Embed Size (px)
Citation preview
1
2
Post Disaster Needs Assessment in India Current Practices and Future Recommendations
A report prepared for the India PDNA Study Project to describe the findings of an analysis of the
current practices of conducting post-disaster needs assessments in India in comparison to prevailing
practices elsewhere in the world.
Document Quality Information General information Author(s) ADPC PDNA Project Team ( Team Leader : Roberto Jovel) Document name Post Disaster Needs Assessment in India: Current Practices
and Future Recommendations Date 17 February 2015 Version Ver 3.0
Submission Status Project Implementation Unit (PIU)
National Cyclone Risk Management Project (NCRMP) National Institute of Disaster Management, India
Sent to:
Date 17 February 2015 (Ver. 3) , 10 March 2015 (Ver. 4) Review Process Approved by the Technical Steering Committee on 30
th March, 2015
The PDNA Project Team
Disclaimer
This document is developed based on the inputs received during various consultative meetings, state
visits, individual interviews, and the literature review by the PDNA India Consultants. Any
discrepancies are unintended. Care has been taken in factual descriptions and data sources. The
document remains open for any corrections in facts, figures and visuals.
Mr. Roberto Jovel Team Leader & PDNA Expert
Mr. Aslam Perwaiz Project Manager & Governance/ Planning Expert
Dr. Mohinder S. Mudahar Agriculture Expert
Dr. Asha Kambon Social Development Expert & Gender Expert
Dr. Peeranan Towashiraporn Engineering Expert
Dr. Md. Habibur Rahman Economic Analyst/Livelihood Expert
Ms. Thitiphon Sinsupan Environmental Expert
Mr. Emmanuel C. Torrente Training, Capacity Building and Evaluation Expert
Mr. Bill Ho System Analyst/MIS Expert/IT Expert

3
CONTENTS
Document Quality Information 2
Acronyms 4
Introduction of the Report 5
1. Current International Methodologies for Assessing Disaster Impact 6
1.1: Historical Development of Assessment Methodology 6
1.2: Scope of Current International Methodology for Disaster Impact Assessment 13
1.3: Other International Methodologies for Disaster-Related Assessments 16
2. Analysis of existing practices for Post-Disaster Needs Assessment 19
2.1: Introduction 19
2.2: Existing Disaster Assessment Regulations 21
2.3: Current Disaster Assessment Procedures 23
2.4: SWOT Analysis of Existing Disaster Assessment Scope and Procedures 26
2.5: Summary of Conclusions and Recommendations 34
Annexes 37
Annex- 1: State Field Visit Report 37
Annex-2: Relevant Data Collected from States 37
Annex-3: Chart depicting damage assessment procedure in India 37

4
Acronyms
ADPC Asian Disaster Preparedness Center ASSOCHAM Associated Chambers of Commerce and Industry of India CDRN Corporate Disaster Resource Network CII Chamber of India Industry (Confederation of Indian Industries) CRC Central Review Committee CSO Central Statistical Organization CWC Central Water Commission DaLA Damage and Loss Assessment DDMA District Disaster Management Authority DES Directorates of Economics and Statistics DM act Disaster Management Act DRR Disaster Risk Reduction FC Finance Commission FCI Finance Commission of India FEMA Federal Emergency Management Agency (USA) FICCI Federation of India Chamber of Commerce and Industry GAR Global Assessment Report GSDMA Gujarat State Disaster Management Authority GFDRR Global Facility for Disaster Reduction and Recovery GIDM Gujarat Institute of Disaster Management GIS Geographical Information System GOI Government of India GSDP Gross State Domestic Product GSI Geological Survey of India HAZUS Hazard in the USA HVS Higher Vulnerability States IDA International Development Association (World Bank Group) IDD International Disaster Database IIASA International Institute for Applied Systems Analysis IMD Indian Meteorological Department IT Information Technology LVS Lower Vulnerability States MHA Ministry of Home Affairs MOA Ministry of Agriculture NCRMP National Cyclone Risk Mitigation Project NDMA National Disaster Management Authority NDRF National Disaster Response Funds NHRA Natural Hazards Risk Atlas NIBS National Institute of Building Sciences NIDM National Institute Of Disaster Management NSSO National Sample Survey Organization OM Operations Manual PC Planning Commission PDNA Post Disaster Needs Assessment PIU Project Implementation Unit POC Project Oversight Committee PONJA Post-Nargis Joint Needs Assessment PSC Project Steering Committee RC Relief Commissioner RF Relief Memorandum SATI State Administrative Training Institute SDMA State Disaster Management Authority SDMC SAARC Disaster Management Centre SDRF State Disaster Response Funds SNA System of National Accounts SOP Standard Operating Procedure ToT Trainers of Trainers TSC Technical Steering Committee UH User’s Handbook UN-ECLAC United Nations Economic Commission for Latin America and the Caribbean UNISDR United Nations International Strategy for Disaster Reduction UT Union Territory
5
Introduction of the Report
As part of the Post-Disaster Needs Assessment Study for India, conducted under the
National Cyclone Risk Mitigation Project (NCRMP), an analysis has been made of prevailing
practices for post-disaster needs assessment – in terms of their scope and suitability to
estimate post-disaster needs for recovery and reconstruction – in 10 selected, disaster-
prone States of India, together with a comparison with similar practices prevailing elsewhere
in the world at the present time.
An examination is made of current practices for the purpose in other developing countries of
the world, on the basis of an analysis of many recent case studies of disaster impact and
needs assessment in most of which the India PDNA Project Team members have been
directly involved. Subsequently, a review is made of current assessment practices prevailing
in India, for which visits were undertaken to the selected, disaster States included in the
India PDNA project. A comparison between these current practices in India and the rest of
the world is made through a Strengths-Weaknesses-Opportunities-Threats (SWOT)
analysis, which will provide the basis for improving the existing system in India.
The Annexes provide details on the information gathered and exchanges held with State
officials during the field visits undertaken by the ADPC Team experts.
6
1. Current International Methodologies for Assessing Disaster Impact
1.1: Historical Development of Assessment Methodology
Due to the relatively infrequent occurrence of disasters, their social and economic impacts
were not often assessed by the middle of the twentieth Century. Whenever disasters
occurred, governments would make an estimation of the cost of reconstruction based solely
in the value of destroyed physical assets, mostly buildings, roads, bridges, etcetera. Little if
any attention was paid at that time to the social and human development impacts caused by
disasters and the recovery costs to achieve normalcy after such events.
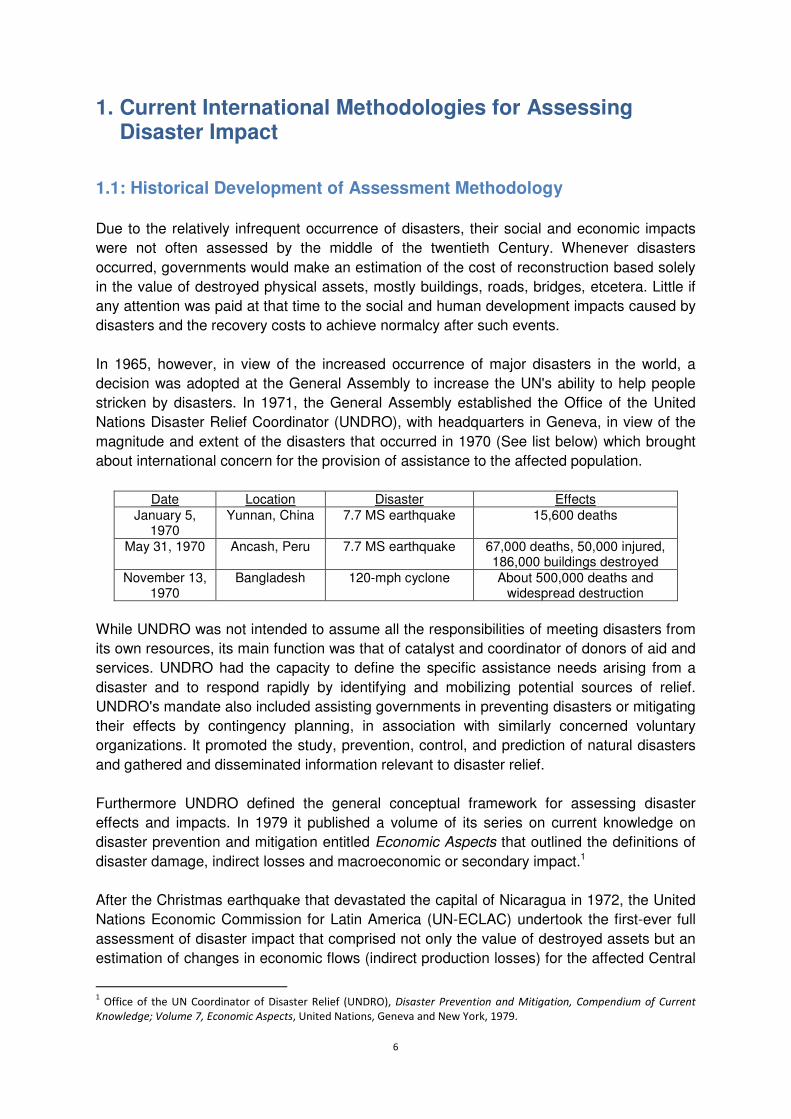
In 1965, however, in view of the increased occurrence of major disasters in the world, a
decision was adopted at the General Assembly to increase the UN's ability to help people
stricken by disasters. In 1971, the General Assembly established the Office of the United
Nations Disaster Relief Coordinator (UNDRO), with headquarters in Geneva, in view of the
magnitude and extent of the disasters that occurred in 1970 (See list below) which brought
about international concern for the provision of assistance to the affected population.
Date Location Disaster Effects January 5,
1970 Yunnan, China 7.7 MS earthquake 15,600 deaths
May 31, 1970 Ancash, Peru 7.7 MS earthquake 67,000 deaths, 50,000 injured, 186,000 buildings destroyed
November 13, 1970
Bangladesh 120-mph cyclone About 500,000 deaths and widespread destruction
While UNDRO was not intended to assume all the responsibilities of meeting disasters from
its own resources, its main function was that of catalyst and coordinator of donors of aid and
services. UNDRO had the capacity to define the specific assistance needs arising from a
disaster and to respond rapidly by identifying and mobilizing potential sources of relief.
UNDRO's mandate also included assisting governments in preventing disasters or mitigating
their effects by contingency planning, in association with similarly concerned voluntary
organizations. It promoted the study, prevention, control, and prediction of natural disasters
and gathered and disseminated information relevant to disaster relief.
Furthermore UNDRO defined the general conceptual framework for assessing disaster
effects and impacts. In 1979 it published a volume of its series on current knowledge on
disaster prevention and mitigation entitled Economic Aspects that outlined the definitions of
disaster damage, indirect losses and macroeconomic or secondary impact.1
After the Christmas earthquake that devastated the capital of Nicaragua in 1972, the United
Nations Economic Commission for Latin America (UN-ECLAC) undertook the first-ever full
assessment of disaster impact that comprised not only the value of destroyed assets but an
estimation of changes in economic flows (indirect production losses) for the affected Central
1 Office of the UN Coordinator of Disaster Relief (UNDRO), Disaster Prevention and Mitigation, Compendium of Current
Knowledge; Volume 7, Economic Aspects, United Nations, Geneva and New York, 1979.
7
American economy, and assisted the Nicaraguan Government in preparing a plan for
economic recovery and reconstruction. Subsequent similar assessment of other major
disasters in the Latin America and Caribbean region enabled UN-ECLAC to develop a
standard methodology to comprehensively estimate the socio-economic impact of disasters,
which was first published in 1991 with support from the Government of Italy.2 This
methodology, which was informally called DaLA methodology, enabled the assessment of
direct and indirect disaster effects across all sectors of economic and social activity and
provided a basis for estimating macro-economic impact (or secondary effects) of disasters of
every kind, and provided inputs for formulating economic recovery and reconstruction plans.
During the 1990s UN-ECLAC, in cooperation with other United Nations agencies with which
it had joint units or with which it had established close working relations – such as the Food
and Agriculture Organization (FAO), UN-HABITAT, the United Nations Environment
Program (UNEP), the Pan-American Health Organization (PAHO/WHO), the United Nations
Industrial Development Organization (UNIDO) and others – further developed and expanded
the methodology to include the analysis of disaster impact on the environment, and applied it
in a relatively large number of disaster cases that occurred in the Latin America and
Caribbean region, assisting many of its member States in defining post-disaster recovery
and reconstruction programs. This resulted in an expanded and updated version of the
methodology that was published in 2003 with the support of the Government of The
Netherlands and the World Bank.3
In 2001, after the Gujarat earthquake in India, the World Bank and other international
agencies assisted in the assessment of disaster impact, in which the UN-ECLAC
methodology was partially applied for the purpose of defining recovery and reconstruction
requirements and plans.4
Through the auspices of the Asian Disaster Preparedness Center (ADPC) the ECLAC
methodology was disseminated in the Asian region. A technical assistance project financed
by the World Bank and executed by ADPC enabled the methodology to be adapted and
transferred to the State of Gujarat, India, in 2004-2005, in which the Gujarat State Disaster
Management Agency (GSDMA) was the official government counterpart. The methodology
was also used to estimate the economic impact of the Severe Acute Respiratory Syndrome
(SARS) epidemic that occurred in Singapore in 20035. The impact of the Indian Ocean
earthquake and Tsunami that affected Indonesia,6 Thailand,7 India,8 Sri Lanka9, and the
2 Economic Commission for Latin America and the Caribbean, Handbook for Estimating the Socio-Economic Effects of
Natural Disasters, United Nations, Santiago, Chile, 1991. 3 Economic Commission for Latin America and the Caribbean, Handbook for Estimating the Socio-Economic and
Environmental Effects of Disasters, United Nations, Santiago and Mexico, 2003. 4 See India, Gujarat Earthquake Recovery Program Assessment Report, World Bank and Asian Development Bank (ADB), 14
March 2001. 5 See Jovel, Roberto, Estimation of the Economic Impact of the Severe Acute Respiratory Syndrome (SARS) in Singapore,
Asian Disaster Preparedness Center (ADPC), Bangkok, 2005. 6 See Indonesia, Preliminary Damage and Loss Assessment, the December 26, 2004 Natural Disaster, World Bank, Jakarta,
19 January 2005. 7 See Jovel, Roberto, The Economic Impact of the 26 December 2004 Indian Ocean Tsunami in Thailand, Asian Disaster
Preparedness Center (ADPC), Bangkok, August 2005. 8 See India, Post-Tsunami Recovery Program; Preliminary Damage and Needs Assessment, Asian Development Bank (ADB),
United Nations and World Bank, 8 March 2005.

8
Maldives Islands10 was also estimated using the ECLAC methodology. A comparative
analysis of the socio-economic impact of the Indian Ocean Earthquake and Tsunami in the
five affected countries was made by the Asian Disaster Preparedness Center (ADPC) to
highlight commonalities and differences among the countries,11 and to foster recovery.
When the World Bank established the Global Facility for Disaster Reduction and Recovery
(GFDRR) in 2006, a decision was taken – after an in-depth analysis of existing assessment
methodologies had been conducted – to adopt the UN-ECLAC methodology for disaster
impact and post-disaster needs assessment, and efforts were made to further refine it to
include the analysis of impact at the personal or household levels and to standardize the
quantitative estimation of recovery and reconstruction financial requirements across all
sectors of social and economic activity, and additional procedures were designed to enable
the estimation of personal and household income decline arising from sectorial production
losses after disasters. Recovery needs were to be systematically estimated to ensure
restoration of personal income, availability of minimum levels of basic services (including
education, health and nutrition, transport, water and sanitation, electricity, etcetera), and the
very important recovery of production levels (in agriculture, livestock, fishery, manufacturing,
commerce, tourism, mining, etcetera). Reconstruction requirements would be estimated on
the basis of the cost of rebuilding destroyed assets with inclusion of disaster-resilient
standards to reduce disaster risk.
The GFDRR produced a set of Guidance Notes for the application of the expanded UN-
ECLAC methodology that now enabled the estimation of not only the value of destroyed
assets and of the changes in production flows of goods and services, but the overall macro-
economic impact and the preliminary estimation of disaster impact on personal or household
levels of income and costs of living.12 In addition, more than 800 World Bank staff and more
than 1,500 government officials from disaster-prone developing countries in Asia, Africa and
Latin America and the Caribbean were trained on the application of the expanded
methodology.
Simultaneously, the GFDRR – in cooperation with the United Nations System and the
European Union (EU) – was assisting many national governments located all over the world
in estimating disaster impacts and the financial requirements for post-disaster recovery and
reconstruction. Utilizing the information obtained since 1972 in the assessment of disaster
effects and impact through the application of the methodology, a damage-and-loss database
was established at GFDRR that provides all existing information on those cases of disaster.
The database provides information on the value of destroyed goods and production decline
caused by disasters in each affected sector of economic and social activity, as defined in the
world-wide system of national accounts.
9 See Sri Lanka Post-Tsunami Recovery Program; Preliminary Damage and Needs Estimation, Asian Development Bank
(ADB), Japan Bank for International Cooperation (JBIC), Japan International Cooperation Agency (JICA), and World Bank,
Colombo, January 2005. 10
See Republic of the Maldives, Tsunami: Impact and Recovery, Joint Needs Assessment, World Bank, Asian Development
Bank (ADB), and United Nations, February 2005. 11
See Jovel, Roberto, Regional Analysis of Socio-Economic Impacts of the December 2004 Earthquake and Indian Ocean
Tsunami, Asian Disaster Preparedness Center (ADPC), Bangkok, January 2006. 12
See Jovel, Roberto, Mudahar, Mohinder, et al, Guidance Notes for Damage, Loss and Needs Assessments, 3 Volumes,
Global Facility for Disaster Reduction and Recovery (GFDRR), World Bank, Washington, D.C., 2010 (Available in English,
French and Spanish).
9
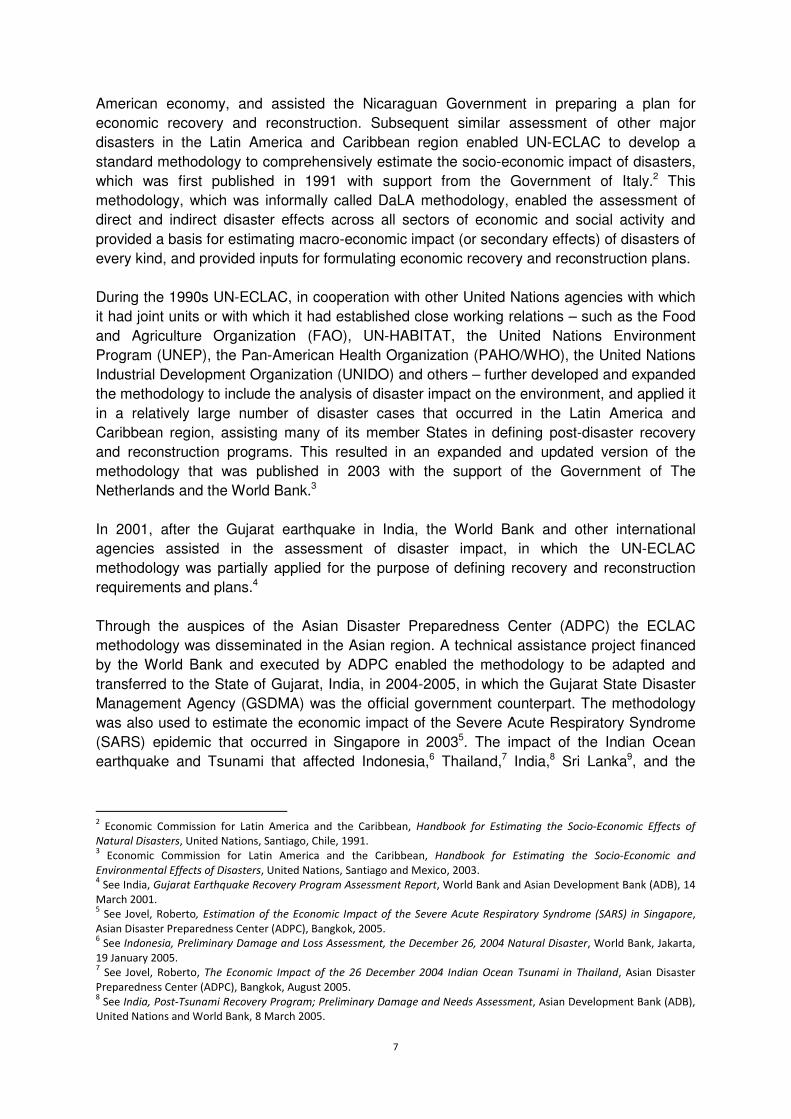
Table 1. Estimation of Damage and Losses Caused by Disasters in Asia (2000 to 2013)
(Inflation adjusted to 2010)
Year
Disaster
Location and Country Million US Dollars
Total Damage Losses
Disasters of Geological Origin
2001 Earthquake Gujarat, India 3,522.9 2,694.7 828.2
2004 Earthquake & Tsunami Indonesia 5,115.3 3,357.4 1,758.0
2004 Tsunami India 1,406.4 660.7 745.7
2004 Tsunami Sri Lanka 1,670.6 1,314.5 356.2
2004 Tsunami Maldives Islands 692.8 517.1 175.8
2004 Tsunami Thailand 2,526.7 584.8 1,941.8
2005 Earthquake Kashmir, Pakistan 3,194.5 2,549.6 644.9
2006 Earthquake Yogyakarta, Indonesia 3,375.7 2,636.6 739.1
2009 Earthquake West Java, Indonesia 212.3 202.8 9.5
2009 Earthquake West Sumatra, Indonesia 2,293.0 2,060.0 233.0
2010 Volcanic Eruption Mt. Merapi, Indonesia 469.6 126.5 343.1
Disasters of Hydro-Meteorological Origin
2007 Cyclone Sidr Bangladesh 1,751.9 1,211.3 540.6
2007 Floods in Jakarta Indonesia 601.8 205.2 396.6
2008 Cyclone Nargis Myanmar 4,101.8 1,773.3 2,328.5
2009 Typhoon Ketsana Lao PDR 58.1 41.9 16.1
2009 Typhoon Ketsana Cambodia 133.4 58.7 74.7
2009 Typhoons Ketsana & Parma Philippines 4,429.3 1,467.1 2,962.2
2010 Floods Sri Lanka 50.6 23.4 27.2
2010 Floods Pakistan 10,056.1 6,496.2 3,560.0
2011 Floods Thailand 44,247.4 19,565.5 24,681.9
In the Asia region, many cases of disasters were analyzed taking advantage of the
methodology since 200113. Table 1 summarizes the estimated total values of damage and
losses in the disasters that were assessed using the expanded UN-ECLAC methodology.14
Data is available in each of those cases of disaster in a dis-aggregated fashion, for each and
all of the standard sectors of economic and social activity as defined in the worldwide
system of national accounts, which fact enables comparisons between disasters in different
countries.
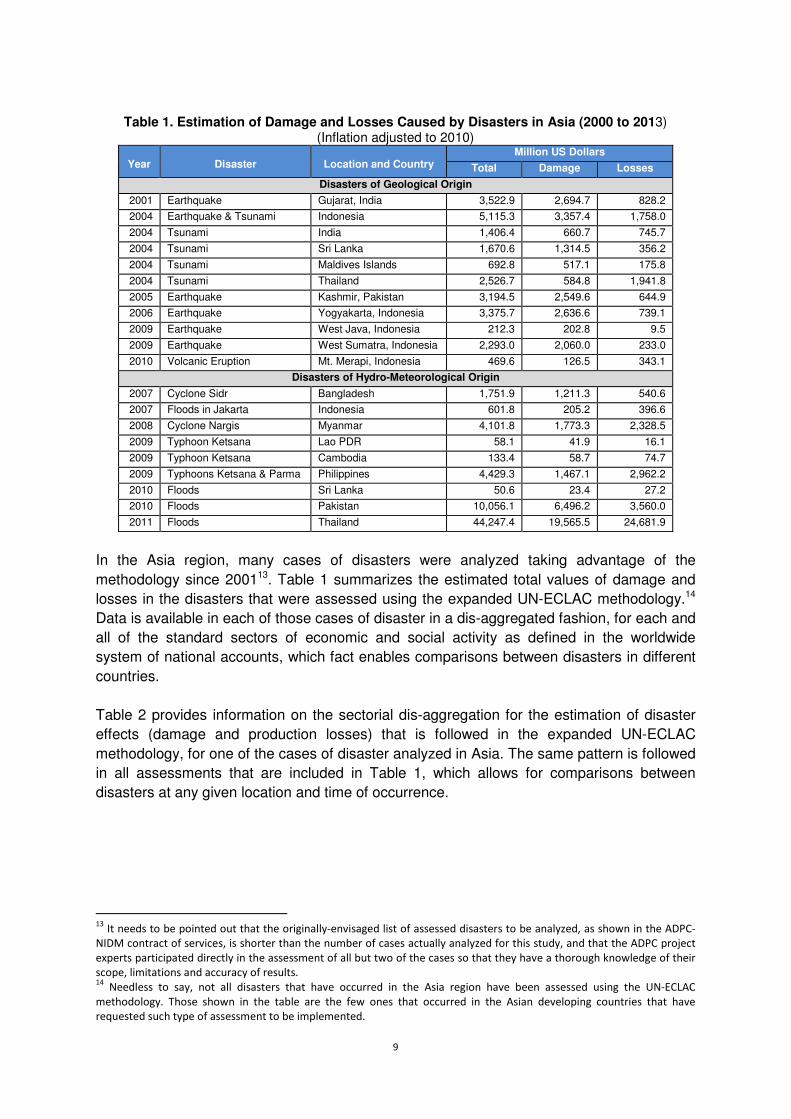
Table 2 provides information on the sectorial dis-aggregation for the estimation of disaster
effects (damage and production losses) that is followed in the expanded UN-ECLAC
methodology, for one of the cases of disaster analyzed in Asia. The same pattern is followed
in all assessments that are included in Table 1, which allows for comparisons between
disasters at any given location and time of occurrence.
13
It needs to be pointed out that the originally-envisaged list of assessed disasters to be analyzed, as shown in the ADPC-
NIDM contract of services, is shorter than the number of cases actually analyzed for this study, and that the ADPC project
experts participated directly in the assessment of all but two of the cases so that they have a thorough knowledge of their
scope, limitations and accuracy of results. 14
Needless to say, not all disasters that have occurred in the Asia region have been assessed using the UN-ECLAC
methodology. Those shown in the table are the few ones that occurred in the Asian developing countries that have
requested such type of assessment to be implemented.
10
Table 2. Detailed estimation of disaster effects after 2009 Typhoons in the Philippines
Million US Dollars
Total Damage Losses
Social
Housing 730.40 541.60 188.80
Health 123.80 105.50 18.30
Education & Culture 64.90 59.50 5.40
Infrastructure
Electricity 33.90 15.20 18.70
Water & Sanitation 24.30 7.90 16.40
Flood-control works 15.30 15.30
Transport 159.90 138.70 21.20
Communications 4.10 4.10
Public Administration 7.20 6.30 0.90
Productive
Agriculture 849.30 80.10 769.20
Manufacture 403.30 209.20 194.10
Trade 1,900.60 256.20 1,644.40
Tourism 66.30 12.30 54.00
Total 4,383.30 1,451.90 2,931.40
The data included in Table 1 can be best understood or visualized when some comparators
are used: first, the significance of a disaster may be observed when the value of damage
and production losses is compared to the size of the affected country´s economy; second, a
comparison can also be made of the value of destroyed assets (or damage) with the value of
fixed gross capital formation (GFKF) of the affected country, to provide a measure of the
domestic capacity to rebuild after the disaster; third, the value of production losses may be
compared to the value of the country´s gross domestic product (GDP) to provide a first
indication of whether overall economic growth may be affected; and fourth, the value of per
capita damage and losses yields a first idea of the possible impact at personal level. Table 3
shows the values of such comparators for the disasters included in Table 1.
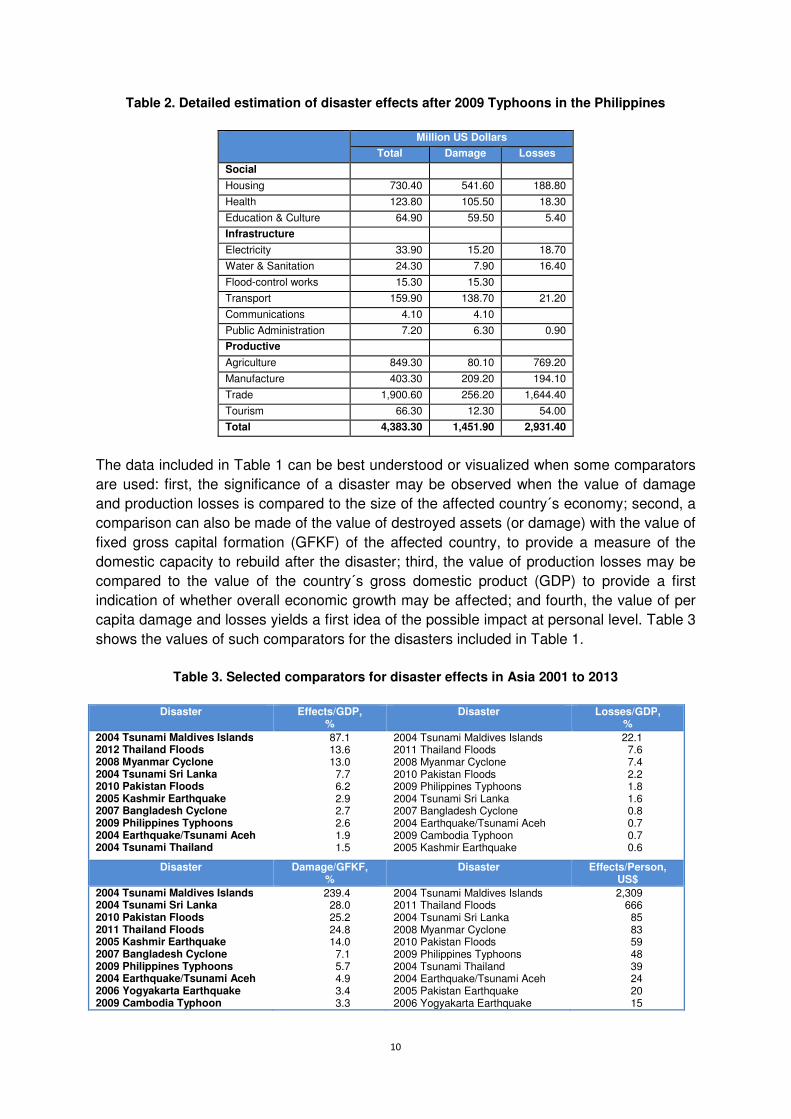
Table 3. Selected comparators for disaster effects in Asia 2001 to 2013
Disaster Effects/GDP,
% Disaster Losses/GDP,
%
2004 Tsunami Maldives Islands 2012 Thailand Floods 2008 Myanmar Cyclone 2004 Tsunami Sri Lanka 2010 Pakistan Floods 2005 Kashmir Earthquake 2007 Bangladesh Cyclone 2009 Philippines Typhoons 2004 Earthquake/Tsunami Aceh 2004 Tsunami Thailand
87.1 13.6 13.0 7.7 6.2 2.9 2.7 2.6 1.9 1.5
2004 Tsunami Maldives Islands 2011 Thailand Floods 2008 Myanmar Cyclone 2010 Pakistan Floods 2009 Philippines Typhoons 2004 Tsunami Sri Lanka 2007 Bangladesh Cyclone 2004 Earthquake/Tsunami Aceh 2009 Cambodia Typhoon 2005 Kashmir Earthquake
22.1 7.6 7.4 2.2 1.8 1.6 0.8 0.7 0.7 0.6
Disaster Damage/GFKF, %
Disaster Effects/Person, US$
2004 Tsunami Maldives Islands 2004 Tsunami Sri Lanka 2010 Pakistan Floods 2011 Thailand Floods 2005 Kashmir Earthquake 2007 Bangladesh Cyclone 2009 Philippines Typhoons 2004 Earthquake/Tsunami Aceh 2006 Yogyakarta Earthquake 2009 Cambodia Typhoon
239.4 28.0 25.2 24.8 14.0 7.1 5.7 4.9 3.4 3.3
2004 Tsunami Maldives Islands 2011 Thailand Floods 2004 Tsunami Sri Lanka 2008 Myanmar Cyclone 2010 Pakistan Floods 2009 Philippines Typhoons 2004 Tsunami Thailand 2004 Earthquake/Tsunami Aceh 2005 Pakistan Earthquake 2006 Yogyakarta Earthquake
2,309 666 85 83 59 48 39 24 20 15

11
From the above information it is possible to infer that the most significant disaster included in
the assessments conducted in the Asia region was that of the 2004 tsunami in the Maldives
Islands since the combined value of damage and losses represented 87 per cent of the
value of the country´s gross domestic product, followed at a distance by the 2012 Thailand
floods (13.6 per cent of GDP) and the 2008 Myanmar cyclone (13 per cent), while the
magnitude of the 2004 earthquake and tsunami in Indonesia – while causing over 200,000
deaths – only represented less than 2 per cent of the country´s gross domestic product15. A
very similar statement may be made in relation to disaster impact on production (comparing
production losses versus GDP).
In addition to the above, it may be noted that when comparing the value of damage or
destroyed assets vis a vis the national capacity of constructing fixed capital, the most
significant disaster was, again, that of the 2004 tsunami in the Maldives Islands (239.4 per
cent), which is a reflection of the degree that the country´s capacity for building fixed capital
was to be engaged for post-disaster reconstruction. Putting it into different words, this ratio
or comparator provides an insight into the kind of efforts ant time required for reconstruction.
Next in the descending scale of this comparator were the disasters caused by the 2004
tsunami in Sri Lanka (28 per cent), the 2010 Pakistan floods and the 2011 Thailand floods
(about 25% each). At the bottom of the scale are the 2006 Yogyakarta earthquake and the
2009 Cambodia typhoon, where damage was equivalent to about 3.5 per cent of the
respective countries´ annual rate of gross fixed capital formation (GFKF).
In average per capita terms, the most significant disaster was that of the 2004 tsunami in the
Maldives Islands (US$ 2,300 per person), followed by the 2011 Thailand floods (US$
666/person). The 2009 Philippines typhoons caused per capita damage and losses in the
order of US$ 50 per person, and in the 2006 Yogyakarta earthquake this figure was of US$
15.
The above comparisons are of importance since it can be seen that the disaster that has
caused the highest value of damage and losses – i.e. the 2011 Thailand floods with 44.5
billion US Dollars in disaster effects – compares similarly to the 2004 tsunami in the
Maldives Islands whose value of disaster effects is only about 1.5 per cent. Worse yet, the
value of per capita disaster effects in the Maldives is nearly four times that of the Thailand
floods. Such results are of course due to the differences in relative size of the two affected
economies, and provide a measure of the intensity of disaster effects.
In the case of India, many large scale and minor disasters have occurred in the relatively
recent past. They include: earthquakes in Latur (1993), Chamoli (1999), Gujarat (2001),
Jammu and Kashmir (2005), and Sikkim (2011); flooding caused by the Andhra and Orissa
cyclones (1991 and 1997), Odisha cyclone (1999), Assam (2002), Bihar (2004 and 2008),
Mumbai (2009), cyclone Aila in West Bengal (2009) and many others; droughts such as the
one faced by Karnataka (2011) and in other States. In each case the respective State
authorities, in some cases assisted by Central Government authorities, conducted relief
needs assessments (whose results were presented in the respective relief memoranda); in
15
It is to be noted that the above percentage figures are used to indicate the magnitude of the damage and losses caused
by disasters in comparison to the size of the disaster-affected economy. These numbers are not to be confused with the
possible temporary slowdown of GDP growth that may arise, until recovery programs are put in place.

12
the case of selected very large scale disasters, such as the Gujarat earthquake in 2001,
more comprehensive assessments of disaster impact and post-disaster needs were
conducted with assistance from international organizations.
In more recent years, at least three damage and needs assessments have been conducted
with assistance from the World Bank, the Asian Development Bank and the United Nations
after the Bihar floods in 200816, the floods in Uttarakhand17 and Cyclone Phailin in Odisha
State18, both in 2013. While these assessments went beyond estimating relief stage
requirements, the assessment methodologies that were used did not enable to obtain the
value of production losses across the affected sectors, nor were all sectors of social and
economic activity covered; furthermore, the data collected did not enable to estimate the
macro-economic and personal-level impact of such disasters except in the case of the 2008
Kosi floods, or the detailed estimation of recovery of production and personal income levels.
Table 4 shows the summarized results of these three assessments.
Table 4. Results of the damage and needs assessments conducted in India between 2008 and
2013. Million Rupees
Bihar Floods 2008
Uttarakhand Floods 2013
Cyclone Phailin Odisha 2013
Housing 9,900.0 19 1,505.0 29,600.0
Education 1,251.0
Health 730.2
Public buildings 1,029.0 6,620.0
Urban infrastructure 1,268.0 4,700.0
Livelihoods 1,622.5 26,500.0
Agriculture, Fisheries, Tourism 1,668.0
Fisheries, SMEs 3,960.0
Tourism 1,166.0
Irrigation 1,393.0
Road and bridges 13,936.0 27,103.0 7,000.0
Electricity 2,662.0 10,480.0
Rural water supply 1,305.0
Water resources 26,828.0
Forests and biodiversity 542.0 160.0
Total 54,267.7 39,641.0 89,020.0
It is to be noted that – most unfortunately – the results shown above are not fully comparable
between the disasters, due to the fact that the methodologies used for their estimation did
not apply the same structure of sectorial composition and because different criteria and
procedures were used.
The data obtained in those case studies of disaster impact assessment conducted in India,
compared to the data developed in the cases of disaster conducted elsewhere in Asia,
16
See Bihar, Kosi Flood (2008); Needs Assessment Report, Government of Bihar, World Bank, Global facility for Disaster
Reduction and Recovery (GFDRR), June 2010; also, see UNDP-IHD, Kosi Floods 2008: How we coped and what we need?
Delhi, January 2009. 17
See India, Uttarakhand Disaster, June 2013, Joint Rapid Damage and Needs Assessment Report, Government of
Uttarakhand, Asian Development Bank (ADB) and World Bank, 2013. 18
See India, Cyclone Phailin in Odisha, October 2013, Rapid Damage and Needs Assessment Report, State Government of
Odisha, Asian Development Bank (ADB), and World Bank, 2013. 19
A discrepancy exists between the estimated values of housing damage: the ADB-WB assessment estimated a damage
value of 9.9 billion Rupees, while the UNDP-IHD estimation yielded a value of 8.8 billion only.
13
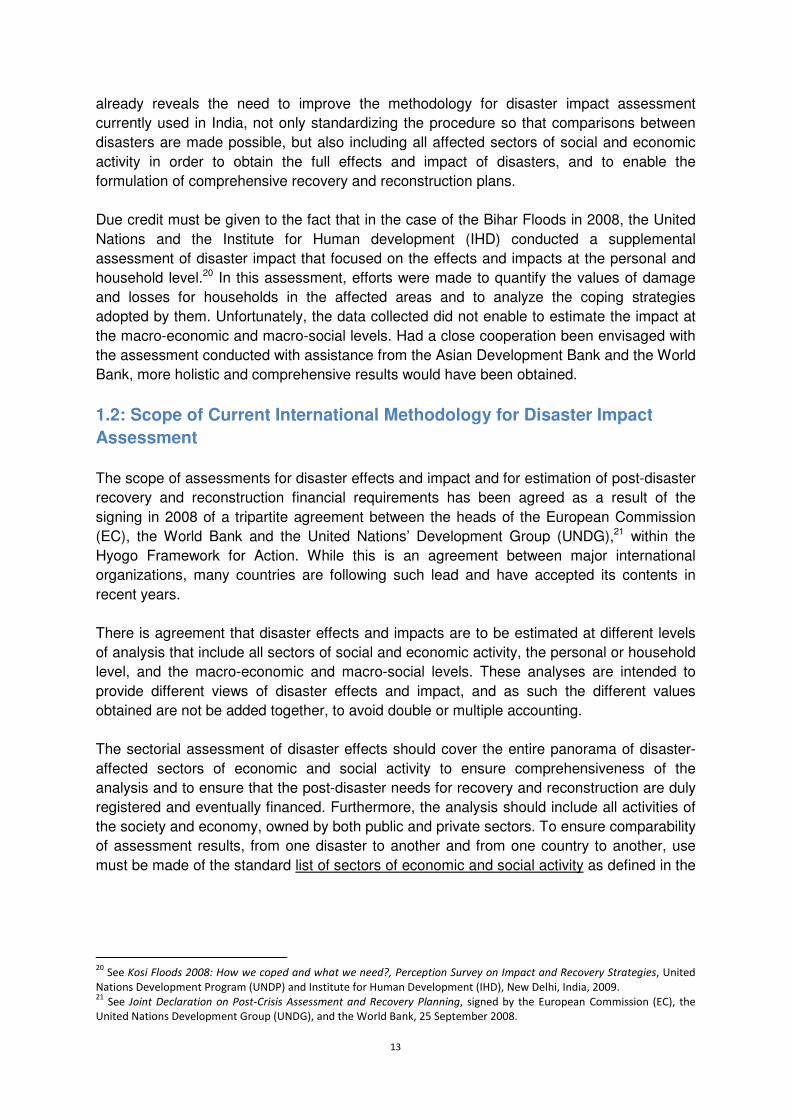
already reveals the need to improve the methodology for disaster impact assessment
currently used in India, not only standardizing the procedure so that comparisons between
disasters are made possible, but also including all affected sectors of social and economic
activity in order to obtain the full effects and impact of disasters, and to enable the
formulation of comprehensive recovery and reconstruction plans.
Due credit must be given to the fact that in the case of the Bihar Floods in 2008, the United
Nations and the Institute for Human development (IHD) conducted a supplemental
assessment of disaster impact that focused on the effects and impacts at the personal and
household level.20 In this assessment, efforts were made to quantify the values of damage
and losses for households in the affected areas and to analyze the coping strategies
adopted by them. Unfortunately, the data collected did not enable to estimate the impact at
the macro-economic and macro-social levels. Had a close cooperation been envisaged with
the assessment conducted with assistance from the Asian Development Bank and the World
Bank, more holistic and comprehensive results would have been obtained.
1.2: Scope of Current International Methodology for Disaster Impact
Assessment
The scope of assessments for disaster effects and impact and for estimation of post-disaster
recovery and reconstruction financial requirements has been agreed as a result of the
signing in 2008 of a tripartite agreement between the heads of the European Commission
(EC), the World Bank and the United Nations’ Development Group (UNDG),21 within the
Hyogo Framework for Action. While this is an agreement between major international
organizations, many countries are following such lead and have accepted its contents in
recent years.
There is agreement that disaster effects and impacts are to be estimated at different levels
of analysis that include all sectors of social and economic activity, the personal or household
level, and the macro-economic and macro-social levels. These analyses are intended to
provide different views of disaster effects and impact, and as such the different values
obtained are not be added together, to avoid double or multiple accounting.
The sectorial assessment of disaster effects should cover the entire panorama of disaster-
affected sectors of economic and social activity to ensure comprehensiveness of the
analysis and to ensure that the post-disaster needs for recovery and reconstruction are duly
registered and eventually financed. Furthermore, the analysis should include all activities of
the society and economy, owned by both public and private sectors. To ensure comparability
of assessment results, from one disaster to another and from one country to another, use
must be made of the standard list of sectors of economic and social activity as defined in the
20
See Kosi Floods 2008: How we coped and what we need?, Perception Survey on Impact and Recovery Strategies, United
Nations Development Program (UNDP) and Institute for Human Development (IHD), New Delhi, India, 2009. 21
See Joint Declaration on Post-Crisis Assessment and Recovery Planning, signed by the European Commission (EC), the
United Nations Development Group (UNDG), and the World Bank, 25 September 2008.

14
world-wide system of national accounts that all countries use.22 For the case of India, the
corresponding list is as follows:23
- Agriculture, forestry and fishing - Mining and quarrying - Manufacturing - Electricity, gas and water resources - Water supply, sewerage and waste management - Trade, hotels and restaurants - Transportation and communications - Financing, insurance, real estate and business services - Community, social and personal services
Recent experience has shown two important conclusions in regard to the scope of post-
disaster assessments. First, that leaving out one or more sectors of social and economic
activity in the assessment would bring about undesired limitations in the overall results of the
recovery and reconstruction program, as persons that are employed or involved in the
sectors left out from the assessment may only achieve normalcy at much later dates or not
recover at all from the event. Second, that leaving out of the assessment those sectors of
activity that are mostly in the ownership of the private sector, under the (erroneous)
assumption that they generate their own income and have savings, insurance or other
sources of financing, would likely result in similar limitations and delays in the overall
recovery and reconstruction results.
Disaster effects are defined, at the sector level, as being of two main types: (i) the value of
physical, durable assets destroyed by the disaster, which is defined as damage; and (ii)
changes in economic flows arising because of the disaster, often called losses, which
normally include the value of production of goods and services that will not be obtained and
the associated higher costs of production. Needless to say, damages occur at the time of the
disaster, while losses would occur over time until recovery or normalcy is achieved.
At the personal level, damage refers to the value of destroyed physical, durable goods or
assets owned by individual persons or households; and the changes in flows or losses
include personal and household income decline that arises from the disruption of livelihood
activities and employment, together with the associated higher costs of living due to
difficulties or higher costs of access to goods and services.
Disaster impact arises as the consequence of disaster effects. At the sector level, disaster
impact may involve a reduction in the capacity of production of goods or a decline in the
capacity and actual provision of services; at the personal or household level, disaster impact
may involve a reduction in the access to goods and services by the population as well as
decline in personal well-being and possible increase in poverty headcounts.
At the macro-economic level, disaster impact may involve a decline in the value and growth
of the gross domestic product (GDP) of the affected country; a deterioration of the balance
of trade and payments for the country due to decline in the value of traditional exports and
increase in imports; a negative change in the fiscal position caused by disaster-induced,
lower government revenues and higher expenditures; and possible, generalized consumer
22
See United Nations, International Standard Industrial Classification of All Economic Activities, Rev.4, New York, 2008.
(http://unstats.org/unsd/cr/registry/). 23
See Central Statistical Office (CSO), National Account Statistics, 2013, page 15, Ministry of Statistics and Programme
Implementation, Government of India, New Delhi, 2013.

15
price indexes increases or inflation, arising from the combination of disaster-induced
production losses and higher costs of production.24
Recent experience has shown that, in many cases, the macro-economic impact may be very
limited in numbers while the sectorial and personal level impacts may be very high, for which
high levels of recovery and reconstruction investments may be required. In other cases, the
capacity of the affected country government may be crippled because of macro-economic
impact of the disaster, and limit its ability to lead recovery and reconstruction, especially in
the case of smaller developing economies.
At the macro-social level, disaster impact may result in delays for the country to meet
Millennium Development Goals (MDGs) or those goals defined in the existing national and
State development plans, with regard to education, health and nutrition, and other social
protection issues.25
The estimation of post-disaster needs should include the financial requirements to achieve
recovery of (i) personal income, (ii) availability and access to basic services for the
population, and (iii) production levels, as well as to (iv) rebuild destroyed assets using
disaster-resilient standards. Needless to say, the estimation of post-disaster financial
requirements is to be based on the quantitative and as-precise-as-possible estimation of
disaster effects sustained at the sector and personal levels, as the assignation of resources
requires an evidence-based quantification of needs.
It is to be noted here that the value of post-disaster needs is not equal to the sum of disaster
effects (damage and losses). Rather, recovery needs represent the value of working capital
or current operating expenditures requirements that would enable achieving normal levels of
production of goods and services after a disaster; and reconstruction needs are usually
higher than the estimated value of damage in view of the introduction of disaster-risk
reduction standards for physical assets.
In any event, post-disaster needs assessments should estimate the needs of both public-
and privately-owned sectors in order to provide the total picture of the financial amounts
required for the entire affected society and economy, and to ensure that no parts of the
society and economy are left out of the recovery and reconstruction program. Should only
the publicly-owned or managed activities and assets be included in post-disaster needs
estimations, only 20 per cent of the affected activities would be covered in the case of India,
as this is the proportion of the public sector participation in the overall national economy,26
and the remaining 80 per cent would in fact be left out of the analysis. In this regard, it is to
be noted that under the public sector are considered all activities owned or administered by
central, State and local governments, while under the private sector are included all activities
owned and managed by individual persons and families as well as by enterprises or
corporations. It is to be noted also that including both public and private sector needs in the
estimation does not imply that the affected government is required to provide the entire
24
It has been found that the macro-economic impact may be temporary in nature, depending on the efficiency of the
recovery and reconstruction program that is put in place in the affected areas. 25
In this case again, the macro-social impact may only be temporary, and its duration would depend on the extent and
efficiency of the recovery program activities put in place after the disaster. 26
See Central Statistical Office (CSO), National Accounts Statistics, 2013; Statement 24: Percentage share of public sector in
value added by type of institution, page 63, Op. Cit.

16
funding requirements for recovery and reconstruction for the whole country; instead, the
government would be required to provide funding for the recovery and reconstruction of
assets and activities that fall under its purview and ownership as well as to assist the poorer
strata of the population, and should interact with the private banking and development
banking systems to ensure the availability of supplemental funding – provided under soft-
term conditions as required by the disaster situation – for the (personal and enterprise)
privately-owned recovery and reconstruction activities and assets, respectively. Without this
latter function by the government of encouraging and guiding the timely availability of credit
resources from the private and development banking systems, full social and economic
recovery and disaster-resilient reconstruction may not be achieved, and considerable
setbacks in overall development would ensue.
1.3: Other International Methodologies for Disaster-Related
Assessments
The NIDM-ADPC contract for the India PDNA Study envisaged that “in order to analyze and
document suitable PDNA tools in the Indian situation, the ADPC Team will take a
comprehensive analysis of the available international models and methodologies for disaster
assessment, which would include:
1. DaLA (Damage and Loss Assessment) Methodology: This methodology is popularly
termed as DaLA or ECLAC methodology and would be the central focus for the
assignment for adaptation purpose.
2. The CBA (Cost-Benefit Analysis) Methodology: Cost-benefit analysis CBA is an
economic technique used to organize, appraise and present the costs and benefits,
and inherent trade-offs of public investment projects and policies taken by
governments and public authorities in order to increase public welfare.
3. HAZUS (Hazards in the USA) Methodology: HAZUS I the second major effort to
develop a methodology for vulnerability assessment developed for the Federal
Emergency Management Agency (FEMA) by the National Institute of Building
Sciences (NIBS) to provide a tool for developing earthquake loss estimates.
4. The ACM (Advanced Component Method): The ACM, developed by AIR Worldwide
Corporation (AIR), takes a significant step objective and scientific methodology
largely replaces the subjective measures and opinions of experts about how building
damage relates to earthquake intensity.
5. CatSim (Catastrophe Simulation) Model: CatSim Model is built and designed to
illustrate the tradeoffs and choices a country must make in financially managing the
economic risks in the anticipation of major disasters. The Internationals Institute for
Applied System Analysis (IIASA) developed this tool for natural disaster risk
management for delineating the damage and loss probabilities.”27
Nevertheless, it should be noted that in the above list, only the DaLA methodology is used
for the actual assessment of post-disaster disaster effects and impacts as well as for
estimation of the financial requirements to achieve post-disaster recovery and disaster-
resilient reconstruction.
27
See Consultants´ Services: Lump Sum Contract for Post-Disaster Needs Assessment Study for India under the National
Cyclone Risk Mitigation Project (NCRMP), New Delhi, pages 44 and 45.
17
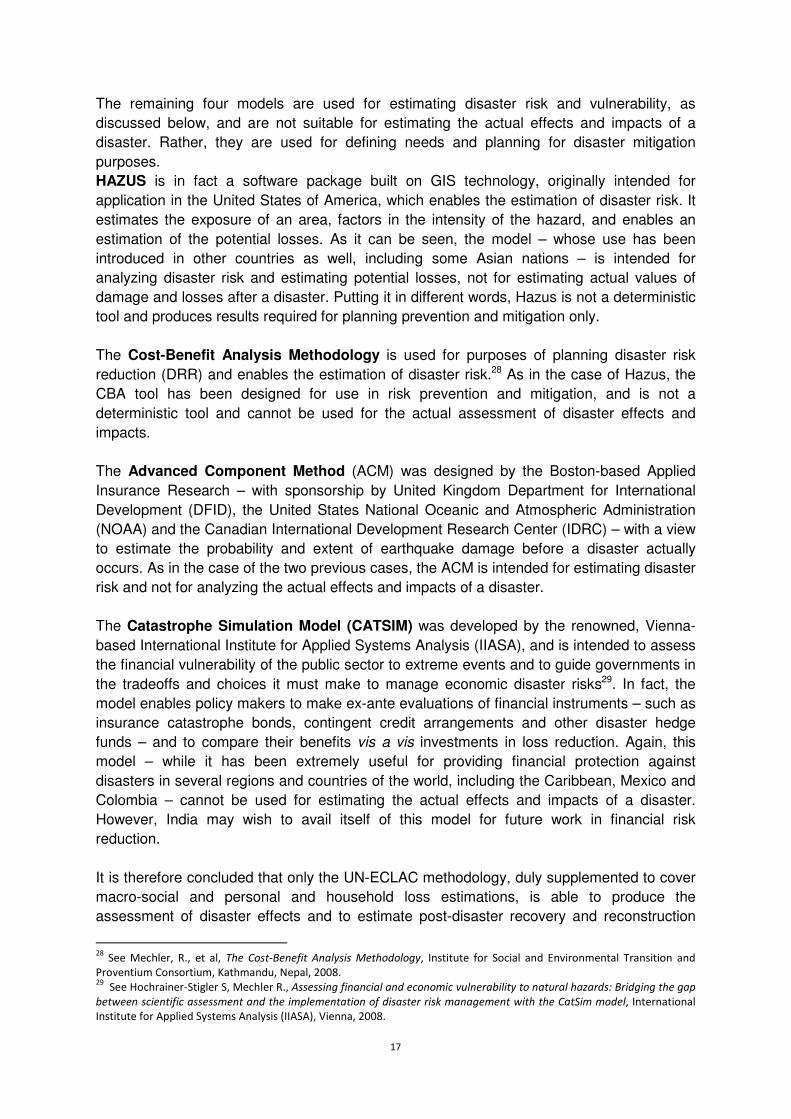
The remaining four models are used for estimating disaster risk and vulnerability, as
discussed below, and are not suitable for estimating the actual effects and impacts of a
disaster. Rather, they are used for defining needs and planning for disaster mitigation
purposes.
HAZUS is in fact a software package built on GIS technology, originally intended for
application in the United States of America, which enables the estimation of disaster risk. It
estimates the exposure of an area, factors in the intensity of the hazard, and enables an
estimation of the potential losses. As it can be seen, the model – whose use has been
introduced in other countries as well, including some Asian nations – is intended for
analyzing disaster risk and estimating potential losses, not for estimating actual values of
damage and losses after a disaster. Putting it in different words, Hazus is not a deterministic
tool and produces results required for planning prevention and mitigation only.
The Cost-Benefit Analysis Methodology is used for purposes of planning disaster risk
reduction (DRR) and enables the estimation of disaster risk.28 As in the case of Hazus, the
CBA tool has been designed for use in risk prevention and mitigation, and is not a
deterministic tool and cannot be used for the actual assessment of disaster effects and
impacts.
The Advanced Component Method (ACM) was designed by the Boston-based Applied
Insurance Research – with sponsorship by United Kingdom Department for International
Development (DFID), the United States National Oceanic and Atmospheric Administration
(NOAA) and the Canadian International Development Research Center (IDRC) – with a view
to estimate the probability and extent of earthquake damage before a disaster actually
occurs. As in the case of the two previous cases, the ACM is intended for estimating disaster
risk and not for analyzing the actual effects and impacts of a disaster.
The Catastrophe Simulation Model (CATSIM) was developed by the renowned, Vienna-
based International Institute for Applied Systems Analysis (IIASA), and is intended to assess
the financial vulnerability of the public sector to extreme events and to guide governments in
the tradeoffs and choices it must make to manage economic disaster risks29. In fact, the
model enables policy makers to make ex-ante evaluations of financial instruments – such as
insurance catastrophe bonds, contingent credit arrangements and other disaster hedge
funds – and to compare their benefits vis a vis investments in loss reduction. Again, this
model – while it has been extremely useful for providing financial protection against
disasters in several regions and countries of the world, including the Caribbean, Mexico and
Colombia – cannot be used for estimating the actual effects and impacts of a disaster.
However, India may wish to avail itself of this model for future work in financial risk
reduction.
It is therefore concluded that only the UN-ECLAC methodology, duly supplemented to cover
macro-social and personal and household loss estimations, is able to produce the
assessment of disaster effects and to estimate post-disaster recovery and reconstruction
28
See Mechler, R., et al, The Cost-Benefit Analysis Methodology, Institute for Social and Environmental Transition and
Proventium Consortium, Kathmandu, Nepal, 2008. 29
See Hochrainer-Stigler S, Mechler R., Assessing financial and economic vulnerability to natural hazards: Bridging the gap
between scientific assessment and the implementation of disaster risk management with the CatSim model, International
Institute for Applied Systems Analysis (IIASA), Vienna, 2008.

18
needs. Furthermore, due to the UN-ECLAC´s unique feature of relying on baseline
information available in the world-wide system of national accounts, it is feasible to adapt it
to the specific social, economic and environmental characteristics of India.
Before concluding this section of the report, mention should be made to an examination of
existing practices of disaster impact assessment conducted in 2007, by the UNDP/BCPR,
whose results are described in the document titled Review of Post-Disaster recovery Needs
Assessment and Methodologies30. Such document analyzes and describes the
methodologies that were in use at that time, and points out to gaps and needs to improve
existing procedures, on the basis of a limited number of case studies conducted in Asia and
Latin America. Many of the conclusions contained therein are outdated since the limitations
described therein have been solved in the past eight years since the analysis was made.
The analysis of current methodological practices described in the previous pages of this
report, which is based on more than 120 cases of disaster impact assessments, supersedes
and expands the conclusions of this 2007 report.
30
See Bollin, Christina, and Khanna, Shivani, Review of Post-Disaster Recovery Needs Assessment and Methodologies,
United Nations Development Programme (UNDP), New York, 2007.
19
2. Analysis of existing practices for Post-Disaster Needs Assessment
2.1: Introduction
As part of the Post-Disaster Needs Assessment Study for India, conducted under the
National Cyclone Risk Mitigation Project (NCRMP), an analysis has been made of prevailing
practices for post-disaster needs assessment in 10 selected States of India, together with a
comparison with similar practices elsewhere in the world. This analysis is intended to
provide a basis for developing a more scientific, evidence-based methodology for the
estimation of recovery and reconstruction needs after disasters, which might be adopted by
the Government of India.
To develop such analysis, experts from the Asian Disaster Prevention Center (ADPC)
assigned to the PDNA Study, in close cooperation with officials from the National Institute of
Disaster Management of India, conducted field visits31 to the selected States with a view to:
- Collect and review all forms used to gather disaster-related information; - Analyze the procedures used by State officials to estimate and valuate disaster
effects and impacts, as well as the financial requirements for ensuring recovery and disaster-resilient reconstruction;
- Collect existing reports that describe recent post-disaster needs assessment conducted in the selected States;
- Hold discussions with relevant State officials on possible ways to improve existing disaster assessment procedures; and
- Collect available data on social, economic and environmental conditions prevailing in the States, which may be used as baseline information for future post-disaster needs assessments.
During these visits, consultations and exchanges were made with State Disaster
Management and Department officials, and interviews and working meetings with Revenue
Department officials that normally collect information for relief needs assessment, and down
to District levels. Efforts were also made to meet with selected persons affected by recent
disasters at Village and Taluka (Sub-District) levels, in order to obtain their views on the
suitability of post-disaster assistance required and obtained. Such meetings enabled to
collect: (i) existing reports of past assessments conducted in recent years; (ii) standing
directives, guidelines and data collection forms presently in use for post-disaster needs
assessment for recovery and reconstruction; and (iii) an exchange of ideas on possible ways
to improve existing practices.
As a side benefit, the following baseline information was collected for eventual use in future
post-disaster needs assessment, in either printed form or in electronic files gathered at the
respective websites of relevant State Departments:
- Annual State Statistical Abstracts, including information on Gross State Domestic
Product (GSDP) in real and nominal terms as well as fiscal sector position;
- State Production Accounts, by sector of economic activity;
31
Individual State Visit reports is enclosed in Annex-1

20
- Value-added technical coefficients that relate gross domestic production to GSDP by
sector of economic activity;
- Population census and household survey information on income and expenditure;
- Human development information;
- Data on agriculture sector annual production and prices for different types of crops;
- Annual electricity production by source, annual sales of electricity by consumer
sectors, and consumer rates;
- Annual water supply to consumers, annual billings by consumer type and water
rates; and
- Information on quantity and economic value of environmental assets and services,
where available.
The State visits were made according to the following calendar agreed upon between the
ADPC Team experts, NIDM officials and State authorities:
State Dates of Field Visit ADPC Experts NIDM Officials
Uttarakhand 23 to 25 March 2014
Roberto Jovel; Aslam Perwaiz Priyanka Chowdhary
Odisha 1 to 3 April 2014 Roberto Jovel Priyanka Chowdhary Assam 6 to 8 May 2014 Aslam Perwaiz Tamil Nadu 3 to 5 July 2014 Emmanuel Torrente, Tarique
Sohail Priyank Jindal
Maharashtra 9 to 11 July Tithipon Sinsupan, Sunil Prashar Priyanka Chowdhary, Rani Dhakad
West Bengal
21 to 22 July 2014 Emmanuel Torrente, Priyanka Chowdhary, Rani Dhakad
Bihar 20 to 24 July 2014 Aslam Perwaiz, Tarique Sohail Priyank Jindal Gujarat 14 to 16 July 2014 Tithipon Sinsupan, Sunil Prashar Priyanka Chowdhary
21
2.2: Existing Disaster Assessment Regulations
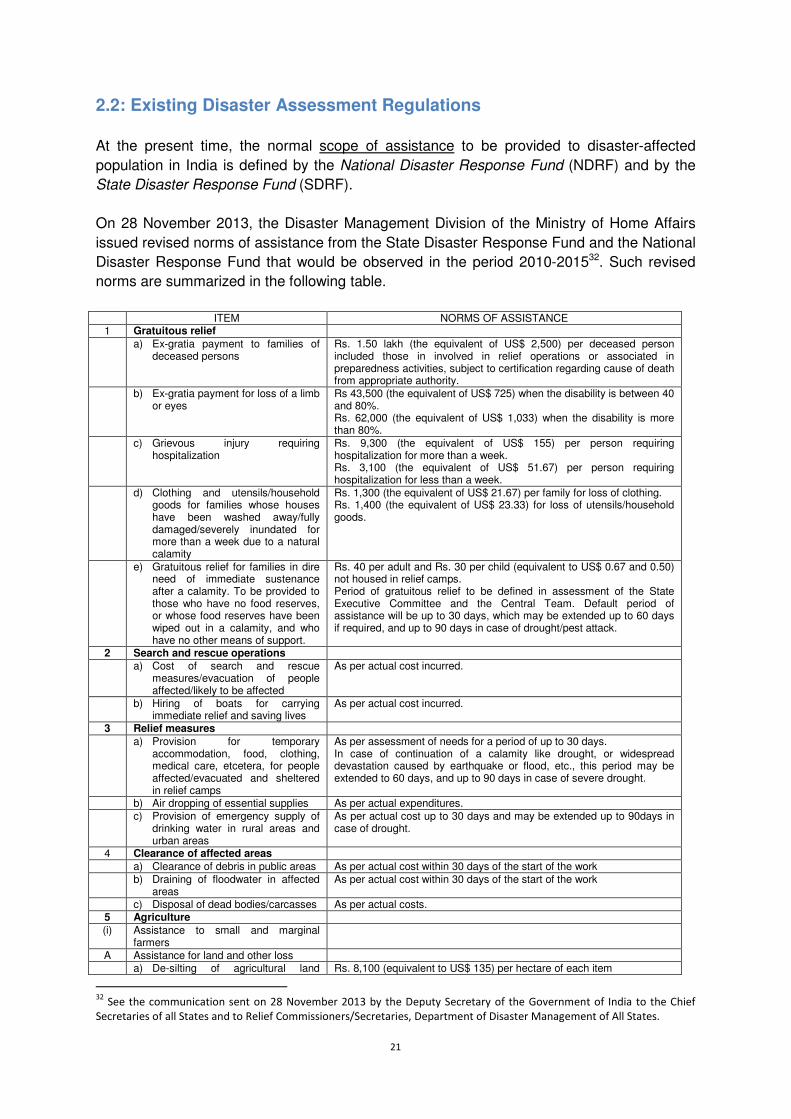
At the present time, the normal scope of assistance to be provided to disaster-affected
population in India is defined by the National Disaster Response Fund (NDRF) and by the
State Disaster Response Fund (SDRF).
On 28 November 2013, the Disaster Management Division of the Ministry of Home Affairs
issued revised norms of assistance from the State Disaster Response Fund and the National
Disaster Response Fund that would be observed in the period 2010-201532. Such revised
norms are summarized in the following table.
ITEM NORMS OF ASSISTANCE
1 Gratuitous relief a) Ex-gratia payment to families of
deceased persons Rs. 1.50 lakh (the equivalent of US$ 2,500) per deceased person included those in involved in relief operations or associated in preparedness activities, subject to certification regarding cause of death from appropriate authority.
b) Ex-gratia payment for loss of a limb or eyes
Rs 43,500 (the equivalent of US$ 725) when the disability is between 40 and 80%. Rs. 62,000 (the equivalent of US$ 1,033) when the disability is more than 80%.
c) Grievous injury requiring hospitalization
Rs. 9,300 (the equivalent of US$ 155) per person requiring hospitalization for more than a week. Rs. 3,100 (the equivalent of US$ 51.67) per person requiring hospitalization for less than a week.
d) Clothing and utensils/household goods for families whose houses have been washed away/fully damaged/severely inundated for more than a week due to a natural calamity
Rs. 1,300 (the equivalent of US$ 21.67) per family for loss of clothing. Rs. 1,400 (the equivalent of US$ 23.33) for loss of utensils/household goods.
e) Gratuitous relief for families in dire need of immediate sustenance after a calamity. To be provided to those who have no food reserves, or whose food reserves have been wiped out in a calamity, and who have no other means of support.
Rs. 40 per adult and Rs. 30 per child (equivalent to US$ 0.67 and 0.50) not housed in relief camps. Period of gratuitous relief to be defined in assessment of the State Executive Committee and the Central Team. Default period of assistance will be up to 30 days, which may be extended up to 60 days if required, and up to 90 days in case of drought/pest attack.
2 Search and rescue operations a) Cost of search and rescue
measures/evacuation of people affected/likely to be affected
As per actual cost incurred.
b) Hiring of boats for carrying immediate relief and saving lives
As per actual cost incurred.
3 Relief measures a) Provision for temporary
accommodation, food, clothing, medical care, etcetera, for people affected/evacuated and sheltered in relief camps
As per assessment of needs for a period of up to 30 days. In case of continuation of a calamity like drought, or widespread devastation caused by earthquake or flood, etc., this period may be extended to 60 days, and up to 90 days in case of severe drought.
b) Air dropping of essential supplies As per actual expenditures. c) Provision of emergency supply of
drinking water in rural areas and urban areas
As per actual cost up to 30 days and may be extended up to 90days in case of drought.
4 Clearance of affected areas a) Clearance of debris in public areas As per actual cost within 30 days of the start of the work b) Draining of floodwater in affected
areas As per actual cost within 30 days of the start of the work
c) Disposal of dead bodies/carcasses As per actual costs. 5 Agriculture (i) Assistance to small and marginal
farmers
A Assistance for land and other loss a) De-silting of agricultural land Rs. 8,100 (equivalent to US$ 135) per hectare of each item
32
See the communication sent on 28 November 2013 by the Deputy Secretary of the Government of India to the Chief
Secretaries of all States and to Relief Commissioners/Secretaries, Department of Disaster Management of All States.

22
(where thickness of sand/silt deposit is more than 3 inches
b) Removal of debris on agricultural areas in hilly areas
Subject to the condition that no other assistance/subsidy has been availed of by/is eligible to the beneficiary under any other Government scheme
c) De-silting/restoration/repair of fish farms
Subject to the condition that no other assistance/subsidy has been availed of by/is eligible to the beneficiary under any other Government scheme
d) Loss of substantial portion of land caused by landslide, avalanche, change of course of rivers
Rs. 25,000 (equivalent to US$ 416.67) per hectare to only those small and marginal farmers whose ownership is legitimate as per the revenue records
B Input subsidy where crop loss is 50% and above
a) For agriculture crops, horticulture crops and annual plantation crops
Rs. 4,500 (equivalent to US$ 75) per hectare in rain fed and restricted to sown areas. Rs. 9,000 (equivalent to US$ 150) per hectare in assured irrigated areas, subject to minimum assistance no less than Rs. 750 and restricted to sown areas
b) Perennial crops Rs. 12,000 (equivalent to US$ 200) per hectare for all types of perennial crops subject to minimum assistance not less than Rs. 1,500 and restricted to sown areas
c) Sericulture Rs. 3,200 (equivalent to US$ 53.33) per hectare of Eri, Mulberry, Tussar Rs. 4,000 (equivalent to US$ 66.67) per hectare for Muga
(ii) Input subsidy to farmers other than small and marginal farmers
Rs. 4,500 (US$ 75) per hectare in rain fed areas and restricted to sown areas Rs. 9,000 (US$ 150) per hectare for areas under assured irrigation and restricted to sown areas Rs. 12,000 (US$ 200) per hectare for all types of perennial crops and restricted to sown areas. Assistance may be provided where crop loss is 50% and above subject to a ceiling of 1 hectare per farmer and up to 2 hectare per farmer in case off successive calamities irrespective of size of holding being large
6 Animal husbandry i) Replacement of milch animals,
draught animals or animals used for haulage
Milch animals Rs. 16,400 (or US$ 273.33) for buffalo/cow/camel/yak, etc. Rs. 1,650 (or US$ 27.50) for sheep/goat Draught animals Rs. 15,000 (or US$ 250) for camel/horse/bullock, etc. Rs. 10,000 (or US$ 166.67) for calf/donkey/pony/mule. This assistance may be restricted for the actual loss of economically productive animals and will be subject to a ceiling of 1 large milch animal or 4 small milch animals or 1 large draught animal or 2 small draught animal per household irrespective of whether a household has lost a larger number of animals Poultry Poultry @ 37 (US$ 0.62) per bird subject to a ceiling of assistance of Rs. 400 per beneficiary household. The death of poultry birds should be as a result of natural calamity.
ii) Provision of fodder/feed concentrate including water supply and medicines in cattle camps
Large animals Rs. 50 (US$ 0.83) per day Small animals RS. 25 (US$ 0.42) per day Default period of assistance up to 30 days, which may be extended to 60 days, and to 90 days in case of severe drought.
iii) Transport of fodder to cattle outside cattle camps
As per actual cost of transport
ITEM NORMS OF ASSISTANCE
7 Fishery i) Assistance to fishermen for
repair/replacement of boats, nets – damaged or lost
Rs. 3,000 (equivalent to US$ 50) for repair of partially damaged boats only Rs. 1,500 (equivalent to US$ 25) for repair of partially damaged net Rs. 7,000 (equivalent to US$ 116.67) for replacement of fully damaged boats Rs. 1,850 (equivalent to US$ 30.83) for replacement of fully damaged net
ii) Input subsidy for fish seed farm Rs. 6,000 (equivalent to US$ 100) per hectare 8 Handicrafts/handloom – Assistance to Artisans i) For replacement of damaged
tools/equipment Rs. 3,000 (equivalent to US$ 50) per artisan for equipment
ii) For loss of raw materials/goods in process/finished goods
Rs. 3,000 (equivalent to US$ 50) per artisan for raw materials
9 Housing a) Fully damaged/destroyed houses

23
i) Pucca house Rs. 70,000 (equivalent to US$ 1,166.67) per house in plain areas Rs. 75,000 (equivalent to US$ 1,250) per house in hilly areas
ii) Kutcha house Rs. 17,600 (equivalent to US$ 293.33) per house b) Severely damaged houses i) Pucca house Rs. 12,600 (equivalent to US$ 210) per house ii) Kutcha house Rs. 3,800 (equivalent to US$ 63.33) per house c) Partially damaged houses i) Pucca (other than huts) where
damage is at least 15% Rs. 3,800 (equivalent to US$ 63.33) per house
ii) Kutcha (other than huts) where damage is at least 15%
Rs. 2,300 (equivalent to US$ 38.33) per house
d) Damaged/destroyed huts Rs. 3,000 (equivalent to US$ 50) per hut. Hut means temporary, make shift unit, inferior to Kutcha house, made of thatch, mud, plastic sheets, etc.
e) Cattle shed attached to house Rs. 1,500 (equivalent to US$ 25) per shed. 10 Infrastructure
Repair/restoration (of immediate nature) of damaged infrastructure: Roads and bridges; drinking water supply works; irrigation; power (limited to immediate restoration of electricity supply in affected areas); schools, primary health centers; community assets owned by Panchayat. Sectors such as telecommunication and power (except immediate restoration of power supply), which generate their own revenues, and also undertake immediate repair/restoration works from their own funds/resources, are excluded.
Based on the assessment of needs. As regards the repairs of roads due consideration shall be given to Norms for Maintenance of Roads in India 2001, as amended from time to time. These are: normal and urban areas up to 15% of the total of ordinary repair and periodic repair; hills, up to 20%.
2.3: Current Disaster Assessment Procedures
At the present time, two main types of post-disaster assessments are conducted in India: the
usual Disaster-Response type of assessment, designed to estimate the amounts of relief
assistance to be given to disaster-affected persons, as per the Disaster Response Fund
dictates; and, in some cases, broader post-disaster assessments of major events carried out
by the affected State authorities with support from international agencies such as the Asian
development Bank, the World Bank, and the United Nations, which are aimed at estimating
– beyond relief assistance – needs for reconstruction and recovery.
The following paragraphs describe the scope and contents of the two kinds of assessment.
2.3.1: Disaster-Response Fund Assessments
At the present time the Office of the Relief Commissioner in the Revenue Department of
each State and Union Territory (UT) is mandated to collect information on disaster effects
after any disaster and to provide the required disaster response thereafter.
On the basis of individual, “rapid assessment” reports developed by District, Block and
Village Revenue Officers as well as of supplementary “detailed assessments” prepared by
sectorial State Department Officials (including the Departments of Agriculture, Public Works,
etcetera), a “Relief Memorandum” is prepared by the Relief Commissioner to be sent to the
Central Government in order to obtain additional financial resources to meet post-disaster
demands for assistance. While the contents and details of the relief memoranda vary from
State to State and from one disaster to another, it normally provides full information on the
estimated value of required disaster response assistance based on the estimation of the
24
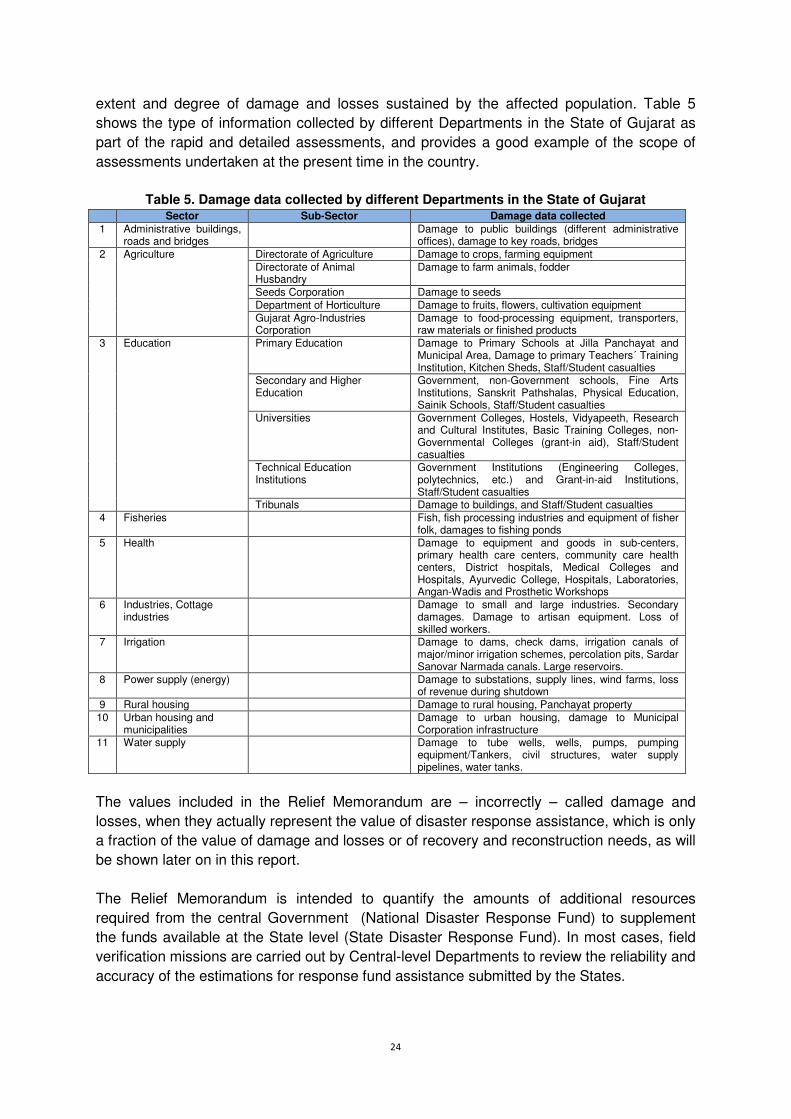
extent and degree of damage and losses sustained by the affected population. Table 5
shows the type of information collected by different Departments in the State of Gujarat as
part of the rapid and detailed assessments, and provides a good example of the scope of
assessments undertaken at the present time in the country.
Table 5. Damage data collected by different Departments in the State of Gujarat
Sector Sub-Sector Damage data collected 1 Administrative buildings,
roads and bridges Damage to public buildings (different administrative
offices), damage to key roads, bridges 2 Agriculture Directorate of Agriculture Damage to crops, farming equipment
Directorate of Animal Husbandry
Damage to farm animals, fodder
Seeds Corporation Damage to seeds Department of Horticulture Damage to fruits, flowers, cultivation equipment Gujarat Agro-Industries Corporation
Damage to food-processing equipment, transporters, raw materials or finished products
3 Education Primary Education Damage to Primary Schools at Jilla Panchayat and Municipal Area, Damage to primary Teachers´ Training Institution, Kitchen Sheds, Staff/Student casualties
Secondary and Higher Education
Government, non-Government schools, Fine Arts Institutions, Sanskrit Pathshalas, Physical Education, Sainik Schools, Staff/Student casualties
Universities Government Colleges, Hostels, Vidyapeeth, Research and Cultural Institutes, Basic Training Colleges, non-Governmental Colleges (grant-in aid), Staff/Student casualties
Technical Education Institutions
Government Institutions (Engineering Colleges, polytechnics, etc.) and Grant-in-aid Institutions, Staff/Student casualties
Tribunals Damage to buildings, and Staff/Student casualties 4 Fisheries Fish, fish processing industries and equipment of fisher
folk, damages to fishing ponds 5 Health Damage to equipment and goods in sub-centers,
primary health care centers, community care health centers, District hospitals, Medical Colleges and Hospitals, Ayurvedic College, Hospitals, Laboratories, Angan-Wadis and Prosthetic Workshops
6 Industries, Cottage industries
Damage to small and large industries. Secondary damages. Damage to artisan equipment. Loss of skilled workers.
7 Irrigation Damage to dams, check dams, irrigation canals of major/minor irrigation schemes, percolation pits, Sardar Sanovar Narmada canals. Large reservoirs.
8 Power supply (energy) Damage to substations, supply lines, wind farms, loss of revenue during shutdown
9 Rural housing Damage to rural housing, Panchayat property 10 Urban housing and
municipalities Damage to urban housing, damage to Municipal
Corporation infrastructure 11 Water supply Damage to tube wells, wells, pumps, pumping
equipment/Tankers, civil structures, water supply pipelines, water tanks.
The values included in the Relief Memorandum are – incorrectly – called damage and
losses, when they actually represent the value of disaster response assistance, which is only
a fraction of the value of damage and losses or of recovery and reconstruction needs, as will
be shown later on in this report.
The Relief Memorandum is intended to quantify the amounts of additional resources
required from the central Government (National Disaster Response Fund) to supplement
the funds available at the State level (State Disaster Response Fund). In most cases, field
verification missions are carried out by Central-level Departments to review the reliability and
accuracy of the estimations for response fund assistance submitted by the States.

25
2.3.2: Damage and Needs Assessments with International Support
In recent years – notably since the 2001 Gujarat Earthquake – more detailed assessments
of disaster impact have been undertaken in the case of selected, major events. International
technical and financial support from the Asian Development Bank (ADB), the World Bank
(WB) and the United Nations System has been obtained for these undertakings, which
subsequently led to obtaining external support for recovery and reconstruction activities.
Summarized results of these assessments have been presented in Tables 1 and 4 of this
report.
These assessments have had some limitations. In the case of the Gujarat earthquake,
adequate estimations were made of the value of damage or destruction in all affected
sectors of social and economic activity; production losses were only partially estimated for
some sectors, leaving out many of the social and infrastructure sectors. The assessments
conducted in the cases of the 2008 Bihar floods, the Uttarakhand floods and of Cyclone
Phailin in Odisha in 2013 – which were called “damage and needs assessments”, the scope
of work was limited to the estimation of the value of destroyed assets and of the
corresponding needs for reconstruction. Allegedly due to lack of sufficient information,
production losses and social sector changes in flows were not quantified, and not all affected
sectors of activity were included in the assessment.
So, even in these cases of assessments conducted with external technical and financial
support, their results did not provide sufficient information on disaster impact, especially as
regards to production decline and social impact, which in fact preclude the subsequent
analysis of overall macro-economic and macro-social disaster impact and the quantitative
estimation of recovery requirements. There is indication that, because of such limitations, --
as will be shown later on in this report – full recovery was not achieved promptly by the
affected population and that destroyed assets were rebuilt using design and construction
standards that probably have a higher risk than before the disasters occurred.
It may be stated, then, that current assessment practices do not provide adequate
information that (i) may be used by the higher authorities to adopt adequate public policies
for recovery and reconstruction, and that (ii) as a result the affected population faces longer
periods of suffering to achieve recovery.
Putting it differently, due to the limitations of the assessment methodologies presently used,
there exist limitations to governance (since the Central and State governments do not obtain
the full picture of disaster impact and recovery and reconstruction requirements); the overall
potential growth of socio-economic development is not achieved or delayed, and the
affected population face significant deterioration on their quality of life and human
development.
This situation needs to be addressed, especially since the quantitative information required
for a full post-disaster effect-impact-and-needs assessment is available in the country, and
only the adoption of a scientific, holistic methodology for assessment is required.
26
2.4: SWOT Analysis of Existing Disaster Assessment Scope and
Procedures After the visits to the disaster-prone States
were conducted and information on the
scope and existing practices on disaster
response estimations was collected by the
India-PDNA ADPC Team, a strengths-
weaknesses-opportunities-threats (SWOT)
analysis was made to define its suitability to
define post-disaster needs for recovery and
disaster-resilient reconstruction. A SWOT
analysis reveals the internal strengths and
weaknesses of the existing system as well as opportunities and threats in the external
environment of the system.
The existing system of post-disaster needs assessment in India has
certain strengths that include simplicity and efficiency. The issue of
simplicity involves: first, the amounts of assistance to be provided to
the affected population are pre-defined (not determined on the basis
of actual field measurements of damage and losses sustained by the
affected population); second, assessments can be carried out by
non-specialized technical and professional personnel at State levels
and below. The system is efficient because, as recent experience shows, the proceeds of
the estimated assistance can be delivered to the affected population within 45 days of the
occurrence of the disaster; in addition, the capacity of the system is clearly very high as the
recent massive evacuation of population before cyclones in Odisha attests.
It may be stated that the existing system for estimating disaster response is a good example
of optimum utilization of limited – human and financial – resources available for assessment
and disbursement of relief assistance requirements.
However, the present system has weaknesses defined by limitations
and shortcomings in scope and do not provide means to easily adjust
assistance for inflation. Its scope is limited due to the following reasons:
first, not all affected population is included to receive assistance;
second, not all sectors of economic and social activity are included in
the analysis and some sectors are only partially included; and, third, the
assessment concentrates on relief assistance and only very partially
covers recovery assistance and little or no reconstruction of destroyed assets using risk-
reduction features. Finally, as indicated previously, the rates of assistance to be provided
have remained at fixed levels for a number of years, with only minor and partial adjustments
for inflation.
A significant limitation of the present system is that it does not provide for the identification of
the total value of destroyed assets and of the total production decline that occurs after a
disaster, as pointed out in the preceding section of this report. Rather, the result of the
assessment is the estimated value of assistance to be provided to the affected population as
set forth in the Disaster Response Funds guidelines, which in fact represent only a small
S
T

27
fraction of the total value of damage and losses sustained by the Indian society and
economy33. Therefore, the assessment provides the State and Central governments an
estimation of the amounts to be given out to the affected persons; but it does not provide an
estimation of the total impact of the disaster on social and economic conditions nor of the
total needs for recovery and reconstruction.
It is to be noted that official government reports and newspaper accounts erroneously refer
to the estimated disaster response costs as the value of damage and losses produced by
the disaster, misleading the readers and grossly under-estimating the effects of the disaster
on social and economic conditions.
A second limitation of the present system is that it covers only a narrow fraction of the
affected population, concentrating – which is correct but insufficient – on the poorer strata of
the population: i.e. small farmers, fishermen and artisans. In addition to this, the present
system does not include the analysis of all relevant, affected sectors of economic activity,
leaving aside important sectors or sector components and employed population that are
involved in activities such as industry, commerce, tourism and others. In the case of
agriculture, losses of food crops are assessed, but commercial crops are not considered;
moreover, assistance is provided only to those farmers that lose more than 50 per cent of
their crops, and no assistance is given to those that lose less than that value.
An example of the above limitation may be seen in the fact that Disaster Response
assistance was provided promptly and directly to small farmers, fishermen, and home
owners after the very recent Cyclone Hudhud in Andra Pradesh and Odisha States this year.
According to newspaper accounts34 the list of affected sectors and subsectors included
many more, such as agriculture crops, fishery, animal husbandry with special reference to
the poultry industry, many types of industries (including IT, pharmaceutical and petro-
chemical), steel plants, tourism facilities, roads, railways, airports, telecommunications,
water supply and electricity systems, education and health facilities. Disaster Response
assistance was provided to the tune of several hundred Crore, but the total damage and
production losses was roughly estimated to be in the order of one lakh Crore35. Table 6. Comparison of estimated value of damage and losses versus disaster response assistance provided in the case of the Cyclone Phailin disaster in Odisha, 2013
(Values in Rs. Million)* Damage and Needs Assessment Estimation Relief
Memorandum Damage Losses Total Social sectors 31,371.8 4,050.8 35,422.6 9,171.7 Ex-gratia for loss of life 6.6 6.6 6.6 Relief costs 2,837.7 2,837.7 2,837.7 Housing and household goods 24,749.4 1,206.5 25,955.9 3,313.8 Education 3,108.7 N. A. 3,108.7 2,865.1 Health 337.2 N. A. 337.2 148.5 Other social costs 3,176.5 N. A. 3,176.5 Productive services 6,651.5 19,361.6 26,013.1 6,235.5
33
However, official reports and newspaper accounts erroneously equate this assistance to the value of damage and losses,
thus misleading the reader, and providing a lower value of the total effects of the disaster. 34
In this connection, a detailed review was made of daily reports included in http://www.business-standard.com. 35
See Hudhud aftermath: Officials put Hudhud loss at over Rs 1 lakh crore, October 18, 2014, in The Business Standard,
http://www.business-standard.com/article/current-affairs/officials-put-hudhud-loss-at-over-rs-1-lakh-crore-
114101500798_1.html

28
Agriculture, livestock, fishery, forestry 6,537.3 19,340.8 25,878.1 6,213.3 Industry 114.2 N. A. 135.0 22.2 Commerce N. A. N. A. N. A. Infrastructure 31,721.7 31,733.9 27,703.6
Road transport 7,973.1 N. A. 7,973.1 9,557.1 Water supply and sanitation 3,196.3 N. A. 3,196.3 380.5 Irrigation works 6,828.3 N. A. 6,828.3 4,308.6 Electricity 10,748.0 N. A. 10,748.0 10,481.4 Govt. administration buildings 515.7 515.7 515.7 Community assets 2,460.3 2,460.3 2,460.3 TOTAL 69,745.0 23,424.6 93,169.6 43,110.8
Note: Shaded areas represent sectors for which only partial or no estimations were made of either damage or losses caused by the disaster.
In addition, a comparison of the value of response assistance provided to the affected
persons after the 2013 Cyclone Phailin disaster in the State of Odisha36 vis a vis the
estimated value of damage and losses obtained during the Rapid Damage and Needs
Assessment conducted with support from the World Bank and the Asian development
Bank37 is quite revealing. While the latter report did not cover all affected sectors of social
and economic activity and did not include a full estimation of the value of production and
personal income losses38, the estimated value of disaster effects reached a level of 93,170
million Rupees (or its equivalent of 1,500 million US Dollars), and the value of disaster
response assistance was valued as only 43,110 million Rupees (or 685 million US$), as
shown in Table 6 above. This reveals that provisions in the Disaster Response Fund cover
only less than half of the admittedly under-estimated value of total damage and losses.
A third limitation is that when it comes to the replacement of destroyed assets – buildings,
machinery, equipment – the present system includes mainly those under the purview of
government-owned activities, leaving aside those falling under private sector ownership
(whether owned by individual persons or by enterprises). Industrialized countries have a
similar characteristic in that they do not provide coverage for private sector damage and
losses because they have insurance coverage; but in developing countries – and India is not
an exception – insurance penetration and coverage is still in very early stages of
development and cannot provide such assistance to individuals and enterprises. In the
specific case of India, the public sector covers only 20 per cent of economic activities
included in the system of national accounts, which means that in any assessment of disaster
effects where the private sector impact is not included leaves out nearly four fifths of the
impact.
A fourth limitation of the present system refers to the fact that the Disaster Response Fund
concentrates its assistance in relief operations and only provides partial assistance to
achieve recovery of normalcy levels in personal or household income, basic service access
and production recovery, and nearly no assistance for reconstruction of destroyed assets
under disaster-resilient standards. An exception to the latter is the reconstruction of
36
See Special Relief Commissioner, Memorandum of the very severe Cyclone Phailin and the subsequent flood, 12 to 15
October 2013, Government of Odisha, October 2013. 37
See India, Cyclone Phailin in Odisha, October 2013; Rapid Damage and Needs Assessment Report, Government of Odisha,
Asian Development Bank and World Bank, 2013. 38
It is to be pointed out that the Rapid Damage and Needs Assessment did not include an analysis of disaster effects in the
sectors of industry and commerce, nor did it include estimations of the revenue losses sustained by the services sectors of
education, health, transport, water and sanitation, electricity and others, and therefore produced only partial results.

government-owned assets that may be funded from the 10% flexible funds available in the
plan budget funds, through the Centrally Sponsored Schemes.
In this regard, it is to be noted that those persons that do receive assistance from the
Disaster Response Funds actually receive a fraction of the total they require to achieve
recovery of personal income, basic services access, and production, and a very small
fraction of the amount they require to rebuild their homes and other assets to standards that
will be disaster-resilient. Furthermore, not all affected persons receive any assistance, as is
illustrated by the fact that farmers that lose less than 50 per cent of their crops do not get
any assistance. Furthermore, farmers involved in permanent plantation crops do not get any
assistance.
To illustrate this point, using data obtained in Uttarakhand a
has been found that a farmer having a 1
losses more than half of his crop would receive crop input assistance that does not enable
him/her to have sufficient money to plant the s
annual income would decline after the disaster and may in fact fall below poverty
Figure 1 in the next page). And the farmers that lose less than half of their crops would face
similar and probably worse situations.
Figure 1. Analysis of 1
The drought that affected Karnataka in 2011, caused a decline in gross state domestic
product of about 2.5 percent in that same
2012. Figure 2 shows the trend of GSDP after the drought and that which would have
occurred with no drought.
20,000
30,000
40,000
50,000
2012
Fa
rme
r´s
an
nu
al
cin
om
e,
Ru
pe
es
Annual Income of 1
losing 51% of crop, and after receiving input subsidy
29
owned assets that may be funded from the 10% flexible funds available in the
t funds, through the Centrally Sponsored Schemes.
In this regard, it is to be noted that those persons that do receive assistance from the
Disaster Response Funds actually receive a fraction of the total they require to achieve
e, basic services access, and production, and a very small
fraction of the amount they require to rebuild their homes and other assets to standards that
resilient. Furthermore, not all affected persons receive any assistance, as is
ated by the fact that farmers that lose less than 50 per cent of their crops do not get
. Furthermore, farmers involved in permanent plantation crops do not get any
, using data obtained in Uttarakhand after the 2013
has been found that a farmer having a 1-hectare farm where he grows grain crops who
losses more than half of his crop would receive crop input assistance that does not enable
him/her to have sufficient money to plant the same extension of 1 hectare, and therefore his
annual income would decline after the disaster and may in fact fall below poverty
). And the farmers that lose less than half of their crops would face
worse situations.
Figure 1. Analysis of 1-hectare rice farmer´s annual income in Uttarakhand after receiving input subsidy
The drought that affected Karnataka in 2011, caused a decline in gross state domestic
product of about 2.5 percent in that same year as well as a further decline of 1.4 per cent in
2012. Figure 2 shows the trend of GSDP after the drought and that which would have
2012 2013 2014 2015
Annual Income of 1-hectare Uttarakhand Rice Farmer
losing 51% of crop, and after receiving input subsidy
Production sales Input subsidy
owned assets that may be funded from the 10% flexible funds available in the
In this regard, it is to be noted that those persons that do receive assistance from the
Disaster Response Funds actually receive a fraction of the total they require to achieve
e, basic services access, and production, and a very small
fraction of the amount they require to rebuild their homes and other assets to standards that
resilient. Furthermore, not all affected persons receive any assistance, as is
ated by the fact that farmers that lose less than 50 per cent of their crops do not get
. Furthermore, farmers involved in permanent plantation crops do not get any
2013 floods disaster, it
hectare farm where he grows grain crops who
losses more than half of his crop would receive crop input assistance that does not enable
ame extension of 1 hectare, and therefore his
annual income would decline after the disaster and may in fact fall below poverty-level (See
). And the farmers that lose less than half of their crops would face
hectare rice farmer´s annual income in Uttarakhand
The drought that affected Karnataka in 2011, caused a decline in gross state domestic
year as well as a further decline of 1.4 per cent in
2012. Figure 2 shows the trend of GSDP after the drought and that which would have
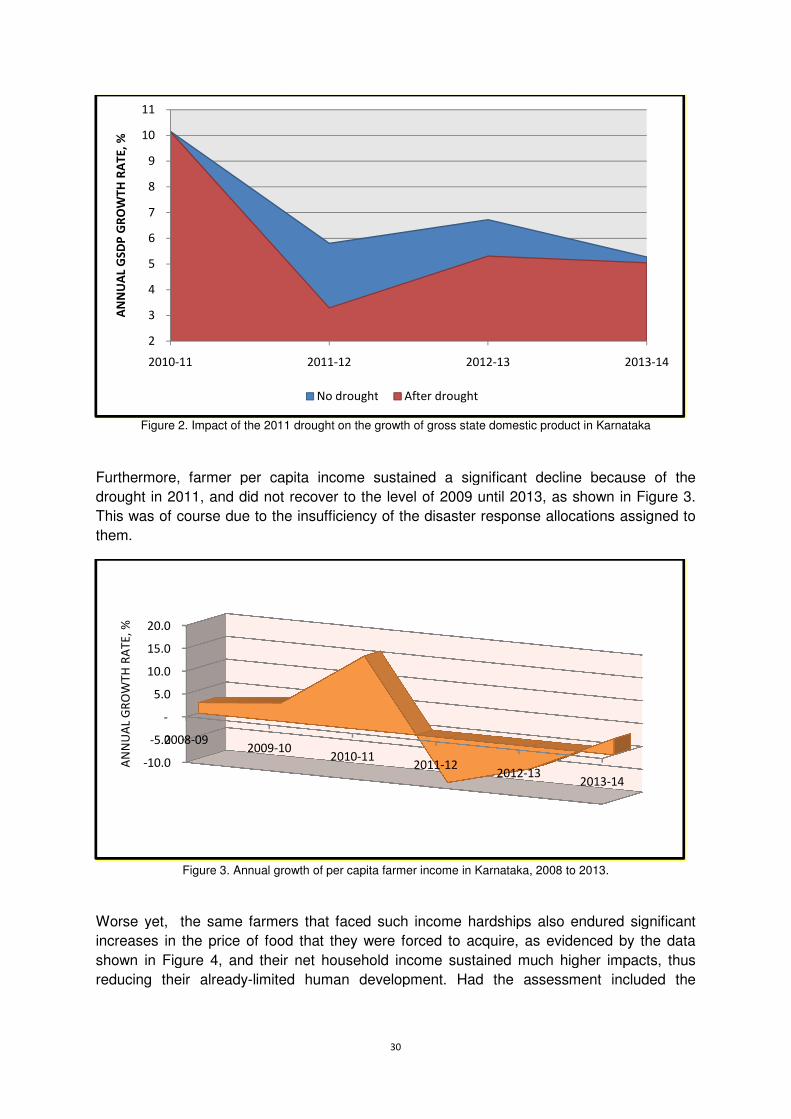
Figure 2. Impact of the 2011 drought on the growth of gross state domestic product in Karna
Furthermore, farmer per capita income sustained a significant decline because of the
drought in 2011, and did not recover to the level of 2009 until 2013, as shown in Figure 3.
This was of course due to the insufficiency of the disaster response all
them.
Figure 3. Annual growth of per capita farmer income in Karnataka, 2008 to 2013.
Worse yet, the same farmers that faced such income hardships also endured significant
increases in the price of food that they were forced to acquire, as evidenced by the data
shown in Figure 4, and their net household income sustained much higher impacts
reducing their already-limited human development. Had the assessment included the
2
3
4
5
6
7
8
9
10
11
2010-11
AN
NU
AL
GS
DP
GR
OW
TH
RA
TE
, %
-10.0
-5.0
-
5.0
10.0
15.0
20.0
2008-092009-10
AN
NU
AL
GR
OW
TH
RA
TE
, %
30
Figure 2. Impact of the 2011 drought on the growth of gross state domestic product in Karna
Furthermore, farmer per capita income sustained a significant decline because of the
drought in 2011, and did not recover to the level of 2009 until 2013, as shown in Figure 3.
This was of course due to the insufficiency of the disaster response allocations assigned to
Figure 3. Annual growth of per capita farmer income in Karnataka, 2008 to 2013.
Worse yet, the same farmers that faced such income hardships also endured significant
increases in the price of food that they were forced to acquire, as evidenced by the data
shown in Figure 4, and their net household income sustained much higher impacts
limited human development. Had the assessment included the
2011-12 2012-13
No drought After drought
102010-11
2011-122012-13
Figure 2. Impact of the 2011 drought on the growth of gross state domestic product in Karnataka
Furthermore, farmer per capita income sustained a significant decline because of the
drought in 2011, and did not recover to the level of 2009 until 2013, as shown in Figure 3.
ocations assigned to
Figure 3. Annual growth of per capita farmer income in Karnataka, 2008 to 2013.
Worse yet, the same farmers that faced such income hardships also endured significant
increases in the price of food that they were forced to acquire, as evidenced by the data
shown in Figure 4, and their net household income sustained much higher impacts, thus
limited human development. Had the assessment included the
2013-14
2013-14

31
estimation and assignation of recovery needs, the hardship of the affected farmers would
have been much less.
Figure 4. Variation of unit prices of selected agriculture products in Karnataka, 2011 to 2013
In the case of the cyclone that affected Odisha in 1999, the growth of agriculture crop
production took more than two years to return to pre-disaster levels, again because the
farmers did not receive sufficient assistance for recovery, and their personal or household
income declined accordingly (See Figure 5).
Figure 5. Growth of agriculture production in Odisha before and after 1999 Cyclone
Moreover, the guidelines for Disaster Response do not cover the entire agriculture sector; it
concentrates only on farmers that produce food crops, and commercial, non-food farming
activities are not included. Therefore, crops losses in sugarcane, tea, and other similar
plantations are not estimated and commercial farmers that may sustain losses in production
due to a disaster do not receive any recovery assistance.
600
700
800
900
1000
1100
1200
1300
Apr Nov Apr Nov Apr Nov
2011-12 2012-13 2013-14
WH
OLE
SA
LE P
RIC
E I
ND
EX
(1
98
1-8
2 =
10
0) Cereals
Pulses
Oil seeds
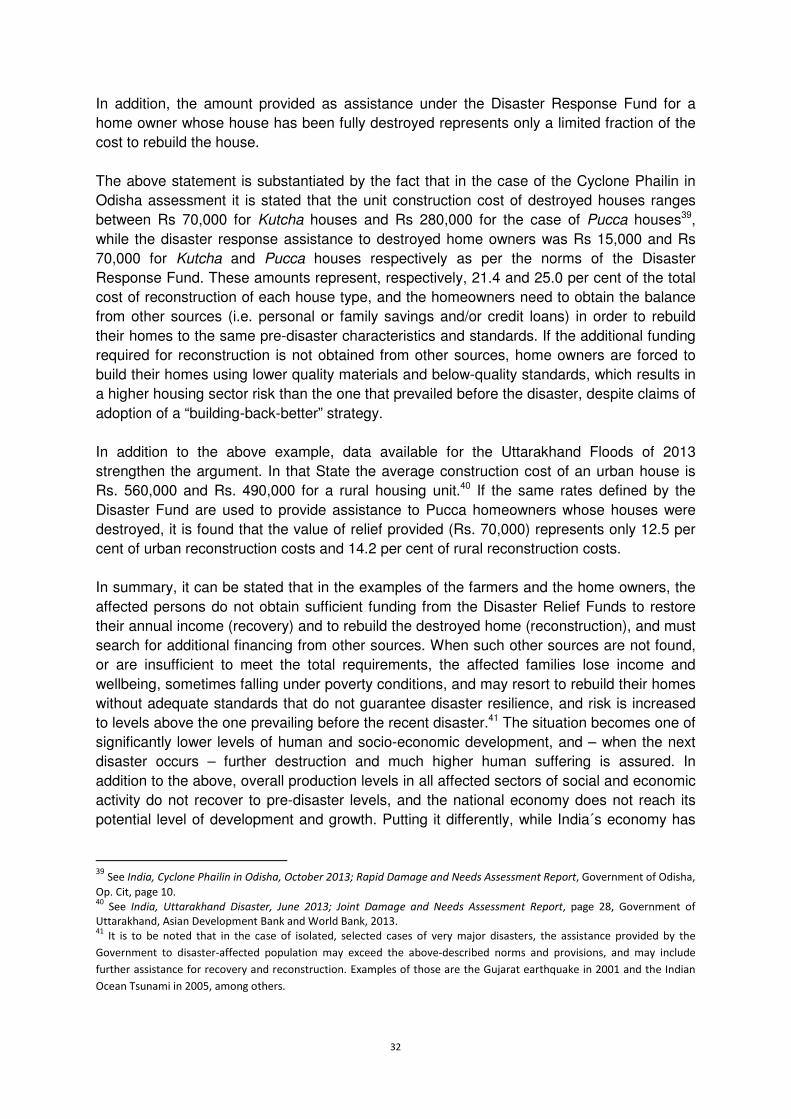
32
In addition, the amount provided as assistance under the Disaster Response Fund for a
home owner whose house has been fully destroyed represents only a limited fraction of the
cost to rebuild the house.
The above statement is substantiated by the fact that in the case of the Cyclone Phailin in
Odisha assessment it is stated that the unit construction cost of destroyed houses ranges
between Rs 70,000 for Kutcha houses and Rs 280,000 for the case of Pucca houses39,
while the disaster response assistance to destroyed home owners was Rs 15,000 and Rs
70,000 for Kutcha and Pucca houses respectively as per the norms of the Disaster
Response Fund. These amounts represent, respectively, 21.4 and 25.0 per cent of the total
cost of reconstruction of each house type, and the homeowners need to obtain the balance
from other sources (i.e. personal or family savings and/or credit loans) in order to rebuild
their homes to the same pre-disaster characteristics and standards. If the additional funding
required for reconstruction is not obtained from other sources, home owners are forced to
build their homes using lower quality materials and below-quality standards, which results in
a higher housing sector risk than the one that prevailed before the disaster, despite claims of
adoption of a “building-back-better” strategy.
In addition to the above example, data available for the Uttarakhand Floods of 2013
strengthen the argument. In that State the average construction cost of an urban house is
Rs. 560,000 and Rs. 490,000 for a rural housing unit.40 If the same rates defined by the
Disaster Fund are used to provide assistance to Pucca homeowners whose houses were
destroyed, it is found that the value of relief provided (Rs. 70,000) represents only 12.5 per
cent of urban reconstruction costs and 14.2 per cent of rural reconstruction costs.
In summary, it can be stated that in the examples of the farmers and the home owners, the
affected persons do not obtain sufficient funding from the Disaster Relief Funds to restore
their annual income (recovery) and to rebuild the destroyed home (reconstruction), and must
search for additional financing from other sources. When such other sources are not found,
or are insufficient to meet the total requirements, the affected families lose income and
wellbeing, sometimes falling under poverty conditions, and may resort to rebuild their homes
without adequate standards that do not guarantee disaster resilience, and risk is increased
to levels above the one prevailing before the recent disaster.41 The situation becomes one of
significantly lower levels of human and socio-economic development, and – when the next
disaster occurs – further destruction and much higher human suffering is assured. In
addition to the above, overall production levels in all affected sectors of social and economic
activity do not recover to pre-disaster levels, and the national economy does not reach its
potential level of development and growth. Putting it differently, while India´s economy has
39
See India, Cyclone Phailin in Odisha, October 2013; Rapid Damage and Needs Assessment Report, Government of Odisha,
Op. Cit, page 10. 40
See India, Uttarakhand Disaster, June 2013; Joint Damage and Needs Assessment Report, page 28, Government of
Uttarakhand, Asian Development Bank and World Bank, 2013. 41
It is to be noted that in the case of isolated, selected cases of very major disasters, the assistance provided by the
Government to disaster-affected population may exceed the above-described norms and provisions, and may include
further assistance for recovery and reconstruction. Examples of those are the Gujarat earthquake in 2001 and the Indian
Ocean Tsunami in 2005, among others.
33
been growing at healthy annual rates in recent years, had disaster recovery been in effect,
annual economic growth would have reached higher rates than the present ones.
The above considerations lead to believe that in India the human development and
wellbeing of affected population does not recover to pre-disaster levels or that it is only
reached after a very long time, with the corresponding long-term suffering of the affected
population, and that overall socio-economic development is not reaching its potential. In
view of the successive occurrence of disasters, especially in the most disaster-prone coastal
States, this might lead to increasing poverty numbers and worsened conditions for the
affected population, rendering insufficient the current national and State programs to fight or
reduce poverty.
One last limitation or shortcoming of the existing system for disaster impact and needs
assessment in India is that in some States use is made of other procedures for estimation of
damage and losses that do not necessarily coincide with the norms of the Disaster
Response Fund. Whenever that happens, the published results of disaster effects cannot be
validly compared or added together to arrive at a series of total damage and losses for the
country. The published data is therefore skewed and does not provide a reliable value for
use in further analysis.
On the other hand, the very existence and execution of the India PDNA
project provides an opportunity to put in place a comprehensive and
scientific system of disaster effect and impact assessment for the
purpose of ascertaining post-disaster recovery and reconstruction
financial needs assessment. The willingness expressed by many State
government officials to request and adopt a scientific and
comprehensive procedure for disaster impact assessments, which go
beyond the estimation and provision of relief assistance, is an opportunity that should be
taken advantage of.
Should those opportunities not be grabbed opportunely, external
threats arise that include: (i) full recovery of production, availability
and access to goods and services is not achieved by all affected
persons after disasters; (ii) overall well-being and quality of life of the
affected population worsens after disasters; (iii) disaster risk is
increased after reconstruction of assets using non-improved
standards; (iv) slowdown of overall economic growth and worsening
of the fiscal position of the State and central governments; (v) significant delays in achieving
Millennium Development Goals (MDGs); and (v) widespread dissatisfaction and complaints
of the population with the amount and coverage of Government assistance provided after
disasters.
Assessments to define the amounts of post-disaster assistance to be provided to affected
population are undertaken by a combination of officials from the State Revenue Department
and of sectorial Departments (agriculture, water and sanitation, public works, etcetera).
While the norms described above are followed in all States, the procedures for the
estimation of assistance are not fully standardized in all of them.

34
In fact, some States do not have standard formats for the collection of damage and loss
information, and rely on the initiative of its officials for such purposes; when these officials
move or are replaced, the manner of data collection is not necessarily maintained. Other
States do have specific formats for such purpose, but they are not standardized across the
country. Therefore, the results in the estimation of assistance requirements are not fully
comparable across all States and over time. On the other hand, however, standard formats
are used by all States to report the estimated requirements of relief assistance to the Central
Level.
The above situation facilitates the claim by Central Government authorities that the States
inflate their estimation of National Disaster Response Fund requirements, which in turn
results in longer periods of time required for Central Government review of each State
funding request.
Lastly, there are no standard lists or forms for collection of the baseline information and
information sources required to conduct full-fledged assessments of disaster effects, impacts
and need, such as the ones presently in use elsewhere in the world. This fact sometimes
leads to the erroneous assumption that the required data is not available in different
sources.
2.5: Summary of Conclusions and Recommendations
The analysis undertaken shows a number of significant gaps in the scope of the current
system of post-disaster assessments in India v is a vis the current international practices,
that are summarized in the following points:
- The existing system of post-disaster assessments in India is designed to estimate
disaster relief response from the Central and State government exclusively, and only
very partial needs of assistance for recovery;
- The value of response assistance is erroneously designated as the total value of
damage and losses caused by disasters, and thus results in a gross underestimation
of disaster effects and impacts;
- The assessment, in its current form, does not cover the estimation of post-disaster
needs for the entire affected population;
- In addition, it does not cover all affected sectors of socio-economic activity. As
examples, the industry, trade or commerce, tourism and mining sectors are not
included; and, under agriculture, only food crops are covered, leaving out possible
losses in the production and export of tea and other commercial crops. In some
cases, no estimation is made of the cost of providing psycho-social assistance to
disaster-affected persons.
- From current assessments, it is not possible to derive the total cost of disasters to
the Indian society, economy and environment;
- The estimation of disaster impact at the macro-economic level is not possible to
make, as production losses in all productive sectors are not estimated on a
systematic basis
- Only partial estimations are made of disaster impact at the personal or household
levels – which fact prevents an estimation of the decline in personal and family
income and increases in costs of living – and no estimates are made of the macro-
35
social impact and of the resulting delays in achieving Millennium Development Goals
(MDGs).
- The current system does not permit estimating the financial requirements to obtain
recovery in production, personal income, and supply/access to basic services for the
population, and there exists evidence that affected persons do not recover or take a
very long time to recover after disasters;
- The current estimation of assistance for house reconstruction and repairs provides
only a fraction of the funds needed by home owners; in the absence of savings or
other financial contributions, families are forced to rebuild their homes with sub-
standard materials norms and the resulting disaster risks are above those that
prevailed before the disaster;
- Furthermore, there is evidence that at least in some cases reconstruction of roads
does not follow a disaster risk reduction standard, thus resulting in higher disaster
risk for the future;
- The fact that the cost of reconstruction of public property and roads is financed from
the regular State budget for operation results in a reduced availability of funds for
maintenance, which in fact reduce the intended life span of existing infrastructure
and would induce higher costs of operation of vehicles.
This situation needs urgent attention and solution if the Government is keen to address the
negative impact of disasters.
It is recommended that the current methodology for post-disaster assessment used
internationally be promptly adapted to the specific characteristics of India, so that the
government may consider its eventual adoption. In this connection, it must be emphasized
that during the State visits and during Central Government meetings held in New Delhi, the
ADPC Team has found evidence that the baseline information required for such
undertakings is available in India, as in any other development country, despite claims to the
contrary expressed orally by some government officials and also in some assessment
reports.42 Furthermore, the sufficient availability of baseline information was evident when, in
the period 2003 to 2005, ADPC conducted a technical assistance project to transfer the UN-
ECLAC methodology to the Gujarat State Disaster Management Agency (GSDMA). Thus,
the ADPC Team is fully convinced that if quantitative information on sectorial disaster effects
is collected during field assessments, and combined with the existing baseline information of
socio-economic development conditions, the improved UN-ECLAC methodology is fully
applicable in India, and should enable a full analysis of disaster impact on social, economic
and environmental conditions as well as the comprehensive estimation of post-disaster
recovery and reconstruction needs.
42
In this regard, note is made of the statement included in the document titled Bihar Kosi Floods 2008, Needs Assessment
Report, as prepared by the Government of Bihar, the Asian Development Bank and the World Bank, 2010, where it is
indicated that “The second limitation is data availability. As comprehensive data is not available on economic losses, it was
not feasible to deploy the UN-ECLAC Damage and Loss Assessment Methodology”. The correct meaning of that statement
is that no government report on production losses was available at the time of the assessment, and that the assessment
team elected not to undertake such estimation on its own due to time constraints.

36

37
Annexes
Annex- 1: State Field Visit Report
Annex-2: Relevant Data Collected from States
Annex-3: Chart depicting damage assessment procedure in India

38

Annex- 1: State Field Visit Report Annex-2: Relevant Data Collected from States Annex-3: Chart depicting damage assessment procedure in India
Post Disaster Need Assessment Study for India 2014-‐2015

Post Disaster Needs Assessment Study for India, 2014-2015
State Visit Report A: Key Objectives 1. To obtain first-hand information on what is presently done in terms of post-disaster
needs assessment1, including the scope, forms used, process and documentation of post-disaster memorandum and other reporting;
2. To determine what information (economic, environment and social) is available that may be used as baseline for any possible future assessment, and collect samples of such information that is not currently available in the respective websites of the official institutions that produce them; and
3. To obtain from counterpart officials their views on the possible scope of a holistic, new system of post-disaster needs assessment.
B: Field Visit purpose
To accomplish the objectives, ADPC team with PIU (NIDM officials) would visit selected States whereby collection would be made of, and discussions would be held with, State and District officials for the following:
• Reports of past disaster assessments conducted; • Standing directives, guidelines and standard formats that may be available and en force in
each State Disaster Management Agency and other local agencies for disaster impact and needs assessment; and
• Exchange of ideas on possible ways to improve data collection and analysis.
C: Data Collection
To facilitate data collection, the following baseline information to be gathered in each State is presented below.
1. Annual State Statistical Abstract, for past 5 years, which normally includes: - Gross State Domestic Product, in real and nominal terms, and by sector of economic
activity, and Fiscal sector position; 2. State Production Accounts, by sector of economic activity, for past 5 years;
1 The term assessment is used not for only relief distribution purposes but for recovery and reconstruction purposes as well.
POST DISASTER NEEDS ASSESSMENT STUDY FOR INDIA 2014-2015

Post Disaster Needs Assessment Study for India, 2014-2015
3. Value-Added coefficients relating gross production to GSDP, by sector of economic activity (usually obtained from either an input/output table or from supply-and-use tables, available from Statistical Offices;
4. Population Census by State, most recent version; 5. Household survey by States, most recent version, including data on income and
expenditure by households; 6. Human Development Report, most recent version, with State-level data; 7. Agricultural Census, most recent, with state level data; annual agriculture production
yearbooks (quantity of crop production, harvested area, and prices paid to farmers for each crop); annual agricultural production forecasts (based on planting intentions and seed varieties to be used by farmers), etcetera;
8. Annual electricity production by source, annual sales of electricity to consumers, consumer rates, etcetera;
9. Annual water supply to consumers, by consumer type; annual sales of water to consumers, and consumer rates, etcetera;
10. Official surveys on quantity and economic value of environmental assets and services that may be available.
C: Key Informants
• State level Government officials • District and below Level Officials • Non-Government agencies that supports Government DRM agenda
D: Key Informant Questions
Headline Questions
1. What is the current institutional arrangement for post-disaster needs assessment2 in the State? 2. Can you share some of the examples of post-disaster assessments carried out by the State? 3. Do you have examples where local government and communities have been consulted
thoroughly for developing recovery and reconstruction process? If so, why and how did this occur?
4. Which are the main Departments and Agencies in your State that are involed in post- disaster needs assessment?
5. What are the gaps in the current system: human resource capacities and training needs? 6. Based on your experience, please recommend the best ways to put in place a system of
post-disaster needs assessment for your State
2 A needs assessment referred hereafter is a systematic process for quantitatively determining damage and losses from natural disaster events, measuring the impact of the disaster at all levels, and identifying the financial requirements to achieve recovery and reconstruction

Post Disaster Needs Assessment Study for India, 2014-2015
Specific Questions
Partnerships
1. Please provide examples where Government has used non-government agencies help in carrying out post-disaster needs assessment, particularly on environment, social and economic sectors?
2. Please provide examples where the private sector has a significant role in post-disaster needs assessment
3. How do community representatives (e.g. NGOs or local leaders) participate in post-disaster needs assessment and influence the allocation of funding for recovery and reconstruction? Please provide examples.
Technical Capacity 4. Are government officials able to obtain social, economic and environmental baseline and trend data? Are officials able to assess the data collected after a disaster?
5. Do the key officials such as SDM, BDO and Revenue Inspectors have appropriate formats for conducting PDNA? What are the different forms and formats being used?
Institutional Capacity
6. Besides Revenue Department, which are the other key departments that conduct post-disaster needs assessment
7. Does the Department of Agriculture in the States carry our annual reports on production (production quantity, surface area planted, unit prices paid to producers, for each crop),
8. Do they conduct annual production forecasts for each year on the basis of surface intended to be planted and seed variety to be used by farmers, and also whether they carry out annual food balance surveys and forecasts? If they do, please share latest information they have which may not be in their web portals (for use as baseline information for any post-disaster needs assessment in the future).
9. Do companies such as electricity and water and sanitation (both publicly owned and privately owned) do any post-disaster needs assessments?
10. Please share copies of such work if available, as well as the annual performance reports of those companies that could be used as baseline for any assessment in the future
11. How are the provisions in NDRF and SDRF being used for post disaster needs assessment?
12. Which are the key Department and agencies in the State that collect information on social impact due to disasters? Is there any system of assessing the social impact in the State?
Community Engagement
13. Please provide examples where community-based organizations (CBOs) are mobilized to assess post disaster damage assessment. What is needed to mobilize CBOs?

Post Disaster Needs Assessment Study for India, 2014-2015
E: Possible Departments for Field Visit3
1. Agriculture Department 2. Animal Husbandry & Fisheries 3. Disaster Department 4. Education 5. Energy Department 6. Environment & Forest Department 7. Finance Department 8. Health, Medical & Family Welfare 9. Housing 10. Industries and Commerce 11. Information & Public Relation Department 12. Infrastructure and Investment 13. Irrigation 14. Panchayat Raj and Rural Development 15. Planning & Development Department 16. Revenue & Land Reforms Department 17. Science & Technology Department 18. Social Welfare Department 19. Transport, Roads and Buildings Department 20. Urban Development Department 21. Water Resources Department 22. Women, Children, Disabled and Senior Citizens
3 Since there are limitations in the budget for the project, it will be necessary to limit the number of institutions to be visited and it will be up to the State to suggest which Departments to meet.
Post Disaster Needs Assessment Study for India, 2014-2015
A visit was made to the State of Uttarakhand was held from 23 to 25 March, 2014, to obtain information on the procedures used for disaster impact and post-disaster needs assessment, as part of the PDNA Study for India. This is a brief report of information obtained and discussions held during said visit.
Meeting with DMMC
After lengthy and detailed discussions were held with the Director, DMMC, it has been ascertained that post-disaster needs assessments undertaken by the combined action of the Revenue Department and DMMC are made with the sole purpose of ascertaining the financial requirements for relief assistance as defined under the guidelines set forth for the State Disaster Response Fund and the National Disaster Response Fund. Revenue Department officials either visit or contact by phone the affected areas to obtain information on destroyed assets and on whether crop production has exceeded 50 per cent of expected output, and deliver the obtained information to DMMC.
It was also found that not all sectors of economic and social activity are included in the assessment of relief requirements. As an example, in regard to the industrial sector the relief requirements of small scale mills and other similar micro-enterprises are included without covering the entire spectrum of industries, and little if anything is covered for the commerce or trade sector. Similarly, no assessment of recovery and reconstruction needs is made for the case of the environment, even though it is recognized that environmental assets and services are widely affected by disasters.
The guidelines for SDRF and NDRF are used to estimate relief fund requirements, and do not include any provisions for estimating recovery of personal/household income, recovery of services provision, or recovery of production financial requirements. Therefore, it may be concluded that the scope of post-disaster needs assessments in the State is limited and does not cover the entire needs arising after disasters.
The Deputy Secretary, Revenue Department was invited to attend the meeting with the Director, DMMC, and provided information as to the scope of the estimation of relief needs routinely done by Revenue Department officials. He also indicated that such officials do not have adequate substantive training on each of the sectors that they are to assess, and that they only conduct a quantification of the numbers of affected families or households due to the disaster.
Copies were obtained of the standard forms used to collect data on the number of affected households, on which estimations are subsequently made of the relief requirements using the standards set forth in the Manual of Administration of SDRF and NDRF.
The ADPC Team concluded that the estimations of relief assistance is undertaken promptly by the combined action of DMMC and the Revenue Department, which results in the provision of relief assistance to the affected population, but that additional training on data collection and processing might benefit the Revenue Department staff.
Uttarakhand State Visit Report

Post Disaster Needs Assessment Study for India, 2014-2015
The meeting concluded with an expression by the two Government officials that since only very limited amounts of funding are available for relief assistance under SDRF and NDRF, they consider that there is no need for conducting the estimation of recovery and reconstruction needs, which fact is aggravated by the lack of trained staff in their Departments that might carry out such wider scope estimations.
They pointed out that some sectorial agencies or departments – such as the departments of agriculture, public works and others – do make estimations of longer term recovery and reconstruction requirements, since they have the required expertise on their staff and also have access to normal development funds for that purpose. Upon receiving such information, it was decided to visit at least the Department of Agriculture in order to find out the type of additional assessments carried out by these sectorial agencies.
Meeting with the Department of Agriculture
During a visit to the Department of Agriculture it was possible to obtain a clear picture of the sectorial estimations conducted on crops losses and damages to agriculture infrastructure caused by disasters, and also to verify the type of baseline information on production that is regularly collected by the Department.
It was indicated during the meeting that after a disaster occurs, staff from the Agriculture Department carry out an estimation of the value of production losses of crops and that they also estimate the needs to reconstruct destroyed assets. It was also indicated that they have access to financial resources to overcome the negative impact of the disaster on production and to rebuild destroyed assets, by drawing from the regular budget for development of the sector that the Department manages.
Through subsequent exchanges of information it was found that while they may estimate the value of production losses, such estimations are not used to ascertain the amounts of recovery assistance required by farmers to restore production to pre-disaster levels; furthermore, that reconstruction requirements that they estimate refer mostly to funding required to rebuild assets under the domain of the Department, but that they do not include rebuilding of destroyed assets of the affected farmers nor to reduce disaster risk.
The ADPC Team concluded that although the Department of Agriculture has the expertise required to estimate agriculture production decline and losses, they do not expand the analysis to estimate recovery and reconstruction requirements by the disaster-affected farmers. It follows then that again in the case of the agriculture sector, only relief assistance is provided to the farmers, after which they are left on their own to rebuild their destroyed assets and to try and recover production levels on their own using their own resources. It was further concluded that the Department of Agriculture is utilizing development funds to attend to post-disaster needs within their institutional purview, but at the cost of reducing the financing available for normal development purposes.
Documents were obtained that describe the annual quantities of crop production, surface area planted, average crop yield, and prices paid to farmers as well as market prices for each crop. The availability of this information ensures that there is sufficient baseline data to conduct full assessment of disaster effects and impact and post-disaster requirements for recovery and for disaster-resilient reconstruction, if it were so desired.
Post Disaster Needs Assessment Study for India, 2014-2015
Field observations of road reconstruction
During the trip to Uttarakhand it was possible to briefly observe on-going reconstruction works of the road and drainage structures (including bridges and culverts) that were destroyed by last year´s floods in parts of the State.
It became evident that considerable erosion occurred in the uplands, and that the silt was deposited in river beds and in the adjacent plains. River bed levels have risen considerably after the event. Yet, the road was not realigned to avoid the sections that are at lower levels, and several bridges and culverts are being rebuilt at the same level and with similar discharge capacities as they had prior to the disaster. Some private houses had been rebuilt in the same location they had prior to the flooding, adjacent to rivers.
Reconstruction using the same pre-disaster standards and without minimum relocation may have actually increased vulnerabilities, which might facilitate further destruction of the rebuilt works when new, high-intensity rains generate further floods in the near future.
People Visited
1. Mr Piyoosh Rautela, The Executive Director, DMMC 2. Mr Santosh Bhadoni, Deputy Secretary, Revenue Department 3. Mr Mahidhar Singh Tomar, Deputy Director (Technical), Directorate of Agriculture
Documents Reviewed during visit-
1. Uttarakhand Memorandum 2012 2. Disaster Relief Memorandum 2010 3. Rudraprayag Memorandum 2012 4. P-20 Form 5. Crop Production Details – Kharif 2011-12 and Rabi 2010-11 6. Crop MSP Details (as of 24-03-2014) 7. Information on Reconstruction / Re-establishing Destroyed Assets (Agri Dept) 8. Performance Budget 2013-14 (Agriculture Department) 9. Proposed Work Plan 2013-14 (Agriculture Department).
Post Disaster Needs Assessment Study for India, 2014-2015
Visit to the State of Odisha
The ADPC Team Leader for the PDNA Study for India, and Miss Priyanka Chowdhary from the Project
Implementation Unit (PIU) of the National Cyclone Risk Mitigation Project (NCRMP), National Institute of Disaster Management, visited the State of Odisha from 1 to 3 April 2014 to obtain information on the current practices for disaster impact assessment in that State, as well as to gather statistical information on State activities for use as baseline for possible future post-disaster needs assessments.
During the visit to Bhubaneswar the offices of the Odisha State Disaster Management Authority (OSDMA), Revenue Department, and of other disaster-related sectorial and support institutions were visited and discussions were held to learn about current practices for disaster impact assessment, recovery and reconstruction activities. A list of the officials with which interviews were held follows:
1. Dr. Taradatt, Additional Chief Secretary, Revenue and Disaster Management Department. 2. Mr. Avaya Kumar Nayak, General Manager, Odisha State Disaster Management Authority (OSDMA). 3. Mr. B.N. Mishra, GIS and Environment Specialist (OSDMA). 4. Mr. Puroshottam Sahoo, Additional Secretary, Agriculture Department 5. Mr. Gangadhar Dass, Joint Secretary, Agriculture Department. 6. Mr. Shatrughan Dass, Chief Engineer, Water Resources. 7. Mr. Dushyasan Behra, Director, Directorate of Economics and Statistics 8. Chief Engineer, Public Works. 9. Mr. Prabhat Ranjan Mohapatra, Deputy Relief Commissioner, Revenue Department.
During the discussions it became evident that State officials of the Revenue Department conduct
assessments for disaster relief purposes, efficiently following the dictates of the State Disaster Response Fund and the National Disaster Response Fund, with a view to providing assistance to affected population within 45 days after a disaster. The amounts of assistance provided are defined in the guidelines of the previously mentioned funds.
In addition, officials from the State line departments conduct subsequent estimations of agriculture sector losses, urgent repairs required for basic lifelines or services – including roads, water and sanitation, electricity supply, etcetera – in order to carry out rehabilitation works in public infrastructure. Funds for that purpose are taken not from the Relief Funds but from the operation and maintenance budget of each line department, even at the cost of not being able to provide proper maintenance to other works.
In summary, in Odisha State relief assistance is estimated and provided in an efficient manner, although not all sectors of social and economic activity are covered, on the assumption that the affected population has savings, insurance or other means to achieve it on its own. Recovery needs are not estimated.
Reconstruction needs to replace destroyed assets are estimated for government-owned property only. Reconstruction requirements are obtained from the normal or regular State Government budget for operation and maintenance, despite the opportunity costs generated by using maintenance funds, which would imply that inadequate maintenance is provided to infrastructure after disasters. No evidence was provided that the rebuilt infrastructure conforms to disaster-resilient standards.
Odisha State Visit Report

Post Disaster Needs Assessment Study for India, 2014-2015
Discussions were held to reach a consensus on the limitations of the existing system of assessment, and on the need to conduct holistic assessments to cover all sectors of social and economic activity, whether publicly or privately owned, and to provide – in addition to relief assistance – recovery and reconstruction under improved standards to achieve risk reduction.
During said discussions, note was taken of the State officials legitimate concern for the possible unavailability of sufficient State funds to cover such wide-ranging needs, in view of State budget limitations. As a reply, assurances were given to them that the State Government was not expected to finance all recovery and reconstruction needs, but to estimate total needs and to facilitate their financing making use of a combination of public and private funds.
We were informed that the Revenue Officials that conduct relief assessments do not have a standardized format for data collection and that, likewise, the Agriculture Department officials that carry out estimation of production losses do not have similar formats.
During a visit to the State Statistical Office information was collected on the schedule of release of statistical data for the State, as well as for surveys describing economic information. A copy of the most recent economic survey available was collected for use as baseline data for any post-disaster needs assessment that may be undertaken in the future. We were informed that the State is waiting for guidelines for the development of satellite accounts for the environment that should come from the Central Statistical Office.
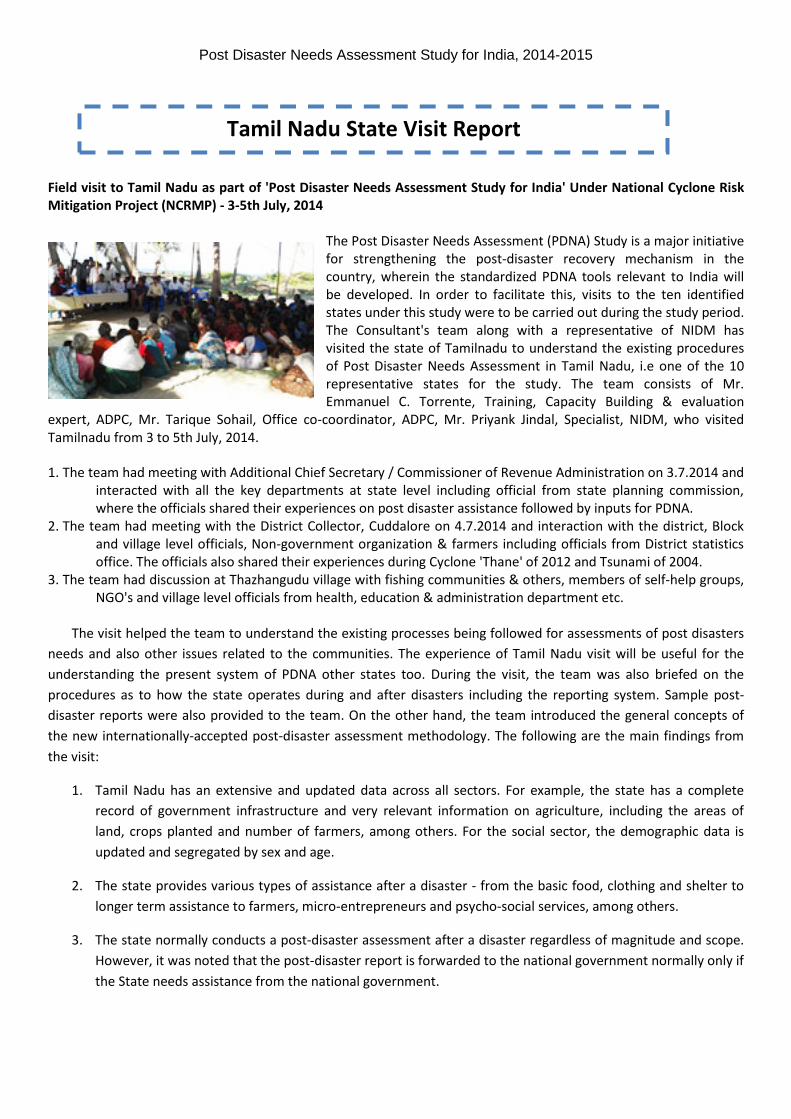
Post Disaster Needs Assessment Study for India, 2014-2015 Field visit to Tamil Nadu as part of 'Post Disaster Needs Assessment Study for India' Under National Cyclone Risk Mitigation Project (NCRMP) - 3-5th July, 2014
The Post Disaster Needs Assessment (PDNA) Study is a major initiative for strengthening the post-disaster recovery mechanism in the country, wherein the standardized PDNA tools relevant to India will be developed. In order to facilitate this, visits to the ten identified states under this study were to be carried out during the study period. The Consultant's team along with a representative of NIDM has visited the state of Tamilnadu to understand the existing procedures of Post Disaster Needs Assessment in Tamil Nadu, i.e one of the 10 representative states for the study. The team consists of Mr. Emmanuel C. Torrente, Training, Capacity Building & evaluation
expert, ADPC, Mr. Tarique Sohail, Office co-coordinator, ADPC, Mr. Priyank Jindal, Specialist, NIDM, who visited Tamilnadu from 3 to 5th July, 2014.
1. The team had meeting with Additional Chief Secretary / Commissioner of Revenue Administration on 3.7.2014 and interacted with all the key departments at state level including official from state planning commission, where the officials shared their experiences on post disaster assistance followed by inputs for PDNA.
2. The team had meeting with the District Collector, Cuddalore on 4.7.2014 and interaction with the district, Block and village level officials, Non-government organization & farmers including officials from District statistics office. The officials also shared their experiences during Cyclone 'Thane' of 2012 and Tsunami of 2004.
3. The team had discussion at Thazhangudu village with fishing communities & others, members of self-help groups, NGO's and village level officials from health, education & administration department etc.
The visit helped the team to understand the existing processes being followed for assessments of post disasters needs and also other issues related to the communities. The experience of Tamil Nadu visit will be useful for the understanding the present system of PDNA other states too. During the visit, the team was also briefed on the procedures as to how the state operates during and after disasters including the reporting system. Sample post-disaster reports were also provided to the team. On the other hand, the team introduced the general concepts of the new internationally-accepted post-disaster assessment methodology. The following are the main findings from the visit:
1. Tamil Nadu has an extensive and updated data across all sectors. For example, the state has a complete record of government infrastructure and very relevant information on agriculture, including the areas of land, crops planted and number of farmers, among others. For the social sector, the demographic data is updated and segregated by sex and age.
2. The state provides various types of assistance after a disaster - from the basic food, clothing and shelter to longer term assistance to farmers, micro-entrepreneurs and psycho-social services, among others.
3. The state normally conducts a post-disaster assessment after a disaster regardless of magnitude and scope. However, it was noted that the post-disaster report is forwarded to the national government normally only if the State needs assistance from the national government.
Tamil Nadu State Visit Report
Post Disaster Needs Assessment Study for India, 2014-2015
4. The valuation methods used by the State in estimating damages and needs are not yet completely in accordance with the internationally-accepted PDNA. For instance, damages, losses and needs are not clearly defined.
5. The creation of a post-disaster recovery plan is not generally practiced after a major disaster. It appears that the post-disaster assessment report is not considered as a tool for longer-term recovery but more of a document that will identify the immediate needs of those affected.
6. The officials met in Tamil Nadu are willing to learn and open to adopt the internationally-accepted post-disaster methodology. The state is willing to collaborate with the project in the development and training of a post-disaster assessment methodology.
Based on what was learned from the visit, the team is of the general opinion that the introduction to Tamil Nadu of the internationally-accepted PDNA methodology that can be easily conducted. First, a post-disaster assessment system exists in terms of procedures and personnel. Second, the baseline information in the state is extensive which will make PDNA easier. Lastly, the state is willing and open to learn and adopt the new methodology completely, from the damage, loss and needs assessment to recovery planning. The experience of Tamil Nadu visit will be useful for the understanding the present system of PDNA in other states too.
Documents reviewed during visit-
1. A booklet that had answers to the questionnaire sent to the visiting state having the headline question and specific questions, and relevant formats.
2. Abstract of the Drought-Water Scarcity Revenue Department G.O.(Ms)No.89 dated 24.02.2014
3. District Disaster Management Plan & Hand Book, Cuddalore, Year 2013-2014
4. Indian Red Cross Society, Cuddalore, Disaster Risk Reduction Program Leaflet & Forms.
5. Report on Thane Rehabilitation Works by Fisheries Department, Thane Disbursement Category Wise, MSME Department, Cuddalore

Post Disaster Needs Assessment Study for India, 2014-2015
Field visit to Maharashtra as part of 'Post Disaster Needs Assessment Study for India' Under National Cyclone Risk Mitigation Project (NCRMP) – 9-11th July, 2014 The Post Disaster Needs Assessment (PDNA) Study is a major initiative for strengthening the post-disaster recovery mechanism in the country, wherein the standardized PDNA tools relevant to India will be developed. In order to facilitate this, visits to the ten identified states under this study were to be carried out during the study period. The Consultant's team along with a representative of NIDM has visited the state of Maharashtra to understand the existing procedures of Post Disaster Needs Assessment in
Maharashtra, i.e. one of the 10 representative states for the study. The team consists of Ms. Priyanka Chowdhary, Specialist, NIDM, and Ms. Thitiphon Sinsupan, Program manager, ADPC, who visited Maharashtra from 9th to 11th July, 2014.
1. The team had a meeting with the Secretary to the Government of Maharashtra as well as Director, Disaster Management Unit, Relief and Rehabilitation Division of Revenue and Forest Department, Government of Maharashtra on 9.7.2014 and interacted with all key departments, such as, Environment, Agriculture, etc., where officials shared their experiences related to post disaster damage assessment and provided their input to PDNA, for example, Standard formats for assessment in different sectors, and in future, attach PDNA specialist with state disaster management authority for capacity building in PDNA.
2. The team has a meeting with Additional Municipal Commissioner of Municipal Corporation of Greater
Mumbai (MCGM) on 9.7.2014 and officials, who shared their experiences about the damage assessment and suggestions for PDNA.
3. The team also had discussion with the Chairperson, Jamsetji Tata Center for Disaster Management, TISS,
and Mumbai, who shared TISS experiences in the post disaster damage assessment (e.g. Psycho-Social Impact Assessment – Post disaster traumatic stress, Vidharbha study). The institute also agreed to share its work on the Rapid assessment report (qualitative assessment) – for Kutch & Rajkot, after Gujarat earthquake of 2001.
4. At district level, the team had a meeting with District Collector, Aurangabad on 10.7.2014 and interacted
with all key departments including Agriculture, PWD, Environment, Fire, Statistics, Forest, Animal Husbandry, etc. where officials shared their previous experiences in damage assessment and shared circulars, reports, and formats for assessment.
5. At district level, the team also met with District Commissioner, Aurangabad Municipal Corporation and
interacted with officials from urban local bodies on 11.7.2014, who shared their overview of damage assessment after disasters, challenges they felt with Maharashtra Resettlement Policy, Acquisition of land act, 1984, and social aspects which is often left out during the rehabilitation and recovery processes.
Maharashtra State Visit Report
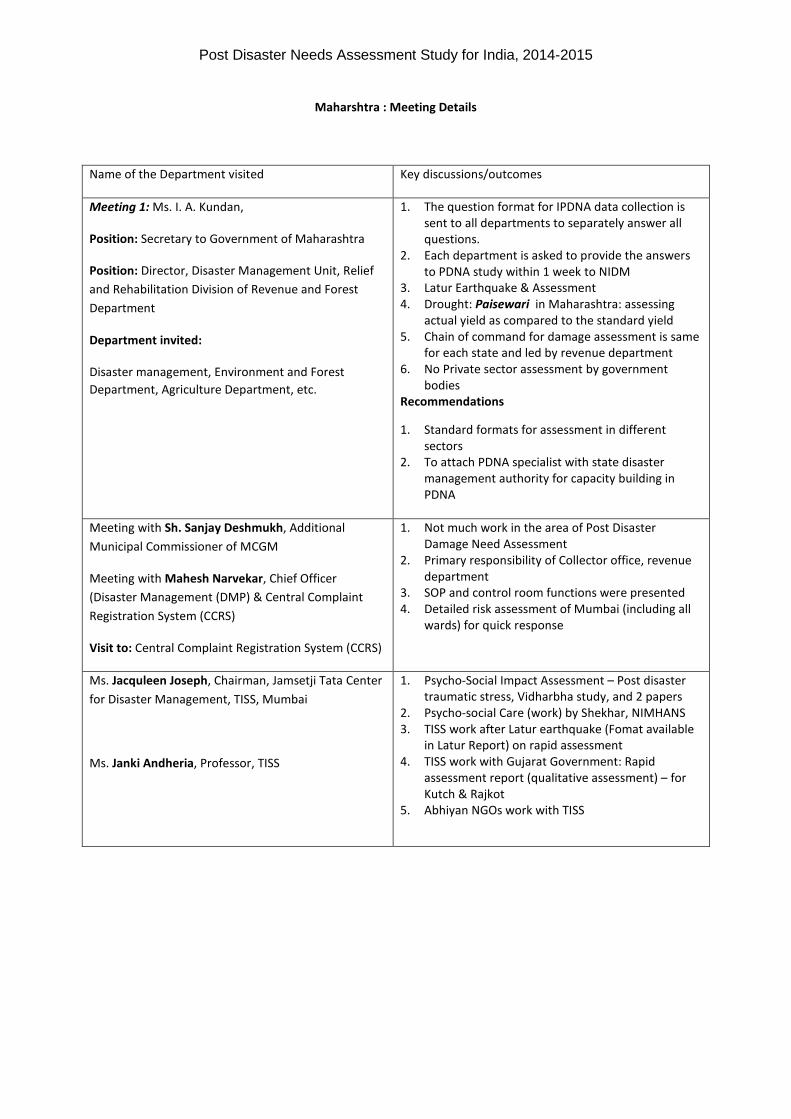
Post Disaster Needs Assessment Study for India, 2014-2015
Maharshtra : Meeting Details
Name of the Department visited Key discussions/outcomes
Meeting 1: Ms. I. A. Kundan,
Position: Secretary to Government of Maharashtra
Position: Director, Disaster Management Unit, Relief and Rehabilitation Division of Revenue and Forest Department
Department invited:
Disaster management, Environment and Forest Department, Agriculture Department, etc.
1. The question format for IPDNA data collection is sent to all departments to separately answer all questions.
2. Each department is asked to provide the answers to PDNA study within 1 week to NIDM
3. Latur Earthquake & Assessment 4. Drought: Paisewari in Maharashtra: assessing
actual yield as compared to the standard yield 5. Chain of command for damage assessment is same
for each state and led by revenue department 6. No Private sector assessment by government
bodies Recommendations
1. Standard formats for assessment in different sectors
2. To attach PDNA specialist with state disaster management authority for capacity building in PDNA
Meeting with Sh. Sanjay Deshmukh, Additional Municipal Commissioner of MCGM
Meeting with Mahesh Narvekar, Chief Officer (Disaster Management (DMP) & Central Complaint Registration System (CCRS)
Visit to: Central Complaint Registration System (CCRS)
1. Not much work in the area of Post Disaster Damage Need Assessment
2. Primary responsibility of Collector office, revenue department
3. SOP and control room functions were presented 4. Detailed risk assessment of Mumbai (including all
wards) for quick response
Ms. Jacquleen Joseph, Chairman, Jamsetji Tata Center for Disaster Management, TISS, Mumbai
Ms. Janki Andheria, Professor, TISS
1. Psycho-Social Impact Assessment – Post disaster traumatic stress, Vidharbha study, and 2 papers
2. Psycho-social Care (work) by Shekhar, NIMHANS 3. TISS work after Latur earthquake (Fomat available
in Latur Report) on rapid assessment 4. TISS work with Gujarat Government: Rapid
assessment report (qualitative assessment) – for Kutch & Rajkot
5. Abhiyan NGOs work with TISS

Post Disaster Needs Assessment Study for India, 2014-2015
Aurangabad Visit
District Collector, District collector office, Aurangabad
Departments’ presented: Agriculture, PWD, Environment, Fire, Disaster Management, revenue, statistics,Animal Husbandry
1. Paisewari (documents including format and circular shared with NIDM) for Drought Assessment in Maharashtra
2. PWD formats for assessment (normal assessment for roads, buildings, buildings which are rented, and bridges shared with NIDM)
3. PWD/AMC: Data base for District Schedule of Rates is available online and revised every year
4. Role of NGO is limited in relief and reconstruction, but not for damage assessment in Aurangabad
5. Statistical information related to PDNA: http://mahades.maharashtra.gov.in/language.do?hl=en
Animal Husbandry 1. Postmortem, disease control, and medical treatment of animals
2. Data base for number of animals available in normal time. Number of animal died and affected after disaster is available
3. Data base: National Bank for Agriculture and Rural Development (NABARD) https://www.nabard.org/English/InvalidPage.htm
4. Data base for market price of animals is available with life stock development officer
5. Curricular on fodder required for animals; 6. Village Level (Demand and supply study on
available fodder in case of any drought, less rainfall, flood situation)
Forest Department 1. Data base available for forest that are grown for commercial purpose
Aurangabad Municipal Corporation (AMC) 1. Overview of Damage assessment after disaster 2. Damage assessment is not the mandate of the
AMC, however, they are capable to undertake and provide support to the district upon request
3. Maharashtra Resettlement Policy in place and but should be revised (location and land price for resettlement) since it often have impacts on people’s livelihood as well as social security due re-settlement, particularly to the poor
4. Acquisition of land act, 1984 will be revised and under this the government will pay double price to the land owner.
5. Social aspects need to consider such as impacts on the women (e.g. widows) in the relief assistance, reconstruction and rehabilitation
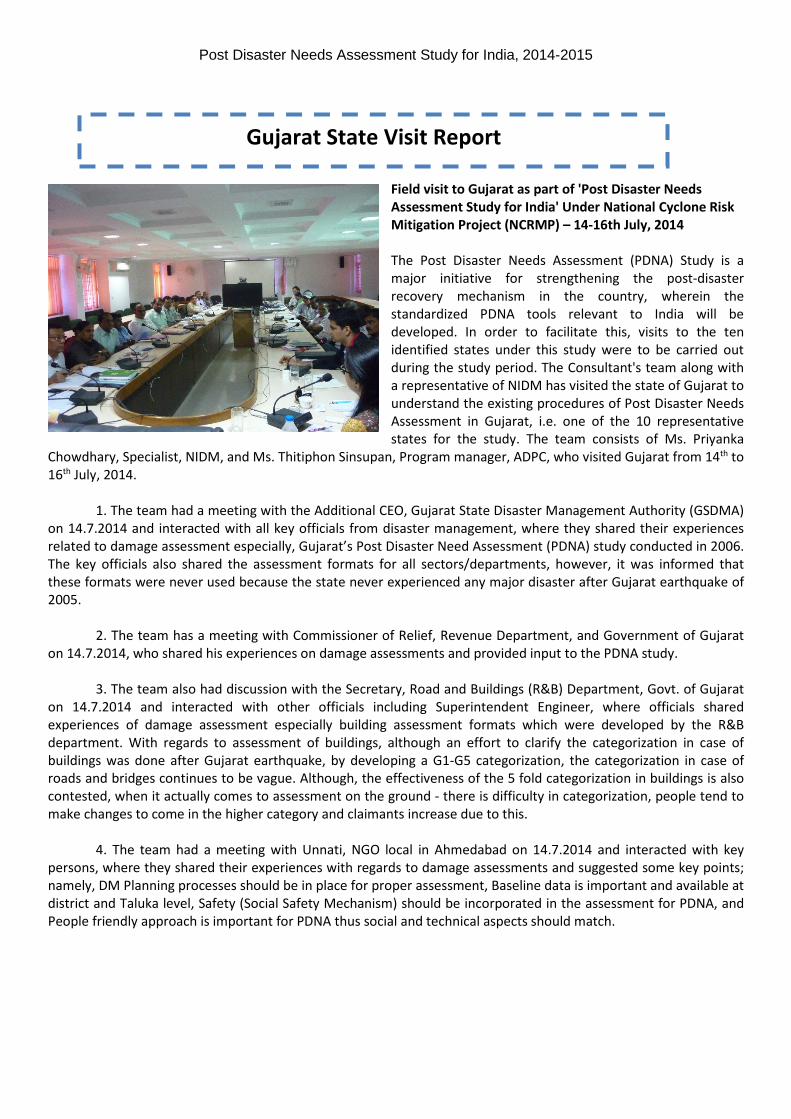
Post Disaster Needs Assessment Study for India, 2014-2015
Field visit to Gujarat as part of 'Post Disaster Needs Assessment Study for India' Under National Cyclone Risk Mitigation Project (NCRMP) – 14-16th July, 2014 The Post Disaster Needs Assessment (PDNA) Study is a major initiative for strengthening the post-disaster recovery mechanism in the country, wherein the standardized PDNA tools relevant to India will be developed. In order to facilitate this, visits to the ten identified states under this study were to be carried out during the study period. The Consultant's team along with a representative of NIDM has visited the state of Gujarat to understand the existing procedures of Post Disaster Needs Assessment in Gujarat, i.e. one of the 10 representative states for the study. The team consists of Ms. Priyanka
Chowdhary, Specialist, NIDM, and Ms. Thitiphon Sinsupan, Program manager, ADPC, who visited Gujarat from 14th to 16th July, 2014.
1. The team had a meeting with the Additional CEO, Gujarat State Disaster Management Authority (GSDMA) on 14.7.2014 and interacted with all key officials from disaster management, where they shared their experiences related to damage assessment especially, Gujarat’s Post Disaster Need Assessment (PDNA) study conducted in 2006. The key officials also shared the assessment formats for all sectors/departments, however, it was informed that these formats were never used because the state never experienced any major disaster after Gujarat earthquake of 2005.
2. The team has a meeting with Commissioner of Relief, Revenue Department, and Government of Gujarat on 14.7.2014, who shared his experiences on damage assessments and provided input to the PDNA study.
3. The team also had discussion with the Secretary, Road and Buildings (R&B) Department, Govt. of Gujarat on 14.7.2014 and interacted with other officials including Superintendent Engineer, where officials shared experiences of damage assessment especially building assessment formats which were developed by the R&B department. With regards to assessment of buildings, although an effort to clarify the categorization in case of buildings was done after Gujarat earthquake, by developing a G1-G5 categorization, the categorization in case of roads and bridges continues to be vague. Although, the effectiveness of the 5 fold categorization in buildings is also contested, when it actually comes to assessment on the ground - there is difficulty in categorization, people tend to make changes to come in the higher category and claimants increase due to this.
4. The team had a meeting with Unnati, NGO local in Ahmedabad on 14.7.2014 and interacted with key persons, where they shared their experiences with regards to damage assessments and suggested some key points; namely, DM Planning processes should be in place for proper assessment, Baseline data is important and available at district and Taluka level, Safety (Social Safety Mechanism) should be incorporated in the assessment for PDNA, and People friendly approach is important for PDNA thus social and technical aspects should match.
Gujarat State Visit Report

Post Disaster Needs Assessment Study for India, 2014-2015 5. At district level, the team had a meeting with Additional District Collector, Kutch on 15.7.2014 and
interacted with all key departments including Irrigation, Mamlatdar, Animal husbandry, Agriculture, Gram Panchayat, etc., where officials shared their previous experiences in damage assessment after Gujarat earthquake of 2001 and shared circulars, reports, and assessment formats they used in the post-earthquake scenarios.
6. At district level, the team also met with officers from Fisheries department on 15.7.2014, where they shared past damage assessment after major cyclones in Gujarat and input to the PDNA.
7. At district level, the team met Industrial Inspector, District Industrial Center (DIC) and other officials from same center on 15.7.2014, where they shared their damage assessment experiences especially from local flood of 2013 in Kutch, when a study was done by this center in Bhuj area to assess the flood damages occurred especially to the service providers such as shopkeepers and expanded to the households living in the affected areas. For salt field, damage assessment was done in the past against flood. The DIC has no predefined formats to make damage assessment after any disaster. It is conducted if directed by the state govt. It shared the damage assessment formats as well as other documents for PDNA study.
8. At district level, the team also met District Development Officer, Kutch on 15.7.2014, who shared his experiences of damage assessment and provided input for PDNA study.
9. At district level, the team had a meeting with key officials from Abhiyan (NGO) – Network of organization and interacted on 16.7.2014 and they shared their damage assessment experiences and suggested that re-assessment is required for the accuracy, for instance, as per the Gujarat earthquake experience, the assessment in health/ medical sector and housing were done 3 times, as things became clearer and situations changed – the first assessment started roughly within 10 days of the earthquake. The other 2 were distributed in the 1 year period that followed. Finally, for the input to the PDNA study, the organization shared some of the key documents on damage assessment.
10. At district level, the team had a meeting with Town Planning Officer, Bhuj Area Development Authority (BHADA) and other officials on 16.7.2014, where they shared their experiences of damage assessment and rehabilitation phase through sharing Master Plan for Bhuj.
11. At district level, the team also had a meeting with key officials from SEWA (NGO) for “women empowerment” and interact on 16.7.2014, where they shared experiences related to damage assessment and input to the PDNA study.
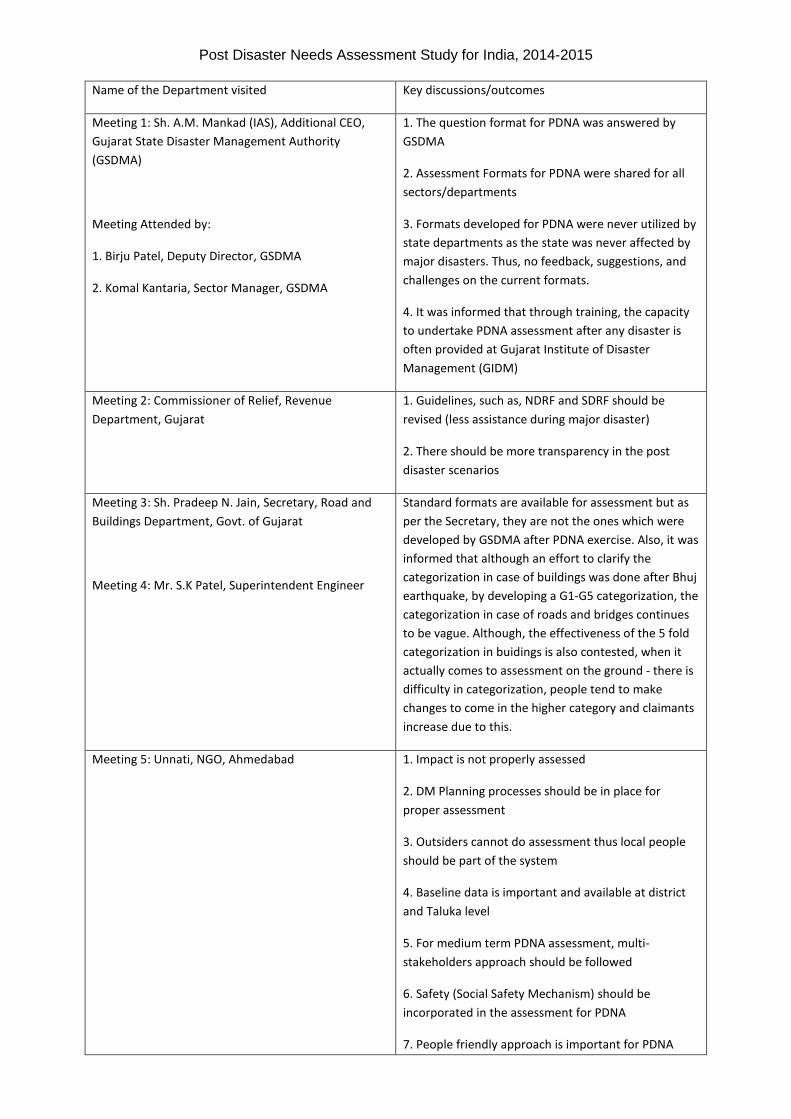
Post Disaster Needs Assessment Study for India, 2014-2015
Name of the Department visited Key discussions/outcomes
Meeting 1: Sh. A.M. Mankad (IAS), Additional CEO, Gujarat State Disaster Management Authority (GSDMA)
Meeting Attended by:
1. Birju Patel, Deputy Director, GSDMA
2. Komal Kantaria, Sector Manager, GSDMA
1. The question format for PDNA was answered by GSDMA
2. Assessment Formats for PDNA were shared for all sectors/departments
3. Formats developed for PDNA were never utilized by state departments as the state was never affected by major disasters. Thus, no feedback, suggestions, and challenges on the current formats.
4. It was informed that through training, the capacity to undertake PDNA assessment after any disaster is often provided at Gujarat Institute of Disaster Management (GIDM)
Meeting 2: Commissioner of Relief, Revenue Department, Gujarat
1. Guidelines, such as, NDRF and SDRF should be revised (less assistance during major disaster)
2. There should be more transparency in the post disaster scenarios
Meeting 3: Sh. Pradeep N. Jain, Secretary, Road and Buildings Department, Govt. of Gujarat
Meeting 4: Mr. S.K Patel, Superintendent Engineer
Standard formats are available for assessment but as per the Secretary, they are not the ones which were developed by GSDMA after PDNA exercise. Also, it was informed that although an effort to clarify the categorization in case of buildings was done after Bhuj earthquake, by developing a G1-G5 categorization, the categorization in case of roads and bridges continues to be vague. Although, the effectiveness of the 5 fold categorization in buidings is also contested, when it actually comes to assessment on the ground - there is difficulty in categorization, people tend to make changes to come in the higher category and claimants increase due to this.
Meeting 5: Unnati, NGO, Ahmedabad 1. Impact is not properly assessed
2. DM Planning processes should be in place for proper assessment
3. Outsiders cannot do assessment thus local people should be part of the system
4. Baseline data is important and available at district and Taluka level
5. For medium term PDNA assessment, multi-stakeholders approach should be followed
6. Safety (Social Safety Mechanism) should be incorporated in the assessment for PDNA
7. People friendly approach is important for PDNA

Post Disaster Needs Assessment Study for India, 2014-2015 Name of the Department visited Key discussions/outcomes
thus social and technical aspects should match
District Visit: Bhuj, Kutch
Meeting 1: Sh. D.B. Shah, Add. District Magistrate/Collector, Collector Office, Revenue Office
Department office Presented: Irrigation, Mamlatdar, Animal husbandry, Agriculture, Gram Panchayat, etc.
1. Process of collecting damage assessment was shared in the meeting by the Sh. D.B Shah
2. The Add. District Collector requested all departments to share their assessment formats with PDNA team
Meeting 2: Officer, Fisheries Department 1. The damages to the fishermen, boats, equipment, etc., are physically examined by the team and a detailed report as per the owner’s account is taken
Meeting 3: Sh. L.M. Parmar, Junior Industrial Inspector, District Industrial Center (DIC)
1. In 2013, study was done by this department to assess the flood damages occurred especially to the service providers such as shopkeepers and expanded to the households living in the affected areas. The formats to assess the damages were prepared by the DIC at the time of flood
2. Micro Medium Small scale Enterprises (MMSEs) are registered with DIC. However, registration is not compulsory. Suggestion: The registration should be compulsory for each unit
3. For salt field, damage assessment was done in the past against flood
4. No predefined formats to make damage assessment after any disaster. It is conducted if directed by the state govt.
Meeting 4: R.G. Balara, District Development Officer, Kutch
1. Damage assessment in various sectors, immediately after any disaster, done as per priorities
2. Immediate rapid damage assessment often carried out with priorities
Meeting 5: Abhiyan (NGO) – Network of organization
Team Presented: 12 members team from Abhiyan was presented for this.
1. During 2001, For Damage assessment, several re-assessment are required. As per the Bhuj experience, the assessment in health/ medical sector and housing were done 3 times, as things became clearer and situations changed – the first assessment started roughly within 10 days of the earthquake. The other 2 were distributed in the 1 year period that followed.
2. Damage assessment is done for various phases after any disaster (i.e. relief, rehabilitation, reconstruction)
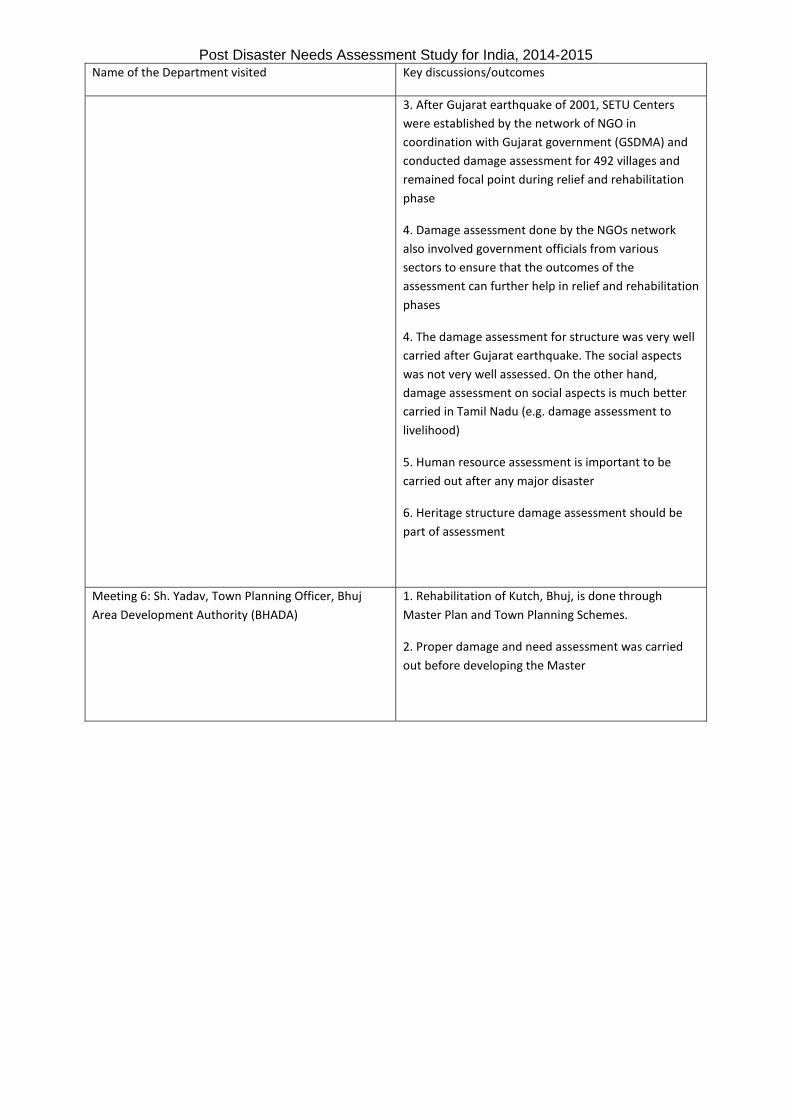
Post Disaster Needs Assessment Study for India, 2014-2015 Name of the Department visited Key discussions/outcomes
3. After Gujarat earthquake of 2001, SETU Centers were established by the network of NGO in coordination with Gujarat government (GSDMA) and conducted damage assessment for 492 villages and remained focal point during relief and rehabilitation phase
4. Damage assessment done by the NGOs network also involved government officials from various sectors to ensure that the outcomes of the assessment can further help in relief and rehabilitation phases
4. The damage assessment for structure was very well carried after Gujarat earthquake. The social aspects was not very well assessed. On the other hand, damage assessment on social aspects is much better carried in Tamil Nadu (e.g. damage assessment to livelihood)
5. Human resource assessment is important to be carried out after any major disaster
6. Heritage structure damage assessment should be part of assessment
Meeting 6: Sh. Yadav, Town Planning Officer, Bhuj Area Development Authority (BHADA)
1. Rehabilitation of Kutch, Bhuj, is done through Master Plan and Town Planning Schemes.
2. Proper damage and need assessment was carried out before developing the Master

Post Disaster Needs Assessment Study for India, 2014-2015
List of documents reviewed during visit-
No. Name of document Source Remark
Maharashtra
1 MEERP at a Glance Maharashtra EQ in 1993; the damage; recue & relief; rehabilitation; salient features of EQ rehabilitation program (housing, infrastructure, water supply, irrigation, economic rehabilitation, social rehabilitation, community rehabilitation, technical assistance, training and equipment); achievements at a glance; community participation; technology
2 Establishment of DM policy & plan
Aurangabad In Marati
3 Aurangabad district disaster management plan 2014-2015
Aurangabad
4 Paicewari circular Agriculture Dept., Aurangabad
In Marati
5 Paicewari Formats Agriculture Dept., Aurangabad
In Marati
6 Description of Pacewari Agriculture Dept. In Marati
7 Manarashtra circular regarding livestock in drought situation
Animal husbandry, Aurangabad
In Marati
8 Animal husbandry statistical booklet 2010-2011
Animal husbandry, Aurangabad
9 Availability of fodders in case of drought
Animal husbandry, Aurangabad
In Marati
10 Database – fodder storage schemes (DVD)
Animal husbandry, Aurangabad
11 Comprehensive inspection form for bridge
PWD, Aurangabad In Marati
12 Road management system PWD, Aurangabad
13 Rent valuation history sheet PWD, Aurangabad In Marati
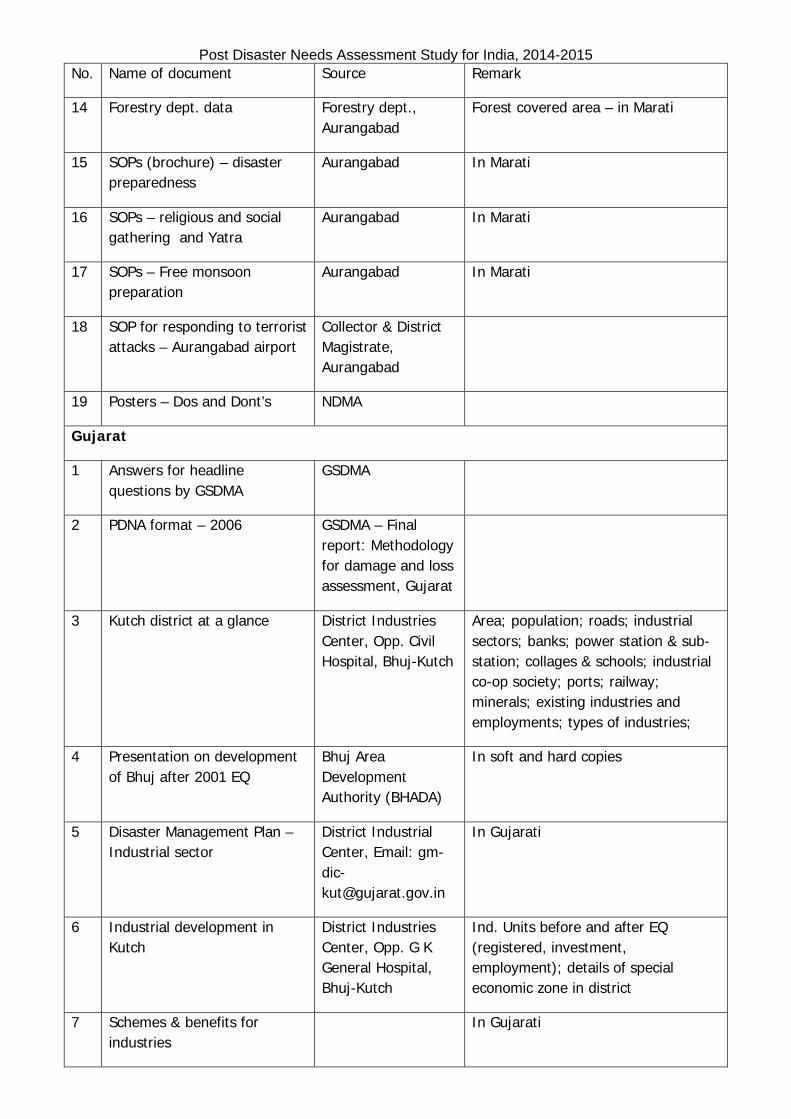
Post Disaster Needs Assessment Study for India, 2014-2015 No. Name of document Source Remark
14 Forestry dept. data Forestry dept., Aurangabad
Forest covered area – in Marati
15 SOPs (brochure) – disaster preparedness
Aurangabad In Marati
16 SOPs – religious and social gathering and Yatra
Aurangabad In Marati
17 SOPs – Free monsoon preparation
Aurangabad In Marati
18 SOP for responding to terrorist attacks – Aurangabad airport
Collector & District Magistrate, Aurangabad
19 Posters – Dos and Dont’s NDMA
Gujarat
1 Answers for headline questions by GSDMA
GSDMA
2 PDNA format – 2006 GSDMA – Final report: Methodology for damage and loss assessment, Gujarat
3 Kutch district at a glance District Industries Center, Opp. Civil Hospital, Bhuj-Kutch
Area; population; roads; industrial sectors; banks; power station & sub-station; collages & schools; industrial co-op society; ports; railway; minerals; existing industries and employments; types of industries;
4 Presentation on development of Bhuj after 2001 EQ
Bhuj Area Development Authority (BHADA)
In soft and hard copies
5 Disaster Management Plan – Industrial sector
District Industrial Center, Email: [email protected]
In Gujarati
6 Industrial development in Kutch
District Industries Center, Opp. G K General Hospital, Bhuj-Kutch
Ind. Units before and after EQ (registered, investment, employment); details of special economic zone in district
7 Schemes & benefits for industries
In Gujarati

Post Disaster Needs Assessment Study for India, 2014-2015 No. Name of document Source Remark
8 Schemes & benefits after Bhuj EQ
In Gujarati
9 Schemes – District Industrial Center
District Industrial Center (DIC)
In Gujarati
10 Cash dole application format Revenue dept. Mostly flood immediate relief – in Gujarati
11 Tabular information - PWD Publicworks Department (PWD), Kutch
Department wise details of EQ affected Resi. Govt. Buildings; Details of Progress of Works (R&B Deptt. Public Building EQ); Gujarat Emergency EQ Reconstruction Project; Damage of surface roads; Damages to bridge, cause way, slab drain, pipe drain & protective work
12 Forestry Dept Format Gujarat In Gujarati
13 DVD Coming Together – All Edition
Abhiyan A document on the past earthquake rehabilitation by various organizations working in Kutch
14 Pre/Post monsoon inspection format
Kutch Irrigation Circular
The inspection checklist to be completed every time a maintenance inspection is performed. General inspection to be performed every year in Mar and Oct.
15
Flood Disaster Management Plan (Early Warning)
In Gujarati
16 Department Information - Bhuj Area Development Authority (BHADA)
Bhuj Area Development Authority (BHADA), www.bhujada.com
In Gujarati
17 Format Animal Husbandry In Gujarati
18 Format Animal Husbandry In Gujarati
19 Format in case of death in disaster
In Gujarati

Post Disaster Needs Assessment Study for India, 2014-2015
Field visit to Bihar as part of 'Post Disaster Needs Assessment Study for India' Under National Cyclone Risk Mitigation Project (NCRMP) – 20th-24th July, 2014
Meeting with Agriculture Directorate, Patna
• The three member team consisting of Mr. Aslam Perwaiz & Tarique Sohail from ADPC and Mr. Priyank Jindal from NIDM had a discussion on the PDNA scenario in the state.
• Eye estimation – farmer wise in the village with help from revenue inspector and at times district
officials are present • Basic problem is land erosion, silt deposit and mass rehabilitation • CRF mandates river Sone area affected only if it is more than 50% whereas for drought it is not considered • Use of modern technology is advocated by the department officials like remote sensing, geo tagged GPS • Training on post disaster assessment to panchayat sewaks, kisan salahkar and agriculture coordinator who
are the actual person to visit the affected area initially
Disaster Management Department, Patna Secretariat
• Pertaining to relief disbursement only, actual assessment is not done • More stress needed on scientific assessment , satellite monitoring • Crops estimation via satellite for actual damage • SOPs of flood and drought different • Enrolling of all small and roadside establishment for quick response in times of disaster
BSDMA, Pant Bhawan, Patna
• Prof. Arya emphasized todays preparedness scenario as grim compared to the 1934 earthquake,
• Recovery of life, livelihood and rehabilitation, reconstruction is required for the PDNA
• The present methods estimates the loss as per state directives whereas need is there for all type of damage estimation for actual PDNA
• Stressed estimation based on panchayat and village business affected
• Need of training required
Bihar State Visit Report

Post Disaster Needs Assessment Study for India, 2014-2015 Vikas Bhawan, Collectorate, Saharsa
• Most of the line departments were present but were unable to part with formats used for assessment after a disaster.
• IMD reporting to be channelized with more sophisticated equipments
• Assessment done to grant relief, no provision for recovery • No socio psychological assessment done
Field visit to ascertain the functioning of the flood relief shelter/center in the village of Amarpur, Block Kahara. It was assisted by Mr. Mohit Kumar Gupta & Muneshwar Prasad , J.E. Bihar Rajya Pul Nirman Nigam Limited.
These flood relief shelter/center are huge in nature and are strategically located for the convenience of the affected people and are easily accessible. Provisions of cattle shed are there and was seen as separate from the main structure.
Basic facility of washing and cooking within the premises is available and is useful in flood like situation. This centre is used only during flood situation and there are at least three of them within the block level. However on interaction with the local community it was felt that such a huge facility can be utilized for community development purpose otherwise its upkeep is very uncertain and this may lead to damage of the facility.
Annexure 1
Officials Met during the visit
1. Sri. Dharmendra Singh, Director Agriculture 2. Sri. Rajeshwar Dayal, Engineer-in-Chief, WRD, Patna 3. Sri. Dhananjay Pati Tripathi, Director, PPM 4. Sri. Prof. A. S. Arya, Member, BSDMA 5. Sri. Naresh Paswan, Secretary, BSDMA 6. Sri. Vishal Vasvani, BSDMA 7. Sri. Anil Kumar Sinha, Vice Chairman, BSDMA 8. District Officials in Saharsa 9. Members from Inter Agency Group, Bihar
Documents reviewed during visit-
1. High Land area list for use during flood, Saharsa 2. Flood Shelter list, Saharsa 3. Pre-Flood preparedness 2014 by District Disaster Cell, Saharsa 4. Rainfall report from District Statistical Office, Saharsa 5. Guide books on Office disaster Management plan, Earthquake resistance building standard 2012, 2013, from
BSDMA and the BSDMA Newsletter
Annex-2: Relevant Data Collected from States
Post Disaster Need Assessment Study for India

//T-/1/-U.L.*."j- - { )+'rct*+- -Uil^ale- r4ffi
I
I FAD s pdlql-eft eilmfiiiorirtafir fion,$p or4lonpnryb dcub15<Erbu otmdorc @rpriuou rodrirlc@ dornriuupurdr
$Oosirgti, anqpCq4o, 6ffeu$Fb,6r-9grr, Fn6uu[Tsrrb ofgrb eorofltrnOufl onourinch
w#LFAD
gGrbu oraDltr|r6rr durrb
C RC arrrfl urnan dlornuucrgrueb oair
CRC -orouuti
qgol oair, op@ ouurrt
Cf nro /oenrmn Sf nog$ol Oururt
rybanurirEr
gorfl ub /olrrrlillor 6luu.ri
Cumqgprjrgi6 crglrio6 a-eiror Erab
clgn.lpfibg;rb o irumo$ti66 2itdr gfintb
Gpnanafun-rorflor oururi ro$96 Lpi6n
cprrenanr$qpEB
(District) (Cluster) (Panchayat)
c.6.
4.'.6.
(Household)
1. €rGlrbu dunb (oenmriq - lqt umfrrircqrb)
1.1 1.2-;t;ff
1.4 1g t:€ \7 1.8
5U.
eiein. Ouu.rfi.9E
Ef
6fd
$e€
€€s $Ba HI FcE1.
2.
3.
4.
5.
6.
7.
a.
9.
10.
*nnbuti Elpn our:qcocri ocnailu oaftdceqri€r Aoor:r&ir ocntlisnuri(lircr ounq{grono of6otun umilgl Sorluorrb.
I
SURVEY TSUNAMI REHABILITATION - TAMIL NADU

p. er&cngq cdxr&oroncr onrd6 (ANTHROPOilETRYJ (g.g dr eiurq;$gmnoenp oeur.0r-qrb)
2.1 2.2 2.3 2.4 2.5 2.6 2.7
6U.
aabr.g'tPEotilffirouuli
undonb'9EEeog$ ouUE!
(ongl*recffc$e-u.ry6
(6trene6r:u?d6DL
(4Gff4rmb)46nt or.tai,r FTTdI onpb ot@rLtb
1 2
1 2
I 2
1 2
1 2
8. cgDo eurGrrrlDilg Foo (eunOiiolDrrfldjifop dcudLqlb)3.1 qg.D t GiEl z ryiugrori s. gD6ioeb +. r&f
3.2 6dD6a,tidqll t dqbut-oCufonl
2 qil-r@htlru':tJon 3. rdcd$bOir.@blh-cmd
+.pn[I|4in:O-lm S. t-{$it€tt$ttldti
3.3 o(}iueflnd*opcdrr{B
l rJirDt 2SEdmtf 3.5brfiocn(N) 4.8rh-Aino
AEo-oah.
3.4 dtEenofi{ t cro&fi:!ff6
2. €tG 3. CSlrDann: Cl1E(gtfuOuiu.ndD
4. ao[
3.5 d[:Oe-auao L oarrb6d@ 2. dm-dD6 +. Wttil0trdci
3.6 oO)br$tmi l qdnr 2. or.nh S.0@i6tin6
n. dcrgggCrc *rliuor- dc$odr (eunctiprolrerflDolD cr:utrl-qd)4.1 cipnrr1trfi
dor.iorbemst(}Jlgtilrdtrgl 2.Crrrglotrdrtiin
4.2 o{fii#rrrb t d'rgilci&0clouh;aegt
zdi:gbscnnftSdreo*$gt
l eybodl$:ddnfiddei,iitr / eUitgtoanlccqb@dqhg/aleuixlddxbril
/40l/CoL
4.3 sefierryfoo-irdr[r!rb
t stntrybrO z g6efi:qryi6b€,eogtoilr s. 96&rfirgibbet$cronc
4.4 fi*rilgot 16gii'@ e Eino4.5 ucuru6rfft.ngi tS6e(}i.l emh5nrir6t6n'il
s0rj3. srformq +. ancnfliofiu.l s.rfldrgGq
6. cr$lio$ IDOUO ronpqmb (euno$pronaotrirop sr:udl-errb)
5.1 6t-rb t d('qilb ori'nir 6(}iu pr.riant qrtioo pt-ooe&;oairtr uqiigoroocig 6uefuU o..dldtttfudn
r qb.tLm|6o|DOroorc
zqidgtffrigtb6opon6
5.2 Oucqirr* 0'.4trr etessr cprjqo $ptip e@oq/-A$6.irnnrc0on' egi,Cg gxlq l qbrb eAdroo
5.3 e-rilrldr €Oiru fLrtceryi6 Eo 6nti$:(} ott$ (Health Insurance)oafudrP0dmotrf r qb'b z8droeo
5.4 ccnflUifllpioaegri6 otitgi6trd$dfr.dn
t.4niruccrlinutkDouri'EiD6Abdr6oEI
2.poflumirD@p5lo[Do6r
3. erft@rioor$Sr$
4.9u8,uqiigtoruoan
S.enjpcerrEuarq$t{rbAirm
tt ICDS F:ui#*0cooronuru*n(ljOfftcenrrf t qb'h 2. EdfDo 3.SireooaofobarUonb undomg$rboo
5.6 q$n9ro"S r dcryfocirGer0uta-drarg/Qomdre-r-Curne66tbA$os
z. drr*eireirtBcrGurlcirsng au0urnq$futtgirsro
3. ourgdq$ur5lub
4. 6hr[t- 6lo6flulkb
SURVEY TSUNAMI REHABILITATION - TAMIL NADU

6. e-frq ungonriq (6.1dt eun6;ji;prowffio,p otr-rduqrb)
9. dccmulb rofgnb rftfrrlu epild& err;fif4o- durrriodl9.Ldor.b udldliw dqrnioCr
6.1 arir6@2616 o15ub g{96u56 g6pnocriag 3 Gaaoeir e-eorq Ceolidpgni 1q6 I e. Sidos6.2 $tc$eoao6lurerfl dr (gO oOLl@) o$poer pm:ooir gmrE Gorosn p-6eral
e-nt6@riig Souioefldeoo. prr[66h
6.3 mjp orgitaonO c-eorq 4ounu$r pC$uun@ c-eirong?
6.4'DtrDS
g!bun0r6dt?
7. deo p-arLflrrDrDdr (eun@gbpronoolileDll G[er-rfl-qrb)
7.1 ctgimoodom:4inuu+ r. qub 2. Etilos 7.5 oo{BnC/6tgnosGud 1.46 2.8rnos7.2 gsirirrpnfiLau14 r eub 2.$rbdDs 7.6 diC/derrafunri rs6 2.$\$coo
7.3 r@rnbngGDr*&iD t qbrb 2. $r$doo 7.7 gD6iIU F i{ry /plr6irg cti60oncanb 1qb6 2.8$dDs
7.4 $@cdouonesrb r qbtb 2 E$eos
8. onSorprg s€ELrDtwft / eall$e&dbdt (oeocfrq - tqbt umilrioqlb)
8.1
l-or.@rDt 0-CIl.sD2 cr{il-flDg . O-fDt-rol4 2.dil'-euD5
oadig e-ot-fDtD6dr
ol.516[ dugrile6ir r{ar6tai606 Grd,orfti,) F6itncurfbd @'i6ridt egrnr&cncb 6nb @rri{nftir)
t. ocrfieEotb
2. OdOaoopso6
3. ujlpoar
9.9. uullrf,uiu6rb uuf,rt oeooarfrurrlrfroooodr
1.OFti
2.wfi,pgnafrworo666ir
g. @iar-oo4.6fluodl6rfr
5. l$otdE66rdl
6. D'rpoor Gdn$q6)
uniuerq (gdiorie)
e.8. a-riddr 6Grbu6de qbW puriairdr riefogop criryipriurr- egrryf&oefd, fGuc@irefii'odl?
r6ue6drseprdd,Cunb puftarir
t. r&in9rqdiprir
2. t&ir60trro6r
3. oui Ga4! CIcefiirunsni
4. Eui,Gangfll6flDrr6ri
5. oOorr@ eltnijfiurndni
o. eJuorSlEr@dr
7. l.Dt pdDot
Iiurr(Edr
SURVEY TSUNAMI REHABILITATION - TAMIL NADU

ffi
1o. 6r-rb ouulfrglir (eunct$pronaotrfrop ocudl-ql$)
10.1 on1lonrgryg$Dcna S-rb ouuridftaeirn l qbtb z. Eino
to.2 eUb oofu$, gub ouuriyipig untr? I qaitr........... ftn:att 2. 6lrreir........... prudr
10.3 orip oocunot gub ouuirgltb? t. orgr4i$*, Co Dnplitctil Dt:@b 2fub4stDna
1o.4 Co ronpluorir ru!0Ctoeft6 olbioot Dnpduottn
11. d@tDr6r OUorrniodte-niedr oiGrhridd cp&Au scrora ouFlrul8oe effi (aocriq - rct umt&oqrb)
o|,
safuror-ulri
11"1 OpidreDro (9[tin6i 6letl1$6 n22-rj,l,irrUxt
o{DtDfrdmD
@
8@or@ Isor@lD|rfrlD
FSDEttrS{*r
or@tDfianD
(ts@-@ lsouurs|.o
FSb6nrr*I
lg. oLft eiiecuiqrb g0unGodr (eun@iibpurfldlireop ocr-rduqrb)
12.1 friulir 4[t6ir 6rub 5]rugdldffi66tfi, t Ob'h et oca6nril0
ehpddpuft6rnill0
2 8600
12.2 AUb oaft$ gi@iryi$$ E#noo Funaeir emrdl@
eurluuuc(Fhamn? -.-.-.'.-...Futioril
12.3 6$ gfn0t@frdrooraocT 6nult0 ofiugtdrdfrEcrm?
@ l qbrb 2.$d,eleo
on1iffrpng z-alr-eorD / fita,tfu l q5rb 2. EddDo
drOo-"or-otD6dT t e6rh 2. E$dDs
12.4 omlrh+riranen Oill0rub qpnem
@gtllulrit) e@rDrr#ipro 6lrofiem+06.. 96 orgr'"tr$Dg --_.-.
18. roeilp ocrr&airdr (eunq;bprorcf,flJitop ocudrqrb)
13.1 slgr4$s $rorD {}uiuu picirernio 619rail@
Sgotoriro6ir /fUonrdxlr gig6 uufltitd
or-rjfgcirqfiEdn?t qr6 2.86eo0
q6oafldro$pootputicdn
.................4air6cit ..................61u4ir6tf I
13.2 $pgnruulf$oj$OatrtOtoo0ibdultD
t on$nrnpnurb 3.Ouflui0rooneiroo
4. qbp6Dol
lr. onerilu / dlwrrurr ADulDd
14.'l ffirmd{i€n&ir e-rt 6rir g@iu puiadt (qehromfrDonoffub / durmrrlrb oeruirC zrilsrrrcfflt1,
r qb6 2.8rb00
4rb oolkb ooromcurnen ond.lb / e0u.trungtb o$uiude-6irdfi6{in
14.2 GrgDadu ondurb /eflurutu4lird e-unpgritcn o@pnatnb
@pnorg 2 4dnro6€Ei{iio etrfLeb) @
SURVEY TSUNAMI REHABILITATION - TAMIL NADU

15. egognunb ami6O gflryoailifiir
g1!*oem dUpa'Arane agnhtorno e-Crclrtoenr?e-Afrlfe*o*ateddi;oc
oufr ewh
auegdHs,@
rfaroriaimrb
et:@igq 6r;t6tb
to'teso' @fln&-ot'd
16. ord {r6DrD (6@fu aerd&)q9ro6(Opmf6)
a)ernd6crhatprru cl.-&dlor) oiDrbuilfsneidticnacr-ic* -
r". e-dr@ilt gflq[ildnfudnd eudrodnd uni8afq (eurCl$plorndsolD otudrqrb)
17.1u&ceiacuouldeudc.il&rlritqdry
A[ enDtou$&3li€triroronea6 dqSOorCJeEb
Soouigrb e-circnetni'
gb.9@'Ol+lD6frIlr5grdDr.Dt:rtsldr ei €riraonatD':Ob nctipdt
E. enuordldtrrr6r6t6@nuqp EdleDs
SURVEY TSUNAMI REHABILITATION - TAMIL NADU
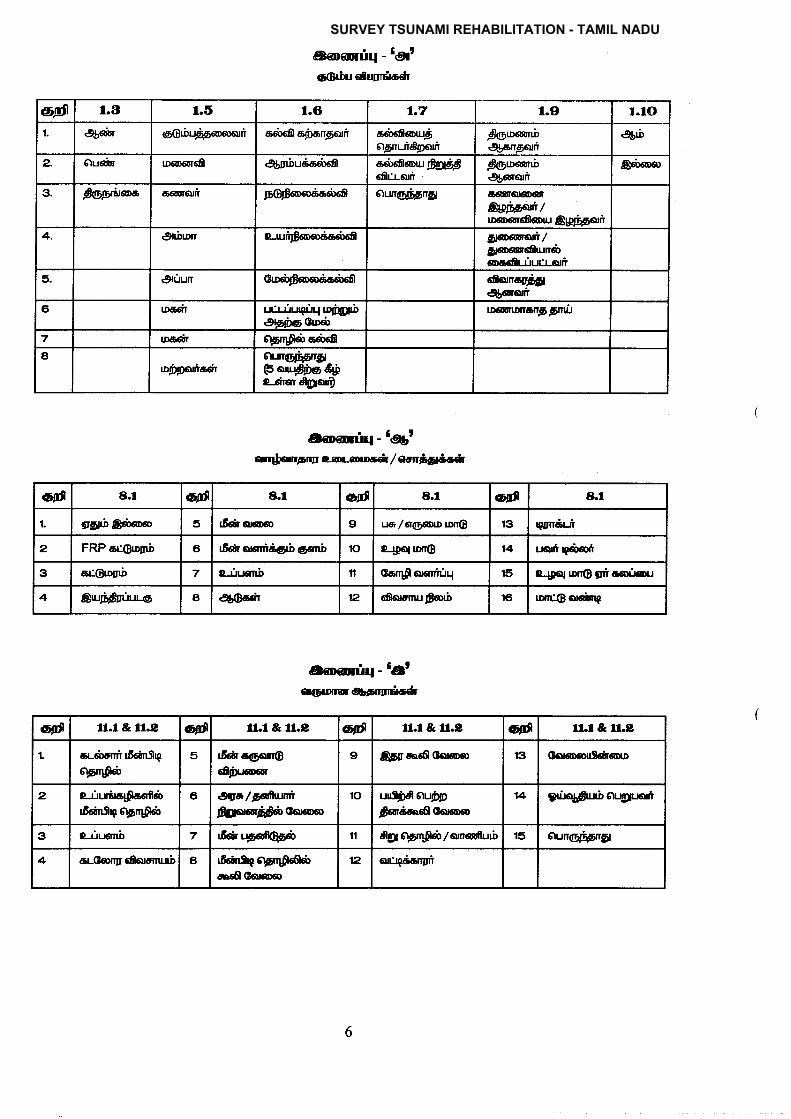
€,,t$ 1.8 1.5 1.6 t.7 1.9 t.101. €5airr gOrixlppiooorri oobd ofrcnporri aeireflour;b
ognuidprui$6roorrbSSsnqioili
e56
2. oueiur uoorefl €UmbuSerirefl adleftourSg45$eflrlon
;fiOtomnb€rororri
gdrdDa,
3. .6Oprttuaoe 65U'IOII p@cooae*gl Oun6$png 66dtro|dDdlAgitpqu'?/rD@tr60oru Arpricorn
4. gtrbon o uliEoa*edrefl g[o@oui/Srfeoodurncireocdu.rucuorft
5. €lrjrun CtD6fbo.irrcircn e0oncsjbgl€btrori
6 lDardl ucdlnguq tDtt{il6g666ALDd)
uononcnppndr
7 Lo66ir oOn*$odxfa
lDElDnrr66n 6 6urg!b66$u#cnCgnfl
oooiq - lort
oiGttu drlrrEcCr
dDeoarrriq - lobt
cn$ongug o-or-orocCr / eefidgrir*
ooorirl - 3ot
fl@rrDrilqeo|Ilrfu*
6fr 8.1 6fr 8.1 6fr 4.1 d &lL gg|lbt\it6tDs 5 6ar oloo 9 u&/6t@|aDrD lD[rO 13 Sttf.irr-'n
2 FRP 6rreI.D[6 6 6&Nrn{i'(g,6Cdnb 10 e-19ol rDr(E 14 uomeo60n
3 or-'@ogrb 7 o irl.16niy t1 Ccn$onnilq 15 2-po{ tDn{ESrf 6ouo..l
4 Aru$Snrus, a €U0J6ir 12 Oorsrurporb t6 t'onr$otdnrp
6fi u.t & fl.s @ ll.l& fl.S 6fr fl.l& l1.S @ rl.l & u.s
1. cr-cirm6on5la6]'irq0o
5 6* cOprrodrit rdDdtr
9 Spsad 0omo 13 Oonoouleroo
2 a-uurao$eerfldr6ein5t$ 6lpq0d,
6 eVc./pffiunitftFdri#d, Coroo
10 un9llC oubgl
.S-,i'.0Goreoo14 eUnfSuOcUry-nn
3 o irgqnil 7 6Arqgen'Ggr*t 11 CgQg,qfid/orndub 15 aun@ftsr$
4 aGofig6norrrnu6 a &infe6ten$H6arflGorco
12 ot'tg66ngn
SURVEY TSUNAMI REHABILITATION - TAMIL NADU
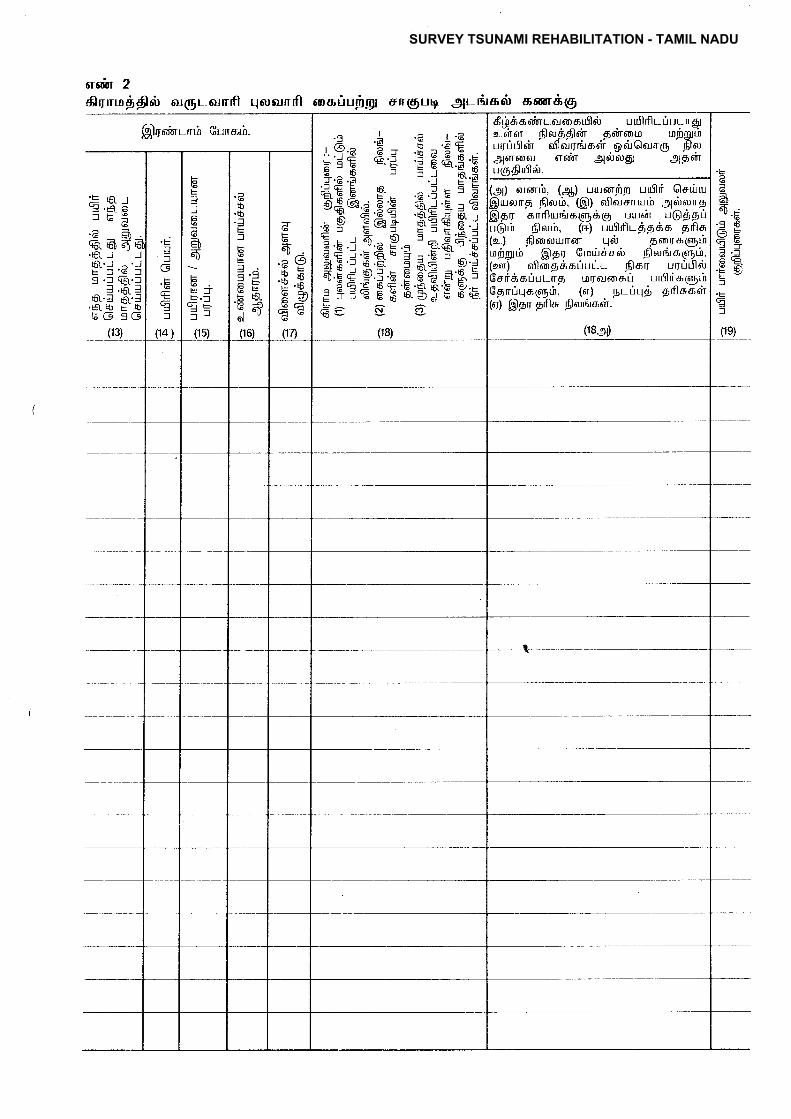
ilsfur 2dlrynLn$$ii eugreunfl qarrunrfl eooriu$gt 6n(gug g4r-fiodl omrdg
Slrirrnr*nLir GunoLb.
-b;l.d Elqfl6b46.6'r. -l -
-.Ja.t .lE l'6 f3.= q1'1_ l.6r-lbI.J En'l
'81 b;-bEG 3G
_ {!t_
.E
f
d..la-^bgaC;6
AEFX'.F Y/::
df d;oeurrrr.roouflrt uuflrflr*riuu n gtL6n 6lT tRl6U6grl60l 55'ft6Dt0 L0mmltn
urtiflri,r oflflirtniro6iT.gilGornqg 6tpe{6rT6o6u 6r6-dn g6u6ugl gip6n
'3 .l .a t'e, iq- 'H b 'EE.'.;'E Ea .rdGx;F5E {5r'd. .reer.1'59.*.$ = =._l pr.F
e€E s. .=.ieEF
3E*I A€ EE F *Ig.r r A,0- E;E€=a#'i'e € E'= ='E':' ^.8ai E'-l q'+
^3 dE *.8,';]EEEd*EF.RPb:: f =" € E n3;-E 6G1F+' O 6-EV
lf
I
F
€=:l
(14 )
F
l)
a'-u
+
GH
/1q\
.e
.b.flts
Ef
^- ti
.FS| -u
5'l
(16)_
11) cucnLb, (gq) uuemfp uuflri GleLlurueung flzurir,-(Sl; olorenu6 gqebsunp
)prl onrflumoqrydqg uurir u@ppn6dr 6lr,n, (m) uLLflrflL-$p&o prflo
(r) $lrozuu,rnor qefu pcofogibmpgdr $lgrl GLoui&ae! flzuruogLh,(oll) oflcogri'a'riuuL .6lsu urluLllzu
ori&ouui ng r-nqcrcoou uullri oqgLirGpnriqoqgLb. (n) ,ELUqp grflaaeh(fl 6tpr prflo flzuraroeh.
SURVEY TSUNAMI REHABILITATION - TAMIL NADU
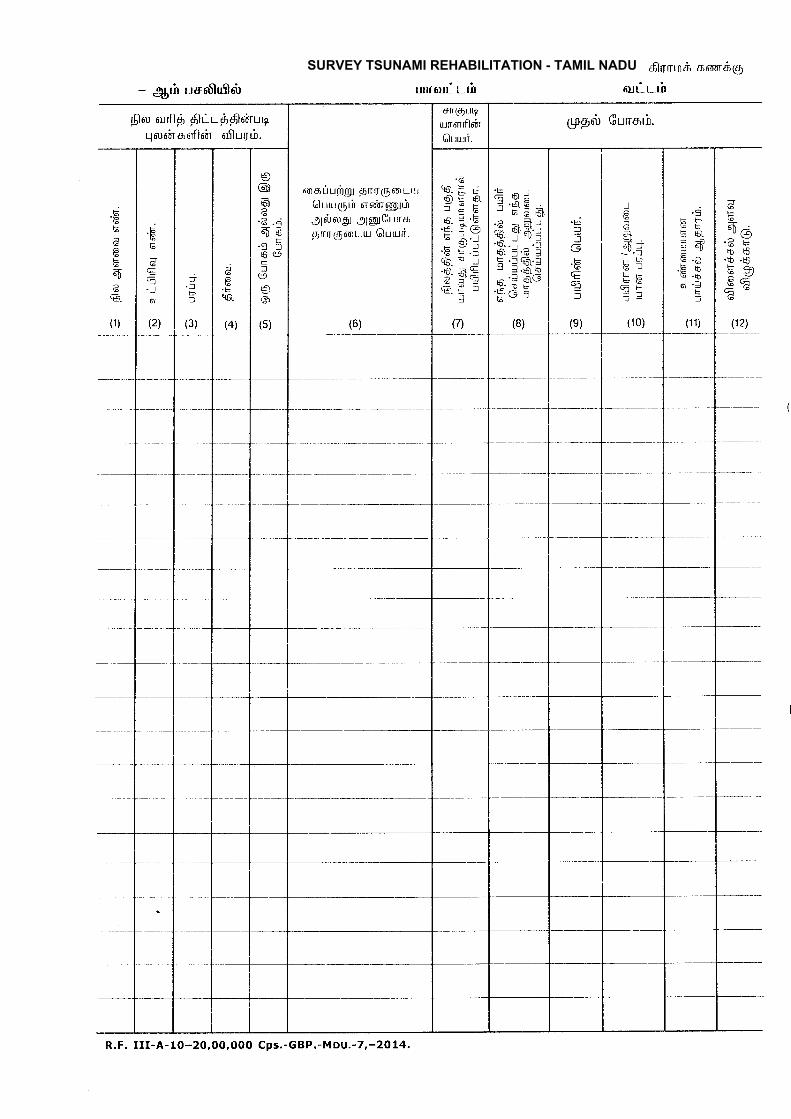
TOIT6ULLM
dlrynLot!; oeomti;qg
mrir-rb- grn r"rrnllufloir
@ou zurfl$ 6luL- $6leiruguzuoin o'orflein oflurrri.
gnpoil Grnorir.
;r
ffi'
-9srS
.t|l .tnFe"
(12)
EG
eG
4
EI
(1)
6d)titIUmml drflllrfl6OL.ll t
GluurqlLir ncdur@td)
.9l6ldugl glglGurra'tr)rrrJ (t6dl .u Clururi.
-EtaaAi'6 .acu"
G6 ou et.j'91 .J -'f- j'rFl tb
^': 6rG
(B)
.iff
€q=:l
{s)
I6
(10)
.=
.i -:
: -UE^F,i.Ea
:0'J;
(1 1)
.,
JE6
P^'a;e^
.E E'i; _-.rol
$,1, =
1€IE ll
0
R.F. III-A-10-20,00,000 Cps.-GBP.-MDU.-7,-2OL4.
SURVEY TSUNAMI REHABILITATION - TAMIL NADU
6r6mr 2dlryrLn$$0il nr1ryr.rurrfl qa:orrrrfl rurrlriLrli;.ry rrngug -g4r--rirofi CIrurrril1q
$)trrmL nr'n GunaLir
,Ee
f
E!
'tgrF
FN.E]. E
a.-- --614 qll
:l'G :.- Gr.-
!_Fl
.E)
d[..
.:o\1' .
;€L
:.b
=:(13)
.F 'G :.5: Q .E]'ECJ.bl:9a'f .-jE;!.E
= E 'o .-'F-' A- - {r.|c
E L '-:'i b/F
'5 € Fd'9 =^ id
ei" -* X:q c.i Ft -r\g= yL= v p ;
^ pJ :-^ dE'.:.d F .S Erq. - q)
€t" I _.8: ^.p-a q;G p)'=.3.e F H'i a'g 5q g'q'S 6r'E Fr.b€ 6 oLJ.; G bq='oo
.9I s/.t
J '6 .rc,l- -€.F €r,qr a i6E :2(A *.dD
E:{
e€:.EAa - QX; = (r)
tv
dL!6onirrrrrlco.lou9)ril uLrflrflL riuL-ng1s iht-n r[lzud-dlirirr ortrrnio r-orhrnribr rrTIrril5m olrfilfJmtrh6n .g)6ubt6ulr(rb Dp.o]l6ll6nol 616dn .9j5\J6Udrr .o)tdrfdlLl (q nrl tt'lI 6U.
.i==G
€(;=l
04)
l
IFF
a"
:t -'(1s)
")F.
'h.fEf
E
.E$'. sli
(16)
q) orenri':. (,96) Lruj',irrbm lrullri GlsrLrLurzuri 16 [)ourb. (61) nllolrorrLrrh 31r'irzung
6)p,l o,nrflrunio,qrytiq5 Lrurin uOppuLr@Lb ;5ieuri, (r+; rrulifLtiotio prflen(q-) rflo-osuLurrs'ar 116r-r prono,qgLbLnfrglrir (2)gr Gmur&aoi.r $orri.roqigLit,(Eq) ni.irrrpti,orirrr- Slou LrnrlLflri-rGori6trLiurrrs, Lnrtorornor'r uuflritnrorrbGpnriqu,gSrh, (er) purirLl$ prfltaorh
SURVEY TSUNAMI REHABILITATION - TAMIL NADU
MIT6ULLTO
dlrJnLn& ocrurBlg
euir-rb- grh ueaSluflrit
$|zu curfl$ $Lr$$lomugqzueiroorfl oir nflurrri.
grpet Gunorir.
a'^vb6
'tf',lA
;Jbe
(121
F
AE
=
CL
(1)
roariufrgt pnrI(g6oLurGluurnLir crarmeuorLb
gldir5ugt gqglGunopn6lgeoru Gluu-rri.
0E 6rIFEA 3.E.;i $.^-'- v
.b e =c\o I
.6I Rl!
9Jlr J:n
;6J
=.er€- Edd'G -6fsl T4--r
E '= Ct'-- i.6t!n'i 6t(.v^.oE'Et aE qG-'
(B)
.tsff
F
€f
(e)
I
(10)
.3FF
e 5h'6^.FpE.bd'l
E:l
(1 1)
R.F. III-A- 10*20,00,000 Cps.-GBP.-M DU.-7,-2OL4.
SURVEY TSUNAMI REHABILITATION - TAMIL NADU

FormiiL 1
Panchayat Union Panchavat Narnu
Enumeration cum Application Form
(Patta or clear title of huts and damagccl/'filecl houses/ Mangallore tilcd/ Acr
Shcct and othcr houscs)
I. Details
Name of the Beneficiary
S/o (or) W/o
lf Beneficiary is Malc, Namc of hiswifc
Ilabitation Namc
Namc of the Panchayat
Beneficiary Phot<> in lir<>nt of'thi: Ilxtistir-rg [[ousc(Merxi Sizc)
6 Cartegory(SC/ ST/MBC/ BC/ OC)
l
Door number and Addrcss
of
ENUMERATION CUM APPLICATION FORM DAMAGED HOUSE - TAMIL NADU

iramily cardlVoter Id/MGNtitr(]S .Job cardNo.If Beneficiary is belorv Ptlverty Linc ? Ycs/No
II. Details
Classification of Land
2 Patta No
aJ
A+ Extent of the Land (Sq. ft)
Title's of the LandOwn land I Un divided Landllf not zr Oln'nland Specify the Relationship o1'thart Land
III. Status of the Existing House
8
I
t_
fI
I
Survcy No
illlr.ltlllrttlilii
)vc arc crlrrc<:l :rnd truc. Othcrmr family mt'mbt'rs arrd mvsclft this is cr-rlrrncrzrtion onl.t'. F-orurance lbr sanclioriing of- housc.sh my housc ernd construct Lhc
Signaturc of the Bcncficiar.y i
l
Signz.it.un: o1' thc VAo
brLt
lilSS
rli
t--lI lluts/ Tilcd house / Mangalorc Tik:rl Iloursc/
I t ] nc Shect in damaged and Dilapidi,rtcd
I I condition/ Specify the other type of'houses.
l_,I
I I dcclared that thc Particulars mcntioncd as ab,than the housc photo arl-fixcd in lhi: form:rt thetthave not any permanent house . I also l<norn' thz:
] filling up this application i knorv it is nol an itss
I If houses arc sanctioncd to mc i agrcc to dcmol
I
sarnc.
I
I
I Recomcndation of thc VAO
l
I
ENUMERATION CUM APPLICATION FORM DAMAGED HOUSE - TAMIL NADU

APPENDIX ''C''(coMPREHENSIVE INSPECTION FORM)
CHECK LIST FOR INSPECTION REPORT:
1. GENERAL:
1.1 Name of bridge / No' of the bridge. Name or the
river.
1.2 Name No. of Highway, Bridge Location.
2, TYPE OF BRIDGE:
Hige level / SubmersibleHigh level / Submersible.
3 (A) Date of last such insPection :
by :'
(B) Date of last routine inspection
Dy
(C) Traffic intensity PCU / T per day(The latest census ).
4. APPROACHES:
4.1 Condition of PaYement sudace :
( RePort unevenness. settlement'cracking. Pot holes, etc.)
4.2 Side slopes (report pitched or unpitched
condition of pitching / turf ing any signs of
sloPe failure, etc.)
4.9 Rasion of embankment by rain cuts or any
other damage to embankment- :
4.4 Approach slab (report settlement, crecksmovement. etc .) :
4.5 Approach geometrics (report whether it
satisfied the standard as in force.).
4.6 Accumulation of silt and debris on
submersilble approaches in cutting &
embankment.
COMPREHENSIVE ASSESSMENT REPORTING - MAHARASHTRA

5.
q1
(2)
PROTECT]VE WORKS :
Type (mention whether guidebund ofprotection around abutments or spures.) :
Report damage of the layout, cross section,profile ( checks whether the layout and thegeneral cross section are in order.)
Report condition of slope pitching, apronand toe walls indicating the nature ofdamage if any (check for proper slope,thickness, pitching in the slopes, width anothickness of apron, erosion of toe walls etc)
Report condition of floor protection worKs ,
indicate nature of damage if any, (condi_tion of impervious floor, flexible apron,curtain walls, etc).
Report any abnormal scou r noticed .:
Reserve stone material (check againstspecicfied quantity.) :
WATERWAY:
Report presenceundergrowth, etc) :
of obstruction,
Report any abnormal change in flowpatte rn.
Report maximum flood level observeoduring the year and mark the same on tnepier/abutment both on the U/s & D/S.
Report abnormal afflux il anv :
Report.adequancy of waterway. :
FOUNDATIONS:
Report settlement shifting (of wells) if any)
Report cracking, disintegration decay,erosion, cavitation, etc.
Report damage due to impact of floatingbodies, boulders etc:
5.2
5.3.
5.4
5.5.
5.6
5.
6.1
6.2
6.3
6"4
6.5
7.
'7 1
7.2
t.5
COMPREHENSIVE ASSESSMENT REPORTING - MAHARASHTRA

7.4
8.
6. I
8.4.
8.5
4.2.
8.3
(3)
For Sub-ways Report see-page, if any,damage to the foundations etc.
SUBSTRUCTURES:
(piers, abutments, return walls, andwing walls) :
Report efficiency of drainage of the back-fill behind abutments. (Check functioningof weep holes evidence of moisture onabutment faces, etc. )
Report cracking, disintegration decay etc.
For sub-ways Report condition of sideretaining walls, like cracking, disintegra-tion, etc and see-page, if any. curtain walls, etc).
8.6
9.
9.1
Report large excavations done in the roadbelow in case of flyover or road over bridgeor viaduct.
Report dmamages to protective measuresto piers and abutments (for viaductsflyovers and R. O. BS) :
Report damages to protective coatingor paint.
BEARINGS:
Metallic bearings ( state types sliding plate /Rockers / Roller )
9.1.1 Report General condition (check resting,cleanliness, ceasing of plates, slitingaccummulation of direct case of submerssible bridqes.)
9.1 .2 * Functioning (Report exessive movement,titling, jumping off-guides. )
9.1.3 Greasing / oil bath (Report date of lastgreasing / oil bath and whether to beredone or not)
9.1 .4 Report effectiveness of anchor bolts (checkwhether they are in position and tight)
9.2 Elastomeric bearings (State No.)
COMPREHENSIVE ASSESSMENT REPORTING - MAHARASHTRA

L2.1
9.2.2
9.3.
9.3.'l
(4)Report condition of pads (oxidentiorr, creepflattening, bulging, sptitting.)
Report general cieanliness.
Concerte bearings.
Report any signs of distress (cracking,spalling, disintegration staining etcj
Report any excessive titling.
Report loss of shape.
Report general clealrness
Report cracks if an(abutment
""ol I !,;":t;t'"8"T:T,t":;
SUPERSTRUCTURE :
Reinforced concrete and prestressedconcerte memebers.
R"p:ft spatiing, disintegration or honeyl,oTO.,nn,. etc (special attention to O"glven to points of bearings.)
Y.3.2
9.3.3
QEA
9.4
10.
10.1
10.1 1
1o'1 .2 Report cracking, (pattern, tocatjonexptain preferabls by plotting on sketch.A map of the ciacking should beproduced. The size and iistrioution ofcracks and their penertation should benoted.)
10. '1 .3 Report availablereinforcement (ro be noted.)
cover thickness to theExposed reinforcenrent
14.1 .4
10. 1.5
Report wear of deck surface
l^.lgt, scaling (this is graduat andcontinuous loss of surfacJ n-rortor Indaggregate over irregular areas.)
Report surface stains and rust stains withlocations.10.1.6
COMPREHENSIVE ASSESSMENT REPORTING - MAHARASHTRA

1O.1 .7 Report Leachingusefually evident
(5)
(effects are moston the soffits of decks.)
10.1 .8
1 0.1 .9.
10.'1 .10
Report corrosion of reinforcementsif any.
Report leakage (leakage of water cantake place throughy concrete decks,constructlon joints or thin componentsections of the deck e.g. at kerbs etc.)
Report damages if any due to movingvehicles.
10
10
10.1.1 1 Report condition of articuliation (cracksif any)
1O.1 .12 Report perceptible vibration if any.
10.1.13 Report excessive deffections (sag)or loss of carnber if any (measure atsame point each time.)
1.14 Report cracks if any in end anchoragezona far nrpstessed COncrete membef.
1.15 Reporl excessive deffection (sag) atcentral hinge, tip of cantilever forcantilever bridges.
10.1.15 Prestressed concrete bridges shouldbe given special attention and thepossibility <lf the following additionaldefects should be noted. )
a) Longitudinal cracks in the flanges
Spalling or cracking on concretenear curved cabie ducts.
Slrearr cracks in webs nearer tosupports.
1.17 In box girders, the interior faces off langes and webs need to be examinedfor sir-rgs of cracking and also io ensurethat no excessive accumulation ofwater or debris is taking place forSubmerssible bridges. Interior diaphragmswill also require examination, particularly for anysigns of cracking at their junction to the webs.
b)
c)
10
COMPREHENSIVE ASSESSMENT REPORTING - MAHARASHTRA

(6).1
0..1 .18 Report accumulation of slit and debrison surJace of deck ( for submerssiblebridge).
1O.1 .19 Report peeling off of protective coat orpatnt.
10.2 Steel Members.
1O.2.1 Report condition of protective sysrem
1O.2.2 Report corrosion if any.
1O.2.3 Report excessive viberations, if any
10.2.4 Report of Alignment & Members
10.2.5 Report condition of connection(adequacy, lossenr:ss of rivets, bolts orworn out welds, Report specially onconnection of stringers to cross girders,to main girders, gussetsor splices, condition of hingessplices etc.)
1O.2.6 Report excessive loss of camber andexcessive deffections and deformationsif any.
1O.2.7 Report buckling, kinking, warping andwavtness.
1O.2.8 Report on the cleaniess of memberand joints ( check chocking of drain_age holes provided in the bottombooms)
1O.2.9 Report f racture apparent if any.
10.2..1 O Report excessive wear (such as inpins injoints of truss ) and theirlocations requiring close monitoring.
1O.2.11 Report.conditions in side the cioseomember.
1O^3 Masonry arches.
r\ii$?r:fry
COMPREHENSIVE ASSESSMENT REPORTING - MAHARASHTRA

a)
1C.3.1 Report condition of joints-mortorpointing, masonrY, etc.
'I 0.3.2 Prof ile report (f lattening by observingrise of the arch at centre and quarterpoints.
10.3.3 Report cracks if any (indicate location,pattern, extent, dePth exPlain bY
sketches)
10.3.4 Check drainage of spandrel f illings(report bulging of sPandrel wallsif anY)
10.3.5 Check growth of vegetation.
10.3.6
10.3.7
Cast iron and wrought iron
These materials occur i:r cllder bridgesand the defects which they exibit arein general very similar to those described above for steel, it shouid berec6gnised that the homogeneity andpurity of the material will not be up tothe standards of presents day steelsso that the inspection process has totake into account a range oi materialvariability. Below holes and crackingare probably the main deiects thatoccLlr, the casting of the metal andcooling.
EXPANSION JOINTS :
Fuctioning (report cracks in deck inthe existing gap and aPProximatetemperatures)
Report condition of sealing material (for
neoprene sealing material, check forsplitting oxidation, creep, flattening,bulking and for bitumen filler, check{or hardening, cracking, etc.)
Report secureness of the joints.
Top sliding plate (Report corrosiondamage to welds, etc.)
Locking oi joints (report locking ofjoints especially tor f inger tyPeexpansion joints.)
11.
11.1
11.2
11.3
114
'1 1.5
COMPREHENSIVE ASSESSMENT REPORTING - MAHARASHTRA
1 1.6 Check for debris in open loinis. (B)
11.7 Report rattling, if any.
1 1.8 Report drainage improvements forexpansion joints needed, if any.
12. WEARING COAT
12.1 Report surface condition ( cracks,spalling, disintegration, pot holes, erc,1
12.2 Report evidence of wear ( tell taie ringscheck for thickness as against actuallythickness, report date of last inspection )
12.3 Compare actual thickness with cJesignthickness.
13. DRAINAGE SPOUTS ANDVENTHOLES.
1 3.'1 Check clogging, deterioration anddamage, if any.
13.2 Check the projection of the spour onthe underside (see whether structuralmembers are being effected.)
13.3 Report adquacy, thereof.
13.4 For sup-ways report about adequcyof Drainage and pumpingarrangements etc.
13.5 For submersiable bridge, report onfunctioning.
14 HANDRAILS PARAPET ETC.
14.'l Report general condition (checkexpansion gaps, missing parts, ifany, etc.)
14.2 Report damage due to collision.
COMPREHENSIVE ASSESSMENT REPORTING - MAHARASHTRA

(e)
14.9 Check alignment ( Report any abrupt ness
in Profiles.)
15. FOOT- PATHS
15.1 Report general condition (damage
due to mounting of vehicles')
15.2 Report missing footpath slabs'
( 16. UTILITIES
16.1 Report Leakage ofwaterand sewagepipqs.
16.2 Report any dmage by telephone and
electric cables.
16.3 Report condition ol lighting facilities'
16.4 Report damages due to any otlrerutilites.
( tz. BRIDGE NI"JMBER:
17.1 Report condition oi pairlting.
18. AESTAHETICS:
18.1 Report any visual intrustion (bill
boards, paints on structural members,
etc.
.1 9. Report whether all actions for main
tenance and rePairs recommendedduring last inspections have been done
or not (give details).
COMPREHENSIVE ASSESSMENT REPORTING - MAHARASHTRA

(10)
20. Maintenance and improvement recommendations.
Sr ltem needing attention Action Time whenNo. - to be RemarksRecommended comptetecj
21 . Certificate to be accorded by the Inspection Officier
Certified that I have personally Inspecged this bridoe
Date:Signature Name & Designation
of the Inspecting Officer
Duration of Inspection :
From
toAMiPM
Method of Inspection
Note : ltems marked need not be filled up for Minor bridoe.
COMPREHENSIVE ASSESSMENT REPORTING - MAHARASHTRA

APPENDIX F'
INSPECTION OF ROADS BRIDGES AND CULVERTS
A) Name of the f-lighway (B) Culvert/ Bridge Location
KM No.
C) Name of the Bridge / No. SUB KM No. ................
of culvert.
D) Name of River /Nalla /Creek
E) Type of Bridge Pipes / R. C.C. SIab iR. C. C. beam & deck slab / R. C. C.
Boxes / PSC Beams and
slab /PSC Box / Arch
Concrete Structural Steel
M.t""ty
Trus/Plate g irder/R. S.J.S.
F) Openings
i) Number
ii) Span/diameter
iii) Maximum height of road level above bed
iv) Verticai Clearance above H.F.L.
upto soffit M.
Height of H.F.L. above road level
M.
(for Submersible bridge
v) Design Road discharge
Design H. F. L.
vi) Tupe of foundation open/rafVwells/pipes
Vii) Totallength M
Viii) Clear road width between kerbs
or wheel guards.
ix) Exposure Servere/Moderate
x) High Level/Submersible
xi) Design Live Load
S) Year of Consturction
h) Original Cost
M.
Cu. Mtrs
M
COMPREHENSIVE ASSESSMENT REPORTING - MAHARASHTRA

anoSignature
of lnsPectingOfficer.
Date ofCompletionof Proposeo
RePairs
lnspection Defectand ProPose
remedial measures
Designation ofInspecting
Otf icer
COMPREHENSIVE ASSESSMENT REPORTING - MAHARASHTRA
ff. Lr L€ticL t
hn*,*..r.-
-.r .;., -i
/("q..,zlza^J^-t-*s I
t14
, , tr)*'Iu iYj:' t'''r.-1PJ''
I l'/'
| $'" til
:\"t3 :.- lt :
keo1"iiuktgt{l.r{e srrtr0rl.\(
. :\1.t :_ 3t:
*h@ *. q{q uutrl (qg'{.u't qr.f'o tterc i r{a gsur't -0 dadc E*n ,{l uf&' e.tqi vt*.rit' """".""..--......r.\s{l il. ..-----^-- :rrllJl urt)Jt ,)
:\"t3 :3 :
ctl.-.............. r0 ct- \:;.,rr
!,tt .ir!!e
. l': ' r'\/.--,|r'r' ..\,t"
\_i.,* ' \,"', l.i - \ /,.- ,,i_.!
\\
1,"' . \r'.\''rr1" I
,"k'.*;\'v'"
l'.\llt,
j
"jI.'
4
..))
l,'-
4
(
)
'v
-f
'-r'|
(.'.:l
stteqtqggxd8l
r '"/ \/f,,/ \
\y', , ^t',';!' .l,i\.li i.,tt
\/ '' v\
' 7'. ,t \il)
ANIMAL HUSBANDRY - GUJARAT
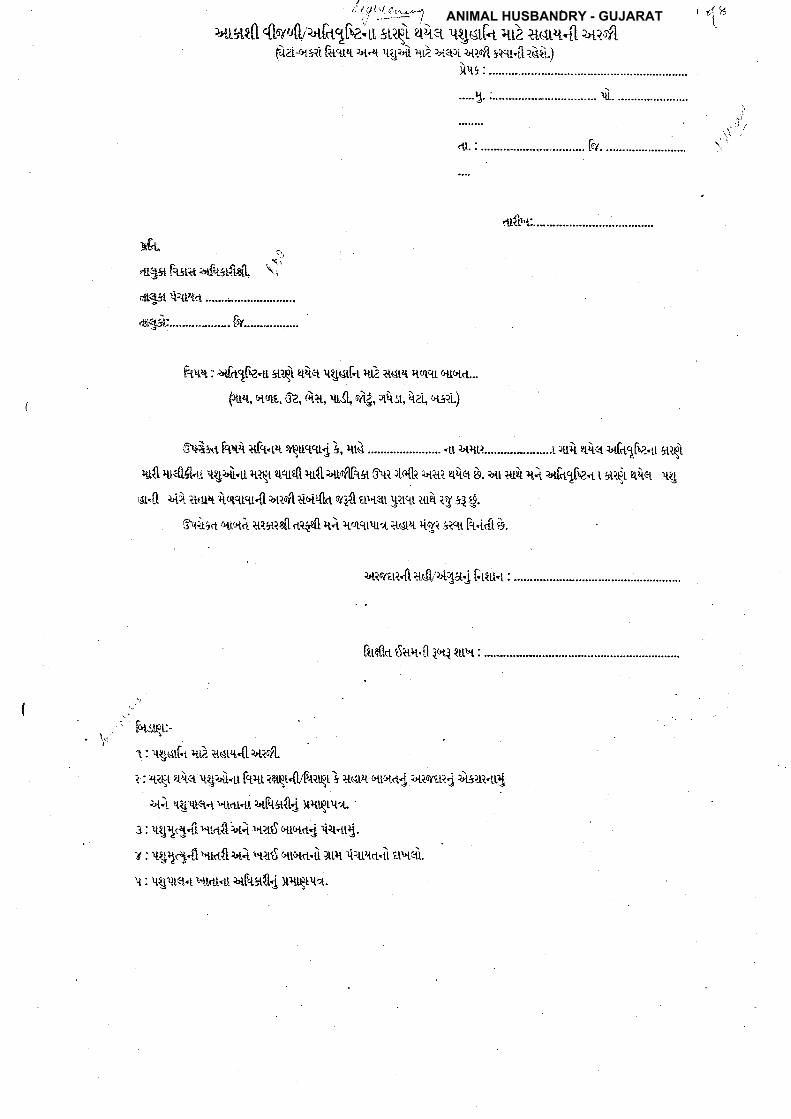
1'.1'-11,o-1
,"n$tft.{luvufl'uft1trzrr snq) u{e ugurk ANIMAL HUSBANDRYANIMAL HUSBANDRYqr} ilsrr.il ui.oflf)at-ant fu'tt't t*.q.,rgtai r.Li- '4etq
r4r.oll riu.{tl&t-t.})tit' :
ctl. : ...............,..........-..-.. [ol.
,tt{l*s:..
Std" i.,
,ug${E*{aa{fu3#td| ll'rttE*t t:Utrt ar..r.;,,....a,.,.-..----.,
*,+giu. ---. .....-. {iv.......-.........
ku-t:.tlo.1$z"u 5tt-$ ttcr ugtlh rtti +tttt+ rtutlt.,4totd...
{tuq qqq sa A+l urJl orig, rtiriL q.zi, nn{)
gn{*$ut [\or4 +rhq,i orqur.u{ }, qG ........... 4r r,tu.r-....-..---.........r.ut q{e r*h1F,-u gRq'i
ru{i.u{l$Lu orgrxi+r rtqr u'+rrll u{l auolf.ta 0\r {a{h qal q{e &. au iu& r+ arh1fu.t untr uLe ug
,14 ,,ii i{{ilt 'ir{qr1t.fl urofl::i',ir{lA or1{ al+<t -ut,rt
+ui. tE 5i €.
€\i.i* atqi ilralsil'ti6l] ti t.lqtutr. atut,+ riEi si.tt F-r"i,{[t].
qio*.1r.{i atfuaii3ai Ftrn t :
&Lc0c daq.it iori rur'r :
i 4'.8\
,tt'.
'-\'l
.,..' florsqu-tr
1: r{1trt&t {D a$rt4}tiutl
? : '{?qt a{er orga&+r &.+tt iaqr.&Ptrryr i ltdFr. etecij, r*loytn{ air--.n.*r.j
ui.,rg'.**t.t .unr<i uFrn{lj xrtrtrqi-'
: : ,l.g1.g.ii.u+i[;rri "ttnl rur+cr{, {l.tt{.
v : ugriar,.{l'*rr,r{tqi "rutl qtora+i atq riqnoql rLq':ri"
q : qgqF{4 1"ilrt[4! uF.{.tr{Li xqt$\rr.
ANIMAL HUSBANDRY - GUJARAT

Page 2 of 8
uradl.{loruffir*ktrk{r rLlq'i qq.e qgoLk qD uur4.ii ulo/l4i {1.4i.
cr{I.'r:
iE4:
r ursr"ai{ +rt: s{L
Fr.ur.qFr{ +ir
.:. u[.t1Fa.n ary u{ei uguf+4 R+a (tia ,tg.{t hld e't'drt oqtn$:- y'n ,, u.itun
\, ]\li,
'l
P'- tvr/'
.\: i .--\j' f -!,'" .r)'- .,'1
,ij' l"
q.r?r 6\i.rd rrgdi*r rttqr 4di ltt{l4rotlRJrA u!qo/ l,tut r E{{l iti5tr8fl d?d{l t4qt i{t,t gt-?dl ?4t
,{..{i?,i)r4acr4 rigr. 3r..tt&.idl&.utrttlqtrttd rrgd4r'udldEtqtqt qi f.tqtr,ii.ttovl{l a,*<t rit?R4tql/q.l4litt ?g 5i q.
&.ilqqi $ t\rrj E i "u I'noftrrl oWrAq ugdar 1utdl Lutcictt qtt h.qt+ uit g{tt"rt q.q i'J tt"L "tt
qD zrri $.4 +{id4$'.'tt {1l,u*'t €.
r'ttezn.{lak
Y. ldqtj4t qqto{t i3{sl. ),ti. laitr Cu<dlRr,t :
tlt 1c,rg.{l&.Lc
qr.q[.t[ tctrtdr1.rie+r fuaqdl{Lt
,tt{I.'r ltry{ t{tut
1
1
x
Lt
ANIMAL HUSBANDRY - GUJARAT

Page 3 of8
r,t$lfl.-{ls/4n{h1fv-{r rt).\i tLqL eriq.qg?'r'i.tr Ft}u iaqr4'F{rqL i acL,{.0 +qraar qLqd.j a+,li4rt.
u{i{ {l ..i.a....r...,,..r,..
.3ei ................................F/ccir upnirr iir{stis ry\t8 g i, ufr..1[v-+t iLtqi r*r artdl *r:.dlqi etftqr
36rot4t rnitgcr . Ltg.p rtqt et{e d. }tt q?qt ',iit{orrqr d qtt uqtt.tedlrjili aL{i.'t ...,.".........,
{t 1lor *q &. :+iofb* \r4ct q?Qr. El€tlpj.,il<r i.'+&.Lrr,r tiiqii 1u hqi cftQe {r{ldrt1 btffftqt r/.
$Eetg€t
ii+qrqi &lqr i tdt4 tq'iq -i{- d4 g '.'tt{l r{t! q! ui I'u dr{i.tt\tdl O,{iiEa hrraL u,..r u--r't1, au{l $ +t
iiz,$; ++{ta{t HtJt ri €.
1r
*o'f''r/,'..,'f "
,j
|J'
r,i; i
t{lot:-
ru{'r-
iEQ:
r,t,ul".p4 a&i,-laj FLtu-r
Rr{Lt d{r{4lql fl.rr'r :
rtilArq {dl .
u?qrr 9ttt ..irrr4c/1dhzr-Lrs{l
.r./Iulr qr$4d. ,{,,..V,n,.
$. .................
3. ....-...............
srq.q q{'tui{ h+rt
]Jri0/€r?r[1..............
w3ri................................h(<{ -.............{ie*loflqi rrti+t 3urot+t id.trgct rti}.it lti
gr r{e eo. u rnqr qi4qnqr:urr+.r'.ndlr{R .rt{l"t ...-........ .tt ior sie'}. uroflru *qrA+ ,tqr \
uLet ugd<t iairi ".tB.ttc tiilqi i g.rt f.ttti <{lirct +8[t drtt r,tio/tq't o4LAet gcr rnqr uL'+
'rg.,i t{tri$qqr qg ,rD i.,i',i uu.u i.ui.1gt"r.u +ro,-ri qr{ *\.JWr ,i: i{Lqn.Jld.i {lruqi &riqr i +rer+.
iq4e -t{L d{ ut itttqrua r,uqctlql r,tA &.
iqut:-
atftt-
\J$r ',r-f \r'-t.' ,J i:
tg fa&.at uF-ut{L
ug h[rc+uet.arg.:'i: ....,................... l"/
",l.tt,'*
"r'r\
t l'"
ANIMAL HUSBANDRY - GUJARAT

Page 4 of8
,..w^ 1 \r'f_it
" ^ t")''"iw'
tE,4:-...........".
dr{b'r: ...........
r*rdl:,rqi -{lt ildl n ur ]rqliri ai{t$r r'ta1 aur$ rqu.$r'i rJt'} i uft1tvr{l r{et lg'-+L[i.{ '+..r
rii{ t{tq.f{t
"""*,9*i ... Grcqi"......".".4r ?&t &. a*prai iq4 b{irfhi ErAq.* 4[ tr$dt$r "... rrgail+ qier.il&a.u rqu,{ld i 111.{ls'i rrdqrCl ri.ttql i,tr{<r t} u,i. i,{.t"r"
'r*E,+{+t 1.riu.ir ruftt............ + ijtr............ .......... fla hact rilrqi ul.qq " *"{lcqr atiofl.ftR'rci4qt ,i* a}rrdb{i l,ridi"f{ &q.r]'4 aet ui.tt.{iqrdl u..{lai dla,i sqr Qrort
.+ qtk.ft r,rufl o/Nt trr/,r .'t{i & q+qt &. ai a* qfi{r{l t'iill 6?t't a} otndi,{ $ora{l tuir4 rcrrr to/,r u*il urqrq
rrt Ji{ *dt qq}+,'tqr &.
{{}ti:
, .,Itl j,J'l-|t"' !:'t'/'
'1.,t'
r^f\y'\,- ,ir
.te#lrq {dlilt {q[{ct.
ili{r{ rtpt 1i"*ttclic1dhe€Rsil
u
ANIMAL HUSBANDRY - GUJARAT
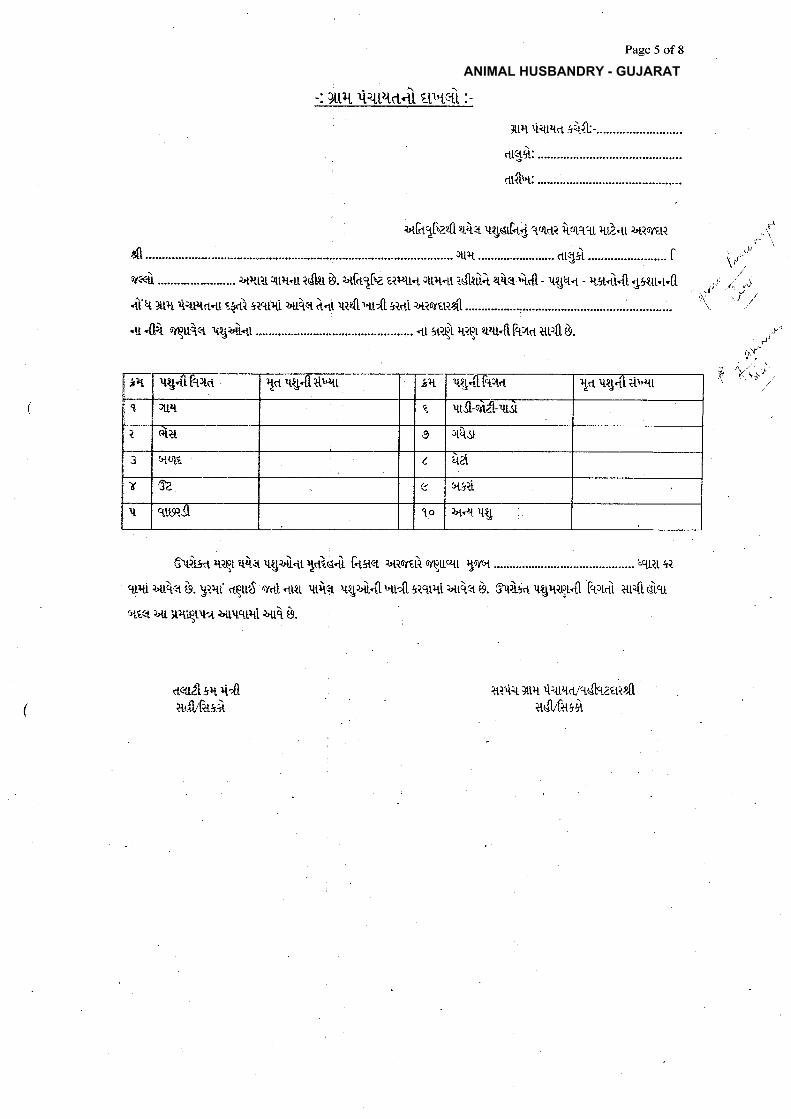
Page 5 of8
.\\-: )ttlt ltEt4d-LL tf'tctl :-
ltq tr.[4cr si{L -............
dtgs'i: .....'.....
rtt{tru ...........
uGtl$zr{l u4e i{U$hd '{'4rri i.urct'{r rrD+ i*iEal ..,",- \,
sr({i ."...-"*.... ltqt{ rt[q4t r&r &. ufit 1tv zr]4r4 r[]r4t r&ri;t q{e Q.{l - rgat - qst d.{l gtu.t+1l ,,, ."' "j',J /
ei''{ }tlt 4*+a.u ryti r?.rtqi 4{€r i.+t qir{l "ttdl lrcti r+iovara[l .-.................. ",. ] /
"u.{Ii.t equt< rgafitt ..,.. 41 lrr.q'i. qier sru4ftqd ltri{l&.
}E qg"ittqrt{r td qrl.it+tLtr ,}t l{e.I.{t tl3tft lct ql}it {lqtq Ittq qrst-6n2[-qrjr
t ni?t a It.isl.
.J {rtut€ C aet
T t3/- 0t3?i
1 qrrj?$ 1o 1"1-4 liti
fi'.lfrrd itqt EAet ugai.u 1.ti.u.ri f.rELet ,,tiortti rr\11a{ Srru{ .qrit 5i
qrqiluir,:r&.-urru d\nS c/di4m {qqt rrgl,it.{lr'u43?<irrt1utq.r1&.Ot{rjl.rrrlJrilQr.r1 Fr.r.ii ar"0u'[..tt
r4rq r,u ]rqtRt\?. utqqtqi r,uq &.
,J'
J,U'i"
,f F i-|', ..
*cil.ltsq {{la&hrri
ii?1i4 qtq titLLrtU.rdtqZlf S{l
u&'fariL
ANIMAL HUSBANDRY - GUJARAT

utr{i itqN{l+ ll.*}ri }il{ Br i, r*iorrti :0
ruq .-............-,........ arg$ .... Fre<ri r.ry-go.rdur.elb{ $cq.t rierg<t
ugui+r rtlqr rr,u4 ltrrei ar.{l ,.r}.rt4 "udt si'11+ri r*Ae &.
O,riis.t qgrtiEt c*ei otg €citltt4ti irtuft* ,tg 1t?c{t?i.l}.ttftt............ .......... .* iior
zqt it'+rti qr{(r d}.
ql}rriql .............;.........!............................. 4t gl$ar rrte &.
. irrr\11l,[{'{i+a{i,{3x4e1&.I r,[ qgra1d ltiZ nii!*t Sl'1{e {s{1, ,ir+.tLqt r{i. ;LLrriiqL,rd.u rrqcrr.fl hrr.[ CUtd] qgtqrdl',tLdl e,ii
,,tt lttcit l,4t{.ttti :,UE(f '}.
Page6ofs
"d\-:-y$rdt.{1ry{rfl1uft.l8z4L ELlgr qle -.{gr,rLk i,iiL qrjqiql.{l,,xrdl r,iir ,' N'2' t
i\
uil hfrrat,+hs(L\tj &.[5r+tq4
'tgr): ......."............... F/
trlut :-
cL{lq-
tlt qtl.t[l'.{3tct1+ ug.iti{t"u t.t ug.[tt't+it r1c lg.i[{t"rt
1 l[tt qrs[-o4.ZL-qrst
?. nt+t I Ltlst
('tutt tf,zl
'{ vz ,e qs{
q '-tts?Jt 1o t*-4 \U
ANIMAL HUSBANDRY - GUJARAT
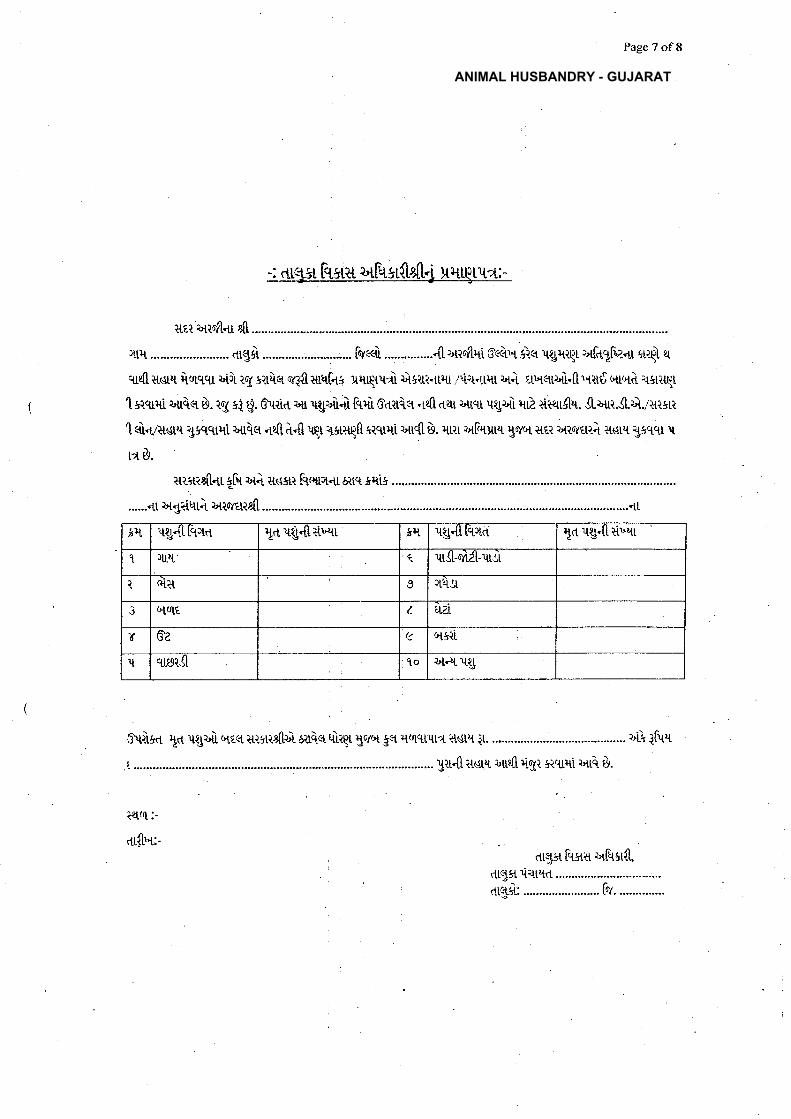
Fage 7 of 8
w? r{ion4r s{l .".........
qrrr........................ .ngi .-..---."-*--:...... h<il ...,.-........4brio/lqt S(+"r:ie ugrriqr'*l.t1Fa+r grq) u
u{l rur4 {q.t.rt ldi ig 5r4er eq{l ut{hl xuqrllaj af tti-ttru ,,iiq{ru qi itl{eri,i.ft.'ia'J ouqi" lr5rilqr
t Es.uxri qAq E. iE 3i g. fftl.t ui ugd+) [,tti O.txiq 4d[.t?n urtt ugai qD ?iiqL1l4, Jlr,ul.JLri.i+ti*Lr
'l <{.tlnsn gsqqr{i +uQcr +dt i4 uqr 1sraryft *.trqi r'tr,{i'}. rrn r*&urLt 30r't nr,? urnvr.ui ittttrr gs'{cu ..t
ra &.
uiarsil+r $.t ui iru$r &er{+6tqrq'13
......<r ugiitui uror€lrs0
Oqrlsd 1.t ugai qr.e il$tirihi arr4q qiiqr 36tr'r. gei !'LutcLl.qt" ?tdtrt iL. t D i[u'{
t...................
rEUt:-
aL{L'"u- ,tgst F..,ra uR*ril
. .ttlrrt riutc -....--i...
,tti: ............ f0/...............
hrtu
t11. ,rg.tttttr 1* ir$.itt{"tr ,4, i{!}.{L Lctita td't{g-{,|{blatq Itt4 I u.st-onzt-1tt3t
0it I :rilJ &trrtf ( ,*ZL
r Ag/, (a qs{
{ .tttq3[ rto 1,t.4 qt,
ANIMAL HUSBANDRY - GUJARAT
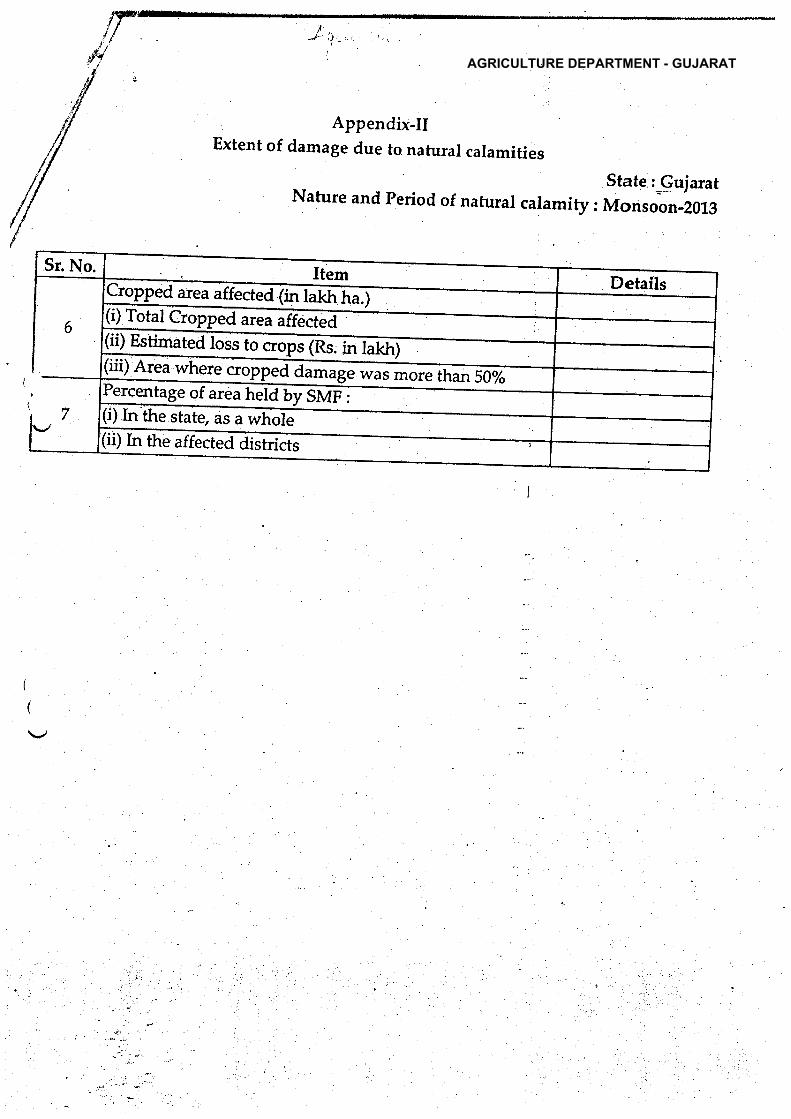
(
Appendix-IlExtent of damage due to nafural calamities
State:SujaratNature and period of natural caramity : Monrolo-iorg
ctoppeqareair@Qfrolulc'op@(ii) Estimated IoS
(iii)'Area -ercentage of area held by SVrFI
(i) In the staie, as;ffile(ii) In the affect"a affi
AGRICULTURE DEPARTMENT - GUJARAT
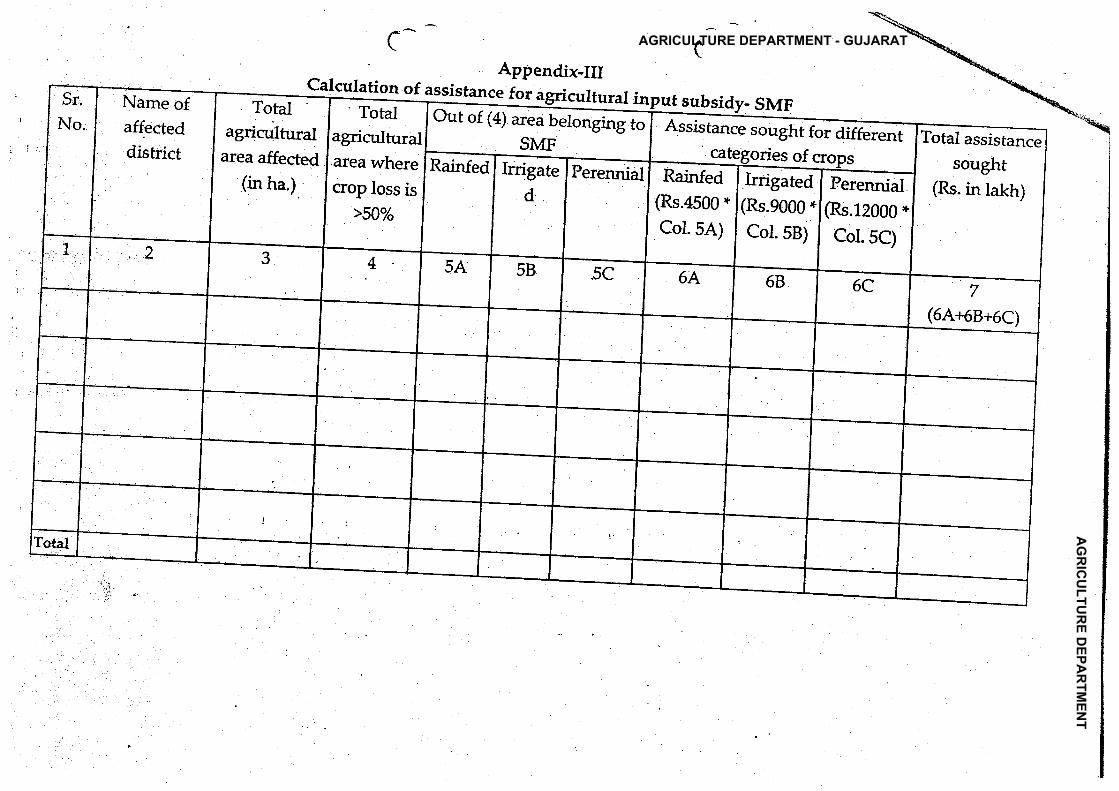
.F4
tqra\<rE
6*r5.gg5
*UEt
tisp$3trl
slol3l(rlbltrlol(!t
EI
dlU
I
(
AG
RIC
ULTU
RE D
EPAR
TMEN
TAGRICULTURE DEPARTMENT - GUJARAT

8-a-6 F
{?^-S,r fi t;
(€g
.',:
f:i.i5;
qoE(t(!II8II,6il6tt:int'
6|,Gatnloo0,UntoU(,!!oo.3}\6E
o;stPxr!(t;9p'E
.bdt ,oeoo5.9,-
rJ\<
ofr.1(!-
b$n'6oor.!t E{,qF
Os.xE
qe.. 6.an'
>:
.i
I'e .
.|!l
&
tl(Do
c>j:3tH
n6 3.'Eer.gH
E 8
EE
tst.ozeE
r $sxho 'F
(,lJ
|r(nGooIc6IX!q,AA
t-, AGRICULTURE DEPARTMENT - GUJARAT
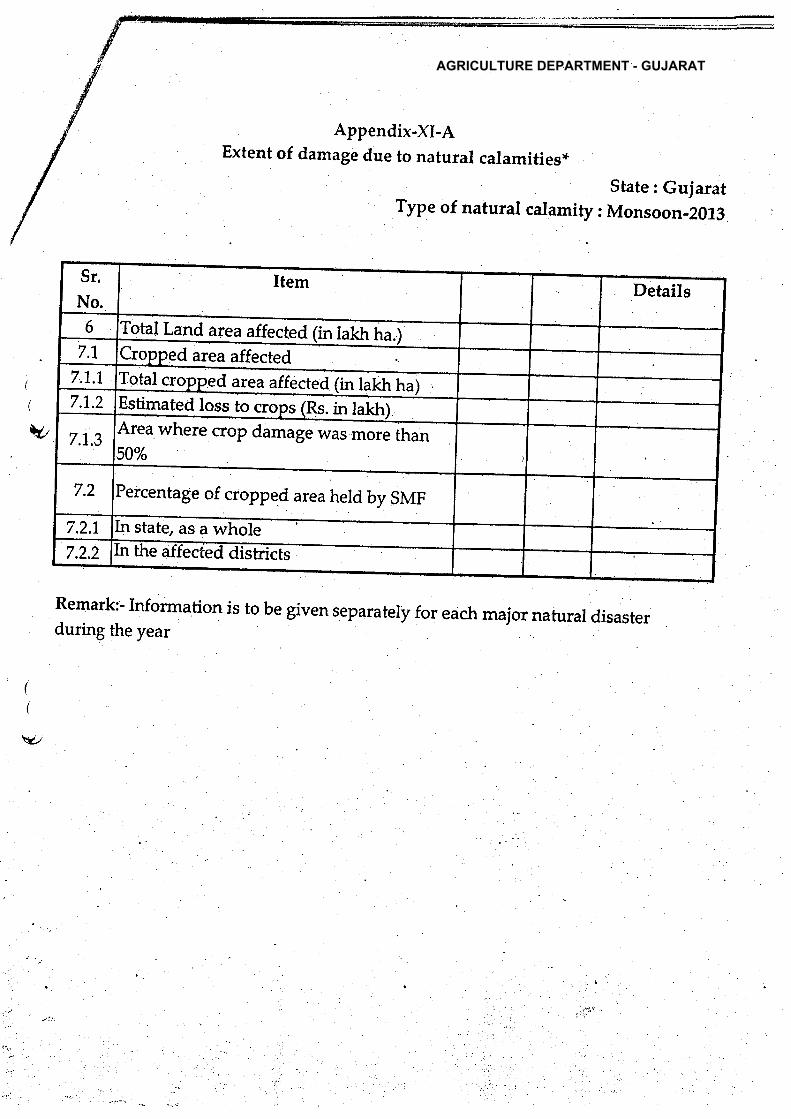
Appendix-XI-AExtent of damage due to natural calamities*
ryp e or naturar caramity, ril:fi :J'rXll
'otal Land area affected (in lakh-ha.area affected
area affected lakh ha)nsqmated lgss to ctops Bi. inG6Area where crop damage was more than50%
Percentage of cropped area held by SMF
In state, as a whole
(
(
V/
Remark:- Information is to be given separatel y foreach major natural disasterduring the year
' ..:...:
''..
.I!:',
AGRICULTURE DEPARTMENT - GUJARAT

(!hf\0)
l!(t)
(f)
oN.1
*iIooq.}
.aoq)
U
'.I.
.ilAA
GR
ICU
LTUR
E DEPA
RTM
ENTG
RIC
ULTU
RE D
EPAR
TMEN
TL, *vto).F-
..Xdr{(!
dG,
IGHtauF
! G
IzfcX
O;9ar5&
"6-
0,;bo-{.
t{
,q.r5
otr.qr(E'/
lrlt
v-
AGRICULTURE DEPARTMENT - GUJARAT

PRE / POST MONSOON INSPECTION
The inspection checklist included in this section should be copied and completed everytime a maintainance inspection is porformed. In general inspections should be performedevery year in March and October.
Date of Examination InsPected BY
S.E. - SuPerintending EngineerE.E - Kachchh lrrigation Circle
D.E.E. - Bhuj-Kachchh'
so.-
Operational Status at Time of Examination
Reservoir Water Surface - Elevation
Reservoir Gross Storage
FRL
Max reservoir water level reached
Releases :
Spilway
HR
Water Supply
COMMUNIVATION
Type : Phone No. - at dam site
Auxillarv Power
, DescriptionI
' Test during examination
Condition
Adquacy
Remote Control
Description
Test during examination
Condition
Adquacy
Site Acess
Description (Main and alternative routes)
Adquacy under
Adverse Conditions
Condition of payment Condition of dip (if any)
D:\0 OId Data\O.Bhuj I.S.Dn\PBranch\PRE-POST MONSOON CHECKLIST\Post RUDRAMATA1
IRRIGATION DEPARTMENT - GUJARAT
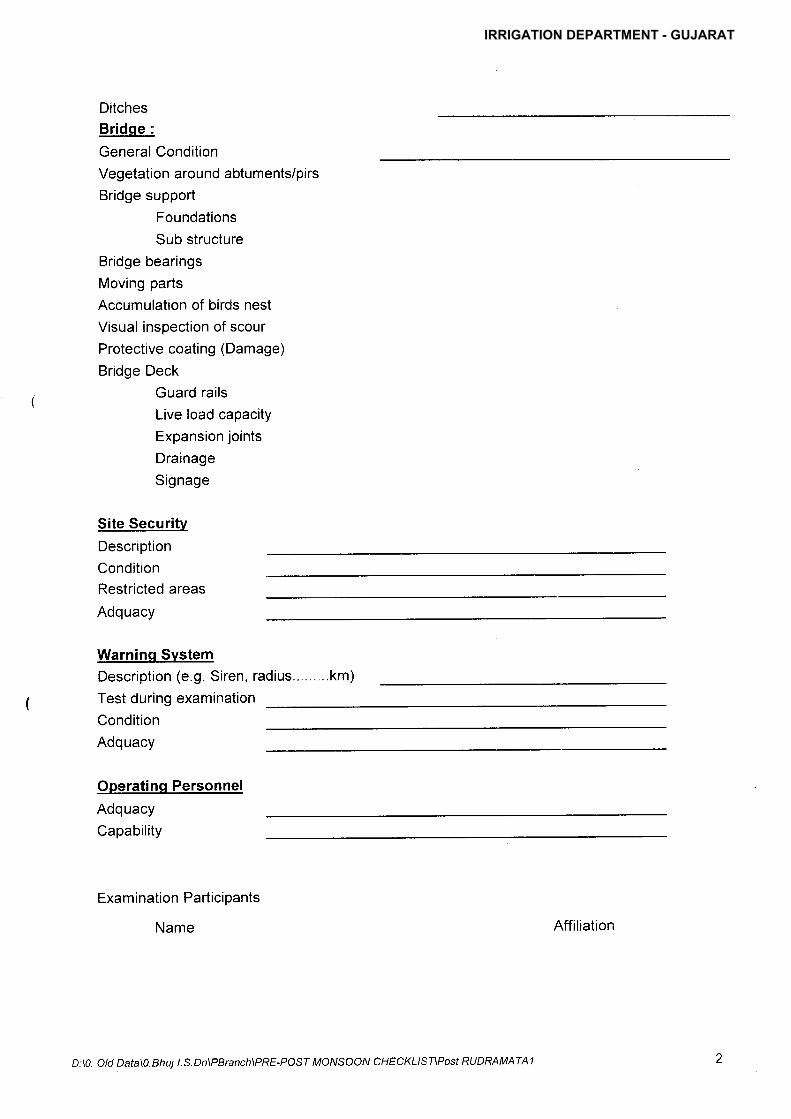
Ditches
Bridqe :
General Condition
Vegetation around abtuments/pirs
Bridge support
Foundations
Sub structure
Bridge bearings
Moving parts
Accumulation of birds nest
Visual inspection of scour
Protective coating (Damage)
Bridge Deck
Guard rails
Live load capacity
Expansion joints
Drainage
Signage
Site Sgguritv
Description
Condition
Restricted areas
Adquacy
1 Test during examination
Condition
Adquacy
Warninq SvstemDescription (e.9" Siren, radius.... km)
Operating Personnel
Adquacy
Capability
Examination Participants
Name
D:\0. old Data\0.Bhuj I"s.Dn\PBranch\PRE-POST MONSOOA/ CHECKLISTPoSt RUDRAMATAI
Affiliation
IRRIGATION DEPARTMENT - GUJARAT

CHECKLIST OFEM ERGENCY PREPAREDNESS
EPP
lssue and revision date
ls copy available current ?
Are instruction adquate ?
Any changes needed ?
COMMUNICATION
Type
Adquacy
OPERATING PROCEDURES
EMERGENCY PREPAREDNESS
Adquacy
Capability of personnel
Auxillarv Power
Test during examination
Condition
Adquacy
Remote Control
Test during examination
Condition
( Adquacy
ACCCESS ROADS
Adquacy under aderse condition
SAFETY FEATURES
General Condition
Restricted areas (for public movement)
D:\0" QId Data\O.Bhuj LS.Dn\PBranch\PRE-POST MONSOON CHECKLIST\Post RUDRAMATAZ
IRRIGATION DEPARTMENT - GUJARAT
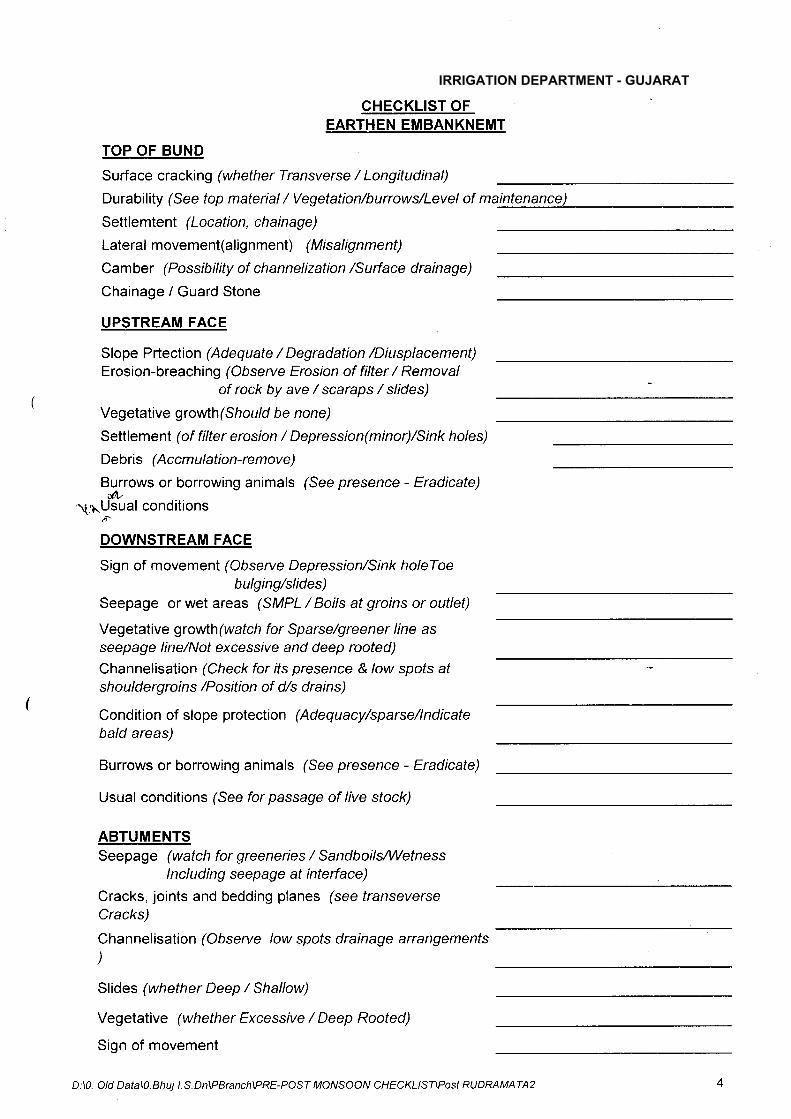
CHECKLIST OFEARTHEN EMBANKNEMT
TOP OF BUND
Surface cracking (whether Transverse / Longitudinal)
Durability (See top material / Vegetation/burrows/Level of maintenance)
Settlemtent (Location, chainage)
Lateral movement(alignment) (Misalignment)
Camber (Possibility of channelization /Surface drainage)
Chainage / Guard Stone
UPSTREAM FACE
Slope Prtection (Adequate / Degradation /Diusplacement)Erosion-breaching (Observe Erosion of filter / Removal
( of rock by ave / scaraps / slides)' Vegetative growth(Should be none)
Settlement (of filter erosion / Depression(minor)/Sink holes)
Debris (Accmulation-remove)
Sign of movement (Observe Depression/Sink holeToebulging/slides)
Seepage or wet areas (SMPL / Boils at groins or outlet)
Vegetative growth(watch for Sparse/greener line asseepage line/Not excessive and deep rooted)
Channelisation (Check for its presence & low spofs afshouldergroins /Positian of d/s drains)
(' Condition of slope protection (Adequacy/sparse/lndicatebald areas)
Burrows or borrowing animals (See presence - Eradicate)&.
rl"xUsual conditions.t-
DOWNSTREAM FAGE
Burrows or borrowing animals (See presence - Eradicate)
Usual conditions (See for passage of live stock)
ABTUMENTSSeepage (watch for greeneries / SandboilsNVetness
lncluding seepage at intefface)
Cracks, joints and bedding planes (see franseverseCracks)
Channelisation (Observe low spofs drainage arrangements)
Slides (whether Deep / Shallow)
Vegetative (whether Excessive / Deep Rooted)
Sign of movement
D:\0. Old Data\0.Bhuj l.S.Dn\PBranch\PRE-POSI MONSOON CHECKLISTPISI RUDRAMATA2
IRRIGATION DEPARTMENT - GUJARAT

SEEPAGE AND DRAINAGE SUMMATION
Location (s) (Grotns /Junctions /HR)Estimated flow (s)
Color (staining) (for silUWashing out of earth pafticlescausing piping)
Erosion of outfallToe drain and manholes (look for Cleanliness/Siltcol I e ct i o n/ Rev i ew of t h e i r I oc at i o n s/o utf al I s )
Out drain ( Clean or not effectiveness / free flow/submerger)
MEASUREMENT
Method
Amountt Change in flow' (Rate, for same water level compate with past data/
lnclease is alarming decrease means shrinking/also watchfor transverse cracks)
Clearness of flow
ColorFines ( Allow water to stand Compare daily heights)Condition of measurement deviceRecords ( Plot flow rates)
INSTRUMENTS
Piezometers
WellVentilationPipes
( Security
Tilt gaugeSurface settlement points i gaugesCross arms (Deviation / offeset)Liq uid pressure transmeterUplift pressure transmeter
SPECIAL ITEMS
Earthen enevelop and junctions
Stockpiles (at vunerable locatios) ofEmpty cement bagesWire cratesRockfill
GravelSand
D :\0. O ld D ata\O. Bh uj I. S. Dn\P Branch\P RE-P O ST MOIVSOOA/ C H E CKL I SnPost RU D RA M AT A2
IRRIGATION DEPARTMENT - GUJARAT

SPILLWAY / MASONRY / CONCRETE DAM
GLACIS WASTE WEIR / SPILLWAY (Oqee Tvpe Waste Weir)Approach Channel
Debris
Slopes (Vegetation / Stability )
Slope protection (Location, chainage)
CrestSurface condition (Cracks/Honey comb/stratification/
Form slippage/Stains / Bar prolection)General condition of concrete (Disintergration/spallingDrummy Concrete/Pop out I Pitting /Scaling)
Cracks or areas of distress (Location , Extent)
Sign Movement (Misalignment / Differntial movement)
( vesetation srowth !Y::?l:, i"ints/tifts, tndicateseepage)
Seepate (at D/s face/staining at joints/pipes,watch,Measure, Turbidity, rate of flow, Record/ Blocked drains)
Traning WallsSurface condition (Observe Cracks/Honey comb/stratification/ Form slippage/Stains / Bar projection)General condition of concrete/masonry (observeDisintergration/spalling Drummy Concrete/Pop out / Pitting /Scaling)
Sign Movement (orfisets/Misalignment / Differntialmovement)Joints (if washed ouUcracUdifferntial movemenUvegetation growth)Cracks or areas of distress (Measure location , extent)
( Condition of blackfill (watch for seepage/erosion/settlement)Functioning of weep holes (whether clean/chocked)Seepage (Record sfains at joints/turbidity)
Debris (lf present at joinU lift joints)
Settlement / erosion of foudation
Floor/apron/cistern/BuckeUstill ing BasinSurface condition (Cracks/Honey comb/ stratification/ Formslippage/Stains / Bar projection)General condition of concrete (Disintergration/spallingDrummy Concrete/Pop out / Pitting / Scaling)
Sign Movement (offsets/Misalignment / Differntialmovement)Cracks or areas of distress (Measure location , extent)
ErosionUpstream release drains / valves
D:\0. OId Data\O.Bhuj l.S.Dn\PBranch\PRE-POST MOIVSOON CHECKLISTPoSt RUDRAMATA2
IRRIGATION DEPARTMENT - GUJARAT
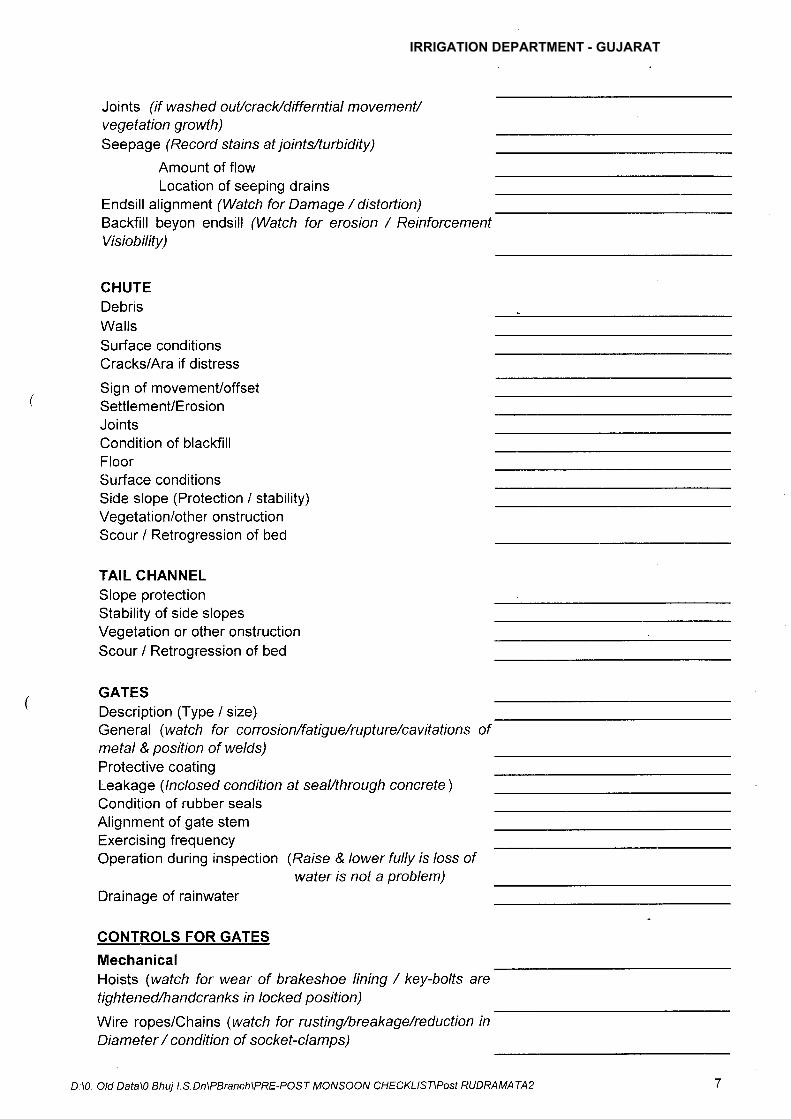
Joints (if washed ouUcracMdifferntial movement/vegetation growth)
Seepage (Record sfarns at joints/turbidity)
Amount of flowLocation of seeping drains
Endsill alignment (Watch for Damage / distortion)Backfill beyon endsill (Watch for erosion / ReinforcementVisiobility)
CHUTEDebrisWallsSurface conditionsCracks/Ara if distress
, Sign of movement/offsetI Settlement/Erosion
JointsCondition of blackfillFloorSurface conditionsSide slope (Protection / stability)Vegetation/other onstructionScour I Retrogression of bed
TAIL CHANNELSlope protectionStability of side slopesVegetation or other onstructionScour / Retroqression of bed
, GATESI' Description (Type / size)
General (watch for corrosion/fatiguehupture/cavitations ofmetal & position of welds)Protective coatingLeakage (lnclosed condition at seal/through concrete)Condition of rubber sealsAlignment of gate stemExercising frequencyOperation during inspection (Raise & lower fully is /oss of
water is not a problem)
Drainage of rainwater
CONTROLS FOR GATES
MechanicalHoists (watch for wear of brakeshoe lining / key-bolts aretightened/handcranks in locked position)
Wire ropes/Chains (watch for rusting/breakage/reduction inDiameter / condition of socket-clamps)
D.\0. Old Data\0"Bhuj l.S.Dn\PBranch\PRE-POST MONSOON CHECKLISIrPoSI RUDRAMATA2
IRRIGATION DEPARTMENT - GUJARAT

Ptorective coatings (watch if peeling/missing)
Condition of hoist platform (watch of rusting/loss of weld/b e n d i n g/m i sa I i g n m e nUm ov e m e nt )
Guard rails (watch for damage/ loss of s/eeves /fouplingcheck anchores\
Change of oils (Fear box)Condition of Gear teeth (check for damage/wear/cracks)
Lubrication (Of ropes/bearing points/Pinion/Hinges/ Spingear/chains)
ElectricalRemot ControlDigital IndicatorPower Supply
( Standby PowerConduit SystemOperation instructions
Diesel DriveGeneral ConditionFuel SupplyLubncation
Operation during examinationVibrations (Excesive)Operation time
Gontrol RoomWindows
1 Walls' Floor
DoorsLightingSltocking I nstructiobsSecurityWiringlntercomFire Extinguisher, First Aid Box
STOPLOGS & CRANEGeneral condition Protective coating (Watch if peeling/
mtssrng )
SealsCrane
ConditionCapacity
D :\0. Old Data\0. Bh uj l. S. D n\P Bra nch\P RE-P O ST MONSOO/V C H EC K L I ST\Post R U D RA M ATA2
IRRIGATION DEPARTMENT - GUJARAT

BRIDGECondition of piers (Leaks/Staining/Projection)
Surface of roadway slabWater Spouls (whether chocked)Condition of parapet/Guard rails (watch for misalignmenU
differenti al settlement)
Structural condition of slab and beams (watch forDeflection/ Cracks)
Bridge bearingsLighting (Adequacy)Overall conditionCatwalsGeneral Condition (Loss of weld/Rusting/Genching/misalignment/ Moveem nt)
Painting (PeelinglMissing)
OTHER Points
D:\0. Old Data\O"Bhui l.S.Dn\PBranch\PRE-POSf MOIVSOON CHECKLISTPaSI RUDRAMATA2
IRRIGATION DEPARTMENT - GUJARAT

NON.OVERFLOW DAM
Upstream FaceSettlement
Deflection
Deterioration concrete I Mortar
Downstream FaceSettlement
Deflection
Deterioration concrete / Mortar
Seepage on downstream face
. Crest(
' Roadway
Walks
Parapat wall
Lighting
Drainage
Drainage Gallary
General Condition
Spalling of surface
Opening of joints
lrletalwork
Access to vital parts/electrification
Ventilation
Cracks(' Seepage (Amount of flowllocation/pressure)
Drains
Frequency of cleaning
Source of pumping
D:\0 Old Data\O"Bhuj l"S.Dn\PBranch\PRE-POST MONSOON CHECKLISnPoSt RUDRAMATA2 10
IRRIGATION DEPARTMENT - GUJARAT

oUTLET WORKS ( H.R.)Trashracks
Trashracks concrete structure
Intake structureGeneral conditions(Deterioration/Miesalignment/Damage)
Entrance Transition(Damage/Cracks/Leaks/Missing seal)
Debris (Removal)
Approach Channel Condition (iltation/Debris/Slope Stability)
SERVICE CONTROL FACILITY
Emegency GATESGeneral conditions(Watch for corrosion/fatiguehupture/cavitations of metal & position of welds)
( Protective Coating
Leakage (ln closed condition at weal/through concrete)
Metal work (Corrosion/Fatigue/Rupture/Cavition)
Condition of rubber seals
Alignment of gate stem
Exercising frequencyOperation during inspection (Ralse & lower fully is /oss ofwater is not rsroblem\
SERVICE GATESGeneral conditions(Watch for corrosion/fatigue/rupture/cavitations of metal & position of welds)
Protective Coating
Leakage (ln closed condition at weal/through concrete)
( Vtetal work (Corrosion/Fatigue/Rupture/Cavition)
Condition of rubber seals
Alignment of gate stem
Exercising frequencyOperation during inspection (Raise & lowerfully is /oss of
water is not problem)
CONTROL FOR GATESMechanicalLubrication
GATE CIVIL WORKS (lncluding Access Bridge)WellVentilation
LightingAccessMetal WorkPainting
D \0. Old Data\o.Bhuj LS.Dn\PBranch\PRE-POST MONSOON CHECKLIST\PosI RUDRAMATA2 11
IRRIGATION DEPARTMENT - GUJARAT

D/S ConduitGeneral Condition ( Deterioration/Leakage/steelement/Steel exposure/ scaling/popping out/vegetation/erosion)
Concrete / masonryCracksLeaks
Settlement
Access BridgeGeneral ConditionPaintingGuard RailsAnchorStillinq BasinDebris / SiltWallsSurface ConditionMinslignmentMasonry / General ConditionSettlementWeep holesSeepageCracks / Area of distressCondition of backfill (Seepage / erosion/ settlement)
D:\0. OId Data\0.Bhuj l.S.Dn\PBranch\PRE-POST MONSOON CHECKLIST\Post RUDRAMATA2 12
IRRIGATION DEPARTMENT - GUJARAT
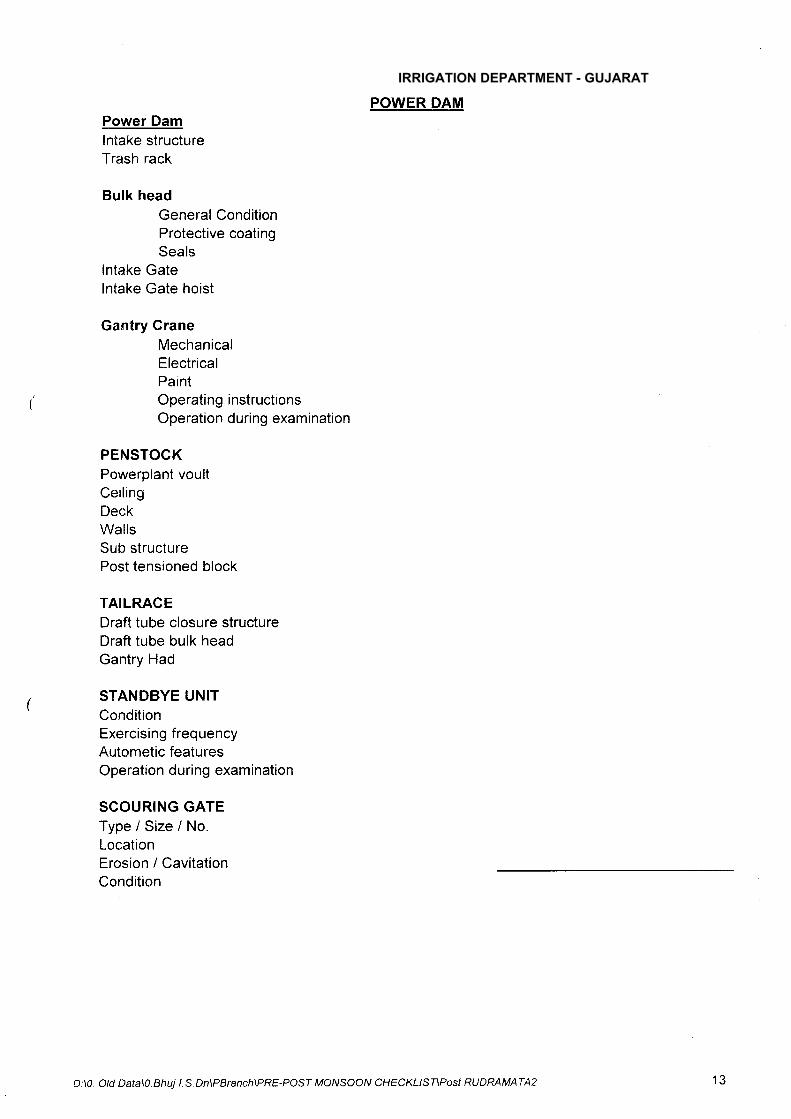
POWER DAMPower DamIntake structureTrash rack
Bulk headGeneral ConditionProtective coatingSeals
lntake Gatelntake Gate hoist
Gantry CraneMechanicalElectricalPaintOperating instructionsOperation during examination
PENSTOCKPowerplant voultCeilingDeckWallsSub structurePost tensioned block
TAILRACEDraft tube closure structureDraft tube bulk headGantry Had
/ STANDBYE UNIT' Condition
Exercising frequencyAutometic featuresOperation during examination
SCOURING GATEType/Size/No.LocationErosion I CavitationCondition
D:\0 AId Data\O Bhui LS.Dn\PBranch\PRE-POST MONSOON CHECKLIST\Past RUDRAMATA2 .Q
IRRIGATION DEPARTMENT - GUJARAT
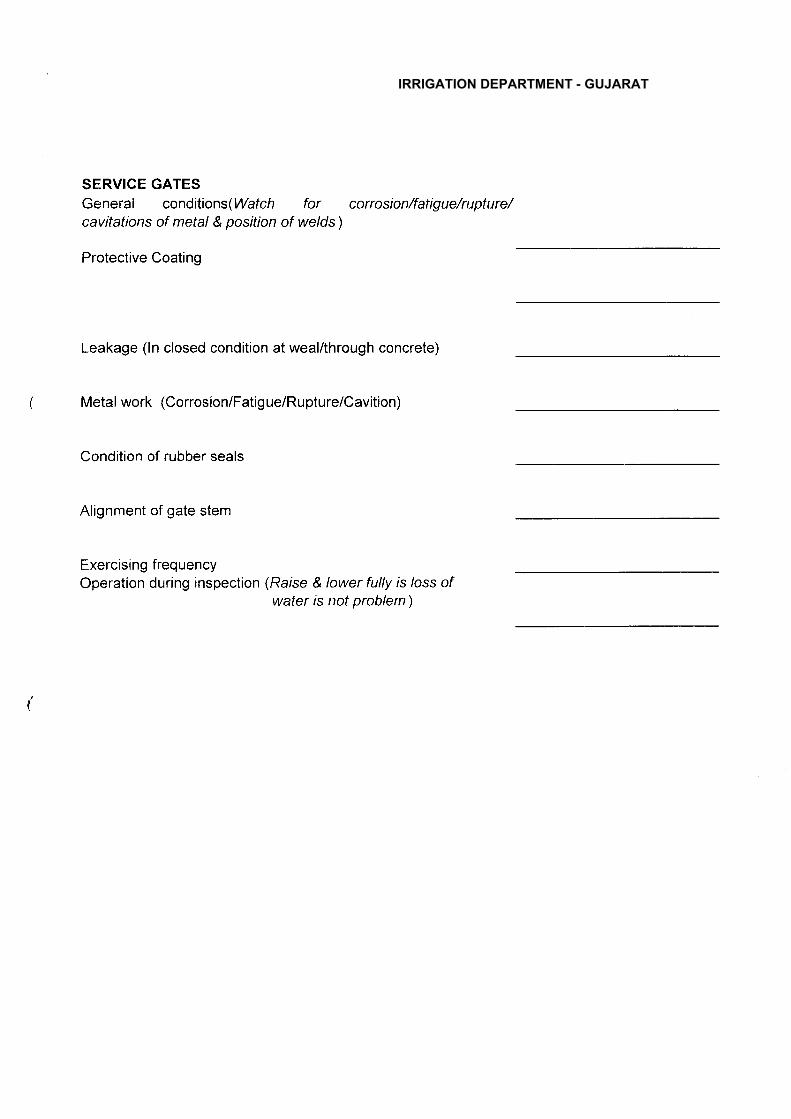
SERVICE GATESGenerai conditions(Watch for corrosion/fatigue/rupture/cavitations of metal & position of welds)
Protective Coating
Leakage (ln closed condition at weal/through concrete)
( Metal work (Corrosion/FatiguelRupture/Cavition)
Condition of rubber seals
Alignment of gate stem
Exercising frequencyOperation during inspection (Raise & lowerfully is /oss of
wateris nof problem)
IRRIGATION DEPARTMENT - GUJARAT
Annex-3: Chart depicting damage assessment procedure in India
Post Disaster Need Assessment Study for India

DDMA/ District Collectorate
SDMA/Revenue/DM Dept. of State Govt.
Disaster Damage Information Collection
for sector/sub sector as specified in SDRF/NDRF
Agriculture
Animal Husbandry
Housing
Fishing
Drinking Water Supply Works
Roads & Bridges
Irrigation
STATE EXECUTIVE COMMITTEE (SEC)
Memorandum for seeking Central Assistance
Power
Health
Education
InfrastructurePublic Properties ( owned by State/Center)Community Assets ( owned by Panchayats)
State level Departments/Directorates
Sections of District Collectorate/Department offices of District
Circle/Block/Panchayat/Village level Revenue related officials
Collection and Collation by Officials as per format prescribed in
SDRF/NDRF or their Ministries
Central Agencies with State Offices (IMD /RSAC etc)
Existing Practice of Collecting, Collating and Reporting of Disaster Damage Data
Source :1. Manual on Administration of SDRF/NDRF, Ministry of Home Affairs, GoI, (revised -2013)2. PDNA India Team’s own impression during visit to selected State