Embed Size (px)
Citation preview

Home Care 100, February 2017Post Acute Providers Going All-In On Risk
Jade Gong (Moderator)Principal JadeGong & Associates [email protected]
Kelly Hopkins President & CEOTrinity Health [email protected]
Lynn JonesPresident & CEOChristiana Care Health [email protected]

Home Care 100, February 2017
If you are not taking risk, you are at risk.Anonymous
Home Care 100, February 2017
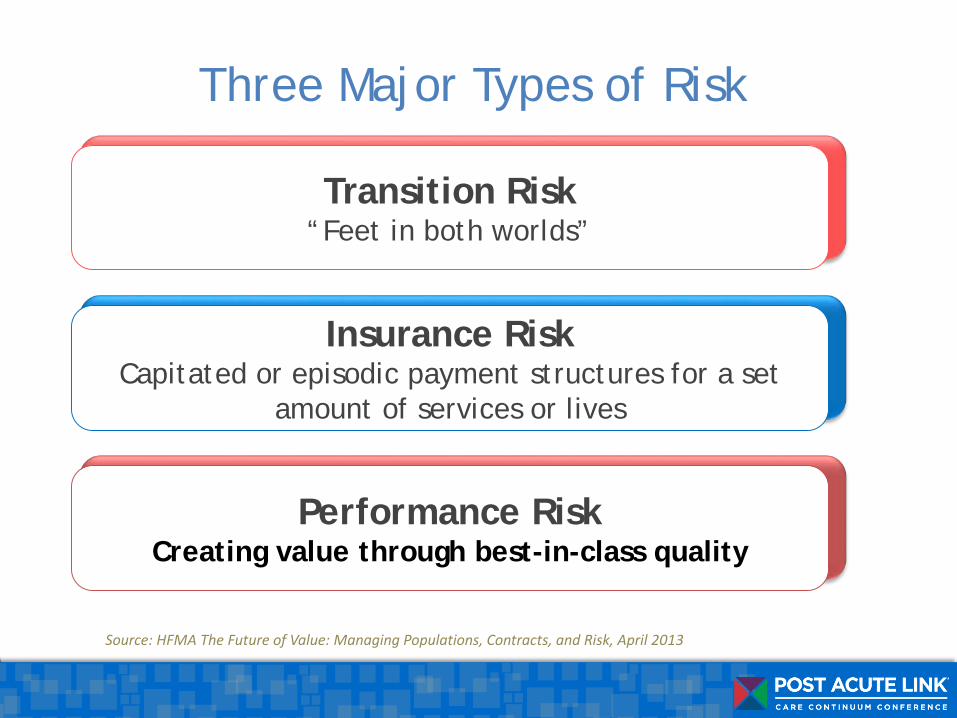
Three Major Types of Risk
Source: HFMA The Future of Value: Managing Populations, Contracts, and Risk, April 2013
Transition Risk“Feet in both worlds”
Insurance RiskCapitated or episodic payment structures for a set
amount of services or lives
Performance RiskCreating value through best-in-class quality

Home Care 100, February 2017Trinity Health
4
Home Care & Hospice Locations Serving 116 Counties47 Continuing Care
Facilities59PACE CenterLocations17
Hospitals* in 20 Regional Health Ministries**92 Mission Health
Ministries4Employed Physicians 5,300
Affiliated Physicians23,900National Health
Ministries***3
Our 22-State Diversified Network
*Owned, managed or in JOAs or JVs.
**Operations are organized into Regional Health Ministries ("RHMs"), each an operating division which maintains a governing body with managerial oversight subject to authorities.
***Includes multiple locations for Trinity Home Health Services, Trinity Senior Living Communities and PACE facilities.

Home Care 100, February 2017Trinity Health PACE National Footprint –13 Programs in 9 states
5
1
CA
AZ
NV
OR
MT
MN
NE
SD
ND
ID
WY
OK
KSCO
UT
TX
NM SC
FL
GAAL 1MS
LA
AR
MO
IA
VA
TN
IN 1
KY
IL
M 1I
WV
WA
OH
PA 3
NY 2
VT
ME
CT
NJ 2
D.C.
WI NHMA
RI
DE 1MD
NC 1
AK
HI
PACE State
Non-PACE State
TH PACE State

Home Care 100, February 2017
What is PACE?• The Program of All-inclusive Care for the Elderly (PACE) is designed to provide the entire continuum of
care and services to frail seniors, helping them to maintain their independence in their home and
community for as long as possible

Home Care 100, February 2017
55 years of age or older
Live in a PACE service area
Be certified as eligible to receive nursing home level of care (as determined by the State)
Be able to live safely in the community at point of enrollment
Who Do We Serve?
2015 PACE Innovation Act will allow CMS to develop pilot projects for the PACE model to be used as a platform for innovation to serve more seniors as well as younger individuals in need of integrated care and services

Home Care 100, February 2017
• PACE Services– Primary Care– Episodic Care
• Inpatient Hospital• Skilled Nursing
– Specialist Care– Social Services– Adult Day– Recreation– PT/OT– In home services– Dietary services (dietician
assessment/ recommendations, hot meals in center, supplements)
– Transportation– Anything else the IDT
determines as necessary
What Does PACE Provide For Seniors…..Exactly?

Home Care 100, February 2017
Specialty Care
Medication Supplies
DME
Transportation
Meals
Personal Care
Subacute Care
Hospital Care
• The Interdisciplinary Team (IDT), with the participant and caregiver, develop an individualized plan of care (POC) based on data from the IDT assessment and participant and family goals
• The POC is updated at six months and on an as needed basis
• Most care plans include care at the PACE Center and in the home
• Most participants attend the PACE Center 2 – 3 times each week
• Participants must agree to receive all services and medications through the PACE provider network (exceptions for emergency and urgent care)
• Some PACE Organizations allow continued visits with prior PCP
Interdisciplinary TeamA LIFE Plan of Care

Home Care 100, February 2017
IDT Balancing Act
• Wants and needs of participant and family
• Individualized care plans• Creativity of individual IDT
members
• Appropriate utilization of necessary services
• Uniform tools that guide decision making
• Stewardship of resources
10

Home Care 100, February 2017
• Payment features are unique compared to other health care payment models
• Capitated payment system (per member per month)
• Combines funding from multiple sources to meet all participant needs Medicare Part A & B Medicare Part D Medicaid Private Pay (less common)
• Program is completely at risk
Integrated Capitated Reimbursement
Pooled Capitation (PMPM)
Medicare Part D
Medicare Medicaid
Private Pay

Home Care 100, February 2017
Balancing Services and Dollars19
Use Dollars Sparingly• Hospital• Emergency Room• Nursing Home
Use Dollars Generously• PACE Team• Home Health• Day Center

Home Care 100, February 2017
Key Points
Traditional Model:Fragmentation
PACE Model:Integration
Care• Multiple providers
• Discontinuity across sites
Financing• Multiple payors
• Institutional bias
• Restrictions
Care• Outpatient care
• Acute care
• Long-term care
Financing• All-inclusive
• Full risk
• No restrictions

Home Care 100, February 2017Dashboard – April
14
12 month rolling: May 2016 - April 2017 Pres
sure
Inju
ry p
er 1
000
part
icip
ant
days
UTI
per
100
0 pa
rtic
ipan
t day
s
maj
or in
jury
falls
per
100
m
embe
r m
onth
s
% im
mun
ized
for P
N
% im
mun
ized
for f
lu
ER v
isits
per
mem
ber
per
annu
m
Acut
e IP
adm
issi
ons
per
mem
ber
per a
nnum
Acut
e IP
adm
issi
ons
per 1
,000
m
embe
rs
Read
mis
sion
s
SNF
days
per
mem
ber
per
mon
th
% P
artic
ipan
ts i
n H
ome/
Com
mun
ity
Wha
t is
your
reco
mm
enda
tion
of P
ACE
to o
ther
s? -
%Ex
celle
nt
Empl
yee
Enga
gem
ent I
ndic
ator
sc
ore
Trinity Health System PACE Organizations Average 5.42 0.82 0.46 91% 89% 0.65 0.65 645 17% 0.45 91.4% 63% 4.19 1.82Threshold (Median) 4.48 0.78 0.5 80% 80% 0.57 0.65 643 18% 0.53 96% 60% 4.08 1.5Target (Top Quartile) 2.59 0.75 0.34 90% 86% 0.38 0.46 563 14% 0.36 98.3% 76% 4.1 2.35
Lower is better
Lower is better
Lower is better Higher is better Higher is better Lower is better Lower is better Lower is better Lower is better Lower is better
Higher is better Higher is better
Higher is better Higher is better
Clinical Scorecard
Financial Summary
Actual Budget Variance % Variance
Operating Revenue (000s) $229,196 $231,516 ($2,320) (1.00)%Operating Expense (000s) $217,691 $222,950 $5,259 2.36 %Operating Margin (000s) $11,505 $8,566 $2,939 34.31 %Operating Margin % 5.02 % 3.70 % 1.32 % 35.67 %Operating Cash Flow (000s) $15,447 $12,683 $2,764 21.79 %Operating Cash Flow 6.74 % 5.48 % 1.26 % 23.03 %Member Months 30,005 31,075 (1,070) (3.44)%Operating Revenue PMPM $7,639 $7,450 $188 2.53 %Operating Expense PMPM $7,255 $7,175 ($81) (1.12)%
Total System PACE - All PACE programs and TH PACE

Home Care 100, February 2017
Post Acute Providers Going All-In On RiskPOST ACUTE LINK
Lynn C. JonesPresident, Home Health & Community Services
SVP, Post Acute Care Services

Home Care 100, February 2017
• Major teaching hospital with four campuses. Largest teaching affiliate hospital for Sidney Kimmel Medical College at Thomas Jefferson University, training more than 280 residents annually.
• Delaware’s largest private employer. (more than 11,000 employees)
• Accountable Care Organization (ACO). Statewide partnership with hospitals, health centers and community physicians in Medicare Shared Savings Program.
• Net operating revenue of $1.8 billion.
o Home Health Care visits: 312,537o 22nd in U.S. Admissions: 53,259o 28th in U.S. Surgeries: 39,102o 21st in U.S. ED Visits: 197,340o 31st in U.S. Births: 6,545

Home Care 100, February 2017
• Targeting Criteria: IAH-Qualifying criteria identify 6% of the FFS population with high cost and high mortality
• Intervention: Home based primary care using mobile interdisciplinary teams with local flexibility in composition, meeting patients “where they are”
• Payment Model: Aligns incentives , using “Shared Savings with Discipline”, covering all A&B spending tied to Quality Metrics; with suspension for non-performance
Independence at Home Demonstration

Home Care 100, February 2017
• Two or more chronic conditions.
• Need for assistance with two or more functional dependencies.
• Non-elective hospital admissions within the last 12 months.
• Received acute or sub-acute rehabilitation services in the last 12 months in SNF, IRF, or Home Health.
• Traditional Medicare only
HCC score for average Medicare beneficiary is 1.0. PACE score is 2.5 and IAH is 3.6.
IAH Qualifying Criteria

Home Care 100, February 2017
IAH “Learning Collaborative”• Boston Medical Center (Boston, Massachusetts)• Christiana Care Health System (Wilmington, Delaware)• Cleveland Clinic Home Care Services (Independence, Ohio)• Comprehensive Geriatric Medicine, P.C. d/b/a Doctors on Call
(Brooklyn, New York)• Doctors Making Housecalls, LLC (Durham, North Carolina)• Housecall Providers, Inc. (Portland, Oregon)• MD2U (Louisville, Kentucky)• National Housecall Practioners Group (Austin, Texas)• Northwell Health (Long Island, New York)• Visiting Physicians Association (Wisconsin, Michigan, Texas, Florida)• Mid-Atlantic Consortium (Penn, VCU, WHC)

Home Care 100, February 2017
IAH Quality Metrics• Follow-up within 48 hours after hospital admission, hospital
discharge, and emergency department visits.
• In-home medication reconciliation within 48 hours of hospital discharge and emergency department visits.
• All-cause hospital readmissions within 30 days.
• Annual documentation of patient preferences.
• Hospital admission rate for ambulatory care sensitive conditions.
• Emergency department visit rate for ambulatory care sensitive conditions.

Home Care 100, February 2017
IAH Gain Share Model• CMS sets a “spending target”
• If savings is achieved; • First, CMS keeps an amount equal to 5% of the
spending target (Then, at least 20% of the remaining savings)
• Providers may receive 80% - 50% of remaining savings based on quality indicators
• Key challenge is delay in receiving claims data (2 year delay)

Home Care 100, February 2017
IAH Demo Year 1 and 2 Results
$11.7 awarded in shared savings• CMS retained 54% of savings• Top savings program saved 32%;
Savings among the 9/17 who received shared savings averaged 17%
All programs improved on 3 out of 6 quality measures• Four programs met all 6 quality
measures
$5.1 awarded in shared savings• CMS retained 35% of savings• Top savings program saved 26%;
Savings among the 7/15 who received shared savings averaged 14%
All programs improved quality from the first performance year in at least two of the six quality measures • Four programs met all 6 quality
measures
Year 1 Year 2
Home Care 100, February 2017
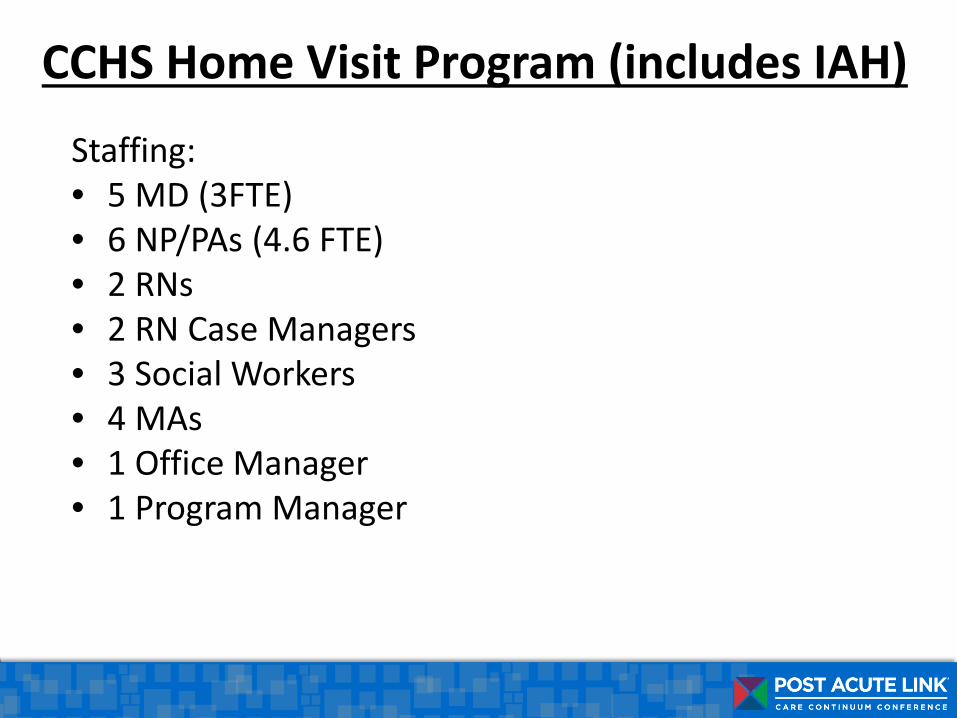
CCHS Home Visit Program (includes IAH)Staffing: • 5 MD (3FTE)• 6 NP/PAs (4.6 FTE)• 2 RNs• 2 RN Case Managers• 3 Social Workers• 4 MAs• 1 Office Manager • 1 Program Manager

Home Care 100, February 2017
CCHS Home Visit Program (includes IAH)
A Few Key Metrics:• Completing year 5 (may extend 2 more years)• 625 HV patients (290 are IAH)• 80 on “waiting list” • 12 month “LOS”• ED Visits (25%)• Hospitalizations (15%)• Patient engagement ↑• ($800k) loss per year on operations• No gain share years 1 & 2

Home Care 100, February 2017
CCHS Home Visit ProgramKey Learnings:• Social Worker as key role• VNA “embedded” Nurses• Risk Stratification = Customized visit patterns• Management of “SNF days”• “Transition team”• Need to add efficiency, revise model and reduce
loss

Home Care 100, February 2017
CCHS Home Visit Program“Fit” into system’s Continuum of Care• Unique class of patients• Unique level/intensity of care = IAH• “Typical ACO case management” not effective for these
patients• Continue to learn; leverage technology; work at “top of
license”; get better at social determinates, end of life care, and efficiency

Home Care 100, February 2017Post Acute Providers Going All-In On Risk
Jade Gong (Moderator)Principal JadeGong & Associates [email protected]
Kelly Hopkins President & CEOTrinity Health [email protected]
Lynn JonesPresident & CEOChristiana Care Health [email protected]