Embed Size (px)
Citation preview
POSSIBLE HEALTH IMPLICATIONS FROM EXPOSURE TO
FORMALDEHYDE EMITTED FROM LAMINATE FLOORING SAMPLES TESTED BY THE CONSUMER
PRODUCT SAFETY COMMISSION
March 22, 2016
2
TABLE OF CONTENTS
Executive Summary ............................................................................................................................... 3 Background and Statement of Issues .................................................................................................... 9 Formaldehyde overview .................................................................................................................. 9 Sources of formaldehyde in indoor air .................................................................................... 10 Laminate flooring and formaldehyde ...................................................................................... 11 Emissions standards................................................................................................................. 11 Factors influencing indoor air concentrations of formaldehyde .............................................. 12 Floorboard Test Results ...................................................................................................................... 16 Consumer Product Safety Commission sample analysis methods ................................................ 17 Consumer Product Safety Commission formaldehyde emission testing results ............................ 19 Indoor Air Modeling ............................................................................................................................ 23 Model summary ............................................................................................................................. 24 Probabilistic analysis ..................................................................................................................... 24 Influence of input variables ........................................................................................................... 27 Model limitations ........................................................................................................................... 29 Discussion and Health Implications ..................................................................................................... 30 Screening of modeled data ............................................................................................................. 30 Health effects from formaldehyde exposure .................................................................................. 30 Implications of exposure to modeled formaldehyde concentrations ............................................. 31 Potential health effects from formaldehyde exposure to floorboards analyzed by CPSC ...... 32 Non-cancer effects ...................................................................................................... 32 Cancer effects .............................................................................................................. 34 Odors and quality of life ............................................................................................. 36 What residents can do ................................................................................................. 36 Summary ................................................................................................................................. 36 Conclusions .......................................................................................................................................... 38 Recommendations ............................................................................................................................... 40 Additional Resources ..................................................................................................................... 42 References ............................................................................................................................................ 43 Appendix A: CPSC Data Results ......................................................................................................... 51 Appendix B: Supplemental Health Effects Information ...................................................................... 54 Appendix C: Modeling Analysis.......................................................................................................... 66

3
Executive Summary Background On March 1, 2015, the CBS news program 60 Minutes reported that an American company, Lumber Liquidators®, was selling a Chinese-produced laminate wood flooring product that released elevated levels of formaldehyde. 60 Minutes tested formaldehyde levels in 31 boxes of commercially available laminate flooring products purchased from Lumber Liquidator® stores in five states (Florida, Illinois, New York, Texas, and Virginia). 60 Minutes reported that some test results were higher than the California Air Resources Board emission standards. Because of concerns raised by the 60 Minutes report, the Consumer Product Safety Commission (CPSC) tested laminate flooring samples manufactured in China during 2012-2014 that were sold at Lumber Liquidators® stores. CPSC subsequently requested that NCEH/ATSDR evaluate the test results for possible health effects. Purpose The purpose of this report is to evaluate people’s possible exposures to formaldehyde emitted from laminate flooring tested by the Consumer Product Safety Commission in indoor air and the possible effects on their health. The report also recommends actions that can reduce formaldehyde levels in people’s homes. Methods As an initial step, CPSC contracted with three accredited, independent laboratories to conduct small chamber testing to measure the formaldehyde emissions from 33 laminated, uninstalled floorboard manufacture lots representing eight unique floorboard styles.
After the small chamber tests were completed, CPSC chose to conduct large chamber tests. CPSC selected samples from three floorboard manufacture lots that emitted the highest amounts of formaldehyde in the small chamber tests and samples from two floorboard manufacture lots that emitted lower amounts of formaldehyde, to use as comparison samples in this large chamber test analysis. Note: Small chamber tests are conducted on individual boards. Large chamber tests are room size, include many boards, and better represent potential exposure conditions.
NCEH/ATSDR used all of the results to estimate (model) indoor formaldehyde levels that may be present in typical homes. The modeling considered other factors that may affect final formaldehyde concentrations, including building ventilation or air exchange rates and ceiling height.
NCEH/ATSDR evaluated the possible health effects from breathing a range of estimated indoor air formaldehyde levels from the flooring alone. We then added these formaldehyde levels to the typical levels commonly found in homes and evaluated the health effects of breathing the combined levels. Finally, NCEH/ATSDR compared the estimated indoor air formaldehyde levels

4
with those in published studies to determine if exposure could cause harmful health effects in residents. Conclusions NOTE: Because of the small number of laminate flooring samples tested, these conclusions do not represent the range of all possible formaldehyde concentrations and should not be generalized to all laminate flooring manufactured during the period of concern. As a result of this evaluation, NCEH/ATSDR has come to the following conclusions: Health effects from estimated formaldehyde exposures Non-cancer effects Floorboard contributions The amount of formaldehyde released could cause health symptoms in residents. Those
symptoms include an increase in breathing problems and short-term eye, nose, or throat irritation. These symptoms are more likely to occur at lower concentrations for people with pre-existing health conditions like asthma or chronic obstructive pulmonary disease (COPD).
The higher the emissions the more likely people are to experience health effects, regardless of their age or pre-existing health conditions.
Flooring in small chamber tests had lower emission rates than flooring in large chamber tests. Across all testing, the NCEH/ATSDR model results show that in 95% of the samples, the amount of formaldehyde released by new laminate flooring alone could range from at or below 185 micrograms of formaldehyde per cubic meter of air (µg/m3) to at or below 930 µg/m3.
Floorboard contributions plus typical indoor levels Formaldehyde is a common indoor air pollutant found in almost every home in the
United States. It comes from manufactured wood products, permanent press fabrics, and other common household products. The typical amount of formaldehyde in indoor air ranges from a few µg/m3 to 240 µg/m3, with an average less than 50 µg/m3. This range includes lower levels in older, less energy efficient homes, and higher concentrations in newer or newly renovated homes (ATSDR 1999; ATSDR 2010).
NCEH/ATSDR added the estimated amount of formaldehyde released by new laminate flooring to typical home indoor air levels.
Our calculations show that if homes already contain new materials or products that release formaldehyde, the new floorboards could add a large amount of additional formaldehyde to what is already in the air from other sources. This additional amount of formaldehyde increases the risk for breathing problems as well as short-term eye, nose, and throat irritation for everyone.
5
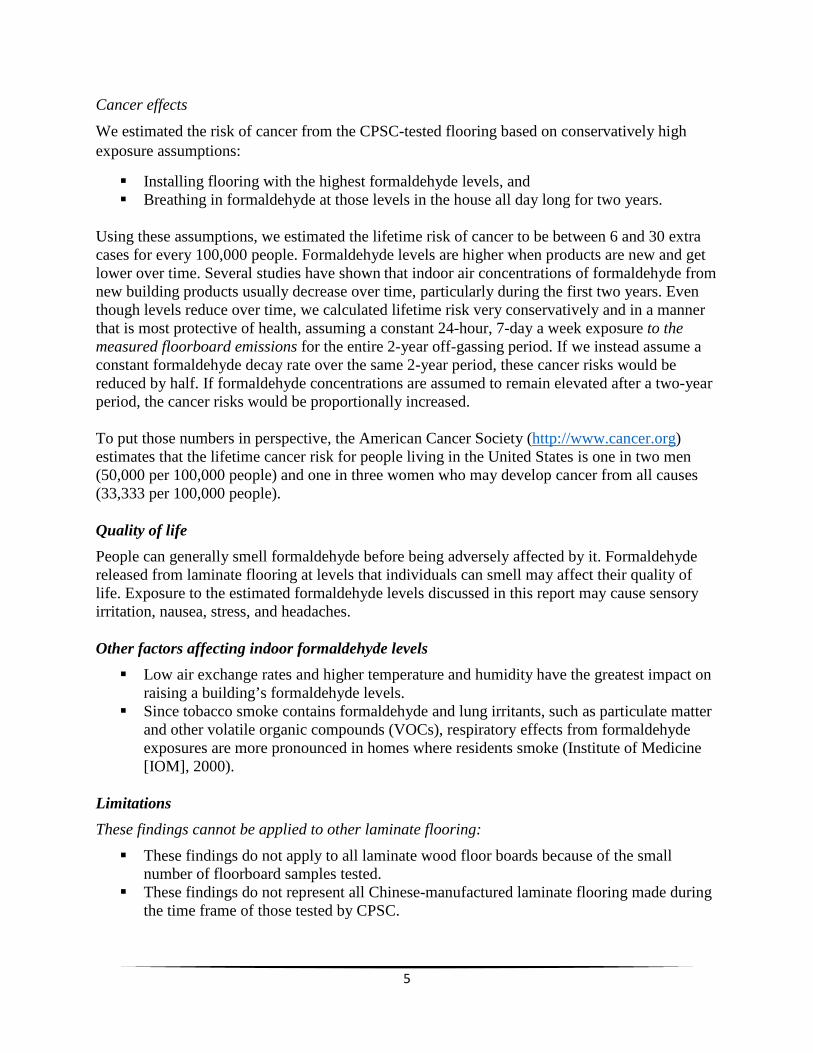
Cancer effects
We estimated the risk of cancer from the CPSC-tested flooring based on conservatively high exposure assumptions:
Installing flooring with the highest formaldehyde levels, and Breathing in formaldehyde at those levels in the house all day long for two years.
Using these assumptions, we estimated the lifetime risk of cancer to be between 6 and 30 extra cases for every 100,000 people. Formaldehyde levels are higher when products are new and get lower over time. Several studies have shown that indoor air concentrations of formaldehyde from new building products usually decrease over time, particularly during the first two years. Even though levels reduce over time, we calculated lifetime risk very conservatively and in a manner that is most protective of health, assuming a constant 24-hour, 7-day a week exposure to the measured floorboard emissions for the entire 2-year off-gassing period. If we instead assume a constant formaldehyde decay rate over the same 2-year period, these cancer risks would be reduced by half. If formaldehyde concentrations are assumed to remain elevated after a two-year period, the cancer risks would be proportionally increased. To put those numbers in perspective, the American Cancer Society (http://www.cancer.org) estimates that the lifetime cancer risk for people living in the United States is one in two men (50,000 per 100,000 people) and one in three women who may develop cancer from all causes (33,333 per 100,000 people). Quality of life People can generally smell formaldehyde before being adversely affected by it. Formaldehyde released from laminate flooring at levels that individuals can smell may affect their quality of life. Exposure to the estimated formaldehyde levels discussed in this report may cause sensory irritation, nausea, stress, and headaches. Other factors affecting indoor formaldehyde levels Low air exchange rates and higher temperature and humidity have the greatest impact on
raising a building’s formaldehyde levels. Since tobacco smoke contains formaldehyde and lung irritants, such as particulate matter
and other volatile organic compounds (VOCs), respiratory effects from formaldehyde exposures are more pronounced in homes where residents smoke (Institute of Medicine [IOM], 2000).
Limitations These findings cannot be applied to other laminate flooring: These findings do not apply to all laminate wood floor boards because of the small
number of floorboard samples tested. These findings do not represent all Chinese-manufactured laminate flooring made during
the time frame of those tested by CPSC.

6
These findings only apply to the 43 samples collected from 11 Lumber Liquidators® laminate flooring manufacture lots sampled by CPSC and analyzed by NCEH/ATSDR.
These findings are based on very conservative (health protective) modeling assumptions
Formaldehyde is not lost due to adsorption or transformation. The model represents steady state formaldehyde concentrations estimated from CPSC
emission rate data This model assumes no sinks, a constant generation rate, a constant incoming
contaminant concentration, and an equal airflow into and out of the room. The flooring covered 100% of the floor surface, which would overestimate formaldehyde
concentrations in homes with carpet or tile flooring in addition to the laminate flooring.
Past and future exposure Formaldehyde emissions from laminate flooring decrease over time. The floorboard samples provided by CPSC were analyzed between six months and three years after the manufacture date. Since formaldehyde emissions decrease over time, formaldehyde emissions from the CPSC-tested floorboards were likely higher when they were first manufactured. No results of emissions testing over time are available. Therefore, NCEH/ATSDR cannot estimate past or future indoor formaldehyde concentrations or potential health impacts. While modeling or emissions testing over time was not conducted, literature sources indicate that emissions rates of other products may decrease to typical indoor levels after several years. Recommendations Based on the above conclusions, NCEH/ATSDR recommends the following actions for residents who installed laminate flooring made in China between 2012 and 2014 and sold by Lumber Liquidators®. Residents should see a doctor trained in environmental medicine if they begin to experience symptoms or discomfort after the installation of new laminate flooring (or any product manufactured with formaldehyde) to determine if their symptoms are related to indoor air quality. Formaldehyde-related symptoms can include irritated eyes, nose, or throat and increased breathing problems for people with health conditions like asthma or chronic obstructive pulmonary disease (COPD). These symptoms would be more noticeable when residents are at home (see additional resources).
Residents can reduce exposure to formaldehyde by: Opening windows (when possible) to let in fresh air, unless residents have asthma
triggered by outdoor air pollution or pollen. If opening windows is not possible, using non-ozone-producing air cleaners (like those with activated carbon filters or HEPA [High Efficiency Particulate Air]) filters1 can reduce exposure to these triggers;
1 Note: Air filters that only remove particulates (like dust and pollen) or air fresheners that release aerosols into the air to mask odors do not remove formaldehyde from indoor air. Further, with ozone-producing air purifiers, the

7
Running exhaust fans in the kitchen and bathroom increase the draw of outdoor air into the home;
Maintaining the temperature and humidity inside the home at the lowest settings comfortable for the occupants;
Making the home smoke free. Tobacco smoke contains formaldehyde, so residents should not allow anyone to smoke in the home.
Using products without formaldehyde in future home improvement projects such as: o Furniture, wood cabinetry, or flooring made without urea-formaldehyde (UF)
glues; o Pressed-wood products that meet ultra-low emitting formaldehyde (ULEF) or no
added formaldehyde (NAF) requirements; o Products labeled “No VOC/Low VOC” (volatile organic compound); and o Insulation not based on UF foam.
Reducing formaldehyde from new products that contain formaldehyde by: o Washing permanent-press clothing and curtains before using them; and o Letting new products such as furniture, wood cabinetry, flooring made with urea-
formaldehyde, and pressed-wood products, release formaldehyde outside of the living space before installing or using them inside, for example, in a garage or on a patio. If possible, residents should keep these products out of their living space at least until they no longer smell a chemical odor.
Residents should consider the following before testing formaldehyde levels in their homes:
Testing the air in their homes may not be needed, especially if the flooring was installed several years ago.
If residents recently installed laminate flooring and smell odors or experience symptoms consistent with formaldehyde exposure only when they are in the home, they may want to consider testing their indoor air for formaldehyde.
Testing or sampling should be conducted by a professional with appropriate environmental credentials (such as a certified industrial hygienist [CIH], registered environmental health specialist/registered sanitarian [REHS/RS]). These professionals should use a federal reference sampling method and analysis that can measure the formaldehyde concentration, such as EPA TO-11A (http://www.epa.gov/ttnamti1/files/ambient/airtox/to-11ar.pdf).
Professional tests are expensive and do not identify which products are the largest sources of the formaldehyde in indoor air. Therefore, air sampling may not provide definitive information on whether the flooring is the major source of formaldehyde.
There are no standards for acceptable residential indoor formaldehyde levels in air. Residents should consider the following before removing this type of laminate flooring from their homes:
If the flooring was installed several years ago, the levels of formaldehyde may have returned to what is typically found in homes — so there may be no reason to remove it.
ozone can react with other chemicals and produce formaldehyde. For that reason, they are not recommended for home use because they can cause breathing problems (IOM 2010).
8
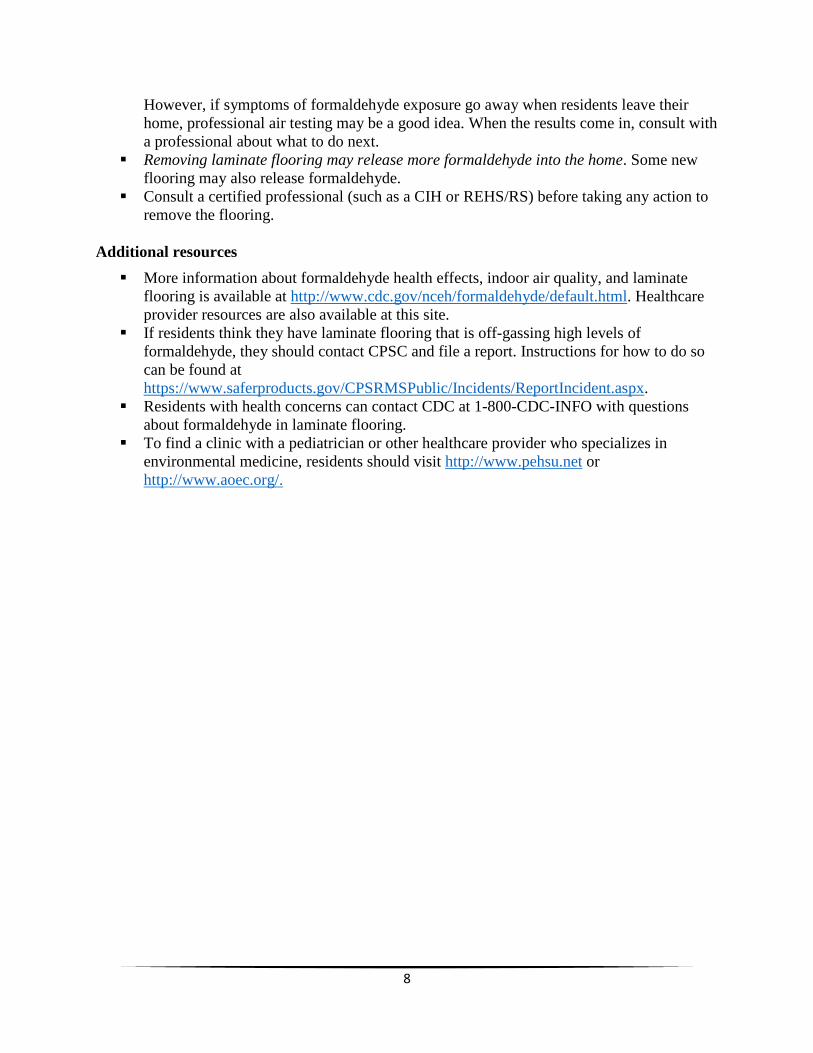
However, if symptoms of formaldehyde exposure go away when residents leave their home, professional air testing may be a good idea. When the results come in, consult with a professional about what to do next.
Removing laminate flooring may release more formaldehyde into the home. Some new flooring may also release formaldehyde.
Consult a certified professional (such as a CIH or REHS/RS) before taking any action to remove the flooring.
Additional resources More information about formaldehyde health effects, indoor air quality, and laminate
flooring is available at http://www.cdc.gov/nceh/formaldehyde/default.html. Healthcare provider resources are also available at this site.
If residents think they have laminate flooring that is off-gassing high levels of formaldehyde, they should contact CPSC and file a report. Instructions for how to do so can be found at https://www.saferproducts.gov/CPSRMSPublic/Incidents/ReportIncident.aspx.
Residents with health concerns can contact CDC at 1-800-CDC-INFO with questions about formaldehyde in laminate flooring.
To find a clinic with a pediatrician or other healthcare provider who specializes in environmental medicine, residents should visit http://www.pehsu.net or http://www.aoec.org/.
9
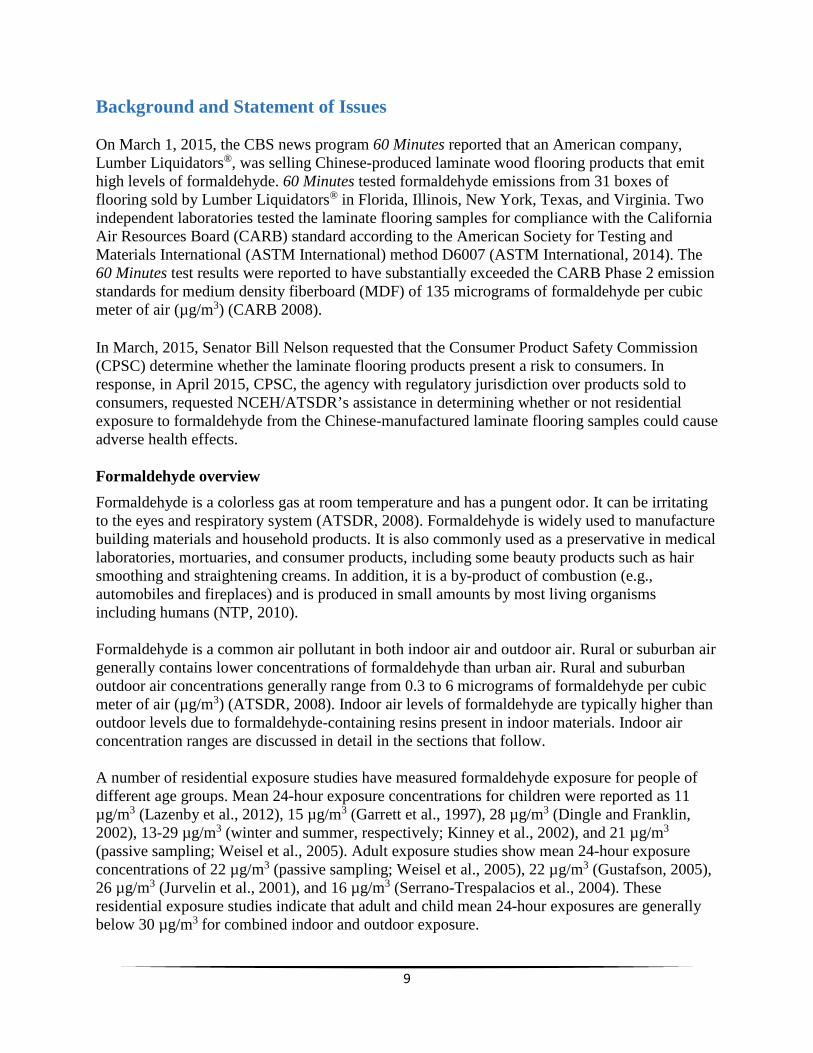
Background and Statement of Issues On March 1, 2015, the CBS news program 60 Minutes reported that an American company, Lumber Liquidators®, was selling Chinese-produced laminate wood flooring products that emit high levels of formaldehyde. 60 Minutes tested formaldehyde emissions from 31 boxes of flooring sold by Lumber Liquidators® in Florida, Illinois, New York, Texas, and Virginia. Two independent laboratories tested the laminate flooring samples for compliance with the California Air Resources Board (CARB) standard according to the American Society for Testing and Materials International (ASTM International) method D6007 (ASTM International, 2014). The 60 Minutes test results were reported to have substantially exceeded the CARB Phase 2 emission standards for medium density fiberboard (MDF) of 135 micrograms of formaldehyde per cubic meter of air (µg/m3) (CARB 2008). In March, 2015, Senator Bill Nelson requested that the Consumer Product Safety Commission (CPSC) determine whether the laminate flooring products present a risk to consumers. In response, in April 2015, CPSC, the agency with regulatory jurisdiction over products sold to consumers, requested NCEH/ATSDR’s assistance in determining whether or not residential exposure to formaldehyde from the Chinese-manufactured laminate flooring samples could cause adverse health effects. Formaldehyde overview Formaldehyde is a colorless gas at room temperature and has a pungent odor. It can be irritating to the eyes and respiratory system (ATSDR, 2008). Formaldehyde is widely used to manufacture building materials and household products. It is also commonly used as a preservative in medical laboratories, mortuaries, and consumer products, including some beauty products such as hair smoothing and straightening creams. In addition, it is a by-product of combustion (e.g., automobiles and fireplaces) and is produced in small amounts by most living organisms including humans (NTP, 2010). Formaldehyde is a common air pollutant in both indoor air and outdoor air. Rural or suburban air generally contains lower concentrations of formaldehyde than urban air. Rural and suburban outdoor air concentrations generally range from 0.3 to 6 micrograms of formaldehyde per cubic meter of air (µg/m3) (ATSDR, 2008). Indoor air levels of formaldehyde are typically higher than outdoor levels due to formaldehyde-containing resins present in indoor materials. Indoor air concentration ranges are discussed in detail in the sections that follow. A number of residential exposure studies have measured formaldehyde exposure for people of different age groups. Mean 24-hour exposure concentrations for children were reported as 11 µg/m3 (Lazenby et al., 2012), 15 µg/m3 (Garrett et al., 1997), 28 µg/m3 (Dingle and Franklin, 2002), 13-29 µg/m3 (winter and summer, respectively; Kinney et al., 2002), and 21 µg/m3 (passive sampling; Weisel et al., 2005). Adult exposure studies show mean 24-hour exposure concentrations of 22 µg/m3 (passive sampling; Weisel et al., 2005), 22 µg/m3 (Gustafson, 2005), 26 µg/m3 (Jurvelin et al., 2001), and 16 µg/m3 (Serrano-Trespalacios et al., 2004). These residential exposure studies indicate that adult and child mean 24-hour exposures are generally below 30 µg/m3 for combined indoor and outdoor exposure.

10
Formaldehyde is a highly reactive molecule that can irritate tissues with which it comes into contact. Human and animal studies indicate that, at certain levels, exposure to formaldehyde in the air can be irritating to the eyes, to the upper respiratory tract (through inhalation), to the skin (through dermal contact), and to the gastrointestinal tract (orally) (ATSDR, 2008). Noticeable health effects from formaldehyde exposure in air include nose and throat irritation, a burning sensation in the eyes, wheezing, and difficulty breathing. People with pre-existing allergies or respiratory conditions, such as asthma or bronchitis, may be especially sensitive to formaldehyde inhalation exposure. Studies of workers breathing high levels of formaldehyde over a long period of time, such as industrial workers and embalmers, found that formaldehyde causes myeloid leukemia and rare cancers including sinonasal and nasopharyngeal cancer. In laboratory animal studies, formaldehyde caused cancer of the nasal cavity (NTP, 2014). The Department of Health and Human Services (DHHS) and the International Agency for Research on Cancer (IARC) have characterized formaldehyde as a known human carcinogen based on studies of inhalation exposure in humans and laboratory animals (ATSDR, 2008; IARC 2012, NTP 2014). Appendix B presents a detailed discussion of cancer and non-cancer effects documented in humans exposed to formaldehyde. Sources of formaldehyde in indoor air Most formaldehyde produced in the United States is for the manufacture of resins, such as melamine-formaldehyde or urea-formaldehyde resins, used to make the adhesives for pressed wood products (NTP, 2010). Many of these products are found inside homes. Formaldehyde is a common indoor air pollutant and is emitted from many indoor materials such as particleboard, furniture, wood paneling, cabinets, and flooring. It is also found in cigarette smoke, and is a component of other household products such as permanent press fabrics, antiseptics, medicines, cosmetics, dish-washing liquids, fabric softeners, shoe-care products, carpet cleaners, glues and adhesives, and lacquers (ATSDR, 2015a; U.S.EPA, 2015; Kim et al., 2011). Numerous studies have been conducted in many different countries and in many different types of housing, and have evaluated various factors influencing indoor formaldehyde levels. Formaldehyde is generally found in every dwelling, but the concentrations may vary considerably depending on many factors, in particular, the age of the residence or the timing of a recent home renovation. The presence of new building materials, particularly those made using formaldehyde-releasing resins and glues, appears to be the source of relatively short-term (~ 2 years) high level exposure in residences (Brown, 2002; Park and Ikeda, 2006; Wolkoff et al., 1991). Generally, the mean indoor levels of formaldehyde across residential indoor air studies are less than 50 µg/m3 (Clarisse et al., 2003; Dingle and Franklin, 2002; Garrett et al., 1997; Gonzalez-Flesca et al., 1999; Krzyzanowsky et al., 1990; Liu et al., 2006; Marchand et al., 2008; Schliebinger et al., 2001; Wolkoff and Nielson, 2010). However, significant differences have been noted in the ranges of detection due to the age of the dwelling, the air exchange rates of the dwelling, and meteorological conditions such as temperature and relative humidity (Brown et al., 1996; Dassonville, 2009; Fang et al., 1999; Garrett et al., 1997; Gilbert et al., 2006, 2008; Kotzias et al., 2009; McPhail et al., 1991; Murphy et al., 2013; Myers et al., 1985; Park and Fuji, 1999, 2000; Park and Ikeda, 2006; Raw et al., 2004; Sakai et al., 2004; Salthammer, 1995; Sherman and Hodgson, 2004; Van Netten et al., 1989; Wolkoff et al., 1991; Zhang et al., 2007).

11
For the purposes of this report, we note a range of a few µg/m3 to 240 µg/m3 as a typical range of formaldehyde in indoor air (ATSDR 1999). This range includes a lower range for older, less energy efficient homes, and a higher range for newly renovated or newer, more energy efficient homes. Laminate flooring and formaldehyde This evaluation focuses on laminate wood flooring produced in China and sold by Lumber Liquidators® that contains formaldehyde added during the manufacturing process. Formaldehyde-containing resins are used to adhere veneer to a pressed wood core, which may also contain formaldehyde resins as an adhesive. Lumber Liquidators® reports that its laminates are composed of four layers: the wear layer, decorative paper, core layer, and the stabilizing layer (backing layer). The wear layer is provided by a melamine resin, which is highly wear resistant and
scratch resistant (Lumber Liquidators®, 2015). Texture is added to the wear layer through a process called "embossing," which involves pressing patterns into the surface. Melamine-formaldehyde (MF) resin is a synthetic resin obtained by chemical combination of melamine (a crystalline solid derived from urea) and formaldehyde. MF resin is similar to higher formaldehyde emitting urea-formaldehyde (UF) resin in its processing and applications, but MF resins are more moisture-resistant, harder, and stronger. They emit less formaldehyde because of the tighter bond of molecules in their chemical structure.
Below the wear layer is the decorative paper, which gives the laminate a high definition wood or tile look.
The core layer is made of high or medium density fiberboard. UF is commonly used in the manufacture of pressed wood boards and is a less expensive alternative to MF resins (Kandelbauer et al., 2010).
The stabilizing layer is the bottom layer of the laminate that helps provide stability and moisture resistance (Lumber Liquidators®, 2015).
Urea-formaldehyde is commonly used in manufacturing wood-based materials and furnishings due to its rapid curing and low price (Salthammer et al., 2010). However, NCEH/ATSDR could not confirm whether or not both melamine formaldehyde and urea formaldehyde were used in the Chinese mills or just melamine formaldehyde, as was noted on the Lumber Liquidators® website (Lumber Liquidators®, 2015). Emissions standards The Formaldehyde Standards for Composite Wood Products Act (enacted 2010) required U.S. EPA to establish limits for formaldehyde emissions from composite wood products: hardwood plywood, medium-density fiberboard, and particleboard. In 2013, U.S. EPA proposed regulations for composite wood product formaldehyde emissions that are identical to the emission standards adopted by the California Air Resources Board (CARB) currently in place in California (an emissions standard of no higher than 135 µg/m3). EPA will set limits on how much formaldehyde can be released from composite wood products imported into or sold, supplied,

12
offered for sale, or manufactured in the United States. The proposed regulations will also require that composite wood panel producers monitor formaldehyde emissions from their composite wood products and will require testing to confirm that formaldehyde emission standards are met (U.S. EPA, 2015). Under U.S. EPA’s proposed regulations, a laminated product means a product in which a wood or woody grass veneer is affixed to a particleboard platform, a medium-density fiberboard platform, or a veneer core platform. The proposed regulation states that a laminated product is a component part used in the construction or assembly of a finished good, which could include laminate flooring. Under U.S. EPA’s proposal, the composite wood product used in manufacturing laminate flooring would be subject to testing and certification to ensure that it meets the applicable emissions standard. Under the CARB regulations, laminated products must be made with cores that are certified to comply with the applicable emissions standard. The California formaldehyde emissions standards (CARB standards) apply to unfinished composite wood panels. These emissions standards are not directly applicable to finished products, such as the laminate wood flooring installed in homes and buildings. There are many other guidelines derived by public health agencies, including some applicable to finished products, but they are not discussed here. The CARB standard is described because a lack of compliance with the CARB standard is the basis of the investigations by 60 Minutes and CPSC. ATSDR was requested to evaluate the potential health implications of exposure to formaldehyde off-gassing from laminate flooring analyzed by CPSC-contracted laboratories. Thus, our focus was on the presentation of studies demonstrating health effects at various concentrations for comparison to our modeling data, not on the regulatory compliance of Lumber Liquidators® with existing regulatory standards. Factors influencing indoor air concentrations of formaldehyde Indoor air formaldehyde levels are influenced by a number of variables. Furnishings and building materials contain formaldehyde and are major sources of indoor formaldehyde emissions. Pressed wood materials and laminates containing urea or melamine formaldehyde resins that off-gas (emit gases as the product cures and ages) formaldehyde are commonplace and are found not only in laminate flooring, but also in shelving; cabinetry; furniture containing particle boards, plywood, and medium density fiber board; paint and wallpaper; glue and adhesives; varnishes and lacquers; household products; electronic equipment; insecticides; and paper products. The major factors influencing the concentration of formaldehyde in homes are described below. However, additional factors, such as formaldehyde sinks (materials that adsorb and desorb formaldehyde), such as drywall, furniture, and carpet, affect indoor concentrations and complicate the chemistry of the indoor environment (Gunschera et al., 2013). Some predictors of past or current formaldehyde levels inside homes are discussed below. Age of homes/recent renovations Studies of indoor air levels of formaldehyde have indicated that older homes have lower levels of formaldehyde, and Park and Ikeda (2006) suggest that new/recent renovation sources of formaldehyde off-gas to a steady state within approximately two years. Park and Ikeda (2004) initially measured formaldehyde levels in 1,417 homes in various provinces and cities in Japan and found that homes averaged a mean formaldehyde concentration between May and October of 134 µg/m3. The researchers invited the residents in these homes to have two more rounds of
13
testing one and two years from the original test date. Of the original 1,417 homes sampled, 251 homes in Japan were sampled three times over a 2-year period to assess fluctuations of VOCs and aldehydes over time. Park and Ikeda evaluated “newer” homes (less than 6 months old at initiation of the study) and “older” homes greater than 6 months old at the initiation of the study) in the summer (July-September) and found substantial decreases in formaldehyde levels in new homes over the study period. In fact, by the third round of sampling at the end of the second year of the study, the levels of formaldehyde in “newer” homes reached relatively static concentrations of approximately 85-90 µg/m3, the same concentrations as in the older homes sampled in rounds one and two. The authors concluded that while general VOC concentrations in newer or recently renovated homes reached levels similar to older homes within one year, formaldehyde had a longer “flushing period” in newer homes, and did not reach this typical level for an additional year. Wolkoff et al. (1991) reported that between construction and occupancy (approximately one month), Danish residences had initial levels of 200-300 µg/m3 in various rooms that reduced to about 80 µg/m3. Brown (2002) reported that formaldehyde levels in a newly constructed residence were reduced from 120 to 46 µg/m3 in the living room area and 120 to 64 µg/m3 in the bedroom area over a 35 week time period. The author concluded that formaldehyde decayed at a faster initial rate, similar to the indoor decay rate of VOCs, but then slowed to a decay rate three orders of magnitude slower. This decay pattern is similar to what was observed by Park and Ikeda (2006).
An evaluation by Tang et al. (2009) of formaldehyde levels in 6,000 various recently renovated (≤1 year) urban Chinese residences identified a mean formaldehyde level of 238 µg/m3, compared to 1,350 unrenovated homes in rural areas with a mean concentration of 35 µg/m3. Gilbert et al. (2005), Raw et al. (2004), and Sakai et al. (2004) also reported associations between housing characteristics and formaldehyde concentrations in indoor air. They found a statistically significant difference with mean formaldehyde levels indoors and the age of the dwelling, where older houses had lower concentrations of formaldehyde than newer houses. ATSDR (1999) reported that formaldehyde levels in more recently built (<1 year old) conventional homes were generally within the range of 60-245 µg/m3, with few measurements exceeding 350 µg/m3. Older conventional homes had the lowest indoor concentrations of formaldehyde with values typically less than 61.4 µg/m3, consistent with the expected decrease in latent formaldehyde release from wood-based building materials as they age. Wolkoff and Nielson (2010) reported that mean indoor concentrations of formaldehyde in older, less energy efficient homes ranged from 5-100 µg/m3.
Clarisse et al. (2003) sampled 61 dwellings in France and investigated indoor determinants of formaldehyde, finding that flooring replaced within the past year was correlated with higher formaldehyde concentrations. Raw et al. (2004) measured formaldehyde in 833 bedrooms in England and observed a small but statistically significant difference (P<0.001) in the formaldehyde concentrations in rooms with particle board flooring (32 µg/m3) and those without (20 µg/m3). In summary, several studies have shown that indoor air concentrations of formaldehyde from new building products usually decrease over time, particularly during the first two years.

14
Air exchange rate (AER) Several studies have evaluated how formaldehyde levels fluctuate depending on the AER of the dwelling. Most concluded that increased ventilation generally decreases indoor formaldehyde concentrations. In 1995, Salthammer et al. reported an inverse relationship between residential and office AERs and indoor formaldehyde levels. Gilbert et al. (2005) also reported that higher levels of humidity and carbon dioxide, two indicators of low ventilation, were correlated with increased concentrations of formaldehyde in indoor air. Park and Ikeda (2006) reported that the type of ventilation system was less important over time than it was in the first year of sampling in newer homes. Järnström et al. (2006) reported that apartments with combined mechanical ventilation (mechanical supply and mechanical exhaust systems) had significantly lower formaldehyde levels than those with mechanical exhaust only (p<0.01). Chen et al. (2014) also noted that because newer homes are larger and have tighter construction and less air leakage than older homes, they have lower AERs in the ventilation systems. The implications of this study are that newly constructed homes have more floor surface area to off-gas, a generally lower AER, and many other construction products, besides laminated flooring, that add formaldehyde to the indoor air. Gilbert et al. (2008) concluded that increased ventilation generally decreases indoor formaldehyde concentration. However, some types of homes, such as those with new formaldehyde sources (new furniture, flooring, etc.) and those with baseboard heat, may require a higher ventilation rate for an initial period to yield lower formaldehyde levels than homes without these sources. The American Society of Heating, Refrigerating, and Air Conditioning Engineers (ASHRAE) recommends an ideal AER of 0.35 air changes (AC)/hr. Newer and more energy efficient homes built on or after 1990 have a lower AC/hr of 0.26, and homes older than 1990 and less energy efficient have a higher AC/hr of 0.58. The latter two values are the median values obtained from a modeling study where infiltration rates were simulated for 209 typical structures (homes) across the United States that represent 80% of national housing stock (Persily et al. 2010). Plaisance et al. (2013) measured the decay rate of a fixed amount of formaldehyde in indoor environments (i.e., not a continuously-emitting source of formaldehyde gas) and reported that formaldehyde is not persistent and has a relatively short indoor half-life of 2 hours. Further, the authors suggested that indoor sinks may be as important as the air exchange rate of the dwelling for the removal of formaldehyde from indoor air (air exchange rate represented 27-44% of the total indoor air depletion of formaldehyde in the study). Liang and Yang (2013) measured the decay rate of indoor levels of formaldehyde in various rooms of an apartment and found that substantial decreases in indoor formaldehyde levels could be achieved by simply opening windows wide for as little as 6 minutes at a time. Furthermore, they reported that the formaldehyde dissipated indoors with window ventilation at a much more rapid rate than the formaldehyde accumulated when the windows were closed. This study suggests that intermittently opening windows to air out an impacted home is a potentially highly effective option for decreasing indoor levels of formaldehyde. Temperature, humidity, and season Several studies have found that increasing temperature and humidity is correlated with increasing formaldehyde concentrations indoors.

15
Wiglusz et al. (2002) tested emissions from laminate flooring with particleboard and high density fiber board (HDF) and determined that they demonstrated relatively low emissions of formaldehyde at 23 and 29oC (73 and 84oF), but much higher emissions at 50oC (122oF). The authors also suggested that floor heating may facilitate the off-gassing of formaldehyde from laminate flooring. Brown et al. (1996) reported that an increase of 10oC in indoor air was correlated with a two to three-fold increase in formaldehyde levels. Zhang et al. (2007) evaluated the partition and diffusion coefficients for four building materials and reported that the diffusion coefficients increased with increasing temperature for particleboard, vinyl floor, and medium and high density board (MDF and HDF, respectively). In this study the most sensitive product for formaldehyde off-gassing from increasing temperatures was the medium density board (MDF). Both MDF and HDF are often used in the manufacture of laminate floor core layers. Clarisse et al. (2003) observed that maximum temperatures increased all major indoor aldehyde concentrations in Parisian dwellings. However, Järnström et al. (2006) did not find a significant association between temperature and formaldehyde levels in 6-month-old apartments and 12-month-old apartments. Some studies have suggested that increased relative humidity also facilitates an increased rate of off-gassing of formaldehyde to indoor air. Jo and Sohn (2009) measured formaldehyde in 158 residences over four seasons in 24 newly built apartment buildings and found a correlation between formaldehyde concentration and temperature and humidity. Murphy et al. (2013) found significant associations between temperature and relative humidity and indoor formaldehyde levels in 519 mobile homes. Xu et al. (2012) determined that because of the water solubility of formaldehyde, porous materials such as drywall and carpet could act as formaldehyde sinks, retaining dissolved formaldehyde in the micropores of porous surfaces. Further, water vapor and formaldehyde may compete for sorption sites on these surfaces, resulting in high indoor air concentrations due to relative humidity (Xu et al., 2012; Zhang et al., 2002). Plaisance et al. (2013) also suggested that the adsorption of formaldehyde onto surfaces is facilitated by an increase in absolute humidity. Järnström et al. (2006) reported a significant association (P<0.01) between relative humidity and formaldehyde levels in 6- and 12-month old apartments. Raw et al. (2004) sampled 876 homes in England and found a significant association between seasons and formaldehyde levels. Statistically significant higher levels were found in mean formaldehyde levels in fall months (26 µg/m3) compared with other seasons (spring (21 µg/m3); summer (23 µg/m3); winter (20 µg/m3)). Järnström et al. (2006) identified higher indoor air concentrations of formaldehyde in summer months than in other months for 14 apartments in Finland. Heroux et al (2010) corroborated these results in over 100 Canadian homes reporting mean concentrations in summer of 31.1 μg/m3 and in winter of 23.4 μg/m3 (p < 0.001). Smoking indoors Tobacco smoke contains significant amounts of formaldehyde. Ayer and Yeager (1982) reported that concentrations of formaldehyde (up to 2,600 µg/m3) in side stream cigarette smoke plumes are up to three orders of magnitude above occupational limits, which may account for reported eye and nasal irritation. Lovreglio et al. (2009) sampled 59 Italian homes and found a correlation between mean and median formaldehyde levels with tobacco smoke in residences where more than 10 cigarettes were smoked during sampling. This correlation did not reach statistical
16
significance, likely due to the relatively low percentage of smokers in the study. Bari et al. (2015) measured VOCs, including formaldehyde, in 50 Canadian homes, and used positive matrix factorization to apportion various VOCs to sources in the homes. The authors concluded that formaldehyde was a major pollutant emitted from wood-based building products and tobacco smoke. Marchand et al. (2006) conducted a series of experiments to estimate the aldehyde exposure levels of a person in a closed room when cigarettes are smoked. After five cigarettes were smoked, the mean concentration of formaldehyde in the closed room was 217 µg/m3. After opening windows for 1 hour, the formaldehyde levels returned to typical indoor air concentrations (20 µg/m3). These studies generally indicate that cigarette smoking results in acute formaldehyde exposures to the smoker and the non-smoking occupants.. Nonetheless, chronic heavy smoking in a dwelling could contribute chronically high levels of formaldehyde in indoor air in addition to formaldehyde-releasing building materials. Urea-formaldehyde foam insulation (UFFI) In 1982, the Consumer Product Safety Commission banned the sale of urea formaldehyde foam insulation (UFFI) for use in homes and schools after receiving thousands of resident complaints of adverse health effects from exposure to UFFI emissions. These health effects demonstrated the irritating nature of formaldehyde exposure and included eye irritation, respiratory problems, headaches, nausea, and dizziness after the spray foam was applied. Studies in the United States (CPSC 1981; U.S.EPA 1984) concluded that the presence of UFFI in homes more than doubled the concentration of formaldehyde in indoor air compared to homes without UFFI. The 1982 CPSC ban was appealed and overturned in 1983, but the ban, adverse publicity, and litigation resulted in the collapse of the UFFI industry in the United States (Godish, 2001). Although UFFI was formerly a major contributor of formaldehyde in indoor air, it is unlikely to be a major source in homes today. Spray-in foam insulation (referred to, variously, as “injection foam,” “amino foam,” “aminoplast foam,” “tri-polymer foam,” and “dry-resin foam”) is still commercially available, but does not generate the widespread complaints that were so common with UFFI. Floorboard Test Results Two test methods were used in analyzing flooring samples obtained by CPSC: small chamber tests (ASTM Method D6007) and large chamber tests (ASTM Method E1333), which are described in greater detail below. Thirty-three samples (eight flooring styles or brands) from eleven manufacture lots were selected for small chamber analysis. These were collected from the same manufacture lots of floorboard styles sampled by the 60 Minutes investigation. Five of these manufacture lots were chosen for additional analysis via large chamber testing ̶ two discrete samples were analyzed for one style, and three discrete samples were analyzed for another style. The three floorboard samples emitting the highest levels of formaldehyde were selected for large chamber test analyses as representative of worst-case conditions in a home, while two other lower formaldehyde-emitting samples were selected as comparison samples. Thus, five of the 11 manufacture lots tested in small chamber tests were also analyzed in large chamber tests. Note that one of the lower emitting samples was not from the same production date as its small chamber equivalent because the boards in the package did not satisfy the surface area required for the large chamber test. Therefore, for the large sample test, CPSC secured another sample from the same manufacture lot as the sample used in the small chamber analysis.

17
Production dates of the floorboards analyzed in the small and large chamber tests are summarized in Table 1, below. Table 1. Floorboards sampled by CPSC
Lot ID# Small Chamber Test
Date of Manufacture Lot ID# Large Chamber Test
Date of Manufacture 1 07/20/2014 1 07/20/2014 2 08/10/2013 3 08/10/2013 4 08/10/2013 4 08/10/2013 5 12/20/2014 5 07/20/2014* 6 09/07/2014 6 09/07/2014 7 10/15/2014 8 06/12/2014 9 06/01/2012
10 06/04/2012 10 06/04/2012 11 07/01/2014
*Sample 5 represented two different manufacture dates due to the surface area needs of the large chamber test but were from a single manufacture lot; the small chamber test sample was manufactured in December 2014, and the large chamber test sample was manufactured in July 2014.
Consumer Product Safety Commission (CPSC) sample analysis methods
Small chamber testing Thirty-three samples from eleven manufacture lots of laminate flooring purchased by CPSC in Lumber Liquidator® showrooms were submitted to three independent laboratories (referred to here as “Labs A, B, and C”) for testing of formaldehyde emissions. The samples were manufactured between June 2012 and December 2014. The flooring production dates are provided in Table 1. The laboratories used ASTM Standard Method D6007-14: Determining Formaldehyde Concentrations in Air from Wood Products Using a Small Scale Chamber. This method can be used to analyze samples with and without the laminate facing on the boards. If the facing is removed by sanding the sample, the analysis would be consistent with the California EPA’s “Standard Operating Procedure for Finished Good Test Specimen Preparation Prior to Analysis of Formaldehyde Emissions from Composite Wood Products,” to establish CARB-2 compliance. CPSC tested the intact board as a means to estimate formaldehyde concentrations under in-use conditions. ASTM Method 6007-14 requires that samples be stored in polyethylene plastic prior to analysis. This method places samples in a small chamber (0.02-1.0 cubic meters in volume) during analysis and requires that the interior of the chamber be made of nonadsorbent material, such as stainless steel. Before testing, the method recommends that the boards be conditioned for 2 hours ± 15 minutes (placed with at least 6 inches between them) and at specific temperature (75 ± 5oF)

18
and humidity (50 ± 5%) conditions.2 Note that ASTM D6007 states that “alternative conditioning intervals may give better correlation, such as seven day conditioning that parallels Test Method E1333”, and that CPSC opted for this longer conditioning period for consistency with the large chamber test analysis that followed. This method requires a chamber airflow rate (Q/A) of 1.172 m/h, and an AER of 0.5± 0.05 AC/hr. If the chamber temperature is ± ¼ a degree from 25oC (77oF) or ± 1% from 50% relative humidity, the concentrations yielded by the analysis are corrected for a temperature of 25oC (77oF) and a 50% relative humidity. The test run time for the CPSC small chamber analysis was between 30 minutes and 2.5 hours. The edges of the laminate flooring samples were sealed with aluminum tape to cover exposed edges in compliance with the small chamber test sampling method during analysis. See Table A-1 for CPSC test parameters for small chamber analyses. The laboratories reported the results both in micrograms per cubic meter, as well as in an emission factor of micrograms per meter squared per hour. Large chamber testing Ten samples from five manufacture lots of laminate flooring purchased by CPSC in Lumber Liquidator® showrooms were submitted to two independent laboratories (referred to here as “Labs A and B”) for testing formaldehyde emissions. Note that Lab B is the same for the small and large chamber tests. The samples were manufactured between June 2012 and July 2014. The laboratories used ASTM Standard Method E1333-14: Determining Formaldehyde Concentrations in Air and Emission Rates from Wood Products Using a Large Chamber. This method is intended to measure emissions from floorboards under conditions that mimic product installation in homes. The large chamber allows a larger sample, which means that boards are assembled as they would be in a home, that is, with seams and unsealed edges. Measurement results are also used for comparing concentrations in air and emission rates from different wood products and, similar to the small chamber method (6007-14), for determining compliance with product standards, such as the CARB standard (ASTM International, 2014b). ASTM Method E1333-14 requires that samples be stored in polyethylene plastic prior to analysis. This method places samples in a large chamber (minimum size of 22 cubic meters in volume) during analysis and requires that the interior of the chamber be made of nonadsorbent material, such as stainless steel, aluminum, or polytetrafluoroethylene (PTFE). Before testing, this method requires that the boards should be conditioned for 7 days ± 3 hours at a certain distance (placed with at least 6 inches between them) and at specific temperature (75 ± 5oF) and humidity (50 ± 5%) conditions.3 The formaldehyde concentration around the boards during conditioning cannot be higher than 123 µg/m3 (0.10 ppm). The method designates an AER of 0.5± 0.05 AC/hr. If the chamber temperature is ± ¼ a degree from 25oC (77oF) or ± 1% from 50% relative humidity, the concentrations yielded by the analysis are corrected for a temperature
2 Note that CPSC samples were conditioned for 7 days in the chamber prior to analysis (ASTM Method 6007-14 requires 2 hours ± 15 minutes). 3 Note that CPSC samples were conditioned for 7 days in the chamber prior to analysis (ASTM Method E1333-14 requires 7 days ± 3 hours).

19
of 25oC (77oF) and a 50% relative humidity. The test run time was 1 hour for all large chamber samples. Unlike the small chamber test sampling method, in large chamber testing the edges of the sampled floorboards were not taped to cover exposed edges, in an effort to mimic installation procedures in homes. See Table A-1 for CPSC test parameters for large chamber analyses. The laboratories reported the results both in micrograms per cubic meter, as well as in an emission factor of micrograms per meter squared per hour. Consumer Product Safety Commission formaldehyde emission testing results
Small chamber test results In July 2015, CPSC forwarded both formaldehyde concentration and emission factor data to NCEH/ATSDR for indoor air modeling. CPSC converted the concentration reported by the laboratory to an emissions factor that can be modeled using the following equation:
EF = AER x (C-CB)/L (1) where EF = emission factor (µg/m2-hr) AER = air exchange rate (AC/hr), defined as ventilation rate divided by chamber volume (m3); C = measured concentration during test (µg/m3) CB = background concentration of the chamber (µg/m3) L = loading factor of the material (ratio of surface area [m2] divided by chamber volume [m3]) The emission factor results for each of the three individual laboratory analyses are listed for each sample in Table 2. The formaldehyde emissions factors measured in the chambers ranged from 10 micrograms per square meters of material per hour (µg/m2-hr) to 350 µg/m2-hr.
Table 2. CPSC Small chamber test results-Analysis of Lumber Liquidators® floor samples* Sample and Laboratory ID # Calculated emission factor (µg/m²-h)
1A 290 1B 50 1C 130 2A 70
2B 20
2C 40
3A 40
3B 40
3C 30
4A 40
4B 20
4C 50
5A 170 5B 70 5C 40 6A 350

20
Sample and Laboratory ID # Calculated emission factor (µg/m²-h) 6B 80 6C 40 7A 80 7B 20 7C 50 8A 40 8B 20 8C 20 9A 50 9B 10 9C 30 10A 20 10B 20 10C 10 11A 100 11B 20 11C 20
*Note: Each sample was analyzed by three independent and accredited laboratories The three sets of results submitted for the samples show some variability. The reason for this is unclear, but it could be explained by differences in the physical composition within individual boards, laboratory handling methods, or chamber composition (one chamber did not have a stainless steel interior, for example, but met the alternative method approval for CARB-2 analysis). The emission factor data distribution for all samples analyzed by each laboratory and all 33 samples are presented in Figure 1 below. While the emissions factors reported from the three laboratories for an individual sample show notable variability, the variability is generally within acceptable ranges of precision for inter-laboratory and between-laboratory variability (ASTM, 2014a,b). We assessed differences in the floorboards by date of manufacture, but very few samples were available per manufacture date ̶ six samples were manufactured in 2014, three were manufactured in 2013, and two were manufactured in 2012. Furthermore, the floor samples were different products and thus are not directly comparable. NCEH/ATSDR noted more variability and higher maximum concentrations in the 2014 samples than other years, less in 2013, and the lowest concentrations in 2012. These trends are likely the result of off-gassing of the boards over time, with newer boards off-gassing at a higher rate than older boards. Figure 2, below, shows the distribution of the emissions factor data for the small chamber test analyses.

21
Figure 1. Formaldehyde emission factors from small chamber analyses: Eleven laminate flooring manufacture lots evaluated by three independent laboratories
0
50
100
150
200
250
300
350
400
1 2 3 4 5 6 7 8 9 10 11
Emiss
ions
fact
or, in
micr
ogra
ms
per h
our p
er sq
uare
d m
eter
Manufacture Lot ID
A
B
C
Laboratory
Figure 2. Measured small chamber test formaldehyde emission factors from floorboards by manufacture year
0
50
100
150
200
250
300
350
400
Form
aldeh
yde e
miss
ion
fact
or
(ug/
m2)
-hr
Manufacture Year2012 (n=2) 2013 (n=3) 2014 (n=6)
Note: “n” refers to the number of manufacture lots analyzed for each year. Each manufacture lot was analyzed by three different laboratories, yielding three sample measurements for each manufacture lot.

22
NCEH/ATSDR used all the emission factors (Table 2, above) provided by CPSC from Labs A, B, and C to model potential indoor air concentrations. Large chamber test results In November 2015, CPSC forwarded both formaldehyde concentration and emission factor data for the large chamber test to NCEH/ATSDR for consideration along with the small chamber test results provided in July 2015. The two individual laboratory results and corresponding emissions factors for each individual floorboard sample are listed in Table 3. The emissions factors ranged from 115 microgram per square meters of material per hour (µg/m2-hr) to 629 µg/m2-hr (Figure 3).
Table 3. CPSC Large chamber test results-Analysis of Lumber Liquidators® floor samples* Sample and Laboratory ID # Emission factor (µg/m²-h)
1A 588 1B 472 4A 229 4B 154 5A 272 5B 231 6A 629 6B 367
10A 157 10B 115
*Note: Each sample was analyzed by two independent and accredited laboratories As with the small chamber tests, the two sets of results submitted for the samples show some variability. The reason for this is unclear, but it could be explained by differences in the physical composition within individual boards (surface area was exposed in 40-50 boards, for example), laboratory handling methods, or chamber composition. An in-depth statistical analysis was not possible with five discrete floorboard products each analyzed by two laboratories. As with small chamber tests, the floor samples were different products and thus are not directly comparable to one another. Four large chamber test samples were manufactured in 2014 and one was manufactured in 2013, so no assessment of manufacture date and concentrations was performed. NCEH/ATSDR used all the emission factors provided by CPSC in Table 3 (above) to model potential indoor air concentrations.

23
Figure 3. Formaldehyde emission factors from large chamber analyses: Five laminate flooring manufacture lots evaluated by two independent laboratories *
0
100
200
300
400
500
600
700
1 4 5 6 10
Emiss
ions
fact
or, in
micr
ogra
ms
per s
quar
ed m
eter
per
hou
r
Sample ID
A
B
Laboratory
*Note: Each sample was analyzed by two independent and accredited laboratories; Lab B is the same for the small and large chamber tests. Indoor Air Modeling Modeling using emissions factors identified in small and large chamber tests was conducted to estimate indoor formaldehyde air concentrations from the floorboards analyzed. Modeling can be deterministic or probabilistic. Deterministic models are straightforward and estimate an air concentration given a series of input parameters using a mathematical equation. Probabilistic models are more complex, generalize across a series of samples, and represent the inputs of the model using probability distributions. For the purposes of exploring the differences and similarities of the two types of chamber tests for these data, NCEH/ATSDR ran a probabilistic model on all 11 small chamber sample measurements and all 5 large chamber sample measurements. Independent analyses on small chamber tests for each flooring sample by three different laboratories yielded 33 independent observations (three for each flooring sample) on which to conduct probabilistic modeling. In spite of a small sample size, we also conducted probabilistic analyses on the large chamber test data, which consisted of 10 independent observations (two for each flooring sample).
24
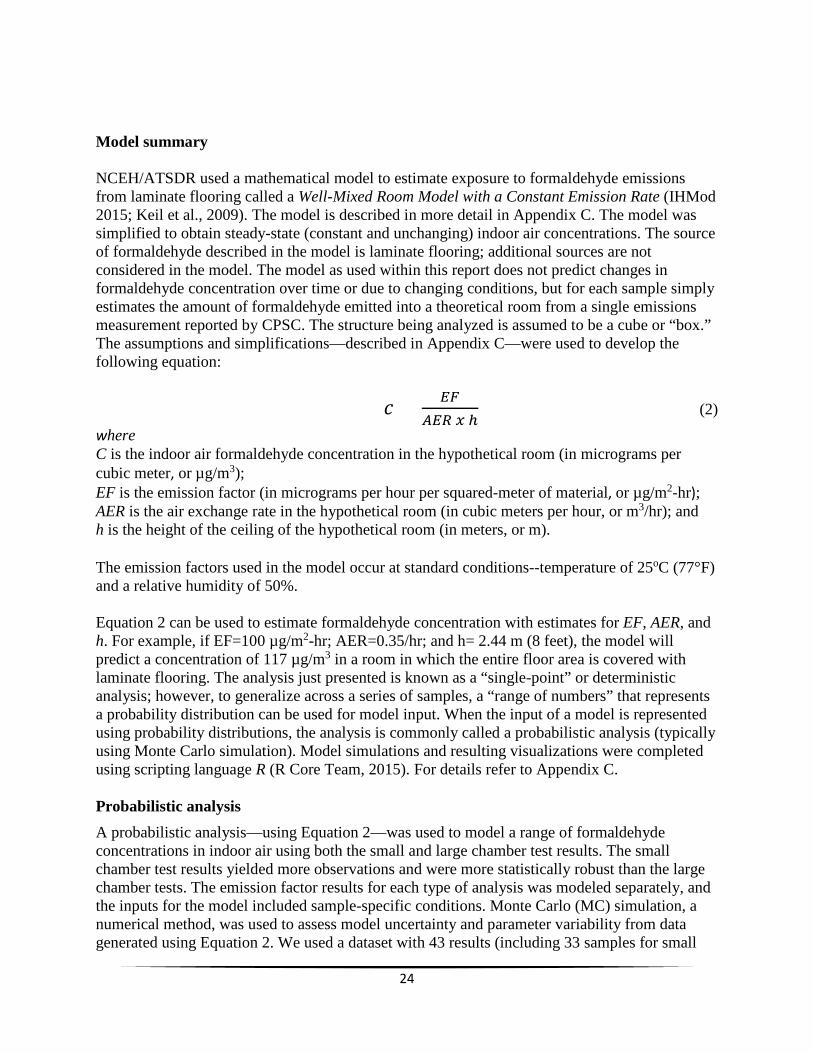
Model summary NCEH/ATSDR used a mathematical model to estimate exposure to formaldehyde emissions from laminate flooring called a Well-Mixed Room Model with a Constant Emission Rate (IHMod 2015; Keil et al., 2009). The model is described in more detail in Appendix C. The model was simplified to obtain steady-state (constant and unchanging) indoor air concentrations. The source of formaldehyde described in the model is laminate flooring; additional sources are not considered in the model. The model as used within this report does not predict changes in formaldehyde concentration over time or due to changing conditions, but for each sample simply estimates the amount of formaldehyde emitted into a theoretical room from a single emissions measurement reported by CPSC. The structure being analyzed is assumed to be a cube or “box.” The assumptions and simplifications—described in Appendix C—were used to develop the following equation:
𝑐𝑐 = 𝐸𝐸𝐸𝐸𝐴𝐴𝐸𝐸𝐴𝐴 𝑥𝑥 ℎ
(2) where C is the indoor air formaldehyde concentration in the hypothetical room (in micrograms per cubic meter, or µg/m3); EF is the emission factor (in micrograms per hour per squared-meter of material, or µg/m2-hr); AER is the air exchange rate in the hypothetical room (in cubic meters per hour, or m3/hr); and h is the height of the ceiling of the hypothetical room (in meters, or m). The emission factors used in the model occur at standard conditions--temperature of 25oC (77°F) and a relative humidity of 50%. Equation 2 can be used to estimate formaldehyde concentration with estimates for EF, AER, and h. For example, if EF=100 µg/m2-hr; AER=0.35/hr; and h= 2.44 m (8 feet), the model will predict a concentration of 117 µg/m3 in a room in which the entire floor area is covered with laminate flooring. The analysis just presented is known as a “single-point” or deterministic analysis; however, to generalize across a series of samples, a “range of numbers” that represents a probability distribution can be used for model input. When the input of a model is represented using probability distributions, the analysis is commonly called a probabilistic analysis (typically using Monte Carlo simulation). Model simulations and resulting visualizations were completed using scripting language R (R Core Team, 2015). For details refer to Appendix C. Probabilistic analysis A probabilistic analysis—using Equation 2—was used to model a range of formaldehyde concentrations in indoor air using both the small and large chamber test results. The small chamber test results yielded more observations and were more statistically robust than the large chamber tests. The emission factor results for each type of analysis was modeled separately, and the inputs for the model included sample-specific conditions. Monte Carlo (MC) simulation, a numerical method, was used to assess model uncertainty and parameter variability from data generated using Equation 2. We used a dataset with 43 results (including 33 samples for small

25
chamber testing and 10 samples for large chamber testing) provided by CPSC to generate some of the input for the model presented within this document. A full analysis of the dataset is presented in Appendix C, and a summary of the input parameters is listed in Table 4. NCEH/ATSDR conducted a Monte Carlo simulation using 100,000 realizations. A realization is a single simulation run representing a particular set of conditions or a potential outcome. A probabilistic analysis implements many realizations to simulate a large number of possible outcomes. The results from the probabilistic analysis can be summarized and interpreted using a probability of exceedance4 plot—see Figure 4 and Figure 5. The probability of exceedance can be interpreted as the percentage of the time emissions from this group of floorboards would likely exceed a specific concentration given the data provided by CPSC.5 For example, to use results shown in Figure 4 (small chamber results) and Figure 5 (large chamber results) to estimate the indoor air formaldehyde concentration likely to be exceeded in 5% of the homes containing the tested Chinese-manufactured floorboards sold by Lumber Liquidators®, NCEH/ATSDR used the following procedure:
1. Locate the 5% exceedance value at the y-axis. 2. Draw a horizontal line from the 5% y-axis value until it intersects with the probability type
curve (point A in Figures 4 and 5). 3. Draw a vertical line from point A (Figures 4 and 5) until it intersects the x-axis (in Figure
4, it intersects at 185 µg/m3; in Figure 5, it intersects at 930 µg/m3).
Table 4. Input parameter values used to simulate formaldehyde indoor air concentrations. Parameter Distribution Input Comments
Emission factor (EF) (small chamber)
Emission factor (EF) (large chamber)
Log-normal
meanlog=3.73; sdlog=0.85
meanlog=5.62; sdlog=0.59
The meanlog and sdlog are the mean and standard deviation; respectively, and converted to logarithmic scale of the small chamber CPSC data—all 33 samples were used in the analysis. The meanlog and sdlog are the mean and standard deviation; respectively, and converted to logarithmic scale of the large chamber CPSC data—all 10 samples were used in the analysis. The min and max correspond to the values published by Persily
Air exchange rate (AER) Uniform min=0.10;
max=1.21 (2010) for the 5th and 95th percentile range for single family (national average). Persily et. al. (2010) calculated infiltration rates and associated AERs using a multizone network airflow model (CONTAM) for 209 houses that represent 80% of U.S. housing.
Ceiling height NA NA (value of 2.44 meters feet] was used)
[8 Standard ceiling height obtained from US EPA (2011).
Note: NA, not applicable; rlnorm and runif are the random number generator (RNG) functions used in the scripting language R to run the probabilistic model; meanlog, sdlog, min, and max are the input values for the RNG functions; see Appendix C
Overall, our analyses suggest that expected concentrations may vary substantially depending on how the samples were tested. This yields two distinct ranges of potential formaldehyde levels (“low emission level” based on small chamber testing range and the “high emission level” based on large chamber testing range). We estimate that emissions from 95% of the samples
4 Probability of exceedance is defined as the complementary cumulative distribution function. 5 Note that CPSC samples were conditioned for 7 days in the chamber prior to analysis (ASTM Method 6007-14 requires 2 hours ± 15 minutes)

26
characterized by the CPSC data would be ≤ 185 µg/m3 for the “low emission level” range (smalchamber test results) and ≤ 930 µg/m3 for the “high emission level” range (large chamber test results). The inset tables in Figures 4 and 5 provide probability values for various indoor air formaldehyde concentrations.
Figure 4. Small chamber probabilistic model resulconcentration from laminate flooring emissions
ts of formaldehyde indoor air
l
Note: Point A represents the 95th percentile modeled concentration

27
Figure 5. Large chamber probabilistic model results of formaldehyde indoor air concentration from laminate flooring emissions
Note: Point A represents the 95th percentile modeled concentration Influence of model input parameters Input parameters to the model—Equation 1—are emission factor (EF), air exchange ratio (AER), and ceiling height (h). The results of the model can be visualized differently to show the effects of varying a specific parameter, such as the AER, in the simulated indoor air formaldehyde concentrations. Figure 6 shows formaldehyde concentration as a function of AER. Concentrations in this plot have been normalized to interpret the results as a percentage. In Figure 6, a room with a concentration of 100 units has an AER of 0.1/hr (point A). If the AER increases to 0.5/hr, the normalized concentration then would be about 20 units (point B). This can also be interpreted as an 80% reduction in concentration when the AER is increased from 0.1/hr to 0.5/hr. Furthermore, if the initial concentration is 20 units when the AER is 0.5/hr and the AER is increased to 1.0/hr, the resulting concentration would be about 10 units (point C). This can also be interpreted as an additional 10% decrease when the AER is changed from 0.5/hr to 1.0/hr. These results show that the AER does not have a linear effect on concentration. Figure 6 highlights different AERs, including the ASHRAE 62.2 standard (2013) AER of 0.35/hr, a low AER of 0.26/hr—representative of a “new and energy efficient” house built on or after 1990, and a high AER of 0.58/hr—representative of an “old and less energy efficient” house built on or before 1940. These AERs were obtained from the median value calculated by Persily et al (2010). Figure 6 highlights the importance of increasing air exchange within a home as a protective measure to reduce airborne formaldehyde levels.

28
Figure 6. Normalized formaldehyde indoor air concentration (dimensionless) for varying air change rates
Note: Point A shows the concentration modeled with an AER of 0.1/hr; Point B shows the indoor concentration modeled with an AER of 0.5/hr; Point C shows the indoor concentration modeled with an AER of 1.0/hr. The concentration modeled decreases substantially with increased air exchange in the home.
Other factors that can influence indoor air concentration include temperature and relative humidity. Berge et al. (1980), Pickrell et al. (1984), and Myers (1985) have reported the effect of temperature and relative humidity on formaldehyde concentration. Formaldehyde concentration for temperature and humidity are commonly corrected using the Berge equation (Berge et al., 1980, ASTM 2014a,b). The term “correction” has been criticized in the literature because it implies that the result is more accurate than the uncorrected value (Godish and Rouch, 1985). The error introduced by correction is small for small variations; however, the relative error can be as high as 11.5% and 42% for non-standard values of temperature and relative humidity, respectively (Myers, 1985). Tables 5 and 6—modified from ASTM (2014) and equivalent for both small and large chamber ASTM methods—provide correction factors for temperature and relative humidity. Because the available CPSC sample data are limited, we did not conduct specific analyses for the effect of temperature and relative humidity on the concentrations predicted by the model. Equation 1. The results (concentrations) provided in this report are at standard conditions (25oC [77°F]) and 50% relative humidity). If corrections are needed, they should be limited to ± 1oC (2°F) and ±4% relative humidity according to recommendations from ASTM (2014a,b).

29
Model limitations NCEH/ATSDR used a Well-Mixed Room Model with a Constant Emission Rate to calculate estimated indoor air concentrations from data generated from the CPSC Lumber Liquidator’s® laminate flooring samples. We assessed these estimated indoor air formaldehyde concentrations for their public health significance in residential settings. The dataset is limited due to the small sample size, resulting in considerable variability in emissions factors for the various floorboards. The laboratories tested eight discrete floorboard styles or brands, with two styles having two and three discrete samples analyzed, respectively. Thus, the sample size was small, limiting the possibility of generalizing the data to all Lumber Liquidator® floorboards manufactured in China. As with any mathematical model, the model used in this analysis has some limitations. Appendix C provides additional details of the assumptions and simplifications used in the model. However, the assumptions can be generalized as follows:
1. Turbulent conditions exist and/or mixing occurs rapidly. 2. Formaldehyde is not lost due to absorption or transformation. 3. Conditions (e.g., AER, emission factor) are not continuously changing over time. 4. The model represents steady state formaldehyde concentrations estimated from CPSC
emission rate data; it cannot estimate past or future levels.
This model assumes no sinks, a constant generation rate, a constant incoming contaminant concentration, and an equal airflow into and out of the box (room). These assumptions and limitations are significant. Research suggests that sinks are important in the potential indoor air concentrations of formaldehyde, especially when ambient conditions like ventilation rate, temperature, and humidity are considered. Not considering sinks overestimates indoor concentrations. The model assumed that concentrations are constant and uniformly distributed throughout the room. We also assumed that the flooring covered 100% of the floor surface, which would overestimate formaldehyde concentrations in homes with carpet or tile flooring in addition to the laminate flooring. Further, heated flooring (e.g., baseboard heaters) has the potential to increase formaldehyde emissions. We did not include this variable in the model due to a lack of reliable information in the literature about emission rates of formaldehyde from heated flooring.

30
Discussion and Health Implications In the following sections, NCEH/ATSDR discusses the potential health implications of residential exposure to the modeled indoor air formaldehyde levels off-gassing from the laminate flooring sampled by CPSC. A detailed assessment of toxicological data is provided in Appendix B to give context to the measured or modeled data. Screening of modeled data Small chamber results (the low emission range) indicate that 95% of the floorboards analyzed contributed up to 185 µg/m3 of additional formaldehyde to indoor environments. The remaining 5% of floorboards were likely to contribute more than 185 µg/m3. Large chamber results (the high emission range) indicate that 95% of the floorboards analyzed contributed up to 930 µg/m3 of additional formaldehyde to indoor environments. The remaining 5% of floorboards were likely to contribute more than 930 µg/m3. Indoor air concentration estimates are highly dependent on modeling parameters, including air exchange rate (AER), emissions factors, and ceiling height. Furthermore, variations in the formaldehyde content of the flooring style and individual manufacture lots also influence formaldehyde emissions that may occur in homes. Thus, the most likely range of indoor air formaldehyde levels in homes from the additional burden of laminate flooring releases is somewhere within this low (≤185 µg/m3) and high (≤930 µg/m3) concentration range depending on the age of the installed flooring and other housing characteristics. The actual concentration in a home is influenced by the board characteristics as well as the many factors discussed in the “Factors influencing indoor air concentrations of formaldehyde”, such as home age, air change rate, recent renovations, etc. (see page 11-15).
Health effects from formaldehyde exposure and the implications of potential exposures are discussed below. Health effects from formaldehyde exposure At high enough concentrations, formaldehyde is an irritant to the eyes and respiratory tissues. It is highly water soluble and is retained in moist layers of the nasal mucosa, which removes greater than 95% of formaldehyde from inhaled air (WHO, 2010). Several studies have determined that inhaled formaldehyde does not move beyond the nasal epithelium to reach distant sites in the body, even though some studies have reported an increase in leukemia with inhalation exposure to formaldehyde (Lu et al., 2010a, 2010b; Moeller et al., 2011; Swenberg et al., 2010). Formaldehyde is rapidly absorbed and metabolized in the nasal mucosa. Wolkoff and Nielsen (2010) reported that it is metabolized at such a rapid rate that 2,500 µg/m3 does not result in a significant increase of blood formaldehyde in either humans or animals, nor does it increase urinary formate excretion at 500 µg/m3 exposure. Because formaldehyde is efficiently removed from the body and does not accumulate, it acts primarily as an irritant at the site of contact. The odor threshold for formaldehyde in humans varies due to a number of issues, including age, gender, smoking status, and occupational history. Formaldehyde odor was reported to be perceived by 50% of individuals in a 31 person age-matched case-control study at 110 µg/m3
31
(Berglund et al., 2012), but others have noted that the odor threshold may range as low as 60 µg/m3 (Arts et al., 2006). Golden (2011) stated that, although some studies reported the detection of formaldehyde odor at concentrations lower than 110 µg/m3, no empirical data document a perception of odor in the absence of the perception of sensory irritation. Individuals who are older, who smoke, or whose sense of smell is compromised (e.g., from occupational exposure) may not smell formaldehyde until it reaches much higher concentrations (Wolkoff, 2013). The Department of Health and Human Services (DHHS) and the International Agency for Research on Cancer (IARC) have characterized formaldehyde as a known human carcinogen based on studies of inhalation exposure in humans and laboratory animals (ATSDR, 2008; IARC, 2009; NTP, 2014). Appendix B has a detailed summary of health studies that document the types of health effects caused by inhalation exposure to formaldehyde, including cancer and non-cancer effects. A very brief description of these studies is presented below. Implications of exposure to modeled formaldehyde concentrations NCEH/ATSDR estimated (modeled) indoor formaldehyde levels that may be in typical residential environments resulting from the off-gassing of laminate floorboards tested. NCEH/ATSDR’s analysis of small chamber test results from CPSC suggested that, in a lower emissions scenario, 95% of the time modeled indoor air formaldehyde concentrations were at or below 185 µg/m3 based on emission from the floorboards alone. Levels of formaldehyde estimated from large chamber tests suggested that, in a higher emissions scenario, 95% of the time modeled indoor air formaldehyde levels were at or below 930 µg/m3. Taking a conservative approach, NCEH/ATSDR then added the small- and large chamber-derived levels of modeled formaldehyde from new laminate flooring to the typical indoor air levels in new (more energy efficient, built after 1990) and older (less energy efficient, built before 1990) homes as reported in indoor air studies of formaldehyde. Small chamber modeled concentrations (“lower emissions scenario”): Typical average
indoor air formaldehyde levels are generally less than 60 µg/m3 in older homes and are at or below 240 µg/m3 in newer homes (ATSDR, 1999).6 The additional contribution of 185 µg/m3 formaldehyde to older home typical levels would increase formaldehyde levels in older, less energy efficient, unrenovated homes to approximately 245 µg/m3 or less. The addition to newer homes could result in a concentration approximately 425 µg/m3 or less.
Large chamber modeled concentrations (“higher emissions scenario”): As with small chamber testing, assuming the average indoor air formaldehyde levels are generally less than 60 µg/m3 in older homes and at or below 240 µg/m3 in newer homes, the additional contribution of 930 µg/m3 formaldehyde to typical home indoor air levels greatly increased formaldehyde levels in older, less energy efficient, unrenovated homes to at or below 990 µg/m3. The addition to newer homes could result in a concentration of at or below 1,170 µg/m3.
6 These average levels may have included sources such as laminate flooring.

32
These ranges are quite large; the results of NCEH/ATSDR’s analysis indicate a great deal of potential variability in the contributions of formaldehyde to indoor air from the tested floorboards. The conditions of the home where the boards are installed are also key to the potential accumulation of formaldehyde indoors. Thus, residents living in older, less energy efficient homes are less likely to be affected by formaldehyde emitted by the flooring, while those living in newer or newly renovated homes are more likely to be affected by the flooring. Many factors influence concentrations of indoor air pollutants. Beyond the amount and rate of formaldehyde released from the boards (emissions factor), the building’s air exchange rate has the greatest influence on indoor air levels of formaldehyde ̶ the higher the air exchange rate (AER), the lower the formaldehyde concentrations. Newer, more energy-efficient homes are built tighter and are more insulated to conserve energy, and by design have much lower air exchange rates. Older homes have much higher air exchange rates; less insulation in walls, windows, and floors results in less efficiency and more air loss. From our model results, air concentration of formaldehyde was reduced by 80% when the AER increased from 0.1 per hour to 0.5/hr. Higher temperatures and relative humidity inside the home, as well as the presence of new furniture, cabinets, flooring, and other new construction or renovation materials, may also increase residential exposure to formaldehyde. Furthermore, smoking indoors adds a substantial additional amount of formaldehyde to indoor air. Research suggests that formaldehyde levels in recently built or renovated homes decrease rapidly within the first year after installation of formaldehyde-containing materials (Brown, 2002; Park and Ikeda, 2006; Wolkoff et al., 1991) Potential health effects from exposure to estimated formaldehyde levels from CPSC laminate floorboard samples Non-cancer effects Scientific literature has established that formaldehyde causes irritant effects to the eyes, nose, and respiratory tract and may exacerbate asthma symptoms (ATSDR, 1999; ATSDR, 2010). The levels that cause health effects for individuals are highly variable depending on their age, occupation, and health status. Most formaldehyde exposure studies in the scientific literature are of healthy adult workers and are not representative of sensitive residential populations. Occupational studies generally indicate that irritant effects from exposure to formaldehyde begin at levels starting around 350 µg/m3, becoming more consistent at levels of 500 µg/m3 and higher (ATSDR 1999, ATSDR 2010). However, sensitive individuals who are exposed chronically in their homes (the elderly, children, asthmatics, and people with compromised cardiopulmonary systems) are more likely to experience health effects from formaldehyde exposure at lower levels than occupationally-exposed, healthy adults. Floorboards evaluated in this assessment may emit between 185 and 930 µg/m3 of formaldehyde to the indoor environment, resulting in an exposure high enough to cause irritant effects in sensitive and in normal, healthy individuals.

33
Some studies with relatively low exposure ranges have reported health impacts, such as Increased respiratory symptoms in children: Children exposed to indoor formaldehyde
levels above 60 µg/m3 had a 39% increased likelihood of hospital admissions for their asthmatic condition compared to children exposed to 10 µg/m3 (Rumchev et al., 2002). Children exposed to formaldehyde levels ranging from 75-150 µg/m3 experienced statistically significant increases in the prevalence of asthma and chronic bronchitis, especially in the presence of tobacco smoke (Krzyzanowski et al., 1990).
Sensory irritation: o Since odor perception and sensory irritation are often indistinguishable (Golden,
2011), studies of chemicals with relatively low odor thresholds (Arts et al., 2006, and Berglund et al., 2012) suggest a lower range concentration for the perception of sensory irritation. For formaldehyde, this may occur at concentrations between 30 and 110 µg/m3 (Kotzias et al., 2005).
o Kotzias et al. (2005) reported an eye, nose, and throat irritation threshold for formaldehyde of 100-600 µg/m3 in the general population, while Franklin et al. (2000) reported a statistically significant increase in exhaled nitric oxide from exposures greater than 60 µg/m3, indicating a subclinical inflammatory response in the airways of non-asthmatic children.
o Occupational studies have reported that formaldehyde ranges of 49-490 µg/m3, 90-5,470 µg/m3, and 190-11,250 µg/m3 are associated with viral/bacterial inflammation of the upper airways (Holstrom and Wilhelmsson, 1988), decreased lung function (Akbar-Khanzadeh et al., 1994; Akbar and Mlynek, 1999), and sensory irritation (Kim et al., 1999), respectively.
Table 7 provides a summary of the non-cancer health effect ranges used in this evaluation.
Table 7. Summary of non-cancer health effect ranges Concentration µg/m3 Population Comment Reference
600-1,200 General population Eye irritation threshold Kotzias et al., 2005 100-600 General population Nose and throat irritation threshold Kotzias et al., 2005
60-150 Asthmatic children Increased risk of hospitalizations in asthmatic children exposed to
an average 60 µg/m3 compared to non-asthmatic children exposed to 10 µg/m3 and greater prevalence of asthma and chronic
bronchitis in children exposed to 75-150 µg/m3
Rumchev et al., 2002 Krzyzanowski et al.,
1990
60 Non-asthmatic children
Increased exhaled nitric oxide concentrations indicating subclinical inflammatory response of the airways in children exposed to
formaldehyde at 60 µg/m3 and greater Franklin et al., 2000
30-110 General population Odor perception leading to sensory irritation Kotzias et al., 2005
Arts et al., 2006 Berglund et al., 2012
Without the added contributions of other indoor sources, the modeled 95th percentile of emissions from the CPSC floorboards tested in small chamber tests (185 µg/m3) and large chamber tests (930 µg/m3) exceed the odor threshold. Further, concentrations in this range could produce adverse effects, both in sensitive populations like asthmatic children (described above) and in the general population. These effects include eye, nose, throat, and respiratory irritation

34
and the exacerbation of pre-existing respiratory conditions. These effects would be most likely to occur in sensitive individuals beginning at lower concentrations, but the range of formaldehyde concentrations modeled could result in irritant effects for anyone in the general population. Installed, these floorboards could add a considerable amount of formaldehyde to homes where formaldehyde is already present from newer household materials and products that emit formaldehyde, increasing the likelihood of irritant effects and the worsening of respiratory conditions, such as asthma. Tobacco smoke contains significant amounts of formaldehyde. As mentioned previously, Marchand et al. (2006) reported that the mean formaldehyde concentration in a closed room of a house after 5 cigarettes was 217 µg/m3. Therefore, respiratory effects could be more pronounced in homes where occupants smoke. The impacts on asthmatic children from exposure to formaldehyde in the presence of tobacco smoke may also be substantially greater than impacts from formaldehyde exposure on children in non-smoking homes. Furthermore, evidence shows that smoking in the presence of formaldehyde exposures can compound the oxidative stress—the reduced ability to detoxify and repair damage from exposure to pollutants—experienced by the individual, leading to adverse health outcomes at lower concentrations than in individuals who are not exposed to tobacco smoke (Romanazzi et al., 2013).
Cancer effects Many conflicting studies have evaluated whether or not formaldehyde causes various cancers, but scientists generally accept that formaldehyde causes cancer of the nasopharynx, sinuses, and nasal cavity, as well as leukemia, particularly myeloid leukemia (IARC, 2012; NTP, 2014). However, studies of cancer development are usually conducted in animals or in large cohorts of workers exposed to high levels of formaldehyde for many years (such as embalmers and furniture factory workers). This type of exposure is not likely in a residence with laminate flooring, where emissions from the floorboards are expected to decrease to typical levels over a few years. NCEH/ATSDR calculated cancer risk using the 95th percentile of 185 µg/m3 to estimate the lower emissions level additional lifetime risk of cancer and the 95th percentile of 930 µg/m3 to estimate the higher emissions level additional lifetime risk for two years of exposure to emissions of formaldehyde of laminate flooring, as provided by CPSC and modeled by NCEH/ATSDR. These calculations are as follows (U.S. EPA 2009):
Inhalation Cancer Risk = IUR x EC x EF (3) where IUR = Inhalation Unit Risk (in (μg/m3) -1) EC = exposure concentration (μg/m3) EF = exposure fraction (unitless)

35
The inhalation unit risk (IUR) is a number developed by the U.S. EPA that is an upper-bound excess lifetime cancer risk estimated to result from continuous exposure to an agent concentration of 1 µg/m3 in air.7 This value for formaldehyde is currently 0.000013 per μg/m3. To estimate cancer risk from two years of continuous exposure to formaldehyde, we simply multiply the IUR value by our 95th percentile additional formaldehyde burden of 185 μg/m3 for the low emissions risk scenario and 930 μg/m3 for the high emissions risk scenario. The floorboards will not off-gas at current level over a lifetime (assumed to be 78 years). A two-year time frame was chosen because several studies have shown that indoor air concentrations of formaldehyde from new building products usually decrease over time, particularly during the first two years. In light of these assumptions, we adjusted the lifetime cancer risk posed by the floorboards (i.e., we assumed a two-year maximum exposure). We then adjusted for the fraction of lifetime exposure (2 years/78 years) for both the low emissions and the high emissions scenarios. Inhalation Low Emission (small chamber 95%) Cancer Risk (2 years) = 0.000013 (μg/m3) -1 * 185 μg/m3 x 2/78 years
= 0.00006 excess cancer risk (or the risk of about 6 cases out of a population of 100,000 people from exposure to formaldehyde from the off-gassing of laminate flooring). Inhalation High Emission (large chamber 95%) Cancer Risk (2 years) = 0.000013 (μg/m3) -1 * 930 μg/m3 x 2/78 years
= 0.0003 excess cancer risk (or the risk of about 30 out of 100,000 people from exposure to formaldehyde from the off-gassing of laminate flooring). These numbers represent a near worst-case (health conservative) scenario because we assumed that a resident was exposed 24 hours a day, 7 days a week to the modeled formaldehyde levels constantly over the two-year decay period. These assumptions yield an additional cancer risk of exposure to formaldehyde between 6 and 30 additional cases of cancer per 100,000 people exposed to floorboard emissions tested by CPSC. If we instead assume a constant formaldehyde decay rate over the same 2-year period, these cancer risks would be reduced by half. If elevated formaldehyde concentrations are assumed to persist beyond a 2-year period, then cancer risks would be proportionally increased.
To put those numbers in perspective, the American Cancer Society (http://www.cancer.org) estimates that the lifetime cancer risk for people living in the United States is one in two men (50,000 per 100,000 people) and one in three women who may develop cancer from all causes (33,333 per 100,000 people). 7 An example of how to interpret inhalation unit risk: if the unit risk is 0.000002 per µg/m³, 2 excess cancer cases (upper bound estimate) are expected to develop per 1,000,000 people if exposed daily for a lifetime to 1 µg of the chemical per m³ of air. The U.S. EPA IUR for formaldehyde (0.000013 per μg/m3) is the equivalent of the potential of 1.3 excess cancer cases developing in a population of 100,000 people if people are exposed daily for a lifetime to 1 µg of the chemical per m³ of air.

36
Odors and quality of life The NCEH/ATSDR modeling suggests that the formaldehyde concentrations contributed by the floorboards alone are above odor thresholds identified to be as low as 60 µg/m3 (Arts et al., 2006; Berglund et al., 2012). This odor impact could be greater if the floorboards were installed in homes that have other sources of formaldehyde and is likely to be greatest in new homes. Since the health impacts of noxious odors vary from individual to individual, direct impacts on health are difficult to measure. However, studies have established that exposure to unpleasant odors can adversely affect quality of life (ATSDR, 2015b). The odor threshold for formaldehyde in humans varies due to a number of factors, including age, gender, smoking status, and occupational history. Some studies have questioned whether the irritation threshold from formaldehyde exposure is defined by the odor of formaldehyde or from the perception of irritation, noting that at times people may experience sensory irritation prior to or along with the perception of formaldehyde odors (Golden, 2011). The presence of unpleasant odors in the home may cause stress, nausea, and headaches in addition to the irritant effects mentioned previously in the non-cancer health discussion. Thus, indoor formaldehyde odors from the CPSC-tested laminate flooring evaluated in this report may cause discomfort and a reduced quality of life. What residents can do If residents experience eye, nose, or throat irritation or an increase in respiratory symptoms only inside the home after floor installation or the installation of other building products containing formaldehyde resins, elevated levels of formaldehyde may be present. The only way to determine whether or not a home has unacceptable levels of formaldehyde indoors is to have the indoor air tested by a qualified professional, preferably using an active collection method that yields a specific concentration of formaldehyde in air, like U.S. EPA Method TO-11A (http://www.epa.gov/ttnamti1/files/ambient/airtox/to-11ar.pdf). Consumers should be aware that indoor air testing cannot identify the specific sources of formaldehyde in the indoor air; the testing merely assesses total formaldehyde concentration at the time of sampling. However, testing might provide supplementary information to assess a resident’s risk of experiencing health effects from formaldehyde levels when they are in their home. Summary
Many factors influence concentrations of indoor air pollutants. The building’s air exchange rate (AER) has the greatest influence on indoor air levels of formaldehyde ̶ the lower the AER, the higher the formaldehyde concentrations. Newer, more energy-efficient homes have a tighter construction to conserve energy and by design have much lower AERs. Older homes are the opposite, having much higher AERs, with air lost through a lack of efficiency due to less insulation and leakage in walls, windows, and floors. Higher temperatures and relative humidity inside the home, as well as the presence of new furniture, cabinets, flooring, and other new construction or renovation materials, will also increase residential exposure to formaldehyde. NCEH/ATSDR cannot generalize the impact of formaldehyde levels in laminate flooring products in all homes based on an analysis of a small number of samples. However, our evaluation suggests the following:

37
The additional formaldehyde from new laminate flooring in older homes may cause sensory irritation in the general population and exacerbate pre-existing health conditions in sensitive populations.
On average, newer homes are already in the range of sensory irritation (where eye, nose, and throat irritation may occur). However, over time, people can become desensitized to low level exposures. The addition of potentially high additional formaldehyde concentrations from new laminate flooring could provoke sensitization and symptoms.
Cigarette smoking contributes acute, high levels of formaldehyde to indoor air and can substantially increase occupant exposures (both from smoking and exposure to second hand smoke) and exacerbate other respiratory conditions. Smoking in general can make a person more susceptible to health effects from exposure to formaldehyde.
Floorboards installed in residential homes may cause irritation and possibly exacerbate respiratory health conditions when first installed, but formaldehyde levels and subsequent health effects are likely to subside by the time the off-gassing process nears its end.
Figure 7 shows effect levels vs. modeled floorboard levels alone and added to other household sources. Figure 7. Summary of modeled formaldehyde concentrations and health effect ranges*
*Note that indoor concentrations from the floorboards alone average 0-930 µg/m3.

38
Conclusions NOTE: Because of the small number of laminate flooring samples tested, these conclusions do not represent the range of all possible formaldehyde concentrations and should not be generalized to all laminate flooring manufactured during the period of concern. As a result of this evaluation, NCEH/ATSDR has come to the following conclusions: Health effects from estimated formaldehyde exposures Non-cancer effects Floorboard contributions The amount of formaldehyde released could cause health symptoms in residents. Those
symptoms include an increase in breathing problems and short-term eye, nose, or throat irritation. These symptoms are more likely to occur at lower concentrations for people with pre-existing health conditions like asthma or chronic obstructive pulmonary disease (COPD).
The higher the emissions the more likely people are to experience health effects, regardless of their age or pre-existing health conditions.
Flooring in small chamber tests had lower emission rates than flooring in large chamber tests. Across all testing, the NCEH/ATSDR model results show that in 95% of the samples, the amount of formaldehyde released by new laminate flooring alone could range from at or below 185 micrograms of formaldehyde per cubic meter of air (µg/m3) to at or below 930 µg/m3.
Floorboard contributions plus typical indoor levels Formaldehyde is a common indoor air pollutant found in almost every home in the
United States. It comes from manufactured wood products, permanent press fabrics, and other common household products. The typical amount of formaldehyde in indoor air ranges from a few µg/m3 to 240 µg/m3, with an average less than 50 µg/m3. This range includes lower levels in older, less energy efficient homes, and higher concentrations in newer or newly renovated homes (ATSDR 1999; ATSDR 2010).
NCEH/ATSDR added the estimated amount of formaldehyde released by new laminate flooring to typical home indoor air levels.
Our calculations show that if homes already contain new materials or products that release formaldehyde, the new floorboards could add a large amount of additional formaldehyde to what is already in the air from other sources. This additional amount of formaldehyde increases the risk for breathing problems as well as short-term eye, nose, and throat irritation for everyone.
Cancer effects We estimated the risk of cancer from the CPSC-tested flooring based on conservatively high exposure assumptions:
Installing flooring with the highest formaldehyde levels, and
Breathing in formaldehyde at those levels in the house all day long for two years.

39
Using these assumptions, we estimated the lifetime risk of cancer to be between 6 and 30 extra cases for every 100,000 people. Formaldehyde levels are higher when products are new and get lower over time. Several studies have shown that indoor air concentrations of formaldehyde from new building products usually decrease over time, particularly during the first two years. Even though levels reduce over time, we calculated lifetime risk very conservatively and in a manner that is most protective of health, assuming a constant 24-hour, 7-day a week exposure to the measured floorboard emissions for the entire 2-year off-gassing period. If we instead assume a constant formaldehyde decay rate over the same 2-year period, these cancer risks would be reduced by half. If formaldehyde concentrations are assumed to remain elevated after a two-year period, the cancer risks would be proportionally increased.
To put those numbers in perspective, the American Cancer Society (http://www.cancer.org) estimates that the lifetime cancer risk for people living in the United States is one in two men (50,000 per 100,000 people) and one in three women who may develop cancer from all causes (33,333 per 100,000 people).
Quality of life People can generally smell formaldehyde before being adversely affected by it. Formaldehyde released from laminate flooring at levels that individuals can smell may affect their quality of life. Exposure to the estimated formaldehyde levels discussed in this report may cause sensory irritation, nausea, stress, and headaches. Other factors affecting indoor formaldehyde levels Low air exchange rates and higher temperature and humidity have the greatest impact on
raising a building’s formaldehyde levels. Since tobacco smoke contains formaldehyde and lung irritants, such as particulate matter
and other volatile organic compounds (VOCs), respiratory effects from formaldehyde exposures are more pronounced in homes where residents smoke (Institute of Medicine [IOM], 2000).
Limitations These findings cannot be applied to other laminate flooring: These findings do not apply to all laminate wood floor boards because of the small
number of floorboard samples tested. These findings do not represent all Chinese-manufactured laminate flooring made during
the time frame of those tested by CPSC. These findings only apply to the 43 samples collected from Lumber Liquidators®
laminate flooring manufacture lots sampled by CPSC and analyzed by NCEH/ATSDR.
These findings are based on conservative (health protective) modeling assumptions
Formaldehyde is not lost due to adsorption or transformation.

40
The model represents steady state formaldehyde concentrations estimated from CPSC emission rate data
This model assumes no sinks, a constant generation rate, a constant incoming contaminant concentration, and an equal airflow into and out of the room.
The flooring covered 100% of the floor surface, which would overestimate formaldehyde concentrations in homes with carpet or tile flooring in addition to the laminate flooring.
Past and future exposure Formaldehyde emissions from laminate flooring decrease over time. The floorboard samples provided by CPSC were analyzed between six months and three years after the manufacture date. Since formaldehyde emissions decrease over time, formaldehyde emissions from the CPSC-tested floorboards were likely higher when they were first manufactured. No results of emissions testing over time are available. Therefore, NCEH/ATSDR cannot estimate past or future indoor formaldehyde concentrations or potential health impacts. While modeling or testing of emissions over time were not conducted, literature sources indicate that emissions rates of other products may decrease to typical steady-state indoor air levels after several years.
Recommendations Based on the above conclusions, NCEH/ATSDR recommends the following actions for residents who installed laminate flooring made in China between 2012 and 2014 and sold by Lumber Liquidators®. Residents should see a doctor trained in environmental medicine if they begin to experience symptoms or discomfort after the installation of new laminate flooring (or any product manufactured with formaldehyde) to determine if their symptoms are related to indoor air quality. Formaldehyde-related symptoms can include irritated eyes, nose, or throat and increased breathing problems for people with health conditions like asthma or chronic obstructive pulmonary disease (COPD). These symptoms would be more noticeable when residents are at home (see additional resources).
Residents can reduce exposure to formaldehyde by Opening windows (when possible) to let in fresh air, unless residents have asthma
triggered by outdoor air pollution or pollen. If opening windows is not possible, using non-ozone-producing air cleaners (like those with activated carbon filters or HEPA [High Efficiency Particulate Air]) filters8 can reduce exposure to these triggers;
Running exhaust fans in the kitchen and bathroom increase the draw of outdoor air into the home;
Maintaining the temperature and humidity inside the home at the lowest settings comfortable for the occupants;
8 Note: Air filters that only remove particulates (like dust and pollen) or air fresheners that release aerosols into the air to mask odors do not remove formaldehyde from indoor air. Further, with ozone-producing air purifiers, the ozone can react with other chemicals and produce formaldehyde. For that reason, they are not recommended for home use because they can cause breathing problems (IOM 2010).

41
Making the home smoke free. Tobacco smoke contains formaldehyde, so residents should not allow anyone to smoke in the home.
Using products without formaldehyde in future home improvement projects such as: o Furniture, wood cabinetry, or flooring made without urea-formaldehyde (UF)
glues; o Pressed-wood products that meet ultra-low emitting formaldehyde (ULEF) or no
added formaldehyde (NAF) requirements; o Products labeled “No VOC/Low VOC” (volatile organic compound); and o Insulation not based on UF foam.
Reducing formaldehyde from new products by: o Washing permanent-press clothing and curtains before using them; and o Letting new products, such as furniture, wood cabinetry, flooring made with urea-
formaldehyde, and pressed-wood products, release formaldehyde outside of the living space before installing or using them inside, for example, in a garage or on a patio. If possible, residents should keep these products out of their living space at least until they no longer smell a chemical odor.
Residents should consider the following before testing formaldehyde levels in their homes: Testing the air in their homes may not be needed, especially if the flooring was installed
several years ago. If residents recently installed laminate flooring and smell odors or experience symptoms
consistent with formaldehyde exposure only when they are in the home, they may want to consider testing their indoor air for formaldehyde.
Testing or sampling should be conducted by a professional with appropriate environmental credentials (such as a certified industrial hygienist [CIH], registered environmental health specialist/registered sanitarian [REHS/RS]). These professionals should use a federal reference sampling method and analysis that can measure the formaldehyde concentration, such as EPA TO-11A (http://www.epa.gov/ttnamti1/files/ambient/airtox/to-11ar.pdf).
Professional tests are expensive and do not identify which products are the largest sources of the formaldehyde in indoor air. Therefore, air sampling may not provide definitive information on whether the flooring is the major source of formaldehyde.
There are no standards for acceptable residential indoor formaldehyde levels in air. Residents should consider the following before removing this type of laminate flooring from their homes: If the flooring was installed several years ago, the levels of formaldehyde may have
returned to what is typically found in homes — so there may be no reason to remove it. However, if symptoms of formaldehyde exposure go away when residents leave their home, professional air testing may be a good idea. When the results come in, consult with a professional about what to do next.
Removing laminate flooring may release more formaldehyde into the home. Some new flooring may also release formaldehyde.

42
Consult a certified professional (such as a CIH or REHS/RS) before taking any action to remove the flooring.
Additional resources
• More information about formaldehyde health effects, indoor air quality, and laminate flooring is available at http://www.cdc.gov/nceh/formaldehyde/default.html. Healthcare provider resources are also available at this site.
• If residents think they have laminate flooring that is off-gassing high levels of formaldehyde, they should contact CPSC and file a report. Instructions for how to do so can be found at https://www.saferproducts.gov/CPSRMSPublic/Incidents/ReportIncident.aspx.
• Residents with health concerns can contact CDC at 1-800-CDC-INFO with questions about formaldehyde in laminate flooring.
• To find a clinic with a pediatrician or other healthcare provider who specializes in environmental medicine, residents should visit http://www.pehsu.net or http://www.aoec.org/.

43
References ACS. American Cancer Society. 2015a. Nasopharyngeal Cancer. http://www.cancer.org/cancer/nasopharyngealcancer/index. Accessed July 2015. ACS. American Cancer Society. 2015b. Nasal Cavity and Paranasal Sinus Cancer. http://www.cancer.org/cancer/nasalcavityandparanasalsinuscancer/index. Accessed July 2015. AIHA. 2009. Mathematical models for estimating occupational exposure to chemicals, Second edition. Fairfax, VA: American Industrial Hygiene Association. Akbar-Khanzadeh F. & Mlynek J. 1997. Changes in respiratory function after one and three hours of exposure to formaldehyde in non-smoking subjects. Occup Environ Med. 24: 296-300.
Akbar-Khanzadeh F., Vaquerano M., Akbar-Khanzadeh M., et al. 1994. Formaldehyde exposure, acute pulmonary response, and exposure control options in a gross anatomy laboratory. Am J Ind Med. 26: 61-75. Arts J., de Heer C., Woutersen R. 2006. Local effects in the respiratory tract: Relevance of subjectively measured irritation for setting occupational exposure limits. Int. Arch. Occup. Environ. Health. 79: 283-298. ASTM International. 2014a. Standard Test Method for Determining Formaldehyde Concentrations in Air from Wood Products Using a Small-Scale Chamber. West Conshohocken, PA: ASTM International. ASTM International. 2014b. Determining Formaldehyde Concentrations in Air and Emission Rates from Wood Products Using a Large Chamber. West Conshohocken, PA: ASTM International. ATSDR. (Agency for Toxic Substances and Disease Registry). 2015a. Formaldehyde and Your Health. http://www.cdc.gov/nceh/formaldehyde/. Accessed July 2015. ATSDR. (Agency for Toxic Substances and Disease Registry). 2015b. Environmental Odors. http://www.atsdr.cdc.gov/odors/faqs.html. Accessed January 2016. ATSDR (Agency for Toxic Substances and Disease Registry). 2010. Addendum to the Toxicological Profile for Formaldehyde. http://www.atsdr.cdc.gov/toxprofiles/formaldehyde_addendum.pdf. ATSDR (Agency for Toxic Substances and Disease Registry). 2008. Public Health Statement for Formaldehyde. http://www.atsdr.cdc.gov/ToxProfiles/tp111-c1-b.pdf. ATSDR (Agency for Toxic Substances and Disease Registry). 1999. Toxicological Profile for Formaldehyde. http://www.atsdr.cdc.gov/toxprofiles/tp111.pdf.

44
Ayer H. & Yeager D. 1982. Irritants in cigarette smoke plumes. Am J Public Health. 72 (11): 1283-5. Bari M., Kindzierski W., Wheeler A., Heroux M., et al. 2015. Source apportionment of indoor and outdoor volatile organic compounds at homes in Edmonton, Canada. Build and Environ. 90: 114-124. Berge A., Mellegaard B., Hanetho P., et al. 1980. Formaldehyde release from particleboard—Evaluation of a mathematical model. Holz als Roh- und Werkstoff. 38(7): 251-255. Berglund B., Hoglund A., Esfandabad H. 2012. A bisensory method for odor and irritation detection of formaldehyde and pyridine. Chem. Percept. 5: 146–157. Brown S. 2002. Volatile organic pollutants in new and established buildings in Melbourne, Australia. Indoor Air. 12: 55-63. Brown V., Crump D., Gavin M. 1996. Indoor air quality in homes: the Building Research Establishment Indoor Environment Study. Building Res. Establishment, BRE report BR 299. CARB (California Air Resources Board). 2008. Final Regulation Order, Airborne Toxic Control Measure to Control Formaldehyde Emissions from Compressed Wood Products. California Code of Regulations, §93120-93120.12, title 17. http://www.arb.ca.gov/regact/2007/compwood07/fro-final.pdf. CBS News. 2015. Lumber Liquidators linked to health and safety violations. Sixty Minutes, March 1, 2015 episode. http://www.cbsnews.com/news/lumber-liquidators-linked-to-health-and-safety-violations/. Accessed in June 2015. Chen W., Persily A., Hodgson A., et al. 2014. Area-specific airflow rates for evaluating the impacts of VOC emissions in U.S. single-family homes. Build and Environ 71: 204-211. Clarisse B., et al. 2003. Indoor aldehydes: measurement of contamination levels and identification of their determinants in Paris dwellings. Environ Res. 92: 245–253. (CPSC) Consumer Product Safety Commission. 1982. Press Release: CPSC Bans Urea Formaldehyde Foam Insulation (UFFI). Release Number: 82005. Date: March 01, 1982. http://www.cpsc.gov/en/Newsroom/News-Releases/1982/CPSC-Bans-Urea-Formaldehyde-Foam-Insulation-UFFI/ . Accessed June 2015. (CPSC) Consumer Product Safety Commission. 1981. Revised Carcinogenic Risk Assessment of UFFI: Estimates of Cancer Risk Due to Inhalation of Formaldehyde Released by UFFI. October 26, 1981. Dassonville C., Demattei C., Laurent A., et al. 2009. Assessment and predictor determination of indoor aldehyde levels in Paris newborn babies' homes. Indoor Air. 19: 314–23.

45
Dingle P. & Franklin P. 2002. Formaldehyde levels and the factors affecting these levels in homes in Perth, Western Australia. Indoor Built Environ. 11: 111–116. Fang L., Clausen G., Fanger, P. 1999. Impact of temperature and humidity on chemical and sensory emissions from building materials. Indoor Air. 9: 193–201. Franklin P., Dingle P., Stick S. 2000. Raised exhaled nitric oxide in healthy children is associated with domestic formaldehyde levels. Am J Respir Crit Care Med. 161(5): 1757–1759. Garrett M., Hooper M., Hooper B. 1997. Formaldehyde in Australian homes; levels and sources. Clean Air. 31(2): 28–32. Gilbert N., Guay M., Gavin D., et al. 2008. Air change rate and concentration of formaldehyde in residential indoor air. Atmos Environ. 42: 2474–2478. Gilbert N., Gavin D., Guay M., et al. 2006. Housing characteristics and indoor concentrations of nitrogen dioxide and formaldehyde in Quebec City, Canada. Environ Res. 102: 1–8. Gilbert N., Guay M., Miller D., et al., 2005. Levels and determinants of formaldehyde, acetaldehyde, and acrolein in residential indoor air in Prince Edward Island, Canada. Environ Res. 99: 11–17. Godish T. 2001. Regulatory and Non-Regulatory Initiatives: Section C, Formaldehyde. Indoor Environmental Quality. CRC Press: Boca Raton, FL. Print. Godish T. & Rouch J. 1985. An Assessment of the Berge Equation Applied to Formaldehyde Measurements under Controlled Conditions of Temperature and Humidity in a Mobile Home. J Air Poll Cont Assoc. 35(11): 1186-1187. Golden R. 2011. Identifying an indoor air exposure limit for formaldehyde considering both irritation and cancer hazards. Critical Reviews in Toxicology. 41(8): 672–721. Gonzalez-Flesca N., Cicolella A., Bates M., et al. 1999. Pilot study of personal, indoor and outdoor exposure to benzene, formaldehyde and acetaldehyde. Environ Sci Pollut Res Int. 6(2): 95-102. Gustafson P., Barregard L., Lindahl R., et al. 2005. Formaldehyde levels in Sweden: personal exposure, indoor and outdoor concentrations. J Expo Anal Env Epid. 15: 252–260. Gunschera J., Mentese S., Salthammer T., et al. 2013. Impact of building materials on indoor formaldehyde levels: Effect of ceiling tiles, mineral fiber insulation and gypsum board. Building and environment. 64(2013): 138-145.
Héroux M., Clark N., Van Ryswyk K., et al. 2010. Predictors of indoor air concentrations in smoking and non-smoking residences. Int J Environ Res Public Health. 2010 Aug;7(8): 3080-99.

46
Holmstrom M.& Wihelmsson B. 1988. Respiratory symptoms and pathophysiological effects of occupational exposure to formaldehyde and wood dust. Scand J Work Environ Health. 14: 306–311. IHMod (Version 0.209). (downloaded May 2015). Retrieved from https://www.aiha.org/get-involved/VolunteerGroups/Pages/Exposure-Assessment-Strategies-Committee.aspx. International Agency for Research on Cancer (IARC). (2012). Formaldehyde. Chemical Agents and Related Occupations. Vol. 100F. pp. 401-430. Lyon: WHO, IARC. http://monographs.iarc.fr/ENG/Monographs/vol100F/mono100F-29.pdf. Institute of Medicine (IOM). Clearing the Air. Washington, DC: National Academy Press, 2000. Institute of Medicine (IOM). Climate change, the indoor environment, and health. Washington, DC: National Academy Press, 2010. Järnström H., Saarela K., Kalliokoski P., et al. 2006. Reference values for indoor air pollutant concentrations in new, residential buildings in Finland. Atmos Environ. 40: 7178–7191. Jo W. & Sohn, J. 2009. The effect of environmental and structural factors on indoor air quality of apartments in Korea. Build Environ. 44: 1794–1802. Jurvelin J., Vartiainen M., Jantunen M. 2001. Personal exposure levels and microenvironmental concentrations of formaldehyde and acetaldehyde in the Helsinki metropolitan area, Finland. J Air Waste Manage Assoc. 51: 17–24. Kandelbauer A., Petek P., Medved S., et al. 2010. On the performance of a melamine–urea–formaldehyde resin for decorative paper coatings. Eur. J. Wood Prod. 68: 63–75. Keil C., Simmons C., Anthony T., & American Industrial Hygiene Association. 2009. Exposure Assessment Strategies Committee. Modeling Subcommittee. Mathematical models for estimating occupational exposure to chemicals (2nd ed.). Fairfax, VA: AIHA Press. Kim K., Jahan S., and Lee J. 2011. Exposure to formaldehyde and its potential human health hazards. J. Environ. Sci. Health Part C. 29(4): 277-299. Kim H., Kim Y., and Cho S. 1999. Formaldehyde exposure levels and serum antibodies to formaldehyde-human serum albumin of Korean medical students. Arch Environ Health. 54(2): 115–118. Kinney P., Chillrud S., Ramstrom S., et al. 2002. Exposures to multiple air toxics in New York City. Environ. Health Perspect. 110(4): 539–546. Kotzias D., Geiss O., Tirendi S., et al. 2009. Exposure to multiple air contaminants in public buildings schools and kindergartens – the European indoor air monitoring and exposure assessment AIRMEX study. Fresenius J. Anal. Chem. 18: 670–681.

47
Kotzias D., Koistinen K., Kephalopoulos S., et al. 2005. Critical Appraisal of the Setting and Implementation of Indoor Exposure Limits in the EU. The INDEX project: Final Report. EUR 21590 EN. EC DG JRC. Institute for Health and Consumer Protection. Physical and Chemical Exposure Unit. Krzyzanowsky M., Quackenboss J., Lebowitz M. 1990. Chronic respiratory effects of indoor formaldehyde exposure. Environ. Res. 52: 117–125. Lazenby V., Hinwood A., Callan A., et al. 2012. Formaldehyde personal exposure measurements and time weighted exposure estimates in children. Chemosphere. 88(8): 966-73. Liang W. & Yang X. 2013. Indoor formaldehyde in real buildings: Emission source identification, overall emission rate estimation, concentration increase and decay patterns. Build Environ. 69: 114-120. Liu W., Zhang J., Zhang L., et al. 2006. Estimating contributions of indoor and outdoor sources to indoor carbonyl concentrations in three urban areas of the United States. Atmos. Environ. 40 (12): 2202–2214. Lovreglio P., Carrus A., Iavicoli S., et al. 2009. Indoor formaldehyde and acetaldehyde levels in the province of Bari, South Italy, and estimated health risk. J. Environ. Monit. 11: 955–961. Lu K., Collins L., Ru H., et al. 2010a. Distribution of DNA adducts caused by inhaled formaldehyde is consistent with induction of nasal carcinoma but not leukemia. Toxicol Sci. 116: 441–451. Lu K., Moeller B., Doyle-Eisele M., et al. 2010b. Molecular dosimetry of N2-hydroxymethyl-dG DNA adducts in rats exposed to formaldehyde. Chem Res Toxicol. 24(2): 159–61. Lumber Liquidators. 2015. Flooring 101: Laminates. Accessed July 2015 from: http://www.lumberliquidators.com/ll/flooring/Flooring101?Wt.ad=RIGHTNAV_Flooring101. Copyright 2015. Marchand C., Le Calve´ S., Mirabel P., et al. 2008. Concentrations and determinants of gaseous aldehydes in 162 homes in Strasbourg (France). Atmospheric Environment. 42: 505–516. Marchand C., Bulliot B., Le Calve S., et al. 2006. Aldehyde measurements in indoor environments in Strasbourg (France). Atmos. Environ. 40: 1336–1345. McPhail S., 1991. Formaldehyde in homes. J Occ Health Safety. 7(2): 139–144. Moeller B., Lu K., Doyle-Eisele M., et al. 2011. Determination of N2-hydroxymethyl-dG adducts in nasal epithelium and bone marrow of non-human primates following 13CD2-formaldehyde inhalation exposure. Chem Res Toxicol. 24: 162–164.

48
Murphy M., Lando J., Kieszak S., et al. 2013. Formaldehyde levels in FEMA-supplied travel trailers, park models, and mobile homes in Louisiana and Mississippi. Indoor Air. 23: 134–141. Myers G. 1985. The effects of temperature and humidity on formaldehyde emission from UF bonded boards: a literature review. Forest Prod J. 35: 20–31. NTP (National Toxicology Program). 2014. Report on Carcinogens, Thirteenth Edition. Research Triangle Park, NC: U.S. Department of Health and Human Services, Public Health Service. http://ntp.niehs.nih.gov/pubhealth/roc/roc13/ NTP (National Toxicology Program). 2010. Final: Report on Carcinogens, Background Document for Formaldehyde. January 22, 2010. Department of Health and Human Services, Research Triangle Park. http://ntp.niehs.nih.gov/ntp/roc/twelfth/2009/november/formaldehyde_bd_final.pdf . Park J. & Ikeda R. 2006. Variations of formaldehyde and VOC levels during 3 years in new and older homes. Indoor Air. 16: 129–135. Park J. & Ikeda K. 2004 Exposure to the mixtures of organic compounds in homes in Japan. Indoor Air. 14: 413–420. Park J. & Fuji S. 1999. Evaluation of VOC emissions from solid building materials by diffusion model. The 8th International Conference on Indoor Air Quality and Climate, Vol. 5, 161–166. Park J. & Fuji S. 2000 Characteristics of volatile organic compounds emissions from solid building materials, Part 1 Study on the effect of environmental conditions on emissions from materials. J. Architect. Plann. Environ. Eng. (Trans. Architect. Inst. Jpn.). 536: 49–54. Persily A., Musser A., Emmerich S. 2010. Modeled infiltration rate distributions for U.S. housing. Indoor Air. 20(6): 473-485. Pickrell J., Griffis, L., Mokler B., et al. 1984. Formaldehyde release from selected consumer products: influence of chamber loading, multiple products, relative humidity, and temperature. Environmental Sci Technol. 18(9): 682-686. Plaisance H., Blondel A., Desauziers V., et al. 2013. Field investigation on the removal of formaldehyde in indoor air. Build. Environ. 70: 277-283. R Core Team. 2015. R: A language and environment for statistical computing. R Foundation for Statistical Computing, Vienna, Austria. http://www.R-project.org/. Raw G., Coward S., Brown V., et al. 2004. Exposure to air pollutants in English homes. J. Exposure Anal. Environ. Epidemiol. 14: S85–S94.

49
Romanazzi V., Pirro V., Bellisario V., et al. 2013. 15-F2t isoprostane as biomarker of oxidative stress induced by tobacco smoke and occupational exposure to formaldehyde in workers of plastic laminates. Sci Tot Environ, 442: 20-25. Rumchev K., Spickett J., Bulsara M., et al. 2002. Domestic exposure to formaldehyde significantly increases the risk of asthma in young children. Eur. Resp. J. 20: 403–408. Sakai K., Norbäck D., Mi Y., et al. 2004. A comparison of indoor air pollutants in Japan and Sweden: formaldehyde, nitrogen dioxide, and chlorinated volatile organic compounds. Environ Res. 94: 75–85. Salthammer T., Mentese S., Marutzky R. 2010. Formaldehyde in the indoor environment. Chem Rev. 110: 2536–2572. Salthammer T., Fuhrmann F., Kaufhold S., et al. 1995. Effects of Climatic Parameters on Formaldehyde Concentrations in Indoor Air. Indoor Air. 5: 120-128. Schleibinger H., Hott U., Marchl D., et al. 2001. VOC concentrations in Berlin indoor environments between 1988 and 1999. Gefahrst Reinhalt Luft. 61: 26–38. Serrano-Trespalacios P., Ryan L., Spengler J. 2004. Ambient, indoor and personal exposure relationships of volatile organic compounds in Mexico City Metropolitan Area. J. Exposure Anal. Environ. Epidemiol. 14: S118–S132. Sherman M. & Hodgson A. 2004. Formaldehyde as a basis for residential ventilation rates. Indoor Air. 14: 2–8.
Swenberg J., Lu K., Moeller B., et al. 2010. Endogenous versus exogenous DNA adducts: Their role in carcinogenesis, epidemiology and risk assessment. Toxicol Sci. 120 Suppl 1: S130-45. Tang X., Bai Y., Duong A., et al. 2009. Formaldehyde in China: production, consumption, exposure levels, and health effects. Environ Int. 35: 1210–24. U.S. EPA (United States Environmental Protection Agency). 2015. Formaldehyde. http://www2.epa.gov/formaldehyde. Last updated March 2015. U.S. EPA (United States Environmental Protection Agency). 2011. Exposure Factors Handbook: 2011 Edition. Washington, DC: U.S. Environmental Protection Agency, Office of Research and Development, National Center for Environmental Assessment, report EPA/600/R-090/052F; September 2011. U.S. EPA (United States Environmental Protection Agency). 2010. Toxicological Review of Formaldehyde: Inhalation Assessment, Volume III of IV, Quantitative Assessment, Major Conclusions in the Characterization of Hazard and Dose Response, and References. Washington, DC: report EPA/635/R-10/002A; June 2, 2010.
50
U.S. EPA (Environmental Protection Agency). 2009. Risk Assessment Guidance for Superfund (RAGS), Volume I: Human Health Evaluation Manual (Part F, Supplemental Guidance for Inhalation Risk Assessment). Washington, DC. EPA-540-R-070-002. January 2009. http://www.epa.gov/swerrims/riskassessment/ragsf/index.htm. Accessed July 2015. U.S. EPA (United States Environmental Protection Agency). Federal Register, May 23, 1984, "Formaldehyde: Determination of Significant Risk." 49 FR: 21898. Van Netten C., Shirtliffe C., Svec J. 1989. Temperature and humidity dependence of formaldehyde release from selected building materials. Bull Environ Contam Toxicol 42: 558–65. Weisel C., Junfeng Z., Turpin B., et al. 2005. Relationships of Indoor, Outdoor and Personal Air (RIOPA): Part I. Collection Methods and Descriptive Analyses. Boston, Health Effects Institute. Wiglusz R., Sitko E., Nikel G., et al.2002. The effect of temperature on the emission of formaldehyde and volatile organic compounds (VOCs) from laminate flooring – case study. Build. Environ. 37: 41-44.
Wolkoff P. 2013. Indoor air pollutants in office environments: Assessment of comfort, health, and performance. Int. J Hyg. Environ. Health. 216: 371– 394. Wolkoff P. & Nielsen G. 2010. Non-cancer effects of formaldehyde and relevance for setting an indoor air guideline. Environ. Int. 36: 788–799. Wolkoff P., Clausen P., Nielsen P., et al. 1991. The Danish Twin Apartment Study; Part I: formaldehyde and long-term VOC measurements. Indoor Air. 1: 478–90. WHO (World Health Organization). 2010.WHO Guidelines for Indoor Air Quality: Selected Pollutants. Geneva, Switzerland. http://www.euro.who.int/_data/assets/pdf_file/0009/128169/e94535.pdf. Xu J., Zhang J., Liu X., et al. 2012. Determination of partition and diffusion coefficients of formaldehyde in selected building materials and impact of relative humidity. J. Air Waste Manage. Assoc. 62(6): 671-679. Xu B., Aoyama K., Takeuchi M., et al. 2002. Expression of cytokine mRNAs in mice cutaneously exposed to formaldehyde. Immunol Lett. 84(1): 49–55. Zhang Y., Luo X., Wang X., et al. 2007. Influence of temperature on formaldehyde emission parameters of dry building materials. Atmos Environ. 41: 3203–3216. Zhang J., Zhang J., Chen Q. (2002) Effects of environmental conditions on the VOC sorption by building materials-part I: Experimental results, ASHRAE Transactions, 108, 273-282.

51
Appendix A. CPSC Data Results

52
Table A-1. CPSC Sample Testing Parameters* Conditioning Phase Testing Phase
Sample # Date of manufacture Date of test Temperaturea, RHb,
in °F in percent Temperaturec
in °F RHd,
in percent Time, in hr
Chamber volume (m³)
Air change rate (AC/hr)
Air flow rate (L/min)
Loading ratio, see notes
Q/A ratio, see notes
Small chamber (Test method D6007-14)e
1A
1B 1C
2A
2B
2C
3A
3B
3C
4A
4B
4C
5A 5B 5C 6A 6B 6C 7A 7B
7C
8A 8B 8C 9A 9B 9C
7/20/2014
7/20/2014 7/20/2014
8/10/2013
8/10/2013
8/10/2013
8/10/2013
8/10/2013
8/10/2013
8/10/2013
8/10/2013
8/10/2013
12/20/2014 12/20/2014 12/20/2014
9/7/2014 9/7/2014 9/7/2014
10/15/2014 10/15/2014
10/15/2014
6/12/2014 6/12/2014 6/12/2014 6/1/2012 6/1/2012 6/1/2012
5/27/2015
5/22/2015 5/18/2015
5/26/2015
5/22/2015
5/25/2015
5/27/2015
5/26/2015
5/25/2015
5/27/2015
5/26/2015
5/18/2015
5/26/2015 5/22/2015 5/18/2015 5/26/2015 5/22/2015 5/25/2015 5/27/2015 5/22/2015
5/18/2015
5/26/2015 5/26/2015
— 5/28/2015 5/22/2015 5/25/2015
70
75.5 75.2
70
75.5
75.2
70
75.2
75.2
70
75.2
75.2
70 75.5 75.2 70
75.5 75.2 70
75.5
75.2
70 75.2 75.2 70
75.5 75.2
50
52.4
50 50 52.4 50 50 54 50 50 54 50
50
52.4
50
50
52.4
50
50 52.4 50
50
54
50
50
52.4
50
78
76.1 77.4
77.3
77.5
78.5
78.7
76.4
78.7
79.1
76.2
77.5
77.7 77.2 78.3 77.4 77.1 78.1 77.2 76.3
77.2
77.6 77
77.8 77.9 77.1 78.3
50
49.7 48
50.2
50.1
48
50.6
49.9
48
50.5
49.2
49
50 49.3 46 50
47.4 50
50.1 50.7
49
50.2 50.6 50 50
48.4 48
2.5
1 0.5
2.5
1
0.5
2.5
1
0.5
2.5
1
0.5
2.5 1
0.5 2.5 1
0.5 2.5 1
0.5
2.5 1
0.5 2.5 1
0.5
0.20
0.07 0.12
0.20
0.07
0.12
0.20
0.07
0.12
0.20
0.07
0.12
0.20 0.07 0.12 0.20 0.07 0.12 0.20 0.07
0.12
0.20 0.07 0.12 0.20 0.07 0.12
0.5
4 0.5
0.5
4
0.5
0.5
4
0.5
0.5
4
0.5
0.5 4 0.5 0.5 4 0.5 0.5 4
0.5
0.5 4 0.5 0.5 4 0.5
1
1 1
1
1
1
1
1
1
1
1
1
1 1 1 1 1 1 1 1
1
1 1 1 1 1 1
—
1.04 1.39
—
1.04
1.39
—
1.04
1.39
—
1.04
1.39
— 1.04 1.39 — 1.04 1.39 — 1.04
1.39
— 1.04 1.39 — 1.04 1.39
1.172
— 1.172
1.172
—
1.172
1.172
—
1.172
1.172
—
1.172
1.172 —
1.172 1.172 —
1.172 1.172 —
1.172
1.172 —
1.172 1.172 —
1.172

53
Conditioning Phase Testing Phase
Sample # Date of manufacture Date of test Temperaturea, RHb,
in °F in percent Temperaturec
in °F RHd,
in percent Time, in hr
Chamber volume (m³)
Air change rate (AC/hr)
Air flow rate (L/min)
Loading ratio, see notes
Q/A ratio, see notes
10A 6/4/2012 5/28/2015 70 50 78.4 50.2 2.5 0.20 0.5 1 — 1.172 10B 6/4/2012 5/26/2015 75.2 54 77.2 49.3 1 0.07 4 1 1.04 — 10C 6/4/2012 5/18/2015 75.2 50 77.6 47 0.5 0.12 0.5 1 1.39 1.172 11A 7/1/2014 5/28/2015 70 50 77 50 2.5 0.20 0.5 1 — 1.172 11B 7/1/2014 5/26/2015 75.2 54 76.4 50.2 1 0.07 4 1 1.04 — 11C 7/1/2014 5/25/2015 75.2 50 77.7 47 0.5 0.12 0.5 1 1.39 1.172
Large chamber (Test method E1333)f
1A 7/20/2014 10/1/2015 74 50 77.2 51.6 1 24.0 0.5 1 0.13 —
1B 7/20/2014 10/7/2015 76.5 48 77.6 54.9 1 30.6 0.495 1 0.13 — 4A 8/10/2013 10/2/2015 74 50 77.1 50.8 1 24.0 0.5 1 0.13 —
4B 8/10/2013 10/8/2015 76.5 48 77.4 50.9 1 30.6 0.501 1 0.13 —
5A 7/20/2014 10/5/2015 70 50 77.1 51.2 1 24.0 0.5 1 0.13 —
5B 7/20/2014 10/6/2015 76.5 48 77.6 51.5 1 30.6 0.496 1 0.13 —
6A 9/7/2014 10/3/2015 70 50 77.2 50.9 1 24.0 0.5 1 0.13 — 6B 9/7/2014 10/2/2015 77.3 49.9 77.5 51.2 1 30.6 0.502 1 0.13 —
10A 6/4/2014 9/30/2015 70 50 76.8 50.2 1 24.0 0.5 1 0.13 —
10B 6/4/2014 10/1/2015 75.9 53.2 77.3 51.4 1 30.6 0.481 1 0.13 — *RH-relative humidity; hr-hour; L-liter; °F-Fahrenheit; ft-feet
Notes: All results are assumed to conform to ASTM 6007 or E1333, respectively. ATSDR did not verified independently the validity of the tests. ASTM 6007 specify a Q/A ratio of 1.172 ±2% m3/h air perm2 test area. ASTM E1333 specify a loading ratio of 0.13 ±2% ft2/ft3. Conditioning background concentration ranged from below the limit of quantitation (BLQ) to 0.01 parts per million. Test background concentration ranged from BLQ to 0.02 parts per million. Also, note that emissions at time of manufacture were likely greater than when tested; as discussed previously, formaldehyde emissions decrease rapidly over time. a ASTM 6007 specify a conditioning temperature of 75 ±5 °F b ASTM 6007 specify a conditioning relative humidity of 50 ±5 % c ASTM 6007 specify a test temperature of 77 ±2 °F d ASTM 6007 specify a test relative humidity of 50 ±4 % e All samples analyzed by the small chamber test (D6007) were subjected to a conditioning period of 168 hours (7 days). According to D6007, conditioning period of seven days; may give better correlation with Testing Method E1333. f All samples analyzed by the large chamber test (E1333) were subjected to a conditioning period of 168–169 hours (7 days).

54
Appendix B: Supplemental Health Effects Information
55
This Appendix presents a summary of available health studies of human exposures to formaldehyde for various exposure durations. It includes a discussion of cancer and non-cancer health effects to supplement and support the health implications summary presented in the body of the report. Non-cancer effects Sensory irritation of the eyes, nose, and throat are the most commonly reported non-cancer health effects caused by exposure to formaldehyde. Of these, eye irritation is believed to be the most sensitive endpoint of sensory irritation (Golden, 2011). Formaldehyde-induced sensory irritation of the upper airways begins with the triggering of sensory nerves (primarily the trigeminal nerve) at low concentrations, where the body is able to detoxify the tissues of the nose and upper airways. The odor threshold may or may not be reached before individuals experience irritant effects, depending on their sensitivity to odors. However, many studies have reported that odor detection of formaldehyde generally occurs before observable irritation of the eyes or upper respiratory tract (Golden, 2011). Short-term exposure (1-14 day exposure) Formaldehyde levels of 2,030 µg/m3 and greater resulted in more rapid eye blinking in study subjects (Xu et al., 2002). No statistically significant decreases in lung function were observed in healthy or asthmatic volunteers exposed to 2,460 µg/m3 for 3 hours (Kulle et al., 1993), to 2,460 µg/m3 for 3 hours (Kulle et al., 1987), to 490 µg/m3 for 1 hour (Ezratty et al., 2007), or to 610 µg/m3 for 4 hours with peak concentrations of 1,230 µg/m3 (Lang et al., 2008). However, in laboratory settings, lung function in student laboratory workers decreased with 2-3 hour time-weighted average exposures ranging from 90-5,470 µg/m3 (Akbar-Khanzadeh et al., 1994; Akbar and Mlynek, 1997). Kim et al. (1999) reported that 167 medical students exposed to formaldehyde from 190-11,250 µg/m3 during cadaver dissection practice experienced clinical symptoms that included eye soreness (92.8 %); lacrimation (watering eyes) (74.9 %); headaches (51.5 %); and rhinorrhea (runny nose) (50.3 %). Intermediate exposure (14-365 day exposure) Lang et al. (2008) exposed 21 healthy student and unemployed volunteers (11 males and 10 females, mean age of 26.3 years) to different concentrations of formaldehyde 4 hours/day, 5 days/week for 10 weeks. The researchers observed slight to moderate eye irritation with subjects exposed to 610 µg/m3. However, neither eye nor nasal irritation reported at 370 µg/m3 were validated by objective tests and both were believed to be related to anxiety and smell. The researchers observed no differences in nasal flow and resistance, pulmonary function, or reaction times. This study highlights the importance of distinguishing subjective perception and an objectively observed symptom, such as eye redness. Wolkoff (2013) notes that subjects have difficulty separating odor perception and sensory irritation at low concentrations. However, the author notes that Berglund (2012) observed that sensory irritation was perceived before odor in an assessment of formaldehyde exposure in 31 age-matched case-control study subjects. Multiple irritant symptoms have been reported in medical students exposed repeatedly to formaldehyde over 2-3 months. Eye, nose, and throat irritation symptoms reported by students exposed to 660-2,040 µg/m3 formaldehyde for 2.5 hours/week for 14 weeks decreased after 4 weeks, which suggests the development of exposure tolerance over time (Kriebel et al., 2001). Takahashi et al. (2007) evaluated health outcomes in 143 medical students exposed to 2,200–4,640 µg/m3 formaldehyde for 15 hours/week for 2 months. Clinical symptoms included skin irritation (27%), eye soreness (68%),

56
lacrimation (60%), eye fatigue (45%), rhinorrhea (38%), and throat irritation (43%). Students with a history of allergic rhinitis (31 of 143 students) complained of rhinorrhea and sneezing more often than students without a history of allergic rhinitis. Even at relatively low concentrations, formaldehyde can cause similar effects with repeated exposure. Wei et al. (2007) reported similar clinical symptoms in medical students exposed to a peak concentration of 890 µg/m3 of formaldehyde for 6-8 hours/day for 3 months. Takigawa et al. (2005) demonstrated that installing ventilation fans in a gross anatomy laboratory reduced the median personal formaldehyde exposure in medical students exposed over 2-3 months from 3,310 µg/m3 to 880 µg/m3, and consequently reduced the intensity of skin eczema and eye, nose, and throat irritation. This reduction may be a combined result of reduced exposure as well as increased formaldehyde tolerance with prolonged exposure noted by Kriebel et al. (2001). Long-term exposure (exposure for 1 year or longer) Clinical findings of upper respiratory tract inflammation were reported in 12 of 29 (41%) workers exposed to a mean formaldehyde concentration of 870 µg/m3 (range 640–1,920 µg/m3) for a mean exposure duration of 12.7 years (Lyapina et al., 2004). A history of frequent viral or bacterial inflammatory relapses of the upper respiratory tract were also reported in these formaldehyde-exposed workers. Holstrom and Wilhelmsson (1988) reported similar effects in formaldehyde exposed workers by, but the nasal and lower airways effects were latent in the exposed groups until 3-4 years after exposure commenced. The estimated exposure concentrations for these chemical and furniture factory workers ranged from 49 µg/m3 to 490 µg/m3 (ATSDR, 2010). A number of studies reported that pulmonary function was not affected in a number workers chronically exposed to ≤ 390 µg/m3 (Bracken et al., 1985); ≤ 3,600 µg/m3 (mean=85 µg/m3) (Horvath et al., 1988); and ≤ 1,000 µg/m3 (Holness and Nethercott, 1989) (ATSDR, 2010).
A few available studies evaluate the effects of formaldehyde exposure on child respiratory health. Franklin et al. (2000) reported no impact on pulmonary function on 224 healthy children, aged 6-13 years, when their homes had less than 61 µg/m3 of formaldehyde in indoor air, but did report a statistically significant increase in exhaled nitric oxide (eNO) in children living in homes with concentrations exceeding 61 µg/m3. The authors concluded that the elevated eNO is an indicator of subclinical inflammatory response in the airways of healthy children exposed to levels of formaldehyde greater than 61 µg/m3. A study of residential formaldehyde concentrations in homes of asthmatic children admitted to emergency rooms in Australia found that children who had formaldehyde concentrations in homes in this same range (≥60 µg/m3) had a 39% increased likelihood of admission to a hospital (Rumchev et al., 2002). Krzyzanowski et al. (1990) studied the relationship of chronic respiratory symptoms and pulmonary function to formaldehyde levels in the homes of 298 children aged 6-15 years and 613 adults. The authors reported that significantly greater prevalence rates of asthma and chronic bronchitis were found in children whose homes had concentrations of formaldehyde ranging from 75-150 µg/m3 than in those living in homes with lower concentrations. This trend was especially pronounced in children also exposed to tobacco smoke in the home. Peak expiratory flow rates decreased linearly with formaldehyde exposures in the homes. McGwin et al. (2010) conducted a meta-analysis of studies evaluating childhood asthma and quantitative formaldehyde exposure and identified 18 studies that met review criteria, including the aforementioned Franklin et al. (2000) and Rumchev et al. (2002) studies. However, upon further review, eight studies, including Franklin et al. (2000), were excluded because they were review articles (n=3); they were not

57
asthma-specific (n=3); or they did not include a reference or control group (n=2). Three of the remaining 10 studies did not include raw formaldehyde measurements and were not available for further analysis. The authors standardized the data and generated an odds ratio and 95% confidence interval for the association between asthma and a 10 µg/m3 unit increase in formaldehyde exposure. These studies included 5,930 participants, with 364 having asthma. The meta-analysis identified a 3% increase in asthma risk (p<0.0001) using a fixed effects model and a 17% increase in asthma risk using a random-effects model (p=0.016) for every 10 µg/m3 unit increase in formaldehyde. Further, those with the highest exposures reported in the studies (80 µg/m3) had 3.5 times higher odds of asthma compared to children with no formaldehyde exposure. In reviewing childhood asthma studies, Wolkoff and Nielson (2010) noted that many of these studies may be confounded because of the presence of co-pollutants known to be associated with asthma, such as combustion products (Rumchev et al., 2002), and that some studies have found no association at all between formaldehyde exposure and childhood asthma (Doi et al., 2003; Genuneit et al., 2007; Raaschou-Nielson et al., 2010; and Tavernier et al., 2006). Table 1 below shows the studies where formaldehyde concentrations were measured in the indoor residential environments and allergy/asthma morbidity of adults and children was assessed. Table 2 shows two clinical studies that included dosing patients with co-exposure of formaldehyde and an allergen to which the patients were allergic. The residential studies have some limitations that are acknowledged by the authors. These include small sample size, multiple indoor air quality (IAQ) exposures that might have served as confounders, and inability to measure exposures that could have occurred outside the home. These limitations notwithstanding, the studies detected statistically significant differences between formaldehyde concentrations in the home and adverse respiratory health outcomes (e.g. allergy/asthma symptoms and poor lung function). However, the conflicting results of the two clinical studies could be due to small sample size. Nonetheless, co-exposure of formaldehyde with allergens is common in real-world settings, and the mechanism of a synergistic irritant/allergic effect is biologically plausible. Table B-1. Epidemiologic studies on associations between formaldehyde concentrations and allergy/asthma outcomes.
First author (year)
Study description
Measure reported
Formaldehyde concentration
Allergy and asthma outcomes
Association Detected? (yes or no)
µg/m3 ppb
Krzyzanowski et al. (1990)
Children and adults (n= 202 households)
Mean (indoor) 31.9 26 Lung function test
Yes (children) Yes (adults, morning test
only)
Lovreglio et al.
(2009)
Children and adults (n=59 households)
Mean
(indoor)
16
13
Reported allergy symptoms
No
Norback et al.
(1995)
Adults (n=88 households)
Mean
(indoor)
29-nighttime symptoms
17-no nighttime symptoms
23.6
13.9
Reported asthma symptoms
Lung Function Test
Yes
No
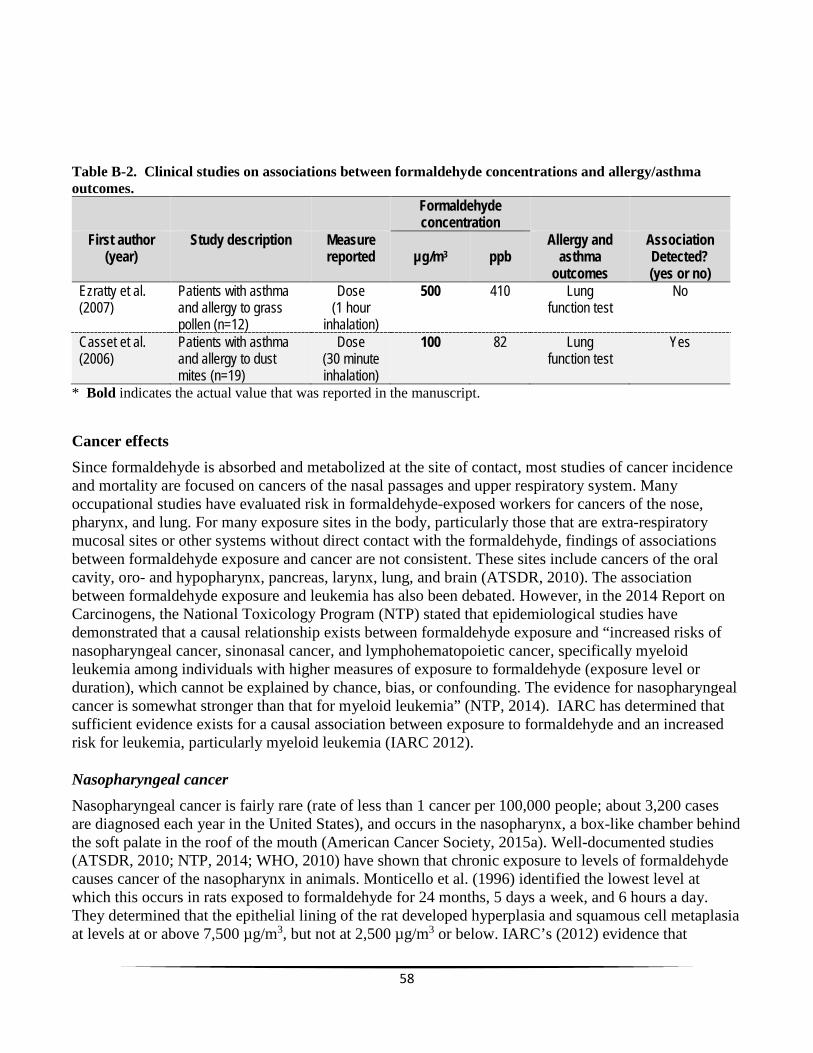
58
Table B-2. Clinical studies on associations between formaldehyde concentrations and allergy/asthma outcomes.
Formaldehyde
First author Study description Measure concentration
Allergy and Association (year) reported µg/m3 ppb asthma Detected?
outcomes (yes or no) Ezratty et al. Patients with asthma Dose 500 410 Lung No (2007) and allergy to grass (1 hour function test
pollen (n=12) inhalation) Casset et al. Patients with asthma Dose 100 82 Lung Yes (2006) and allergy to dust (30 minute function test
mites (n=19) inhalation) * Bold indicates the actual value that was reported in the manuscript.
Cancer effects Since formaldehyde is absorbed and metabolized at the site of contact, most studies of cancer incidenc
et
i
e
a
n
e
si
l
d
a
and mortality are focused on cancers of the nasal passages and upper respiratory system. Many occupational studies have evaluated risk in formaldehyde-exposed workers for cancers of the nose, pharynx, and lung. For many exposure sites in the body, particularly those that are extra-respiratory mucosal sites or other systems without direct contact with the formaldehyde, findings of associations between formaldehyde exposure and cancer are not consistent. These sites include cancers of the oralcavity, oro- and hypopharynx, pancreas, larynx, lung, and brain (ATSDR, 2010). The association between formaldehyde exposure and leukemia has also been debated. However, in the 2014 Report onCarcinogens, the National Toxicology Program (NTP) stated that epidemiological studies have demonstrated that a causal relationship exists between formaldehyde exposure and “increased risks ofnasopharyngeal cancer, sinonasal cancer, and lymphohematopoietic cancer, specifically myeloid leukemia among individuals with higher measures of exposure to formaldehyde (exposure level or duration), which cannot be explained by chance, bias, or confounding. The evidence for nasopharyngcancer is somewhat stronger than that for myeloid leukemia” (NTP, 2014). IARC has determined thasufficient evidence exists for a causal association between exposure to formaldehyde and an increasedrisk for leukemia, particularly myeloid leukemia (IARC 2012). Nasopharyngeal cancer Nasopharyngeal cancer is fairly rare (rate of less than 1 cancer per 100,000 people; about 3,200 casesare diagnosed each year in the United States), and occurs in the nasopharynx, a box-like chamber behthe soft palate in the roof of the mouth (American Cancer Society, 2015a). Well-documented studies (ATSDR, 2010; NTP, 2014; WHO, 2010) have shown that chronic exposure to levels of formaldehydcauses cancer of the nasopharynx in animals. Monticello et al. (1996) identified the lowest level at which this occurs in rats exposed to formaldehyde for 24 months, 5 days a week, and 6 hours a day. They determined that the epithelial lining of the rat developed hyperplasia and squamous cell metaplaat levels at or above 7,500 µg/m3, but not at 2,500 µg/m3 or below. IARC’s (2012) evidence that

59
formaldehyde exposure also causes nasopharyngeal cancer in humans is presented in seven case control studies, five of which found elevated risk for nasopharyngeal cancer (Vaughan et al., 1986a,b; Roush et al., 1987; West et al., 1993; Vaughan et al., 2000; Hildesheim et al., 2001). Human occupational and case-control studies are limited because 1) they generally do not report exposure levels over time, but are more descriptive in nature (e.g., whether a group of workers developed more of a certain type of cancer than would be expected in a population that size); and 2) these cohorts include very small numbers of cases because some cancers (e.g., nasopharyngeal), are extremely rare. Furthermore, meta-analyses of large cohort studies reached conflicting conclusions about an exposure-response relationship between formaldehyde exposure and nasopharyngeal cancers (Bosetti et al., 2008; Collins et al., 1997; Luce et al., 2002). The studies evaluated did, however, demonstrate excess aggregate relative risk for nasopharyngeal cancer in workers exposed to formaldehyde (e.g., relative risk of 1.2 [Blair et al., 1990]; relative risk of 2.0 [Partanen, 1993]). Bosetti et al. (2008) evaluated 16 cohort studies of workers and did not find elevated risk of oral and pharyngeal, sinonasal, or lung cancers. In general, while cancers of the nasopharynx are plausible based on animal studies, excess cancer of the nasopharynx has not been observed consistently across human cohort studies (ATSDR, 2010). Sinonasal cancer: “Sinonasal cancer” refers to cancer of the sinuses and nasal cavity. Like nasopharyngeal cancer, sinonasal cancer is a very rare cancer with less than 1 person in 100,000 diagnosed—about 2,000 cases each year in the United States (American Cancer Society, 2015b). Slight excess risk of cancer of the sinuses and nasal cavity were noted in two large cohort studies (relative risk of 1.1 [Blair et al., 1990]; relative risk of 1.1 [Partanen, 1993]). A meta-analysis of 16 occupational studies did not find an increased risk of developing sinonasal cancers from formaldehyde exposures (Bosetti et al., 2008). A meta-analysis (Luce et al., 2002) of 12 case-control studies of sinonasal cancer in occupational settings suggested a significantly increased risk of adenocarcinoma (a type of cancer that forms in mucus-secreting glands throughout the body). However, further evaluation by IARC questioned whether these cancers could have been caused by exposure to wood dust and not formaldehyde, since wood dust exposure is known to cause adenocarcinoma in the sinuses and nasal cavity. NTP (2014) notes that “increased risk of sinonasal cancer associated with formaldehyde exposure has been found among individuals with little or no exposure to wood dust or after adjustment for wood-dust exposure (Olsen et al., 1984; Hayes et al., 1986; Olsen and Asnaes, 1986). Some studies suggested that co-exposure to formaldehyde and wood dust had an interactive (synergistic) carcinogenic effect (Luce et al., 1993, 2002).” In general, like nasopharyngeal cancers, nasal cancers have not been observed consistently in the scientific literature. Lymphohematopoietic cancer: Large occupational studies have reported an association between formaldehyde exposures and leukemia (Walrath & Fraumeni, 1983, 1984; Levine et al., 1984; Stroup et al., 1986; Hayes et al., 1990; Hall et al., 1991; Hauptmann et al., 2003; Pinkerton et al., 2004). However, upon reanalysis or later follow-up, some studies have not continued to demonstrate a significant association over time or were not able to duplicate the findings of the initial studies (Beane Freeman et al., 2009; Marsh and Youk, 2004). Collins and Lineker (2004) conducted a meta-analysis of the findings of 18 occupational studies and did not find a causal association between formaldehyde exposure and leukemia. Several studies have questioned the biological plausibility of a causal relationship between formaldehyde exposure and the development of cancer, concluding that biological evidence to support such an association is inadequate (Gentry et al., 2013; Cole and Axten, 2004; Golden et al., 2006; Heck and Casanova, 2004). However, based on the results of a nested case–control study of workers in the funeral industry (Beane Freeman et al., 2009; Hauptmann et al., 2009), as well as three meta-analyses

60
(Bosetti et al., 2008; Zhang et al., 2009; Bachand et al., 2010), IARC has determined that sufficient evidence demonstrates a causal association between exposure to formaldehyde and an increased risk for leukemia, particularly myeloid leukemia (IARC 2012). References Akbar-Khanzadeh F. & Mlynek J. 1997. Changes in respiratory function after one and three hours of exposure to formaldehyde in non-smoking subjects. Occup Environ Med. 24: 296-300.
Akbar-Khanzadeh F., Vaquerano M., Akbar-Khanzadeh M., et al. 1994. Formaldehyde exposure, acute pulmonary response, and exposure control options in a gross anatomy laboratory. Am J Ind Med. 26: 61-75. ATSDR (Agency for Toxic Substances and Disease Registry). 2010. Addendum to the Toxicological Profile for Formaldehyde. http://www.atsdr.cdc.gov/toxprofiles/formaldehyde_addendum.pdf. Bachand A., Mundt K., Mundt D., et al. 2010. Epidemiological studies of formaldehyde exposure and risk of leukemia and nasopharyngeal cancer: a meta-analysis. Crit Rev Toxicol. 40: 85–100. Beane Freeman L., Blair A., Lubin J., et al. 2009. Mortality from lymphohematopoietic malignancies among workers in formaldehyde industries: the National Cancer Institute report. J. Natl. Cancer Institute. 101: 751–761. Berglund B., Hoglund A., Esfandabad H. 2012. A bisensory method for odor and irritation detection of formaldehyde and pyridine. Chem. Percept. 5: 146–157. Blair A., Saracci R., Stewart P., et al. 1990. Epidemiologic evidence on the relationship between formaldehyde exposure and cancer. Scand J Work Environ Health. 16: 381–393. Bosetti C., McLaughlin J., Tarone R., et al. 2008. Formaldehyde and cancer risk: A quantitative review of cohort studies through 2006. Ann Oncol. 19: 29–43. Bracken M., Leasa D., Morgan W. 1985. Exposure to formaldehyde: Relationship to respiratory symptoms and function. Can J Public Health. 76: 312–316. Cole P. & Axten C. 2004. Formaldehyde and leukemia: An improbable causal relationship. Regul Toxicol Pharmacol. 40(2): 107–112. Collins J. & Lineker G. 2004. A review and meta-analysis of formaldehyde exposure and leukemia. Regul Toxicol Pharmacol. 40: 81–91. Collins J., Acquavella J., Esmen N. 1997. An updated meta-analysis of formaldehyde exposure and upper respiratory tract cancers. J Occup Environ Med. 39: 639–651. Doi S., Suzuki S., Morishita M., et al. 2003. The prevalence of IgE sensitization to formaldehyde in asthmatic children. Allergy. 58: 668–71.
61
Ezratty V., Bonay M., Neukirch C., et al. 2007. Effect of formaldehyde on asthmatic response to inhaled allergen challenge. Environ Health Perspect. 115: 210–214. Franklin P., Dingle P., Stick S. 2000. Raised exhaled nitric oxide in healthy children is associated with domestic formaldehyde levels. Am J Respir Crit Care Med. 161(5): 1757–1759. Frew AJ, (1996). The immunology of respiratory allergies. Toxicology Letters. 86: 65-72. Gentry P., Rodricks J., Turnbull D. et al. 2013. Formaldehyde exposure and leukemia: Critical review and reevaluation of the results from a study that is the focus for evidence of biological plausibility. Crit Rev Toxicol. 43(8): 661–670. Genuneit J., Seifert B., Vogelberg C., et al. 2007. Formaldehyd und Asthma und Allergien im Kindersalter: Keine Evidenz für einen Zusammenhang 2007. Augsburg. 17–21 September 2007. Golden R. 2011. Identifying an indoor air exposure limit for formaldehyde considering both irritation and cancer hazards. Critical Reviews in Toxicology. 41(8): 672–721. Golden R., Pyatt D., Shields P. 2006. Formaldehyde as a potential human leukemogen: An assessment of biological plausibility. Crit Rev Toxicol. 36(2): 135–153. Hall A., Harrington J., Aw T. 1991. Mortality study of British pathologists. Am J Ind Med. 20: 83–89. Hauptmann M., Stewart P., Lubin J., et al. 2009. Morality from lymphohematopoietic malignancies and brain cancer among embalmers exposed to formaldehyde. J Natl Cancer Inst. 101: 1696-1708. Hauptmann M., Lubin J., Stewart P. et al. 2003. Mortality from lymphohematopoietic malignancies among workers in formaldehyde industries. J Natl Cancer Inst, 95: 1615–1623. Hayes R., Blair A., Stewart P., et al. 1990. Mortality of U.S. embalmers and funeral directors. Am J Ind Med. 18: 641–652. Hayes R., Raatgever J., de Bruyn A., et al. 1986. Cancer of the nasal cavity and paranasal sinuses, and formaldehyde exposure. Int J Cancer. 37: 487–492. Heck H. & Casanova M. 2004. The implausibility of leukemia induction by formaldehyde: A critical review of the biological evidence on distant-site toxicity. Regul Toxicol Pharmacol 40(2): 92–106. Hildesheim A., Dosemeci M., Chan C. et al. 2001. Occupational exposure to wood, formaldehyde, and solvents and risk of nasopharyngeal carcinoma. Cancer Epidemiol Biomarkers Prev. 10: 1145–1153. Holmstrom M. & Wihelmsson B. 1988. Respiratory symptoms and pathophysiological effects of occupational exposure to formaldehyde and wood dust. Scand J Work Environ Health. 14: 306–311. Holness D. & Nethercott J. 1989. Health status of funeral service workers exposed to formaldehyde. Arch Environ Health. 44: 222–228.

62
Horvath E., Anderson H., Pierce W., et al. 1988. Effects of formaldehyde on the mucous membranes and lungs: A study of an industrial population. JAMA. 259: 701–707. International Agency for Research on Cancer (IARC). (2012). Formaldehyde. Chemical Agents and Related Occupations. Vol. 100F. pp. 401-430. Lyon: WHO, IARC. http://monographs.iarc.fr/ENG/Monographs/vol100F/mono100F-29.pdf. Kim K., Jahan S., Lee J. 2011. Exposure to formaldehyde and its potential human health hazards. J. Environ. Sci. Health Part C. 29(4): 277-299. Kim H., Kim Y., Cho S. 1999. Formaldehyde exposure levels and serum antibodies to formaldehyde-human serum albumin of Korean medical students. Arch Environ Health. 54(2): 115–118. Kriebel D., Myers D., Cheng M., et al. 2001. Short-term effects of formaldehyde on peak expiratory flow and irritant symptoms. Arch Environ Health. 56(1): 11–18. Krzyzanowsky M., Quackenboss J., Lebowitz M. 1990. Chronic respiratory effects of indoor formaldehyde exposure. Environ. Res. 52: 117–125. Kulle T. 1993. Acute odor and irritation response in health nonsmokers with formaldehyde exposure. Inhal Toxicol. 5: 323–332. Kulle T., Sauder L., Hebel J., et al. 1987. Formaldehyde dose-response in healthy nonsmokers. J Air Pollut. Control Assoc. 37: 919–924. Lazenby V., Hinwood A., Callan A., et al. 2012. Formaldehyde personal exposure measurements and time weighted exposure estimates in children. Chemosphere. 88(8): 966-73. Levine R., Andjelkovich D., Shaw L. 1984. The mortality of Ontario undertakers and a review of formaldehyde-related mortality studies. J Occup Med. 26: 740–746. Lovreglio P., Carrus A., Iavicoli S., et al. 2009. Indoor formaldehyde and acetaldehyde levels in the province of Bari, South Italy, and estimated health risk. J. Environ. Monit. 11: 955–961. Lu K., Collins L., Ru H., et al. 2010a. Distribution of DNA adducts caused by inhaled formaldehyde is consistent with induction of nasal carcinoma but not leukemia. Toxicol Sci. 116: 441–451. Lu K., Moeller B., Doyle-Eisele M., et al. 2010b. Molecular dosimetry of N2-hydroxymethyl-dG DNA adducts in rats exposed to formaldehyde. Chem Res Toxicol. 24(2): 159–61. Luce D., Leclerc A., Begin D., et al. 2002. Sinonasal cancer and occupational exposures: A polled analysis of 12 case-control studies. Cancer Causes Control. 13: 147–157. Luce D., Gerin M., Leclerc A., et al. 1993. Sinonasal cancer and occupational exposure to formaldehyde and other substances. Int J Cancer. 53: 224–231.

63
Lyapina M., Zhelezova G., Petrova E., et al. 2004. Flow cytometric determination of neutrophil respiratory burst activity in workers exposed to formaldehyde. Int Arch Occup Environ Health. 77(5): 335–340. Marsh G. & Youk A. 2004. Reevaluation of mortality risks from leukemia in the formaldehyde cohort study of the National Cancer Institute. Regul Toxicol Pharmacol. 40(2): 113–124. McGwin G. Jr., Lienert J., Kennedy, J. Jr. 2010. Formaldehyde exposure and asthma in children: A systematic review. Environ Health Perspect. 118 (3): 313–317. Moeller B., Lu K., Doyle-Eisele M., et al. 2011. Determination of N2-hydroxymethyl-dG adducts in nasal epithelium and bone marrow of non-human primates following 13CD2-formaldehyde inhalation exposure. Chem Res Toxicol. 24: 162–164. Monticello T., Morgan K., Evritt, J. et al. 1989. Effects of formaldehyde gas on the respiratory tract of rhesus monkeys. Pathology and cell proliferation. Amer. J Pathol. 134: 515–527. NTP (National Toxicology Program). 2014. Report on Carcinogens, Thirteenth Edition. Research Triangle Park, NC: U.S. Department of Health and Human Services, Public Health Service. http://ntp.niehs.nih.gov/pubhealth/roc/roc13/. NTP (National Toxicology Program). 2010. Final: Report on Carcinogens, Background Document for Formaldehyde. January 22, 2010. Department of Health and Human Services, Research Triangle Park. http://ntp.niehs.nih.gov/ntp/roc/twelfth/2009/november/formaldehyde_bd_final.pdf . Olsen J. & Asnaes S. (1986). Formaldehyde and the risk of squamous cell carcinoma of the sinonasal cavities. Br J Ind Med. 43: 769–774. Olsen J., Jensen S., Hink M., et al. (1984). Occupational formaldehyde exposure and increased nasal cancer risk in man. Int J Cancer. 34: 639–644. Partanen T. 1993. Formaldehyde exposure and respiratory cancer—a meta-analysis of the epidemiologic evidence. Scand J Work Environ Health. 19: 8–15. Pinkerton L., Hein M., Stayner L. 2004. Mortality among a cohort of garment workers exposed to formaldehyde: an update. Occup Environ Med. 61: 193–200. Raaschou-Nielsen O., Northman Hermansen M., Loland L., et al. 2010. Long-term exposure to indoor air pollution and wheezing symptoms in infants. Indoor Air. 20: 159–67. Romanazzi V., Pirro V., Bellisario V., et al. 2013. 15-F2t isoprostane as biomarker of oxidative stress induced by tobacco smoke and occupational exposure to formaldehyde in workers of plastic laminates. Sci Tot Environ, 442: 20-25. Roush G., Walrath J., Stayner L. et al. 1987. Nasopharyngeal cancer, sinonasal cancer, and occupations related to formaldehyde: a case-control study. J Natl Cancer Inst, 79: 1221–1224.

64
Rumchev K., Spickett J., Bulsara M., et al. 2002. Domestic exposure to formaldehyde significantly increases the risk of asthma in young children. Eur. Resp. J. 20: 403–408. Stroup N., Blair A., Erikson G. 1986. Brain cancer and other causes of death in anatomists. J Natl Cancer Inst. 77: 1217–1224. Swenberg J., Lu K., Moeller B., et al. 2010. Endogenous versus exogenous DNA adducts: Their role in carcinogenesis, epidemiology and risk assessment. Toxicol Sci. 120 Suppl 1: S130-45. Takahashi S., Tsuji K., Fuji K., et al. 2007. Prospective study of clinical symptoms and skin test reactions in medical students exposed to formaldehyde gas. J Dermatol. 34(5): 283–289. Takigawa T., Usami M., Yamasaki Y., et al. 2005. Reduction of indoor formaldehyde concentrations and subjective symptoms in a gross anatomy laboratory. Bull Environ Contam Toxicol. 74(6): 1027–1033. Tavernier G., Fletcher G., Gee I., et al. 2006. IPEADAM study: indoor endotoxin exposure, family status, and some housing characteristics in English children. J Allergy Clin Immun. 117: 656–62. Vaughan T., Stewart P., Teschke K. et al. 2000. Occupational exposure to formaldehyde and wood dust and nasopharyngeal carcinoma. Occup Environ Med. 57: 376–384. Vaughan T., Strader C., Davis S., et al. 1986a. Formaldehyde and cancers of the pharynx, sinus and nasal cavity: I. Occupational exposures. Int J Cancer. 38: 677–683. Vaughan T., Strader C., Davis S., et al. 1986b. Formaldehyde and cancers of the pharynx, sinus and nasal cavity: II. Residential exposures. Int J Cancer. 38: 685–688. Walrath J. & Fraumeni J. Jr. 1984. Cancer and other causes of death among embalmers. Cancer Res. 44: 4638–4641. Walrath J. & Fraumeni J. Jr. 1983. Mortality patterns among embalmers. Int J Cancer. 31: 407–411. Wei C., Harada K., Ohmori S., et al. 2007. Subjective symptoms of medical students exposed to formaldehyde during a gross anatomy dissection course. Int J Immunopathol Pharmacol. 20(2): 23-25. West S., Hildesheim A., Dosemeci M. 1993. Non-viral risk factors for nasopharyngeal carcinoma in the Philippines: results from a case-control study. Int J Cancer, 55: 722–727. Wolkoff P. & Nielsen G. 2010. Non-cancer effects of formaldehyde and relevance for setting an indoor air guideline. Environ. Int. 36: 788–799. WHO (World Health Organization). 2010.WHO Guidelines for Indoor Air Quality: Selected Pollutants. Geneva, Switzerland. http://www.euro.who.int/_data/assets/pdf_file/0009/128169/e94535.pdf.

65
Xu B., Aoyama K., Takeuchi M., et al. 2002. Expression of cytokine mRNAs in mice cutaneously exposed to formaldehyde. Immunol Lett. 84(1): 49–55. Zhang Y., Luo X., Wang X., et al. 2007. Influence of temperature on formaldehyde emission parameters of dry building materials. Atmos Environ. 41: 3203–3216.

66
Appendix C: Modeling Analysis

67
MODELING INDOOR AIR QUALITY FROM FORMALDEHYDE EMISSIONS OF CHINESE-MANUFACTURED LAMINATE FLOORING PRODUCTS
Introduction
In a letter dated March 4, 2015, Senator Bill Nelson (Florida) requested that the Consumer Product Safety Commission (CPSC) determine if Chinese-manufactured laminate flooring products—specifically products from Lumber Liquidators® as seen on the television program 60 Minutes—present an unreasonable risk to consumers. In response to Senator Nelson’s letter, the CPSC has requested the Agency for Toxic Substances and Disease Registry’s (ATSDR) assistance in estimating indoor air formaldehyde (HCOH) concentrations in homes containing the Chinese-manufactured laminate flooring products sold by Lumber Liquidators®. This report describes ATSDR’s technical assistance response, which assesses the variability of indoor air formaldehyde concentrations using a modeling approach. Data analyses and modeled (simulated) indoor air HCOH concentrations are presented. This report has been prepared by the Exposure-Dose Reconstruction Program (EDRP), which is part of the Science Support Branch, Division of Community Health Investigations at ATSDR.
Data: Summary and Exploratory Analysis The CPSC provided ATSDR with two sets of Chinese-manufactured laminate flooring chamber-test data. Table C1 summarizes the dataset provided by the CPSC to ATSDR. Owing to the scope of work requested by the CPSC from ATSDR, the EDRP did not conduct a complete and thorough review of the CPSC-provided data, sampling protocols, testing methodologies, or analysis standards of the data listed in Table C1. The datasets and respective analyses will be referred in this report as small chamber and large chamber. A cursory review was conducted, however, to obtain selected modeling parameter values required to quantify indoor air HCOH concentrations. All flooring product samples were analyzed by the ASTM 6007 standard (ASTM 2014a) or E1333 and HCOH chamber-test concentrations were measured using the NIOSH 3500 method (NIOSH 2015) as required by ASTM 6007.9
The CPSC data provided to ATSDR (Table C1) were analyzed and visualized using the scripting language R (R Core Team 2015)10. The parameter of interest obtained from a chamber-test dataset required for a modeling approach is the emission factor (EF)11. The emission factor is calculated using the following equation (Kelly 1999; ASTM 1333): 𝐸𝐸𝐸𝐸 = 𝐶𝐶 𝑁𝑁
𝐿𝐿 (1)
where,
𝐸𝐸𝐸𝐸 is the emission factor12 [M/L2/T], 𝐶𝐶 is concentration in the test chamber at steady state [M/L3],
9 Laboratory reports for the large chamber datasets do not provide information about the analytical methods used to test HCOH. 10 R scripts and corresponding input files used for the analyses presented in this report are available upon request from ATSDR. 11 In the literature and the data provided by CPSC to ATSDR, the term emission factors and emission rates are sometimes used interchangeably. In this report, emission factor is used to maintain consistency with the data provided by CPSC. The values provided are rates and have units of micrograms per square meter per hour. 12 Units designations where M is mass (e.g., mg), L is length (e.g., meter), and T is time (e.g., hr).

68
𝑁𝑁 is the air exchange rate in the chamber [T-1], and 𝐿𝐿 is the product loading rate in the chamber [L2/L3].
In the original datasets—files listed in Table C1, data for the small chamber CPSC dataset are identified by the “CPSC Sample #” and by the name of the contract laboratory. These identifiers presented in this report—sample identification numbers—correspond to internal ATSDR identifiers. The sample identification number represents the manufacturer lot where the sample was obtained from. The sample identification number in the large chamber dataset correspond to the same manufacturing lot as the dataset from the small chamber. Figure C1 shows sample HCOH concentrations in parts per million (ppm) from the small chamber tests for each of the 11 samples (1 per package) for each laboratory (total of 33 samples). For reference, an error bar of 0.02 ppm is plotted for each sample because the ASTM 6007 standard provides a repeatability (within laboratory) precision of up to 0.02 ppm. Note, each CPSC-contracted laboratory tested different samples (e.g. a different board from each product box). Figure C1 shows four samples analyzed by Laboratory A where the error bar ranges do not overlap results from the other two laboratories. Figure C2 shows the results for the large chamber dataset. The emission factors (EF) for all samples are provided in the dataset received by ATSDR and are summarized in Table C2.
Modeling Methods ATSDR used an analytical model coupled with probabilistic analyses to estimate the range of possible indoor air HCOH concentrations in a residential setting. The model description, resulting mathematical equations, and a brief introduction to probabilistic analysis are described below.
Model Description The mathematical model used by ATSDR to estimate HCOH indoor air concentrations from Chinese-manufactured laminate flooring is known in the literature as a Well-Mixed Room Model with a Constant Emission Rate (IHMod 2015; Keil et al. 2009). The conceptual model can be visualized as a box (i.e., a “room”) where the flow in and out of the room are considered to be equal (𝑄𝑄𝑖𝑖𝑖𝑖 = 𝑄𝑄𝑜𝑜𝑜𝑜𝑜𝑜) and the concentration in the room (i.e., the “box”) is instantaneously and uniformly mixed (Figure C3). An equation expressing the HCOH concentration (Ct) in the box at time t is developed using a mass balance approach. For a detailed description of the mass balance approach and governing equations, refer to Keil (2009) or Masters (1998). The resulting equation, as provided in IHMod (2015) is:
𝐶𝐶𝑜𝑜 = 𝐺𝐺+𝐶𝐶𝑖𝑖𝑖𝑖𝑄𝑄𝑄𝑄+𝑘𝑘𝐿𝐿𝑉𝑉
�1 − 𝑒𝑒𝑒𝑒𝑒𝑒 �−𝑄𝑄+𝑘𝑘𝐿𝐿𝑉𝑉𝑉𝑉
𝑡𝑡�� + 𝐶𝐶0𝑒𝑒𝑒𝑒𝑒𝑒 �−𝑄𝑄+𝑘𝑘𝐿𝐿𝑉𝑉
𝑉𝑉𝑡𝑡� (2)
where,
Ct is the HCOH concentration at time t [M/L3], G is the generation rate (M/T), Cin is the background HCOH concentration (M/L3), Q is the ventilation rate of the room (L3/T), V is the volume of the room (L3), kL is the loss mechanism value (1/T), and t is time (T).

69
Equation 2 provides a mathematical description (analytical solution to governing equations) of time dependent indoor air concentration. Thus, Equation (2) is referred to as an unsteady- or transient-state model. A typical plot of HCOH concentration versus time using Equation (2) provides the following insight about model (Figure C4). The concentration increases early in time and then begins leveling off. The time to reach steady state is dependent on the volume of the room and the ventilation rate. Theoretically, Equation (2) never reaches steady-state (i.e., concentration change is zero) because the exponential terms never reach zero. However, as time approaches a very long duration or infinity, the change in the air concentration within the box (i.e., room) becomes negligible, and therefore, steady-state can be assumed.
Because the chamber-test data provide emission rates for only one point in time, it is not possible to estimate the loss mechanism value (kL) over time without introducing substantial uncertainty. Therefore, if the following assumptions are made: (1) background HCOH concentration is zero (𝐶𝐶𝑖𝑖𝑖𝑖 = 0), (2) initial concentration in the room is zero (𝐶𝐶0 = 0), (3) steady-state conditions (t→∞, therefore the exponential terms of Equation (2) approach zero), and (4) the losses are negligible or zero (𝑘𝑘𝐿𝐿 = 0), Equation 2 reduces to: 𝐶𝐶𝑆𝑆𝑆𝑆 = 𝐺𝐺
𝑄𝑄 (3)
where, 𝐶𝐶𝑆𝑆𝑆𝑆 is the steady-state HCOH concentration. By substituting in the definitions: 𝐺𝐺 = 𝐸𝐸𝐸𝐸 × 𝐴𝐴, (4a) where, G is the generation rate, EF is the emission factor, A is the room/floor area, and 𝐴𝐴𝐸𝐸𝐴𝐴 = 𝑄𝑄/𝑉𝑉, (4b) where, AER is the air exchange rate, Q is the ventilation rate, V is the room volume, and 𝑉𝑉 = 𝐴𝐴 × ℎ (4c) where, A is the floor/room area and h is the ceiling height, Equation 3 becomes: 𝐶𝐶𝑆𝑆𝑆𝑆 = 𝐸𝐸𝐸𝐸
𝐴𝐴𝐸𝐸𝐴𝐴×ℎ (5)
Equation 5 can be used to calculate the steady-state indoor air HCOH concentration, which is now a function of emission factor (EF), air exchange rate (AER), and ceiling height (h). For the ATSDR analysis using the limited amount of CPSC-provided data, an estimate of steady-state concentrations derived using Equation (5) is deemed of sufficient complexity. For example, using typical values for the parameters in Equation (5)—EF=100 µg/hr/m2; AER=0.35/hr; and h= 2.44 m (8 feet), the model estimates an indoor air HCOH concentration of 117 µg/m3, which represents a specific or deterministically derived concentration for single-valued parameter estimates. Conceptually, the deterministic analysis is shown in Figure C5a. Probabilistic Analysis The analysis described above is known as a “single-point” or deterministic analysis because each parameter is assigned a known or estimated single value resulting in a “single-valued” computation of

70
concentration using Equation (5). In reality, the input parameters cannot be described by a single number owing to uncertainty (lack of knowledge as to the “true” value) and variability (range of values)—(Figure C5b). Probability distribution functions (PDFs) can be used to describe model-input parameter values. When it is necessary to represent model input-parameter values using PDFs the resulting analysis is commonly referred to as a probabilistic analysis (Figure C5). As described in Maslia et al. (2007), a number of methods are available for conducting a probabilistic analysis. These methods can be grouped as follows: (1) analytical solutions for moments, (2) analytical solutions for distributions, (3) approximation methods for moments, and (4) numerical methods. The probabilistic analysis conducted for the ATSDR analysis of indoor air HCOH concentrations (e.g., Equation (5)) used a numerical method—Monte Carlo (MC) simulation—to assess model uncertainty and parameter variability. Readers interested in specific details about these methods and about probabilistic analysis in general should refer to the following references: Cullen and Frey (1999), Tung and Yen (2005), and U.S. EPA (1997). MC simulation is a computer-based (numerical) method of analysis that uses statistical sampling techniques to obtain a probabilistic approximation to the solution of a mathematical equation or model (U.S. EPA 1997). The MC simulation method is used to simulate probability density functions (PDFs). PDFs are mathematical functions that express the probability of a random variable (variant or model input parameter) falling within some known or estimated interval. MC simulations and resulting visualizations were conducted using scripting language R [R Core Team (2015)]. For the ATSDR MC analyses, 100,000 simulations or realizations were conducted, which provide an ample number of realizations to simulate the PDFs13. Results obtained using the MC simulation can be used in the form of a frequency distribution that describes the probability of specific indoor air HCOH concentration occurring. Using this information, a number of statistical properties and graphs can be generated. As described by Maslia and Aral (2004), epidemiologists and health scientists are interested in obtaining information on the probability that a person or population was exposed to a contaminant exceeding a given criteria or health guideline. For example, the probability that homeowners who installed Chinese-manufactured laminate flooring were exposed to indoor air containing HCOH concentrations exceeding a specific indoor air quality standard. To address this issue, MC simulation results described above can be presented in the form of the complementary cumulative probability function. The complementary cumulative probability function describes the probability of exceeding a certain value or answers the question: how often is a random variable (for example, the concentration of HCOH in indoor air) above a certain value? Model Assumptions and Limitations The Well-Mixed Room Model with a Constant Emission Rate used in the ATSDR analyses has a number of assumptions and some limitations. These assumptions and limitations are described below: Turbulent conditions exists and/or mixing occurs rapidly. HCOH is not lost due to absorption or transformation. The model does not include any sinks. Conditions (e.g., air exchange rate, emission factors) are not continuously changing over time.
13 Additional MC analysis was conducted using 1,000,000 realizations or simulations to test for solution sensitivity. Results of those analyses indicated concentration changes of less than 1 µg/m3 at the mean, 5th and 95th percentile values. Therefore, MC simulations using 100,000 realizations were deemed sufficiently stable for the analyses described herein.
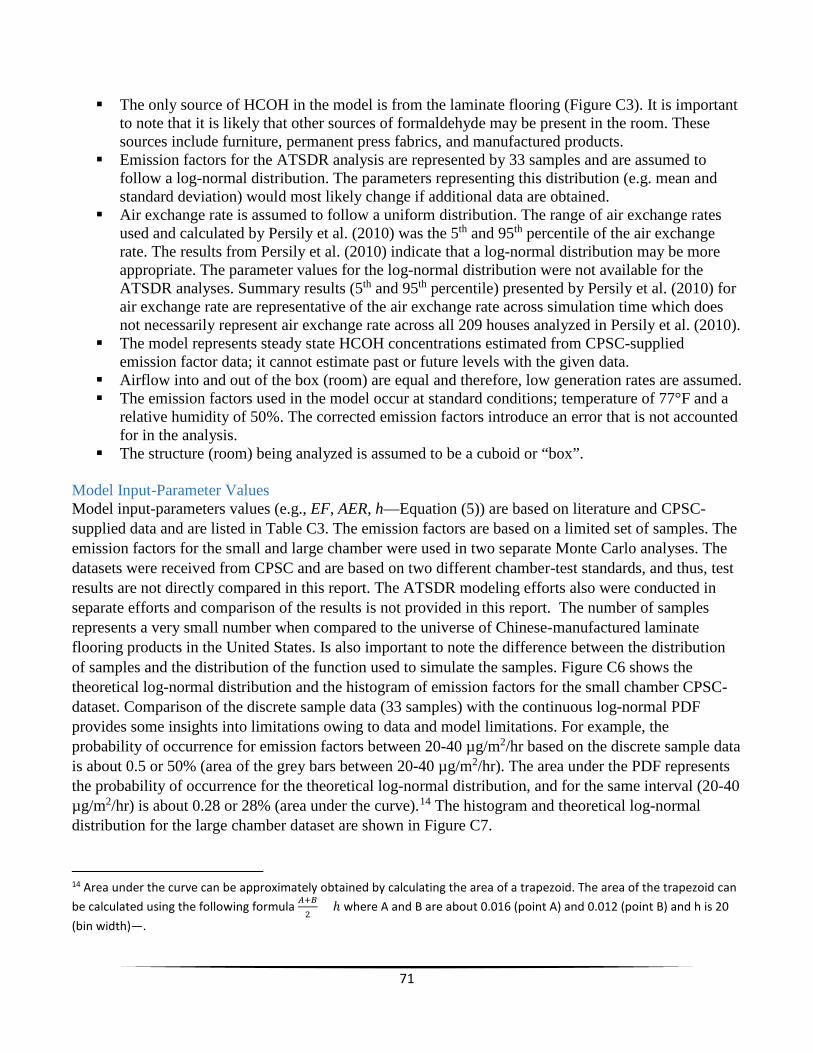
71
The only source of HCOH in the model is from the laminate flooring (Figure C3). It is important to note that it is likely that other sources of formaldehyde may be present in the room. These sources include furniture, permanent press fabrics, and manufactured products.
Emission factors for the ATSDR analysis are represented by 33 samples and are assumed to follow a log-normal distribution. The parameters representing this distribution (e.g. mean and standard deviation) would most likely change if additional data are obtained.
Air exchange rate is assumed to follow a uniform distribution. The range of air exchange rates used and calculated by Persily et al. (2010) was the 5th and 95th percentile of the air exchange rate. The results from Persily et al. (2010) indicate that a log-normal distribution may be more appropriate. The parameter values for the log-normal distribution were not available for the ATSDR analyses. Summary results (5th and 95th percentile) presented by Persily et al. (2010) for air exchange rate are representative of the air exchange rate across simulation time which does not necessarily represent air exchange rate across all 209 houses analyzed in Persily et al. (2010).
The model represents steady state HCOH concentrations estimated from CPSC-supplied emission factor data; it cannot estimate past or future levels with the given data.
Airflow into and out of the box (room) are equal and therefore, low generation rates are assumed. The emission factors used in the model occur at standard conditions; temperature of 77°F and a
relative humidity of 50%. The corrected emission factors introduce an error that is not accounted for in the analysis.
The structure (room) being analyzed is assumed to be a cuboid or “box”.
Model Input-Parameter Values Model input-parameters values (e.g., EF, AER, h—Equation (5)) are based on literature and CPSC-supplied data and are listed in Table C3. The emission factors are based on a limited set of samples. The emission factors for the small and large chamber were used in two separate Monte Carlo analyses. The datasets were received from CPSC and are based on two different chamber-test standards, and thus, test results are not directly compared in this report. The ATSDR modeling efforts also were conducted in separate efforts and comparison of the results is not provided in this report. The number of samples represents a very small number when compared to the universe of Chinese-manufactured laminate flooring products in the United States. Is also important to note the difference between the distribution of samples and the distribution of the function used to simulate the samples. Figure C6 shows the theoretical log-normal distribution and the histogram of emission factors for the small chamber CPSC-dataset. Comparison of the discrete sample data (33 samples) with the continuous log-normal PDF provides some insights into limitations owing to data and model limitations. For example, the probability of occurrence for emission factors between 20-40 µg/m2/hr based on the discrete sample data is about 0.5 or 50% (area of the grey bars between 20-40 µg/m2/hr). The area under the PDF represents the probability of occurrence for the theoretical log-normal distribution, and for the same interval (20-40 µg/m2/hr) is about 0.28 or 28% (area under the curve).14 The histogram and theoretical log-normal distribution for the large chamber dataset are shown in Figure C7.
14 Area under the curve can be approximately obtained by calculating the area of a trapezoid. The area of the trapezoid can be calculated using the following formula 𝐴𝐴+𝐵𝐵
2× ℎ where A and B are about 0.016 (point A) and 0.012 (point B) and h is 20
(bin width)—.

72
Results The results from the model are presented using two approaches. The probabilistic analysis provides a range15 of the likely indoor air HCOH concentrations and the probability of exceedance for specific values. To ascertain the effect of changing the value of one model-input parameter (e.g., air exchange rate) on the resulting model-output parameter (i.e., indoor air HCOH concentrations) a sensitivity analysis is conducted. Results for both the probabilistic and sensitivity analyses are discussed below.
Probabilistic Analysis Results
Applying the MC simulation to Equation (5) results in 100,000 random values of indoor air HCOH concentrations. This approach was completed twice; once using the small chamber dataset and once using large chamber dataset; results are shown in Figure C8 (small chamber-test) and Figure C9 (large chamber-test). Figure C8 and Figure C9 present results in the form of the complementary probability distribution function or a probability of exceedance graph for HCOH concentrations. The probability of exceedance can be interpreted—taking into account the assumptions and limitations of the data and model—as the percentage of floorboards with similar Chinese-manufactured laminate flooring product that would likely exceed a specific concentration.16
For example, to use results provided in Figure C8 to estimate the indoor air HCOH concentration likely to be exceeding in 5% of the floorboards modeled with Chinese-manufactured laminate flooring products, the following procedure is used:
1. locate the 5% exceedance value at the y-axis; 2. draw a horizontal line from the 5% y-axis value until it intersect with the probability type curve
(point A in Figure C8); and 3. draw a vertical line from point A (Figure C8) until it intersects the x-axis (in this example 185
µg/m3).
Therefore, 5% of floorboard samples will have exceeded an indoor air HCOH concentration of 185 µg/m3. Alternatively, 95% of floorboards sampled will have an indoor air HCOH concentration of less than 185 µg/m3. Using the results for the large chamber dataset, a similar approach is used, resulting in an estimate that 5% of floorboard samples will have exceeded an indoor air concentration of 929 µg/m3.
Sensitivity Analysis Results The effects of varying model-input parameters was also evaluated in a one-at-time sensitivity analysis. This analysis provides some insight on the effect of the model-input parameter variation on simulated indoor air HCOH concentrations. Model-input parameters are (Equation 5) emission factor (EF), air exchange rate (AER) and ceiling height (h).
Figure C10 shows HCOH concentration as a function of AER. Concentrations in this plot have been normalized by the concentration at an AER of 0.1 per hour. By normalizing the concentration, the results 15 The term range in this sentence is used to refer to a set of variable results and it does not imply a mathematical or statistical range (i.e., the maximum value minus the minimum value). 16 It should be noted that the probabilities presented in this analysis are not the “true” probability but an estimate of the probability based on the model and assumptions.

73
can be interpreted in terms of percent (0%–100%). In Figure C10, a typical room (in a house with Chinese-manufactured laminate flooring product) with a concentration of 100 units has an AER of 0.1/hr (point A). If the AER increases to 0.5/hr, the normalized HCOH concentration then would be about 20 units (point B). This can also be interpreted as an 80% reduction in concentration when the AER is increased from 0.1 to 0.5. Furthermore, if the initial concentration is 20 units when the AER is 0.5 and the AER is increased to 1.0 then the resulting concentration would be about 10 units (point C). This can also be interpreted as an additional 10% decrease when the air exchange rate is changed from 0.5 to 1.0. These results demonstrate that the AER does not have a linear effect on resulting indoor air HCOH concentration. Figure C10 highlights different AERs, including the ASHRE 62.2 standard (2013), a low AER of 0.26—representative of a “new and energy efficient” house built on or after 1990, and a high AER of 0.58—representative of an “old and less energy efficient” house built on or before 1940. These ACs were obtained from the median value calculated by Persily et al (2010).
Other factors that can influence indoor air concentration include temperature and relative humidity. The effect of temperature and relative humidity on HCOH concentration has been previously reported in the literature by Berge et al. (1980), Pickrell et al. (1984), and Myers (1985). HCOH concentration for temperature and humidity are commonly corrected using the Berge equation (Berge et al. 1980; ASTM 2014a). The term correction has been criticized in the literature because it gives the impression that the modified result is more accurate than the uncorrected value (Godish and Rouch 1985). The error introduced by the correction is small for small variations; however, the relative error can be as high as 11.5% and 42% for non-standard values of temperature and relative humidity, respectively (Myers 1985). Table C4 and Table C5—modified from ASTM (2014)—provide correction factors for temperature and relative humidity. Because limited sample data were provided to ATSDR by the CPSC, specific analyses for the effect of temperature and relative humidity on the concentrations predicted by the model (Equation 1) were not conducted. The results (concentrations) provided in this report are at standard conditions (77° F and 50 % relative humidity). If corrections are needed, they should be limited to ±2°F and ±4 % relative humidity according to recommendations from ASTM (2014).
Conclusions ATSDR applied an analytical model, referred to as a Well-Mixed Room Model with a Constant Emission Rate (IHMod 2015; Keil et al. 2009) to estimate indoor air HCOH concentrations from Chinese-manufactured laminate flooring products. HCHO emission data from two different datasets were used—separately—to estimate emission factor used in the models. HCOH emission data from the flooring samples were provided to ATSDR by the CPSC. Results of indoor air HCOH concentrations have been presented in terms of the probability or likelihood of exceeding specific concentration values. The analysis in this report did not include an uncertainty analysis. The large chamber dataset was obtained after the small chamber dataset and an analogous analysis was completed utilizing the large chamber dataset. Including the large chamber dataset should not be interpreted as one dataset being more reliable than the other. A reliability analysis of the data included in the datasets is beyond the scope of the analyses requested by the CPSC and presented in this report. Because of limited data samples and model limitations, caution is advised when trying to generalize results reported herein to all U.S. homes with Chinese-manufactured laminate flooring products.

74
References ASTM, Standard Test Method for Determining Formaldehyde Concentrations in Air from Wood
Products Using a Small-Scale Chamber (D6007-14), ASTM International, West Conshohocken, PA, 2014, Available from www.astm.org.
ASTM, Standard Test Method for Determining Formaldehyde Concentrations in Air from Wood
Products Using a Large Chamber (E1333-14), ASTM International, West Conshohocken, PA, 2014, Available from www.astm.org.
Berge, A, Mellegaard, B, Hanetho, P, and Ormstad, EB. Formaldehyde release from particleboard—
Evaluation of a mathematical model. Holz als Roh- und Werkstoff, 1980; 38(7): 251-255. doi: 10.1007/BF02616395.
CARB (California Air Resources Board), Standard Operating Procedure for Finished Good Test
Specimen Preparation Prior to Analysis of Formaldehyde Emissions from Composite Wood Products, Consumer Products Enforcement Section, September 13, 2013. [cited 2015 August 19]; Available from http://www.arb.ca.gov/toxics/compwood/outreach/compwood_sop_fg_decon_091313.pdf.
Cullen AC, and Frey HC. Probabilistic Techniques in Exposure Assessment: A Handbook for Dealing
with Variability and Uncertainty in Models and Inputs. New York: Plenum Press; 1999. Godish, T and Rouch, J. An Assessment of the Berge Equation Applied to Formaldehyde Measurements
under Controlled Conditions of Temperature and Humidity in a Mobile Home, Journal of the Air Pollution Control Association. 1985; 35:11, 1186-1187, DOI: 10.1080/00022470.1985.10466021.
HPVA, HPVA Laboratories, Chain of Custody/Summary Test Report, November 4, 2014. IHMod (Version 0.209). (downloaded May 2015). [cited 2015 August 19]; Available from
https://www.aiha.org/get-involved/VolunteerGroups/Pages/Exposure-Assessment-Strategies-Committee.aspx.
Keil, CB, Simmons, CE, Anthony, TR, and American Industrial Hygiene Association (AIHA). Exposure
Assessment Strategies Committee. Modeling Subcommittee. Mathematical models for estimating occupational exposure to chemicals (2nd ed.). Fairfax, VA: AIHA Press; 2009.
Masters, GM. Introduction to Environmental Engineering and Science. 2nd ed: Prentice Hall; 1998. Maslia ML, and Aral MM. Analytical Contaminant Transport Analysis System (ACTS)—Multimedia
Environmental Fate and Transport. Practice Periodical of Hazardous, Toxic, and Radioactive Waste Management. 2004; July:181–198.
Myers, GE. The effects of temperature and humidity on formaldehyde emission from UF-bonded boards
: a literature critique. Forest products journal. 1985; 35(9): 20-31.

75
NIOSH, National Institute for Occupational Safety and Health, Formaldehyde by VIS (assesed Aug 2015). [cited 2015 August 19]; Available from http://www.cdc.gov/niosh/docs/2003-154/pdfs/3500.pdf.
Persily, A, Musser, A, and Emmerich, SJ. Modeled infiltration rate distributions for U.S. housing.
Indoor Air, 20(6), 473-485. doi: 10.1111/j.1600-0668.2010.00669.x.; 2010. Pickrell, JA., Griffis, LC, Mokler, BV, Kanapilly, GM, and Hobbs, CH. Formaldehyde release from
selected consumer products: influence of chamber loading, multiple products, relative humidity, and temperature. Environmental Science & Technology. 1984; 18(9): 682-686. doi: 10.1021/es00127a009.
R Core Team. R: A language and environment for statistical computing. R Foundation for Statistical
Computing, Vienna, Austria. [cited 2015 August 19]; Available from http://www.R-project.org/; 2015.
Tung Y-K, and Yen B-C. Hydrosystems Engineering Uncertainty Analysis. New York: McGraw-Hill;
2005. U.S. Environmental Protection Agency (U.S. EPA). Guiding Principles for Monte Carlo Analysis.
Washington, DC: United States Environmental Protection Agency; 1997 March. Report No.: EPA 630-R-97-001.
U.S. Environmental Protection Agency (U.S. EPA). Exposure Factors Handbook: 2011 Edition.
National Center for Environmental Assessment, Washington, DC; 2011. EPA/600/R-09/052F. Available from the National Technical Information Service, Springfield, VA. [cited 2015 August 19]; Available from http://www.epa.gov/ncea/efh.

76
Tables
Table C1. Summary of dataset provided to ATSDR by CPSC containing chamber-test data on Chinese-manufactured laminate flooring products [ATSDR, Agency for Toxic Substances and Disease Registry; CPSC, U.S. Consumer Product Safety Commission; HPVA, Hardwood Plywood & Veneer Association; NA, not available]
CPSC Dataset (Small Chamber) CPSC Dataset (Large Chamber)
Filename HCHO laminate flooring data 7.9.15 ATSDR.xlsx Large chamber contract laboratory results ATSDR.XLSX
SHA117 of file 2fd6c4 2f0634
Received on: July 13, 2015 November 16, 2015
Content
This file contains the data obtained by CPSC for samples using ASTM 6007 (small chamber). The file contains 4 worksheet tabs. The data is located in the tab named “CPSC samples”.
This file contains the data obtained by CPSC for samples using ASTM E1333 (large chamber). The file contains 3 worksheet tabs. The data is located in the tab named “large chamber data”.
Number of products sampled (some boxes are of the same type (brand) of product)
11 boxes of laminate flooring products Boxes of laminate product were obtained by employees from CPSC
NA
Number of products tested per laboratory
11 samples (one panel from each box) of each product were sent to 3 independent laboratories
NA
Summary of tests/analyses performed by each laboratory
All samples were analyzed by ASTM 6007 All samples were analyzed by ASTM E1333
Number of emission factors reported/calculated
33 10
17 SHA1 is cryptographic hash function used to identify the file. Only the first six character are shown.

77
Table C2. Summary statistics for emission factors, CPSC-supplied flooring samples (33 samples for the small chamber dataset and 10 samples for the large chamber dataset)
[CPSC, Consumer Product Safety Commission]
Emission factors, in micrograms per square meter per hour
Small chamber dataset Large chamber dataset
Minimum 8.64 115.00
Maximum 347.90 629.00
Mean 62.88 321.40
Median 37.44 251.50
Standard deviation 74.63 184.77

78
Table C3. Model-input parameters used to simulate indoor air formaldehyde concentrations.
[NA, not applicable; rlnorm and runif are the random number generator (RNG) functions used in the scripting language R to run the probabilistic model; meanlog, sdlog, min, and max are the input values for the RNG functions; set.seed=5]
Parameter Distribution Input for random number generator Comments
Emission factor (EF) (small chamber)
Emission factor (EF) (large chamber)
Air exchange rate (AER)
Ceiling height
Log-normal
Uniform
NA (discrete value used)
meanlog=3.73; sdlog=0.85
meanlog=5.62; sdlog=0.59
min=0.10; max=1.21
NA (value of 2.44 meter [8 feet] was used)
The meanlog and sdlog are the mean and standard deviation; respectively, and converted to logarithmic scale of the small chamber CPSC data—all 33 samples were used in the analysis.
The meanlog and sdlog are the mean and standard deviation; respectively, and converted to logarithmic scale of the large chamber CPSC data—all 10 samples were used in the analysis.
The min and max correspond to the values published by Persily (2010) for the 5th and 95th percentile range for single family (national average). Persily et. al. (2010) calculated infiltration rates and associated air exchange rates using a multizone network airflow model (CONTAM) for 209 houses that represent 80% of U.S. housing stock.
Standard ceiling height obtained from US EPA (2011).

79
Table C4. Correction factors for temperature [modified from ASTM 2014a, b)
Desired temperature, in degrees Fahrenheit
Multiply simulated formaldehyde
concentrations by 75 0.88 76 0.94 77 1.00 78 1.06 79 1.12
Table C5. Correction factors for relative humidity [modified from ASTM 2014a, b]
Desired relative humidity, in percent
Multiply simulated formaldehyde
concentrations by 46 0.93 47 0.94 48 0.96 49 0.98 50 1.00 51 1.02 52 1.03 53 1.05 54 1.08

80
Figures
Figure C1. Small chamber test formaldehyde concentration (in parts per million) of Chinese-manufactured laminate flooring product

81
Figure C2. Large chamber test formaldehyde concentration (in parts per million) of Chinese-manufactured laminate flooring product

82
Figure C3. Schematic diagram representing a “Well-Mixed Room Model”

83
Figure C4. Indoor air formaldehyde concentration predicted by the “Well-Mixed Room with a Constant Emission Rate” model [see Equation (2) in text].

84
Figure C5. Conceptual framework for a determinisitic and probabilisitic analysis [modified from Maslia and Aral 2004].
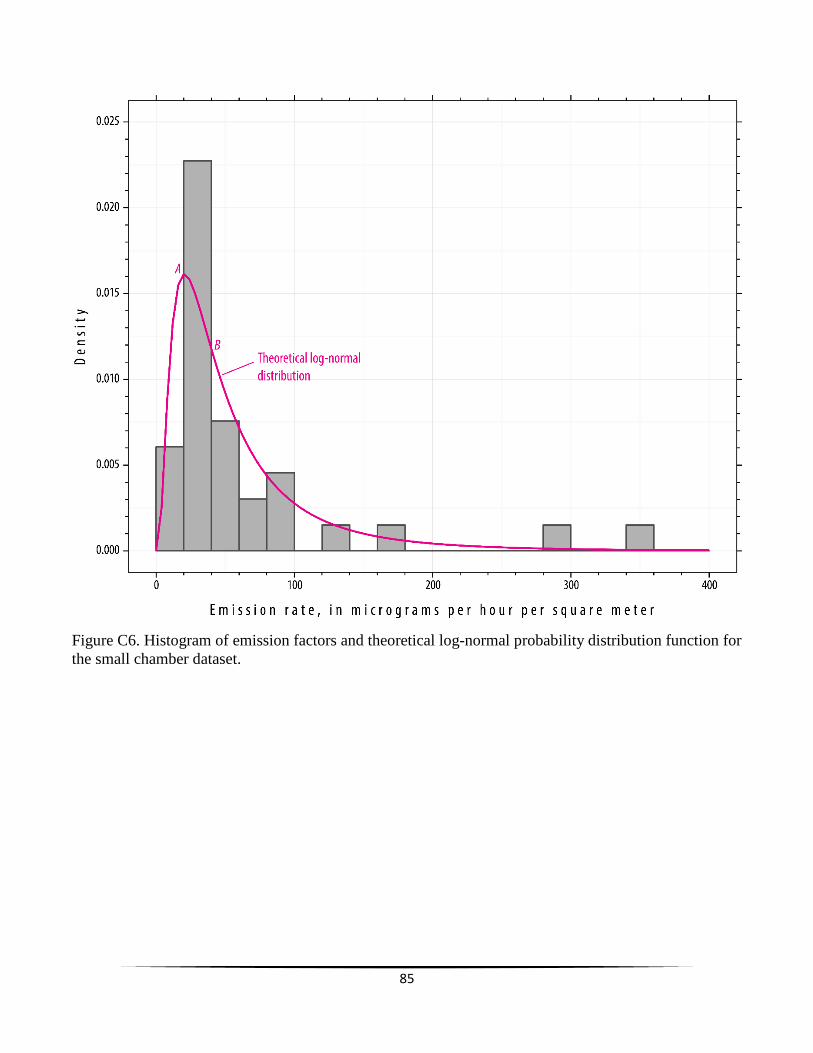
85
Figure C6. Histogram of emission factors and theoretical log-normal probability distribution function for the small chamber dataset.

86
Figure C7. Histogram of emission factors and theoretical log-normal probability distribution function for the large chamber dataset.

87
Figure C8. Probabilistic model results of indoor air formaldehyde concentration from Chinese-manufactured laminate flooring emissions for the emission rates obtained from the small chamber dataset [Monte Carlo simulation using 100,000 realizations].

88
Figure C9. Probabilistic model results of indoor air formaldehyde concentration from Chinese-manufactured laminate flooring emissions for the emission rates obtained from the large chamber dataset [Monte Carlo simulation using 100,000 realizations].
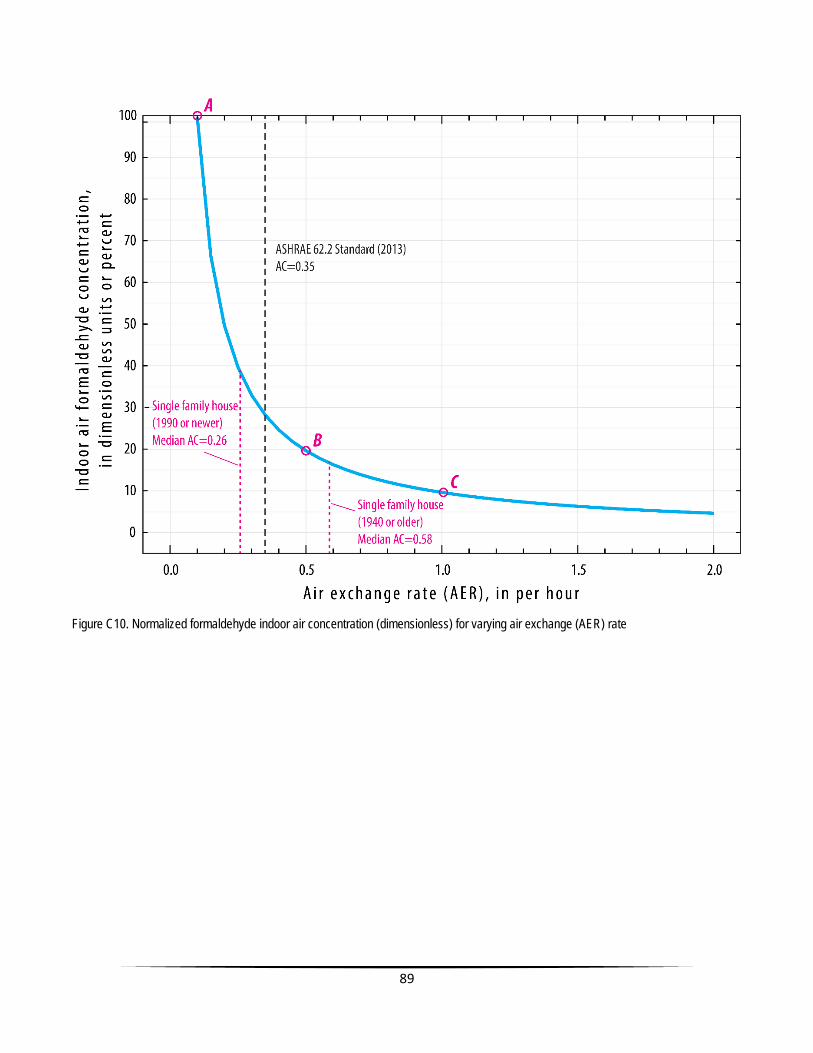
89
Figure C10. Normalized formaldehyde indoor air concentration (dimensionless) for varying air exchange (AER) rate