Embed Size (px)
Citation preview
POSSIBILITY OF SPATIAL DATA INFRASTRUCTURE (SDI) APPLICATION
MD.MOSHARAF HOSSAIN
Survey of Bangladesh Planning and Management of National Mapping and Surveying
ABSTRACT: Spatial Data Infrastructure (SDI) support information discovery, access and use of this information in the decision-making process together with the associated infrastructures that is Geographical information is vital to make sound decisions at the local, regional and global levels. Flood mitigation, Community land use assessments, Environmental restoration, Business development, Disaster recovery and Crime Management are just few examples of areas in which decision-makes are benefiting from geographic information. Application of SDI and GIS is equipped with standard administrative code which administrative code which will be the key for joining the spatial data and attribute statistical data.This technical report dwelt on the constructing and utilizing Spatial data infrastructure (SDI) in pilots areas. It involves creation of features in theme Layers and their corresponding attribute information in theme tables. The overview of GIS technology, data acquisition, data management and analysis is also covered. The main purpose of my this study is to highlight on application of GIS knowledge To manage spatial information.
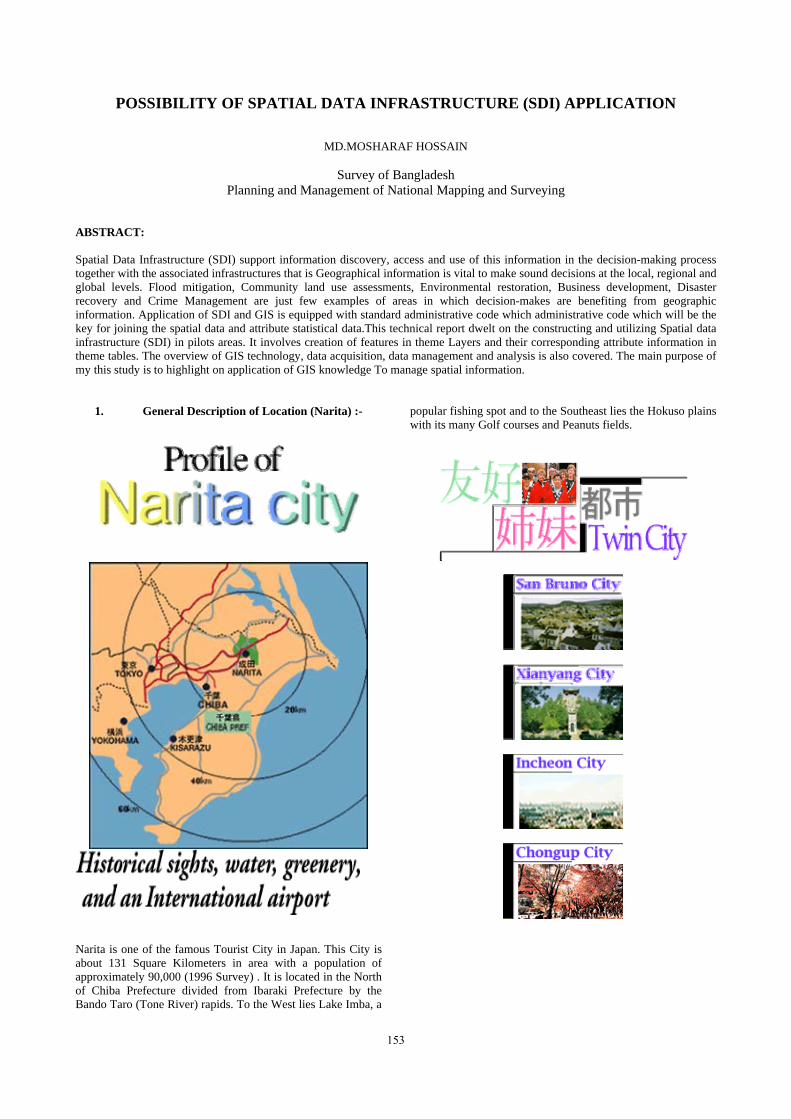
1. General Description of Location (Narita) :-
Narita is one of the famous Tourist City in Japan. This City is about 131 Square Kilometers in area with a population of approximately 90,000 (1996 Survey) . It is located in the North of Chiba Prefecture divided from Ibaraki Prefecture by the Bando Taro (Tone River) rapids. To the West lies Lake Imba, a
popular fishing spot and to the Southeast lies the Hokuso plains with its many Golf courses and Peanuts fields.
153

The International Archives of the Photogrammetry, Remote Sensing and Spatial Information Sciences. Vol. XXXVII. Part B4. Beijing 2008
*Lake Imba area*
Boso No Mura Museum (Villages in Boso)
Boso Fudoki No Oka Museum (Hill of Fudoki in Boso)
Sakataga-ike Park
Lake Imba
Jinbei Park
Sogo Kyutaku (former residence of Sogo Sakura)
Makata Shrine
Sogo Reido Sanctuary
(Tosho-ji Temple)
*Narita Station area*
Naritasan Reikokan and Reikoden Museum
Naritasan Shishoji Temple
Naritasan Calligraphy Museum
Narita Tourist Pavilion
Tourist information center
Narita City Office
*Narita Airport area*
Prefectural Flower and Tree Center
Sakura-no-Yama Hill
Narita Airport
Narita Sightseeing Map
154

The International Archives of the Photogrammetry, Remote Sensing and Spatial Information Sciences. Vol. XXXVII. Part B4. Beijing 2008
It’s a City belongs to Historical sights, Waters, Greenery and an International Airport. Narita city has two hearts within its rich natural environment of water and greenery. The tranquil heart is Naritasan Shinshoji temples which are paid homage to by many tourists (visitors) all-year-round. Then there is the heart of action, Narita airport considered to be the sky-gate way of Japan.
2. GIS Technology: Information and resources about computerized mapping, computerized navigation, Satellites and other aspects of technology in geography .Basic resources and articles from guide about GIS, computerized systems to store, record, analyze and produce maps and geographic products based on spatial data. GIS has been commonly used to support spatial analysis for decision-making, planning of infrastructure services in rural as well as in urban areas management use of land, resources, transportation, cartographic application and or any spatially distributed entities. GIS integrates spatial and other kinds of information within a single system to offer a consistent framework foe analyzing geographic data. In this context GIS can be seen as a computer system designed to support the capture, management, manipulation, analysis, modeling and display of spatial referenced data for solving complex planning and spatial infrastructure management.
GIS technology power s solutions for telecommunication, utilities, agriculture, defense, oil, health care, transportation, mining, environment, petroleum, water/ wastewater and many other industries as well as local, state and federal government agencies. As one of the key components of the spatial information infrastructure geographic information system has achieved a great development and contributed to the International economic progress. 2.1 Desktop GIS work To explore geo-referenced digital information, electronic tools designed for Acquiring, presenting and interacting with information that links location with measured values are needed. One such tool is called a geographic information system, better knows as GIS. Desktop GIS is an immensely powerful computer mapping system. It is a tool for managing information of any kind according to where it is located. Desktop GIS stores all the information about the features is referred to as attribute information or attributes in a GIS database and links the features on the map to the information about them. Also Desktop GIS links sets of features and their attributes and manages them together in units called themes/layers. This means that we can
155

The International Archives of the Photogrammetry, Remote Sensing and Spatial Information Sciences. Vol. XXXVII. Part B4. Beijing 2008
access all the information about a feature by simply clicking on it. For example, The attributes of a river, it might include its name, length, average depth, rate of flow, water quality, how many dames are on it and how many bridges cross it. Desktop GIS formats attributes in rows and columns and stores them as tables. 2.2 Data Management in GIS Geographic data refers to information about the earth’s surface and the objects found on it. This information comes in three basic forms: spatial data, tabular data and image data. Spatial data contains the locations and shapes of map features. Tabular data is collected and compiled for specific areas and is the descriptive data that GIS links to map features. Image data includes such diverse elements as satellite images, aerial photograph and scanned data –data that’s been converted from printed to digital format. Maps are static and therefore difficult and expensive to keep up to date. Maps size and scale also limit the amount of data a paper map can portray. GIS is now a widely used system where large amount of data with reference to a co-ordinate system are stored in the computer and thus provides integral database, which can be manipulated and retrieved for data management and plan preparation process. GIS provides the fundamental facility to extract the different sets of information from a paper map or image source (roads, settlements, vegetation, so on.), stores in a digital form and use them as required. Because data are stored on a computer, analysis and modeling becomes possible. For example, one might point at two building, ask the computer to describe each from an attaché database and then calculate the best route between them.
3. Software: 3.1 GIS Software Geographical Information System (GIS) most useful appropriate software to run on a wide range of hardware types, from centralized computer servers to desktop computers used in standalone or networked configurations. GIS-Software provides the functions and tools needed to store, analyze and retrieval geographic information. The major components include tools for the input and manipulation of geographical information, a database management system, graphical user interface and tools that support geographic query, analysis and visualization. 3.2 ArcMap GIS-Software ArcMap GIS-Software for desktop geographic Information System (GIS) and Mapping. It is powerful mapping system that runs on desktop computers such as Visualize: In no time will be working with data geographically, seeing patterns couldn’t See before, revealing hidden trends and distributions and gaining new insights. Create: It’s easy to create maps to convey message. ArcMap provides all the tools need to put data on a map and display it in an effective manner. Solve: Working geographically lets answer questions such as “Where is….?”, “How much….?”, and “What if….?”. Understanding these relationships will help make better decisions. Present: Showing
the results of work is easy. Can make great looking publication-quality maps and create interactive displays that link charts, tables, drawings, photographs and other elements to data. It will find that communicating geographically is a powerful way to inform and motivate others. Develop: The ArcMap customization environment lets tailor the interface to suit needs or the needs of organization, build new tools to automate work and develop standalone applications based on ArcMap mapping components. Its tasks cab be broadly divided into two categories. One includes mapmaking, editing and spatial data analysis; the other includes database design and data management.
4. Spatial Data Infrastructure: “Spatial Data Infrastructure” (SDI) is often used to denote the relevant base collection of technologies, policies and institutional arrangements that facility the availability of and access to spatial data. The SDI provides a basis for spatial data discovery, evaluation, and application for users and providers within all levels of government, the commercial sector, the private sector, academia and by citizens in general. The SDI must be more than a single data set or database. Its hosts geographic data and attributes, sufficient documentation (metadata), a means to discover, visualize, and evaluate the data (catalogues and Web mapping), and some method to provide access to the geographic data. To make SDI functional, it must also include the organizational agreements needed to coordinate and adminster it on a local, regional, national and or trans-national scale. An SDI facilitates the conveyance of virtual unlimited packages of Geographic information. In this project the study is to construct actual Spatial Data Infrastructure and users for Build data once and use it many times for many applications, Integrate distributed providers of data: Cooperative governance “Place-based management”, Share costs of data creation and maintenance and Support sustainable economic, social and environmental development in Narita city. The main purpose is to generate simple types of GIS application using Arc-GIS Software version-9. 4.1 Definition of SDI “The Spatial Data Infrastructure (SDI) provides a basis for spatial data Discovery, Evaluation and Application for users and providers within all levels of government, the commercial sector, the non-profit sector, academia and by citizens in general.” 4.2 Components of SDI Technology –Hardware, Software, Networks, Databases, Technical implementation plans. Policies and Institutional Arrangements – Governance, Data privacy and Security Data sharing, Cost recovery. People – Training, Professional Development, Cooperation and Outreach. 4.3 The Importance of SDI - Build data once and use it many times for many applications. - Integrate distributed providers of data: Cooperative governance “Place-based management”.
156
The International Archives of the Photogrammetry, Remote Sensing and Spatial Information Sciences. Vol. XXXVII. Part B4. Beijing 2008
- Share costs of data creation and maintenance. - Support sustainable economic, social and environmental development. 4.4 Advantage of SDI
- Improved decisions …..providing decision makers what they really need:
- indicators, models, trends and patterns. - Adoption of existing spatial data standards. - Core data available, in the public domain, via a clearinghouse. - Development of a private sector involved with data sales and added value. - A chance for developing countries to participate in the knowledge economy. - A more informed electorate. - Increased globalization. 4.5 Applications of SDI - Lands Records Adjudication - Disaster Response - Transportation Management - Water, Gas and Electric Planning - Public Protection - Defense - Natural Resource Management - Telecommunications Infrastructure
- Economic Development
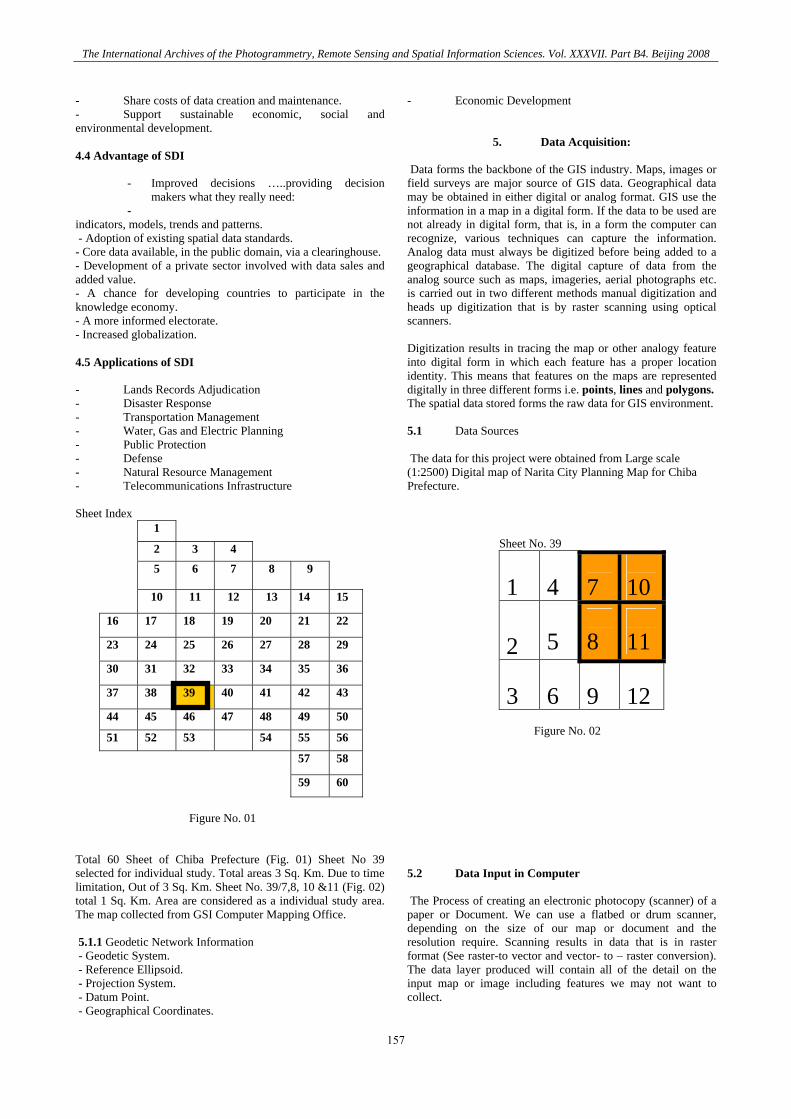
5. Data Acquisition: Data forms the backbone of the GIS industry. Maps, images or field surveys are major source of GIS data. Geographical data may be obtained in either digital or analog format. GIS use the information in a map in a digital form. If the data to be used are not already in digital form, that is, in a form the computer can recognize, various techniques can capture the information. Analog data must always be digitized before being added to a geographical database. The digital capture of data from the analog source such as maps, imageries, aerial photographs etc. is carried out in two different methods manual digitization and heads up digitization that is by raster scanning using optical scanners. Digitization results in tracing the map or other analogy feature into digital form in which each feature has a proper location identity. This means that features on the maps are represented digitally in three different forms i.e. points, lines and polygons. The spatial data stored forms the raw data for GIS environment. 5.1 Data Sources The data for this project were obtained from Large scale (1:2500) Digital map of Narita City Planning Map for Chiba Prefecture.
Sheet Index
1
2 3 4
5 6 7 8 9
10 11 12 13 14 15
16 17 18 19 20 21 22
23 24 25 26 27 28 29
30 31 32 33 34 35 36
37 38 39 40 41 42 43
44 45 46 47 48 49 50
51 52 53 54 55 56
57 58
59 60
Figure No. 01
Total 60 Sheet of Chiba Prefecture (Fig. 01) Sheet No 39 selected for individual study. Total areas 3 Sq. Km. Due to time limitation, Out of 3 Sq. Km. Sheet No. 39/7,8, 10 &11 (Fig. 02) total 1 Sq. Km. Area are considered as a individual study area. The map collected from GSI Computer Mapping Office. 5.1.1 Geodetic Network Information - Geodetic System. - Reference Ellipsoid. - Projection System. - Datum Point. - Geographical Coordinates.
5.2 Data Input in Computer The Process of creating an electronic photocopy (scanner) of a paper or Document. We can use a flatbed or drum scanner, depending on the size of our map or document and the resolution require. Scanning results in data that is in raster format (See raster-to vector and vector- to – raster conversion). The data layer produced will contain all of the detail on the input map or image including features we may not want to collect.
Sheet No. 39
1
4
7
10
2
5
8
11
3
6
9
12
Figure No. 02
157

The International Archives of the Photogrammetry, Remote Sensing and Spatial Information Sciences. Vol. XXXVII. Part B4. Beijing 2008
For this reason, post-processing of scanned data is common. Scanned raster images are useful as a background for vector data, as they provide good spatial context and assist interpretation. Sheet No. 39 was Geo. Tip (Format) for Scanning by Occ. Scan Software, the resolution was 300 DPI, Jasc. Paint Shop Pro 9 (Image Software). For Normalization Software raster-vector Mix Type Software, that is Aupier-Gigalay, version 3.0 used for Geo-referencing of Plane-Rectangular Coordinate. The software used to handle data is Arc Map GIS version 9, one of the powerful GIS software providing tools needed to query and analyze the data and present the result as a quality map by using windows as an operating system. 5.2.1 Getting Data in Arc Map GIS Arc Map GIS links sets of features to their attributes in layer and manage the in a View. An Arc Map layer can be created from a variety of geographic data sources such as spatial data, scanning, computer aided design (CAD) drawing, images and others data sources. In this study, layers are created from several types of spatial and image data sources. This geographic data sources fall into two categories: features data sources and image data sources. Arc Map GIS has it’s own format called Shape Files (.shp), for storing features and attributes, it is created by converting other spatial data sources (such as Arc Catalog), by drawing shapes in layers created or by using tabular data containing locations information. 5.2.2 Data input The basic data is expressed in spatial vectors data well structured in different layers such as facility building, road network, boundary so on, with their attributes. Create topology: The ability to create digitized lines that are intelligently connected to form polygons or networks. Ideally, the process is automatic and includes simple error correction procedures to join line endpoints within specified tolerance distance or remove small overshoots. More serious errors should be highlighted on-screen for you to edit and correct using standard graphical editing functions. Edge matching: The join created by edge matching needs to be topological as well as graphical. A line joined by edge matching should become a single line. Edge matching functions should be able to handle small gaps in data, slight discrepancies, overshoots and missed and double lines. The gaps and errors cannot be handled automatically. Edge matching functions should allow it to set a tolerance limit for automatic editing. Adding attributes: Attributes are characteristics of geographic features (points, lines and areas). They are typically stored in tabular format and linked to the features. Reformatting Digital data: Reformatting ensures accessibility or assists conversion to the system software format. Reformatting data should be topologically and graphically compatible with other data in GIS. In study areas, same scale digital data were input into the computer system to serve as basic data. The digital large scale map at the scale of 1:2500 was in vector format .The basic
digital data from large scale map were obtained as image data sources in the raster format structure.
6. Data Manipulation: In Arc Map editing of a layer is done only if it is based on a shapefile. A shapefile Is the Arc Map GIS format for storing geometry and attribute information for a set of geographic features. The geometry for a feature is stored as a shape, comprised of a set of vector (point, line and polygon) coordinates. Since the obtained data already available in digital form in shapefile format it was possible to be used as basis for manipulation and creation of new theme layer for the study. 6.1 Creation of Layers In this project creation of layers actually involved creation of new, empty layers For construction of Spatial Data Infrastructure (SDI) for the selected area in part of Narita City large scale Map 1: 2500. Thirteen (13) shapefiles each of each of which named corresponding to a particular spatial data infrastructure were created. Each ArcMap shapefiles was added to a project map as a layer by choosing “New Layer” from the View menu one at a time ready for adding features and attributes separately. Based on existing features and image data as reference or background layer Features were drawn in a map using appropriate drawing tools. For the case of Ground Control Point and Trees features were added as Point layer, Area Boundary, Contours, Railroads, Roads, and Roads Under-constructions features were added as line layers and Boundary, Embankment, House, Landuse, Rivers and Vegetation were added as Polygon Layers. When a new layer is created in ArcMap a layer table is automatically created. ArcMap add an empty record to the table for each new feature added to the layer. Initially this table only has two fields, Shape and ID when first opened. New fields were added were necessary and attribute information for a feature entered into a table immediately after a feature drawn. In ArcMap the layer table must contain a field that stores data for the hot linking is created which is defined in Layer properties. Creation of hot links allows clicking on the feature to display additional data linked to that feature. 6.2 Adding features and attributes to the new Layer The main objectives of this individual study(Project) is to create Spatail Data Infrastructure (SDI). For Framework data (database) is to realize a Houses map; the feature data collected in this field on the maps and the terrain has to be added as a polygon layer. An empty new map 2 is created in the view menu then the road and landuse data of the digital map data stored in map 1 are displayed in this new map as a geo-referential data. Every feature layer are linked to a layer attribute table, easy to open for the Active layer by clicking the open layer table button . Making the view table active we start editing and each polygon representing a house is drawn using the appropriate tool. The information relative to this feature is recorded on the
158

The International Archives of the Photogrammetry, Remote Sensing and Spatial Information Sciences. Vol. XXXVII. Part B4. Beijing 2008
attribute table, as a result a relational database called link between each feature and its attributes is generated. After completing to draw house features and setting the attributes table in map 2 the editing function is stopped then the map data is saved in the project This operation is also done under the personal project directory. Following the same procedure as described on the others layers. Features concerning new layer are spatially located on the map, by selecting the view
menu feature type. Attributes of each feature are recorded on the attributes table to generate the relational database by link. According to The Guidelines on Level 2500 GIS Framework Data Preparation Work, the features and attributes added the following article the Specification of data files shall be as per the Data Files Specification for Level 2500 GIS Framework Data and Classification codes and data acquisition shall be as per the Data Acquisition Standards for Level 2500 GIS Framework Data. See the Figure No. 03 and 04.
Figure No.03
159

The International Archives of the Photogrammetry, Remote Sensing and Spatial Information Sciences. Vol. XXXVII. Part B4. Beijing 2008
Figure No. 04
7. Data Analysis A Critical component of a GIS is its ability to produce information that conveys The results of analysis to the decision makers . Maps and other attribute information can be generated, allowing the yser to visualize thereby understand the results of a particular event. A GIS can recognize and analyze the spatial relationships among mapped phenomena. Conditions of adjacency (what is next to what), containment (what is enclosed by what), and proximity (how close something is to something else) can be determined with a GIS. Because ArcMap GIS automatically links the relationship between layers and their attribute tables, it is possible to display map features and attribute data based on this individual study (project) by selecting the former in the view and then examine the later in the layer table. In this individual study (project) emphasize is only on digitize on Image data to construction SDI (framework data) of 13th layers (Ground Control Point, Trees, Area Boundary, Contours, Roads, Railroads, Roads Under-construction, Boundary, Rivers, Embankment, Vegetation, Landuse and Houses) maps data use for GIS application. 7.1 Concept of Infrastructure Management System Represent the Spatial Information System who is the key of Spatial data Infrastructure.The combined map shown clearly how the public facilities are well distributed in the study area. This new concept of Infrastructure Management System (IMS), is very important of city area, the main objective of this concept is to support local effort for an harmonious and profitable urban development. The establishment of geographic and social database is the most important step. 7.2 Finding features by Selecting Attributes.
Since feature and attributes are linked in the database, it is possible to select Indirectly features by selecting their attributes. By pointing at a row in an attributes table, it became easy to select it, along with the feature it’s linked too. One or many rows can be selected, and features linked to these rows selected are highlighted. This is a powerful way to find features while looking over a table of their attributes. Looking for a feature on a map paper can be challenging if the feature is small, with GIS map display finding feature is easy no matter how small is it because you can find it by requesting any of its attributes. 7.3 Finding attributes by selecting features. If you want to know the attributes of a particular Hospital or Post Office Existing on the house layer or digital map display for example, you have only to point this feature on the computer map with the mouse to see its attributes. 7.4 Map display Map are a graphic representation of the real world, it give us a generalized view Of this real world since it is infinitely more detailed than a map can be. To represent real World objects map use three basics shapes; Point. Lines and Areas(commonly referred to as points, lines and polygons in GIS). These GIS map display on a computer screen looks like any other map, the solid Lines represent roads and railroads lines, houses such as hospital, public facility and boundary are represented by solid polygon lines. With GIS map display we can get detailed information about each feature represented by a specific symbol as describe above; and then analyze feature location to uncover relationships between them.
160

The International Archives of the Photogrammetry, Remote Sensing and Spatial Information Sciences. Vol. XXXVII. Part B4. Beijing 2008
8. Conclusion Bangladesh like any other developing country, is now modernizing its Topographic surveying and map production processes. The conventional (traditional) Map-making process is changing bringing it from analogue to digital domain.The target is to have the whole map production process into digital system with the view to provide good services to the general citizens. For this reasons, understanding of ArcMap GIS to me through this individual study (project) is quite appropriate and timely at this end. Nowadays GIS is one of the best technology which is most commonly used all over the world for urban planning purpose, management of natural resources, land use and many other application fields. In this individual study (project) laid on simple application of GIS, the main objective was to collect data in different sources organize and structure this data for constructing a Spatial Data Infrastructure. In spite of the difficulties met during operations in the data collection but also handling this data in ArcMap GIS because lack of deep knowledge concerning the software, the objective of this project has been achieved. As an individual study it was very beneficial for me because I have learn a lot in ArcMap GIS, and those knowledge acquired this project will be helpful for my professional work. Finally, I would like to approach to the GSI management through Japan International Cooperation Agency (JICA) to extend more training opportunities to other Bangladeshi participants to take part in Arc Map GIS knowledge particularly Version 9 to enable the country achieve its goal in mapping sector.
Reference: George B. Korte, P. E, ----- The GIS Book. Peter A. Burrough and Rachael A. McDonnell, -----Principal of Geographic Information System. David J. Maguire, Michael F. Goodchild and David W. Rihind, -----GIS. Reese W. Plews, ----- Introduction to Arc GIS (Lecture Notes) Environmental System Research Institute (ESRI), -----Getting to know Arc GIS. Roger Tomlinson, ----- Thinking About GIS. Michael Minami, ----- Using ArcMap. Douglas D. Nebert, ----- The SDI Cookbook.
United State Geological Survey (USGS), -----Science for a changing world: Home Page, ----- http://www.usg.gov/research/gis/title.html
DEDICATION Dedicated to my parents who struggled so much to see me through education to make me what I am today.
ACKNOWLEDGEMENT First of all I would like to thanks the Almighty GOD “ALLAH” the Most Gracious, the Most Merciful, for allowing me to attend the Administrative and Technical Group Training Course in “ Planning and Management of National Mapping and Surveying”. I would like to express my humble gratitude and appreciation to the Government of Japan (JICA) and Government of Bangladesh for providing me this opportunity to participate in this group training course. This is a great opportunity for me to up grade my knowledge and skill with advanced technologies in the field of Surveying and Mapping. Especially I wish to express my thanks and gratitude to all Executive Staff and Mr. Kazuhiko AKENO, Head of International Affairs Division of Geographical Survey Institute (GSI), to other related instructors for providing their all out efforts, generous advice and cooperation to make the training fruitful one. I would like to express my cordial thanks to my advisor Mr.Kohsei TANAKA Deputy Head of National Large Scale Mapping Division and MR. Sekiya HIROSHI Chief of No.1 Mapping Section, Topographic Department of Geographical Survey Institute (GSI) for his good guidance, advice and assistance during my preparation of this report. wish to express my sincere thanks to Mr. Yoshihide ITO, Mr. Atsushi YUHARA, Ms. Junko KUSUMOTO, Ms. Yaeko OKAMOTO and all other staffs for their cooperation, inspiration and necessary instructions during my stay in Japan. Further, I would like to thank Executive and Staff of JICA & TBIC and Japanese people for their advice, encouragement and warm- hearted support throughout my stay in Japan. Finally I would like to thank my beloved wife Afruza Nasreen Ahmed (Supti) and my son Md. Shabah bin Mosharaf (Nafi) for their patience, inspiration, warm message of hope, cooperation and understanding and being with me in absentia during my stay in Japan, which made me possible to complete my course.
161

The International Archives of the Photogrammetry, Remote Sensing and Spatial Information Sciences. Vol. XXXVII. Part B4. Beijing 2008
162


![Spatial Data Infrastructure (SDI) “[Spatial Data Infrastructure] provides a basis for spatial data discovery, evaluation, and application for users and](https://img.dokumen.tips/doc/110x75/56649d5f5503460f94a3f713/spatial-data-infrastructure-sdi-spatial-data-infrastructure-provides.jpg)