Embed Size (px)
Citation preview

Business imperatives for a prosperous Australia
Building the Lucky Country #3
Positioning for prosperity?Catching the next wave
O
C T O B E R
2 0 1 3
PREVIEW
Go

Everyone can position for prosperity

Where is the next wave?
Part I – Beyond the boom
Part II – Growth strategies for Australia
Current wave: Extend the runwayMining
Next waves: Five new frontsAgribusinessGasTourismInternational educationWealth management
Future waves: Pockets of potential
Part III – Preparing for action
AppendixMethodologyAuthors
c
ContentsWhere is the next wave?
Part I – Beyond the boom 1
Part II – Growth strategies for Australia 10
Current wave: Extend the runway 11
Mining 12
Next waves: Five new fronts 17
Agribusiness 18
Gas 24
Tourism 28
International education 32
Wealth management 36
Future waves: Pockets of potential 41
Part III – Preparing for action 43
Appendix 55
Methodology 56
Authors 67

Where is the next wave?
Part I – Beyond the boom
Part II – Growth strategies for Australia
Current wave: Extend the runwayMining
Next waves: Five new frontsAgribusinessGasTourismInternational educationWealth management
Future waves: Pockets of potential
Part III – Preparing for action
AppendixMethodologyAuthors
Where is the next wave?The Lucky Country has had a good run.
Since 2005, our growth has been fuelled by a magic mix of natural advantages and international opportunities. Simply speaking, we’ve got lots of what industrialising Asia wants.
We’ve seen earlier precedents for this pattern throughout our history: waves of Australian prosperity driven by global demand. Our gold, wool, wheat, meat, iron, coal and nickel have all boomed – some more than once.
All things go in cycles, however. As the current mining boom cools and the Australian dollar returns to earth, it’s time for business and government leaders to ask searching questions about our future and to think about where our prosperity will come from.
This paper asks how we can position Australia – and its individual sectors and businesses – for prosperity. If mining is our current wave, how do we extend its run? And what other future waves can we catch?
Answers are already emerging. The seeds of growth for Australia’s next two decades can be found in our unique advantages in agribusiness, gas, tourism, international education and wealth management.
Collectively, these five waves could be as big as mining. In fact, we estimate that maximising the potential of these sectors alone could add a quarter of a trillion dollars to national income over the next two decades.
Positioning for prosperity? focuses not just on how we can grow, but how to make the most of our opportunities. We believe that business must take the lead in identifying and harnessing the next wave of growth opportunities. Government policy will always play a critical role in creating the economic environment for national prosperity – but businesses do not need to wait.
Many challenges lie ahead, but we are encouraged by the new possibilities opening for our truly fortunate nation. There are more waves on their way – how well we catch them will determine our prosperity for generations to come.
Giam SwiegersCEO, Deloitte Australia
Many challenges lie ahead, but we are encouraged by the new possibilities opening for our truly fortunate nation.

Where is the next wave?
Part I – Beyond the boom
Part II – Growth strategies for Australia
Current wave: Extend the runwayMining
Next waves: Five new frontsAgribusinessGasTourismInternational educationWealth management
Future waves: Pockets of potential
Part III – Preparing for action
AppendixMethodologyAuthors
e
Part I
Beyond the boom

Where is the next wave?
Part I – Beyond the boom
Part II – Growth strategies for Australia
Current wave: Extend the runwayMining
Next waves: Five new frontsAgribusinessGasTourismInternational educationWealth management
Future waves: Pockets of potential
Part III – Preparing for action
AppendixMethodologyAuthors
1
It’s been beautAustralia’s success in having more than two decades without a recession has been so remarkable that it’s become wallpaper. We expect greatness.
Yet our success was no surprise. Led by China, half the world began an ‘industrial revolution’ that saw its hunger for Australia’s commodity exports boom. That boosted our prosperity for the simple reason that we had what the world wanted.
But the boom is slowingAlthough the mining boom isn’t ending, it is changing in ways that will reshape Australia’s industrial landscape. The prices the world is paying for Australian commodities remain a multiple of where they were before the latest upward surge. Yet they are already below their peaks and the consensus among economists is that they’ll go even lower still.
That’s because the end result of a boom in global demand for industrial commodities isn’t a boom in their price, but a boom in their supply. Responding to sustained demand, the world’s miners dig deeper, gradually catching up to the rising needs of the globe’s emerging economies.
At the same time, the stunning increase in mining-related construction, which has driven much of Australia’s recent growth, is already peaking. It won’t go away either – mining-related construction will remain much larger than it used to be – but it will no longer be the main driver of Australian growth.
Australia’s sectoral opportunities are changing
Figure 1: Australia’s relative living standards have rebounded
1949 1959 1969 1979 1989 1999 2009
6
8
10
12
14
16
Glo
bal r
ank
(3-y
ear m
ovin
g av
erag
e)
Source: Groningen Growth and Development Centre, University of Groningen
Years
Figure 2: Recent and forecast iron ore prices
June–2000 June–2005 June–2010 June–2015
160
140
120
100
80
60
40
20
0
A$
per
tonn
eSource: 2013–14 Federal Government Budget Papers
Years

Where is the next wave?
Part I – Beyond the boom
Part II – Growth strategies for Australia
Current wave: Extend the runwayMining
Next waves: Five new frontsAgribusinessGasTourismInternational educationWealth management
Future waves: Pockets of potential
Part III – Preparing for action
AppendixMethodologyAuthors
2
We’ve surfed this break beforeThe past decade isn’t the only time things have worked out well for Australia. Nor is it the only time we’ve failed to cash in.
When a fast-growing global economy – one on the gold standard – needed more of the precious yellow metal from the middle of the 19th century onwards, Australia filled the bill. That trade supercharged our economy and population growth for decades.
When refrigerated transport opened up new world markets for lamb and beef in the 1880s, it revolutionised our farming prospects at a time when agribusiness was already our largest industry. Then the growth baton passed to service sectors which prospered from demands linked to rising incomes here and around the world.
These developments all changed the Australian industrial landscape.
Yet we could have done better – we’ve missed a bunch of magnificent opportunities.
A little over a century ago, Australia vied with Argentina for the highest living standards in the world. By the early 1980s, we’d fallen to 16th in the global rankings of income per head.
There were many factors behind our fall from grace, but our biggest self-inflicted wound was turning our back on both global opportunity and Australian advantage. We cowered behind tariff walls and hid from global markets, dulling Australian advantage and supporting our weaker sectors at a cost to our stronger ones.
Source: Australian Bureau of Statistics
Figure 3: Our changing industrial landscape
16
14
12
10
8
6
4
2
0Sect
ors
– In
dust
ry s
hare
s of
GD
P (%
)
Construction AgricultureMining ServicesManufacturing
1974 1979 1984 1989 1994 1999 2004 2009
82
80
78
76
74
Services – share of GD
P (%)
Years

Where is the next wave?
Part I – Beyond the boom
Part II – Growth strategies for Australia
Current wave: Extend the runwayMining
Next waves: Five new frontsAgribusinessGasTourismInternational educationWealth management
Future waves: Pockets of potential
Part III – Preparing for action
AppendixMethodologyAuthors
3
Economists have long since found that every subsidy to one sector comes at the expense of hidden costs to others. In Australia’s case, that meant our tariff protection for the likes of manufacturing came at a cost to the global competitiveness of our farmers and miners.
That mistake cost us dearly. After a final flurry (when wool prices jumped during the Korean War of the early 1950s), exports slumped to less than one-eighth of national income by the late 1960s. They only returned to what we’d averaged in the first half of the 20th century in the past few years, amid a stunning resources boom.
So, what’s the pattern here? It is that Australia gets its biggest breaks – its largest wealth-creating waves – when we find ourselves at the intersection of global opportunity and national advantage.
This is the idea we explore in this report: how Australia can ensure that it is well positioned for prosperity in a competitive global economy, and how individual businesses, industry associations and governments can do their bit to ensure we (and they) realise our potential.
The mythical ‘Fountain of Youth mine’ To understand the role comparative advantage plays in sustaining Australia’s enviable standard of living, it’s worth considering the absurd proposition of what a ‘Fountain of Youth mine’ could mean for our economy. If such a mine were to produce just a few drops a day, their scarcity would guarantee a price that could support much of our economy.
That is an extreme example of how Australians maintain our enviable standard of living despite exports making up just one-fifth of our economy. By comparison, countries such as Germany must focus about half their production on exports.
35
30
25
20
15
10
Expo
rts
to G
DP
(%)
Source: Australian Treasury, Australian Bureau of Statistics
Years
Figure 4: Exports as a share of Australia’s economy
1900–01 1910–11 1920–21 1930–31 1940–41 1950–51 1960–61 1970–71 2000–011980–81 2010–111990–91

Where is the next wave?
Part I – Beyond the boom
Part II – Growth strategies for Australia
Current wave: Extend the runwayMining
Next waves: Five new frontsAgribusinessGasTourismInternational educationWealth management
Future waves: Pockets of potential
Part III – Preparing for action
AppendixMethodologyAuthors
4
So where is the next wave?
Global opportunityThe reality is that we need new growth drivers. We need another wave – or several. The first place to look is those sectors that can be expected to grow significantly faster than Global Gross Domestic Product (GGDP) as a whole over the next 10 to 20 years, or by more than about 3.4% per year.
To do that, we mapped the expected global growth of a range of industry sectors from now to 2033. Among the fastest growing are gas, tourism and agribusiness – each of which is expected to grow more than 10% faster than GGDP.
GGDP
-10% GGDP
Source: Deloitte Access Economics
Gas
Tourism
Agribusiness
Health
International education
Wealth management
Water and waste services
Retail and wholesale
Other education and training
Public administration
Transport and logistics
Business and property services
Telecommunications
Oil
Banking
Mining
Construction
ICT
Manufacturing
Media
2.42.2 2.6 2.8 3.0 3.2 3.4 3.6 3.8 4.0 4.2
Global growth rate (%)
Sect
ors
3.49
3.42
3.34
3.28
3.25
3.24
2.96
2.52
2.50
Figure 5: Projected annual global industry output growth, 2013–33
+10% GGDP
4.11
4.08
4.06
3.95
3.90
3.81
3.70
3.62
3.57
3.53
3.49

Where is the next wave?
Part I – Beyond the boom
Part II – Growth strategies for Australia
Current wave: Extend the runwayMining
Next waves: Five new frontsAgribusinessGasTourismInternational educationWealth management
Future waves: Pockets of potential
Part III – Preparing for action
AppendixMethodologyAuthors
5
Then we grouped sectors into three categories: those that would grow at least 10% faster than GGDP (more than 3.7%), those that would grow at close to GGDP and those that are expected to grow at least 10% slower than GGDP (less than 3.1%).
Figure 6: A three-part view of global growth
Global opportunity
>GGDP GasTourismAgribusinessHealthInternational educationWealth management
~GGDP Water and waste servicesRetail and wholesaleOther education and trainingPublic administrationTransport and logisticsBusiness and property servicesTelecommunicationsOilBankingMiningConstruction
<GGDP ICTManufacturingMedia
Source: Deloitte Access Economics
At the top are a diverse group of sectors that can be expected to power ahead, with many driven by demand generated by the industrial revolution continuing to play out in the world’s emerging economies.
Below them are industries such as banking, mining, oil, construction, business and property services, and transport and logistics. While all remain big parts of the Australian economy, they are not high-growth stories.
At the base are technology, media and manufacturing. These will still grow, but won’t offer natural tailwinds.

Where is the next wave?
Part I – Beyond the boom
Part II – Growth strategies for Australia
Current wave: Extend the runwayMining
Next waves: Five new frontsAgribusinessGasTourismInternational educationWealth management
Future waves: Pockets of potential
Part III – Preparing for action
AppendixMethodologyAuthors
6
Australian advantageAs history has shown, growth alone isn’t enough to deliver success to Australia. We also need an edge – a source of comparative advantage that’s hard for other nations to match.
The good news is that we have at least five big-picture advantages running in our favour:• World-class resources in land, minerals and energy• Proximity to the world’s fastest growing markets in Asia• Use of English, the world’s business language• A temperate climate• Well-understood tax and regulatory regimes.
The retreat of the Australian dollar (A$) from its record highs is also a welcome relief. Many of our potential high-growth sectors have been on the back foot in recent years, fighting to cope with the relative strength of Australia’s exchange and interest rates that were part and parcel of the mining boom’s first phase.
We see the A$ settling at U.S.80 cents in the longer term (see box, page 9). This is an important development. It signals the starter’s gun on new opportunities that will be good news for ‘dollar-dependent’ sectors including manufacturing, farming, tourism and international education (as it relates to teaching foreign students). It will also be a tailwind for ‘interest rate – sensitive’ sectors, such as retail and housing construction.
These sectors hold out not only the promise of new waves of growth – they offer us a way to diversify beyond mining’s boom and bust. All that’s missing is for Australian businesses and families to realise that our opportunities are just as great as they were at the start of the mining boom, but that they will come from different directions.

Where is the next wave?
Part I – Beyond the boom
Part II – Growth strategies for Australia
Current wave: Extend the runwayMining
Next waves: Five new frontsAgribusinessGasTourismInternational educationWealth management
Future waves: Pockets of potential
Part III – Preparing for action
AppendixMethodologyAuthors
7
To demonstrate this concept better, Deloitte has developed an Australian advantage score linking relative productivity (what Australia is good at) with relative advantage (where it is difficult for others to match or imitate our advantages).
This is shown in Figure 7 and you’ll find more detail about it in our Methodology section. The areas where Australia enjoys a relatively high level of advantage include agribusiness, mining and gas.
Forecast for the Australian dollar A key negative of the past decade for many of the sectors considered here was the stunning strength of the A$. This put large costs on exporters, and on those competing with imports.
Yet the A$’s parity with the U.S. dollar has already passed, and further falls can be expected. In addition, interest rates in much of the developed world remain at ‘emergency lows’ amid the aftershocks of the global financial crisis (GFC).
But crises don’t last forever, and interest rates will eventually rise in the world’s major markets.
For this reason, the two big drivers of the A$ – commodity prices and interest rate differentials – are both likely to push it down in coming years. Our forecasts have the dollar eventually settling at around U.S.80 cents. That’s higher than the U.S.75 cents averaged in three decades of a floating currency, but well down from the parity peaks of recent years.
Figure 7: Areas of comparative advantage for Australia (relative advantage score)
Source: Deloitte Access Economics
* Average Australian advantage
Med
ia Ba
nkin
g
Busin
ess a
nd p
rope
rty se
rvice
s
ICT
Sectors
Aus
tral
ian
adva
ntag
e
2.11.61.41.0
18
16
14
12
10
8
6
4
2
0
Telec
omm
unica
tions
Cons
truct
ion
Wat
er a
nd w
aste
serv
ices
Man
ufac
turin
g
Healt
h
Publ
ic ad
min
istra
tion
Reta
il and
who
lesale
Tran
spor
t and
logi
stics
Othe
r edu
catio
n an
d tra
inin
g
Wea
lth m
anag
emen
t
Inte
rnat
iona
l edu
catio
n Oil
Tour
ism Gas
Min
ing
Agrib
usin
ess
16.2
13.3
11.9
8.28.08.07.6
3.33.23.12.92.82.72.72.42.3
5.2*

Where is the next wave?
Part I – Beyond the boom
Part II – Growth strategies for Australia
Current wave: Extend the runwayMining
Next waves: Five new frontsAgribusinessGasTourismInternational educationWealth management
Future waves: Pockets of potential
Part III – Preparing for action
AppendixMethodologyAuthors
8
Current, next and future wavesThe multi-billion-dollar question is: where do global growth and Australian advantage intersect? Where are the waves that will drive our prosperity, today and tomorrow?
The answer is revealed in Figure 8, which brings all these concepts together – global growth opportunities over the next 20 years (the vertical axis), Australia’s expected advantages (the horizontal axis) and the size and placement of Australia’s specific industry sectors.
This view shows how Australia’s future growth prospects can be viewed as a series of waves.
Mining – the current waveFor the past decade, the big wave has been mining. The resources boom has been driven by the combination of our comparative advantage and runaway global growth. While that growth is moderating, the sheer size of the mining sector and its continuing potential will ensure it remains central to our economy for many years to come. Our challenge is to extend the boom for as long as possible.
Figure 8: Australia’s current, next and future waves of growth, 2013–33
Australian advantage (right is stronger)
Current wave
Future wavesNext waves
Source: Deloitte Access Economics
TourismGas
Agribusiness
International education
Wealth management
Mining
Manufacturing
Media
ICT
Construction
Telecommunications
Banking
Business and property services
Transport and logistics
Oil
Public administration
Health
Other education and trainingRetail and wholesale
Water and waste services
Glo
bal o
ppor
tuni
ty (G
GD
P gr
owth
, hig
her
is s
tron
ger)
<GGDP
~GGDP
>GGDP
-10% GGDP
+10% GGDP

Where is the next wave?
Part I – Beyond the boom
Part II – Growth strategies for Australia
Current wave: Extend the runwayMining
Next waves: Five new frontsAgribusinessGasTourismInternational educationWealth management
Future waves: Pockets of potential
Part III – Preparing for action
AppendixMethodologyAuthors
9
Our next wavesLooking at the global growth trends and Australia’s areas of advantage, it becomes clear that our next waves of prosperity are likely to come from the five sectors that appear at the top of both our lists.
These fantastic five are gas, agribusiness, tourism, international education and wealth management. Collectively, they have the potential to be as big as mining.
The huge and common driver for this group will be Asia. Asian growth will benefit:• Gas – as countries seek to improve air quality and reduce
greenhouse emissions• Agribusiness – as people buy Australia’s fresh produce,
including proteins• International education – as students seek to study in an
English-speaking country• Tourism – as people seek space, nature, holidays and luxury
experiences• Wealth management – as organisations and individuals tap
into Australia’s expertise.
Exceptional growth in these five sectors could add about $250 billion to the economy between 2013 and 2033. That would equate to an additional $25 billion in GDP in 2033 (in today’s dollars) – or a boost of about 1% in an economy turning over $2.6 trillion (also in today’s dollars).1
Future wavesBut wait – that’s not all. There will also be pockets of growth to be found in the big and primarily domestic sectors that make up the bulk of our economy. Some of these, such as health, will grow strongly. Others are areas in which we have deep strength, such as banking. And some are sectors where we could enjoy a renaissance, such as manufacturing, as the global business of making things moves from being labour intensive to creativity intensive.
These potential opportunities and how organisations in those sectors can pursue them is the focus of our continuing research.
Making the most of our strengthsOur final message is that while global opportunity and natural structural advantages are necessary requirements, they are not in themselves sufficient to ensure Australian success, even in sectors like gas that appear to have everything going for them.
The other key ingredient is our capacity to cash in. Resources are a good example: many nations are rich in resources, yet few have developed world-class resource sectors. Australia’s is the result of both good assets and good management.
This is where the hard work comes in. Our task ahead is to build on our areas of favourable comparative advantage to improve Australia’s performance relative to our competitors. This means creating things like a better-skilled vocational workforce, more efficient regulatory and tax regimes, and a stable and clear set of policy rules for businesses.
That’s how we’ll position Australia for prosperity.
While global opportunity and natural structural advantages are necessary requirements, they are not in themselves sufficient to ensure Australian success.
1 See the Methodology section for discussion of this modelling and greater detail of our results.

Where is the next wave?
Part I – Beyond the boom
Part II – Growth strategies for Australia
Current wave: Extend the runwayMining
Next waves: Five new frontsAgribusinessGasTourismInternational educationWealth management
Future waves: Pockets of potential
Part III – Preparing for action
AppendixMethodologyAuthors
10
Growth strategies for Australia
Part II
10

Where is the next wave?
Part I – Beyond the boom
Part II – Growth strategies for Australia
Current wave: Extend the runwayMining
Next waves: Five new frontsAgribusinessGasTourismInternational educationWealth management
Future waves: Pockets of potential
Part III – Preparing for action
AppendixMethodologyAuthors
11
Extend the runway
Current wave
Mining will continue as a major driver of our prosperity over the next two decades and beyond.
Figure 9: Australia’s current growth wave
Australian advantage (right is stronger)
Source: Deloitte Access Economics
TourismGas
Agribusiness
International education
Wealth management
Mining
Glo
bal o
ppor
tuni
ty (G
GD
P gr
owth
, hig
her
is s
tron
ger)
<GGDP
~GGDP
>GGDP
-10% GGDP
+10% GGDP
Manufacturing
Media
ICT
Construction
Telecommunications
Banking
Business and property services
Transport and logistics
Oil
Public administration
Health
Other education and trainingRetail and wholesale
Water and waste services

Where is the next wave?
Part I – Beyond the boom
Part II – Growth strategies for Australia
Current wave: Extend the runwayMining
Next waves: Five new frontsAgribusinessGasTourismInternational educationWealth management
Future waves: Pockets of potential
Part III – Preparing for action
AppendixMethodologyAuthors
12
Current wave Mining
Global growth rate: 3.25% Australian advantage: 13.3*
A decade ago, Australia’s economy was slowing at the back end of a housing price boom, and we needed a new growth driver. Mining stepped up, accelerating Australian prosperity at the perfect moment. In fact, much of Australia’s increased wealth today is thanks to our mining sector, as we were already a leading supplier of industrial inputs to developing Asia at the time the latter’s growth surged.
Roll forward a decade, and some things have changed. In part, we are a victim of our own success: today’s mining sector is already much larger than it used to be. In addition, the outlook for mineral demand growth has ebbed recently and is unlikely to continue at the frantic pace of the past decade (especially for coal), while rising costs and falling productivity are crippling our global competitiveness.
We still hold plenty of acesEven so, mining will continue as a major driver of our prosperity over the next two decades and beyond. As BHP Billiton CEO Andrew Mackenzie recently said: “Global demand for commodities is expected to grow by up to 75% over the next 15 years as 250 million more people move from the Chinese countryside to cities and Asia’s middle class approaches 3 billion.”2 We have exceptional potential to win a large share of that growth.
World-class deposits: Australia holds some of the world’s biggest and highest-quality mineral deposits. We have the world’s largest economic resources of gold, iron ore, lead, rutile, zircon, nickel, uranium and zinc. We also rank among the top six nations worldwide for known resources of antimony, bauxite, black coal, recoverable brown coal, cobalt, copper, diamond, ilmenite, lithium, manganese ore, niobium, silver, tantalum, tungsten and vanadium. In addition, we hold numerous rare earth minerals (see box, page 16).3
2 Mackenzie, Andrew, CEO BHP Billiton, Speech to the Asia Society, Melbourne, 7 August 2013.
3 Geoscience Australia, ‘Australia’s Identified Mineral Resources’, www.ga.gov.au/minerals/mineral-resources/aimr.html.
Figure 10: Australian market share in global commodity markets
Source: Deloitte Access Economics
Lead
Copper
Zinc
Aluminium
Coal
Nickel
Iron ore
0 5 10 15 20 25
Market share in 2010 (%)
2.1
2.3
4.2
4.9
6.0
9.9
21.8
22.517.512.57.52.5
* Our Australian advantage score ranges from 1.0 to 16.2, as shown in Figure 7 and discussed in Part I and the Methodology.
The mother lode

Where is the next wave?
Part I – Beyond the boom
Part II – Growth strategies for Australia
Current wave: Extend the runwayMining
Next waves: Five new frontsAgribusinessGasTourismInternational educationWealth management
Future waves: Pockets of potential
Part III – Preparing for action
AppendixMethodologyAuthors
13
Current wave Mining
Great neighbours: We’re also fortunate to live relatively close to major buyers of mining outputs, especially China, India, Japan and Korea. Particularly when transport prices are high, this gives us a cost advantage over competitors from the Americas and elsewhere.
Profitability: Even with the prices of some commodities falling, Australia is still making a very good living in many mining segments. The key is where we sit on the cost curve and the fact that, even at lower prices, many Australian mines do and will continue to make great profits.
Investment support: Allowing foreigners to invest in our mines gives us a ready supply of capital to commercialise our natural resources. Provided we can overcome our cost challenges, local and foreign investors should continue to show a healthy appetite for supporting Australian exploration and development projects.
Quality infrastructure: While our infrastructure does fray at the edges at times, Australia has substantial assets for producing and exporting minerals. After all, we have just spent – in today’s dollars – the same amount on mining-related infrastructure as the U.S. spent to put a man on the moon. Even better, the mines, ports and railway lines we have built with that money will provide us with a return on our investment for decades to come.
Skilled labour: Our miners are highly skilled, compared to many of those working elsewhere across the world. However, as we note below, we need more of these skilled workers in the sector.
Advanced technology: Our high labour costs have forced us to be smart at using technology rather than muscle to increase yields from our mining operations. Today, Australia is a global leader in next-generation production techniques such as remote operations centres, driverless trucks and devices to make mining safer, such as anti-drowsy caps for operators.4
Taking on China in rare earths?Rare earths (such as lanthanum, neodymium, gadolinium, terbium and ytterbium) offer unique physical, chemical and light-emitting properties that make them attractive to use in ‘green’ products such as the motors and batteries used in hybrid cars. They’re also useful as petroleum catalysts, in glass manufacturing and polishing, and for making some electronic components. Today, the trade in rare earths is currently dominated by China, which controls almost all global output.
Australia hasn’t been an active producer since 1995 when we stopped mining the mineral monazite for its rare earths and thorium. However, we have an estimated 1.65 million tonnes of economic deposits of relevant rare earth oxides (about 2% of the world’s total). Further, a number of companies are actively exploring for – and starting to mine – these minerals.
Given its alignment with global demand for sustainable products, as well as the potential scarcity deriving from China’s hold over the market and Australia’s deposits, this is an area to watch for a strong future exports story.5
4 Cochrane, Nathan, ‘Thinking caps save drowsy drivers’, Australia Unlimited, 17 October 2012.5 Geoscience Australia, www.ga.gov.au/minerals/mineral-resources/rare-earth-elements.html.

Where is the next wave?
Part I – Beyond the boom
Part II – Growth strategies for Australia
Current wave: Extend the runwayMining
Next waves: Five new frontsAgribusinessGasTourismInternational educationWealth management
Future waves: Pockets of potential
Part III – Preparing for action
AppendixMethodologyAuthors
14
What could slow us down?Plenty, given mining is a highly competitive global sector.
Growing costs: The cost of mining in Australia has been escalating due to a range of factors: the scarcity of skilled labour, the high A$, the cost of inputs such as machinery and wages, and more regulations and taxes. While the impact of the high dollar has already begun to abate, the remote and often harsh locations of many of our mines will ensure that miners continue to demand a premium for their work. It will also remain challenging to convince other workers to travel to mining locations.
Taxes and red and green tape: Australia’s biggest ‘own goal’ in recent years has been making our regulatory environment more complex and onerous, including the introduction of new mining taxes and the raising of existing ones. We have also vacillated on carbon pricing and taxation. An unfortunate side effect is that we’ve given ourselves a reputation for government-generated risk. And while protecting our environment is vital, our governments have also been introducing regulations that could slow the growth of mining, which may in turn have an outsized impact on smaller miners.
Lack of new infrastructure: Australia will need more mining-related infrastructure to prevent future bottlenecks and – partly due to the cost and regulatory issues flagged above – we are struggling to win the investment required to build it.
14

Where is the next wave?
Part I – Beyond the boom
Part II – Growth strategies for Australia
Current wave: Extend the runwayMining
Next waves: Five new frontsAgribusinessGasTourismInternational educationWealth management
Future waves: Pockets of potential
Part III – Preparing for action
AppendixMethodologyAuthors
15
Falling productivity: Even though we have plenty of new capacity coming online, the bad news is that our efficiency is slipping. Our mining productivity is still solid, but it has declined sharply over the past decade at a time when other nations improved theirs.
Questions about coal: The world is worried, not merely about greenhouse gas emissions, but also about air quality. Indeed, a new study has estimated 500 million citizens in northern China will live on average 5.5 years less than they should, due to the region’s coal-related air pollution.6 Although global coal sales are expected to keep rising and new clean technologies might help, growth momentum has moved from coal to gas and alternative energy sources. This means that coal – although it will remain an anchor asset of Australia’s mining sector – is unlikely to drive as much growth in coming years. Figure 11: Projected global growth in commodity demand
Source: Deloitte Access Economics
Nickel
Coal
Copper
Aluminium
Zinc
Lead
Iron ore
0 10 20 30 40 50 60 70 80 90
Change in global demand 2010–33 (%)
42.2
56.8
63.5
70.4
73.9
78.2
80.5
6 Chen, Yuyu et al., ‘Evidence on the impact of sustained exposure to air pollution on life expectancy from China’s Huai River policy’, Proceedings of the National Academy of Sciences of the United States, 28 May 2013.

Where is the next wave?
Part I – Beyond the boom
Part II – Growth strategies for Australia
Current wave: Extend the runwayMining
Next waves: Five new frontsAgribusinessGasTourismInternational educationWealth management
Future waves: Pockets of potential
Part III – Preparing for action
AppendixMethodologyAuthors
16
Current wave Mining
Positioning for prosperityThere are many reasons to be hopeful about Australian mining’s future, but there is also work to do to ensure we maintain our leadership. As BHP Billiton’s Andrew Mackenzie added in his speech: “The question is not if Asia’s demand for commodities will be met, but rather which countries will deliver the supply.”
As the discussion above highlights, we have a range of other questions to address as well. These include:• How can we rebuild our reputation for regulatory stability to
win back the confidence of international investors and potential partners?
• Can we review the breadth and complexity of regulations around mining, to ensure they are efficient and valuable?
• How can we make our infrastructure more efficient and effective, including avoiding the duplication of non-competitive facilities such as ports and rail?
• Are there ways to mitigate concerns about coal, such as further investment in clean coal technologies?
• Could miners explore new funding models to improve cost competitiveness, such as divesting assets to infrastructure funds?
Most importantly, how can industry and government work together in a more coordinated and sophisticated way, and how can they better engage with the community?
We’ll need to find answers to all these questions in order to maintain our position in mining and win future rounds of investment. It’s worth keeping in mind that every investment round we miss represents a 20-year head start for a competitor nation.
There are many reasons to be hopeful about Australian mining’s future, but there is also work to do to ensure we maintain our leadership.

Where is the next wave?
Part I – Beyond the boom
Part II – Growth strategies for Australia
Current wave: Extend the runwayMining
Next waves: Five new frontsAgribusinessGasTourismInternational educationWealth management
Future waves: Pockets of potential
Part III – Preparing for action
AppendixMethodologyAuthors
17
Next waves
Five new fronts
Collectively, gas, agribusiness, tourism, international education and wealth management have the potential to be as big as mining.
Figure 12: Australia’s next growth waves
Australian advantage (right is stronger)
Source: Deloitte Access Economics
TourismGas
Agribusiness
International education
Wealth management
Mining
Glo
bal o
ppor
tuni
ty (G
GD
P gr
owth
, hig
her
is s
tron
ger)
<GGDP
~GGDP
>GGDP
-10% GGDP
+10% GGDP
Manufacturing
Media
ICT
Construction
Telecommunications
Banking
Business and property services
Transport and logistics
Oil
Public administration
Health
Other education and trainingRetail and wholesale
Water and waste services
Where is the next wave?
Part I – Beyond the boom
Part II – Growth strategies for Australia
Current wave: Extend the runwayMining
Next waves: Five new frontsAgribusinessGasTourismInternational educationWealth management
Future waves: Pockets of potential
Part III – Preparing for action
AppendixMethodologyAuthors
18
Global growth rate: 4.06% Australian advantage: 16.2*
Many have long hoped that Australia’s red heart would blossom like the U.S. Midwest did a century ago. But we didn’t have enough water: Australia is the world’s driest inhabited continent. This conundrum – we’ve got lots of land, but a limited ability to use it productively – has long since constrained Australian agribusiness.
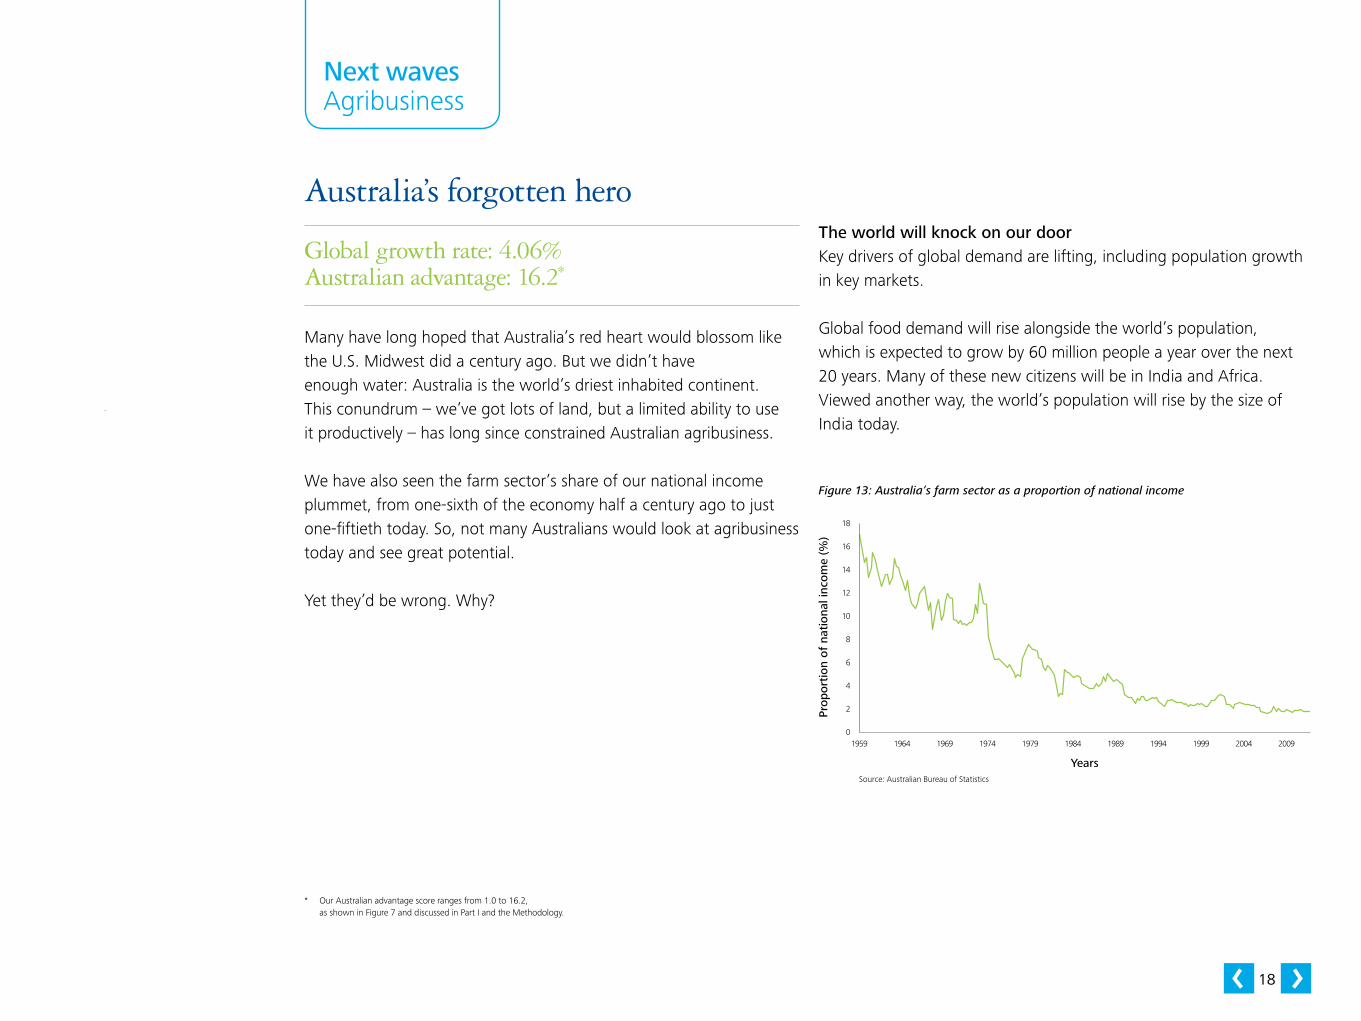
We have also seen the farm sector’s share of our national income plummet, from one-sixth of the economy half a century ago to just one-fiftieth today. So, not many Australians would look at agribusiness today and see great potential.
Yet they’d be wrong. Why?
The world will knock on our doorKey drivers of global demand are lifting, including population growth in key markets.
Global food demand will rise alongside the world’s population, which is expected to grow by 60 million people a year over the next 20 years. Many of these new citizens will be in India and Africa. Viewed another way, the world’s population will rise by the size of India today.
Next waves Agribusiness
Australia’s forgotten hero
1959 1964 1969 1974 1979 1984 1989 1994 20091999 2004
18
16
14
12
10
8
6
4
2
0
Prop
orti
on o
f na
tion
al in
com
e (%
)
Source: Australian Bureau of Statistics
Years
Figure 13: Australia’s farm sector as a proportion of national income
* Our Australian advantage score ranges from 1.0 to 16.2, as shown in Figure 7 and discussed in Part I and the Methodology.

Where is the next wave?
Part I – Beyond the boom
Part II – Growth strategies for Australia
Current wave: Extend the runwayMining
Next waves: Five new frontsAgribusinessGasTourismInternational educationWealth management
Future waves: Pockets of potential
Part III – Preparing for action
AppendixMethodologyAuthors
19
But that is just the increase in baseload demand. Income growth in key markets will be much more important still. As incomes rise in emerging economies, so too does kilojoule intake and, more importantly, a switch to protein takes place. The latter will power a dietary shift from grains and cereals towards meat, dairy, fruit and vegetables. That means a swing to more intensive land use. Simply put, the world is on the cusp of a leap in demand for higher-value food products.
Moreover, at the same time that demand will lift, supply from much of the rest of the world – especially Asia – will be under pressure. Emerging Asia is on the move, with the process of urbanisation turning high-value farms into homes and factories. Many major producers, including the U.S., also face long-term water shortages in key productive regions.

Where is the next wave?
Part I – Beyond the boom
Part II – Growth strategies for Australia
Current wave: Extend the runwayMining
Next waves: Five new frontsAgribusinessGasTourismInternational educationWealth management
Future waves: Pockets of potential
Part III – Preparing for action
AppendixMethodologyAuthors
20
Figure 14: Global demand for protein
120
100
80
60
40
20
0
Source: World Health Organisation
Wor
ld
Deve
lopi
ng
coun
tries
Near
Eas
t and
Nor
th
Afric
a Sub-
Saha
ran
Afric
aLa
tin A
mer
ica a
nd th
e
Carib
bean
East
Asia
Sout
h As
ia
Indu
strial
ised
coun
tries
Tran
sitio
n co
untri
es
Regions
Kg
of m
eat
cons
umed
(p
er c
apita
)
45.336.4
24.2
76.6
53.8
31.735
21.211.9 11.7
5.33.9
36.7
25.5
10.2
58.5
37.7
8.713.49.49.9
100.1
88.2
61.5 60.7
46.242.5
1964–66 1997–99 2030
We have the goodsWhat has Australia got to offer that our competitors will be hard-pressed to match?
Lower dollar: The pain of currency strength – a key negative in the past decade – is not permanent. As noted in Part I, Deloitte Access Economics estimates that the A$ will settle at closer to U.S.80 cents in the longer term.
Fresh product: The same factors that have driven higher-income consumers in the developed world towards fresh produce will do so for the vast numbers of people entering Asia’s middle class. Within two decades, this group will comprise almost half of the world’s middle-class consumers. We are also well placed to ship to Africa. That’s a lot of growth in prospective buying power for fresh, high-quality produce from Australian producers.
Boring is beautiful: As the world’s population and income rise, so the premium on secure sources of food supply will jump. And Australia has that marvellously undervalued asset to capitalise on here: we’re boring. Reliance on Australian produce will be ‘safer’ than many alternatives, in terms of both food quality and the reliability of supply.
Gains from innovation: As a dry continent, Australia has much to gain from any technological advances that enable farmers to increase yields from poor soils and semi-arid conditions. And while Australia has largely eschewed Genetically Modified Organism (GMO) technology, we do have the potential to unlock more productive capacity by using it to support dry-land farming.
Next waves Agribusiness

Where is the next wave?
Part I – Beyond the boom
Part II – Growth strategies for Australia
Current wave: Extend the runwayMining
Next waves: Five new frontsAgribusinessGasTourismInternational educationWealth management
Future waves: Pockets of potential
Part III – Preparing for action
AppendixMethodologyAuthors
21
Next waves Agribusiness
Fish farms: Global tastes for fresh fish and seafood in a period of declining natural stocks will encourage greater investment and innovation in aquaculture. Already started, the billion-dollar Project Sea Dragon in the Top End aims to breed up to 100 million juvenile prawns a week, most destined for Asia.7
Plants as factories: The most rapid growth in business opportunities during the past decade has been in using farms for non-food production. For instance, emerging technologies raise the prospect of growing algae to create ‘green crude’ (see box).
Better water pricing: Moves to improve the pricing and management of water will clear the way for better land use. If water could be better priced and permanent trading of water rights was to be encouraged, there may be further potential to realise value from grain crops.
But there are big challengesAgribusiness may be about to reclaim centre stage as a potential prosperity driver, yet we’ll have to navigate some shoals first – especially over the next decade.
Green crude to fuel 21st century?It turns out that humble algae – the green sludge that builds up if you don’t clean your pool – can be cultivated to produce oils that can power machinery. Even better, Australia is bountiful in the three raw inputs needed to kick-start a competitive algal biofuels industry: non-arable land (which can’t be better used for agriculture), ocean water and sun.
Today, research into algae production for fuel is being spearheaded by a group of well-funded start-ups that have coalesced in San Diego in the U.S. These are companies like Sapphire Energy, Cellana and Synthetic Genomics which have deep-pocketed backers that include the likes of BP, ExxonMobil and Bill Gates’s Cascade Investment fund.
Australia’s strongest suit is likely to be combining its optimum conditions with the know-how of these well-funded biotech start-ups to foster a new industry here. This process is already underway. For example, America’s Aurora Algae recently secured a $2 million Low Emissions Energy Development (LEED) grant from the Western Australian Government to advance the production in Karratha, WA, of algae-based biomasses suitable for use in nutraceuticals, pharmaceuticals, aquaculture and renewable energy.8 7 Thompson, Brad, ‘Prawn farm venture closer’, The West Australian, 19 June 2013.
8 Aurora Algae, ‘Aurora Algae Secures Full $2 Million LEED Grant for Successful Production of Algae-Based Platform’, press release, 27 September 2012.

Where is the next wave?
Part I – Beyond the boom
Part II – Growth strategies for Australia
Current wave: Extend the runwayMining
Next waves: Five new frontsAgribusinessGasTourismInternational educationWealth management
Future waves: Pockets of potential
Part III – Preparing for action
AppendixMethodologyAuthors
22
Age will weary them: Our farmers are old, and getting older, with the average age of Australian farmers at 52, 12 years above the national average for other occupations.
Farmers are five times more likely than the average person to still be working over the age of 65 (Figure 15). The retirement of many farmers in the coming decade will mean Australia’s relatively high dependence on ‘family farms’ will come under increasing pressure. At the same time, younger workers who might have once worked on farms are now being lured into more lucrative careers, especially in mining.
Family business: Most Australian farms are family-owned, with the large majority of broad-acre and dairy farms operated by owner-managers.9 But the stats show big farms make more money than their
smaller counterparts. The largest 10% of Australian farm businesses produce over 50% of output, while the smallest 50% account for just one-tenth of output.10 So the retirement of many Australian farmers won’t just produce skill shortages on a huge scale, it will require many businesses to change hands. It has been estimated there will be a need for up to $400 billion to fund these ownership transitions. A further $600 billion may be needed by 2050 to improve the productivity of Australian farms.11
Too few students: The number of students studying for agricultural qualifications has virtually halved in the past decade, as mining and other careers have offered better prospects.12
Bridges to mend: Australia has recently rattled its trading partners and investors with moves such as cutting off live cattle exports to Indonesia. We need to rebuild trust and our reputation.
Roads to nowhere: It is fortunate that we’re close to burgeoning Asia, but within Australia much of our produce travels from farm to port on relatively inefficient roads, instead of by rail. Improving our transport mix and other infrastructure would greatly improve our competitiveness.
There are also a range of other challenges: land on Australia’s urban fringes is more valuable for residential development than horticulture; global warming is sending Australia’s rainfall to the north and west, challenging existing patterns of land use; and foreign investment in farmland is stirring passions.
Figure 15: Age distribution of farmers relative to all other occupations
600
500
400
300
200
100
0
Source: Australian Bureau of Statistics
15–1
9
20–2
4
25–3
4
35–4
4
45–5
4
55–6
4
65+
Age
536
153
100624860
88
(%)
9 Australian Bureau of Statistics, 4102.0, Australian Social Trends 2003, ‘Living arrangements: Farming Families’, 3 June 2003.10 Australian Government Productivity Commission: ‘Trends in Australian Agriculture: Productivity Commission Research
Paper’, 2005. 11 ANZ insight, Greener Pastures: The Global Soft Commodity Opportunity for Australia and New Zealand, Issue 3, October 2012.12 Allen Consulting Group, Rebuilding the Agricultural Workforce, January 2012.

Where is the next wave?
Part I – Beyond the boom
Part II – Growth strategies for Australia
Current wave: Extend the runwayMining
Next waves: Five new frontsAgribusinessGasTourismInternational educationWealth management
Future waves: Pockets of potential
Part III – Preparing for action
AppendixMethodologyAuthors
23
Positioning for prosperityThere are certainly big challenges ahead. Yet agribusiness has something most other sectors don’t: the prospect of rapid increases in global demand meeting domestic comparative advantage. This means Australia can be a long-term winner in this sector, particularly in grains, beef and dairy, wine, oil seeds and emerging areas like aquaculture.
But business and government will need to take bold steps, especially in the next 10 years as many of our biggest challenges hit home. If we do, then we’re confident that agribusiness – the forgotten hero of Australia’s economy – can rise again.
Given our challenges, can we:• Find ways to promote our safe, fresh and abundant produce to the
world more effectively?• Think laterally and invest in developing new areas of business,
including aquaculture and algae, and new regions of the country?• Invest in technologies and implement new policies and approaches
to make us a world leader in producing value from semi-arid land?• Make agribusiness attractive again to graduates, and enhance the
education we provide?• Attract the capital that will be required to manage the coming
enormous transition from family-owned to corporate farms, and the accompanying generational change?
• Improve the quality and quantity of infrastructure available to our agribusiness sector, including roads, rail and ports which are also in hot demand among miners?

Where is the next wave?
Part I – Beyond the boom
Part II – Growth strategies for Australia
Current wave: Extend the runwayMining
Next waves: Five new frontsAgribusinessGasTourismInternational educationWealth management
Future waves: Pockets of potential
Part III – Preparing for action
AppendixMethodologyAuthors
24
Global growth rate: 4.11% Australian advantage: 11.9*
Technology has revolutionised the globe’s gas production potential, increasing accessibility and reducing the cost of an energy source that is much cleaner and greener than coal or oil. This has occurred at the same time as concerns about air quality in rapidly growing cities have been catapulted to the top of political agendas in countries such as China, while various nations also seek to improve their energy security through diversification.
That’s a magic mix of global supply and demand. And it means that tapping and exporting gas is likely to continue to be one of Australia’s brightest growth engines for the next two decades – with its output growth expected to be faster than that of any other sector. Indeed, look no further than the U.S. to see how gas can re-engineer a country’s fortunes, with the burgeoning shale gas industry there helping to fuel its recovery. Some are forecasting that the U.S. could become the world’s largest energy producer as early as 2018.
The good news is that Australia has vast reserves of conventional and unconventional gas. Even better, there is some $200 billion worth of shiny new infrastructure under construction and due to come online by 2017, just as global demand is booming. And global demand for gas could potentially expand further. For all these reasons, gas sits high on our list in terms of global growth potential and Australian advantage.
But can we keep our good run going? The combination of global opportunity and Australian potential is no guarantee that the Lucky Country will be so lucky again.
There are big question marks over whether Australia can continue to attract the high levels of investment needed to capitalise on our natural good fortune. Have we made ourselves so expensive and difficult to deal with that we get passed by? Might we see our biggest opportunity become just another good line of business for Australia Ltd?
It’s a revolutionThe oil and gas industry will soon make up about 2% of Australia’s economy, with the majority of that now coming from gas. Australia’s output of liquefied natural gas (LNG) is expected to rise by 250% between now and 2017–18. If we achieve that, we could surpass Qatar to become the world’s top LNG producer.
This growth is occurring because gas has commanded a huge share of this nation’s capital spending in recent years, with the construction of plants across western and northern Australia (including Queensland’s Curtis Island) representing about one in every three dollars of the nation’s entire business investment spend.13
This boom has been further fuelled by Japan’s post-Fukushima desire to move away from nuclear power and towards gas-based energy. Yet the popularity of gas is more widely based than that. It is clean and green in a way that coal and oil are not, and this is driving demand among countries looking to lift air quality and cut greenhouse gases.
Next waves Gas
How lucky can we get?
13 Deloitte Access Economics, ‘Building prosperity: Harnessing Australia’s comparative energy advantage’, APPEA conference paper, 12 May 2011.
* Our Australian advantage score ranges from 1.0 to 16.2, as shown in Figure 7 and discussed in Part I and the Methodology.

Where is the next wave?
Part I – Beyond the boom
Part II – Growth strategies for Australia
Current wave: Extend the runwayMining
Next waves: Five new frontsAgribusinessGasTourismInternational educationWealth management
Future waves: Pockets of potential
Part III – Preparing for action
AppendixMethodologyAuthors
25
Most tantalisingly, it has been estimated that there is up to another $180 billion in gas projects under consideration in Australia. If these were all to go ahead, they could create 150,000 jobs and deliver tax revenue of $5 billion a year.14
Our advantagesWe’re blessed: After coal and uranium, gas is our third-largest energy resource. In addition to holding large reserves of conventional gas – mainly in the Bonaparte, Browse and Carnarvon basins – we have a maturing coal seam gas industry and the seventh-highest amount of technically recoverable shale gas in the world.15
Enormous demand: The demand for gas is vast. As the U.S. has demonstrated, countries keen on clean city air see gas as a great substitute for coal in power generation. To put that in perspective, on an energy-equivalent basis China consumes about six times the global LNG market in coal for power and heat generation. LNG can also power mining and construction equipment, trains and trucks. Plus, new, more restrictive rules on marine fuel emissions are opening up a market for LNG in shipping. Even if only a tiny portion of all this demand eventuates, the global gas market will be enormous. China, for example, is expected to increase imports of LNG tenfold between 2010 and 2030.
Open markets and strong partners: Australia is one of only a few countries that allows foreign investors to take a direct ownership share in gas fields, and to separate surface and mineral rights in ways that facilitate access to resources. This has helped us become an investment location of choice for global players wanting secure access to energy. And now that a Who’s Who of international and state-owned oil companies have committed billions of dollars to local projects, they share an interest in ensuring the success of the Australian industry.
Source: BP 2011
Figure 16: Asia-Pacific LNG demand (mtpa), 2011
Japan
India
South Korea
China
Taiwan
52%
8%
8%
8%
24%
Japan
India
South Korea
China
Taiwan
Source: Institute of Energy Economics Japan 2011
Figure 17: Asia-Pacific LNG demand (mtpa), 2030
39%
16%
14%
8%
23%
14 McKinsey & Co., ‘Extending the LNG Boom: Improving Australian LNG productivity and competitiveness’, April 2013.15 U.S. Energy Information Administration, ‘Technically Recoverable Shale Oil and Shale Gas Resources: An Assessment of 137
Shale Formations in 41 Countries Outside the United States’, June 2013.

Where is the next wave?
Part I – Beyond the boom
Part II – Growth strategies for Australia
Current wave: Extend the runwayMining
Next waves: Five new frontsAgribusinessGasTourismInternational educationWealth management
Future waves: Pockets of potential
Part III – Preparing for action
AppendixMethodologyAuthors
26
Head start on the competition: Gas is an example of a wave that lifts all boats, but none equally. For instance, although the U.S. is now a global player in gas it could face internal opposition to exports if they lifted domestic prices. Canada is yet to fix its tax regulations to spur investment, and locals are opposed to pipelines winding through their backyards from gas fields to the coast. Across the Bering Strait, Russia can build pipelines to China but it has also wielded access to gas as part of its foreign policy, so it would need to reassure buyers it is a stable supplier that can commit to 30-year deals.
Location: Gas is difficult and costly to store and move, so Australia’s location near key buyers in Asia is a significant source of competitive advantage.
Yet we could blow itThe extraordinary thing is we’re doing our best to blow our lead in gas by becoming a high-cost, high-regulation and somewhat fickle investment destination.
High costs: Even ignoring the impact of the high A$, the cost of labour and critical inputs has skyrocketed in Australia over the past few years. This has made the cost of building LNG projects higher in Australia than alternatives such as east Africa and North America. The culprits are low productivity, weak innovation and a lack of collaboration within the sector and with government. Accordingly, although the global opportunity is great, on current indications, Australia’s share of the next round of global go-aheads may be very small. Hence, although the current round of investments is turbocharging the outlook for Australian output, cost concerns will need to be addressed to power us beyond 2020.
Next waves Gas
80
70
60
50
40
30
20
10
0
Out
put
(A$
billi
on)
2011 2013 2015 2017 20192021 2023 2025
Years
Source: Deloitte Access Economics
BaselinePipeline of projects and investment
Figure 18: Oil and gas industry output profile, existing and new developments

Where is the next wave?
Part I – Beyond the boom
Part II – Growth strategies for Australia
Current wave: Extend the runwayMining
Next waves: Five new frontsAgribusinessGasTourismInternational educationWealth management
Future waves: Pockets of potential
Part III – Preparing for action
AppendixMethodologyAuthors
27
Regulatory burden and sovereign risk: As well as changing the tax rules applying to gas-related projects and multinational companies, successive Australian governments have introduced green and red tape that is slowing projects and discouraging groups from starting new ones. Combined with vacillation over climate change policy, these moves have made Australia less predictable to global investors and have left us saddled with a reputation for sovereign risk.
Positioning for prosperitySo, gas is big. While there are plenty of headlines about alternative gas and renewable energy sources, the reality is that the world’s energy mix will stay fairly consistent for at least the next 5 to 10 years. And a major and growing part of that mix will be gas.
Ensuring that Australia realises the full potential of gas will revolve around our ability to intervene to improve productivity, enhance infrastructure and make our regulatory environment more attractive to investors and operators.
A critical priority is securing the next round of gas investments from deep-pocketed global investors before those dollars head off to North America or Africa. To win this money, we need to show that Australia can deliver a high-quality product at globally competitive prices for many years to come. Right now, no one is questioning our quality or ability to deliver, but everyone is worried about rising costs and complexity.
Australia should start by controlling what it can, which primarily means taxes and regulations. With that in mind, some issues to consider are:• Is there room to streamline visa requirements for gas sector
workers?• Could we review regulatory and approval frameworks to reduce
unnecessary duplication and obstacles?• Can we set firm policies on taxation, climate change and carbon
trading? • Could the development of unconventional gas sources be better
supported, and can this new industry do more to reassure concerned communities and authorities?
• Is there scope to lower costs through greater collaboration, better sharing of infrastructure including pipelines and ports, and improved planning across all areas of the resources value chain?
Realising the full potential of gas will depend on our ability to improve productivity, enhance infrastructure and make our regulatory environment more attractive to investors and operators.
Next waves Gas

Where is the next wave?
Part I – Beyond the boom
Part II – Growth strategies for Australia
Current wave: Extend the runwayMining
Next waves: Five new frontsAgribusinessGasTourismInternational educationWealth management
Future waves: Pockets of potential
Part III – Preparing for action
AppendixMethodologyAuthors
28
Next waves Tourism
Opening our doors to a new generation
Global growth rate: 4.08% Australian advantage: 8.2*
Brand Australia has long lauded its natural wonders, wide-open spaces, distinctive landmarks, fine food and wine, and sophisticated urban centres in order to lure foreign visitors. This strategy has largely worked. In 2012–13, international visitor arrivals increased another 5% and those guests spent $19.3 billion in Australia.16
Yet there are important challenges. Visitor numbers may be growing, but the last decade saw them grow at only about one-third the rates seen in the 1980s and 1990s.
However, there is a lot more potential growth in the pipeline, with tourism projected to be among the world’s fastest growing industries. Our forecasts have it growing 4% a year from now to 2033 – that is, more than doubling in size over the next two decades. Even better, many of those new travellers will depart from Asia. China is already our second-biggest source of tourists and has the largest spend per visitor. As Figures 19 and 20 show, the prominence of China and more broadly Asia will only grow over time.
New Zealand
U.S.
China
Other Europe
Japan
Canada
India
Other countries
Other Asia
U.K.
New Zealand
U.S.
China
Other Europe
Japan
Canada
India
Other countries
Other Asia
U.K.
Source: Australian Bureau of Statistics
Figure 19: Share of visitors by international source market, 2013
Source: Deloitte Access Economics
Figure 20: Share of visitors by international source market, 2033
11%
7%
19%
14%
3%
28%
14%
4%
6%
8%
9%
13%
6%
24%
11%
8%
2%
1%
3%
10% Total visitor trips 6.2 million
Total visitor trips 13.6 million
16 Tourism Research Australia, International Visitors in Australia: June Quarter 2013.
* Our Australian advantage score ranges from 1.0 to 16.2, as shown in Figure 7 and discussed in Part I and the Methodology.

Where is the next wave?
Part I – Beyond the boom
Part II – Growth strategies for Australia
Current wave: Extend the runwayMining
Next waves: Five new frontsAgribusinessGasTourismInternational educationWealth management
Future waves: Pockets of potential
Part III – Preparing for action
AppendixMethodologyAuthors
29
Next waves Tourism
Why we can winAustralia looks set to enjoy outsized gains from this new travel wave, aided by our attractions, a fall in the A$ and a conscious growth strategy across the tourism industry and our governments. Specifically, demand for Australian tourism is driven by:
Proximity to Asia: Australia is ideally located to capitalise on the burgeoning Asian middle class and the demand for international travel that this is generating.
Beautiful natural assets: Australia has nearly 60,000 kilometres of mostly unadulterated shoreline, an average of 3,000 hours of sunshine a year, and a variety of climates from sunny, tropical or Mediterranean, to snowy. Our land features are varied, including rainforests, urban areas and, of course, our coveted beaches and outback. We also offer spectacular destinations including Sydney Harbour, the Great Barrier Reef, Kakadu and the Uluru-Kata Tjuta national parks.
Safety and languages: Australia is a politically and environmentally safe destination, largely free of the strife that marks many exotic locations around the world. We also offer the convenience of being both English-speaking and offering other languages due to our multicultural heritage.
Cheaper flights: Increased air access, greater levels of competition and low-cost carriers offering more flights into Australia have created many more affordable options for tourists and business travellers.
Education as a drawcard: The calibre of our educational sector encourages foreign students to become ‘education tourists’ who in turn encourage friends and family to visit.
The need to renew our infrastructureAn earlier generation of European and American tourists were attracted to Australia by our beaches and outback. While these drawcards remain, tourists from Asia also seek high-end experiences and entertainment. Unfortunately though, our tourism infrastructure hasn’t always kept pace with this changing demand. We face other obstacles as well.
Trouble getting about: Travelling to and around a big country like Australia is a logistical challenge made more difficult when transport corridors are clogged, or near capacity. The government projects that by 2020, domestic aviation capacity will have to grow by up to 30% and international aviation capacity by up to 40% to handle increased visitor numbers. For those arriving by sea the story is much the same – our port infrastructure needs to be upgraded to support the world’s biggest cruise liners. Some of our busiest roads and highways also need upgrades to handle the demands projected to be placed on them.
17 Australian Bureau of Statistics.

Where is the next wave?
Part I – Beyond the boom
Part II – Growth strategies for Australia
Current wave: Extend the runwayMining
Next waves: Five new frontsAgribusinessGasTourismInternational educationWealth management
Future waves: Pockets of potential
Part III – Preparing for action
AppendixMethodologyAuthors
30
Too few rooms: The most immediate constraint from a traveller’s perspective is simply getting a room at the inn. Since 2004, accommodation use has increased by an average 3% p.a., whereas the supply of rooms in capital cities has only increased by 2% p.a.17 Although there are signs that rising profitability and the coordinated promotion activities of industry and government are spurring investment, the industry will have to work hard to meet the Tourism 2020 target of 40,000 additional rooms. As Figure 21 shows, although we are making good progress in airline capacity, it is in building new rooms that the industry’s performance has been most lacking to date.
Scarce skills: The mining boom has had an impact on the number of workers available to fill hospitality positions, with industry analysis estimating that about 35,000 jobs may be unfilled.18 The critical challenge of ensuring we have a tourism workforce capable of giving visitors a world-class experience will remain.
Figure 21: Tracking progress against Tourism 2020 targets
Source: Tourism Research Australia
Aviation capacity – international
Aviation capacity – domestic
Potential – domestic
Labour
Potential – all sectors
Accommodation – room supply
Potential – international
0 10 20 30 40 50 60 70 80 90 100
42
30
17
13
9
2
2
(%)
Challenges of a cottage industry: A quaint bed and breakfast is very appealing for a weekend getaway, but the dominance of smaller Australian tourism operators can result in a fragmented experience for visitors. The industry is seeking to resolve this with solutions such as the Australian Tourism Data Warehouse to centralise content and facilitate the distribution of tourism offerings.
Positioning for prosperityTo make the most of this potential growth wave, we need to ensure that the attractiveness of Australia’s unique tourism assets outweighs the limitations of our tourism industry.
In addition to rolling out effective marketing campaigns, we need to be investing in the tourism infrastructure, hotel capacity and people skills that will be required to comprehensively support larger numbers of tourists with more diverse tastes.
The questions here are:• Do we have a truly national and shared vision for the future of our
tourism sector?• Are we investing in the tourism infrastructure that Asian tourists
will want?• Does the position of tourism within government need to be
elevated?• Is there greater room for cooperation between industry and our
three layers of government?• Could we be doing more to exploit the link between tourism and
our other globally oriented industry sectors, such as education and financial services?
18 Deloitte estimate, 2011.

Where is the next wave?
Part I – Beyond the boom
Part II – Growth strategies for Australia
Current wave: Extend the runwayMining
Next waves: Five new frontsAgribusinessGasTourismInternational educationWealth management
Future waves: Pockets of potential
Part III – Preparing for action
AppendixMethodologyAuthors
31
Next waves International education
Going to the top of the class
Global growth rate: 3.90% Australian advantage: 8.0*
Teaching foreign students is Australia’s fourth-biggest export earner, generating $15 billion a year in income and employing about 100,000 Australians.19
Growth in this industry has increased expertise and infrastructure, creating economies of scale over and above those usually available to a nation of 23 million people.
Although we may never compete on a level playing field with the likes of the U.S. and the U.K. with their huge populations and elite institutions, there’s no doubt we’re riding this wave for all its worth, with a remarkable market share given our size.
The future potential is also enormous as the emerging economies of today will become the knowledge economies of tomorrow.
Global demand for educational services is about to soar as a result, and is expected to swell by about 7% a year between now and 2020. The rise of China and India, in particular, will be central to the growth in globally mobile students.20
Figure 22: Market share of foreign students in tertiary education
25
22.5
20
17.5
15
12.5
10
7.5
5
2.5
0
Source: OECD, Education at a Glance 2012
Unite
d St
ates
Unite
d Ki
ngdo
m
Austr
alia
Germ
any
Japa
n
Fran
ce
New
Zea
land
Cana
da Italy
Country
Mar
ket
shar
e (%
) 16.6
22.9
6.36.66.6
5.1
3.43.2
13.0
10.8
4.74.6
6.4
9.0
1.70.4
1.71.2
2000 2010
19 Research Snapshot, Australian Education International, May 2013.20 van Onselen, Leith, ‘Temp migration to boom on Chinese students?’ Macro Business (macrobusiness.com.au) citing HSBC
research, 20 June 2013.
* Our Australian advantage score ranges from 1.0 to 16.2, as shown in Figure 7 and discussed in Part I and the Methodology.
Where is the next wave?
Part I – Beyond the boom
Part II – Growth strategies for Australia
Current wave: Extend the runwayMining
Next waves: Five new frontsAgribusinessGasTourismInternational educationWealth management
Future waves: Pockets of potential
Part III – Preparing for action
AppendixMethodologyAuthors
32
Next waves International education
Figure 23: Global growth in foreign student enrolments
Source: University World News 2012
800
700
600
500
400
300
200
100
0
Stud
ent
num
bers
(‘00
0s)
AustraliaU.S. U.K. Canada
2000 2001 2002 2003 2004 2005 2006 2007 20102008 20112009
Years
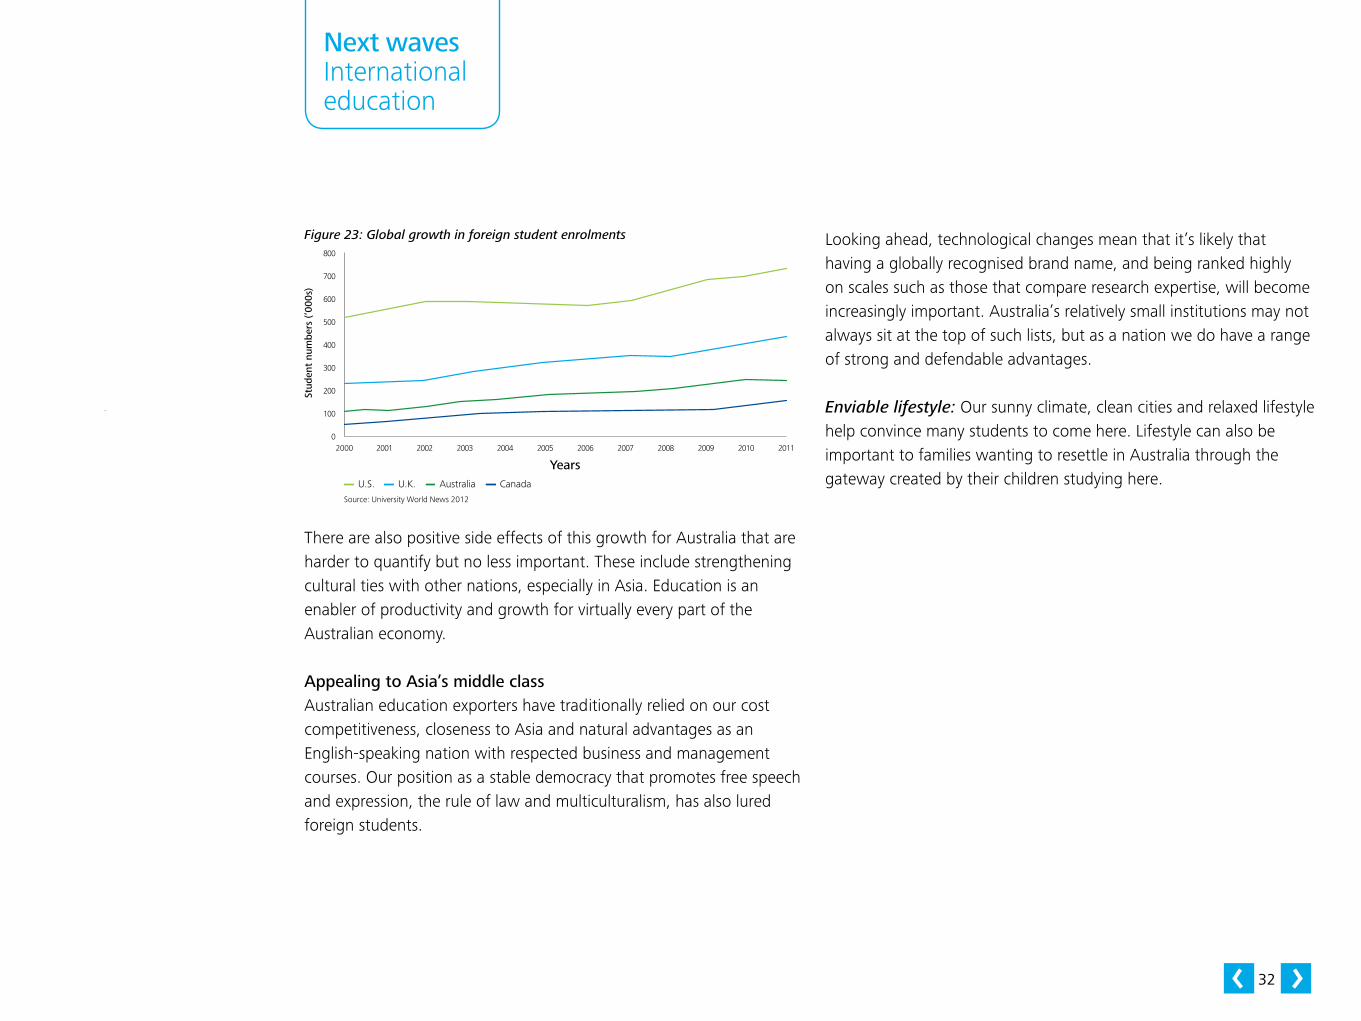
There are also positive side effects of this growth for Australia that are harder to quantify but no less important. These include strengthening cultural ties with other nations, especially in Asia. Education is an enabler of productivity and growth for virtually every part of the Australian economy.
Appealing to Asia’s middle classAustralian education exporters have traditionally relied on our cost competitiveness, closeness to Asia and natural advantages as an English-speaking nation with respected business and management courses. Our position as a stable democracy that promotes free speech and expression, the rule of law and multiculturalism, has also lured foreign students.
Looking ahead, technological changes mean that it’s likely that having a globally recognised brand name, and being ranked highly on scales such as those that compare research expertise, will become increasingly important. Australia’s relatively small institutions may not always sit at the top of such lists, but as a nation we do have a range of strong and defendable advantages.
Enviable lifestyle: Our sunny climate, clean cities and relaxed lifestyle help convince many students to come here. Lifestyle can also be important to families wanting to resettle in Australia through the gateway created by their children studying here.

Where is the next wave?
Part I – Beyond the boom
Part II – Growth strategies for Australia
Current wave: Extend the runwayMining
Next waves: Five new frontsAgribusinessGasTourismInternational educationWealth management
Future waves: Pockets of potential
Part III – Preparing for action
AppendixMethodologyAuthors
33
Next waves International education
English is spoken inside and outside the class: The past few decades have seen English cement its position as the world’s business language and its de facto cultural communication standard. That puts Australia’s education providers on an equal footing with the other leading educational destinations of the U.S. and the U.K.
A path to residency: Australia’s many attractions will sustain its position as one of the world’s top ‘migrant magnets’ (alongside Canada and the U.S.). Studying here will remain a great ‘try before you buy’ opportunity for students, meaning we can sell both education and migration potential. Today, about one-third of overseas students stay in or return to Australia once they have completed their studies.
Specialist courses: We have a competitive advantage in fields derived from the quirks of nature and history. For instance, Australia is a great place to study courses related to natural resources, such as geology and engineering. Our heritage as a dry continent also means we have expertise in arid agriculture, and land and water conservation and management – skills in great demand in the Middle East, for instance.
Research strength: Australia’s investment in R&D and rigorous intellectual property protection make it a compelling place to bring new ideas to life. The new Australian Research Committee has noted our competitiveness as a place to do applied postgraduate research, then continue on into related jobs.
Old school ties: Our secondary school system is especially valued by overseas students and is seen as a path into tertiary education. Studying here in the formative secondary years also helps students acclimatise to the Australian way of life and build support networks that are useful as they continue their education and move into the workforce.
Competing in the global schoolyardWhile the global education market will grow, there are formidable challenges for Australia to overcome.
These threats include the global ambitions and deep pockets of American Ivy League universities and other top institutions being turbocharged by new technologies that place them just a click away from students. The arrival of Massively Open Online Courses (MOOCs) also provides a way to educate huge numbers of students at little to no extra marginal cost per individual. MOOCs are yet to replace classroom tuition but they represent a growing challenge to our institutions, especially those that compete with global brands.
Another issue is that international student enrolment growth rates declined between 2009 and 2013, due to the perceived poor value of some of our qualifications and high costs resulting from a strong A$. There have been times in recent years when it has cost more to study in Australia than in the U.S. or the U.K., though fortunately this issue is receding as the dollar falls.
Finally, the low prestige associated with teaching in Australia has deterred generations of potential educators from joining the profession. The flow-on effect of this has been low tertiary entry scores for aspiring teachers (to encourage students into the profession) and a subsequent decline in the quality of teaching.
Education is an enabler of productivity and growth for virtually every part of the Australian economy.

Where is the next wave?
Part I – Beyond the boom
Part II – Growth strategies for Australia
Current wave: Extend the runwayMining
Next waves: Five new frontsAgribusinessGasTourismInternational educationWealth management
Future waves: Pockets of potential
Part III – Preparing for action
AppendixMethodologyAuthors
34
Next waves International education
Figure 24: Offshore international student visa grants
250
200
150
100
50
0
Off
shor
e gr
ants
(‘00
0s)
2005–06 2006–07 2009–102007–08 2010–112008–09 2011–12
Source: DIAC 2012
Note: VET = Vocational education and training; ELICOS = English-language courses for overseas students.
YearsVET sector ELICOS Schools OtherInternational education sector
Positioning for prosperityAustralia is at a critical juncture in its education policy. On the one hand, effective and targeted changes could deliver significant benefits in terms of global competitiveness and export earnings, while providing the skills needed to enable other parts of the economy. On the other, the sector is facing serious challenges that will require bold action.
Some important questions to address here are:• How can we tailor courses to meet the needs of foreign students,
especially in areas of unique strength such as dry-land agriculture, the environment and engineering?
• Are there ways to lift the quality of our teaching staff, for instance,
by improving the status of educators at home or looking overseas for teachers, especially those with Asian perspectives?
• Could we do more to forge links between Australian educational facilities and overseas leaders to ensure we can offer superior higher educational ‘products’ in a more global and digital marketplace?
• How can we reduce red tape and restrictive visa rules that inhibit student migration? In particular, how can we retain top performers in Australia?
• Could we combat the perception that Australia is a high-cost place to study, by better articulating the value that students gain by studying here?
• Would we benefit from proactively adopting enabling technologies – such as MOOC collaboration middleware and broadband – to facilitate research, meet overseas students’ expectations and help Australian institutions to remain globally competitive?

Where is the next wave?
Part I – Beyond the boom
Part II – Growth strategies for Australia
Current wave: Extend the runwayMining
Next waves: Five new frontsAgribusinessGasTourismInternational educationWealth management
Future waves: Pockets of potential
Part III – Preparing for action
AppendixMethodologyAuthors
35
Next waves Wealth management
Our super platform
Global growth rate: 3.81% Australian advantage: 7.6*
Two trillion dollars, a sophisticated finance sector and Asian growth: that’s the short version of why Australia has a shot at being a global competitor in the business of managing people’s money and becoming a more significant global financial centre.
Funds under management (FUM) in Australia now total about $2.1 trillion, split among superannuation (about $1.5 trillion), life insurance, retail unit trusts and other vehicles.21
That is mainly local money being managed for 11 million Australian superannuation members.22 But as the fourth-largest such pool worldwide, it’s a big base and one that is expected to more than triple in size to reach $7.6 trillion in 2033.
Figure 25: Projected superannuation assets, 2012–33
8,000
7,000
6,000
5,000
4,000
3,000
2,000
1,000
0
Source: Deloitte Actuaries & Consultants
2012
2013
2014
2015
2016
2017
2018
2019
2020
2021
2022
2023
2024
2025
2026
2027
2028
2029
2030
2032
2033
2031
Years
$bill
ion
(%)
Post-retirement assetsPre-retirement assets
Two trillion dollars, a sophisticated finance sector and Asian growth: that’s the short version of why Australia has a shot at being a global competitor in the business of managing people’s money.
21 Australian Bureau of Statistics, 31 March 2013, www.abs.gov.au/ausstats/[email protected]/mf/5655.0.
22 Deloitte Actuaries & Consultants, ‘The Dynamics of the Australian Superannuation System: the next 20 years 2011–2030’, 2013.
* Our Australian advantage score ranges from 1.0 to 16.2, as shown in Figure 7 and discussed in Part I and the Methodology.

Where is the next wave?
Part I – Beyond the boom
Part II – Growth strategies for Australia
Current wave: Extend the runwayMining
Next waves: Five new frontsAgribusinessGasTourismInternational educationWealth management
Future waves: Pockets of potential
Part III – Preparing for action
AppendixMethodologyAuthors
36
Next waves Wealth management
Couple the size of our FUM with the growth of wealth in Asia – more than 3 billion people in Asia are forecast to become middle class by 2030, and by 2050 the region is expected to be home to more than half of the world’s financial assets – and you get a huge pot of untapped demand, and a potentially high-growth story for Australia.
Expertise, skills and cultural tiesSome reasons Australia can expect to succeed in the wealth management arena include our:
Savings model: Australia’s defined contribution savings model is 15–20 years ahead of the prevalent defined benefit model used in most other developed economies. This means we’re well placed to advise and influence the emerging Asian pension industry which is moving more towards our defined contributions model. This will create a growing opportunity to provide advice on operating and improving pension systems, and associated technologies. Skilled workforce: The scale of Australia’s funds management industry has supported the growth of a relatively large and skilled workforce. Our professionals are especially adept at asset allocation, managing very large funds, tracking indices, and designing and selling products to manage longevity risk. In addition, Australian superannuation funds are increasingly investing offshore which is broadening their capabilities and experience.
Trusted reputation: While the GFC wasn’t fun, it did cement Australia’s reputation as a safe investment location with sound financial institutions, a world-class financial regulatory framework and strong professional services firms. This picture is rounded out by our largely stable business sector and 22 years of consistent economic growth.
Recent improvements: Australia has recently addressed a number of the obstacles to becoming a larger financial centre. This includes introducing the Investment Manager Regime to provide greater tax certainty to foreign investors and working with other governments to develop the concept of an Asian Region Fund Passport, which should make it easier and cheaper to manage funds regionally through the harmonisation of regulatory frameworks. In 2013, Australia also became the third country to enter into an agreement to trade the Chinese renminbi (RMB) directly on the Chinese mainland.
Cultural ties: After years of immigration, educational exchange, business activity and political cooperation, there are now many close ties between Australians and their counterparts in Asia. These range from young people to ASX 200 Chairs and CEOs who, as Deloitte’s latest Board Effectiveness Survey found, are taking a much greater interest in the region. This is a subtle source of competitive advantage which will be hard for other nations to quickly replicate.

Where is the next wave?
Part I – Beyond the boom
Part II – Growth strategies for Australia
Current wave: Extend the runwayMining
Next waves: Five new frontsAgribusinessGasTourismInternational educationWealth management
Future waves: Pockets of potential
Part III – Preparing for action
AppendixMethodologyAuthors
37
Leveraging our strengthsWhen it comes to building exports, the three areas in which our wealth management industry is most likely to play are managing funds for foreign investors, advising other nations on how to build their own wealth management sectors, and supplying tools to help them do so. Across our financial services industry, there is scope to also earn income from marketing locally created financial instruments such as bonds overseas as well as expand our banking services in Asia.
Investing for othersToday, only $75 billion of the FUM in Australia is being managed on behalf of foreign investors.23 We believe there is significant room to grow this pool, but that doing so will require us to address the tax and regulatory issues – many identified in the 2009 Johnson Report – that have prevented Australia from becoming a global financial services hub.
One area of potential strength is attracting more funds from Islamic groups in Asia and the Middle East for investment in Australian assets. Our investment offerings are capable of being Sharia-compliant because they are underpinned by physical assets such as farms, mines and real estate. Offering advice and toolsAsia is set to become home to about half of the world’s elderly. The United Nations predicts China’s current 180 million people over 60, for instance, will reach 487 million in 2050, driving a growing need for pension-style products in the Asian region.
This ageing and shrinking population will change the dynamics of one of the Asian nations’ main economic drivers – their populous workforces. Australia’s defined contributions retirement savings model, with its associated regulatory controls over financial advice, will be attractive to mitigate the results of this ageing through the creation of sustainable pension systems.
We can also profit from sharing our experience of adapting to the needs of Australia’s own ageing population as our baby boomers retire and shift their superannuation savings from accumulation to drawdown phases. This includes capabilities in products such as annuities and post-retirement insurance designed to meet the needs of those who are under-funded.
Another export-ready product is the technology platforms we have developed for managing wealth in Australia. These ‘wrap’ platforms and other systems allow large retail superannuation businesses to offer up to 600 investment options to consumers.
23 Australian Bureau of Statistics, 31 March 2013, www.abs.gov.au/ausstats/[email protected]/mf/5655.0.

Where is the next wave?
Part I – Beyond the boom
Part II – Growth strategies for Australia
Current wave: Extend the runwayMining
Next waves: Five new frontsAgribusinessGasTourismInternational educationWealth management
Future waves: Pockets of potential
Part III – Preparing for action
AppendixMethodologyAuthors
38
Next waves Wealth management
Creating bondsWith Australia’s proven ability to create financial instruments for global sale, there is an opportunity to expand our government and private bond markets and make them larger export earners. If we can break down the restrictions on inward and outward capital flows this has the potential to further open up Asia’s rich pools of savings.
Creating instruments that appeal to local and foreign investors would have the added benefit of providing new sources of capital to Australia’s high-growth and capital-intensive industries such as agribusiness and tourism, as well our many small-to-medium enterprises.
Banker to the regionAt the corporate and institutional level, there is scope for Australia’s banks to ride on the coat-tails of our own strong export sectors along with wider Asia-Pacific growth.
Our banks have competitive expertise in infrastructure financing, agribusiness and complex construction projects. They are also becoming increasingly adept at managing systemic risk through insurance and financial markets, and at facilitating portfolio investments for Asian businesses in Asia.
For example, Asia-Pacific lending and syndicated loan volumes were up 16% to U.S.$164.5 billion in the first half of 2013, compared with the previous period.24 Australia’s four banks ranked in the top 10, with ANZ a close second to Bank of China as mandated arrangers.
Positioning for prosperityAustralia can leverage its strong domestic wealth management story to tap into the burgeoning Asian wealth industry and other opportunities in the financial sector. But we’ll need to play our cards right to compete with the region’s major financial centres such as Hong Kong and Singapore. Just some of the difficult questions to answer are:• Can we further streamline our regulatory environment?• What incentives do we need to put in place to attract global
savings to Australia?• Could we leverage our trade integration with financial firms,
governments and companies to market our wealth management capabilities overseas more effectively?
• Are there ways to improve and capitalise on our cultural ties with individuals, business organisations and governments across Asia and beyond?
24 Australasian Banking & Finance, July 2013.

Where is the next wave?
Part I – Beyond the boom
Part II – Growth strategies for Australia
Current wave: Extend the runwayMining
Next waves: Five new frontsAgribusinessGasTourismInternational educationWealth management
Future waves: Pockets of potential
Part III – Preparing for action
AppendixMethodologyAuthors
39
Future waves
T O B E
E A R L Y 2 0 1 4
RELEASED
Pockets of potential
Pockets of growth can be found in the big and primarily domestic sectors that make up the bulk of our economy.
Figure 26: Australia’s future growth waves
Australian advantage (right is stronger)Source: Deloitte Access Economics
TourismGas
Agribusiness
International education
Wealth management
Mining
Glo
bal o
ppor
tuni
ty (G
GD
P gr
owth
, hig
her
is s
tron
ger)
<GGDP
~GGDP
>GGDP
-10% GGDP
+10% GGDP
Manufacturing
Media
ICT
Construction
Telecommunications
Banking
Business and property services
Transport and logistics
Oil
Public administration
Health
Other education and trainingRetail and wholesale
Water and waste services

Where is the next wave?
Part I – Beyond the boom
Part II – Growth strategies for Australia
Current wave: Extend the runwayMining
Next waves: Five new frontsAgribusinessGasTourismInternational educationWealth management
Future waves: Pockets of potential
Part III – Preparing for action
AppendixMethodologyAuthors
40
Future waves
The five super-growth sectors discussed so far – agribusiness, gas, tourism, international education and wealth management – all have clear and obvious potential to generate export dollars for Australia.
They are in industries expected to grow well in excess of GGDP, plus we have natural advantages in each, and all lend themselves to foreign sales.
But what about the 14 other major sectors on our map – the big, domestically focused group that makes up the bulk of our economy, but isn’t expected to grow so strongly or always offer such strong sources of differentiation?
This includes banking, health, construction, business and property services, transportation and logistics, public administration, manufacturing, domestically focused education and training, retail and wholesale, water and waste services, and technology, telecommunications and media.
Our view is that these sectors all have potential to generate substantial pockets of export business. Indeed, even our high-growth opportunities like export-orientated agribusiness have emerged from large domestic industries. There are also the examples of wealth management emerging from financial services and banking, and international education being carved out from education as a whole.
The interesting question – which we’ll explore in 2014 as we continue this research into a growth strategy for Australia – is: where might these potential pockets lie? Can our construction and engineering giants continue to expand around the world? Can our banks build international franchises? Could we reclaim our place in global manufacturing as technology shifts competitive advantage from low-cost labour to high-impact smarts?
We believe the answers will be yes, if we play our cards right. We also think that success will be supercharged by better aligning these sectors with our export-oriented standard bearers like mining, gas, agribusiness and tourism.
These are the areas where other Australian businesses will find strength and differentiation, and fellow Australians holding doors open for them.
Future waves have the potential to generate substantial pockets of export business.
T O B E
E A R L Y 2 0 1 4
RELEASED

Where is the next wave?
Part I – Beyond the boom
Part II – Growth strategies for Australia
Current wave: Extend the runwayMining
Next waves: Five new frontsAgribusinessGasTourismInternational educationWealth management
Future waves: Pockets of potential
Part III – Preparing for action
AppendixMethodologyAuthors
41
Part III
Preparing for action

Where is the next wave?
Part I – Beyond the boom
Part II – Growth strategies for Australia
Current wave: Extend the runwayMining
Next waves: Five new frontsAgribusinessGasTourismInternational educationWealth management
Future waves: Pockets of potential
Part III – Preparing for action
AppendixMethodologyAuthors
42
Creating opportunities for growthThis report analyses where global opportunities and Australia’s advantages will coincide to create growth opportunities for our economy. So far, we’ve focused on five new high-growth waves, and asked how we can extend mining’s extraordinary run for as long as possible.
But recognising that Australia’s prospects are as bright as they were a decade ago is not in itself enough. How can our country’s businesses and governments apply these insights to their specific situations? And what must we all do to advance Australia’s cause?
The answer lies in understanding where companies are positioned today, and identifying the best ways to move towards areas of higher growth and greater advantage.
Government can play a role here too. Yet it is worth underscoring that although government policies can help, success or failure lies more in the aggregate actions of the business world.
Figure 27: Mapping proximity to prosperity for Australian industry sectors
Mining
Business and property services
Australian advantage (right is stronger)
Transport and logistics
Oil
Public administration
Health
TourismGas
Agribusiness
International education
Wealth management
Other education and trainingRetail and wholesale
Water and waste services
Proximity to prosperity:
HighVery high LowMedium
Manufacturing
Media
ICT
Telecommunications
Source: Deloitte Access Economics
Glo
bal o
ppor
tuni
ty (G
GD
P gr
owth
, hig
her
is s
tron
ger)
<GGDP
~GGDP
>GGDP
-10% GGDP
+10% GGDP
Construction Banking
What is your proximity to prosperity?Every business needs to be a part of this conversation. In the same way that we have considered how a range of Australian industry sectors are positioned to grow over the next two decades, individual companies can review how they are positioned to succeed in the future. This means asking ‘What is our proximity to prosperity today?’ and ‘Are we on track to move closer to prosperity, or not?’
Our earlier map of industry sectors can be viewed this way.

Where is the next wave?
Part I – Beyond the boom
Part II – Growth strategies for Australia
Current wave: Extend the runwayMining
Next waves: Five new frontsAgribusinessGasTourismInternational educationWealth management
Future waves: Pockets of potential
Part III – Preparing for action
AppendixMethodologyAuthors
43
Sectors with an outstanding potential growth story, such as gas and agribusiness, enjoy a ‘very high’ proximity to prosperity. This comes from being positioned in markets that are expected to grow strongly globally over the next 20 years, and from doing business in areas where Australia enjoys a disproportionate advantage over our competitors.
Mining, oil and health all have a ‘high’ proximity to prosperity either because these sectors are set to grow fast, or because Australia finds itself in a position of strength. At the other end of the scale, sectors like manufacturing will need to make their way unassisted by exceptional global growth or inherent Australian advantages.
Yet these are generalisations. Each business will occupy different niches, and sometimes operate across more than one sector. The challenge for leaders is to determine where their company sits on the map and – most importantly – how to move closer to prosperity as Australia’s sector growth drivers change gear.
Moving to a new position The more Australian enterprises that can increase their proximity to prosperity as we move further into the current century, the better for all of us. For any particular organisation, the goal will be either to move up on the proximity to prosperity map (Figure 27) towards higher growth markets, or to move to the right to enhance their unique advantages in tapping into those markets.
There are five primary levers that companies and governments can use to achieve this. These start with identifying the organisation’s current status, then reviewing its capabilities in terms of competencies and structural advantages. The levers also focus on how organisations allocate resources and change their portfolios to increase their exposure to growth opportunities. These steps are effectively ways of hitting ‘forward’ and ‘fast forward’ to shape the future for our companies and Australia’s economy.
The challenge for leaders is to determine where their company sits on the map and how to move closer to prosperity.

Where is the next wave?
Part I – Beyond the boom
Part II – Growth strategies for Australia
Current wave: Extend the runwayMining
Next waves: Five new frontsAgribusinessGasTourismInternational educationWealth management
Future waves: Pockets of potential
Part III – Preparing for action
AppendixMethodologyAuthors
44
FOR BUSINESS
Competency advantage
Opportunity radar
Structural advantage
Deliberately raise portfolio growth rate through:• Mergers and acquisitions in
high-growth sectors• Alliances and joint ventures• Active divestments in slower-
growth sectors.
Increase exposure to higher-growth markets by organically shifting internal resources:• Focusing investment dollars into areas with
higher-growth exposure• Deploying top talent into key growth
business units• Investing in transformational innovation.
Drive superior sensing of growth pockets within sectors both internally and externally:• Technological discontinuities• Regulatory changes• Global demographic shifts• Broad array of strategic risks• Consumer trends.
Gain significant operating advantages through superior talent and/or business practices:• Better recruitment, motivation and retention of high-
quality talent• Incremental innovation within business• Institutionalisation of superior practices• Ability to tap into third parties.
Secure positional advantage that is ’hardwired’ and exclusive or difficult to imitate:• Superior location or context such as climate• Physical assets or exclusive access rights to physical
assets• Intangible assets such as intellectual property• Special networks and privileged relationships.
Portfolio mix
Resource allocation

Where is the next wave?
Part I – Beyond the boom
Part II – Growth strategies for Australia
Current wave: Extend the runwayMining
Next waves: Five new frontsAgribusinessGasTourismInternational educationWealth management
Future waves: Pockets of potential
Part III – Preparing for action
AppendixMethodologyAuthors
45
Prosperity levers for businessUnderstanding a company’s position
Opportunity radar A ship at sea uses radar to know where it is headed. Likewise, companies need to sense where growth opportunities and risks may lie in their operations, immediate marketplace and in related markets they may never have considered.
Given that markets are very dynamic and many growth opportunities granular – a number of small grains, rather than large, neat units – this is no trivial exercise. But it is a vital one; after all, if you can’t spot the opportunities (or worse, don’t even try to), it is hard to chart a course for success.
Useful steps are to look for discontinuities that may have opened up new opportunities, such as rapid technological, regulatory and demographic shifts. Companies can also map consumer trends and look at how those changes are affecting their market position.
At the same time, businesses should scan the horizon for any strategic or operating risks that could push them further from prosperity.
The conventional tools for creating this awareness and visibility include everything from company suggestion boxes to management strategy meetings and the use of third-party consultants and forecasters.
There are also new options. Companies can tap social media to better understand consumer sentiment and trends. They can also create or use crowdsourcing to ask questions of large and potentially unknown groups and communities, greatly expanding their access to information and insights (see box).
In this era of ‘big data’, one of the biggest challenges can be making sense of all the information now available. Doing that is likely to require a structured process, and plenty of conversations and debates, before an organisation arrives at a clear point of view about where it’s positioned today and where it plans to go in the future.
A new model of marketing intelligenceThe term ‘crowdsourcing’ has gained currency in recent years, but how do companies use the concept to enhance decision making? The answer is being provided by next-generation management consultancies and services such as 10EQS. This U.S. based start-up, which recently became part of the Deloitte Australia delivery ecosystem, has launched an online collaboration platform aimed specifically at helping companies solve business problems. On the one side, clients pose their challenges to 10EQS, which then draws on its worldwide base of registered experts to deliver answers. As with other crowdsourcing services, the idea is to use the Internet to cost-effectively tap a wide range of minds.
Where is the next wave?
Part I – Beyond the boom
Part II – Growth strategies for Australia
Current wave: Extend the runwayMining
Next waves: Five new frontsAgribusinessGasTourismInternational educationWealth management
Future waves: Pockets of potential
Part III – Preparing for action
AppendixMethodologyAuthors
46
Enhancing competitive advantage
Structural advantage Companies are always searching for an edge. Yet those edges are hard-won, and often all-too-temporary. That’s why this analysis has focused on teasing out where there will be sustainable gains – the potential for Australian business to use and lock in structural advantages.
Australia has many such advantages, yet many don’t even feature when individual businesses assess their situations. This can be a costly mistake. Australia is indeed a lucky country, with built-in growth engines that much of the world simply can’t match – yet are our companies taking full advantage of these home-grown benefits?
To build unassailable sources of advantage that can be hardwired into the business, companies will need to do more than improve their people and processes. They will need to create or acquire assets that deliver structural advantages.
These assets could be intangible, such as intellectual property and brands, or relationships and networks that competitors find hard to emulate. Or they could be physical assets, such as properties and facilities. The business could acquire these assets, or strike exclusive arrangements to gain preferential access to them.
Competency advantage Companies can build on their structural advantages by expanding their competencies.
A rapid way of increasing a company’s competitive advantage is to develop superior talent. The focus here is enhancing recruitment, motivation, day-to-day management and training practices to find, retain and develop the best people.
To ensure this advantage is sustained, those practices must be embedded and institutionalised within the organisation. They should also be complemented by innovative and incremental improvements to business processes that support productivity growth.
Looking outside, companies can partner with third parties to expand their areas of competency and create unique capabilities. This might include forming alliances with technical specialists, and outsourcing commoditised work that doesn’t deliver differentiation.

Where is the next wave?
Part I – Beyond the boom
Part II – Growth strategies for Australia
Current wave: Extend the runwayMining
Next waves: Five new frontsAgribusinessGasTourismInternational educationWealth management
Future waves: Pockets of potential
Part III – Preparing for action
AppendixMethodologyAuthors
47
Increasing exposure to growth
Portfolio mix Yet these changes may not be fast enough to capture the biggest gains. The more aggressive way for a company to increase its exposure to growth opportunities is to actively change the mix of businesses that it owns, or the areas of business in which it chooses to operate. This might involve acquiring or merging with companies that have greater exposure to attractive growth opportunities. Or it could involve forming alliances and joint ventures.
At the same time, groups may need to make hard decisions and exit areas where growth is limited, or where they lack sources of comparative advantage. Again, this is common sense, but there are many examples of businesses staying far too long in weakening market segments or areas where they lack a competitive value proposition. By the time they decide to move, they typically lack the financial firepower to do so on their own terms.
Resource allocation Moving up the proximity to prosperity map involves better aligning a company’s operations to areas of potential growth – areas that this report identifies as where growth will occur over the next two decades.
Yet by definition, our analysis doesn’t go to the level of detail needed by individual businesses. It is for you to weigh up the unique strengths and capabilities of your business, and to consider where the opportunities lie.
Once you do, the task is to act on that. After all, while it isn’t clear that it is the task of governments to ‘pick winners’, this is exactly the job of senior management and boards.
The organic – and typically lowest-risk – way to achieve this is to reallocate resources and people. For example, a company might consider focusing its investment dollars on areas with greater exposure to the drivers of global growth identified in this paper. The company could also look at deploying top talent into business units with significant growth potential, as identified under the Opportunity radar on page 45.
While this sounds obvious, organisations often miss growth opportunities because they simply don’t invest enough; are unwilling to move their best performers to newer parts of the business that promise growth; or fail to undertake transformation programs built around areas of innovation.
These are precisely the steps companies typically need to take to effect a change in their proximity to prosperity. Whether you are leading a government or a business, it is vital to both maximise the value of current growth waves, and to ensure you are positioned to ride those coming in the future.
Or to put it another way: no guts, no glory.
It is vital to both maximise the value of current growth waves, and to ensure you are positioned to ride those coming in the future.

Where is the next wave?
Part I – Beyond the boom
Part II – Growth strategies for Australia
Current wave: Extend the runwayMining
Next waves: Five new frontsAgribusinessGasTourismInternational educationWealth management
Future waves: Pockets of potential
Part III – Preparing for action
AppendixMethodologyAuthors
48
Sample analysis: Moving XYZ Constructions towards prosperity To show how the ideas we’ve been discussing can be applied in practice, take the hypothetical example of XYZ Constructions – a major player in the building industry.
After 30 years in business, XYZ has become a leader in its specialist field in Australia, has a large team with deep capabilities and a range of unique facilities and intellectual property assets.
However, it’s only growing at 1–2% a year while competitors are achieving 10–20% by moving into new areas in Australia and winning international mandates.
Mapping its proximity to prosperity shows the company is sitting in the ‘medium’ proximity to prosperity zone.
Based on this analysis, management decides the problem is a lack of growth opportunities rather than a lack of competency or structural advantages.
XYZ decides to focus on how it can improve its allocation of resources and change its portfolio to drive growth. Over the next three years, it plans to sharply increase its marketing budget and buy two comparable firms: one interstate and one in Asia.
Noting that growth in demand for gas may come to outstrip the matching growth in coal, it also plans to wind back its exposure
to coal-related construction and increase its capacity to offer operational services to gas producers.
Source: Deloitte Access Economics
Australian advantage
Glo
bal o
ppor
tuni
ty
XYZ Constructions
High
Medium
Low
Very high
High
Medium

Where is the next wave?
Part I – Beyond the boom
Part II – Growth strategies for Australia
Current wave: Extend the runwayMining
Next waves: Five new frontsAgribusinessGasTourismInternational educationWealth management
Future waves: Pockets of potential
Part III – Preparing for action
AppendixMethodologyAuthors
49
FOR GOVERNMENT
Competency advantage
Opportunity radar
Structural advantage
Deliberately raise GDP growth through:• Faster consolidation of mature industries• Willingness to wind back existing (and often
wasted) industry subsidies• Bipartisan commitment to national growth strategy
priority themes• Attracting leading global companies in emerging
industries to Australia.
Increase sectors’ exposure to high-growth markets by organically shifting resources through:• Early termination of existing incentives/benefits to
low-growth sectors• Prioritisation of investment into highest-growth
pockets within sectors• Visible political support and championing• Adoption of innovative operating models.
Drive superior sensing of growth pockets within sectors domestically and globally (including creating a business opportunity taskforce):• Technological discontinuities• Global regulatory regime changes• Global demographic shifts• Broad array of strategic risks• Changing social behaviour.
Gain significant operating advantage through superior talent and/or business practices:• Elevating productivity as a key goal for both federal
and state governments• Putting savings from subsidies into enablers like
vocational training and Austrade• Increasing immigration and special worker visas• Enhancing business and government ability to work
together on a common agenda.
Secure positional advantage that is ‘hardwired’ and exclusive or difficult to imitate:• Major national infrastructure (e.g. NBN, ports, roads,
access to cheap energy)• Regional development (e.g. policies to develop
northern Australia)• Policy context (e.g. tax, innovation incentives,
regulatory burdens, legal)• Trade agreements (both bilateral and multilateral).
Portfolio mix
Resource allocation

Where is the next wave?
Part I – Beyond the boom
Part II – Growth strategies for Australia
Current wave: Extend the runwayMining
Next waves: Five new frontsAgribusinessGasTourismInternational educationWealth management
Future waves: Pockets of potential
Part III – Preparing for action
AppendixMethodologyAuthors
50
Prosperity levers for governmentWhen it comes to increasing proximity to growth opportunities and strengthening competitive advantage, government has access to levers comparable to those available to business. However, the courses of action open to government leaders will be different. In broad terms, businesses should focus on ‘doing’, while governments should focus on ‘enabling’.
Even then, government must be careful. Given the difficulty of picking winners – especially by governments, whose track record isn’t great – the need to safeguard taxpayers’ money counsels caution. That is all the more true given the granularity of growth: the potential for success lies more at the level of individual businesses than it does for sectors as a whole, meaning that specifically directed government help can often miss its mark.
Understanding positions
Opportunity radar Yet to say that safeguarding taxpayers’ money can limit the potential for governments to focus on specific sectors is not to imply that sectoral prospects are irrelevant to governments. Quite the opposite.
Government must start by understanding where industry sectors are positioned relative to local and global growth opportunities, and the risks that those industries face. This will involve considering growth drivers and inhibitors, including technology developments, global and local shifts in regulatory regimes, as well as demographic developments.
This work can be completed by industry-focused task forces, charged with looking at which sectors are well positioned for growth, and what governments can assist with. These taskforces should also consider regulatory and other obstacles to success, along with potential remedies.
Enhancing competitive advantage
Structural advantage It makes sense for individual business to play to Australia’s natural advantages. But the same is true of government policies, which need to help the nation ‘slipstream’ the changing nature of Asia’s turbocharged growth.
Those policies should help ensure that our ability to tap our natural resources and make the most of Australia’s temperate climate, English-speaking society and other advantages isn’t hamstrung by poor policies and regulations. In other words, we need to play to our strengths, making maximum use of those advantages that much of the world simply can’t match, for the benefit of all Australians.
Accordingly, the government response to securing growth opportunities and strengthening competitive advantage will involve programs such as investing in infrastructure, changing policies and putting in place new trading relationships. These enabling policies can cement our structural sources of advantage so as to hardwire them even more strongly into Australia’s economy.

Where is the next wave?
Part I – Beyond the boom
Part II – Growth strategies for Australia
Current wave: Extend the runwayMining
Next waves: Five new frontsAgribusinessGasTourismInternational educationWealth management
Future waves: Pockets of potential
Part III – Preparing for action
AppendixMethodologyAuthors
51
Creating national broadband infrastructure is one example of a potentially nation-building investment aimed at enhancing our capacity to compete in a more digital world. So, too, are the expansion and improvement of transport and energy infrastructure to facilitate the growth of our resources sector and other industries, along with taking steps to ensure the northern regions of Australia can compete to their full potential.
More broadly, the public funding of infrastructure spending needs to be judged on its merits, not merely on whether it might exacerbate current debts and deficits. If it passes cost-benefit tests, then it should happen.
Competency advantage Yet there is more that can be done than just trying to maximise our structural strengths.
For example, government is well placed to help increase industry capabilities through targeted education and training, supportive immigration policies, direct or indirect financial support, and generally using its weight to champion our business sector globally. The latter includes making the most of Austrade and political and trade relationships.
The key here isn’t spending more – it’s spending well. Together with industrial relations reform to ensure a focus on productivity growth at the enterprise level, these measures can improve Australian competitiveness by increasing the productivity and specialised capabilities of our workforce.
Changes in tax, innovation incentives and carbon pricing policies, and regular assessments of the effectiveness of green and red tape can also have a big impact – especially when well targeted and developed in consultation with the industries they are designed to help.
Related to that, Australia needs not only to make the most of its strengths, it also needs to address the costs of its disadvantages. Chief among these are its creaking federation, with overlapping responsibilities at every level of government leading to wasted spending and atrocious efficiency outcomes. Unless the design of our federation can be dragged into the 21st century – with all premiers and the prime minister leading COAG-generated reforms from the front – then it will be very hard for Australia to achieve its potential.
To develop these effective responses, government should collaborate closely with the business community. These interactions may be best led by industry associations.
Increasing exposure to growth
Portfolio mix The more accelerated route is for government to use its position to directly shape the growth opportunities that Australia pursues. If government is actively intervening in the economy, then it should explore whether the measures it is implementing are aligned to global growth opportunities and areas where Australia can compete most effectively.
Where is the next wave?
Part I – Beyond the boom
Part II – Growth strategies for Australia
Current wave: Extend the runwayMining
Next waves: Five new frontsAgribusinessGasTourismInternational educationWealth management
Future waves: Pockets of potential
Part III – Preparing for action
AppendixMethodologyAuthors
52
The key goal of governments is prosperity. That means enabling a policy backdrop that assists in reshaping our economy such that more and more of our national income comes from sectors with greater growth potential. This might mean encouraging the consolidation of mature or declining industries, and winding back poorly directed subsidies.
At the same time, governments should be asking what commercial allies we want. Acting on this might include making it attractive for global leaders in next-generation sectors to establish operations in Australia.
Resource allocation Can government help move Australia closer to prosperity by helping its industries align more strongly to high-growth sectors? Yes. In fact, if we can take steps to enhance our structural and competency advantages in those sectors, then momentum will build as more money and people flow their way – a self-reinforcing and virtuous circle.
In addition, government should prioritise the clearing of growth blockages for those sectors or pockets of opportunity identified as offering growth potential during the opportunity radar phase. At the same time, government will need to make difficult decisions to reduce subsidies to sectors that have low growth potential, or where Australia has no compelling comparative advantage.
Government needs to lead the national debate, educating Australians on a simple equation: the more we support laggards, the worse Australia will do.
Let’s start the conversationThere are plenty of actions leaders can take to help move organisations ‘up and to the right’ in our prosperity map – either closer to global growth opportunities, or better equipped to capitalise on them. Ideally, they can achieve both moves to generate exceptional and lasting sources of future wealth for Australians. The potential pay-off is huge.
But perhaps the most important step is simply to start the conversation and ask questions within companies and between businesses, industry associations and governments:• What waves of growth are we riding today, and what waves can
we see coming? • How can we move our organisations into the best positions to
capitalise on those future growth opportunities? • And how can governments enable growth rather than block it?

Where is the next wave?
Part I – Beyond the boom
Part II – Growth strategies for Australia
Current wave: Extend the runwayMining
Next waves: Five new frontsAgribusinessGasTourismInternational educationWealth management
Future waves: Pockets of potential
Part III – Preparing for action
AppendixMethodologyAuthors
53
Appendix
53

Where is the next wave?
Part I – Beyond the boom
Part II – Growth strategies for Australia
Current wave: Extend the runwayMining
Next waves: Five new frontsAgribusinessGasTourismInternational educationWealth management
Future waves: Pockets of potential
Part III – Preparing for action
AppendixMethodologyAuthors
54
MethodologyThe calculated advantage
Our analysis To determine where Australia was most likely to find its future waves of growth, we asked where we were most likely to see an intersection of global opportunities and Australian competitiveness.
To address that question, our analysis had two key components: projections of global growth by sector and an assessment of ‘Australian advantage’.
The result is shown in Figure 28, the Deloitte positioning for prosperity map that we introduced in Part I.
The vertical axis reflects expected global economic growth from 2013 to 2033. There are two lines positioned at plus and minus 10% above and below the expected Global Gross Domestic Product (GGDP) growth over that time (3.4%). The horizontal axis reflects Australian advantage and the size of the circles indicates the relative scale of each industry sector.
The higher a sector appears on the map, the faster it is expected to grow. The further to the right, the stronger its estimated competitive advantages when based in Australia.

Where is the next wave?
Part I – Beyond the boom
Part II – Growth strategies for Australia
Current wave: Extend the runwayMining
Next waves: Five new frontsAgribusinessGasTourismInternational educationWealth management
Future waves: Pockets of potential
Part III – Preparing for action
AppendixMethodologyAuthors
55
Figure 28: Positioning for prosperity map
Australian advantage (right is stronger)
Source: Deloitte Access Economics
TourismGas
Agribusiness
International education
Wealth management
Mining
Manufacturing
Media
ICT
Construction
Telecommunications
Banking
Business and property services
Transport and logistics
Oil
Public administration
Health
Other education and trainingRetail and wholesale
Water and waste services
Glo
bal o
ppor
tuni
ty (G
GD
P gr
owth
, hig
her
is s
tron
ger)
<GGDP
~GGDP
>GGDP
-10% GGDP
+10% GGDP

Where is the next wave?
Part I – Beyond the boom
Part II – Growth strategies for Australia
Current wave: Extend the runwayMining
Next waves: Five new frontsAgribusinessGasTourismInternational educationWealth management
Future waves: Pockets of potential
Part III – Preparing for action
AppendixMethodologyAuthors
56
Global opportunityAlthough economists have often projected where the global economy goes over time, most studies look forward by nation rather than by sector, though there is some limited material to use as comparators.
The resultant ranking over time is below. Note that the total implied global growth (in purchasing power parity terms) is consistent with the global 10-year average from Consensus Economics.
Our forecasts draw inputs from key sectoral drivers around the globe:• Urbanisation rates • The rise of the middle class in emerging economies • The impact of environmental concerns• Population ageing• The pace of global growth.
GGDP
-10% GGDP
Source: Deloitte Access Economics
Gas
Tourism
Agribusiness
Health
International education
Wealth management
Water and waste services
Retail and wholesale
Other education and training
Public administration
Transport and logistics
Business and property services
Telecommunications
Oil
Banking
Mining
Construction
ICT
Manufacturing
Media
2.42.2 2.6 2.8 3.0 3.2 3.4 3.6 3.8 4.0 4.2
Global growth rate (%)
Sect
ors
3.49
3.42
3.34
3.28
3.25
3.24
2.96
2.52
2.50
Figure 29: Projected annual global industry output growth, 2013–33
+10% GGDP
4.11
4.08
4.06
3.95
3.90
3.81
3.70
3.62
3.57
3.53
3.49

Where is the next wave?
Part I – Beyond the boom
Part II – Growth strategies for Australia
Current wave: Extend the runwayMining
Next waves: Five new frontsAgribusinessGasTourismInternational educationWealth management
Future waves: Pockets of potential
Part III – Preparing for action
AppendixMethodologyAuthors
57
Figure 30: Forecast changes in global industry shares, 2013–33
1998 2000 2002 2004 2006 2008 2010 2012 2018 20202014 20222016
25
22.5
20
17.5
15
12.5
10
7.5
5
2.5
0
Shar
e of
GG
DP
(%)
Source: World Bank and Deloitte Access Economics
Years
AgricultureManufacturing
Natural resource rents (% GGDP)
Health expenditure (% GGDP)
Mining/Construction/Electricity/Water/Gas
Public expenditure on education (% GGDP)
Tourism total contribution (% GGDP)
The resulting expected trends in global industry shares over time can also be seen above.
Australian advantageBecause our analysis of global growth is based on sectors rather than nations, it ventures into less-travelled territory. This is even truer of our assessment of ‘Australian advantage’. The end result is shown in Figure 31, where a higher score indicates better prospects for Australian companies.
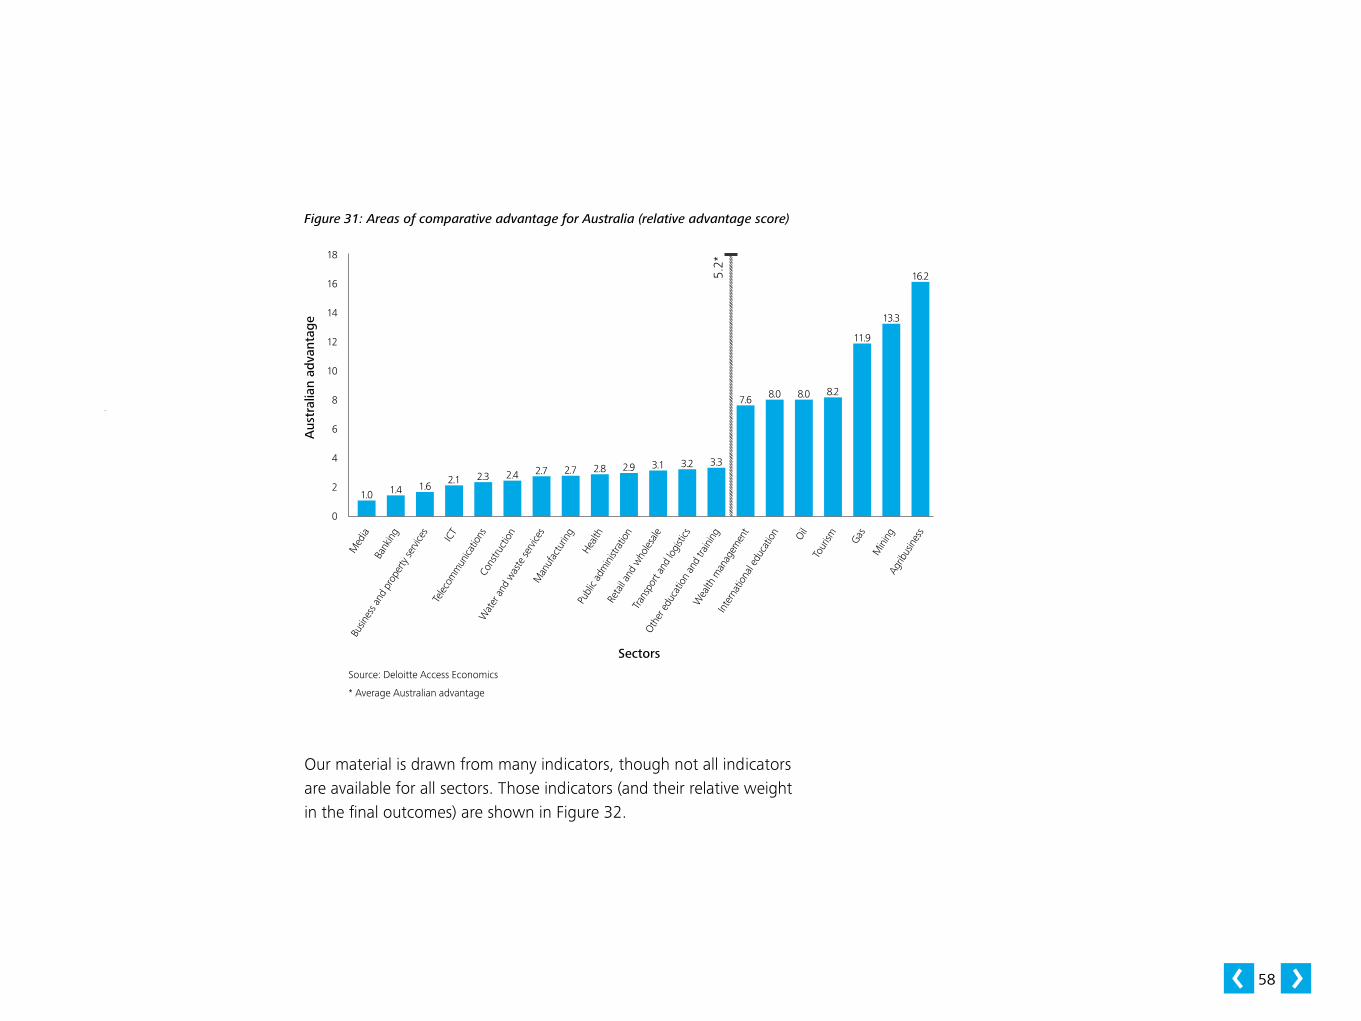
Where is the next wave?
Part I – Beyond the boom
Part II – Growth strategies for Australia
Current wave: Extend the runwayMining
Next waves: Five new frontsAgribusinessGasTourismInternational educationWealth management
Future waves: Pockets of potential
Part III – Preparing for action
AppendixMethodologyAuthors
58
Figure 31: Areas of comparative advantage for Australia (relative advantage score)
Source: Deloitte Access Economics
* Average Australian advantage
Med
ia Ba
nkin
g
Busin
ess a
nd p
rope
rty se
rvice
s
ICT
Sectors
Aus
tral
ian
adva
ntag
e
2.11.61.41.0
18
16
14
12
10
8
6
4
2
0
Telec
omm
unica
tions
Cons
truct
ion
Wat
er a
nd w
aste
serv
ices
Man
ufac
turin
g
Healt
h
Publ
ic ad
min
istra
tion
Reta
il and
who
lesale
Tran
spor
t and
logi
stics
Othe
r edu
catio
n an
d tra
inin
g
Wea
lth m
anag
emen
t
Inte
rnat
iona
l edu
catio
n Oil
Tour
ism Gas
Min
ing
Agrib
usin
ess
16.2
13.3
11.9
8.28.08.07.6
3.33.23.12.92.82.72.72.42.3
5.2*
Our material is drawn from many indicators, though not all indicators are available for all sectors. Those indicators (and their relative weight in the final outcomes) are shown in Figure 32.

Where is the next wave?
Part I – Beyond the boom
Part II – Growth strategies for Australia
Current wave: Extend the runwayMining
Next waves: Five new frontsAgribusinessGasTourismInternational educationWealth management
Future waves: Pockets of potential
Part III – Preparing for action
AppendixMethodologyAuthors
59
In looking at these relative weights, remember that there are related groups of factors here:• ‘Natural resources’, ‘proximity to Asia’ and ‘revealed comparative
advantage’ are all related. Taken together, they drive about one-third of the total score
• Just under half of the score is linked to cost-related factors, including ‘cost competitiveness’, ‘regulatory competitiveness’ and ‘exchange rate’
• Of the remaining components, ‘relative productivity’ is the largest. The latter is, in turn, affected by many of the other drivers in this analysis.
A related point to note is that, although there are some disadvantages in having a number of related explanatory factors in our analysis, the available datasets to help assess Australian advantage have their own relative strengths and weaknesses, meaning that a broader selection of explanatory factors will tend to help pick up a more accurate final figure than if we had narrowed the selection.
Some relevant components of Australian advantageIt is also worth noting some of the building blocks of the Australian advantage measure. First, because we project the exchange rate to fall further, that naturally has an impact on sectors where we export most of our product (such as mining) or import much of our demand (such as manufacturing) (see Figure 33).
However, the Australian Bureau of Statistics (ABS) data are an imperfect guide to net export ratios at the industry level – in part because the categories we have chosen aren’t themselves an exact match with ABS categories, but also because the available input/output data have some limitations in this regard.
In addition, there are some sectors where exports are about to leap – gas is an example – and so it would be misleading to use historical data for net exports. Accordingly, we have made some direct adjustments to the data.
The resultant ranking is shown in Figure 31.
Figure 32: Indicators used to assess ‘Australian advantage’
29.0
Source: Deloitte Access Economics
30
25
20
15
10
5
0
Educ
atio
nal a
ttain
men
t
Reve
aled
com
para
tive
adva
ntag
ePr
oxim
ity to
Asia
Sect
or-s
pecifi
c fa
ctor
s
Relat
ive p
rodu
ctivi
tyEx
chan
ge ra
te
Regu
lator
y com
petit
ivene
ss
Cost
com
petit
ivene
ssNa
tura
l res
ourc
es
Deg
ree
of a
dvan
tage
(%)
19.118.9
11.811.1
4.33.41.9
0.4

Where is the next wave?
Part I – Beyond the boom
Part II – Growth strategies for Australia
Current wave: Extend the runwayMining
Next waves: Five new frontsAgribusinessGasTourismInternational educationWealth management
Future waves: Pockets of potential
Part III – Preparing for action
AppendixMethodologyAuthors
60
Figure 33: Exchange rate impacts via net export ratios
100
90
80
70
60
50
40
30
20
10
0
Source: Deloitte Access Economics
Note: Net export ratio = (absolute value of) net exports as a share of output (value-added). High numbers mean the sector benefits from falls in the A$, but hurts when the A$ rises.
Wat
er a
nd w
aste
serv
ices
Healt
h
Publ
ic ad
min
istra
tion
Cons
truct
ion
Busin
ess a
nd p
rope
rty se
rvice
sBa
nkin
g
Wea
lth m
anag
emen
t
Othe
r edu
catio
n an
d tra
inin
g
ICT
Telec
omm
unica
tions
Sectors
Rel
ativ
e ex
posu
re t
o ex
chan
ge r
ate
mov
emen
ts (%
)
9.06.15.0
1.10.70.50.40.10
Med
ia Oil
Reta
il and
who
lesale
Tran
spor
t and
logi
stics
Inte
rnat
iona
l edu
catio
nTo
urism
Agrib
usin
ess
Gas
Min
ing
Man
ufac
turin
g
87.084.2
65.0
75.0
27.027.0
20.8
14.910.39.09.0
We used the World Bank Doing Business 2013 survey to rank Australia’s regulatory framework against those of our competitors. The key here is that Australia has different competitors in different sectors. Some examples are that:• In gas development, we compete against
countries including Qatar and Russia• In agribusiness, we compete against the U.S.,
Brazil, Canada and New Zealand• In business and property services, we
compete against the U.S., the U.K. and Hong Kong, among others.
That competitor analysis allowed us to rank our regulatory strength by industry using the proxy of regulatory rankings by nation. The end result is shown in the following chart (Figure 34). A key caveat on the available data is that we cannot readily compare the regulatory arrangements affecting sectors within each country. Accordingly, mining ranks well because many of the nations we compete with in mining are often seen as poorly regulated, not because the mining sectors in those competitor nations aren’t necessarily well regulated.

Where is the next wave?
Part I – Beyond the boom
Part II – Growth strategies for Australia
Current wave: Extend the runwayMining
Next waves: Five new frontsAgribusinessGasTourismInternational educationWealth management
Future waves: Pockets of potential
Part III – Preparing for action
AppendixMethodologyAuthors
61
Figure 34: Australia’s global competitiveness by industry sector
70
60
50
40
30
20
10
0
-10
Source: World Bank, Doing Business 2013 survey
Note: A score of 20 means that, on average, Australia was ranked 20 places above our competitors in the industry on the World Bank’s Doing Business 2013 survey. High numbers are ‘good’, while low numbers are ‘bad’.
ICT
Bank
ing
Wea
lth m
anag
emen
t
Telec
omm
unica
tions
Med
ia
Sectors
Rel
ativ
e re
gula
tory
com
peti
tive
ness
(%)
1.41.41.41.41.4
Man
ufac
turin
gCo
nstru
ctio
nTo
urism
Reta
il and
who
lesale Ga
sAg
ribus
ines
s
Oil
Healt
hM
inin
g
59.8
41.339.237.5
33.328.0
19.8
7.06.0
Busin
ess a
nd p
rope
rty se
rvice
s
Inte
rnat
iona
l edu
catio
n
Othe
r edu
catio
n an
d tra
inin
g
Wat
er a
nd w
aste
serv
ices
Tran
spor
t and
logi
stics
Publ
ic ad
min
istra
tion
0.8
-2.3 -0.3-2.3 -0.8-5.7
Similarly, we used studies of cost competitiveness to rank the latter, as per Figure 35.

Where is the next wave?
Part I – Beyond the boom
Part II – Growth strategies for Australia
Current wave: Extend the runwayMining
Next waves: Five new frontsAgribusinessGasTourismInternational educationWealth management
Future waves: Pockets of potential
Part III – Preparing for action
AppendixMethodologyAuthors
62
Figure 35: Australia’s global cost competitiveness by industry sector
2
1
0
-1
-2
-3
-4
-5
-6
-7
-8
Source: Deloitte Access Economics based on data provided in KPMG’s Competitive Alternatives report
Note: A score of 1.5 means it is 1.5% cheaper to do business here than it is to set up in one of the competitor countries in the industry. High numbers are ‘good’, while low numbers are ‘bad’.
Inte
rnat
iona
l edu
catio
n
Othe
r edu
catio
n an
d tra
inin
gM
inin
g
Gas
Agrib
usin
ess
Tour
ism Oil
Healt
h
Busin
ess a
nd p
rope
rty se
rvice
sCo
nstru
ctio
n
ICT
Bank
ing
Wea
lth m
anag
emen
tSectors
Rel
ativ
e co
st c
ompe
titi
vene
ss (%
)
-1.5-1.5-1.5
-2.3
-3.7-3.7-3.7-4.0
-5.5
-6.4-6.4-6.6
-7.5
Telec
omm
unica
tions
-1.5
Med
ia
Reta
il and
who
lesale
Man
ufac
turin
g
Publ
ic ad
min
istra
tion
Wat
er a
nd w
aste
serv
ices
Tran
spor
t and
logi
stics
1.01.0
0.3
-0.4-0.5
-1.5
We used data on output per employee across the nations of the world to extend related analysis by the Australian Treasury on Australian industry productivity. Whereas the Treasury research benchmarked against U.S. industries, we again tried to identify relevant competitor nations to use in the benchmarking.
Hence, for example, our banking sector was benchmarked against productivity levels of the U.S., the U.K., Germany, Japan and Hong Kong, while our transport and logistics sector was benchmarked against those of the U.S., Japan and Singapore – as seen in Figure 36.
As is true of our analysis of regulatory burdens, a key caveat on the available data is that we cannot readily compare the productivity of individual sectors within each country. Accordingly, mining ranks well because the nations we compete with in mining have low productivity, not because the mining sectors in those competitor nations are necessarily inefficient.

Where is the next wave?
Part I – Beyond the boom
Part II – Growth strategies for Australia
Current wave: Extend the runwayMining
Next waves: Five new frontsAgribusinessGasTourismInternational educationWealth management
Future waves: Pockets of potential
Part III – Preparing for action
AppendixMethodologyAuthors
63
A revealed comparative advantage parameter was also added to the estimate of Australian advantage of goods-producing sectors. Revealed comparative advantage is measured by a product’s share of Australia’s total exports, compared to its share of world trade. A value of more than 100% indicates Australia holds a comparative advantage in producing the product in question. Based on this calculation, Australia currently holds a strong comparative advantage in mining and less of an advantage in agribusiness and manufacturing.
In addition, we rated proximity to Asia as a driver of Australian advantage. It, too, is affected by the expected further fall in the exchange rate.
Finally, we exercised our judgement with respect to several sectors. Among the sectors we marked down were:• Mining, to reflect the strong weight of coal within Australia’s
mining sector, as well as a current lack of exploration funding, and the rise of new competitors. Other things being equal, the gains in gas will partly come at the cost of coal
• Manufacturing, to reflect a lack of new investment in plant and the lack of potential economies of scale
• Health, to reflect its low trade potential. In 2010, about 12,800 people visited Australia for medical reasons. While this number is growing faster than tourism numbers in general, it’s still only a tiny fraction of the global medical tourism trade.
Figure 36: Productivity of Australian industry sectors compared to global competitors
Source: Deloitte Access Economics based on data provided in The Conference Board, Total Economy Database
Note: A score of 110 means that we are 10% more productive than the average productivity of our competitors in the industry.
Man
ufac
turin
g
Reta
il and
who
lesale
Busin
ess a
nd p
rope
rty se
rvice
s
Tran
spor
t and
logi
stics ICT
Bank
ing
Wea
lth m
anag
emen
t
Telec
omm
unica
tions
Sectors
Prod
ucti
vity
inde
x (%
)105.6105.6105.6105.6
80.075.0
160
140
120
100
80
60
40
Med
ia
Wat
er a
nd w
aste
serv
ices
Publ
ic ad
min
istra
tion
Cons
truct
ion
Gas
Inte
rnat
iona
l edu
catio
n
Othe
r edu
catio
n an
d tra
inin
g
Healt
hTo
urism
Agrib
usin
ess
Oil
Min
ing
148.5146.1140.9
126.2126.2122.5 122.5120.0117.0112.0
107.0105.698.797.7

Where is the next wave?
Part I – Beyond the boom
Part II – Growth strategies for Australia
Current wave: Extend the runwayMining
Next waves: Five new frontsAgribusinessGasTourismInternational educationWealth management
Future waves: Pockets of potential
Part III – Preparing for action
AppendixMethodologyAuthors
64
On the other hand, we marked up:• Wealth management, to reflect the skills developed through
superannuation stewardship• International education, to reflect the value of being an English-
speaking nation, and of having a possible pathway to permanent residency and citizenship. (Other education and training received a similar but smaller boost)
• Agribusiness, because our proximity-to-Asia measure effectively only picks up benefits related to transport costs, but agribusiness has the additional advantage of improved ‘freshness’ in product-delivery potential versus competitors who are further away
• Professional services, to reflect the depths of the Australian sector within the Asia-Pacific basin.
Modelling the impact on the economyThe other side of our analysis was to estimate how much the high-growth sectors that we identified (gas, agribusiness, tourism, international education and wealth management) might collectively contribute to the Australian economy over the next two decades if we were to fully capitalise on the opportunities they offer.
To form a view, we used the Deloitte Access Economics CGE Model, applying shocks based on outperformance in those sectors above and beyond what we might expect in a ‘business as usual’ economy.
Figure 37 demonstrates the additional activity that Australia could achieve in each year compared to what we would have experienced anyway. Expressed in today’s dollars, these gains would generate an additional $25 billion in GDP in 2033 alone, and a cumulative net gain in GDP of about $250 billion over the next two decades.
Figure 37: Potential additional GDP contribution per annum*
2015 2020 2025 2030
30
20
10
0
A$
2011
–12
billi
ons
Source: Deloitte Access Economics estimates.
* From outperformance in gas, agribusiness, tourism, international education
and wealth management
Years

Where is the next wave?
Part I – Beyond the boom
Part II – Growth strategies for Australia
Current wave: Extend the runwayMining
Next waves: Five new frontsAgribusinessGasTourismInternational educationWealth management
Future waves: Pockets of potential
Part III – Preparing for action
AppendixMethodologyAuthors
65
For further information on positioning for prosperity, please visitwww.buildingtheluckycountry.com.auor email [email protected]
Positioning for prosperity? Catching the next wave
Authors
Professor Ian HarperPartner Deloitte Access Economics
Monish PaulNational Leader Education
Sarah WoodhousePartner Assurance & Advisory
Mehrdad BaghaiGuest Editor Managing Director Alchemy Growth Partners
Kristian KoldingManager Deloitte Access Economics
Neil BrownNational Leader Wealth Management
Kanak PillaiDirector Clients & Markets
David RedhillChief Marketing Officer
Selwyn D’SouzaPartner Consulting
Mike LynnNational Leader Oil & Gas
Stephen ReidNational Leader Mining
Building the Lucky Country
Series authors
Gerhard VorsterChief Strategy Officer
John MeacockManaging Partner NSW National Leader Clients & Markets
Lachlan SmirlNational Leader Tourism, Hospitality & Leisure
Clare HardingPartner Consulting
Chris RichardsonPartner Deloitte Access Economics
Adjunct Professor Henry ErgasSenior Economic Adviser Deloitte Access Economics
Rob McConnelNational Leader Agribusiness
Dr Bob ScealyManager Deloitte Access Economics

Where is the next wave?
Part I – Beyond the boom
Part II – Growth strategies for Australia
Current wave: Extend the runwayMining
Next waves: Five new frontsAgribusinessGasTourismInternational educationWealth management
Future waves: Pockets of potential
Part III – Preparing for action
AppendixMethodologyAuthors
66
Deloitte officesAdelaide11 Waymouth Street Adelaide SA 5000 Tel: +61 8 8407 7000 Fax: +61 8 8407 7001
Alice Springs9 Parsons Street Alice Springs NT 0870
Tel: +61 8 8950 7000 Fax: +61 8 8950 7001
BrisbaneRiverside Centre Level 26, 123 Eagle Street Brisbane Qld 4001
Tel: +61 7 3308 7000 Fax: +61 7 3308 7001
CanberraBrindabella Business Park Level 2, 8 Brindabella Circuit Canberra Airport ACT 2609
Tel: +61 2 6263 7000 Fax: +61 2 6263 7001
DarwinLevel 11, 24 Mitchell Street Darwin NT 0800
Tel: +61 8 8980 3000 Fax: +61 8 8980 3001
HobartANZ Centre Level 8, 22 Elizabeth Street Hobart Tas 7000
Tel: +61 3 6237 7000 Fax: +61 3 6237 7001
Launceston117 Cimitiere Street Launceston Tas 7250
Tel: +61 3 6337 7000 Fax: +61 3 6337 7001
Melbourne550 Bourke Street Melbourne VIC 3000
Tel: +61 3 9671 7000 Fax: +61 3 9671 7001
PerthWoodside Plaza Level 14, 240 St Georges Terrace Perth WA 6000
Tel: +61 8 9365 7154 Fax: +61 8 9365 7001
SydneyGrosvenor Place 225 George Street Sydney NSW 2000
Tel: +61 2 9322 7000 Fax: +61 2 9322 7001
Western Sydney The Barrington Level 10, 10 Smith Street Parramatta NSW 2150
Tel: +61 2 9840 7000 Fax: +61 2 9840 7001
66

Building the Lucky Country™ is a trademark that belongs exclusively to Deloitte Touche Tohmatsu in Australia.
This publication contains general information only, and none of Deloitte Touche Tohmatsu Limited, its member firms, or their related entities (collectively the “Deloitte Network”) is, by means of this publication, rendering professional advice or services.
Before making any decision or taking any action that may affect your finances or your business, you should consult a qualified professional adviser. No entity in the Deloitte Network shall be responsible for any loss whatsoever sustained by any person who relies on this publication.
About Deloitte
Deloitte refers to one or more of Deloitte Touche Tohmatsu Limited, a UK private company limited by guarantee, and its network of member firms, each of which is a legally separate and independent entity. Please see www.deloitte.com/au/about for a detailed description of the legal structure of Deloitte Touche Tohmatsu Limited and its member firms.
Deloitte provides audit, tax, consulting, and financial advisory services to public and private clients spanning multiple industries. With a globally connected network of member firms in more than 150 countries, Deloitte brings world-class capabilities and high-quality service to clients, delivering the insights they need to address their most complex business challenges. Deloitte has in the region of 200,000 professionals, all committed to becoming the standard of excellence.
About Deloitte Australia
In Australia, the member firm is the Australian partnership of Deloitte Touche Tohmatsu. As one of Australia’s leading professional services firms, Deloitte Touche Tohmatsu and its affiliates provide audit, tax, consulting, and financial advisory services through approximately 6,000 people across the country. Focused on the creation of value and growth, and known as an employer of choice for innovative human resources programs, we are dedicated to helping our clients and our people excel. For more information, please visit Deloitte’s web site at www.deloitte.com.au.
Liability limited by a scheme approved under Professional Standards Legislation.
Member of Deloitte Touche Tohmatsu Limited
© 2013 Deloitte Touche Tohmatsu.
MCBD_Syd_09/13_049226