Embed Size (px)
Citation preview

Positioned for GrowthRufus YatesBB&T Securities President/CEO
Financial Services Commercial Finance Manager
Investor Day 2018

2
Key Takeaways
1Segment
provides
revenue, asset
and geographic diversification
Successfulnational platform
has meaningful
opportunity for
continued market
share expansion23
Wealth segment is
driving high value retail household
growth 4Corporate and
Institutional platform
provides industry-
specific solutions while increasing
relationship value
through targeted
up-tiering strategy

▪ Specialized businesses offer geographic, asset and
revenue diversity
▪ Helping clients achieve economic success and
financial security through the delivery of highly
customized capital, investment and asset
management solutions
▪ Supported by high performing associates prepared
to meet the unique needs of our growing Wealth,
Corporate and Institutional client base
Financial Services & Commercial Finance (FSCF)
3

Financial Services & Commercial Finance
Provides Diversification of Revenue and Profitability
YTD as of 09/30/2018
Revenue Diversification by Segment Net Income Mix by Segment
Community Banking –Retail &
Consumer Finance
43%
*Total segments excluding Other, Treasury & Corporate
Community Banking –Retail &
Consumer Finance
44%
Community Banking –
Commercial 23%
Insurance Holdings & Premium Finance
16%
Financial Services &
Commercial Finance
17%
4
Community Banking –
Commercial 33%
Financial Services &
Commercial Finance
17%
Insurance Holdings & Premium Finance
7%

• Wealth, Retirement and Asset Management LOBs (55% of Revenue)
▪ Wealth
▪ BB&T Securities (BB&T Scott & Stringfellow
and BB&T Investments)
▪ Retirement and Institutional Services (RIS)
▪ Sterling Capital
• Capital Markets Corporate Banking and Commercial Finance LOBs
(45% of Revenue)
▪ Corporate Banking
▪ BB&T Securities (Capital Markets)
▪ Equipment & Governmental Finance
▪ Grandbridge
~$1.5 Billion
Revenue MixDelivery Channels
FTE count = 3,293 (9% of BBT’s FTEs)
Based on LOB reporting for period ended 09/30/2018
Provides BB&T With Diverse Balance Sheet and
Non-Credit Fee Growth
5
Wealth23%
Corporate Banking
24%
Retirement / Inst
Services4%
BB&T Securities (S&S/IS)
22%Sterling Capital
6%
Grand-bridge
8%
Equipment & Gov
Finance8%
BB&T Securities (Capital Markets)
5%

Growing National Platforms Since 2014
6
LOB
2Q18
Assets
% Out of
Footprint
Corporate Banking
$15.4B 40%
GovernmentFinance
$5.2B 19%
Equipment Finance
$2.8B 44%
Grandbridge $2.0B 43%
Total $25.3B 37%

$1.9 $2.0 $2.0
$0.0
$0.5
$1.0
$1.5
$2.0
2016 2017 2018 est
$0.53
$0.72 $0.74
$0.00
$0.25
$0.50
$0.75
$1.00
2016 2017 2018 est
Revenues (TE) Pre-Tax Income
Nonperforming Loans / Total Loans
7
High Growth, High Contribution Business$ in billions
36.6%37.1% 37.2%
28.0%
30.5%
33.0%
35.5%
38.0%
2016 2017 2018 est
Operating Margin
0.37%
0.06%
0.14%
0.00%
0.20%
0.40%
0.60%
2016 2017 9/30/2018
2018 estimated is 09/30/2018 annualizedOperating margin is calculated as net income before taxes and provision for credit losses divided by total revenues

$4.6 $5.4
$6.2
$1.5 $2.0 $2.1
$0.0
$2.0
$4.0
$6.0
$8.0
2016 2017 9/30/2018
$34.7 $38.2
$40.7
$14.1 $15.0 $15.5
$0.0
$16.0
$32.0
$48.0
2016 2017 9/30/2018
$7.4 $8.4 $8.5
$7.0 $8.0 $8.0
$0.0
$4.0
$8.0
$12.0
2016 2017 9/30/2018
$1.5 $1.6
$1.9
$1.4 $1.5
$1.8
$0.0
$1.0
$2.0
2016 2017 9/30/2018
▪ Commitments
▪ Outstandings
Wealth Loan Growth18.4% of total Direct Retail
Corporate Loan Growth32.8% of total C&I
Equipment & Governmental Finance
Loan Growth
Grandbridge
Loan Growth
Driving Diversified Loan Growth$ in billions
8CAGRs are calculated on end of period outstanding balances
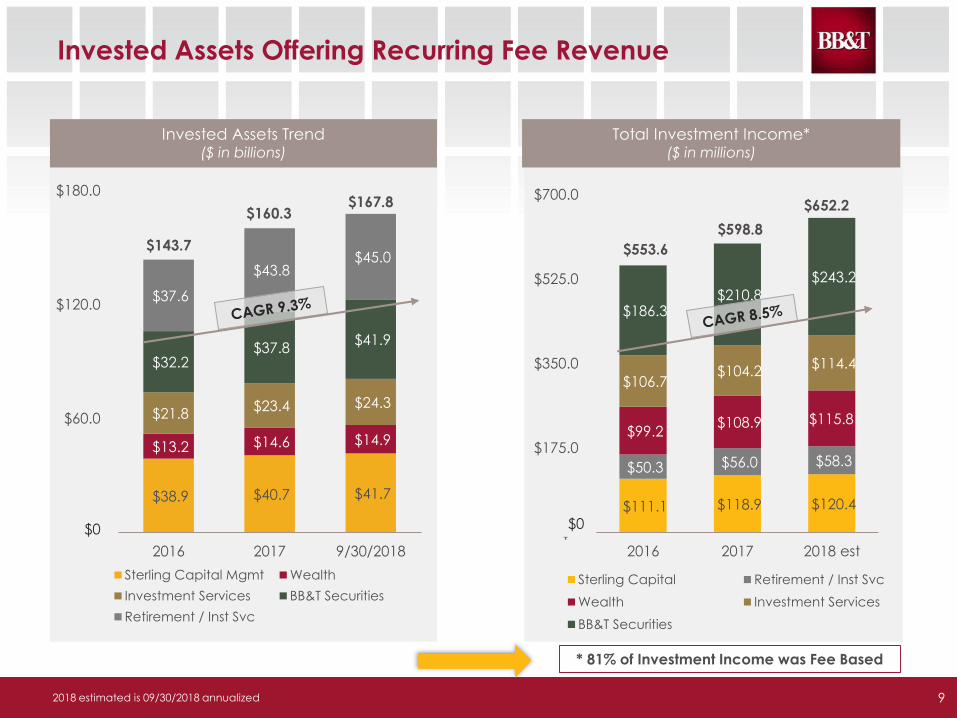
$38.9 $40.7 $41.7
$13.2 $14.6 $14.9
$21.8 $23.4 $24.3
$32.2 $37.8
$41.9
$37.6
$43.8 $45.0
$-
$60.0
$120.0
$180.0
2016 2017 9/30/2018
Sterling Capital Mgmt Wealth
Investment Services BB&T Securities
Retirement / Inst Svc
Invested Assets Trend($ in billions)
$111.1 $118.9 $120.4
$50.3 $56.0 $58.3
$99.2 $108.9 $115.8
$106.7 $104.2
$114.4
$186.3 $210.8
$243.2
$-
$175.0
$350.0
$525.0
$700.0
2016 2017 2018 est
Sterling Capital Retirement / Inst Svc
Wealth Investment Services
BB&T Securities
$553.6
Total Investment Income*($ in millions)
* 81% of Investment Income was Fee Based
$598.8
$652.2
$143.7
$160.3$167.8
Invested Assets Offering Recurring Fee Revenue
92018 estimated is 09/30/2018 annualized
$0 $0

10
Powerful Drivers of Growth:Wealth, Retirement and
Investment Management Businesses

11
The BB&T Wealth, Retirement and Investment Management businesses are integrated to fully serve our clients, helping them to achieve economic success and financial security
$806 Million $165 Billion 215,000 2,055YTD Revenue Client Assets Personal & Business HH’s Licensed Sales & Support
Investment Expertise, Acumen and Execution
Core Attributes
Proprietary Open Architecture Disciplined Collaborative Team Based
BB&T Has Become an Investment Powerhouse With Over
$165 Billion in Client Assets
Revenue based on YTD 09/30/2018 segment results

12
Full Spectrum of Financial Solutions
Individual Institutional
Virtual High-Touch
BANKING STRATEGIC CREDIT RETIREMENT & INVESTING RISK MANAGEMENT TRUST & ESTATE
▪ Checking
▪ Savings
▪ IDA
▪ CD’s and IRA’s
▪ Asset
Management
Account
▪ Mortgage
▪ Security Secured
▪ HELOC
▪ Bankcard
▪ Auto, Marine &
Aircraft
▪ Unsecured
▪ Personal Investment
Management
▪ Brokerage Services
▪ Institutional Asset
Management
▪ 401k Plan Administration
▪ Retirement Plan Solutions
▪ Life Insurance
▪ Property and
Casualty
▪ Health Insurance
▪ Disability Insurance
▪ Long-Term Care
▪ Commercial
▪ Personal Trust
▪ Corporate Trust
▪ Custody Services
▪ Estate Settlement
& Administration
▪ Foundation and
Endowment
SEGMENTMASS AFFLUENT AFFLUENT HIGH NET WORTH INSTITUTIONAL
ASSETS$100K- $500K $500K - $2MM $2MM+ $1MM+
DELIVERY▪ Centralized Preferred
Advisor
▪ Solutions delivered virtually
▪ Regional Private Advisor
▪ Solutions delivered centrally
▪ Regional Wealth Advisor
▪ Solutions delivered regionally
▪ Regional Bankers
▪ Delivered to clients regionally or virtually
Financial Planning

13
The “Power of One” BB&T
Community Bank Retail
BB&T Life Insurance
Community Bank Commercial
BB&T Securities
BB&T Capital Markets
BB&T Home Mortgage
Strong internal partnerships have enabled us to serve our clients’ full range of financial needs and expand our businesses through a fully integrated client-first approach
BB&T Wealth
BB&T Enterprise
Financial Insights meeting with
client, Commercial
Banker & Wealth Advisor
▪ Commercial Client
▪ Business Checking
▪ Business Loans
▪ Wealth Sales & Relationship
Management Process
▪ Financial Planning
▪ Introduction of key enterprise
partners to deliver broad array of
solutions

14
320K
1.3MM
Known
BB&T HHs
Estimated
BB&T HHs
Mass Affluent–33MM Total in US (26%)
($100K to $500K in Assets)Average Relationship Revenue: $5K
102K
300K
Known
BB&T HHs
Estimated
BB&T HHs
144
3.5K
Known
BB&T HHs
Estimated
BB&T HHs
Core Wealth–7.5MM Total in US (6%)
($500K to $25MM in Assets)Average Relationship Revenue: $46K
Ultra High Net Worth–90K Total in US (.07%)
($25MM+ in Assets)Average Relationship Revenue: $600K
39% 10%
125Kcurrent
BB&T clients 76% 26%
78Kcurrent
BB&T clients 95% 4%
137current
BB&T clients
Our Opportunity: Growing the Wealth Segment
HHs contain Total Assets (Investments + Deposits) at BB&T, does not represent full opportunity of unknown assetsSource – 2016 Forester client survey
We will serve the Mass Affluent clients through a virtual advice based
relationship model (Preferred, CAT & Digital Advice Platform)
This segment represents our “core” wealth delivery, this segment is well
developed and growing
We will expand serving UHNW clients through a customized high touch
approach
126MM Total HHs in US – 5MM Total HHs in BB&T

15
Driving Growth Through 4 Key Stages
BB&T Wealth Businesses have been focused on four key strategic areas to drive
revenue, asset and household growth with digital transformation at its core
Digital Transformation
Client ExperienceAssociate Experience
Enhanced Solutions Business Model Expansion
Digitally enhanced tools and information for seamless interaction between the client, advisor and the bank.
Premier products, competitive pricing, and compelling delivery of subject matter expertise.
Robust toolbox of applications to ensure successful bank partnership and ability to connect with clients wherever and whenever.
Capitalizing on financial consumer trends by focusing on high potential segments.

16
Client Experience
Digitally enhanced tools and information for seamless interaction between the
Client, Advisor and BB&T
Online Banking – U Application
Clients manage their financial lives in one integrated
mobile enabled platform
▪ Mobile
▪ Budgeting & Goals
▪ Financial Planning
▪ Account Aggregation
▪ Zelle
▪ Document Vault
Enhanced Investment Management Platforms
Trust Platform Brokerage Platform
Key Components :
▪ Performance
Reporting
▪ Dashboards
▪ Digital Advice
▪ Single Sign On
▪ E-Signature
▪ Alerts
Continuous Voice of the Client feedback ensures we are delivering a perfect client experience

17
Digital Advice Platform
▪ Automated & tailored Investments
▪ Goals based investing with automatic
rebalancing
▪ Integration with BB&T U Platform
Improved Product Capabilities
▪ Enhanced financial planning platform,
bankcard solutions and wealth mortgage
solutions
▪ Brokerage, wealth and trust platform
connectivity
Wealth Lending Enhancements
▪ Digitally enabled collateral monitoring system
▪ Expansion of business purpose & marine lending
▪ East, Simple & Fast
Robotics Processing / Chatbot -Automation
▪ Intelligent prospecting – leveraging data
▪ Automation of repetitive processes
▪ Enables self-service for clients
Enhanced Solutions
Premier products, competitive pricing, and compelling delivery of subject
matter expertise

18
Associate Experience
Advisor Mobility
▪ Connected 24/7 to applications
▪ Increased client engagement during planning
and proposal process
▪ Expedited account opening & funding
Salesforce & Wealth View
▪ 360° client, sales & activity management view
▪ New Financial Service Cloud platform
▪ Digital profile of assets, activities, referrals &
opportunities
▪ Drives insight, advice and opportunities
Automated Client Communication
▪ Digital market communication series to clients
and prospects delivering market news, advice
and Insights
▪ Standardized new client onboarding process
▪ Increases productivity of advisors and
engagement of client
Robust toolbox of applications to ensure successful bank partnership and ability to connect with clients wherever they are

19
Business Model Expansion
Add Revenue Producers in
Key Growth Markets
▪ Expand in Key Markets –Texas, Florida, Pennsylvania & Tennessee
▪ Opening joint office with S&S in Cincinnati and Nashville office during 3Q18
Talent Development
▪ Leverage internships, Leadership development program, and early career program
▪ Bring high performing young, energetic talent into the organization
Capitalizing on financial consumer trends by focusing on high potential segments
Expand the Mass Affluent Segment
Digital Advice Platform
• Self-directed and advisor-supported platform
• Integrated with BB&T U and BBT.com
Centralized Advisor Team
(CAT)
• Licensed Advisors • Offer investments through
the UMA and digital platforms
• Maintain and grow a
book of business
Preferred Advisors
• Serves clients between $100K and $500K
• Delivers full suite of Wealth Solutions
• Maintains a book of business
Retirement Resource Center
(RRC)
• Educate and advocate clients on retirement
• Provides support to clients on digital advice platform

20
21
Powerful Drivers of Growth:Corporate & Institutional Platform

Our mission is to serve large, complex corporate and institutional clients with integrated capital, treasury, investment and risk management solutions to develop long-term, mutually beneficial
relationships and help our clients meet their financial goals and objectives
$672MM YTD Revenue
$25.3B loans
outstanding
36% of C&I portfolio
$9.1B
Deposits
14% of Commercial
Deposits
3,000
Clientsserved by 677 associates
1% of Assigned Commercial Clients
Revenue based on YTD 09/30/2018 segment resultsLoans and deposits based on 3Q18 YTD averageClient count is an estimate based on LOB reported information
Corporate & Institutional Platform
22
Corporate & Institutional Platform
Becoming a more meaningful provider of solutions and advice while increasing relationship profitability

Delivering Financial Solutions
23
▪ Debt & Equity Underwriting & Distribution
▪ Share Buybacks/ATMs
▪ M&A Advisory
▪ Tax-Exempt Finance
▪ Relationship Management
▪ Bilateral & Syndicated Loans
▪ Treasury & Deposit Solutions
▪ Interest Rate Derivatives
▪ Equipment Finance
▪ Supply Chain Finance
▪ Working Capital Finance
▪ Real Estate Finance
▪ Insurance
▪ Retirement & Institutional
▪ Asset Management
▪ Employee Benefits
▪ Leadership Institute

Industry Diversification and Future Growth Potential
Other industries not depicted include government, art, food services, entertainment, agriculture represent <2% of loan commitments2016 GDP Data – Note Energy is down as a % of GDP relative to previous years Total Syndicated Loan Issuance Source: Thompson Reuter’s LPC 2017
Retail & Wholesale Trade17% of Portfolio vs. 10% of GDP
11% Total Syn Loan Issuance
Retail
Real Estate, Insurance, Finance 24% of Portfolio vs. 18% of GDP
17% Total Syn Loan Issuance
Financial Services
Healthcare, Education & Social 3%* of Portfolio vs. 8% of GDP 11% Total Syn Loan Issuance
Healthcare & Education
Construction, Manufacturing & Transportation
35% of Portfolio vs. 24% of GDP 11% Total Syn Loan Issuance
Industrial
Oil & Gas, Coal, Mining & Utilities
15% of Portfolio vs. 4% of GDP 16% Total Syn Loan Issuance
Energy
* The majority of BB&T’s healthcare and education loans are booked in the Community Bank.
Information, Tech & Business Services
3% of Portfolio vs. 16% of GDP 26% Total Syn Loan Issuance
Business Services & Tech
24

Disciplined Commitments ($ in millions)
BB&T
$20
$30
$40
$50
$60
$70
$80
$90
$100
2012 2013 2014 2015 2016 2017 YTD 2018
24
BB&T and Peer Allocation Averages
Source: Salesforce production dataPeers include: BBVA, CMA, FITB, HBAN, KEY, PNC, RF, STI and USB

Growth Strategies
10
26
13.1%9.4%11.7%
19.5%
21.4%20.1%
Client Coverage by Regionclients >$500MM revenue
* Before referral expense Market Share Source: S&P CapIQ
Corporate Banking Coverage
▪ Recent hires in San Francisco, Denver, Houston and Chicago will
enhance coverage and accelerate client acquisition
▪ Significant growth opportunities in low market share regions (see below)
▪ Hired Technology Team Leader in 2Q18 to bring expertise and partner
with credit administration
▪ Uptiering is key to improve relationship return and non-credit revenue
which represents 40% of Corporate Banking pre-provision revenue*

Significant Opportunity to Be a Meaningful Provider of
Capital and Advisory Solutions
“BB&T has been a long-term financial partner and over time has delivered consistently strong execution of all of its product offerings.”
Dan Susik, SVP Finance & Treasurer
▪ Ryder System, Inc. is a long-term client where we
have increased our credit commitment over the
last 3 years.
▪ Over the course of 6 months, BB&T executed 4
significant transactions across 4 different
products.
▪ Our industry expertise, willingness to provide
capital and holistic relationship approach
allowed us the opportunity to uptier the
relationship and capture additional business.
27
Uptiered and
increased credit
commitment
Served as sell-
side Exclusive
Advisor in recent
Ryder
acquisition
Participated in
3 public bond
transactions
totaling >$1B
including Joint
Bookrunner title
Awarded
$40MM in
additional
Equipment
Finance
business

28
Key Takeaways
1Segment
provides
revenue, asset
and geographic diversification
Successfulnational platform
has meaningful
opportunity for
continued market
share expansion23
Wealth segment is
driving high value retail household
growth 4Corporate and
Institutional platform
provides industry-
specific solutions while increasing
relationship value
through targeted
up-tiering strategy