Embed Size (px)
Citation preview

Portsmouth Air Quality Optimisation of Road Traffic Control Systems Corridor 1 VISSIM Model Assessment Report
December 2014

Portsmouth Corridor 1 Air Quality Management Area VISSIM Model Assessment Report
Notice
This document and its contents have been prepared and are intended solely for Portsmouth City Council’s (PCC) information and use in relation to the Portsmouth Air Quality Management Area improvement project.
Atkins assumes no responsibility to any other party in respect of or arising out of or in connection with this document and/or its contents.
Document History
JOB NUMBER:
DOCUMENT REF:
Revision Purpose Description Originated Checked Reviewed Authorised Date
1 Draft LMVR RN RM RN MH 29/1/14
2 DM Assessment Results RM MH RM MH 27/6/14
3 DS1 Assessment Results RM MH RM MH 10/7/14
4 DS2 Assessment Results RM MH RM MH 18/7/14
5 Updated Results RM MH RM MH 31/7/14
6 Final with comments RM MH RM MH 17/9/14
7 Updated Results RM MH RM MH 26/09/14
8 AM Peak new flows EW MH EW MH 24/12/14

Portsmouth Corridor 1 Air Quality Management Area VISSIM Model Assessment Report
Table of contents
Chapter pages
1. Introduction 1
2. Data Collection 5
3. Model Development 7
4. Model Calibration and Validation 12
Validation 13
5. 2013 Existing Conditions Validation Results 16
AM Peak 16
PM Peak 22
Inter Peak 28
6. 2013 Proposed Assessment 35
Model Development 35
Do Minimum Scenario 35
Proposed Option 1 37
Proposed Option 2 38
7. 2013 Comparison Results 39
AM Peak 39
PM Peak 42
Inter Peak 46
8. Summary and Conclusions 50
Tables
Table 5.1 – 2013 AM Peak Summary of Junction Performance 18 Table 5.2 – 2013 AM Peak Summary of Travel Times (secs) 19 Table 5.3 – 2013 AM Peak Summary of Queue Lengths (m) 21 Table 5.4 – 2013 AM Peak Network Performance 22 Table 5.5 – 2013 PM Peak Summary of Junction Performance 24 Table 5.6 – 2013 PM Peak Summary of Travel Times (secs) 25 Table 5.7 – 2013 PM Peak Summary of Queue Lengths (m) 27 Table 5.8 – 2013 PM Peak Network Performance 28 Table 5.9 – 2013 Inter Peak Summary of Junction Performance 30 Table 5.10 – 2013 Inter Peak Summary of Travel Times (secs) 31 Table 5.11 – 2013 Inter Peak Summary of Queue Lengths (m) 33 Table 5.12 – 2013 Inter Peak Network Performance 34 Table 7.1 – 2013 AM Peak Junction Performance Comparison 39 Table 7.2 – 2013 AM Peak Travel Time Comparison (s) 41 Table 7.3 – 2013 AM Peak Network Performance Comparison 42 Table 7.4 – 2013 PM Peak Junction Performance Comparison 43 Table 7.5 – 2013 PM Peak Travel Time Comparison (s) 45 Table 7.6 – 2013 PM Peak Network Performance Comparison 46 Table 7.7 – 2013 Inter Peak Junction Performance Comparison 47 Table 7.8 – 2013 Inter Peak Travel Time Comparison (s) 48 Table 7.9 – 2013 Inter Peak Network Performance Comparison 49

Portsmouth Corridor 1 Air Quality Management Area VISSIM Model Assessment Report
Figures
Figure 1.1- Study Area 2 Figure 1.2- VISSIM Model Study Area 3 Figure 3.1- Princess Royal Way Signal Staging 8 Figure 3.2- Church Street Roundabout Signal Staging 9 Figure 3.3- Marketway Roundabout Signal Staging 9 Figure 3.4- Unicorn Road/Alfred Road Signal Staging 10 Figure 3.5- Queen Street/Alfred Road Signal Staging 10 Figure 3.6- Park Road /Anglesea Road Signal Staging 10 Figure 3.7- Winston Churchill Avenue/Anglesea Road Signal Staging 10 Figure 3.8- Cambridge Rd/A3 Signal Staging 11 Figure 4.1- HGV and Bus Acceleration Parameters 12 Figure 5.1 - AM Peak Cumulative Frequency of GEH Values 16 Figure 5.2 - AM Peak Linear Regression of Traffic Flows 16 Figure 5.3 – 0800-0900 Northbound Cumulative Travel Time Comparison 20 Figure 5.4 – 0800-0900 Southbound Cumulative Travel Time Comparison 20 Figure 5.5 - PM Peak Cumulative Frequency of GEH Values 23 Figure 5.6 - PM Peak Linear Regression of Traffic Flows 23 Figure 5.7 – 1700-1800 Northbound Cumulative Travel Time Comparison 26 Figure 5.8 – 1700-1800 Southbound Cumulative Travel Time Comparison 26 Figure 5.9 - Inter Peak Cumulative Frequency of GEH Values 29 Figure 5.10 - Inter Peak Linear Regression of Traffic Flows 29 Figure 5.11 – 1300-1400 Northbound Cumulative Travel Time Comparison 32 Figure 5.12 – 1300-1400 Southbound Cumulative Travel Time Comparison 32 Figure 6.1 – Rudmore Roundabout Network Changes 35 Figure 6.2 – Rudmore Roundabout Comparison of 2013 Traffic Flows (Oct and March) 37 Figure 6.3 – Holbrook Rd / Lake Rd Roundabout DS1 Layout 38 Figure 6.4 – Church Street Roundabout DS2 Layout 38 Figure 7.1 – Church Street Approach Queuing (07:47) 40 Figure 7.2 – Church Street Approach / Lake Road (W) Queuing (17:18) 44

Portsmouth Corridor 1 Air Quality Management Area VISSIM Model Assessment Report
Appendix
A. 2013 Balanced Traffic Flows 53
B. 2013 Existing AM Peak Model Output Results 54
C. 2013 Existing PM Peak Model Output Results 55
D. 2013 Existing Inter Peak Model Output Results 56
E. Rudmore Roundabout and Marketway Bus Lane Drawings 57
F. 2013 AM Peak Comparison Results 58
G. 2013 PM Peak Comparison Results 59
H. 2013 Inter Peak Comparison Results 60

1
Portsmouth Corridor 1 Air Quality Management Area VISSIM Model LMVR
1. Introduction
1.1. Atkins has been commissioned by Portsmouth City Council (PCC) to develop five existing conditions micro-simulation models to assess various improvement schemes along key routes within Portsmouth City Centre and surrounding network, with a view to improving air quality within each of the study areas.
1.2. This report documents the calibration and validation of the Corridor 1 existing conditions model and assessment of proposed schemes developed using VISSIM, which is part of the PTV Vision Transport modelling suite. VISSIM is a microscopic traffic flow simulation model based on car following and lane change logic. VISSIM can analyse vehicular traffic including bus / tram, pedestrian and bicycle operations under constraints such as lane configuration, traffic composition, traffic signals, and bus/tram stops. VISSIM does not follow the conventional link / node modelling system, but utilises a link / connector system that enables complex geometry to be modelled. The link / connector system also permits different traffic controls (signal, give way or stop) to be utilised anywhere in the model. VISSIM is also capable of modelling vehicle actuation traffic control utilising the Vehicle Actuated Programming (VAP) module as well as MOVA using the PCMOVA module from TRL. Therefore, it is an appropriate tool for the evaluation of the combination of complex geometry and traffic controls (give way and traffic signal) operations that will be assessed within the study area.
1.3. The vehicle record outputs from the VISSIM model will be utilised by the AIRE emissions modelling assessment software to determine if the proposals are predicted to reduce emissions and improve the air quality within the study area.
1.4. Corridor 1 is located within the area of Portsmouth City Centre. Corridor 1 includes the motorway M275 which is the principal route for traffic entering and leaving Portsmouth. It further continues as the A3 into Portsmouth and together they form the main routes through Portsmouth City centre area. The A3 forms a key link road between the M275, A288 and A2030 as shown in Figure 1.1. This Study area includes three major roundabouts, one gyratory and four major signalised junctions. The area of assessment is shown in Figure 1.2 bounded by the blue line and includes all junctions from the Rudmore Roundabout in the north through to St Michael’s Gyratory in the south and Lake Road/A2030 roundabout to the east. In the middle of the network is the Mile End Road roundabout and the Marketway roundabout which has recently been converted from a roundabout to a signalised junction.

2
Portsmouth Corridor 1 Air Quality Management Area VISSIM Model LMVR
Figure 1.1- Study Area
© OpenStreetMap contributors, CC-BY-SA

3
Portsmouth Corridor 1 Air Quality Management Area VISSIM Model Assessment
Figure 1.2- VISSIM Model Study Area
1.5. A full data collection programme was commissioned in order to provide data for the model and included manual classified turning movement surveys at the key junctions throughout the study area and Automatic Number Plate Recognition (ANPR) cameras for journey time analysis.
1.6. All traffic signal controllers have been coded in Visual Vehicle Actuated Programming (VisVAP) using the signal specifications in order to replicate the average SCOOT green times, Cableless Linked Fixed time plans (CLF) or Vehicle Actuated (VA) control.
1.7. The models have been constructed to represent the morning peak period from 07:00 to 10:00, an Inter peak from 12:00 to 14:00 and an evening peak period from 16:00 to 19:00 each with a 30 minute seed period, prior to each peak to populate the network before analysis is undertaken.
© OpenStreetMap contributors, CC-BY-SA

4
Portsmouth Corridor 1 Air Quality Management Area VISSIM Model Assessment
1.8. A site visit was undertaken on Tuesday 1st October 2013 during the AM, IP and PM peaks to observe traffic conditions along the network. Heavy congestion and long queues were observed on Church Street and Lake Road in the AM and PM peak, also, there was some congestion around Commercial Road Southbound approaching the Marketway roundabout and the A3 from Hope Street to Cascade’s approach roundabout, but this did dissipate relatively quickly.
1.9. During the Inter peak period, it was observed that traffic management was in place around the Mile End Road roundabout (Church Street Roundabout). This caused the offside lane on the Commercial Road northbound approach to be coned off, along with one lane on the circulatory. The Church Street approach was reduced to a single lane and the Hope Street Right turn approach was closed, so traffic wishing to make this movement was required to utilise the offside lane of the left turn.
1.10. Traffic management was also in place at the Rudmore Roundabout throughout all peaks, with lane closures and speed restrictions in force. No other issues were highlighted.
1.11. The remainder of the report is structured as follows:
Section 2 – Data Collection
Section 3 – Model Development
Section 4 – Model Calibration and Validation
Section 5 – 2013 Existing Validation Results
Section 6 – 2013 Do Minimum Scenario Comparison
Section 6 – Summary and Conclusions

5
Portsmouth Corridor 1 Air Quality Management Area VISSIM Model Assessment
2. Data Collection
2.1. A data collection programme was undertaken by Traffic Survey Partners (TSP) on behalf of Arup throughout October 2013 but the main day of traffic surveys were undertaken on Tuesday 1st October 2013. The data collection is described below by category.
Turning Counts
2.2. Manual classified counts (MCC) (Car, Taxi, Light Goods Vehicles (LGV), Other Goods Vehicles (OGV1 and OGV2), Motorbike, Bus and Coach Classifications) were conducted between 07:00 in the morning to 19:00 in the evening. The MCC counts were carried out at the following junctions in the network area of Corridor 1 (listed north to south):
Rudmore Roundabout;
Princess Royal Way / Mile End Road junction;
Mile End Road/Church Street/Commercial Road/Hope Street roundabout;
Marketway / Commercial Road / Lake Road roundabout;
Queen Street/Alfred Road junction;
St. Michael’s Gyratory
2.3. The survey video files have also been received.
2.4. The MCC data collected on 21st March 2013 for an earlier Portsmouth model study were utilised to obtain turning proportions for the remaining junctions of:
Unicorn Road/Alfred Road junction
Park Road/Anglesea Road junction
Cascade’s Approach/Marketway roundabout
Flathouse Road junction
Holbrook Road/Lake Road roundabout
Wingfield Street/Church Street junction
A2030 roundabout
Automated Traffic Counts (ATC)
2.5. The ATC loops were placed in three locations (A397(S), A3 Northern Rd(N), A3 Southampton Rd(W)) and covered a period of 4 weeks from Monday 30th September to Sunday 27th October 2013 in order to avoid half term holidays.
Travel Times
2.6. Journey time surveys were conducted using the moving observer method on Tuesday 1st October 2013, between 07:00 to 10:00, 12:00 to 14:00 and 16:00 to 19:00. The surveyed route ran between the Rudmore Roundabout to the St. Michael’s Gyratory, via the A3 Commercial Road and comprised of 7 sections per run from stopline to stopline in both directions as detailed below:
Winston Churchill Avenue to Park Road junction;
Park Road junction to Queen Street junction;
Queen Street junction to Cascade’s Approach roundabout
Cascade’s Approach to Marketway roundabout
Marketway roundabout to Mile End Road roundabout
Mile End Road roundabout to Princess Royal Way

6
Portsmouth Corridor 1 Air Quality Management Area VISSIM Model Assessment
Princess Royal Way to Rudmore Roundabout
2.7. The following number of runs were completed per peak:
AM Peak – 14 runs northbound and 15 runs southbound;
Inter Peak – 8 runs northbound and 9 runs southbound; and,
PM Peak – 13 runs northbound and 13 runs southbound.
Queue Lengths
2.8. Manual queue length surveys were collected for all approaches at each junction on Tuesday 1st October 2013 between 07:00 to 10:00, 12:00 to 14:00 and 16:00 to 19:00. The queue lengths were collated per lane with spot observations undertaken every 5 minutes. All observations were undertaken at the appropriate give way lines.
Pedestrians
2.9. The surveys were undertaken on Tuesday 1st October 2013 and counted the number of pedestrians crossing in each direction at signalised crossing at or adjacent to the surveyed junctions. At the Park Road eastbound and westbound pedestrian crossings there is no pedestrian survey data available, however, the site video suggests a large number of pedestrians cross at this location as there is an entrance to the Portsmouth University on the eastern side. In order to replicate the site conditions, a higher number of pedestrians is included at this location in the model. For the remainder of the crossings within the network where the data is unavailable, assumptions have been made, which range from 5 pedestrians per direction per 15 minute interval to 10 pedestrians per direction per 15 minute interval.
Bus Services
2.10. The network contains several bus stops so it was necessary to isolate the bus services running through the network from the traffic count data and code these separately to the main traffic counts in order to model the correct traffic conditions.
2.11. The main bus operator in Portsmouth is First Hampshire and Dorset with a few services operated by Stagecoach Coastline.
2.12. All timetables for the services which operate in the network during the weekday AM, Inter and PM peak periods were collated from the Travel Line internet site (http://traveline.info/). The routes of the individual services through the network were given the corresponding service numbers as their route number and given separate inbound and outbound routes.
2.13. In order to calculate when the bus service would appear in the network, the nearest stop on the edge of the network was selected for the start time of the service, or where this information was missing, the nearest stop outside of the network was adopted and the time taken by the bus between this stop and when it appeared in the network was calculated and added to the start time.
2.14. Once the bus times were calculated for each 15 minute interval, the buses were then entered into VISSIM separately using Public Transport inputs.
2.15. The dwell times for all bus stops within the network have been set to the default value of 20 seconds with a 2 second standard deviation. All buses have been coded to stop at every stop along their route, to provide a robust assessment.
Traffic Signal Data
2.16. The traffic signal specifications for all signalised junctions within the study area were provided by PCC. Where specifications were not available, observed timings for each junction were provided.

7
Portsmouth Corridor 1 Air Quality Management Area VISSIM Model Assessment
3. Model Development
3.1. The VISSIM model is comprised of five basic components:
Highway network (links and connectors);
Traffic control systems (signal, stop and give-way control);
Traffic inputs;
Vehicle type and compositions; and,
Vehicle routes.
3.2. VISSIM version v5.40-09 has been used to construct and run the model.
Balanced Turning Movements
3.3. Within VISSIM the traffic flows need to be balanced so the same amount of traffic enters and exits each junction within the network. The MCC data was utilised to produce a network of unbalanced turning movement flows in 15 minute intervals. The SATURN flows were then used to create turning proportions which were used to balance the remaining junctions back to the surveyed roundabouts in 15 minute intervals. The balanced traffic flows for the network are shown in Appendix A for the AM Peak, Inter Peak and PM Peak in hourly periods for all vehicles including the scheduled bus services.
3.4. A seed period of 30 minutes was utilised to populate each peak, however, traffic data for the 30 minute interval of 06:30-07:00 was not available therefore, the 07:00-07:15 flows were utilised and factored by 75% based upon observations from the survey video footage.
3.5. During the balancing stage, it was also noticed that there were inconstancies between the junctions/roundabouts as the few of the junctions/roundabouts had data from the earlier PCC model. Therefore, the flows were balanced using the proportion of flows observed earlier. In case of large number of U-turn traffic, the U-turn traffic was not included while balancing instead they are routed to the nearest exit to the survey location.
Highway Network
3.6. The base road network for the existing conditions VISSIM models was constructed for both peaks based upon an Ordinance Survey CAD background.
3.7. In order to facilitate realistic queuing and vehicle behaviour the main link type utilised on the dual carriageway sections was Urban Free Lane Selection (Motorised) and on the signal lane sections Urban Left-Side Rule (Motorised) utilised, both Wiedemann 74. .
Traffic Control System
3.8. Priority rules were placed at all give-way locations, with separate rules for lights and heavy vehicles to account for differing gap acceptance values at roundabouts.
Vehicles Types and Classes
3.9. VISSIM uses individual vehicle models that are grouped into vehicle types which are then grouped into vehicle classes. Vehicle classes for Car, Taxi, LGV, HGV, Bus and Motorcycle were used within the model. The car class was further split into small and large cars, HGV was further split into OGV1 and OGV2. All other vehicle classes contained a single vehicle type.
Vehicle Inputs and Composition
3.10. The balanced traffic flow networks for the AM and PM peak periods were used to determine the total vehicle inputs at all entries into the network in 15 minute intervals.

8
Portsmouth Corridor 1 Air Quality Management Area VISSIM Model Assessment
3.11. The survey data was used to calculate the vehicle type compositions at the entry points to the network in 15 minute intervals.
3.12. The light vehicles in VISSIM were split into vehicle types of small cars and large cars in the assumed proportions of 75% and 25% respectively.
Vehicle Routes
3.13. The balanced traffic flow networks for the AM and PM peaks were used to determine the total vehicle routes throughout the network in 15 minute intervals.
Traffic Signal Data
3.14. The traffic signal specifications provided by PCC were interrogated in order to code in the most applicable signal control method at each junction. All junctions were coded in Vehicle Actuated Programming (VAP) using the VisVAP module of VISSIM regardless of the specific control method. Using VAP allows Vehicle Actuation (VA) to be replicated in the model using detector loops in VISSIM, provide demand dependant phases and stages to be introduced as well as the ability to apply different time plans mid-way through a simulation. In the case of the Portsmouth model, VisVAP has been used to change the programme times to match the master clock settings within the specifications. The coding for the main junctions within the study network are summarised below.
Princess Royal Way J24291
3.15. The junction has been coded to operate on vehicle actuation. The stage sequence is shown below in Figure 3.1. Each signal phase that runs within each stage is shown by a letter, where phases A and C represent the Mile End NB and Princess Royal Way movements respectively. The dotted arrows represent pedestrian phases. Princess Royal Way operates as a one-way street.
Figure 3.1- Princess Royal Way Signal Staging
Church Street Roundabout J24281
3.16. The junction has been coded to operate on UTC fixed time and runs with 2 streams as shown in the stage sequence provided in Figure 3.2. Stream 1 is the Hope Street approach and opposing circulatory, represented by phases B and A respectively. Stream 2 operates the Mile End Road approach (phase D), Church Street approach (phase I) and opposing circulatory. The crossing along the Church Street exit is also controlled within Stream 2 and is represented by phases F and G.
3.17. Within Stream 2, only stages 2 and 3 can be followed by 1 and are called on demand. Therefore, should there be no demand for crossing G, stage 3 will run instead. Stage 4 is prohibited under VA control.
3.18. AM and PM peak timings are as follows:
Stream 1 – Stage 1 35s, Stage 2 73s; and,

9
Portsmouth Corridor 1 Air Quality Management Area VISSIM Model Assessment
Stream 2 – Stage 1 78s, Stage 2 or 3 24s.
3.19. The Inter peak times are as follows:
Stream 1 – stage 1 21s, stage 2 63s; and,
Stream 2 – stage 1 67s, stage 2 11s.
3.20. The Hope Street circulatory (stage 1) ends 4 second after the Church Street green (Phase I) for all peaks.
Figure 3.2- Church Street Roundabout Signal Staging
Marketway Roundabout J24231
3.21. The junction operates vehicle actuation, with the signal staging shown in Figure 3.3. Phase A represents Commercial Road NB and phase B represents the Marketway circulatory (south) movement.
Figure 3.3- Marketway Roundabout Signal Staging
Unicorn Road/Alfred Road J24271
3.22. This junction has been coded on a 4 stage operation and the staging sequence is provided in Figure 3.4. Phase A and Phase B represent Alfred Road northbound and southbound whilst Phases D, E, F and G represent the Unicorn Road movement.
3.23. In the PM peak stage 2 does not appear, therefore right turning traffic from the north (phase C) operates on give way during stage 1.

10
Portsmouth Corridor 1 Air Quality Management Area VISSIM Model Assessment
Figure 3.4- Unicorn Road/Alfred Road Signal Staging
Queen Street J24221
3.24. This junction has been coded on a 3 stage operation and the staging sequence is provided in Figure 3.5. Phases A and B represent Alfred Road, phases E and F represent the southbound movement and phases C, D and G represent the Queen Street movement.
Figure 3.5- Queen Street/Alfred Road Signal Staging
Park Road J24241
3.25. This junction has been coded on a 3 stage operation and the staging sequence is provided in Figure 3.6. Phases A and C represent Anglesea Road while phase B represents the Park Road movement.
Figure 3.6- Park Road /Anglesea Road Signal Staging
Winston Churchill Avenue J24141
3.26. This junction has been coded on a 2 stage operation and the staging sequence is provided in Figure 3.7. Phases A and E represent Anglesea Road and Phase B represents the Winston Churchill Avenue movement.
Figure 3.7- Winston Churchill Avenue/Anglesea Road Signal Staging

11
Portsmouth Corridor 1 Air Quality Management Area VISSIM Model Assessment
Cambridge Road J24121
3.27. This junction has been coded on a 2 stage operation and the staging sequence is provided in Figure 3.4. Phases A and C represent the A3 and Phase E represents the Cambridge Road movement.
Figure 3.8- Cambridge Rd/A3 Signal Staging
Model Output
3.28. Measures of effectiveness have been coded and output from VISSIM including the following:
General network performance statistics;
Junction analysis (including demand and supply volumes, average and maximum queue lengths);
Journey Times and,
Vehicle record (for use in AIRE).

12
Portsmouth Corridor 1 Air Quality Management Area VISSIM Model Assessment
4. Model Calibration and Validation
Introduction
4.1. In order to confirm that the model is fit for the purpose of the evaluation of proposed improvement measures and to provide credibility to results it is necessary to calibrate and validate the model. The calibration process involves changing the network set up and behavioural characteristics to achieve a match between observed and modelled data.
4.2. Model validation assesses the accuracy of the model by comparing traffic data from the model with independent traffic data not used in the model building process. Validation is directly linked to the calibration process as adjustments in calibration are needed to improve the models ability to replicate field measured traffic conditions.
Parameters used to calibrate this model
4.3. The Corridor 1 model has largely been developed using default VISSIM parameters. However, during the process of calibration, some parameters were reviewed and adjusted to better fit observed driver behaviour. Key parameters and their calibration are summarised in the following paragraphs.
Vehicle Acceleration and Deceleration
4.4. Default values were assumed for rates of vehicle acceleration and deceleration, vehicle models and weight distributions.
4.5. However, the acceleration parameters for HGVs and Buses have been reviewed as part of the Air Quality scheme and altered to better reflect those quoted by Martin Fellandorff in his report titled ‘A Toolbox to Quantify Emission Reductions due to Signal Control’ dated 2010. Figure 4.1 shows the parameters used for HGVs and Buses.
Figure 4.1- HGV and Bus Acceleration Parameters

13
Portsmouth Corridor 1 Air Quality Management Area VISSIM Model Assessment
Vehicle Following Behaviour and Link Types
4.6. The Urban Free Lane selection link type has been utilised on the entire network, although there are sections of the network where traffic has to merge over relatively short distances and vehicles were not reflecting the observed conditions of letting vehicles in or out of lanes. Therefore, an amended version of the Urban Free Lane (motorised) link type, Urban Free Lane (merge), was created for these sections only. This new link type was identical to the original link type, with the exception of the additive and multiplication parts of the car following model set to 1.0. The co-operative lane change parameters were also altered to 10mph maximum speed difference and collision time of 8s.
4.7. For the heavily congested section of the network (from the Mile end roundabout to Marketway and Church Street) another link type was created. This section of the network was observed to be very congested during the AM and PM peak periods and therefore, drivers naturally provided less space between vehicles. Therefore, the link type Urban Motorized (Aggressive) was created to try to replicate the driving conditions observed in this section of the network. This link type was identical to the Urban Left-Side Rule (motorized)link type with the exception of the additive and multiplication parts of the car following model set to 1.0, Advance Merging options enabled and diffusion time reduced to 60 sec.
Average Standstill Distance
4.8. The average standstill distance (between stationary vehicles) is set by default in VISSIM to 2.0 metres. This would appear to be excessive, and can affect the accuracy of queue length calculations as well as capacity in congested situations. This value has therefore been reduced to 1.5m for the two motorised link types and 1.0m for the Merge link type (based on observations of queuing traffic from the survey videos).
Links and Connectors
4.9. The default look back, lane change distances (200m) on turning connectors were increased to the appropriate length of the upstream links to match the advance road signs that traffic receives to enable it to move into the correct lanes in time, and from local knowledge of commuting traffic.
Priority Rules
4.10. It is standard practice to have all priority rules set close to default values unless site observations indicate differences.
Speed Distributions
4.11. Speed distributions define the speeds at which vehicles will travel if not hindered by other vehicles on the network. This will range from the lowest possible speed to the maximum speed for any particular speed limit.
4.12. Speed distribution limits in the VISSIM network have been set to the on-site speed limits of the study area, which is generally 30mph (25-35 mph) with the exception of the A3 Mile End Road and the M275 Flyover as a result of the traffic management in place which is 40mph (35-45 mph). The section of the M275 Motorway prior to the traffic management is set to 60mph (55-65mph).
4.13. Reduced speed areas have been placed at all turning connectors and on the circulatory of each of the roundabouts.
Validation
GEH Statistic
4.14. The Geoffrey E. Havers (GEH) statistic is a standard way of comparing observed and modelled flows as defined in the Design Manual for Roads and Bridges (DMRB) Volume 12, Chapter 4. It is used to remove the bias that exists when comparing flows of different magnitudes using percentages. For example, a difference of 10 in a flow of 100 vehicles per hour (VPH) is less significant (GEH = 3.0) than a difference of 100 in a 1000 VPH flow (GEH = 11.5), even though they both show a percentage difference of 10%.

14
Portsmouth Corridor 1 Air Quality Management Area VISSIM Model Assessment
4.15. The GEH statistic is calculated as follows:
4.16. Where:
GEH………………..is the GEH statistic;
M……………………is the modelled flow; and
C……………………is the observed flow
4.17. The accuracy of the modelled flows can also be assessed by comparing observed and modelled flows on an x-y plot and performing a linear regression analysis to calculate R2, and the slope of
the regression line through the origin. Typically a value of R2 ≥ 0.95, and slope within the range
0.90 and 1.10 would imply that the modelled flows are a good fit within the observed flows. A slope exceeding unity implies that the model is over predicting flows, while a slope less that unity suggests that the model is under-predicting observed flows.
4.18. In summary the following set of acceptable ranges and limits have been used to assess model calibration based upon all turning movements within the study area:
GEH value: ≤ 5.0 in at least 85% of cases;
R2 value: greater than or equal to 0.95; and,
Slope of linear regression: within the range 0.90 to 1.10.
Travel Times
4.19. The observed travel times have been compared to the modelled travel times. All travel times have been weighted by the number of vehicles making the journey and have utilised an acceptance criteria of 95% with 5% confidence level or 15% of the average (which ever value was the highest/lowest). Both criteria for validation of travel times were utilised due to the low number of travel time runs conducted on site.
Queue Lengths
4.20. The surveyed queue length data has been compared to the modelled queue lengths for all peaks. The queue length data utilised an acceptance criteria of one standard deviation from the observed mean, however, it was not possible to fully calibrate the model to this data for several reasons.
4.21. Queue length validation is based upon a comparison of modelled and observed average queue lengths for each hour of the modelled period. The key issue is that VISSIM records queue lengths very differently to the traffic surveys. Observations are based on spot recordings taken every 5 minutes, therefore, totalling 12 an hour. At give way controlled roundabouts, queues are often rolling queues and therefore queue lengths are subjective and the enumerators may not have accurately captured the correct queue length, also visibility of the extent of the queuing may be hindered due to the geometry of the road network (bends or hills obstructing the view).
4.22. Within VISSIM, the queue lengths are recorded for every time step which is a rate of 10 recordings per second (or 36,000 per hour) and as a result the queue length is recorded throughout periods of free flow, which gives a much truer average, which is often lower than the average reported in the survey data.
4.23. In the absence of queue length validation, greater emphasis will be based on the journey time validation.

15
Portsmouth Corridor 1 Air Quality Management Area VISSIM Model Assessment
Random Seeds
4.24. As VISSIM is a stochastic model the results differ slightly depending on the random seed assigned to each simulation run. Therefore, in order to obtain statistically significant results the existing conditions peak hour models were simulated 16 times with different random seeds. Random seeds can be thought of as different days and therefore account for daily variation. The results presented are an average of the 16 random seed runs.

16
Portsmouth Corridor 1 Air Quality Management Area VISSIM Model Assessment
5. 2013 Existing Conditions Validation Results
AM Peak
GEH Statistic
5.1. The GEH statistic assessments have been conducted on all turning movements at all junctions in the modelled network. A cumulative frequency plot of the AM Peak GEH values are shown in Figure 5.1 below. The plot indicates that the model meets the first criteria in that 99% of cases are less than or equal to a GEH of 5.
Figure 5.1 - AM Peak Cumulative Frequency of GEH Values
The linear regression of the modelled total flows and observed total flows was also analysed. A high co-efficient correlation (R2) was achieved with the results shown in Figure 5.2. A value of R2 =1 implies a perfect match while R2 = 0 an imperfect match between the observed and modelled flows.
Figure 5.2 - AM Peak Linear Regression of Traffic Flows
60
65
70
75
80
85
90
95
100
1 2 3 4 5
Cu
mu
lati
ve
Fre
qu
en
cy
(%
)
GEH Values (less than or equal to)
y = 0.9709x + 0.4779R² = 0.996
0
500
1000
1500
2000
2500
3000
3500
0 500 1000 1500 2000 2500 3000 3500
Mo
de
lls
ed
(V
PH
)
Observed - Balanced (VPH)
Turning Flows Ideal Turning Flow Regression

17
Portsmouth Corridor 1 Air Quality Management Area VISSIM Model Assessment
5.2. Regression of the AM peak observed versus modelled flows showed an R2 value of 0.996 and a slope of 0.9709 demonstrating that the model shows an excellent fit and meets the second and third validation criteria.
5.3. In summary the AM peak has met all of the GEH validation criteria and is considered to be calibrated extremely well to the surveyed traffic flows.
Junction Performance
5.4. A summary of the overall junction analysis results for the 2013 Existing AM peak period model is shown in Table 5.1 below. The table shows the summary performance at each junction within the network within each hour of the peak period. A full output by each turning movement is provided in Appendix B.
5.5. Table 5.1 provides information on modelled and observed flow differences, average and maximum queue lengths and average delays. The Level of Service (LOS) indicator has also been included in order to provide a quick reference to junction performance.
5.6. The LOS is an American concept derived from their Highway Capacity Manual (2000). It rates performance based upon delay thresholds on an A to F grading as follows:
LOS A – 0 to 10 seconds;
LOS B – 10 to 20 seconds (10 to 15 seconds for unsignalised);
LOS C – 20 to 35 seconds (15 to 25 seconds for unsignalised);
LOS D – 35 to 55 seconds (25 to 35 seconds for unsignalised);
LOS E – 55 to 80 seconds (35 to 50 seconds for unsignalised); and,
LOS F – Over 80 seconds (over 50 seconds for unsignalised).
5.7. Any junctions operating at LOS E or F are highlighted in light blue. A LOS E is considered to be close to capacity whilst a LOS F is considered to be over capacity.

18
Portsmouth Corridor 1 Air Quality Management Area VISSIM Model Assessment
Table 5.1 – 2013 AM Peak Summary of Junction Performance
5.8. Table 5.1 indicates that overall the network operates with a LOS of D, although during the last two hours of the AM peak the Holbrook Road/Church Street roundabout operates over capacity and the Church Street Roundabout (Mile End Road) operates at capacity.
Travel Times
5.9. A summary of the average weighted travel times for the 2013 AM peak existing conditions for all vehicles for each hour is shown in Table 5.2.
Node Description Model Count Mod-Cnt Max Avg Avg LOS
501 Rudmore Roundabout 7341 7660 -319 224 5 8.3 A
502 Mile End Roundabout 4370 4826 -456 232 38 39.9 D
503 Cascade's Approach 2763 3010 -247 142 1 5.5 A
504 Marketway Roundabout 2088 2234 -146 122 3 10.1 B
505 A2030 roundabout 785 818 -33 165 2 10.6 B
506 Holbrook Road Roundabout 1980 2096 -116 231 13 23.6 C
507 Unicorn Road 3016 3250 -234 221 14 26.9 C
508 Stanhope Road 455 478 -23 58 0 5.1 A
509 Queen Street 2484 2728 -244 225 8 20.3 C
510 St Michael's Gyratory 2020 2146 -126 221 4 15.8 C
511 Park Road 1909 2113 -204 190 11 15.2 B
512 Princess Royal Road 3561 3766 -205 227 14 19.7 B
32771 35125 -2354 232 8 18.0 C
501 Rudmore Roundabout 8193 8238 -45 178 6 8.7 A
502 Mile End Roundabout 5711 5927 -216 232 58 57.2 E
503 Cascade's Approach 3916 4089 -173 232 6 11.5 B
504 Marketway Roundabout 2985 3088 -103 229 13 27.6 D
505 A2030 roundabout 911 996 -85 231 4 14.3 B
506 Holbrook Road Roundabout 2224 2439 -215 236 91 161.2 F
507 Unicorn Road 3949 4087 -138 226 17 26.2 C
508 Stanhope Road 613 660 -47 76 0 5.1 A
509 Queen Street 3430 3574 -144 231 27 31.8 C
510 St Michael's Gyratory 2734 2813 -79 232 9 27.8 D
511 Park Road 2538 2699 -161 235 34 29.9 C
512 Princess Royal Road 3244 3282 -38 224 8 13.2 B
40450 41892 -1442 236 21 32.3 D
501 Rudmore Roundabout 5881 5644 237 219 3 7.3 A
502 Mile End Roundabout 4257 4120 137 232 46 65.3 E
503 Cascade's Approach 2867 2909 -42 227 3 9.0 A
504 Marketway Roundabout 2455 2420 35 226 5 16.6 C
505 A2030 roundabout 889 844 45 232 7 22.3 C
506 Holbrook Road Roundabout 2020 1905 115 236 47 91.0 F
507 Unicorn Road 2841 2837 4 223 8 19.6 B
508 Stanhope Road 639 634 5 73 0 5.2 A
509 Queen Street 2427 2394 33 234 13 22.7 C
510 St Michael's Gyratory 2104 2023 81 225 4 21.3 C
511 Park Road 1811 1790 21 231 10 15.1 B
512 Princess Royal Road 2186 1939 247 161 4 9.4 A
30378 29459 919 236 12 26.3 D
103599 106476 -2877 236 14 26.0 D0700-1000 Network Total
Q Length (m) Delay (sec)Volume
0700-0800 Network Total
0800-0900 Network Total
0900-1000 Network Total

19
Portsmouth Corridor 1 Air Quality Management Area VISSIM Model Assessment
Table 5.2 – 2013 AM Peak Summary of Travel Times (secs)
From To Direction
Weighted
Model
Average
Observed
AverageLower Upper Accept
Winston Churchill
AvenueAnglesea Road Northbound 39 40 34 46 P
Anglesea Road Queen Street (NB) Northbound 79 146 82 209 O
Queen Street (NB) Cascade's Approach Northbound 67 77 62 93 P
Cascade's Approach Marketw ay Roundabout Northbound 27 37 29 46 O
Marketw ay Roundabout Mile End Roundabout Northbound 65 85 32 138 P
Mile End Roundabout Princess Royal Road Northbound 31 32 25 40 P
Princess Royal Road Rudmore Roundabout Northbound 58 69 58 80 P
Rudmore Roundabout Princess Royal Road Southbound 39 41 35 47 P
Princess Royal Road Mile End Roundabout Southbound 20 26 10 42 P
Mile End Roundabout Marketw ay Roundabout Southbound 32 39 28 51 P
Marketw ay Roundabout Cascade's Approach Southbound 35 28 24 33 O
Cascade's Approach Queen Street(SB) Southbound 59 76 58 94 P
Queen Street(SB) Anglesea Road Southbound 50 39 33 45 O
Anglesea RoadWinston Churchill
AvenueSouthbound 15 15 11 20 P
71.4%
Winston Churchill
AvenueAnglesea Road Northbound 48 53 41 64 P
Anglesea Road Queen Street (NB) Northbound 80 144 83 205 O
Queen Street (NB) Cascade's Approach Northbound 67 87 56 117 P
Cascade's Approach Marketw ay Roundabout Northbound 29 28 18 38 P
Marketw ay Roundabout Mile End Roundabout Northbound 81 62 34 90 P
Mile End Roundabout Princess Royal Road Northbound 27 31 17 45 P
Princess Royal Road Rudmore Roundabout Northbound 55 65 49 82 P
Rudmore Roundabout Princess Royal Road Southbound 40 41 35 47 P
Princess Royal Road Mile End Roundabout Southbound 23 30 22 37 P
Mile End Roundabout Marketw ay Roundabout Southbound 49 57 48 65 P
Marketw ay Roundabout Cascade's Approach Southbound 49 47 37 58 P
Cascade's Approach Queen Street(SB) Southbound 86 70 60 81 O
Queen Street(SB) Anglesea Road Southbound 71 76 64 87 P
Anglesea RoadWinston Churchill
AvenueSouthbound 18 10 8 11 O
78.6%
Winston Churchill
AvenueAnglesea Road Northbound 44 42 34 50 P
Anglesea Road Queen Street (NB) Northbound 54 89 72 106 O
Queen Street (NB) Cascade's Approach Northbound 57 51 42 60 P
Cascade's Approach Marketw ay Roundabout Northbound 29 28 19 36 P
Marketw ay Roundabout Mile End Roundabout Northbound 72 49 29 70 O
Mile End Roundabout Princess Royal Road Northbound 24 31 22 40 P
Princess Royal Road Rudmore Roundabout Northbound 44 51 41 62 P
Rudmore Roundabout Princess Royal Road Southbound 40 39 33 45 P
Princess Royal Road Mile End Roundabout Southbound 21 26 16 35 P
Mile End Roundabout Marketw ay Roundabout Southbound 39 31 26 36 O
Marketw ay Roundabout Cascade's Approach Southbound 43 32 23 41 O
Cascade's Approach Queen Street(SB) Southbound 72 66 54 77 P
Queen Street(SB) Anglesea Road Southbound 53 55 41 69 P
Anglesea RoadWinston Churchill
AvenueSouthbound 16 15 8 23 P
71.4%
73.8%
Description
Average Journey Times (secs) All Vehicles
Overall 0700-1000
Average Limits 95% or 15%
Overall 0700-0800
Overall 0800-0900
Overall 0900-1000

20
Portsmouth Corridor 1 Air Quality Management Area VISSIM Model Assessment
5.10. Table 5.2 shows that overall 74% of modelled travel times are within the lower and upper thresholds, with the northbound segment from Anglesea Road to Queen Street being consistently shorter than observed throughout the AM peak.
5.11. The cumulative travel times validate to 95% of the observed and the corresponding graphs comparing the modelled to the observed travel times, per direction for each hour, can be located in Appendix B, whilst the peak hour 0800-0900 graphs are shown in Figure 5.3 and Figure 5.4. The one segment that does not validate to the observed time is the Anglesea Road to Queen Street, which again is marginally lower in the last hour of the AM peak period.
Figure 5.3 – 0800-0900 Northbound Cumulative Travel Time Comparison
Figure 5.4 – 0800-0900 Southbound Cumulative Travel Time Comparison
0
100
200
300
400
500
600
Winston ChurchillAvenue
Anglesea Road Queen Street (NB) Cascade's Approach MarketwayRoundabout
Mile End Roundabout Princess Royal Road
Ave
rag
e T
rave
l T
ime
(se
c)
Location
0800-0900 Northbound Travel Time Comparison
Model Average
Observed Average
0
50
100
150
200
250
300
350
400
Rudmore Roundabout Princess Royal Road Mile End Roundabout Marketway Roundabout Cascade's Approach Queen Street(SB) Anglesea Road
Ave
rag
e T
rave
l T
ime
(se
c)
Location
0800-0900 Southbound Travel Time Comparison
Modelled Average
Observed Average

21
Portsmouth Corridor 1 Air Quality Management Area VISSIM Model Assessment
Queue Lengths
5.12. Table 5.3 shows the comparison of the modelled average and maximum queue lengths to the observed maximum and average queue length data.
Table 5.3 – 2013 AM Peak Summary of Queue Lengths (m)
Time Description Time Description
M275 SB 24 35 0 15 M275 SB 55 32 2 20
Tw yford Avenue(Ahead & Right) 115 100 7 51 Tw yford Avenue(Ahead & Right) 72 70 3 36
Tw yford Avenue (left) 0 10 0 5 Tw yford Avenue (left) 0 25 0 8
Kingston Crescent 74 70 15 60 Kingston Crescent 70 62 8 34
M275 NB (left) 14 70 0 60 M275 NB (left) 0 62 0 34
M275 NB (Ahead & Right) 58 50 6 28 M275 NB (Ahead & Right) 50 27 2 4
Wharf Road (Left) 0 60 0 22 Wharf Road (Left) 0 20 0 4
Wharf Road (Ahead & Right) 23 60 0 25 Wharf Road (Ahead & Right) 23 45 0 19
Kingston Crescent WB 32 115 0 85 Kingston Crescent WB 31 107 0 31
Car Park (Right) 0 10 0 6 Car Park (Right) 1 10 0 3
Car Park (Left) 0 0 0 0 Car Park (Left) 0 5 0 2
Kingston Crescent EB 0 10 0 1 Kingston Crescent EB 1 10 0 4
Car Park exit on A3 20 15 0 1 Car Park exit on A3 20 12 0 2
Mile End Road SB 139 95 27 74 Mile End Road SB 32 42 4 24
Mile End Road NB (Ahead) 182 120 23 91 Mile End Road NB (Ahead) 86 107 6 46
Mile End Road NB (Left) 45 77 2 42 Mile End Road NB (Left) 28 92 1 23
Princess Royal Road 46 37 4 17 Princess Royal Road 40 35 4 19
Mile End Road SB 89 92 9 59 Mile End Road SB 101 65 11 45
Church Street 227 55 144 49 Church Street 230 60 182 50
Commercial Road (NB) 42 115 3 41 Commercial Road (NB) 21 35 0 19
Hope Street (Left) 186 125 23 73 Hope Street (Left) 131 70 13 40
Hope Street (Ahead & Right) 7 50 0 28 Hope Street (Ahead & Right) 11 15 0 5
Commercial Road (SB) 89 50 2 21 Commercial Road (SB) 131 45 9 26
Cornmill Street 127 45 9 33 Cornmill Street 140 30 22 22
Commercial Road (NB) 37 20 2 9 Commercial Road (NB) 36 30 3 17
Marketw ay 34 30 1 10 Marketw ay 42 25 1 8
A3 SB 28 10 0 2 A3 SB 57 35 1 13
Winston Churchill Avenue 40 70 4 40 Winston Churchill Avenue 43 65 7 31
St Paul's Road 17 15 0 8 St Paul's Road 11 5 0 5
Hampshire Terrace 146 30 13 22 Hampshire Terrace 135 45 10 31
Cambridge Road 42 50 0 15 Cambridge Road 52 45 1 29
Alfred Road (SB) 59 72 2 47 Alfred Road (SB) 190 97 18 60
Bishop Crispian Way 48 45 6 7 Bishop Crispian Way 75 75 11 35
Alfred Road (NB) (Right) 149 240 16 143 Alfred Road (NB) (Right) 76 80 8 51
Alfred Road (NB) (Left) 42 5 1 0 Alfred Road (NB) (Left) 26 12 0 5
Queen Street (Left) 57 70 11 25 Queen Street (Left) 50 30 7 15
Queen Street (Ahead) 44 65 4 25 Queen Street (Ahead) 41 55 5 31
M275 SB 67 30 2 21
Tw yford Avenue(Ahead & Right) 111 100 8 66
Tw yford Avenue (left) 0 12 0 3
Kingston Crescent 75 70 18 53
M275 NB (left) 9 70 0 53
M275 NB (Ahead & Right) 65 45 6 23
Wharf Road (Left) 0 22 0 14
Wharf Road (Ahead & Right) 22 25 0 17
Kingston Crescent WB 47 160 1 115
Car Park (Right) 2 12 0 3
Car Park (Left) 0 5 0 1
Kingston Crescent EB 1 5 0 3
Car Park exit on A3 20 0 0 0
Mile End Road SB 80 67 12 41
Mile End Road NB (Ahead) 167 110 15 69
Mile End Road NB (Left) 21 60 1 26
Princess Royal Road 54 40 6 25
Mile End Road SB 139 101 17 83
Church Street 230 60 222 51
Commercial Road (NB) 32 80 1 39
Hope Street (Left) 220 105 33 73
Hope Street (Ahead & Right) 10 35 0 21
Commercial Road (SB) 205 55 29 35
Cornmill Street 165 50 26 41
Commercial Road (NB) 38 20 3 13
Marketw ay 38 30 1 11
A3 SB 52 40 1 11
Winston Churchill Avenue 65 97 10 75
St Paul's Road 28 15 1 8
Hampshire Terrace 156 40 28 30
Cambridge Road 94 80 3 40
Alfred Road (SB) 223 100 49 70
Bishop Crispian Way 81 60 9 27
Alfred Road (NB) (Right) 155 270 18 182
Alfred Road (NB) (Left) 6 10 0 3
Queen Street (Left) 68 75 14 35
Queen Street (Ahead) 52 75 7 30
Model
Max
Obs
Max
Model
Avg
Obs
Avg
Marketw ay
Roundabout
St.Michael's
Gyratory
Queen's
Street/Alfred
Road
Rudmore
Roundabout
Approach
Rudmore
Roundabout
Rudmore
Roundabout
Car Park
Trafalgar
Gate
Church Street
Roundabout
Rudmore
Roundabout
Car Park
Trafalgar
Gate
Church Street
Roundabout 0900-1
000
Marketw ay
Roundabout
St.Michael's
Gyratory
Queen's
Street/Alfred
Road
St.Michael's
Gyratory
Queen's
Street/Alfred
Road
0700-0
800
0800-0
900
Rudmore
Roundabout
Rudmore
Roundabout
Car Park
Trafalgar
Gate
Church Street
Roundabout
Marketw ay
Roundabout
Obs
Avg
Model
Max
Obs
Max
Model
AvgApproach

22
Portsmouth Corridor 1 Air Quality Management Area VISSIM Model Assessment
5.13. Table 5.3 shows that the model maximum queue lengths are generally higher than the observed maximum queue lengths and the modelled average queues are lower than the observed average queues.
Network Performance
5.14. The average and standard deviation values for various network performance parameters of the AM peak are summarised in Table 5.4 below. The full output by random seed is provided in Appendix B.
Table 5.4 – 2013 AM Peak Network Performance
5.15. The network performance indicates that vehicles suffer an average delay of 1.47 minutes. The standard deviation of the 16 random seeds indicates that some variation in the results between seeds is evident.
5.16. Random seed number 50 is the closest to the average in terms of network delay and vehicle throughput.
PM Peak
GEH Statistic
5.17. The GEH statistic assessments have been conducted on all turning movements at all junctions in the modelled network. A cumulative frequency plot of the PM peak GEH values is shown in Figure 5.5 below. The plot indicates that the model meets the first criteria in that 100% of cases are less than or equal to a GEH of 5.
Std
Dev
Remaining Vehicles in Network 590 23
Processed Vehicles 37912 49
Total Distance Travelled (mi) 106680 208
Total Travel Time (h) 2642.1 40.5
Total Network Delay (h) 943.6 41.8
Average Travel Time (mins) 4.12 0.07
Average Delay Time (mins) 1.47 0.07
Total Stopped Delay (h) 467.3 21.7
Average Stopped Delay (s) 43.7 2.1
Number of Stops 76051.0 3704.1
Average Number of Stops 1.98 0.10
Average Network Speed (mph) 25.1 0.4
AverageMeasure

23
Portsmouth Corridor 1 Air Quality Management Area VISSIM Model Assessment
Figure 5.5 - PM Peak Cumulative Frequency of GEH Values
5.18. The linear regression of the modelled total flows and observed total flows was also analysed. A high co-efficient correlation (R2) was achieved with the results shown in Figure 5.6. A value of R2 =1 implies a perfect match while R2 = 0 an imperfect match between the observed and modelled flows.
Figure 5.6 - PM Peak Linear Regression of Traffic Flows
5.19. Regression of the PM peak observed versus modelled flows showed an R2 value of 0.9984 and a slope of 0.9728 demonstrating that the model shows an excellent fit and meets the second and third validation criteria.
5.20. In summary the PM peak has met all of the GEH validation criteria and is considered to be calibrated extremely well to the surveyed traffic flows.
Junction Performance
5.21. A summary of the overall junction analysis results for the 2013 Existing PM peak period model is shown in Table 5.6 below. The table shows the summary performance at each junction within the network within each hour of the peak period. The full output by each turning movement is provided in Appendix C.
5.22. Table 5.5 provides information on modelled and observed flow differences, average and maximum queue lengths and average delays. The Level of Service (LOS) indicator has also been included in order to provide a quick reference to junction performance.
60
65
70
75
80
85
90
95
100
1 2 3 4 5
Cu
mu
lati
ve
Fre
qu
en
cy
(%
)
GEH Values (less than or equal to)
y = 0.9728x + 1.0154R² = 0.9984
0
500
1000
1500
2000
2500
3000
3500
0 500 1000 1500 2000 2500 3000 3500
Mo
de
lls
ed
(V
PH
)
Observed - Balanced (VPH)
Turning Flows Ideal Turning Flow Regression

24
Portsmouth Corridor 1 Air Quality Management Area VISSIM Model Assessment
Table 5.5 – 2013 PM Peak Summary of Junction Performance
5.23. Table 5.5 indicates that overall the network operates with a LOS of C. In first and middle hours of the PM peak, the Holbrook roundabout operates at and over capacity respectively. In the last hour, no issues have been highlighted, with all junctions operating well within capacity, although several individual movements at the Rudmore Roundabout and Mile End Roundabout operate at or over capacity.
Travel Times
5.24. A summary of the average weighted travel times for the 2013 PM peak existing conditions for all vehicles for each hour is shown in Table 5.6.
Node Description Model Count Mod-Cnt Max Avg Avg LOS
501 Rudmore Roundabout 8632 8814 -182 236 25 18.9 C
502 Mile End Roundabout 5520 5773 -253 236 26 35.4 D
503 Cascade's Approach 3897 4140 -243 225 2 8.2 A
504 Marketway Roundabout 2610 2745 -135 236 8 22.9 C
505 A2030 roundabout 1128 1156 -28 200 3 15.4 C
506 Holbrook Road Roundabout 2318 2379 -61 236 46 46.6 E
507 Unicorn Road 3983 4190 -207 229 16 25.4 C
508 Stanhope Road 717 747 -30 48 0 5.5 A
509 Queen Street 3206 3408 -202 225 13 22.9 C
510 St Michael's Gyratory 2492 2573 -81 173 5 24.0 C
511 Park Road 2344 2529 -185 225 18 20.8 C
512 Princess Royal Road 4195 4338 -143 236 51 41.8 D
41041 42792 -1751 236 16 25.3 D
501 Rudmore Roundabout 8494 8569 -75 236 36 28.6 D
502 Mile End Roundabout 5713 5838 -125 236 22 33.3 C
503 Cascade's Approach 4052 4225 -173 231 7 11.7 B
504 Marketway Roundabout 2975 3070 -95 232 11 26.4 D
505 A2030 roundabout 1118 1156 -38 232 8 27.2 D
506 Holbrook Road Roundabout 2288 2307 -19 236 48 51.1 F
507 Unicorn Road 4064 4189 -125 223 13 20.7 C
508 Stanhope Road 744 766 -22 68 0 4.8 A
509 Queen Street 3479 3581 -102 229 18 24.6 C
510 St Michael's Gyratory 2726 2712 14 187 6 29.2 D
511 Park Road 2594 2704 -110 228 23 22.6 C
512 Princess Royal Road 3501 3565 -64 229 21 21.8 C
41749 42682 -933 236 18 26.2 D
501 Rudmore Roundabout 6438 6266 172 232 10 16.1 C
502 Mile End Roundabout 4399 4418 -19 224 9 21.5 C
503 Cascade's Approach 2964 3028 -64 204 2 8.3 A
504 Marketway Roundabout 2519 2509 10 162 3 14.7 B
505 A2030 roundabout 891 898 -7 35 0 3.6 A
506 Holbrook Road Roundabout 1882 1880 2 224 8 15.8 C
507 Unicorn Road 2982 2998 -16 218 3 10.6 B
508 Stanhope Road 523 554 -31 47 0 3.8 A
509 Queen Street 2641 2672 -31 225 8 17.4 B
510 St Michael's Gyratory 2165 2162 3 119 3 20.7 C
511 Park Road 2020 2054 -34 225 10 13.5 B
512 Princess Royal Road 2090 2079 11 106 3 9.0 A
31514 31518 -4 232 5 14.7 B
114304 116993 -2689 236 13 22.7 C1600-1900 Network Total
Q Length (m) Delay (sec)Volume
1600-1700 Network Total
1700-1800 Network Total
1800-1900 Network Total

25
Portsmouth Corridor 1 Air Quality Management Area VISSIM Model Assessment
Table 5.6 – 2013 PM Peak Summary of Travel Times (secs)
From To Direction
Weighted
Model
Average
Observed
AverageLower Upper Accept
Winston Churchill
AvenueAnglesea Road Northbound 48 60 45 76 P
Anglesea RoadQueen Street
(NB)Northbound 76 121 28 213 P
Queen Street (NB)Cascade's
ApproachNorthbound 72 104 70 137 P
Cascade's
Approach
Marketw ay
RoundaboutNorthbound 31 36 26 45 P
Marketw ay
Roundabout
Mile End
RoundaboutNorthbound 67 98 32 163 P
Mile End
Roundabout
Princess Royal
RoadNorthbound 39 66 34 97 P
Princess Royal
Road
Rudmore
RoundaboutNorthbound 62 80 37 122 P
Rudmore
Roundabout
Princess Royal
RoadSouthbound 41 42 36 48 P
Princess Royal
Road
Mile End
RoundaboutSouthbound 24 28 18 39 P
Mile End
Roundabout
Marketw ay
RoundaboutSouthbound 48 48 39 57 P
Marketw ay
Roundabout
Cascade's
ApproachSouthbound 41 39 28 51 P
Cascade's
Approach
Queen
Street(SB)Southbound 73 73 62 84 P
Queen Street(SB) Anglesea Road Southbound 58 77 57 96 P
Anglesea RoadWinston Churchill
AvenueSouthbound 17 11 9 13 O
92.9%
Winston Churchill
AvenueAnglesea Road Northbound 52 45 32 59 P
Anglesea RoadQueen Street
(NB)Northbound 74 81 61 100 P
Queen Street (NB)Cascade's
ApproachNorthbound 58 64 36 93 P
Cascade's
Approach
Marketw ay
RoundaboutNorthbound 30 32 20 45 P
Marketw ay
Roundabout
Mile End
RoundaboutNorthbound 78 111 83 138 O
Mile End
Roundabout
Princess Royal
RoadNorthbound 34 45 25 66 P
Princess Royal
Road
Rudmore
RoundaboutNorthbound 89 103 37 168 P
Rudmore
Roundabout
Princess Royal
RoadSouthbound 41 55 30 80 P
Princess Royal
Road
Mile End
RoundaboutSouthbound 26 32 12 51 P
Mile End
Roundabout
Marketw ay
RoundaboutSouthbound 52 67 44 90 P
Marketw ay
Roundabout
Cascade's
ApproachSouthbound 47 59 24 94 P
Cascade's
Approach
Queen
Street(SB)Southbound 78 113 58 169 P
Queen Street(SB) Anglesea Road Southbound 65 73 51 96 P
Anglesea RoadWinston Churchill
AvenueSouthbound 19 15 11 19 P
92.9%
Winston Churchill
AvenueAnglesea Road Northbound 46 45 31 58 P
Anglesea RoadQueen Street
(NB)Northbound 55 81 55 107 P
Queen Street (NB)Cascade's
ApproachNorthbound 49 53 38 68 P
Cascade's
Approach
Marketw ay
RoundaboutNorthbound 27 32 22 41 P
Marketw ay
Roundabout
Mile End
RoundaboutNorthbound 57 52 44 60 P
Mile End
Roundabout
Princess Royal
RoadNorthbound 25 31 24 35 P
Princess Royal
Road
Rudmore
RoundaboutNorthbound 47 61 51 70 O
Rudmore
Roundabout
Princess Royal
RoadSouthbound 40 42 36 49 P
Princess Royal
Road
Mile End
RoundaboutSouthbound 21 25 11 39 P
Mile End
Roundabout
Marketw ay
RoundaboutSouthbound 39 38 30 46 P
Marketw ay
Roundabout
Cascade's
ApproachSouthbound 40 32 24 40 P
Cascade's
Approach
Queen
Street(SB)Southbound 60 65 44 86 P
Queen Street(SB) Anglesea Road Southbound 50 46 39 53 P
Anglesea RoadWinston Churchill
AvenueSouthbound 16 16 14 18 P
92.9%
92.9%Overall 1600-1900
Average Journey Times (secs) All Vehicles
Overall 1600-1700
Overall 1700-1800
Overall 1800-1900
Average Limits 95% or 15%Description

26
Portsmouth Corridor 1 Air Quality Management Area VISSIM Model Assessment
5.25. Table 5.6 shows that overall 93% of modelled travel times are within the lower and upper thresholds, with the northbound segments in the last hour being marginally higher and lower than observed.
5.26. The cumulative travel times validate to 100% of the observed and the corresponding graphs compare the modelled to the observed travel times, per direction for each hour, and are located in Appendix C, whilst the peak hour 1700-1800 graphs are shown in Figure 5.7 and Figure 5.8.
Figure 5.7 – 1700-1800 Northbound Cumulative Travel Time Comparison
Figure 5.8 – 1700-1800 Southbound Cumulative Travel Time Comparison
0
100
200
300
400
500
600
Winston Churchill
Avenue
Anglesea Road Queen Street (NB) Cascade's
Approach
Marketway
Roundabout
Mile End
Roundabout
Princess Royal
Road
Ave
rag
e T
arv
el T
ime
(se
c)
Location
1700-1800 Northound Travel Time Comparison
Modelled
Observed Average
0
50
100
150
200
250
300
350
400
450
Rudmore
Roundabout
Princess Royal
Road
Mile End
Roundabout
Marketway
Roundabout
Cascade's
Approach
Queen Street(SB) Anglesea Road
Ave
rage
Tra
vel
Tim
e (
sec)
Location
1700-1800 Southbound Travel Time Comparison
Modelled Average
Observed Average

27
Portsmouth Corridor 1 Air Quality Management Area VISSIM Model Assessment
Queue Lengths
5.27. Table 5.7 shows the comparison of the modelled average and maximum queue lengths to the observed maximum and average queue length data.
Table 5.7 – 2013 PM Peak Summary of Queue Lengths (m)
Time Description Time Description
M275 SB 219 65 110 41 M275 SB 190 90 45 49
Tw yford Avenue(Ahead & Right) 61 60 3 34 Tw yford Avenue(Ahead & Right) 69 65 3 35
Tw yford Avenue (left) 0 25 0 10 Tw yford Avenue (left) 0 15 0 6
Kingston Crescent 69 50 7 39 Kingston Crescent 63 60 4 30
M275 NB (left) 2 50 0 39 M275 NB (left) 0 60 0 30
M275 NB (Ahead & Right) 162 110 26 70 M275 NB (Ahead & Right) 81 40 5 25
Wharf Road (Left) 4 35 0 23 Wharf Road (Left) 0 17 0 7
Wharf Road (Ahead & Right) 50 37 4 31 Wharf Road (Ahead & Right) 22 20 0 14
Kingston Crescent WB 26 95 0 39 Kingston Crescent WB 10 80 0 9
Car Park (Right) 10 15 0 6 Car Park (Right) 13 10 0 5
Car Park (Left) 0 10 0 5 Car Park (Left) 0 5 0 4
Kingston Crescent EB 1 10 0 5 Kingston Crescent EB 0 10 0 4
Car Park exit on A3 20 5 0 0 Car Park exit on A3 20 5 0 0
Mile End Road SB 24 15 3 10 Mile End Road SB 16 25 1 11
Mile End Road NB (Ahead) 224 110 52 95 Mile End Road NB (Ahead) 80 65 6 40
Mile End Road NB (Left) 26 34 2 11 Mile End Road NB (Left) 16 15 0 3
Princess Royal Road 231 115 147 96 Princess Royal Road 59 35 6 22
Mile End Road SB 131 75 17 57 Mile End Road SB 98 101 12 49
Church Street 187 60 61 48 Church Street 100 80 20 51
Commercial Road (NB) 43 130 3 66 Commercial Road (NB) 19 35 0 13
Hope Street (Left) 226 145 96 106 Hope Street (Left) 140 80 14 51
Hope Street (Ahead & Right) 16 30 1 16 Hope Street (Ahead & Right) 25 15 1 10
Commercial Road (SB) 158 50 24 31 Commercial Road (SB) 115 82 7 30
Cornmill Street 76 45 5 31 Cornmill Street 47 50 2 25
Commercial Road (NB) 39 30 3 14 Commercial Road (NB) 25 15 2 9
Marketw ay 56 65 1 20 Marketw ay 24 10 0 5
A3 SB 64 40 1 24 A3 SB 56 65 1 24
Winston Churchill Avenue 55 95 10 61 Winston Churchill Avenue 47 45 9 30
St Paul's Road 18 10 0 6 St Paul's Road 14 10 0 5
Hampshire Terrace 81 50 6 33 Hampshire Terrace 51 40 2 26
Cambridge Road 88 50 3 33 Cambridge Road 48 35 1 20
Alfred Road (SB) 140 135 9 80 Alfred Road (SB) 135 150 6 60
Bishop Crispian Way 63 60 8 33 Bishop Crispian Way 45 50 7 32
Alfred Road (NB) (Right) 133 252 17 162 Alfred Road (NB) (Right) 79 70 8 52
Alfred Road (NB) (Left) 16 5 0 2 Alfred Road (NB) (Left) 15 10 0 2
Queen Street (Left) 88 105 17 62 Queen Street (Left) 49 70 7 23
Queen Street (Ahead) 75 45 8 30 Queen Street (Ahead) 39 65 2 28
M275 SB 225 80 138 58
Tw yford Avenue(Ahead & Right) 67 50 3 27
Tw yford Avenue (left) 0 15 0 6
Kingston Crescent 74 55 11 38
M275 NB (left) 0 55 0 38
M275 NB (Ahead & Right) 214 100 65 75
Wharf Road (Left) 0 45 0 28
Wharf Road (Ahead & Right) 50 45 4 30
Kingston Crescent WB 55 110 1 63
Car Park (Right) 10 10 0 6
Car Park (Left) 0 5 0 3
Kingston Crescent EB 0 10 0 4
Car Park exit on A3 20 5 0 0
Mile End Road SB 22 35 3 16
Mile End Road NB (Ahead) 214 94 31 78
Mile End Road NB (Left) 20 20 1 6
Princess Royal Road 209 90 50 50
Mile End Road SB 132 110 22 79
Church Street 151 60 47 47
Commercial Road (NB) 47 105 4 64
Hope Street (Left) 220 132 57 88
Hope Street (Ahead & Right) 19 35 1 18
Commercial Road (SB) 156 100 23 59
Cornmill Street 149 55 37 37
Commercial Road (NB) 36 50 4 16
Marketw ay 46 55 1 21
A3 SB 63 65 2 32
Winston Churchill Avenue 60 75 13 61
St Paul's Road 34 15 1 8
Hampshire Terrace 94 35 9 30
Cambridge Road 70 45 2 24
Alfred Road (SB) 200 160 20 117
Bishop Crispian Way 60 80 9 28
Alfred Road (NB) (Right) 101 165 15 91
Alfred Road (NB) (Left) 21 5 0 1
Queen Street (Left) 79 115 15 42
Queen Street (Ahead) 66 50 6 26
St.Michael's
Gyratory
Queen's
Street/Alfred
Road
1600-1
700
1700-1
800
Rudmore
Roundabout
Rudmore
Roundabout Car
Park
Trafalgar Gate
Church Street
Roundabout
Marketw ay
Roundabout
Obs
Avg
Model
Max
Obs
Max
Model
AvgApproach
Rudmore
Roundabout
Rudmore
Roundabout Car
Park
Trafalgar Gate
Church Street
Roundabout
Rudmore
Roundabout Car
Park
Trafalgar Gate
Church Street
Roundabout 1800-1
900
Marketw ay
Roundabout
St.Michael's
Gyratory
Queen's
Street/Alfred
Road
Marketw ay
Roundabout
St.Michael's
Gyratory
Queen's
Street/Alfred
Road
Rudmore
Roundabout
Approach
Model
Max
Obs
Max
Model
Avg
Obs
Avg

28
Portsmouth Corridor 1 Air Quality Management Area VISSIM Model Assessment
5.28. Table 5.7 shows that the modelled maximum queue lengths are generally higher than the observed maximum queue lengths whilst the modelled average queues are generally lower than the observed.
Network Performance
5.29. The average and standard deviation values for various network performance parameters of the PM peak are summarised in Table 5.8 below. The full output by random seed is provided in Appendix C.
Table 5.8 – 2013 PM Peak Network Performance
5.30. The network performance indicates that vehicles suffer an average delay of 1.16 minutes. The standard deviation of the 16 random seeds indicates that some variation in the results between seeds is evident.
5.31. Random seed number 20 is the closest to the average in terms of network delay and vehicle throughput.
Inter Peak
GEH Statistic
5.32. The GEH statistic assessments have been conducted on all turning movements at all junctions in the modelled network. A cumulative frequency plot of the Inter peak GEH values is shown in Figure 5.9 below. The plot indicates that the model meets the first criteria in that 100% of cases are less than or equal to a GEH of 5.
Std
Measure Average Dev
Remaining Vehicles in Network 567 31
Processed Vehicles 47561 55
Total Distance Travelled (mi) 113558 251
Total Travel Time (h) 2774.5 99.2
Total Network Delay (h) 933.6 100.3
Average Travel Time (mins) 3.46 0.13
Average Delay Time (mins) 1.16 0.13
Total Stopped Delay (h) 467.9 39.7
Average Stopped Delay (s) 35.0 3.0
Number of Stops 89170.9 9686.0
Average Number of Stops 1.85 0.20
Average Network Speed (mph) 25.5 0.9

29
Portsmouth Corridor 1 Air Quality Management Area VISSIM Model Assessment
Figure 5.9 - Inter Peak Cumulative Frequency of GEH Values
5.33. The linear regression of the modelled total flows and observed total flows was also analysed. A high co-efficient correlation (R2) was achieved with the results shown in Figure 5.10. A value of R2 =1 implies a perfect match while R2 = 0 an imperfect match between the observed and modelled flows.
Figure 5.10 - Inter Peak Linear Regression of Traffic Flows
5.34. Regression of the Inter peak observed versus modelled flows showed an R2 value of 0.9982 and a slope of 0.9682 demonstrating that the model shows an excellent fit and meets the second and third validation criteria.
5.35. In summary the Inter peak has met all of the GEH validation criteria and is considered to be calibrated extremely well to the surveyed traffic flows.
Junction Performance
5.36. A summary of the overall junction analysis results for the 2013 Existing Inter peak period model is shown in Table 5.9 below. The table shows the summary performance at each junction within the network within each hour of the peak period. A full output by each turning movement is provided in Appendix D.
5.37. Table 5.9 provides information on modelled and observed flow differences, average and maximum queue lengths and average delays. The Level of Service (LOS) indicator has also been included in order to provide a quick reference to junction performance.
60
65
70
75
80
85
90
95
100
1 2 3 4 5
Cu
mu
lati
ve
Fre
qu
en
cy
(%
)
GEH Values (less than or equal to)
y = 0.9682x + 1.1518R² = 0.9982
0
500
1000
1500
2000
2500
0 500 1000 1500 2000 2500
Mo
de
lls
ed
(V
PH
)
Observed - Balanced (VPH)
Turning Flows Ideal Turning Flow Regression

30
Portsmouth Corridor 1 Air Quality Management Area VISSIM Model Assessment
Table 5.9 – 2013 Inter Peak Summary of Junction Performance
Node Description Model Count Mod-Cnt Max Avg Avg LOS
501 Rudmore Roundabout 5230 5358 -128 141 3 7.7 A
502 Mile End Roundabout 3773 3909 -136 105 5 16.8 B
503 Cascade's Approach 2826 2947 -121 231 4 9.4 A
504 Marketway Roundabout 2319 2369 -50 106 3 13.8 B
505 A2030 roundabout 871 872 -1 70 1 5.0 A
506 Holbrook Road Roundabout 1613 1635 -22 189 5 13.6 B
507 Unicorn Road 3112 3160 -48 229 19 31.3 C
508 Stanhope Road 522 520 2 47 0 5.4 A
509 Queen Street 2273 2327 -54 192 8 19.3 B
510 St Michael's Gyratory 1807 1812 -5 125 2 20.1 C
511 Park Road 1571 1626 -55 157 7 13.1 B
512 Princess Royal Road 2112 2218 -106 84 4 9.3 A
28028 28753 -725 231 4 14.6 B
501 Rudmore Roundabout 5198 5321 -123 101 2 7.4 A
502 Mile End Roundabout 3726 3856 -130 162 5 16.9 B
503 Cascade's Approach 2832 2944 -112 95 1 6.1 A
504 Marketway Roundabout 2181 2246 -65 94 2 11.9 B
505 A2030 roundabout 912 925 -13 40 1 3.9 A
506 Holbrook Road Roundabout 1807 1821 -14 232 17 24.2 C
507 Unicorn Road 2971 3018 -47 181 9 21.5 C
508 Stanhope Road 536 545 -9 45 0 5.3 A
509 Queen Street 2324 2393 -69 148 7 17.9 B
510 St Michael's Gyratory 1897 1913 -16 149 3 20.8 C
511 Park Road 1683 1734 -51 151 8 13.5 B
512 Princess Royal Road 2148 2241 -93 114 3 9.0 A
28215 28957 -742 232 4 13.5 B
56243 57709 -1466 232 4 14.1 B1200-1400 Network Total
Q Length (m) Delay (sec)Volume
1200-1300 Network Total
1300-1400 Network Total
5.38. Table 5.9 indicates that overall the network operates with a LOS of B with no significant congestion or delay observed at any of the junctions within the study area. However, several individual turning movements operate at or over capacity as shown in Appendix D.
Travel Times
5.39. A summary of the average weighted travel times for the 2013 Inter peak existing conditions for all vehicles for each hour is shown in Table 5.10.

31
Portsmouth Corridor 1 Air Quality Management Area VISSIM Model Assessment
Table 5.10 – 2013 Inter Peak Summary of Travel Times (secs)
5.40. Table 5.10 shows that overall 89% of modelled travel times are within the lower and upper thresholds. In both hours of the Inter peak the modelled northbound segment between the Marketway roundabout and Church Street roundabout is much lower than the observed time, but it was noticed that traffic management was in place during the Inter peak which resulted in the northbound approach being reduced to 2 lanes with the offside lane coned off.
5.41. As a result of the traffic management being in place, the cumulative travel times validate to 79% of the observed and the corresponding graphs comparing the modelled to the observed travel times, per direction for each hour, can be located in Appendix D, whilst the peak hour 1300-1400 graphs are shown in Figures 5.11 and 5.12.
From To Direction
Weighted
Model
Average
Observed
AverageLower Upper Accept
Winston Churchill
AvenueAnglesea Road Northbound 46 49 33 65 P
Anglesea Road Queen Street (NB) Northbound 68 59 28 89 P
Queen Street (NB)Cascade's
ApproachNorthbound 67 58 41 74 P
Cascade's
Approach
Marketw ay
RoundaboutNorthbound 32 72 32 110 P
Marketw ay
Roundabout
Church Street
RoundaboutNorthbound 66 212 159 265 O
Church Street
Roundabout
Princess Royal
RoadNorthbound 24 30 22 38 P
Princess Royal RoadRudmore
RoundaboutNorthbound 45 42 35 48 P
Rudmore
Roundabout
Princess Royal
RoadSouthbound 40 36 31 42 P
Princess Royal RoadChurch Street
RoundaboutSouthbound 16 18 15 21 P
Church Street
Roundabout
Marketw ay
RoundaboutSouthbound 37 30 26 35 O
Marketw ay
Roundabout
Cascade's
ApproachSouthbound 44 34 23 46 P
Cascade's
ApproachQueen Street(SB) Southbound 72 65 43 86 P
Queen Street(SB) Anglesea Road Southbound 48 49 40 58 P
Anglesea RoadWinston Churchill
AvenueSouthbound 16 28 10 47 P
85.7%
Winston Churchill
AvenueAnglesea Road Northbound 46 51 35 67 P
Anglesea Road Queen Street (NB) Northbound 69 69 29 108 P
Queen Street (NB)Cascade's
ApproachNorthbound 66 81 66 95 P
Cascade's
Approach
Marketw ay
RoundaboutNorthbound 31 63 8 117 P
Marketw ay
Roundabout
Church Street
RoundaboutNorthbound 66 259 161 357 O
Church Street
Roundabout
Princess Royal
RoadNorthbound 25 27 23 32 P
Princess Royal RoadRudmore
RoundaboutNorthbound 44 47 40 54 P
Rudmore
Roundabout
Princess Royal
RoadSouthbound 40 40 34 46 P
Princess Royal RoadChurch Street
RoundaboutSouthbound 16 22 12 33 P
Church Street
Roundabout
Marketw ay
RoundaboutSouthbound 36 44 34 52 P
Marketw ay
Roundabout
Cascade's
ApproachSouthbound 37 32 23 41 P
Cascade's
ApproachQueen Street(SB) Southbound 60 74 58 89 P
Queen Street(SB) Anglesea Road Southbound 46 54 40 67 P
Anglesea RoadWinston Churchill
AvenueSouthbound 16 21 9 33 P
92.9%
89.3%Overall 1200-1400
Description
Average Journey Times (secs) All Vehicles
Overall 1200-1300
Overall 1300-1400
Average Limits 95% or 15%

32
Portsmouth Corridor 1 Air Quality Management Area VISSIM Model Assessment
Figure 5.11 – 1300-1400 Northbound Cumulative Travel Time Comparison
Figure 5.12 – 1300-1400 Southbound Cumulative Travel Time Comparison
Queue Lengths
5.42. Table 5.11 shows the comparison of the modelled average and maximum queue lengths to the observed queue length data.
0
100
200
300
400
500
600
700
Winston ChurchillAvenue
Anglesea Road Queen Street (NB) Cascade'sApproach
MarketwayRoundabout
Church StreetRoundabout
Princess RoyalRoad
Ave
rag
e T
rave
l T
ime
(se
c)
Location
1300-1400 Northbound Travel Time Comparison
Modelled
Observed Average
0
50
100
150
200
250
300
RudmoreRoundabout
Princess RoyalRoad
Church StreetRoundabout
MarketwayRoundabout
Cascade'sApproach
Queen Street(SB) Anglesea Road
Ave
rag
e T
rave
l T
ime
(se
c)
Location
1300-1400 Southbound Travel Time Comparison
Modelled Average
Observed Average

33
Portsmouth Corridor 1 Air Quality Management Area VISSIM Model Assessment
Table 5.11 – 2013 Inter Peak Summary of Queue Lengths (m)
5.43. The modelled maximum queues are generally higher than the observed queues, whilst the modelled average queues are much lower than the observed.
Network Performance
5.44. The average and standard deviation values for various network performance parameters of the Inter peak are summarised in Table 5.12 below. The full output by random seed is provided in Appendix D.
Time Description
M275 SB 65 50 4 37
Tw yford Avenue(Ahead & Right) 54 0 2 0
Tw yford Avenue (left) 0 50 0 38
Kingston Crescent 64 62 4 37
M275 NB (left) 0 65 0 43
M275 NB (Ahead & Right) 74 0 4 0
Wharf Road (Left) 0 0 0 0
Wharf Road (Ahead & Right) 44 40 1 22
Kingston Crescent WB 13 52 0 18
Car Park (Right) 3 5 0 3
Car Park (Left) 0 12 0 4
Kingston Crescent EB 1 12 0 4
Car Park exit on A3 20 0 0 0
Mile End Road SB 23 25 3 13
Mile End Road NB (Ahead) 64 80 6 52
Mile End Road NB (Left) 30 60 1 30
Princess Royal Road 51 40 5 21
Mile End Road SB 54 45 4 35
Church Street 66 55 13 50
Commercial Road (NB) 22 155 1 97
Hope Street (Left) 88 90 8 50
Hope Street (Ahead & Right) 19 0 1 0
Commercial Road (SB) 84 42 4 21
Cornmill Street 50 40 3 25
Commercial Road (NB) 37 45 3 15
Marketw ay 49 60 1 22
A3 SB 50 22 1 5
Winston Churchill Avenue 39 50 6 29
St Paul's Road 10 10 0 7
Hampshire Terrace 54 45 1 28
Cambridge Road 57 57 2 22
Alfred Road (SB) 82 65 4 48
Bishop Crispian Way 65 45 9 25
Alfred Road (NB) (Right) 72 84 9 53
Alfred Road (NB) (Left) 21 10 0 4
Queen Street (Left) 58 40 9 22
Queen Street (Ahead) 47 45 5 31
M275 SB 60 40 3 35
Tw yford Avenue(Ahead & Right) 49 0 2 0
Tw yford Avenue (left) 0 77 0 49
Kingston Crescent 63 50 4 33
M275 NB (left) 0 50 0 39
M275 NB (Ahead & Right) 60 0 3 0
Wharf Road (Left) 0 0 0 0
Wharf Road (Ahead & Right) 36 120 0 44
Kingston Crescent WB 18 92 0 23
Car Park (Right) 2 5 0 3
Car Park (Left) 0 10 0 3
Kingston Crescent EB 1 5 0 2
Car Park exit on A3 20 0 0 0
Mile End Road SB 20 25 2 13
Mile End Road NB (Ahead) 76 77 6 46
Mile End Road NB (Left) 24 35 1 22
Princess Royal Road 48 40 5 19
Mile End Road SB 47 52 4 36
Church Street 60 60 12 53
Commercial Road (NB) 26 145 1 110
Hope Street (Left) 109 82 9 53
Hope Street (Ahead & Right) 24 0 1 0
Commercial Road (SB) 69 50 2 22
Cornmill Street 27 35 1 19
Commercial Road (NB) 31 15 2 13
Marketw ay 53 67 1 36
A3 SB 45 32 0 12
Winston Churchill Avenue 42 35 6 25
St Paul's Road 9 15 0 9
Hampshire Terrace 74 45 4 29
Cambridge Road 54 50 2 20
Alfred Road (SB) 65 60 2 38
Bishop Crispian Way 65 50 9 30
Alfred Road (NB) (Right) 75 80 10 58
Alfred Road (NB) (Left) 39 10 1 5
Queen Street (Left) 51 47 9 27
Queen Street (Ahead) 41 50 5 34
St.Michael's
Gyratory
Queen's
Street/Alfred
Road
1200-1
300
1300-1
400
Rudmore
Roundabout Car
Park
Marketw ay
Roundabout
Marketw ay
Roundabout
St.Michael's
Gyratory
Queen's
Street/Alfred
Road
Rudmore
Roundabout
Church Street
Roundabout
Trafalgar Gate
Church Street
Roundabout
Rudmore
Roundabout
Rudmore
Roundabout Car
Park
Trafalgar Gate
Obs
Avg
Model
Max
Obs
Max
Model
AvgApproach

34
Portsmouth Corridor 1 Air Quality Management Area VISSIM Model Assessment
Table 5.12 – 2013 Inter Peak Network Performance
5.45. The network performance indicates that vehicles suffer an average delay of 39 seconds. The standard deviation of the 16 random seeds indicates that some variation in the results between seeds is evident.
5.46. Random seed number 5 is the closest to the average in terms of network delay and vehicle throughput.
Validation Summary
5.47. The VISSIM models are now deemed to have been calibrated and validated to within acceptable levels and are therefore, fit for purpose and can be used as an evaluation tool for potential improvement schemes within the study area to improve air quality.
Std
Measure Average Dev
Remaining Vehicles in Network 632 28
Processed Vehicles 31727 30
Total Distance Travelled (mi) 50469 164
Total Travel Time (h) 1218.6 10.9
Total Network Delay (h) 349.3 10.7
Average Travel Time (mins) 2.26 0.02
Average Delay Time (mins) 0.65 0.02
Total Stopped Delay (h) 198.9 5.1
Average Stopped Delay (s) 22.1 0.6
Number of Stops 38191.1 1068.3
Average Number of Stops 1.18 0.03
Average Network Speed (mph) 25.7 0.2

35
Portsmouth Corridor 1 Air Quality Management Area VISSIM Model Assessment
6. 2013 Proposed Assessment
Model Development 6.1. Three proposed scenarios have been developed and are described in more detail in the following
section. The existing conditions base models have been utilised and updated with the changes for each of the proposals accordingly.
Do Minimum Scenario 6.2. The ‘Do Minimum’ (DM) scenario comprises of network changes which have been implemented
on site (since the original traffic surveys and base model development).
Rudmore Roundabout
6.3. The Roundabout situated to the north of the network, has recently been converted to operate under signalled control from give way control. All approaches and their opposing circulatory have been signalised with the exception of the A2047 Kingston Road approach and circulatory, which remains on give way control.
6.4. The lane allocations have also been updated along with the implementation of a bus lane and bus gate along the southbound off slip nearside lane.
6.5. There are two controllers and each controller incorporates two streams. Controller 1 is for the SB Off-Slip / A3 Stamshaw Road with stream 2 operating the bus gate. Controller 2 stream 1 operates the NB slip and stream 2 controls Wharf Road approach. On site the junction operates on MOVA, but due to the absence of the MOVA dataset, the junction in VISSIM has been modelled to run on the CLF timings for each peak as detailed in the specifications.
6.6. Figure 6.1 provides a visual representation of the key changes made to this junction, whilst the drawings are located in Appendix E.
Figure 6.1 – Rudmore Roundabout Network Changes
Mile End Road / Church Street Roundabout / Marketway Roundabout
6.7. The current bus lane along Mile End Road southbound is to be extended through to the Marketway Roundabout with the following key changes implemented to accommodate this change:
The southbound on slip from Rudmore Roundabout merges with the nearside lane of the M275 flyover traffic and reduces back to two lanes downstream of the Princess Royal junction (rather than the slip road traffic continuing as a lane gain);

36
Portsmouth Corridor 1 Air Quality Management Area VISSIM Model Assessment
The end of the bus lane along Mile End Road is located 60m back upstream from the stop line; although buses will still utilise the nearside lane through the Church Street Roundabout;
The nearside lane through the roundabout is to be a bus lane, which continues through the full length of Commercial Road, through the Marketway Roundabout and along Marketway westbound to join up with the existing bus lane;
The offside lane along Mile End Road towards the Church Street Roundabout is for U-turns only, leaving lanes 2 and 3 for ahead traffic;
The signal timings in the AM and PM peak have been altered for stream 2 only. Stage 1 runs for 82s and stage 2 runs for 20s.
6.8. The drawings for the changes are provided in Appendix E.
St Michael’s Gyratory
6.9. The Anglesea Road approach and opposing circulatory is to be signalised along with introducing pedestrian facilities.
6.10. Atkins has previously undertaken a LinSig assessment of this junction and therefore, the timings from the LinSig have been included in the VISSIM model and coded on VA control with the LinSig fixed times coded as the phase maximum times. However, in all peaks, the circulatory maximum time has been increased as traffic was being held up at the circulatory and occasionally would block back to Cambridge Road and Hampshire Terrace.
6.11. The Cambridge Road triple pedestrian crossings are to run in isolation when there is demand at each individual crossing. Currently when one crossing is called, all three are called together stopping all traffic. These alterations are due to be installed during the Summer 2014.
Traffic Management
6.12. As stated in 1.10 traffic management was also in place at the Rudmore Roundabout throughout all peaks, with lane closures and speed restrictions in force as follows:
A3 approach reduced to 2 lanes;
Kingston Crescent approach reduced to 2 lanes;
East side circulatory reduced to 2 lanes;
South side circulatory reduced to a single lane;
A3 NB off-slip offside lane (for u-turns) coned off; and,
Slip road from Wharf Road to M275 closed.
6.13. An earlier traffic count was undertaken at the Rudmore Roundabout in March 2013. A comparison of the traffic flows showed little difference in the PM and Inter peaks, however, the AM peak comparison showed some significant differences as shown in Figure 6.2. The black figures represent the March 2013 flows, the blue figures represent the October 2013 flows and the red figures are the differences (March – Oct). The bold red is the sum of the differences on each arm.
6.14. Figure 6.2 shows that the main differences are on the M275 southbound off-slip and the London Road approaches where the March flows are much larger than the October flows. This results in 220 less trips downstream in the southbound direction from the roundabout.
6.15. Given the large discrepancy in the AM peak flows the proposed scenarios have utilised revised flows in the AM peak. The March 2013 traffic flows have been used directly at the Rudmore roundabout and Church Street roundabout and then the resulting differences downstream have been balanced through in the proportion of the existing October 2013 turning movement.

37
Portsmouth Corridor 1 Air Quality Management Area VISSIM Model Assessment
Figure 6.2 – Rudmore Roundabout Comparison of 2013 Traffic Flows (Oct and March)
Proposed Option 1 6.16. The Holbrook / Lake Road roundabout is a single lane entry roundabout on all approaches, with
the exception of the Holbrook Road approach, which has a designated left turn lane. It would appear that this roundabout was originally a 2 lane circulatory, which has been hatched down to single lanes, in order to provide room for cycle lanes.
6.17. The existing conditions models highlighted capacity issues in the AM and PM peaks along the Church Street and Lake Road (E) approaches. Therefore, proposed changes have been considered accordingly and assessed as the Do Something 1 (DS1) scenario. The Do Minimum model was utilised and updated with the following changes to this junction and are shown in Figure 6.3:
40m flare introduced along Church Street for left turns only – creating more capacity at the approach for ahead and right turns. This would involve using up some of the kerb space, but aerial photos reveal there appears to be sufficient space for this (but subject to statutory undertaker checks); and,
35m flare introduced along Lake Road (E) for left turns only, utilising the existing hatched out space.

38
Portsmouth Corridor 1 Air Quality Management Area VISSIM Model Assessment
Figure 6.3 – Holbrook Rd / Lake Rd Roundabout DS1 Layout
Proposed Option 2 6.18. This scenario changes the layout at the Church Street Roundabout to allow 3 lanes from the
merge with the Rudmore Roundabout and incorporates a bus gate upstream of the Mile End Road approach signals to give buses priority and merge them back into the general traffic stream.
6.19. The Do Minimum model was utilised and updated with the changes which are shown in Figure 6.4:
Figure 6.4 – Church Street Roundabout DS2 Layout

39
Portsmouth Corridor 1 Air Quality Management Area VISSIM Model Assessment
7. 2013 Comparison Results
AM Peak
Junction Performance
7.1. The 2013 AM peak existing conditions results for junction performance have been compared to the 2013 DM, DS1 and DS2 results in terms of average queue lengths (m) average delay (s) and LOS and are shown in Table 7.1 for each peak hour. The full output by turning movement for all measures and junctions in the network is detailed in Appendix F. The light blue shaded cells represent the optimum performer.
Table 7.1 – 2013 AM Peak Junction Performance Comparison
7.2. Table 7.1 indicates that overall each proposed scenario increases delays and average queues in the AM peak period, although all scenarios are still predicted to operate within capacity for the overall network.
7.3. The Rudmore Roundabout delays are predicted to increase in all scenarios, which could be expected when introducing traffic signals, although the junction is still predicted to operate within capacity throughout the AM peak. The Mile End Road Roundabout (Church Street Roundabout) is predicted to operate at capacity in the middle and final hours, with longer delays in each scenario as a result of altering the lane allocation, signal times and introducing the Bus Lane.
Node Description Base DM DS1 DS2 Base DM DS1 DS2 Base DM DS1 DS2
501 Rudmore Roundabout 5.0 20.6 20.8 20.8 8.3 22.0 22.3 22.3 A C C C
502 Mile End Roundabout 37.8 48.1 48.1 48.1 39.9 48.6 47.3 49.0 D D D D
503 Cascade's Approach 0.8 1.0 0.8 0.8 5.5 6.2 5.2 5.2 A A A A
504 Marketw ay Roundabout 3.0 3.7 3.9 3.9 10.1 12.2 11.7 11.8 B B B B
505 A2030 roundabout 1.6 1.3 1.5 1.6 10.6 10.0 10.7 10.9 B B B B
506 Holbrook Road Roundabout 12.7 30.9 24.1 31.0 23.6 70.6 69.9 69.9 C F F F
507 Unicorn Road 13.7 15.9 15.3 14.9 26.9 28.6 27.7 27.5 C C C C
508 Stanhope Road 0.1 0.1 0.1 0.1 5.1 4.8 4.9 4.8 A A A A
509 Queen Street 7.6 8.3 8.2 8.2 20.3 21.6 21.5 21.4 C C C C
510 St Michael's Gyratory 4.1 10.2 10.1 10.8 15.8 23.9 23.5 24.2 C C C C
511 Park Road 11.4 12.7 12.8 12.8 15.2 15.3 15.2 15.5 B B B B
512 Princess Royal Road 14.0 13.7 13.9 14.0 19.7 19.6 19.8 20.1 B B B C
8.1 14.7 14.1 14.8 18.0 25.7 25.4 25.7 C C C C
501 Rudmore Roundabout 6.0 33.1 33.1 32.8 8.7 37.7 38.9 36.0 A D D D
502 Mile End Roundabout 58.0 76.1 75.6 73.0 57.2 78.1 79.1 77.5 E E E E
503 Cascade's Approach 6.3 7.5 7.5 7.1 11.5 12.4 11.5 11.1 B B B B
504 Marketw ay Roundabout 13.1 21.7 21.2 19.1 27.6 33.1 31.0 30.5 D D D D
505 A2030 roundabout 4.5 14.5 14.5 9.7 14.3 40.1 43.4 30.7 B E E D
506 Holbrook Road Roundabout 90.9 104.2 55.2 105.3 161.2 215.2 166.1 216.9 F F F F
507 Unicorn Road 17.2 20.6 21.1 20.4 26.2 28.7 29.4 28.3 C C C C
508 Stanhope Road 0.2 0.2 0.2 0.2 5.1 5.0 5.0 5.0 A A A A
509 Queen Street 26.8 30.7 31.2 30.7 31.8 33.1 33.5 32.8 C C C C
510 St Michael's Gyratory 9.5 33.8 36.8 36.9 27.8 59.4 61.2 62.2 D E E E
511 Park Road 33.5 31.7 32.9 31.9 29.9 26.8 27.8 26.1 C C C C
512 Princess Royal Road 8.3 7.4 7.6 7.5 13.2 13.1 13.4 12.7 B B B B
21.3 35.1 31.1 35.1 32.3 46.7 44.8 45.9 D D D D
501 Rudmore Roundabout 2.9 14.7 13.6 13.2 7.3 23.0 23.3 21.9 A C C C
502 Mile End Roundabout 45.7 58.6 57.0 60.0 65.3 74.1 71.7 74.9 E E E E
503 Cascade's Approach 3.2 3.7 5.4 4.6 9.0 10.4 10.7 10.4 A B B B
504 Marketw ay Roundabout 5.4 12.1 13.1 10.8 16.6 24.2 25.4 23.9 C C D C
505 A2030 roundabout 6.7 22.5 23.3 14.1 22.3 59.0 57.5 39.2 C F F E
506 Holbrook Road Roundabout 46.7 92.8 56.6 92.4 91.0 186.0 159.8 182.8 F F F F
507 Unicorn Road 7.9 9.5 10.8 9.8 19.6 21.5 22.7 21.9 B C C C
508 Stanhope Road 0.2 0.2 0.2 0.2 5.2 5.2 5.1 5.1 A A A A
509 Queen Street 13.3 17.0 17.2 16.8 22.7 25.2 25.3 25.1 C C C C
510 St Michael's Gyratory 4.3 13.6 13.5 14.7 21.3 42.0 42.0 45.6 C D D D
511 Park Road 10.0 11.6 11.6 11.8 15.1 15.9 16.1 16.4 B B B B
512 Princess Royal Road 3.8 3.6 3.6 3.7 9.4 9.3 9.6 9.6 A A A A
11.9 22.9 19.4 22.4 26.3 40.2 38.4 39.7 D D D D
13.8 24.2 21.5 24.1 26.0 38.1 36.8 37.6 D D D D
0700-0800 Network Total
0800-0900 Network Total
0900-1000 Network Total
0700-1000 Network Total
Avg QL (m) Avg Delay (s) LOS

40
Portsmouth Corridor 1 Air Quality Management Area VISSIM Model Assessment
7.4. St Michael’s Gyratory is predicted to operate marginally worse at the Anglesea Road approach in each of the proposed scenario with the introduction of traffic signals.
7.5. The proposed changes at the Holbrook Road roundabout are predicted to help reduce the delays at the two altered approaches, but the junction is still predicted to operate over capacity throughout the AM peak.
7.6. Appendix F shows that queues and delays along Church Street increase significantly throughout the AM peak as a result of reducing the amount of green time the approach receives. The queues along Church Street extend back towards the Holbrook roundabout and causes blocking for the Holbrook Road approach as shown in Figure 7.1.
Figure 7.1 – Church Street Approach Queuing (07:47)
Travel Times
7.7. The 2013 AM peak existing conditions weighted travel times have been compared to the DM, DS1 and DS2 weighted travel times and are shown in Table 7.2. The cumulative graphs for each hour have been provided in Appendix F.

41
Portsmouth Corridor 1 Air Quality Management Area VISSIM Model Assessment
Table 7.2 – 2013 AM Peak Travel Time Comparison (s)
7.8. Table 7.2 shows that all travel times are very similar to the base model with the exception of the northbound time between Princess Royal Road and Rudmore Roundabout in the last hour where travel times have increased by 10/11 seconds as a result on introducing signals, however in the first two hours, the travel times are very similar to the base.
Time From To Direction Base DM DS1 DS2
Winston Churchill
AvenueAnglesea Road Northbound 39 40 40 40
Anglesea Road Queen Street (NB) Northbound 79 79 78 79
Queen Street (NB) Cascade's Approach Northbound 67 72 72 69
Cascade's Approach Marketw ay Roundabout Northbound 27 27 26 27
Marketw ay Roundabout Mile End Roundabout Northbound 65 72 71 70
Mile End Roundabout Princess Royal Road Northbound 31 32 31 32
Princess Royal Road Rudmore Roundabout Northbound 58 60 59 61
Rudmore Roundabout Princess Royal Road Southbound 39 41 41 41
Princess Royal Road Mile End Roundabout Southbound 20 20 19 20
Mile End Roundabout Marketw ay Roundabout Southbound 32 34 34 34
Marketw ay Roundabout Cascade's Approach Southbound 35 36 33 33
Cascade's Approach Queen Street(SB) Southbound 59 62 60 60
Queen Street(SB) Anglesea Road Southbound 50 53 53 54
Anglesea RoadWinston Churchill
AvenueSouthbound 15 15 15 15
Winston Churchill
AvenueAnglesea Road Northbound 48 50 52 51
Anglesea Road Queen Street (NB) Northbound 80 78 78 78
Queen Street (NB) Cascade's Approach Northbound 67 69 69 68
Cascade's Approach Marketw ay Roundabout Northbound 29 29 27 28
Marketw ay Roundabout Mile End Roundabout Northbound 81 80 84 86
Mile End Roundabout Princess Royal Road Northbound 27 27 28 28
Princess Royal Road Rudmore Roundabout Northbound 55 58 58 58
Rudmore Roundabout Princess Royal Road Southbound 40 57 59 46
Princess Royal Road Mile End Roundabout Southbound 23 34 34 43
Mile End Roundabout Marketw ay Roundabout Southbound 49 57 56 58
Marketw ay Roundabout Cascade's Approach Southbound 49 51 47 46
Cascade's Approach Queen Street(SB) Southbound 86 91 93 89
Queen Street(SB) Anglesea Road Southbound 71 68 69 65
Anglesea RoadWinston Churchill
AvenueSouthbound 18 17 17 17
Winston Churchill
AvenueAnglesea Road Northbound 44 46 46 46
Anglesea Road Queen Street (NB) Northbound 54 54 54 54
Queen Street (NB) Cascade's Approach Northbound 57 57 57 56
Cascade's Approach Marketw ay Roundabout Northbound 29 29 29 29
Marketw ay Roundabout Mile End Roundabout Northbound 72 71 71 73
Mile End Roundabout Princess Royal Road Northbound 24 25 25 25
Princess Royal Road Rudmore Roundabout Northbound 44 56 56 57
Rudmore Roundabout Princess Royal Road Southbound 40 44 50 46
Princess Royal Road Mile End Roundabout Southbound 21 24 25 27
Mile End Roundabout Marketw ay Roundabout Southbound 39 46 49 47
Marketw ay Roundabout Cascade's Approach Southbound 43 47 47 46
Cascade's Approach Queen Street(SB) Southbound 72 78 82 80
Queen Street(SB) Anglesea Road Southbound 53 57 58 59
Anglesea RoadWinston Churchill
AvenueSouthbound 16 16 16 17
0900-1
000
Average Journey Times (secs) All Vehicles
0800-0
900
Description
0700-0
800

42
Portsmouth Corridor 1 Air Quality Management Area VISSIM Model Assessment
Network Performance
7.9. The 2013 AM peak existing conditions results for network performance have been compared to the 2013 DM, DS1 and DS2 results and are shown in Table 7.3.
Table 7.3 – 2013 AM Peak Network Performance Comparison
7.10. Table 7.3 is consistent with the other measures in that the existing conditions model operates better than the proposed scenarios.
7.11. Table 7.3 also provides information on the unmet demand (vehicles that cannot enter the network due to congestion) which is much higher in all three proposed scenarios. The extra unmet demand is located along Holbrook Road as a result of the congestion shown in Figure 7.1 caused by the reduction in green time for the Church Street approach.
PM Peak
Junction Performance
7.12. The 2013 PM peak existing conditions results for junction performance have been compared to the 2013 DM, DS1 and DS2 results in terms of average queue lengths (m) average delay (s) and LOS and are shown in Table 7.4 for each peak hour. The full output by turning movement for all measures and junctions in the network is detailed in Appendix G. The light blue shaded cells represent the optimum performer.
Measure Base DM DS1 DS2
Unmet Demand 219 647 615 615
Remaining Vehicles in Netw ork 590 691 696 691
Processed Vehicles 37912 38740 38784 38764
Total Distance Travelled (mi) 106680.0 110474.9 110574.9 110566.5
Total Travel Time (h) 2642.1 3100.6 3066.6 3082.1
Total Netw ork Delay (h) 943.6 1402.1 1366.8 1382.2
Average Travel Time (mins) 4.118 4.718 4.661 4.687
Average Delay Time (mins) 1.471 2.133 2.078 2.102
Total Stopped Delay (h) 467.28 630.35 629.72 630.21
Average Stopped Delay (s) 43.69 57.55 57.43 57.51
Number of Stops 76051.0 118680.4 115200.6 117913.1
Average Number of Stops 1.98 3.01 2.92 2.99
Average Netw ork Speed (mph) 25.1 22.2 22.5 22.3

43
Portsmouth Corridor 1 Air Quality Management Area VISSIM Model Assessment
Table 7.4 – 2013 PM Peak Junction Performance Comparison
7.13. Table 7.4 shows that of the proposed options, the DS1 scenario is predicted to be the optimum performer with improvements in delays at most junctions throughout the PM peak, however the delays are marginally higher than the base.
7.14. The Rudmore Roundabout operates better in all scenarios as a result of signalising the junction, although the Church Street Roundabout operates much worse throughout the PM peak, operating at capacity in the middle hour. As with the AM peak, the Church Street approach is predicted to operate well over capacity with significant delays as a result of the gating policy to reduce the green time in each of the proposed scenarios.
7.15. St Michael’s Gyratory is predicted to operate marginally worse with the junction operating at capacity in the middle peak hour.
7.16. The Holbrook Road roundabout is predicted to operate better with the proposed changes in DS1, although it still operates at and close to capacity in the first two hours respectively as a result of the delays along Lake Road (W), which have not changed due to current restraints as shown in Figure 7.2.
Node Description Base DM DS1 DS2 Base DM DS1 DS2 Base DM DS1 DS2
501 Rudmore Roundabout 24.8 6.4 6.4 6.1 18.9 15.3 14.8 14.5 C C B B
502 Mile End Roundabout 26.3 52.7 51.6 52.0 35.4 47.5 45.1 44.4 D D D D
503 Cascade's Approach 2.4 2.0 2.1 2.2 8.2 8.1 8.5 8.8 A A A A
504 Marketw ay Roundabout 7.7 7.7 5.7 6.4 22.9 23.7 20.0 21.4 C C C C
505 A2030 roundabout 2.9 3.7 2.6 2.4 15.4 16.6 13.4 14.5 C C B B
506 Holbrook Road Roundabout 46.0 45.3 33.9 44.0 46.6 49.3 43.5 47.5 E E E E
507 Unicorn Road 16.1 15.5 15.6 16.0 25.4 24.9 24.6 25.3 C C C C
508 Stanhope Road 0.2 0.3 0.3 0.3 5.5 5.5 5.5 5.6 A A A A
509 Queen Street 12.8 13.5 13.3 13.7 22.9 23.2 22.9 23.4 C C C C
510 St Michael's Gyratory 4.9 6.8 6.8 7.0 24.0 28.5 28.9 29.4 C D D D
511 Park Road 17.9 17.9 18.1 18.4 20.8 20.4 20.5 20.8 C C C C
512 Princess Royal Road 50.8 45.0 45.2 44.3 41.8 38.7 38.2 38.0 D D D D
15.8 15.1 13.7 14.8 25.3 26.2 25.2 25.5 D C C C
501 Rudmore Roundabout 35.6 8.6 8.2 8.8 28.6 17.4 15.1 17.0 D C C C
502 Mile End Roundabout 21.5 63.9 60.4 63.0 33.3 64.7 56.1 60.3 C E E E
503 Cascade's Approach 6.7 5.9 5.4 5.8 11.7 11.3 11.3 11.5 B B B B
504 Marketw ay Roundabout 11.1 11.0 9.4 9.4 26.4 25.9 24.2 24.5 D D C C
505 A2030 roundabout 7.6 6.1 4.1 4.2 27.2 23.0 18.0 18.5 D C C C
506 Holbrook Road Roundabout 47.6 45.2 29.6 42.4 51.1 55.3 46.7 51.7 F F E F
507 Unicorn Road 13.3 13.0 12.2 12.8 20.7 20.6 19.7 20.4 C C B C
508 Stanhope Road 0.3 0.3 0.2 0.3 4.8 4.9 4.9 4.9 A A A A
509 Queen Street 17.8 17.5 16.2 16.9 24.6 23.9 23.4 24.1 C C C C
510 St Michael's Gyratory 6.1 9.8 10.1 10.3 29.2 36.2 37.0 37.3 D E E E
511 Park Road 23.5 23.1 22.4 23.8 22.6 22.2 21.8 22.8 C C C C
512 Princess Royal Road 21.2 17.2 16.9 17.0 21.8 19.6 19.4 19.5 C B B B
17.8 17.1 14.9 16.6 26.2 28.4 25.9 27.5 D C C C
501 Rudmore Roundabout 10.4 8.6 8.5 7.8 16.1 16.4 16.1 15.4 C C C C
502 Mile End Roundabout 8.8 29.1 28.3 26.7 21.5 42.7 42.1 41.5 C D D D
503 Cascade's Approach 2.3 2.3 1.8 1.9 8.3 8.2 7.1 7.3 A A A A
504 Marketw ay Roundabout 2.6 2.3 2.0 2.2 14.7 14.9 13.9 14.1 B B B B
505 A2030 roundabout 0.3 0.3 0.3 0.3 3.6 3.7 3.5 4.0 A A A A
506 Holbrook Road Roundabout 7.9 7.3 3.0 7.1 15.8 18.5 14.5 17.2 C C B C
507 Unicorn Road 3.3 3.3 3.4 3.5 10.6 10.6 10.5 10.7 B B B B
508 Stanhope Road 0.1 0.1 0.1 0.1 3.8 3.8 3.9 3.9 A A A A
509 Queen Street 8.4 8.9 8.3 8.8 17.4 18.1 17.4 18.0 B B B B
510 St Michael's Gyratory 3.0 4.0 4.0 3.9 20.7 25.1 25.1 24.9 C D D C
511 Park Road 9.5 9.8 9.6 9.6 13.5 13.6 13.6 13.7 B B B B
512 Princess Royal Road 3.4 3.2 3.1 3.1 9.0 8.8 8.8 8.7 A A A A
5.1 6.5 5.9 6.1 14.7 18.3 17.6 17.6 B B B B
12.9 12.9 11.5 12.5 22.7 24.8 23.4 24.0 C C C C
Avg QL (m) Avg Delay (s) LOS
1800-1900 Network Total
1600-1900 Network Total
1700-1800 Network Total
1600-1700 Network Total

44
Portsmouth Corridor 1 Air Quality Management Area VISSIM Model Assessment
Figure 7.2 – Church Street Approach / Lake Road (W) Queuing (17:18)
Travel Times
7.17. The 2013 PM Peak existing conditions weighted travel times have been compared to the DM, DS1 and DS2 weighted travel times and are shown in Table 7.5. The cumulative graphs for each hour have been provided in Appendix G.

45
Portsmouth Corridor 1 Air Quality Management Area VISSIM Model Assessment
Table 7.5 – 2013 PM Peak Travel Time Comparison (s)
Time From To Direction Base DM DS1 DS2
Winston Churchill
AvenueAnglesea Road Northbound 48 48 49 49
Anglesea Road Queen Street (NB) Northbound 76 74 74 74
Queen Street (NB) Cascade's Approach Northbound 72 71 70 71
Cascade's Approach Marketw ay Roundabout Northbound 31 30 31 31
Marketw ay Roundabout Mile End Roundabout Northbound 67 72 73 72
Mile End Roundabout Princess Royal Road Northbound 39 38 39 38
Princess Royal Road Rudmore Roundabout Northbound 62 62 63 61
Rudmore Roundabout Princess Royal Road Southbound 41 47 42 42
Princess Royal Road Mile End Roundabout Southbound 24 23 21 24
Mile End Roundabout Marketw ay Roundabout Southbound 48 52 46 47
Marketw ay Roundabout Cascade's Approach Southbound 41 41 42 43
Cascade's Approach Queen Street(SB) Southbound 73 71 70 72
Queen Street(SB) Anglesea Road Southbound 58 60 60 61
Anglesea RoadWinston Churchill
AvenueSouthbound 17 16 17 17
Winston Churchill
AvenueAnglesea Road Northbound 52 55 56 56
Anglesea Road Queen Street (NB) Northbound 74 73 72 73
Queen Street (NB) Cascade's Approach Northbound 58 58 58 58
Cascade's Approach Marketw ay Roundabout Northbound 30 31 32 31
Marketw ay Roundabout Mile End Roundabout Northbound 78 84 84 83
Mile End Roundabout Princess Royal Road Northbound 34 31 33 31
Princess Royal Road Rudmore Roundabout Northbound 89 63 66 63
Rudmore Roundabout Princess Royal Road Southbound 41 48 42 43
Princess Royal Road Mile End Roundabout Southbound 26 25 21 27
Mile End Roundabout Marketw ay Roundabout Southbound 52 54 49 50
Marketw ay Roundabout Cascade's Approach Southbound 47 47 48 48
Cascade's Approach Queen Street(SB) Southbound 78 75 73 75
Queen Street(SB) Anglesea Road Southbound 65 65 65 67
Anglesea RoadWinston Churchill
AvenueSouthbound 19 20 20 20
Winston Churchill
AvenueAnglesea Road Northbound 46 47 46 46
Anglesea Road Queen Street (NB) Northbound 55 55 55 55
Queen Street (NB) Cascade's Approach Northbound 49 50 48 50
Cascade's Approach Marketw ay Roundabout Northbound 27 28 26 27
Marketw ay Roundabout Mile End Roundabout Northbound 57 63 63 64
Mile End Roundabout Princess Royal Road Northbound 25 25 25 25
Princess Royal Road Rudmore Roundabout Northbound 47 54 55 55
Rudmore Roundabout Princess Royal Road Southbound 40 41 41 40
Princess Royal Road Mile End Roundabout Southbound 21 19 19 21
Mile End Roundabout Marketw ay Roundabout Southbound 39 41 40 40
Marketw ay Roundabout Cascade's Approach Southbound 40 40 37 38
Cascade's Approach Queen Street(SB) Southbound 60 60 59 60
Queen Street(SB) Anglesea Road Southbound 50 52 52 52
Anglesea RoadWinston Churchill
AvenueSouthbound 16 17 17 17
Average Journey Times (secs) All Vehicles
1700-1
800
Description
1600-1
700
1800-1
900
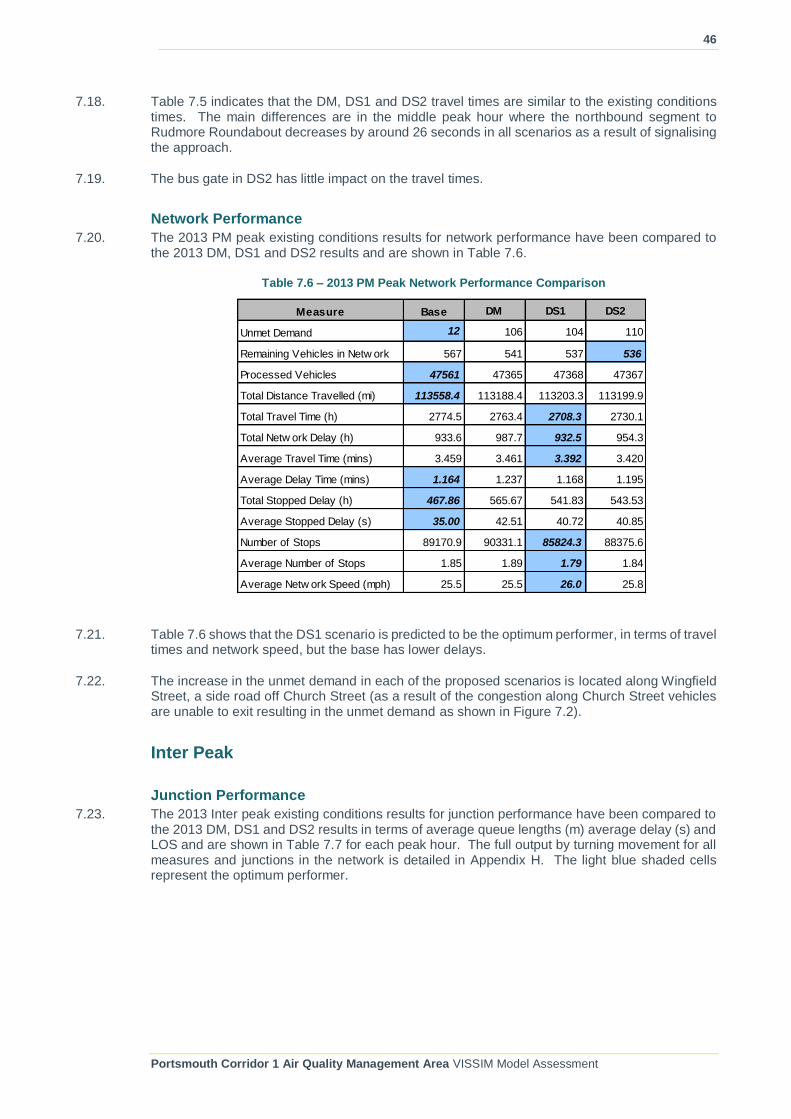
46
Portsmouth Corridor 1 Air Quality Management Area VISSIM Model Assessment
7.18. Table 7.5 indicates that the DM, DS1 and DS2 travel times are similar to the existing conditions times. The main differences are in the middle peak hour where the northbound segment to Rudmore Roundabout decreases by around 26 seconds in all scenarios as a result of signalising the approach.
7.19. The bus gate in DS2 has little impact on the travel times.
Network Performance
7.20. The 2013 PM peak existing conditions results for network performance have been compared to the 2013 DM, DS1 and DS2 results and are shown in Table 7.6.
Table 7.6 – 2013 PM Peak Network Performance Comparison
7.21. Table 7.6 shows that the DS1 scenario is predicted to be the optimum performer, in terms of travel times and network speed, but the base has lower delays.
7.22. The increase in the unmet demand in each of the proposed scenarios is located along Wingfield Street, a side road off Church Street (as a result of the congestion along Church Street vehicles are unable to exit resulting in the unmet demand as shown in Figure 7.2).
Inter Peak
Junction Performance
7.23. The 2013 Inter peak existing conditions results for junction performance have been compared to the 2013 DM, DS1 and DS2 results in terms of average queue lengths (m) average delay (s) and LOS and are shown in Table 7.7 for each peak hour. The full output by turning movement for all measures and junctions in the network is detailed in Appendix H. The light blue shaded cells represent the optimum performer.
Measure Base DM DS1 DS2
Unmet Demand 12 106 104 110
Remaining Vehicles in Netw ork 567 541 537 536
Processed Vehicles 47561 47365 47368 47367
Total Distance Travelled (mi) 113558.4 113188.4 113203.3 113199.9
Total Travel Time (h) 2774.5 2763.4 2708.3 2730.1
Total Netw ork Delay (h) 933.6 987.7 932.5 954.3
Average Travel Time (mins) 3.459 3.461 3.392 3.420
Average Delay Time (mins) 1.164 1.237 1.168 1.195
Total Stopped Delay (h) 467.86 565.67 541.83 543.53
Average Stopped Delay (s) 35.00 42.51 40.72 40.85
Number of Stops 89170.9 90331.1 85824.3 88375.6
Average Number of Stops 1.85 1.89 1.79 1.84
Average Netw ork Speed (mph) 25.5 25.5 26.0 25.8

47
Portsmouth Corridor 1 Air Quality Management Area VISSIM Model Assessment
Table 7.7 – 2013 Inter Peak Junction Performance Comparison
7.24. Table 7.7 shows that overall the proposed scenarios are predicted to operate marginally worse than the base, although the differences in overall delays are nominal and the network is still predicted to operate well within capacity.
7.25. At the Rudmore Roundabout, delays increase significantly at the A3 and Wharf Road approaches in each of the proposed scenarios, causing them to operate close to or over capacity throughout the Inter Peak period (see Appendix H for the full turning movement comparison).
7.26. The Holbrook Road roundabout performs better with the changes made in the DS1 scenario, with delays almost halved in the last hour.
7.27. The remainder of the junctions show little change in operation due to the lower traffic flows than in the AM and PM peaks.
Travel Times
7.28. The 2013 Inter peak existing conditions weighted travel times have been compared to the DM, DS1 and DS2 weighted travel times and are shown in Table 7.8. The cumulative graphs for each hour have been provided in Appendix H.
Node Description Base DM DS1 DS2 Base DM DS1 DS2 Base DM DS1 DS2
501 Rudmore Roundabout 2.9 4.2 4.2 3.9 7.7 13.1 13.1 12.9 A B B B
502 Mile End Roundabout 5.0 5.5 5.4 5.6 16.8 16.9 16.8 17.2 B B B B
503 Cascade's Approach 4.1 4.8 4.5 5.5 9.4 10.0 10.2 10.9 A A B B
504 Marketw ay Roundabout 2.7 3.5 3.3 3.6 13.8 15.1 15.4 16.0 B C C C
505 A2030 roundabout 1.1 2.1 1.3 2.0 5.0 7.5 5.5 7.3 A A A A
506 Holbrook Road Roundabout 5.1 5.1 0.7 5.0 13.6 13.7 10.4 13.5 B B B B
507 Unicorn Road 18.5 18.8 18.9 18.4 31.3 31.1 31.2 31.1 C C C C
508 Stanhope Road 0.2 0.2 0.1 0.2 5.4 5.3 5.4 5.3 A A A A
509 Queen Street 8.1 7.8 7.6 7.8 19.3 18.5 18.3 18.7 B B B B
510 St Michael's Gyratory 2.4 2.9 2.9 2.9 20.1 23.3 23.4 23.3 C C C C
511 Park Road 7.5 7.1 7.2 7.2 13.1 12.5 12.6 12.6 B B B B
512 Princess Royal Road 3.7 3.4 3.4 3.4 9.3 9.1 9.2 9.0 A A A A
4.3 4.8 4.3 4.8 14.6 15.9 15.7 16.1 B B B B
501 Rudmore Roundabout 2.4 3.4 3.4 3.3 7.4 12.4 12.4 12.3 A B B B
502 Mile End Roundabout 4.7 5.2 5.2 5.5 16.9 17.2 16.9 17.3 B B B B
503 Cascade's Approach 0.7 0.7 0.8 0.8 6.1 6.3 6.9 7.1 A A A A
504 Marketw ay Roundabout 1.6 1.7 1.8 1.8 11.9 12.7 13.0 13.1 B B B B
505 A2030 roundabout 0.9 1.0 1.0 0.9 3.9 3.9 4.1 3.8 A A A A
506 Holbrook Road Roundabout 17.4 16.8 1.6 16.1 24.2 23.4 12.4 23.0 C C B C
507 Unicorn Road 8.8 8.5 8.8 8.9 21.5 21.0 21.7 21.8 C C C C
508 Stanhope Road 0.1 0.1 0.1 0.1 5.3 5.3 5.2 5.2 A A A A
509 Queen Street 7.3 7.4 7.2 7.4 17.9 18.0 18.0 18.3 B B B B
510 St Michael's Gyratory 3.0 3.4 3.3 3.3 20.8 23.6 23.7 23.6 C C C C
511 Park Road 7.9 7.8 7.7 7.6 13.5 13.1 13.0 13.0 B B B B
512 Princess Royal Road 3.5 3.4 3.3 3.3 9.0 8.7 8.8 8.8 A A A A
4.5 4.7 3.3 4.7 13.5 14.6 14.0 14.8 B B B B
4.4 4.7 3.8 4.7 14.1 15.3 14.9 15.4 B B B B
Avg QL (m) Avg Delay (s) LOS
1200-1400 Network Total
1200-1300 Network Total
1300-1400 Network Total

48
Portsmouth Corridor 1 Air Quality Management Area VISSIM Model Assessment
Table 7.8 – 2013 Inter Peak Travel Time Comparison (s)
7.29. Table 7.8 indicates that the proposed travel times are similar to the existing conditions times.
7.30. The bus gate in DS2 has little impact in travel times with only marginal increases predicted in the first hour.
Network Performance
7.31. The 2013 Inter peak existing conditions results for network performance have been compared to the 2013 DM, DS1 and DS2 results and are shown in Table 7.9.
Loc From To Direction Base DM DS1 DS2
Winston Churchill
AvenueAnglesea Road Northbound 46 44 43 44
Anglesea Road Queen Street (NB) Northbound 68 67 67 67
Queen Street (NB) Cascade's Approach Northbound 67 63 63 65
Cascade's Approach Marketw ay Roundabout Northbound 31 31 32 32
Marketw ay Roundabout Mile End Roundabout Northbound 66 65 65 66
Mile End Roundabout Princess Royal Road Northbound 24 25 24 24
Princess Royal Road Rudmore Roundabout Northbound 45 52 52 52
Rudmore Roundabout Princess Royal Road Southbound 40 41 41 41
Princess Royal Road Mile End Roundabout Southbound 16 16 16 17
Mile End Roundabout Marketw ay Roundabout Southbound 37 38 38 38
Marketw ay Roundabout Cascade's Approach Southbound 44 45 46 48
Cascade's Approach Queen Street(SB) Southbound 72 73 72 73
Queen Street(SB) Anglesea Road Southbound 48 49 49 49
Anglesea RoadWinston Churchill
AvenueSouthbound 16 16 16 16
Winston Churchill
AvenueAnglesea Road Northbound 46 44 44 45
Anglesea Road Queen Street (NB) Northbound 69 68 68 68
Queen Street (NB) Cascade's Approach Northbound 65 64 65 67
Cascade's Approach Marketw ay Roundabout Northbound 31 31 33 32
Marketw ay Roundabout Mile End Roundabout Northbound 66 68 65 66
Mile End Roundabout Princess Royal Road Northbound 25 25 24 25
Princess Royal Road Rudmore Roundabout Northbound 44 52 52 52
Rudmore Roundabout Princess Royal Road Southbound 40 40 40 40
Princess Royal Road Mile End Roundabout Southbound 16 16 16 16
Mile End Roundabout Marketw ay Roundabout Southbound 36 37 37 37
Marketw ay Roundabout Cascade's Approach Southbound 37 37 39 39
Cascade's Approach Queen Street(SB) Southbound 60 60 61 61
Queen Street(SB) Anglesea Road Southbound 46 49 49 49
Anglesea RoadWinston Churchill
AvenueSouthbound 16 16 17 17
Description
1200-1
300
1300-1
400
Average Journey Times (secs) All Vehicles

49
Portsmouth Corridor 1 Air Quality Management Area VISSIM Model Assessment
Table 7.9 – 2013 Inter Peak Network Performance Comparison
7.32. Table 7.9 shows that the DS1 scenario is the optimum performer in terms of travel times and network speed, but there are lower delays in the base as a result of fewer signalised junctions. Overall the differences between the results are very marginal.
Measure Base DM DS1 DS2
Unmet Demand 0 0 0 0
Remaining Vehicles in Netw ork 632 615 613 613
Processed Vehicles 31727 31684 31683 31684
Total Distance Travelled (mi) 50468.7 50455.7 50459.3 50464.0
Total Travel Time (h) 1218.6 1212.2 1197.0 1206.0
Total Netw ork Delay (h) 349.3 368.5 353.5 362.3
Average Travel Time (mins) 2.259 2.252 2.224 2.241
Average Delay Time (mins) 0.648 0.685 0.657 0.673
Total Stopped Delay (h) 198.92 219.78 211.34 212.32
Average Stopped Delay (s) 22.13 24.50 23.56 23.67
Number of Stops 38191.1 41236.9 40261.6 40860.1
Average Number of Stops 1.18 1.28 1.25 1.27
Average Netw ork Speed (mph) 25.7 25.9 26.2 26.0

50
Portsmouth Corridor 1 Air Quality Management Area VISSIM Model Assessment
8. Summary and Conclusions
8.1. Atkins has been commissioned by Portsmouth City Council (PCC) to develop five existing conditions micro-simulation models to assess various improvement schemes along key routes within Portsmouth City Centre and surrounding network, with a view to improving air quality within each of the study areas.
8.2. This report details the calibration and validation and subsequent results of the Corridor 1 existing conditions models.
8.3. Corridor 1 is located within the area of Portsmouth City Centre, situated to the north of the M27 and Portsmouth City Centre. This Study area includes three major roundabouts, one gyratory and four major signalised junctions
8.4. A data collection programme was commissioned and undertaken on Tuesday 1st October 2013 and included manual classified turning movement surveys, pedestrian counts, queue length surveys and journey times using the moving observer method.
8.5. As VISSIM is a stochastic model, the results differ slightly depending on the random seed assigned to each simulation run. Therefore, in order to obtain statistically significant results, the models were simulated 16 times with different random seeds.
8.6. The models have been constructed to represent the morning peak period from 07:00 to 10:00, an Inter peak period from 12:00 to 14:00 and an evening peak period from 16:00 to 19:00 with a 30 minute seed period prior to each peak to populate the network before analysis is undertaken.
8.7. All peaks have been validated very well in terms of flow throughput, with the AM peak achieving 99% GEH and the PM and Inter achieving 100% GEH.
8.8. The network operates within capacity with an overall LOS of D in the AM peak, C in the PM peak and B in the Inter peak. In the AM peak, the Holbrook Road / Lake Road roundabout operates over capacity and the Church Street Roundabout operates at capacity during the last two hours. In the PM peak the Holbrook Road roundabout operates at capacity in the first two hours. The Inter peak shows no capacity issues, although several individual turning movements are operating at capacity.
8.9. The AM peak modelled travel times have been validated with 74% of modelled travel times within the lower and upper ranges, however, the cumulative travel times validate to 95%. Travel times for the PM peak validate with 93% of modelled times within the upper and lower ranges, and 100% for cumulative times. In the Inter peak, 89% of modelled travel times validate to the observed times, along with 79% of cumulative times. This is due to the fact that during the survey day, traffic management was in place along Commercial Road and at the Church Street Roundabout, which closed lanes and thus reducing capacity around this junction.
8.10. The queue lengths throughout all peaks have not been validated particularly well to the observed queues, with much lower modelled average queues and much higher maximum queues. However, comparisons between the videos and VISSIM show similar queues and therefore, the queue lengths have been deemed to be validated to acceptable levels and more importantly, the travel times in the model match well to the observed journey times.
8.11. The VISSIM models are now deemed to have been calibrated and validated to within acceptable levels and are therefore, fit for purpose and can be used as an evaluation tool for potential improvement schemes within the study area to improve air quality.
8.12. The Do Minimum (DM) scenario comprises of the following changes to the network, which have either already been implemented on site, or are due to be implemented shortly:
Signalisation of the Rudmore Roundabout, bus lane and bus gate along the SB off-slip and alterations to lane allocations;

51
Portsmouth Corridor 1 Air Quality Management Area VISSIM Model Assessment
The merge from Rudmore Roundabout SB on slip with the M275 flyover traffic has been altered so that the slip road traffic merges with the nearside lane of the flyover, resulting in a lane drop;
Extending the existing bus lane along Mile End Road southbound through the Church Street Roundabout, Commercial Road and Marketway Roundabout to join up with the current bus lane along Marketway, with lane alterations and signal time changes at the Church Street Roundabout; and,
Signalising Anglesea Road approach and opposing circulatory to allow pedestrian facilities, and altering the Cambridge Road triple crossings to run in isolation at St Michael’s Gyratory.
8.13. A second option (DS1) has been assessed which utilises the DM model layout with alterations made to the Holbrook Road / Lake Road roundabout. Two flares have been introduced on the Church Street and Lake Road (E) approaches for left turning traffic only to provide more capacity for the ahead and right turning traffic.
8.14. The third proposal (DS2) incorporates a bus gate upstream of the Mile End Road approach signals to allow buses clear access to merge with the nearside lane. It also retains the existing 3 lanes from the Rudmore on slip and shortens the right turn flare.
8.15. Traffic management was in place at the Rudmore Roundabout throughout all peaks, with lane closures and speed restrictions in force. An earlier traffic count was undertaken at the Rudmore Roundabout in March 2013 and a comparison of the traffic flows showed little difference in the PM and Inter peaks, however, the AM peak comparison showed some significant differences on the M275 southbound off-slip and the London Road approaches where the March flows are much larger than the October flows.
8.16. Given the large discrepancy in the AM peak flows the proposed scenarios have utilised revised flows in the AM peak. The March 2013 traffic flows have been used directly at the Rudmore roundabout and Church Street roundabout and then the resulting differences downstream have been balanced through in the proportion of the existing October 2013 turning movement.
8.17. The AM peak comparison results indicate that all three proposed scenarios result in capacity problems around the Church Street Roundabout and Holbrook Road roundabout as a result of the gating strategy and the reduction in green time that the Church Street approach receives. The queues along Church Street extend back to the Holbrook roundabout blocking entry from Holbrook Road. The congestion along Holbrook Road results in a high unmet demand.
8.18. As a result of the congestion from Church Street, the Holbrook Road roundabout is predicted to operate over capacity in all scenarios throughout the AM peak, although some benefits are evident in the DS1 scenario as a result of the proposed changes to two approaches.
8.19. The PM comparison results predict that the Rudmore Roundabout would operate better by introducing the signals and the changes to the SB off-slip, resulting in fewer delays. Northbound travel times to the Rudmore Roundabout decrease by almost 30 seconds in the middle peak hour.
8.20. The Holbrook roundabout performs better in the DS1 scenario, although it is still predicted to operate at capacity in the first two hours with the Lake Road (W) arm over capacity, as no changes can be made due to highway restrictions. As in the AM peak, the Church Street approach is also congested with the queue extending back to this junction.
8.21. Due to the improvements at the Holbrook Road roundabout, the DS1 scenario is predicted to be the optimum performer in terms, travel times and network speed, although the differences in the results are marginal.
8.22. The Inter peak results show that overall, the DS1 performs better in terms of travel times and network speed, but that the base has lower delays. At the Rudmore Roundabout, the A3 and Wharf Road approaches operate close to or over capacity as a result of introducing the traffic signals.
8.23. The Holbrook Road roundabout performs much better in the DS1 scenario with delays almost halved in the last hour.

52
Portsmouth Corridor 1 Air Quality Management Area VISSIM Model Assessment
8.24. Therefore, it is recommended that the improvements to the Holbrook Road / Lake Road roundabout should be taken forward as the preferred scheme once the DM network changes have been concluded and that amendments to the Church Street Roundabout signals be reviewed due to the congestion observed along Church Street as a result of reducing the green time in the AM and PM peaks.

51
Portsmouth Corridor 1 Air Quality Management Area VISSIM Model Assessment
A. 2013 Balanced Traffic Flows

2098 2317 991 3621
M27 M275
2098 2317 991 3621
119
2680 941
A
948 2141
3 479 59 303 97
A E D C B
B 262
A3 738
B 12
163 A A 347
14 B E 54
8 C D 291
2 E C 34
29 D
216 E Rudmore Roundabout
759 Wharf Road 118
344
22
5
C 346
A2047(Kingston cresent) 458
C 0 410
E A B C D B 11 11
178 80 128 26 14 A 360 32 2
E 46
D D 41
Car Park
34 33
426 2141 2680 434
1 986 2127
116
116
1125 Princess Royal Road 117
139 2450
1422 111 0 1498 518
16
9 42
495
52
113 Church Street Roundabout 112 Wingfield St 95
0
660 63
0 32
507 3 1 6
603 10
Hope St
13
13
28 14 Fitzherbert St 114
28
10 Flathouse Road 11614 498
10 1419
Church Street8 4 0 3
Commercial Road (N)
Clarence St Andrew Bell St
6
1429 44 61 1321 0 132 64 0 4 456 67
80 8 52 98
4 91 95 0 152 0
6 2 38
115 Marketway Roundabout 258
Marketway 107 108 109 Cornmill St 110 111 Lake Road B2152 373
11 1441 0 1
1377 30 461 539 58
67 140 11 194
14 0 62 16 0 120
3 8 0 8 7 6 0 352 549 126 1
Cascade's Approach
Landport View
Lake Road
Commercial Road (S)11 71
2013 AM Peak Total Vehicles
(07:00-08:00)
11 71
Holbrook Road225 971 190 14 30 78 49
33
17
31
81
507.8333 Unicorn Road 104
100 Unicorn Road83 21 0
14
200 1386 0 1028 675
240 776 0 1 1 6 173 27
316 20
34 13
0 0
350
332 Queen Street 103 Bishop Crispian Way 105
46 0
24
46 1270 0 14 171 1 0 26
1
133 643
73
0
73
154 Park Road 102 9 20 19
17
170
21 1243 19
106 Stanhope Road 14
14
177 20
A 84 0 Edinburgh Road
50 62 68 1 0 29 258 172 2 1
A B C D E F G H I J
1264 197 189.8333
B
Anglesea Rd
Guildhall Walk
164
A 119 C Winston Churchill Avenue 311
B 4
C 9
D 30
E 0
F 6
G 43
H 95
I 4
J 1
5 31
A 2 Arm J 6 A 0 D Waltham Street 0
B 3 B 0
C 0 C 0
1 A D 0 D 0
0 B E 0 E 0
0 C F 0 F 0
0 D G 0 G 0
0 E H 1 St Michael's Gyratory H 0
0 F I 0 101 I 0
0 G J 0 J 0
0 H
0 I
0 J 0
1019 1 A 105 E St Paul's Road 105
15 Car Park I B 0
C 0
D 0
E 0
F 0
G 0
H 0
I 0
J 0
35
F Wiltshire St 0
A B C D E F G H I J A B C D E F G H I J
393 6 53 0 0 0 0 0 9 2 594 9 34 0 0 0 1 5 0 1
H
G
Cambridge Road
Hampshire Terrace
463 273 644 302

2090 2465 1142 4010
M27 M275
2090 2465 1142 4010
119
2912 1098
A
890 2342
12 305 203 468 110
A E D C B
B 352
A3 661
B 5
90 A A 259
20 B E 37
19 C D 314
5 E C 46
40 D
E Rudmore Roundabout
Wharf Road 118
533
54
6
C 542
A2047(Kingston cresent) 594
C 1 560
E A B C D B 45 24
123 86 172 59 17 A 450 15 9
E 44
D D 54
Car Park
24 78
457 2342 2912 628
4 411 3125
117
Princess Royal Road 117
76 2678
1732 83 0 2458 584
22
10 74
534
87
113 Church Street Roundabout 112 Wingfield St 93
0
661 58
0 35
361 2 1 13
616 13
Hope St
16
56 Fitzherbert St 114
Flathouse Road 11630 348
19 1708
Church Street13 4 0 4
Commercial Road (N)
Clarence St Andrew Bell St
11
1727 43 38 2080 0 364 112 0 9 470 90
107 13 86 293
13 121 125 0 362 1
8 0 94
115 Marketway Roundabout 416
Marketway 107 108 109 Cornmill St 110 111 Lake Road B2152 520
23 2168 0 4
2036 48 322 368 74
127 123 38 217
18 0 77 55 2 225
11 4 0 13 13 6 0 179 544 210 0
Cascade's Approach
Landport View
Lake Road
Commercial Road (S)15 140
Holbrook Road74 1645 336 18 48 134 132
52
11
31
Unicorn Road 104
155 Unicorn Road32 32 0
16
87 1648 0 933 988
413 1279 0 1 0 30 278 39
390 29
45 15
0 0
Queen Street 103 Bishop Crispian Way 105
85 0
30
17 1345 0 22 172 4 3 33
4
263 1016
136
0
Park Road 102 15 24 33
23
277
58 1226 33
106 Stanhope Road 21
21
186 23
2013 AM Peak Total Vehicles
(08:00-09:00)
A 138 0 Edinburgh Road
84 93 114 1 0 49 390 279 1 5
A B C D E F G H I J
1284 209 300.8667
B
Anglesea Rd
Guildhall Walk
313
A 124 C Winston Churchill Avenue 516
B 11
C 24
D 48
E 0
F 5
G 121
H 175
I 2
J 6
16 49
A 4 Arm J 13 A 0 D Waltham Street 0
B 2 B 0
C 4 C 0
5 A D 0 D 0
0 B E 0 E 0
2 C F 0 F 0
0 D G 0 G 0
0 E H 2 St Michael's Gyratory H 0
0 F I 1 101 I 0
0 G J 0 J 0
1 H
0 I
0 J 0
8 A 184 E St Paul's Road 184
10 Car Park I B 0
C 0
D 0
E 0
F 0
G 0
H 0
I 0
J 0
60
F Wiltshire St 0
A B C D E F G H I J A B C D E F G H I J
546 17 133 0 0 4 3 3 4 2 337 15 36 0 0 2 1 14 2 3
H
G
Cambridge Road
Hampshire Terrace
712 474 410 515

1159 1596 638 2536
M27 M275
1159 1596 638 2536
119
1958 578
A
635 1162
17 117 65 300 79
A E D C B
B 424
A3 773
B 23
59 A A 125
28 B E 24
11 C D 470
4 E C 131
57 D
E Rudmore Roundabout
Wharf Road 118
455
37
4
C 463
A2047(Kingston cresent) 542
C 0 509
E A B C D B 85 33
87 90 209 54 32 A 349 24 8
E 32
D D 76
Car Park
32 70
472 1162 1958 700
1 208 2449
133
Princess Royal Road 117
98 1500
1008 101 0 1835 513
22
21 63
476
83
113 Church Street Roundabout 112 Wingfield St 79
0
391 40
0 39
199 4 4 22
373 20
Hope St
36
95 Fitzherbert St 114
Flathouse Road 11681 171
35 956
Church Street17 6 0 6
Commercial Road (N)
Clarence St Andrew Bell St
9
991 71 54 1560 0 268 155 1 13 421 80
117 17 101 223
34 167 173 0 297 0
19 7 80
115 Marketway Roundabout 415
Marketway 107 108 109 Cornmill St 110 111 Lake Road B2152 416
46 1633 0 2
1498 104 174 246 57
136 157 46 198
47 0 85 90 0 159
15 21 0 13 7 8 1 81 327 178 1
Cascade's Approach
Landport View
Lake Road
Commercial Road (S)36 170
2013 AM Peak Total Vehicles
(09:00-10:00)
36 170
Holbrook Road46 1155 331 47 104 175 126
50
18
25
Unicorn Road 104
134 Unicorn Road18 29 1
22
61 977 0 587 804
314 888 0 3 3 14 291 41
227 28
44 14
0 0
Queen Street 103 Bishop Crispian Way 105
73 1
33
37 811 0 25 135 5 1 34
7
136 752
132
0
Park Road 102 15 24 36
22
291
54 716 36
106 Stanhope Road 29
29
151 24
A 146 0 Edinburgh Road
48 77 118 0 0 42 316 136 1 14
A B C D E F G H I J
770 175 314.6667
B
Anglesea Rd
Guildhall Walk
329
A 82 C Winston Churchill Avenue 392
B 18
C 14
D 15
E 0
F 7
G 104
H 146
I 3
J 3
24 16
A 4 Arm J 14 A 0 D Waltham Street 0
B 2 B 0
C 4 C 0
4 A D 0 D 0
3 B E 0 E 0
3 C F 0 F 0
0 D G 2 G 0
0 E H 2 St Michael's Gyratory H 0
0 F I 0 101 I 0
1 G J 0 J 0
0 H
0 I
0 J 0
11 A 43 E St Paul's Road 43
16 Car Park I B 0
C 0
D 0
E 0
F 0
G 0
H 0
I 0
J 0
60
F Wiltshire St 0
A B C D E F G H I J A B C D E F G H I J
255 21 117 0 0 8 7 0 11 4 334 25 73 1 0 3 3 10 1 3
H
G
Cambridge Road
Hampshire Terrace
423 294 453 433

2688 2000 1640 2816
M27 M275
2688 2000 1640 2816
119
1979 837
A
1030 3298
28 109 49 401 250
A E D C B
B 959
A3 647
B 7
326 A A 122
46 B E 14
52 C D 372
0 E C 132
110 D
534 E Rudmore Roundabout
202 Wharf Road 118
688
34
11
C 707
A2047(Kingston cresent) 642
C 0 593
E A B C D B 130 24
77 126 526 148 0 A 433 41 19
E 2
D D 77
Car Park
60 58
877 3298 1979 608
0 83 2504
1067
1067
163 Princess Royal Road 117
80 3108
2086 65 0 1821 618
56
47 228
466
242
113 Church Street Roundabout 112 Wingfield St 89
0
508 48
0 41
529 20 8 15
475 14
Hope St
62
62
176 52 Fitzherbert St 114
176
45 Flathouse Road 11652 495
45 2013
Church Street10 6 0 6
Commercial Road (N)
Clarence St Andrew Bell St
10
2058 211 22 1460 8 409 258 0 15 421 71
177 10 116 310
36 320 326 0 473 0
16 5 58
115 Marketway Roundabout 670
Marketway 107 108 109 Cornmill St 110 111 Lake Road B2152 412
52 1610 0 0
1573 49 306 301 73
51 180 25 176
66 0 185 105 1 163
45 101 0 14 8 6 0 135 406 341 0
Cascade's Approach
Landport View
Lake Road
Commercial Road (S)146 87
Holbrook Road25 1334 275 66 49 291 83
296
110
96
502
67.33333 Unicorn Road 104
198 Unicorn Road14 28 8
21
28 1793 0 882 894
322 1129 0 5 5 4 334 42
473 32
53 16
0 0
526
405 Queen Street 103 Bishop Crispian Way 105
67 0
38
16 1348 0 19 185 3 6 44
14
130 999
271
0
271
166 Park Road 102 13 26 38
21
349
36 1093 38
106 Stanhope Road 52
52
200 23
2013 PM Peak Total Vehicles
(16:00-17:00)
A 62 0 Edinburgh Road
89 25 118 0 0 26 546 192 1 2
A B C D E F G H I J
1129 223 375
B
Anglesea Rd
Guildhall Walk
368
A 168 C Winston Churchill Avenue 446
B 13
C 21
D 4
E 0
F 4
G 81
H 155
I 0
J 0
2 5
A 4 Arm J 7 A 0 D Waltham Street 0
B 0 B 0
C 0 C 0
13 A D 1 D 0
0 B E 0 E 0
5 C F 0 F 0
0 D G 0 G 0
0 E H 2 St Michael's Gyratory H 0
0 F I 0 101 I 0
2 G J 0 J 0
0 H
0 I
0 J 0
20 A 105 E St Paul's Road 105
2 Car Park I B 0
C 0
D 0
E 0
F 0
G 0
H 0
I 0
J 0
33
F Wiltshire St 0
A B C D E F G H I J A B C D E F G H I J
427 12 170 0 0 3 4 1 0 0 323 12 54 0 0 0 2 18 1 0
H
G
Cambridge Road
Hampshire Terrace
617 368 410 635

2128 2782 1557 3302
M27 M275
2128 2782 1557 3302
119
2374 928
A
1037 2648
23 90 39 476 300
A E D C B
B 1019
A3 738
B 9
244 A A 199
46 B E 11
37 C D 387
0 E C 132
74 D
401 E Rudmore Roundabout
152 Wharf Road 118
726
32
8
C 740
A2047(Kingston cresent) 723
C 0 678
E A B C D B 181 17
44 109 483 121 0 A 470 41 14
E 7
D D 65
Car Park
55 49
757 2648 2374 565
3 89 2848
598
598
163 Princess Royal Road 117
74 2804
1848 56 0 2119 672
63
54 307
447
322
113 Church Street Roundabout 112 Wingfield St 100
0
464 65
0 35
510 19 12 21
420 15
Hope St
64
64
170 54 Fitzherbert St 114
170
48 Flathouse Road 11654 477
48 1795
Church Street13 4 0 4
Commercial Road (N)
Clarence St Andrew Bell St
12
1843 207 3 1789 12 414 217 0 13 386 83
137 13 124 377
13 330 334 0 501 1
11 7 46
115 Marketway Roundabout 629
Marketway 107 108 109 Cornmill St 110 111 Lake Road B2152 425
82 1945 0 2
1929 35 311 258 77
15 163 18 143
81 0 216 105 0 203
40 124 0 21 10 9 0 119 346 327 1
Cascade's Approach
Landport View
Lake Road
Commercial Road (S)164 28
Holbrook Road28 1602 350 81 35 321 64
84
56
91
231
64 Unicorn Road 104
203 Unicorn Road16 40 12
22
20 1717 0 793 967
372 1343 0 10 1 6 357 42
436 31
61 20
0 0
497
440 Queen Street 103 Bishop Crispian Way 105
53 0
31
15 1301 0 16 199 3 1 31
19
162 1181
226
0
226
207 Park Road 102 13 23 39
20
377
45 1090 39
106 Stanhope Road 40
40
206 21
2013 PM Peak Total Vehicles
(17:00-18:00)
A 72 0 Edinburgh Road
119 17 88 0 1 55 726 172 3 0
A B C D E F G H I J
1135 227 400
B
Anglesea Rd
Guildhall Walk
281
A 168 C Winston Churchill Avenue 471
B 23
C 8
D 7
E 0
F 4
G 97
H 163
I 1
J 0
0 7
A 3 Arm J 6 A 0 D Waltham Street 0
B 0 B 0
C 0 C 0
17 A D 0 D 0
0 B E 0 E 0
2 C F 0 F 0
0 D G 3 G 0
0 E H 0 St Michael's Gyratory H 0
1 F I 0 101 I 0
3 G J 0 J 0
0 H
0 I
0 J 1
23 A 143 E St Paul's Road 143
9 Car Park I B 0
C 0
D 0
E 0
F 0
G 0
H 0
I 0
J 0
61
F Wiltshire St 0
A B C D E F G H I J A B C D E F G H I J
379 25 131 0 0 1 4 2 4 0 306 7 52 0 0 0 1 14 1 0
H
G
Cambridge Road
Hampshire Terrace
546 351 381 834

1278 2129 816 2882
M27 M275
1278 2129 816 2882
119
1974 908
A
662 1432
11 148 47 442 260
A E D C B
B 732
A3 653
B 0
119 A A 163
19 B E 4
29 C D 368
2 E C 118
61 D
230 E Rudmore Roundabout
217 Wharf Road 118
656
24
4
C 690
A2047(Kingston cresent) 561
C 0 499
E A B C D B 142 18
38 59 311 95 5 A 313 56 34
E 25
D D 81
Car Park
90 42
508 1432 1974 562
0 64 2472
215
215
139 Princess Royal Road 117
75 1725
1159 49 0 1881 542
59
76 257
365
281
113 Church Street Roundabout 112 Wingfield St 68
0
356 48
0 20
236 21 19 20
328 24
Hope St
47
47
208 46 Fitzherbert St 114
208
41 Flathouse Road 11646 229
41 1086
Church Street12 4 0 4
Commercial Road (N)
Clarence St Andrew Bell St
4
1127 83 12 1566 19 418 156 0 3 329 53
116 12 93 377
3 172 176 0 479 1
13 4 36
115 Marketway Roundabout 421
Marketway 107 108 109 Cornmill St 110 111 Lake Road B2152 375
39 1684 0 4
1669 16 173 191 51
2 123 9 119
26 0 105 59 0 201
6 29 0 7 7 4 1 77 297 208 0
Cascade's Approach
Landport View
Lake Road
Commercial Road (S)35 5
Holbrook Road6 1388 294 26 16 164 45
13
3
9
25
16 Unicorn Road 104
134 Unicorn Road2 19 20
29
8 1112 0 582 907
310 1116 0 4 5 16 253 23
258 21
40 15
0 0
298
396 Queen Street 103 Bishop Crispian Way 105
64 1
30
22 862 0 15 126 4 0 33
8
196 920
191
0
191
250 Park Road 102 10 16 23
16
260
54 693 23
106 Stanhope Road 38
38
135 18
2013 PM Peak Total Vehicles
(18:00-19:00)
A 43 0 Edinburgh Road
29 6 80 0 0 34 595 174 2 0
A B C D E F G H I J
747 153 276
B
Anglesea Rd
Guildhall Walk
276
A 99 C Winston Churchill Avenue 404
B 10
C 14
D 11
E 0
F 4
G 106
H 160
I 0
J 0
0 11
A 1 Arm J 2 A 0 D Waltham Street 0
B 0 B 0
C 1 C 0
5 A D 0 D 0
0 B E 0 E 0
2 C F 0 F 0
0 D G 0 G 0
0 E H 0 St Michael's Gyratory H 0
0 F I 0 101 I 0
0 G J 0 J 0
0 H
0 I
0 J 0
7 A 59 E St Paul's Road 59
4 Car Park I B 0
C 0
D 0
E 0
F 0
G 0
H 0
I 0
J 0
39
F Wiltshire St 0
A B C D E F G H I J A B C D E F G H I J
228 16 127 0 0 1 4 1 1 0 326 11 52 0 0 0 0 15 1 0
H
G
Cambridge Road
Hampshire Terrace
378 350 405 705

1250 1336 712 1991
M27 M275
1250 1336 712 1991
119
1410 581
A
593 1369
23 133 90 230 105
A E D C B
B 556
A3 680
B 20
92 A A 90
20 B E 23
14 C D 431
4 E C 116
59 D
189 E Rudmore Roundabout
250 Wharf Road 118
463
23
5
C 475
A2047(Kingston cresent) 555
C 0 531
E A B C D B 128 23
67 93 283 131 0 A 303 18 12
E 23
D D 101
Car Park
30 46
574 1369 1410 681
2 126 1963
190
190
277 Princess Royal Road 117
151 1751
1143 111 0 1454 398
47
44 37
437
46
113 Church Street Roundabout 112 Wingfield St 96
0
234 63
0 33
414 29 20 15
186 9
Hope St
17
17
125 58 Fitzherbert St 114
1164 125
0 Flathouse Road 11658 446
0 1109
Church Street8 3 0 3
Commercial Road (N)
Clarence St Andrew Bell St
9
1109 198 76 1218 0 239 141 0 3 407 60
374 8 182 218
0 384 387 0 352 0
0 10 76
115 Marketway Roundabout 328
Marketway 107 108 109 Cornmill St 110 111 Lake Road B2152 378
10 1407 0 1
1398 30 222 352 58
13 192 14 199
14 0 62 16 0 120
2 8 0 17 8 7 0 164 128 126 1
Cascade's Approach
Landport View
Lake Road
Commercial Road (S)10 13
Holbrook Road166 1027 207 14 30 78 90
376
17
25
1044 418
386.5 Unicorn Road 104
108 Unicorn Road83 32 0
14
138 999 0 419 746
311 755 0 1 1 6 187 30
293 28
45 17
0 0
338
390 Queen Street 103 Bishop Crispian Way 105
52 0
28
27 844 0 15 175 1 0 31
1
125 630
175
0
175
125 Park Road 102 14 25 20
22
183
0 696 20
106 Stanhope Road 14
14
177 24
2013 Inter Peak Total Vehicles
(12:00-13:00)
A 105 0 Edinburgh Road
52 38 58 0 0 27 345 107 3 0
A B C D E F G H I J
696 201 207.5
B
Anglesea Rd
Guildhall Walk
277
A 101 C Winston Churchill Avenue 373
B 22
C 6
D 20
E 2
F 7
G 77
H 135
I 1
J 2
5 20
A 3 Arm J 11 A 0 D Waltham Street 0
B 2 B 0
C 4 C 0
6 A D 0 D 0
3 B E 0 E 0
1 C F 0 F 0
0 D G 1 G 0
0 E H 1 St Michael's Gyratory H 0
0 F I 0 101 I 0
3 G J 0 J 0
1 H
0 I
0 J 2
14 A 37 E St Paul's Road 37
9 Car Park I B 0
C 0
D 0
E 0
F 0
G 0
H 0
I 0
J 0
35
F Wiltshire St 0
A B C D E F G H I J A B C D E F G H I J
208 22 132 0 0 0 9 2 3 1 289 18 76 0 0 1 3 20 2 2
H
G
Cambridge Road
Hampshire Terrace
377 266 411 438

1251 1326 756 1902
M27 M275
1251 1326 756 1902
119
1333 569
A
587 1420
6 172 66 233 92
A E D C B
B 557
A3 624
B 18
125 A A 77
20 B E 24
19 C D 391
2 E C 114
71 D
237 E Rudmore Roundabout
340 Wharf Road 118
448
22
4
C 455
A2047(Kingston cresent) 528
C 1 500
E A B C D B 134 24
110 100 293 107 0 A 284 18 7
E 32
D D 77
Car Park
25 46
610 1420 1333 605
0 113 1826
146
146
211 Princess Royal Road 117
98 1884
1189 94 0 1337 394
55
39 57
412
70
113 Church Street Roundabout 112 Wingfield St 93
0
231 58
0 35
468 20 10 19
192 13
Hope St
41
41
87 30 Fitzherbert St 114
1164 87
0 Flathouse Road 11630 457
0 1196
Church Street13 4 0 4
Commercial Road (N)
Clarence St Andrew Bell St
12
1196 243 45 1109 1 250 113 0 8 368 71
422 13 182 283
0 427 431 0 354 1
0 10 95
115 Marketway Roundabout 398
Marketway 107 108 109 Cornmill St 110 111 Lake Road B2152 483
14 1262 11 4
1229 48 192 304 74
37 178 38 180
18 0 77 55 2 225
11 4 0 13 7 6 0 153 119 210 0
Cascade's Approach
Landport View
Lake Road
Commercial Road (S)15 37
Holbrook Road84 936 220 18 48 134 133
290
11
31
1044 332
185.8 Unicorn Road 104
156 Unicorn Road32 26 1
16
70 1172 0 482 876
254 729 0 1 0 30 164 37
275 30
49 18
0 0
324
373 Queen Street 103 Bishop Crispian Way 105
81 0
30
38 967 0 20 173 4 3 31
4
104 625
243
0
243
104 Park Road 102 14 25 32
22
167
0 762 32
106 Stanhope Road 19
19
186 24
2013 Inter Peak Total Vehicles
(13:00-14:00)
A 67 0 Edinburgh Road
37 20 111 0 0 28 295 131 3 0
A B C D E F G H I J
762 210 191.8
B
Anglesea Rd
Guildhall Walk
330
A 119 C Winston Churchill Avenue 433
B 14
C 12
D 24
E 0
F 4
G 110
H 148
I 2
J 0
0 25
A 7 Arm J 17 A 0 D Waltham Street 0
B 0 B 0
C 3 C 0
7 A D 0 D 0
2 B E 0 E 0
2 C F 0 F 0
0 D G 4 G 0
0 E H 3 St Michael's Gyratory H 0
0 F I 0 101 I 0
0 G J 0 J 0
1 H
0 I
0 J 0
12 A 42 E St Paul's Road 42
5 Car Park I B 0
C 0
D 0
E 0
F 0
G 0
H 0
I 0
J 0
35
F Wiltshire St 0
A B C D E F G H I J A B C D E F G H I J
214 16 120 1 0 2 4 3 0 0 336 15 82 0 0 1 3 21 0 0
H
G
Cambridge Road
Hampshire Terrace
360 307 458 416

52
Portsmouth Corridor 1 Air Quality Management Area VISSIM Model Assessment
B. 2013 Existing AM Peak Model Output Results

Portsmouth AQMA - Corridor 1 - Existing Conditions 2013 AM Peak
Links Volume Queue Length (m) Delay (secs)
Time Node Description Direction Movement From To Model Count Mod-Cnt % Diff* GEH Accept Max Average Average LOS†
501 Rudmore Roundabout M275 SB to M275 NB NW-S SBT 101011 101011 2606 2680 -74 -2.76% 1.4 � 0.0 0.0 2.5 A
M275 NB to M275 SB S-NW SBT 101022 101022 2006 2201 -195 -8.86% 4.3 � 0.0 0.0 2.0 A
A2047 Kingston Cresent to Wharf Road E-W WBT 101211 101412 47 46 1 2.17% 0.1 � 84.7 17.6 10.6 B
A2047 Kingston Cresent to M275 NB Service Road E-S WBL 101211 1010121 35 41 -6 -14.63% 1.0 � 84.7 17.6 2.5 A
A2047 Kingston Cresent to A2047 Kingston Cresent E-SE WBL 101211 101222 0 0 0 0.00% 0.0 � 84.7 17.6 0.0 A
A2047 Kingston Cresent to A3 Twyford Avenue E-NE WBU 101211 101621 11 11 0 0.00% 0.0 � 84.7 17.6 31.4 D
A2047 Kingston Cresent to M275 SB Service Road E-NW WBR 101211 101711 375 360 15 4.17% 0.8 � 84.7 17.6 29.7 D
M275 SB Service Road to Wharf Road NW-W SBR 101311 101412 469 479 -10 -2.09% 0.5 � 49.3 0.2 5.7 A
M275 SB Service Road to A3 Twyford Avenue NW-NE SBL 101311 101621 96 97 -1 -1.03% 0.1 � 49.3 0.2 5.8 A
M275 SB Service Road to M275 SB Service Road NW-NW SBU 101311 101711 1 3 -2 -66.67% 1.4 � 49.3 0.2 2.4 A
M275 SB Service Road to A2047 Kingston Cresent NW-SE SBL 101311 101222 284 303 -19 -6.27% 1.1 � 49.3 0.2 10.1 B
M275 SB Service Road to M275 NB Service Road NW-S SBT 101311 1010121 86 59 27 45.76% 3.2 � 49.3 0.2 7.3 A
A3 Twyford Avenue to Wharf Road NE-W WBT 101321 101412 50 54 -4 -7.41% 0.6 � 223.7 8.6 21.7 C
A3 Twyford Avenue to A3 Twyford Avenue NE-NE WBU 101321 101621 13 12 1 8.33% 0.3 � 223.7 8.6 25.7 D
A3 Twyford Avenue to M275 SB Service Road NE-NW WBR 101321 101711 353 347 6 1.73% 0.3 � 223.7 8.6 26.7 D
A3 Twyford Avenue to A2047 Kingston Cresent NE-SE WBL 101321 101222 34 34 0 0.00% 0.0 � 223.7 8.6 14.8 B
A3 Twyford Avenue to M275 NB Service Road NE-S WBU 101321 1010121 293 291 2 0.69% 0.1 � 223.7 8.6 22.4 C
Wharf Road to Wharf Road W-W EBU 101531 101412 2 2 0 0.00% 0.0 � 52.8 0.6 20.8 C
Wharf Road to A3 Twyford Avenue W-NE EBT 101531 101621 14 14 0 0.00% 0.0 � 52.8 0.6 33.0 D
Wharf Road to M275 SB Service Road W-NW EBL 101531 101711 169 163 6 3.68% 0.5 � 52.8 0.6 30.3 D
Wharf Road to A2047 Kingston Cresent W-SE EBT 101531 101222 8 8 0 0.00% 0.0 � 52.8 0.6 39.0 E
Wharf Road to M275 NB Service Road W-S WBR 101531 1010121 23 29 -6 -20.69% 1.2 � 52.8 0.6 39.4 E
M275 NB Service Road to Wharf Road S-W NBL 101423 101412 144 178 -34 -19.10% 2.7 � 45.3 0.1 4.7 A
M275 NB Service Road to A3 Twyford Avenue S-NE NBR 101423 101621 110 128 -18 -14.06% 1.7 � 45.3 0.1 30.8 D
M275 NB Service Road to M275 SB Service Road S-NW NBT 101423 101711 90 80 10 12.50% 1.1 � 45.3 0.1 19.4 C
M275 NB Service Road to A2047 Kingston Cresent S-SE NBR 101423 101222 20 26 -6 -23.08% 1.3 � 45.3 0.1 32.2 D
M275 NB Service Road to M275 NB Service Road S-S NBU 101423 1010121 3 14 -11 -78.57% 3.8 � 45.3 0.1 35.2 E
All 0 0 7341 7660 -319 -4% - - 223.7 5.0 8.3 A
502 Mile End Roundabout Mile End Road to Mile End Road N-N SBU 100613 100612 108 111 -3 -2.70% 0.3 � 121.2 9.0 58.4 E
Mile End Road to Commercial Road N-S SBT 100613 100111 1395 1498 -103 -6.88% 2.7 � 121.2 9.0 11.3 B
Mile End Road to Church Street N-E SBL 100613 100311 508 518 -10 -1.93% 0.4 � 121.2 9.0 16.0 B
Hope Street to Mile End Road SW-N NBT 100033 100612 1321 1444 -123 -8.52% 3.3 � 224.6 22.8 18.0 B
Hope Street to Mile End Road SW-N NBT 100641 100612 0 0 0 0.00% 0.0 � 12.5 0.1 0.0 A
Hope Street to Commercial Road SW-S NBU 100641 100111 0 9 -9 -100.00% 4.2 � 12.5 0.1 0.0 A
Hope Street to Church Street SW-E NBR 100641 100311 12 16 -4 -25.00% 1.1 � 12.5 0.1 85.6 F
Commercial Road to Mile End Road S-N NBT 100632 100612 477 560 -83 -14.82% 3.6 � 49.7 3.4 42.1 D
Commercial Road to Commercial Road S-S NBU 100632 100111 0 1 -1 -100.00% 1.4 � 49.7 3.4 0.0 A
Commercial Road to Church Street S-E NBR 100632 100311 2 3 -1 -33.33% 0.6 � 49.7 3.4 59.8 E
Church Street to Mile End Road E-N WBR 100621 100612 545 660 -115 -17.42% 4.7 � 231.5 143.6 181.0 F
Church Street to Commercial Road E-S WBL 100621 100111 2 6 -4 -66.67% 2.0 � 231.5 143.6 145.9 F
Church Street to Church Street E-E WBU 100621 100311 0 0 0 0.00% 0.0 � 231.5 143.6 0.0 A
All 0 0 4370 4826 -456 -9.45% - - 231.5 37.8 39.9 D
503 Cascade's Approach Cascade's Approach to Cascade's Approach S-SW NBL 100826 100827 0 0 0 0.00% 0.0 � 20.0 0.2 0.0 A
Cascade's Approach to Marketway WB S-E NBR 100826 100801 11 8 3 37.50% 1.0 � 20.0 0.2 11.8 B
Cascade's Approach to Marketway EB S-W NBL 100826 100825 0 3 -3 -100.00% 2.4 � 20.0 0.2 0.0 A
Marketway WB to Cascade's Approach NE-SW WBT 2 100827 68 67 1 1.49% 0.1 � 142.3 2.5 2.7 A
Marketway WB to Marketway WB NE-E WBL 2 100801 7 11 -4 -36.36% 1.3 � 142.3 2.5 8.9 A
Marketway WB to Marketway EB NE-W WBT 2 100825 1250 1377 -127 -9.22% 3.5 � 142.3 2.5 7.5 A
Marketway EB to Cascade's Approach SW-SW EBU 100824 100827 2 4 -2 -50.00% 1.2 � 27.8 0.1 3.1 A
Marketway EB to Hope Street SW-N EBL 100042 100042 1323 1429 -106 -7.42% 2.9 � 0.0 0.0 3.8 A
Marketway WB to Marketway EB NE-W WBT 2 79 24 25 -1 -4.00% 0.2 � 0.0 0.0 3.7 A
Marketway EB to Marketway WB SW-E EBT 100824 100801 74 80 -6 -7.50% 0.7 � 27.8 0.1 4.2 A
Marketway EB to Marketway EB SW-W NBL 100824 100825 4 6 -2 -33.33% 0.9 � 27.8 0.1 4.2 A
All 0 0 2763 3010 -247 -8.21% - - 142.3 0.8 5.5 A
504 Marketway Roundabout Commercial Road NB to Commercial Road SB S-N NBT 100805 100113 7 7 0 0.00% 0.0 � 38.6 2.3 31.2 D
Commercial Road NB to Marketway S-W NBL 100805 1 8 8 0 0.00% 0.0 � 38.6 2.3 51.1 F
Commercial Road NB to Cornmill street S-SE NBR 100805 100808 6 6 0 0.00% 0.0 � 38.6 2.3 21.3 C
Commercial Road SB to Commercial Road SB N-N SBU 100111 100113 56 61 -5 -8.20% 0.7 � 121.9 2.3 9.7 A
Commercial Road SB to Marketway N-W SBR 100111 1 1222 1321 -99 -7.49% 2.8 � 121.9 2.3 9.1 A
Commercial Road SB to Cornmill street N-SE SBT 100111 100808 113 132 -19 -14.39% 1.7 � 121.9 2.3 5.0 A
Marketway to Commercial Road SB W-N EBL 100804 100113 38 44 -6 -13.64% 0.9 � 59.5 0.9 9.3 A
Marketway to Marketway W-W EBU 100804 1 1 2 -1 -50.00% 0.8 � 59.5 0.9 4.9 A
Marketway to Cornmill street W-SE EBT 100804 100808 48 52 -4 -7.69% 0.6 � 59.5 0.9 13.6 B
Cornmill street to Commercial Road NB E-SW WBT 100806 100807 1 0 1 0.00% 1.4 � 87.6 2.6 0.2 A
Cornmill street to Commercial Road SB E-N WBR 100806 100113 445 461 -16 -3.47% 0.8 � 101.9 6.6 12.9 B
Cornmill street to Marketway E-W WBT 100806 1 143 140 3 2.14% 0.3 � 101.9 6.6 10.0 B
Cornmill street to Cornmill street E-SE WBL 100806 100808 0 0 0 0.00% 0.0 � 101.9 6.6 0.0 A
All 0 0 2088 2234 -146 -6.54% - - 121.9 3.0 10.1 B
505 A2030 roundabout Lake Road NB to Lake Road NB SW-W NBL 100814 100818 0 0 0 0.00% 0.0 � 42.2 0.1 0.0 A
Lake Road NB to Cornmill street SW-NW EBL 100814 100806 63 62 1 1.61% 0.1 � 42.2 0.1 7.0 A
Lake Road NB to Lake Road SB SW-E EBT 100814 100816 15 16 -1 -6.25% 0.3 � 42.2 0.1 4.7 A
Cornmill street to Lake Road NB NW-W SBR 100808 100818 34 38 -4 -10.53% 0.7 � 28.4 0.6 2.4 A
Cornmill street to Cornmill street NW-NW SBU 100808 100806 0 0 0 0.00% 0.0 � 28.4 0.6 0.0 A
Cornmill street to Lake Road SB NW-E SBL 100808 100816 132 152 -20 -13.16% 1.7 � 28.4 0.6 2.0 A
Lake Road SB to Lake Road NB E-W WBT 100817 100818 12 11 1 9.09% 0.3 � 164.6 4.0 17.4 C
Lake Road SB to Cornmill street E-NW WBT 100817 100806 529 539 -10 -1.86% 0.4 � 164.6 4.0 13.7 B
Lake Road SB to Lake Road SB E-E WBU 100817 100816 0 0 0 0.00% 0.0 � 164.6 4.0 0.0 A
All 0 0 785 818 -33 -4.03% - - 164.6 1.6 10.6 B
506 Holbrook Road Roundabout Lake Road SB to Lake Road SB NE-E WBL 100820 100819 0 1 -1 -100.00% 1.4 � 205.1 11.7 16.3 C
Lake Road SB to Holbrook Road NE-S WBR 100820 100821 116 120 -4 -3.33% 0.4 � 205.1 11.7 25.3 D
Lake Road SB to Church Street NE-NW WBR 100820 100313 55 58 -3 -5.17% 0.4 � 205.1 11.7 24.9 C
Lake Road SB to Lake Road NB NE-W WBT 100820 100817 191 194 -3 -1.55% 0.2 � 205.1 11.7 25.4 D
Holbrook Road to Lake Road SB SE-E NBR 100847 100819 118 126 -8 -6.35% 0.7 � 231.4 34.1 41.8 E
Holbrook Road to Holbrook Road SE-S NBL 100847 100821 1 1 0 0.00% 0.0 � 231.4 34.1 10.0 A
Holbrook Road to Church Street SE-NW NBT 100847 100313 522 549 -27 -4.92% 1.2 � 231.4 34.1 36.0 E
Holbrook Road to Lake Road NB SE-W NBL 100847 100817 348 352 -4 -1.14% 0.2 � 231.4 34.1 12.7 B
Church Street to Lake Road SB NW-E SBL 100311 100819 59 67 -8 -11.94% 1.0 � 113.7 3.3 20.2 C
Church Street to Holbrook Road NW-S SBT 100311 100821 421 456 -35 -7.68% 1.7 � 113.7 3.3 16.0 C
Church Street to Church Street NW-NW SBU 100311 100313 0 0 0 0.00% 0.0 � 113.7 3.3 0.0 A
Church Street to Lake Road NB NW-W SBR 100311 100817 4 4 0 0.00% 0.0 � 113.7 3.3 19.1 C
Lake Road NB to Lake Road SB SW-E EBT 100816 100819 54 64 -10 -15.63% 1.3 � 55.6 1.5 9.3 A
Lake Road NB to Holbrook Road SW-S EBR 100816 100821 85 98 -13 -13.27% 1.4 � 55.6 1.5 9.5 A
Lake Road NB to Church Street SW-NW EBL 100816 100313 5 6 -1 -16.67% 0.4 � 55.6 1.5 12.6 B
Lake Road NB to Lake Road NB SW-W NBL 100816 100817 0 0 0 0.00% 0.0 � 55.6 1.5 0.0 A
All 0 0 1980 2096 -116 -5.53% - - 231.4 12.7 23.6 C
507 Unicorn Road Unicorn Road WB to Market Way NW-NE SBL 100837 100035 34 33 1 3.03% 0.2 � 20.7 1.4 30.5 C
Unicorn Road WB to Unicorn Road EB NW-S SBT 100837 100840 15 17 -2 -11.76% 0.5 � 43.3 3.4 53.2 D
Unicorn Road WB to Alfred Road NW-SW SBR 100837 100843 32 31 1 3.23% 0.2 � 43.3 3.4 58.8 E
Market Way to Unicorn Road WB NE-NW WBR 100825 100841 247 225 22 9.78% 1.4 � 186.8 10.7 59.0 E
Market Way to Unicorn Road EB NE-S WBU 100825 100840 180 190 -10 -5.26% 0.7 � 186.8 10.7 7.8 A
Market Way to Alfred Road NE-SW WBT 100825 100843 848 971 -123 -12.67% 4.1 � 186.8 10.7 14.4 B
Unicorn Road EB to Unicorn Road WB S-NW NBT 100851 100841 88 83 5 6.24% 0.6 � 86.2 15.4 55.1 E
Unicorn Road EB to Market Way S-NE NBR 100851 100035 91 100 -9 -9.00% 0.9 � 86.2 15.4 52.2 D
Unicorn Road EB to Alfred Road S-SW NBL 100851 100843 7 14 -7 -50.00% 2.2 � 45.2 0.5 53.0 D
Alfred Road to Unicorn Road WB SW-NW EBL 100037 100841 192 200 -8 -4.00% 0.6 � 221.2 39.3 26.9 C
Alfred Road to Market Way SW-NE EBT 100037 100035 1281 1386 -105 -7.58% 2.9 � 221.2 39.3 26.5 C
All 0 0 3016 3250 -233.8333 -7.20% - - 221.2 13.7 26.9 C
508 Stanhope Road Stanhope Road to Stanhope Road S-S NBU 100849 100850 0 0 0 0.00% 0.0 � 32.5 0.1 0.0 A
Stanhope Road to Edinburgh Road WB S-SE NBR 100849 100853 0 1 -1 -100.00% 1.4 � 32.5 0.1 0.0 A
Stanhope Road to Unicorn road S-N NBT 100849 100842 165 171 -6 -3.51% 0.5 � 32.5 0.1 4.3 A
Stanhope Road to Edinburgh Road EB S-W NBL 100849 100854 9 14 -5 -35.71% 1.5 � 32.5 0.1 14.3 B
Edinburgh Road WB to Stanhope Road E-S WBL 100852 100850 2 1 1 100.00% 0.8 � 39.6 0.1 7.3 A
Edinburgh Road WB to Edinburgh Road WB E-SE WBL 100852 100853 0 0 0 0.00% 0.0 � 39.6 0.1 0.0 A
Edinburgh Road WB to Unicorn road E-N WBR 100852 100842 22 24 -2 -8.33% 0.4 � 39.6 0.1 15.1 C
Edinburgh Road WB to Edinburgh Road EB E-W WBT 100852 100854 35 26 9 34.62% 1.6 � 39.6 0.1 19.2 C
Unicorn road to Stanhope Road N-S SBT 100848 100850 168 173 -5 -2.89% 0.4 � 35.3 0.0 1.0 A
Unicorn road to Edinburgh Road WB N-SE SBT 100848 100853 16 27 -11 -40.74% 2.4 � 35.3 0.0 1.6 A
Unicorn road to Unicorn road N-N SBU 100848 100842 0 1 -1 -100.00% 1.4 � 35.3 0.0 0.0 A
Unicorn road to Edinburgh Road EB N-W SBR 100848 100854 10 6 4 66.67% 1.4 � 35.3 0.0 0.0 A
Edinburgh Road EB to Stanhope Road W-S EBR 100855 100850 8 13 -5 -37.66% 1.5 � 57.6 0.1 2.5 A
Edinburgh Road EB to Edinburgh Road WB W-SE EBT 100855 100853 20 20 0 -1.64% 0.1 � 57.6 0.1 12.5 B
Edinburgh Road EB to Unicorn road W-N EBL 100855 100842 0 1 -1 -100.00% 1.3 � 57.6 0.1 0.0 A
Edinburgh Road EB to Edinburgh Road EB W-W EBU 100855 100854 0 0 0 0.00% 0.0 � 57.6 0.1 0.0 A
All 0 0 455 478 -23 -4.81% - - 57.6 0.1 5.1 A
509 Queen Street Queen St to Alfred Road W-NE EBL 100039 100037 323 316 7 2.22% 0.4 � 67.6 10.6 27.3 C
Queen St to Bishop Crispian Way W-E EBT 100039 100855 28 34 -6 -17.65% 1.1 � 49.3 4.0 58.1 E
Alfred Road to Queen St NE-W WBT 97 100863 221 240 -19 -7.92% 1.3 � 201.8 14.1 38.4 D
Alfred Road to Anglesea Road NE-S WBR 100844 100862 662 776 -114 -14.69% 4.3 � 110.5 1.6 4.5 A
Bishop Crispian Way to Queen St E-W WBT 100857 100863 53 46 7 15.22% 1.0 � 58.3 5.8 49.8 D
Anglesea Road to Queen St S-W NBL 100859 100863 42 46 -4 -8.70% 0.6 � 99.9 0.9 23.3 C
Anglesea Road to Alfred Road S-NE NBR 100859 100037 1156 1270 -114 -8.98% 3.3 � 224.7 16.3 21.4 C
All 0 0 2484 2728 -244 -8.94% - - 224.7 7.6 20.3 C
510 St Michael's Gyratory St Paul's Road to Wiltshire Street S-E NBR 11 9 0 0 0 0.00% 0.0 � 26.7 0.2 0.0 A
St Paul's Road to Waltham St S-S NBU 11 10 0 0 0 0.00% 0.0 � 26.7 0.2 0.0 A
St Paul's Road to Guildhall Walk S-NE NBT 11 12 0 0 0 0.00% 0.0 � 26.7 0.2 0.0 A
St Paul's Road to Cambridge Road S-SW NBL 11 100883 0 0 0 0.00% 0.0 � 26.7 0.2 0.0 A
St Paul's Road to Hampshire Terrace S-S NBU 11 100889 0 0 0 0.00% 0.0 � 26.7 0.2 0.0 A
St Paul's Road to Winston churchill avenue S-E NBR 11 100902 0 0 0 0.00% 0.0 � 26.7 0.2 0.0 A
St Paul's Road to Anglesea Road S-N NBT 11 100859 103 105 -2 -1.90% 0.2 � 26.7 0.2 5.8 A
Cambridge Road to Wiltshire Street SW-E EBT 100882 9 0 0 0 0.00% 0.0 � 100.8 0.4 0.0 A
Cambridge Road to Waltham St SW-S EBR 100882 10 0 0 0 0.00% 0.0 � 100.8 0.4 0.0 A
Cambridge Road to Guildhall Walk SW-NE EBT 100882 12 6 6 0 0.00% 0.0 � 100.8 0.4 22.6 C
Cambridge Road to Cambridge Road SW-SW EBU 100882 100883 0 0 0 0.00% 0.0 � 100.8 0.4 0.0 A
Cambridge Road to Hampshire Terrace SW-S EBR 100882 100889 0 0 0 0.00% 0.0 � 100.8 0.4 0.0 A
Cambridge Road to Winston churchill avenue SW-E EBT 100882 100902 52 53 -1 -1.89% 0.1 � 100.8 0.4 22.0 C
Cambridge Road to Anglesea Road SW-N EBL 100882 100859 387 393 -6 -1.53% 0.3 � 100.8 0.4 8.7 A
Hampshire Terrace to Wiltshire Street S-E NBR 100888 9 0 0 0 0.00% 0.0 � 220.8 15.8 0.0 A
Hampshire Terrace to Waltham St S-S NBU 100888 10 0 0 0 0.00% 0.0 � 220.8 15.8 0.0 A
Hampshire Terrace to Guildhall Walk S-NE NBT 100888 12 9 9 0 0.00% 0.0 � 220.8 15.8 33.4 D
Hampshire Terrace to Cambridge Road S-SW NBL 100888 100883 5 5 0 0.00% 0.0 � 220.8 15.8 12.2 B
Hampshire Terrace to Hampshire Terrace S-S NBU 100888 100889 1 1 0 0.00% 0.0 � 220.8 15.8 11.2 B
Hampshire Terrace to Winston churchill avenue S-E NBR 100888 100902 34 34 0 0.00% 0.0 � 220.8 15.8 31.6 D
Hampshire Terrace to Anglesea Road S-N NBT 100888 100859 588 594 -6 -1.01% 0.2 � 220.8 15.8 21.8 C
Winston churchill avenue to Wiltshire Street E-E WBU 100907 9 6 6 0 0.00% 0.0 � 55.6 4.0 19.0 B
Winston churchill avenue to Waltham St E-S WBL 100907 10 29 30 -1 -3.33% 0.2 � 55.6 4.0 13.0 B
Winston churchill avenue to Guildhall Walk E-NE WBR 100907 12 4 4 0 0.00% 0.0 � 55.6 4.0 36.0 D
Winston churchill avenue to Cambridge Road E-SW WBT 100907 100883 91 95 -4 -4.21% 0.4 � 55.6 4.0 21.5 C
Winston churchill avenue to Hampshire Terrace E-S WBL 100907 100889 45 43 2 4.65% 0.3 � 55.6 4.0 13.9 B
Winston churchill avenue to Winston churchill avenue E-E WBU 100907 100902 8 9 -1 -11.11% 0.3 � 55.6 4.0 34.8 C
Winston churchill avenue to Anglesea Road E-N WBR 100907 100859 115 119 -4 -3.36% 0.4 � 55.6 4.0 20.2 C
Anglesea Road to Wiltshire Street N-E SBL 100869 9 21 29 -8 -27.59% 1.6 � 41.3 0.1 11.9 B
Anglesea Road to Waltham St N-S SBT 100869 10 0 1 -1 -100.00% 1.4 � 41.3 0.1 0.0 A
Anglesea Road to Guildhall Walk N-NE SBL 100869 12 52 62 -10 -16.13% 1.3 � 41.3 0.1 9.6 A
Anglesea Road to Cambridge Road N-SW SBR 100869 100883 141 172 -31 -18.02% 2.5 � 41.3 0.1 14.8 B
Anglesea Road to Hampshire Terrace N-S SBT 100869 100889 226 258 -32 -12.40% 2.1 � 41.3 0.1 11.3 B
Anglesea Road to Winston churchill avenue N-E SBL 100869 100902 56 68 -12 -17.65% 1.5 � 41.3 0.1 9.5 A
Anglesea Road to Anglesea Road N-N SBU 100869 100859 42 50 -8 -16.00% 1.2 � 41.3 0.1 16.4 C
All 0 0 2020 2146 -126 -5.87% - - 220.8 4.1 15.8 C
511 Park Road Park Road to Anglesea Road W-N EBL 100879 100859 69 73 -4 -5.48% 0.5 � 90.8 5.6 48.0 D
Anglesea Road SB to Park Road N-W SBR 100862 100880 107 133 -26 -19.55% 2.4 � 151.0 12.8 51.6 D
Anglesea Road SB to Anglesea Road SB N-S SBT 100862 100865 547 643 -96 -14.93% 3.9 � 151.0 12.8 9.3 A
Anglesea Road to Park Road S-W NBL 100859 100880 21 21 0 0.00% 0.0 � 190.2 12.9 13.7 B
Anglesea Road to Anglesea Road S-N NBT 100859 100859 1165 1243 -78 -6.28% 2.2 � 190.2 12.9 12.7 B
All 0 0 1909 2113 -204 -9.65% - - 190.2 11.4 15.2 B
512 Princess Royal Road Princess Royal Road to Mile end Road NB W-N EBL 100681 101021 114 116 -2 -1.72% 0.2 � 68.5 4.5 26.6 C
Mile end Road SB to Princess Royal Road NE-W WBT 4 100682 1004 986 18 1.83% 0.6 � 183.1 26.7 32.0 C
Mile end Road NB to Princess Royal Road S-W NBL 3 100682 164 154 10 6.49% 0.8 � 60.8 2.3 12.7 B
Mile end Road NB to Mile end Road NB S-N NBT 100612 101021 2280 2510 -230 -9.16% 4.7 � 226.6 22.6 14.4 B
All 0 0 3561 3766 -205 -5.44% - - 226.6 14.0 19.7 B
0 NETWORK TOTALS All All 32771 35125 -2354 -6.70% - 100% 231.5 8.1 18.0 C
07
:00
-08
:00
26/09/2014 11:45 Node Evaluation Results_AM.xlsm

501 Rudmore Roundabout M275 SB to M275 NB NW-S SBT 101011 101011 2975 2912 63 2.16% 1.2 � 0.0 0.0 2.9 A
M275 NB to M275 SB S-NW SBT 101022 101022 2314 2342 -28 -1.20% 0.6 � 0.0 0.0 2.1 A
A2047 Kingston Cresent to Wharf Road E-W WBT 101211 101412 44 44 0 0.00% 0.0 � 82.2 20.0 11.6 B
A2047 Kingston Cresent to M275 NB Service Road E-S WBL 101211 1010121 48 54 -6 -11.11% 0.8 � 82.2 20.0 3.6 A
A2047 Kingston Cresent to A2047 Kingston Cresent E-SE WBL 101211 101222 1 1 0 0.00% 0.0 � 82.2 20.0 18.8 C
A2047 Kingston Cresent to A3 Twyford Avenue E-NE WBU 101211 101621 43 45 -2 -4.44% 0.3 � 82.2 20.0 29.0 D
A2047 Kingston Cresent to M275 SB Service Road E-NW WBR 101211 101711 446 450 -4 -0.89% 0.2 � 82.2 20.0 28.9 D
M275 SB Service Road to Wharf Road NW-W SBR 101311 101412 326 305 21 6.89% 1.2 � 97.6 2.0 7.4 A
M275 SB Service Road to A3 Twyford Avenue NW-NE SBL 101311 101621 110 110 0 0.00% 0.0 � 97.6 2.0 10.0 B
M275 SB Service Road to M275 SB Service Road NW-NW SBU 101311 101711 11 12 -1 -8.33% 0.3 � 97.6 2.0 9.0 A
M275 SB Service Road to A2047 Kingston Cresent NW-SE SBL 101311 101222 466 468 -2 -0.43% 0.1 � 97.6 2.0 13.3 B
M275 SB Service Road to M275 NB Service Road NW-S SBT 101311 1010121 171 203 -32 -15.76% 2.3 � 97.6 2.0 10.0 A
A3 Twyford Avenue to Wharf Road NE-W WBT 101321 101412 40 37 3 8.11% 0.5 � 178.1 9.5 27.1 D
A3 Twyford Avenue to A3 Twyford Avenue NE-NE WBU 101321 101621 6 5 1 20.00% 0.4 � 178.1 9.5 25.3 D
A3 Twyford Avenue to M275 SB Service Road NE-NW WBR 101321 101711 261 259 2 0.77% 0.1 � 178.1 9.5 30.2 D
A3 Twyford Avenue to A2047 Kingston Cresent NE-SE WBL 101321 101222 42 46 -4 -8.70% 0.6 � 178.1 9.5 20.0 C
A3 Twyford Avenue to M275 NB Service Road NE-S WBU 101321 1010121 304 314 -10 -3.18% 0.6 � 178.1 9.5 29.7 D
Wharf Road to Wharf Road W-W EBU 101531 101412 5 5 0 0.00% 0.0 � 40.9 0.8 38.0 E
Wharf Road to A3 Twyford Avenue W-NE EBT 101531 101621 19 20 -1 -5.00% 0.2 � 40.9 0.8 33.1 D
Wharf Road to M275 SB Service Road W-NW EBL 101531 101711 97 90 7 7.78% 0.7 � 40.9 0.8 26.8 D
Wharf Road to A2047 Kingston Cresent W-SE EBT 101531 101222 20 19 1 5.26% 0.2 � 40.9 0.8 35.8 E
Wharf Road to M275 NB Service Road W-S WBR 101531 1010121 33 40 -7 -17.50% 1.2 � 40.9 0.8 35.5 E
M275 NB Service Road to Wharf Road S-W NBL 101423 101412 124 123 1 0.81% 0.1 � 39.7 0.1 4.0 A
M275 NB Service Road to A3 Twyford Avenue S-NE NBR 101423 101621 159 172 -13 -7.56% 1.0 � 39.7 0.1 26.4 D
M275 NB Service Road to M275 SB Service Road S-NW NBT 101423 101711 80 86 -6 -6.98% 0.7 � 39.7 0.1 14.9 B
M275 NB Service Road to A2047 Kingston Cresent S-SE NBR 101423 101222 46 59 -13 -22.03% 1.8 � 39.7 0.1 23.6 C
M275 NB Service Road to M275 NB Service Road S-S NBU 101423 1010121 4 17 -13 -76.47% 4.0 � 39.7 0.1 18.0 C
All 0 0 8193 8238 -45 -1% - - 178.1 6.0 8.7 A
502 Mile End Roundabout Mile End Road to Mile End Road N-N SBU 100613 100612 82 83 -1 -1.20% 0.1 � 164.4 16.7 60.4 E
Mile End Road to Commercial Road N-S SBT 100613 100111 2418 2458 -40 -1.63% 0.8 � 164.4 16.7 15.3 B
Mile End Road to Church Street N-E SBL 100613 100311 591 584 7 1.20% 0.3 � 164.4 16.7 18.8 B
Hope Street to Mile End Road SW-N NBT 100033 100612 1667 1732 -65 -3.75% 1.6 � 228.0 33.4 18.7 B
Hope Street to Mile End Road SW-N NBT 100641 100612 0 0 0 0.00% 0.0 � 22.9 0.2 0.0 A
Hope Street to Commercial Road SW-S NBU 100641 100111 1 10 -9 -90.00% 3.8 � 22.9 0.2 73.7 E
Hope Street to Church Street SW-E NBR 100641 100311 18 22 -4 -18.18% 0.9 � 22.9 0.2 88.6 F
Commercial Road to Mile End Road S-N NBT 100632 100612 366 361 5 1.39% 0.3 � 52.3 1.3 40.5 D
Commercial Road to Commercial Road S-S NBU 100632 100111 0 1 -1 -100.00% 1.4 � 52.3 1.3 0.0 A
Commercial Road to Church Street S-E NBR 100632 100311 1 2 -1 -50.00% 0.8 � 52.3 1.3 41.2 D
Church Street to Mile End Road E-N WBR 100621 100612 556 661 -105 -15.89% 4.3 � 231.5 222.1 396.6 F
Church Street to Commercial Road E-S WBL 100621 100111 11 13 -2 -15.38% 0.6 � 231.5 222.1 468.5 F
Church Street to Church Street E-E WBU 100621 100311 0 0 0 0.00% 0.0 � 231.5 222.1 0.0 A
All 0 0 5711 5927 -216 -3.64% - - 231.5 58.0 57.2 E
503 Cascade's Approach Cascade's Approach to Cascade's Approach S-SW NBL 100826 100827 0 0 0 0.00% 0.0 � 13.0 0.3 0.0 A
Cascade's Approach to Marketway WB S-E NBR 100826 100801 5 4 1 25.00% 0.5 � 13.0 0.3 21.0 C
Cascade's Approach to Marketway EB S-W NBL 100826 100825 10 11 -1 -9.09% 0.3 � 13.0 0.3 16.7 C
Marketway WB to Cascade's Approach NE-SW WBT 2 100827 110 127 -17 -13.39% 1.6 � 231.5 22.5 5.5 A
Marketway WB to Marketway WB NE-E WBL 2 100801 21 23 -2 -8.70% 0.4 � 231.5 22.5 18.9 C
Marketway WB to Marketway EB NE-W WBT 2 100825 1940 2036 -96 -4.72% 2.2 � 231.5 22.5 17.7 C
Marketway EB to Cascade's Approach SW-SW EBU 100824 100827 9 13 -4 -30.77% 1.2 � 141.1 0.2 4.8 A
Marketway EB to Hope Street SW-N EBL 100042 100042 1643 1727 -84 -4.86% 2.0 � 0.0 0.0 5.0 A
Marketway WB to Marketway EB NE-W WBT 2 79 30 33 -3 -9.09% 0.5 � 109.2 0.1 5.9 A
Marketway EB to Marketway WB SW-E EBT 100824 100801 142 107 35 32.71% 3.1 � 141.1 0.2 6.4 A
Marketway EB to Marketway EB SW-W NBL 100824 100825 6 8 -2 -25.00% 0.8 � 141.1 0.2 6.9 A
All 0 0 3916 4089 -173 -4.23% - - 231.5 6.3 11.5 B
504 Marketway Roundabout Commercial Road NB to Commercial Road SB S-N NBT 100805 100113 13 13 0 0.00% 0.0 � 50.5 3.0 30.5 D
Commercial Road NB to Marketway S-W NBL 100805 1 12 13 -1 -7.69% 0.3 � 50.5 3.0 50.2 F
Commercial Road NB to Cornmill street S-SE NBR 100805 100808 5 6 -1 -16.67% 0.4 � 50.5 3.0 27.8 D
Commercial Road SB to Commercial Road SB N-N SBU 100111 100113 37 38 -1 -2.63% 0.2 � 229.1 29.0 25.4 D
Commercial Road SB to Marketway N-W SBR 100111 1 2025 2080 -55 -2.64% 1.2 � 229.1 29.0 29.2 D
Commercial Road SB to Cornmill street N-SE SBT 100111 100808 353 364 -11 -3.02% 0.6 � 229.1 29.0 20.0 C
Marketway to Commercial Road SB W-N EBL 100804 100113 73 43 30 69.77% 3.9 � 61.4 1.0 9.9 A
Marketway to Marketway W-W EBU 100804 1 0 0 0 0.00% 0.0 � 61.4 1.0 2.6 A
Marketway to Cornmill street W-SE EBT 100804 100808 75 86 -11 -12.79% 1.2 � 61.4 1.0 13.5 B
Cornmill street to Commercial Road NB E-SW WBT 100806 100807 1 0 1 0.00% 1.4 � 157.7 12.1 0.2 A
Cornmill street to Commercial Road SB E-N WBR 100806 100113 285 322 -37 -11.49% 2.1 � 171.9 19.8 31.0 D
Cornmill street to Marketway E-W WBT 100806 1 106 123 -17 -13.82% 1.6 � 171.9 19.8 34.0 D
Cornmill street to Cornmill street E-SE WBL 100806 100808 0 0 0 0.00% 0.0 � 171.9 19.8 0.0 A
All 0 0 2985 3088 -103 -3.34% - - 229.1 13.1 27.6 D
505 A2030 roundabout Lake Road NB to Lake Road NB SW-W NBL 100814 100818 0 2 -2 -100.00% 2.0 � 82.1 3.8 0.0 A
Lake Road NB to Cornmill street SW-NW EBL 100814 100806 75 77 -2 -2.60% 0.2 � 82.1 3.8 23.2 C
Lake Road NB to Lake Road SB SW-E EBT 100814 100816 52 55 -3 -5.45% 0.4 � 82.1 3.8 8.6 A
Cornmill street to Lake Road NB NW-W SBR 100808 100818 84 94 -10 -10.64% 1.1 � 32.4 1.2 6.0 A
Cornmill street to Cornmill street NW-NW SBU 100808 100806 0 0 0 0.00% 0.0 � 32.4 1.2 0.0 A
Cornmill street to Lake Road SB NW-E SBL 100808 100816 347 362 -15 -4.14% 0.8 � 32.4 1.2 3.8 A
Lake Road SB to Lake Road NB E-W WBT 100817 100818 35 38 -3 -7.89% 0.5 � 231.4 8.4 13.4 B
Lake Road SB to Cornmill street E-NW WBT 100817 100806 319 368 -49 -13.32% 2.6 � 231.4 8.4 27.1 D
Lake Road SB to Lake Road SB E-E WBU 100817 100816 0 0 0 0.00% 0.0 � 231.4 8.4 0.0 A
All 0 0 911 996 -85 -8.53% - - 231.4 4.5 14.3 B
506 Holbrook Road Roundabout Lake Road SB to Lake Road SB NE-E WBL 100820 100819 4 4 0 0.00% 0.0 � 231.5 166.9 118.8 F
Lake Road SB to Holbrook Road NE-S WBR 100820 100821 212 225 -13 -5.78% 0.9 � 231.5 166.9 200.0 F
Lake Road SB to Church Street NE-NW WBR 100820 100313 66 74 -8 -10.81% 1.0 � 231.5 166.9 188.5 F
Lake Road SB to Lake Road NB NE-W WBT 100820 100817 209 217 -8 -3.69% 0.5 � 231.5 166.9 193.7 F
Holbrook Road to Lake Road SB SE-E NBR 100847 100819 175 210 -35 -16.67% 2.5 � 235.8 174.2 310.9 F
Holbrook Road to Holbrook Road SE-S NBL 100847 100821 0 0 0 0.00% 0.0 � 235.8 174.2 0.0 A
Holbrook Road to Church Street SE-NW NBT 100847 100313 477 544 -67 -12.32% 3.0 � 235.8 174.2 310.5 F
Holbrook Road to Lake Road NB SE-W NBL 100847 100817 151 179 -28 -15.64% 2.2 � 235.8 174.2 208.9 F
Church Street to Lake Road SB NW-E SBL 100311 100819 86 90 -4 -4.44% 0.4 � 171.1 11.4 43.2 E
Church Street to Holbrook Road NW-S SBT 100311 100821 444 470 -26 -5.53% 1.2 � 171.1 11.4 38.1 E
Church Street to Church Street NW-NW SBU 100311 100313 0 0 0 0.00% 0.0 � 171.1 11.4 0.0 A
Church Street to Lake Road NB NW-W SBR 100311 100817 8 9 -1 -11.11% 0.3 � 171.1 11.4 99.9 F
Lake Road NB to Lake Road SB SW-E EBT 100816 100819 104 112 -8 -7.14% 0.8 � 223.6 11.1 19.2 C
Lake Road NB to Holbrook Road SW-S EBR 100816 100821 277 293 -16 -5.46% 0.9 � 223.6 11.1 20.1 C
Lake Road NB to Church Street SW-NW EBL 100816 100313 12 11 1 9.09% 0.3 � 223.6 11.1 32.3 D
Lake Road NB to Lake Road NB SW-W NBL 100816 100817 1 1 0 0.00% 0.0 � 223.6 11.1 13.4 B
All 0 0 2224 2439 -215 -8.82% - - 235.8 90.9 161.2 F
507 Unicorn Road Unicorn Road WB to Market Way NW-NE SBL 100837 100035 52 52 0 0.00% 0.0 � 28.9 3.0 42.6 D
Unicorn Road WB to Unicorn Road EB NW-S SBT 100837 100840 11 11 0 0.00% 0.0 � 37.4 3.1 57.6 E
Unicorn Road WB to Alfred Road NW-SW SBR 100837 100843 29 31 -2 -6.45% 0.4 � 37.4 3.1 62.2 E
Market Way to Unicorn Road WB NE-NW WBR 100825 100841 73 74 -1 -1.35% 0.1 � 224.8 24.9 64.5 E
Market Way to Unicorn Road EB NE-S WBU 100825 100840 310 336 -26 -7.74% 1.4 � 224.8 24.9 14.5 B
Market Way to Alfred Road NE-SW WBT 100825 100843 1581 1645 -64 -3.89% 1.6 � 224.8 24.9 25.9 C
Unicorn Road EB to Unicorn Road WB S-NW NBT 100851 100841 35 32 3 8.70% 0.5 � 92.3 14.6 51.5 D
Unicorn Road EB to Market Way S-NE NBR 100851 100035 145 155 -10 -6.45% 0.8 � 92.3 14.6 52.3 D
Unicorn Road EB to Alfred Road S-SW NBL 100851 100843 12 16 -4 -25.00% 1.1 � 30.1 0.7 49.7 D
Alfred Road to Unicorn Road WB SW-NW EBL 100037 100841 99 87 12 13.79% 1.2 � 225.7 37.5 21.6 C
Alfred Road to Market Way SW-NE EBT 100037 100035 1603 1648 -45 -2.73% 1.1 � 225.7 37.5 22.8 C
All 0 0 3949 4087 -138.2 -3.38% - - 225.7 17.2 26.2 C
508 Stanhope Road Stanhope Road to Stanhope Road S-S NBU 100849 100850 0 3 -3 -100.00% 2.4 � 26.0 0.1 0.0 A
Stanhope Road to Edinburgh Road WB S-SE NBR 100849 100853 0 4 -4 -100.00% 2.8 � 26.0 0.1 0.0 A
Stanhope Road to Unicorn road S-N NBT 100849 100842 167 172 -5 -2.91% 0.4 � 26.0 0.1 4.3 A
Stanhope Road to Edinburgh Road EB S-W NBL 100849 100854 8 22 -14 -63.64% 3.6 � 26.0 0.1 14.3 B
Edinburgh Road WB to Stanhope Road E-S WBL 100852 100850 12 4 8 200.00% 2.8 � 76.3 0.4 7.9 A
Edinburgh Road WB to Edinburgh Road WB E-SE WBL 100852 100853 0 0 0 0.00% 0.0 � 76.3 0.4 0.0 A
Edinburgh Road WB to Unicorn road E-N WBR 100852 100842 24 30 -6 -20.00% 1.2 � 76.3 0.4 13.7 B
Edinburgh Road WB to Edinburgh Road EB E-W WBT 100852 100854 49 33 16 48.48% 2.5 � 76.3 0.4 21.7 C
Unicorn road to Stanhope Road N-S SBT 100848 100850 279 278 1 0.36% 0.1 � 47.1 0.0 1.2 A
Unicorn road to Edinburgh Road WB N-SE SBT 100848 100853 24 39 -15 -38.46% 2.7 � 47.1 0.0 1.6 A
Unicorn road to Unicorn road N-N SBU 100848 100842 0 0 0 0.00% 0.0 � 47.1 0.0 0.0 A
Unicorn road to Edinburgh Road EB N-W SBR 100848 100854 17 30 -13 -43.33% 2.7 � 47.1 0.0 2.1 A
Edinburgh Road EB to Stanhope Road W-S EBR 100855 100850 8 15 -7 -46.19% 2.0 � 41.0 0.1 11.3 B
Edinburgh Road EB to Edinburgh Road WB W-SE EBT 100855 100853 24 29 -5 -17.05% 1.0 � 41.0 0.1 12.6 B
Edinburgh Road EB to Unicorn road W-N EBL 100855 100842 0 1 -1 -100.00% 1.5 � 41.0 0.1 0.0 A
Edinburgh Road EB to Edinburgh Road EB W-W EBU 100855 100854 0 0 0 0.00% 0.0 � 41.0 0.1 0.0 A
All 0 0 613 660 -47 -7.12% - - 76.3 0.2 5.1 A
509 Queen Street Queen St to Alfred Road W-NE EBL 100039 100037 402 390 12 3.08% 0.6 � 81.0 14.0 27.9 C
Queen St to Bishop Crispian Way W-E EBT 100039 100855 32 45 -13 -28.89% 2.1 � 72.2 6.6 70.0 E
Alfred Road to Queen St NE-W WBT 97 100863 389 413 -24 -5.81% 1.2 � 230.8 90.7 86.7 F
Alfred Road to Anglesea Road NE-S WBR 100844 100862 1217 1279 -62 -4.85% 1.8 � 227.8 49.1 22.9 C
Bishop Crispian Way to Queen St E-W WBT 100857 100863 73 85 -12 -14.12% 1.4 � 106.4 9.2 58.9 E
Anglesea Road to Queen St S-W NBL 100859 100863 17 17 0 0.00% 0.0 � 8.7 0.2 20.3 C
Anglesea Road to Alfred Road S-NE NBR 100859 100037 1300 1345 -45 -3.35% 1.2 � 225.9 17.7 22.3 C
All 0 0 3430 3574 -144 -4.03% - - 230.8 26.8 31.8 C
510 St Michael's Gyratory St Paul's Road to Wiltshire Street S-E NBR 11 9 0 0 0 0.00% 0.0 � 42.9 0.8 0.0 A
St Paul's Road to Waltham St S-S NBU 11 10 0 0 0 0.00% 0.0 � 42.9 0.8 0.0 A
St Paul's Road to Guildhall Walk S-NE NBT 11 12 0 0 0 0.00% 0.0 � 42.9 0.8 0.0 A
St Paul's Road to Cambridge Road S-SW NBL 11 100883 0 0 0 0.00% 0.0 � 42.9 0.8 0.0 A
St Paul's Road to Hampshire Terrace S-S NBU 11 100889 0 0 0 0.00% 0.0 � 42.9 0.8 0.0 A
St Paul's Road to Winston churchill avenue S-E NBR 11 100902 0 0 0 0.00% 0.0 � 42.9 0.8 0.0 A
St Paul's Road to Anglesea Road S-N NBT 11 100859 185 184 1 0.54% 0.1 � 42.9 0.8 12.1 B
Cambridge Road to Wiltshire Street SW-E EBT 100882 9 3 4 -1 -25.00% 0.5 � 224.0 2.8 29.0 C
Cambridge Road to Waltham St SW-S EBR 100882 10 0 0 0 0.00% 0.0 � 224.0 2.8 0.0 A
Cambridge Road to Guildhall Walk SW-NE EBT 100882 12 19 17 2 11.76% 0.5 � 224.0 2.8 26.7 C
Cambridge Road to Cambridge Road SW-SW EBU 100882 100883 3 3 0 0.00% 0.0 � 224.0 2.8 33.5 C
Cambridge Road to Hampshire Terrace SW-S EBR 100882 100889 3 3 0 0.00% 0.0 � 224.0 2.8 30.8 C
Cambridge Road to Winston churchill avenue SW-E EBT 100882 100902 132 133 -1 -0.75% 0.1 � 224.0 2.8 27.4 C
Cambridge Road to Anglesea Road SW-N EBL 100882 100859 546 546 0 0.00% 0.0 � 224.0 2.8 14.4 B
Hampshire Terrace to Wiltshire Street S-E NBR 100888 9 1 2 -1 -50.00% 0.8 � 231.5 32.7 48.2 E
Hampshire Terrace to Waltham St S-S NBU 100888 10 0 0 0 0.00% 0.0 � 231.5 32.7 0.0 A
Hampshire Terrace to Guildhall Walk S-NE NBT 100888 12 13 15 -2 -13.33% 0.5 � 231.5 32.7 68.1 F
Hampshire Terrace to Cambridge Road S-SW NBL 100888 100883 16 14 2 14.29% 0.5 � 231.5 32.7 63.1 F
Hampshire Terrace to Hampshire Terrace S-S NBU 100888 100889 1 1 0 0.00% 0.0 � 231.5 32.7 26.4 D
Hampshire Terrace to Winston churchill avenue S-E NBR 100888 100902 34 36 -2 -5.56% 0.3 � 231.5 32.7 67.1 F
Hampshire Terrace to Anglesea Road S-N NBT 100888 100859 339 337 2 0.59% 0.1 � 231.5 32.7 52.6 F
Winston churchill avenue to Wiltshire Street E-E WBU 100907 9 5 5 0 0.00% 0.0 � 90.9 10.2 31.8 C
Winston churchill avenue to Waltham St E-S WBL 100907 10 50 48 2 4.17% 0.3 � 90.9 10.2 21.1 C
Winston churchill avenue to Guildhall Walk E-NE WBR 100907 12 10 11 -1 -9.09% 0.3 � 90.9 10.2 45.5 D
Winston churchill avenue to Cambridge Road E-SW WBT 100907 100883 178 175 3 1.71% 0.2 � 90.9 10.2 38.3 D
Winston churchill avenue to Hampshire Terrace E-S WBL 100907 100889 119 121 -2 -1.65% 0.2 � 90.9 10.2 30.4 C
Winston churchill avenue to Winston churchill avenue E-E WBU 100907 100902 23 24 -1 -4.17% 0.2 � 90.9 10.2 51.2 D
Winston churchill avenue to Anglesea Road E-N WBR 100907 100859 119 124 -5 -4.03% 0.5 � 90.9 10.2 38.4 D
Anglesea Road to Wiltshire Street N-E SBL 100869 9 45 49 -4 -8.16% 0.6 � 72.2 0.9 21.9 C
Anglesea Road to Waltham St N-S SBT 100869 10 0 1 -1 -100.00% 1.4 � 72.2 0.9 0.0 A
Anglesea Road to Guildhall Walk N-NE SBL 100869 12 79 93 -14 -15.05% 1.5 � 72.2 0.9 13.1 B
Anglesea Road to Cambridge Road N-SW SBR 100869 100883 268 279 -11 -3.94% 0.7 � 72.2 0.9 28.2 D
Anglesea Road to Hampshire Terrace N-S SBT 100869 100889 377 390 -13 -3.33% 0.7 � 72.2 0.9 22.1 C
Anglesea Road to Winston churchill avenue N-E SBL 100869 100902 92 114 -22 -19.30% 2.2 � 72.2 0.9 12.3 B
Anglesea Road to Anglesea Road N-N SBU 100869 100859 74 84 -10 -11.90% 1.1 � 72.2 0.9 30.9 D
All 0 0 2734 2813 -79 -2.81% - - 231.5 9.5 27.8 D
511 Park Road Park Road to Anglesea Road W-N EBL 100879 100859 140 136 4 2.94% 0.3 � 94.1 11.8 52.4 D
Anglesea Road SB to Park Road N-W SBR 100862 100880 256 263 -7 -2.66% 0.4 � 234.7 65.1 111.8 F
Anglesea Road SB to Anglesea Road SB N-S SBT 100862 100865 944 1016 -72 -7.09% 2.3 � 234.7 65.1 26.6 C
Anglesea Road to Park Road S-W NBL 100859 100880 49 58 -9 -15.52% 1.2 � 225.5 12.8 14.3 B
Anglesea Road to Anglesea Road S-N NBT 100859 100859 1150 1226 -76 -6.20% 2.2 � 225.5 12.8 12.3 B
All 0 0 2538 2699 -161 -5.97% - - 234.7 33.5 29.9 C
512 Princess Royal Road Princess Royal Road to Mile end Road NB W-N EBL 100681 101021 119 117 2 1.71% 0.2 � 91.3 5.7 28.7 C
Mile end Road SB to Princess Royal Road NE-W WBT 4 100682 446 411 35 8.52% 1.7 � 119.8 11.9 32.4 C
Mile end Road NB to Princess Royal Road S-W NBL 3 100682 81 76 5 6.58% 0.6 � 41.9 0.5 7.0 A
Mile end Road NB to Mile end Road NB S-N NBT 100612 101021 2598 2678 -80 -2.99% 1.6 � 223.5 15.0 9.4 A
All 0 0 3244 3282 -38 -1.16% - - 223.5 8.3 13.2 B
0 NETWORK TOTALS All 40450 41892 -1442 -3.44% - 100% 235.8 21.3 32.3 D
08
:00
-09
:00
26/09/2014 11:45 Node Evaluation Results_AM.xlsm

501 Rudmore Roundabout M275 SB to M275 NB NW-S SBT 101011 101011 1983 1958 25 1.28% 0.6 � 0.0 0.0 1.3 A
M275 NB to M275 SB S-NW SBT 101022 101022 1389 1162 227 19.54% 6.4 � 0.0 0.0 1.0 A
A2047 Kingston Cresent to Wharf Road E-W WBT 101211 101412 31 32 -1 -3.13% 0.2 � 81.9 9.6 8.6 A
A2047 Kingston Cresent to M275 NB Service Road E-S WBL 101211 1010121 65 76 -11 -14.47% 1.3 � 81.9 9.6 2.5 A
A2047 Kingston Cresent to A2047 Kingston Cresent E-SE WBL 101211 101222 0 0 0 0.00% 0.0 � 81.9 9.6 0.0 A
A2047 Kingston Cresent to A3 Twyford Avenue E-NE WBU 101211 101621 88 85 3 3.53% 0.3 � 81.9 9.6 19.0 C
A2047 Kingston Cresent to M275 SB Service Road E-NW WBR 101211 101711 349 349 0 0.00% 0.0 � 81.9 9.6 18.4 C
M275 SB Service Road to Wharf Road NW-W SBR 101311 101412 124 117 7 5.98% 0.6 � 96.8 1.7 5.4 A
M275 SB Service Road to A3 Twyford Avenue NW-NE SBL 101311 101621 81 79 2 2.53% 0.2 � 96.8 1.7 9.5 A
M275 SB Service Road to M275 SB Service Road NW-NW SBU 101311 101711 15 17 -2 -11.76% 0.5 � 96.8 1.7 5.8 A
M275 SB Service Road to A2047 Kingston Cresent NW-SE SBL 101311 101222 299 300 -1 -0.33% 0.1 � 96.8 1.7 12.2 B
M275 SB Service Road to M275 NB Service Road NW-S SBT 101311 1010121 73 65 8 12.31% 1.0 � 96.8 1.7 8.8 A
A3 Twyford Avenue to Wharf Road NE-W WBT 101321 101412 25 24 1 4.17% 0.2 � 219.3 3.6 17.9 C
A3 Twyford Avenue to A3 Twyford Avenue NE-NE WBU 101321 101621 21 23 -2 -8.70% 0.4 � 219.3 3.6 19.8 C
A3 Twyford Avenue to M275 SB Service Road NE-NW WBR 101321 101711 128 125 3 2.40% 0.3 � 219.3 3.6 20.1 C
A3 Twyford Avenue to A2047 Kingston Cresent NE-SE WBL 101321 101222 127 131 -4 -3.05% 0.4 � 219.3 3.6 15.4 C
A3 Twyford Avenue to M275 NB Service Road NE-S WBU 101321 1010121 477 470 7 1.49% 0.3 � 219.3 3.6 21.9 C
Wharf Road to Wharf Road W-W EBU 101531 101412 4 4 0 0.00% 0.0 � 46.2 0.5 30.7 D
Wharf Road to A3 Twyford Avenue W-NE EBT 101531 101621 30 28 2 7.14% 0.4 � 46.2 0.5 31.1 D
Wharf Road to M275 SB Service Road W-NW EBL 101531 101711 62 59 3 5.08% 0.4 � 46.2 0.5 25.9 D
Wharf Road to A2047 Kingston Cresent W-SE EBT 101531 101222 10 11 -1 -9.09% 0.3 � 46.2 0.5 33.9 D
Wharf Road to M275 NB Service Road W-S WBR 101531 1010121 53 57 -4 -7.02% 0.5 � 46.2 0.5 33.7 D
M275 NB Service Road to Wharf Road S-W NBL 101423 101412 85 87 -2 -2.30% 0.2 � 21.5 0.0 2.3 A
M275 NB Service Road to A3 Twyford Avenue S-NE NBR 101423 101621 219 209 10 4.78% 0.7 � 21.5 0.0 10.6 B
M275 NB Service Road to M275 SB Service Road S-NW NBT 101423 101711 81 90 -9 -10.00% 1.0 � 21.5 0.0 7.1 A
M275 NB Service Road to A2047 Kingston Cresent S-SE NBR 101423 101222 51 54 -3 -5.56% 0.4 � 21.5 0.0 12.3 B
M275 NB Service Road to M275 NB Service Road S-S NBU 101423 1010121 14 32 -18 -56.25% 3.8 � 21.5 0.0 9.1 A
All 0 0 5881 5644 237 4% - - 219.3 2.9 7.3 A
502 Mile End Roundabout Mile End Road to Mile End Road N-N SBU 100613 100612 104 101 3 2.97% 0.3 � 130.8 11.4 54.3 D
Mile End Road to Commercial Road N-S SBT 100613 100111 1846 1835 11 0.60% 0.3 � 130.8 11.4 12.3 B
Mile End Road to Church Street N-E SBL 100613 100311 530 513 17 3.31% 0.7 � 130.8 11.4 16.8 B
Hope Street to Mile End Road SW-N NBT 100033 100612 996 1008 -12 -1.19% 0.4 � 180.0 13.5 15.1 B
Hope Street to Mile End Road SW-N NBT 100641 100612 0 0 0 0.00% 0.0 � 28.1 0.3 0.0 A
Hope Street to Commercial Road SW-S NBU 100641 100111 8 21 -13 -61.90% 3.4 � 28.1 0.3 104.0 F
Hope Street to Church Street SW-E NBR 100641 100311 18 22 -4 -18.18% 0.9 � 28.1 0.3 86.5 F
Commercial Road to Mile End Road S-N NBT 100632 100612 242 199 43 21.61% 2.9 � 37.1 0.4 39.2 D
Commercial Road to Commercial Road S-S NBU 100632 100111 0 4 -4 -100.00% 2.8 � 37.1 0.4 0.0 A
Commercial Road to Church Street S-E NBR 100632 100311 2 4 -2 -50.00% 1.2 � 37.1 0.4 67.5 E
Church Street to Mile End Road E-N WBR 100621 100612 493 391 102 26.09% 4.9 � 231.5 181.6 417.0 F
Church Street to Commercial Road E-S WBL 100621 100111 20 22 -2 -9.09% 0.4 � 231.5 181.6 397.7 F
Church Street to Church Street E-E WBU 100621 100311 0 0 0 0.00% 0.0 � 231.5 181.6 0.0 A
All 0 0 4257 4120 137 3.33% - - 231.5 45.7 65.3 E
503 Cascade's Approach Cascade's Approach to Cascade's Approach S-SW NBL 100826 100827 0 0 0 0.00% 0.0 � 25.1 0.6 0.0 A
Cascade's Approach to Marketway WB S-E NBR 100826 100801 23 21 2 9.52% 0.4 � 25.1 0.6 14.5 B
Cascade's Approach to Marketway EB S-W NBL 100826 100825 13 15 -2 -13.33% 0.5 � 25.1 0.6 7.9 A
Marketway WB to Cascade's Approach NE-SW WBT 2 100827 135 136 -1 -0.74% 0.1 � 227.2 10.8 5.7 A
Marketway WB to Marketway WB NE-E WBL 2 100801 43 46 -3 -6.52% 0.4 � 227.2 10.8 14.0 B
Marketway WB to Marketway EB NE-W WBT 2 100825 1501 1498 3 0.20% 0.1 � 227.2 10.8 13.6 B
Marketway EB to Cascade's Approach SW-SW EBU 100824 100827 34 34 0 0.00% 0.0 � 43.4 0.2 4.4 A
Marketway EB to Hope Street SW-N EBL 100042 100042 951 991 -40 -4.04% 1.3 � 0.0 0.0 2.6 A
Marketway WB to Marketway EB NE-W WBT 2 79 31 32 -1 -3.13% 0.2 � 146.1 0.2 6.3 A
Marketway EB to Marketway WB SW-E EBT 100824 100801 132 117 15 12.82% 1.3 � 43.4 0.2 4.1 A
Marketway EB to Marketway EB SW-W NBL 100824 100825 4 19 -15 -78.95% 4.4 � 43.4 0.2 5.6 A
All 0 0 2867 2909 -42 -1.44% - - 227.2 3.2 9.0 A
504 Marketway Roundabout Commercial Road NB to Commercial Road SB S-N NBT 100805 100113 6 7 -1 -14.29% 0.4 � 38.7 3.0 48.6 E
Commercial Road NB to Marketway S-W NBL 100805 1 13 13 0 0.00% 0.0 � 38.7 3.0 44.7 E
Commercial Road NB to Cornmill street S-SE NBR 100805 100808 9 8 1 12.50% 0.3 � 38.7 3.0 28.0 D
Commercial Road SB to Commercial Road SB N-N SBU 100111 100113 52 54 -2 -3.70% 0.3 � 225.5 8.5 15.9 C
Commercial Road SB to Marketway N-W SBR 100111 1 1564 1560 4 0.26% 0.1 � 225.5 8.5 17.4 C
Commercial Road SB to Cornmill street N-SE SBT 100111 100808 270 268 2 0.75% 0.1 � 225.5 8.5 11.5 B
Marketway to Commercial Road SB W-N EBL 100804 100113 65 71 -6 -8.45% 0.7 � 102.6 0.9 9.0 A
Marketway to Marketway W-W EBU 100804 1 2 7 -5 -71.43% 2.4 � 102.6 0.9 7.2 A
Marketway to Cornmill street W-SE EBT 100804 100808 91 101 -10 -9.90% 1.0 � 102.6 0.9 12.7 B
Cornmill street to Commercial Road NB E-SW WBT 100806 100807 4 0 4 0.00% 2.8 � 159.2 5.4 2.2 A
Cornmill street to Commercial Road SB E-N WBR 100806 100113 201 174 27 15.52% 2.0 � 173.4 9.0 17.9 C
Cornmill street to Marketway E-W WBT 100806 1 178 157 21 13.38% 1.6 � 173.4 9.0 17.1 C
Cornmill street to Cornmill street E-SE WBL 100806 100808 0 0 0 0.00% 0.0 � 173.4 9.0 0.0 A
All 0 0 2455 2420 35 1.45% - - 225.5 5.4 16.6 C
505 A2030 roundabout Lake Road NB to Lake Road NB SW-W NBL 100814 100818 0 0 0 0.00% 0.0 � 81.5 3.0 0.0 A
Lake Road NB to Cornmill street SW-NW EBL 100814 100806 89 85 4 4.71% 0.4 � 81.5 3.0 29.7 D
Lake Road NB to Lake Road SB SW-E EBT 100814 100816 90 90 0 0.00% 0.0 � 81.5 3.0 13.1 B
Cornmill street to Lake Road NB NW-W SBR 100808 100818 82 80 2 2.50% 0.2 � 82.6 1.8 7.6 A
Cornmill street to Cornmill street NW-NW SBU 100808 100806 1 0 1 0.00% 1.4 � 82.6 1.8 32.3 D
Cornmill street to Lake Road SB NW-E SBL 100808 100816 289 297 -8 -2.69% 0.5 � 82.6 1.8 6.5 A
Lake Road SB to Lake Road NB E-W WBT 100817 100818 50 46 4 8.70% 0.6 � 231.5 15.3 28.6 D
Lake Road SB to Cornmill street E-NW WBT 100817 100806 289 246 43 17.48% 2.6 � 231.5 15.3 40.7 E
Lake Road SB to Lake Road SB E-E WBU 100817 100816 0 0 0 0.00% 0.0 � 231.5 15.3 0.0 A
All 0 0 889 844 45 5.33% - - 231.5 6.7 22.3 C
506 Holbrook Road Roundabout Lake Road SB to Lake Road SB NE-E WBL 100820 100819 2 2 0 0.00% 0.0 � 231.5 84.7 124.7 F
Lake Road SB to Holbrook Road NE-S WBR 100820 100821 173 159 14 8.81% 1.1 � 231.5 84.7 129.5 F
Lake Road SB to Church Street NE-NW WBR 100820 100313 59 57 2 3.51% 0.3 � 231.5 84.7 123.2 F
Lake Road SB to Lake Road NB NE-W WBT 100820 100817 207 198 9 4.55% 0.6 � 231.5 84.7 124.1 F
Holbrook Road to Lake Road SB SE-E NBR 100847 100819 194 178 16 8.99% 1.2 � 235.9 72.0 139.8 F
Holbrook Road to Holbrook Road SE-S NBL 100847 100821 1 1 0 0.00% 0.0 � 235.9 72.0 5.0 A
Holbrook Road to Church Street SE-NW NBT 100847 100313 378 327 51 15.60% 2.7 � 235.9 72.0 149.0 F
Holbrook Road to Lake Road NB SE-W NBL 100847 100817 102 81 21 25.93% 2.2 � 235.9 72.0 124.2 F
Church Street to Lake Road SB NW-E SBL 100311 100819 79 80 -1 -1.25% 0.1 � 230.9 17.1 53.7 F
Church Street to Holbrook Road NW-S SBT 100311 100821 427 421 6 1.43% 0.3 � 230.9 17.1 45.0 E
Church Street to Church Street NW-NW SBU 100311 100313 1 1 0 0.00% 0.0 � 230.9 17.1 14.5 B
Church Street to Lake Road NB NW-W SBR 100311 100817 13 13 0 0.00% 0.0 � 230.9 17.1 48.5 E
Lake Road NB to Lake Road SB SW-E EBT 100816 100819 153 155 -2 -1.29% 0.2 � 231.5 12.9 21.1 C
Lake Road NB to Holbrook Road SW-S EBR 100816 100821 222 223 -1 -0.45% 0.1 � 231.5 12.9 22.5 C
Lake Road NB to Church Street SW-NW EBL 100816 100313 9 9 0 0.00% 0.0 � 231.5 12.9 21.0 C
Lake Road NB to Lake Road NB SW-W NBL 100816 100817 0 0 0 0.00% 0.0 � 231.5 12.9 0.0 A
All 0 0 2020 1905 115 6.04% - - 235.9 46.7 91.0 F
507 Unicorn Road Unicorn Road WB to Market Way NW-NE SBL 100837 100035 49 50 -1 -2.00% 0.1 � 34.3 2.3 35.3 D
Unicorn Road WB to Unicorn Road EB NW-S SBT 100837 100840 20 18 2 11.11% 0.5 � 27.4 2.5 40.4 D
Unicorn Road WB to Alfred Road NW-SW SBR 100837 100843 26 25 1 4.00% 0.2 � 27.4 2.5 43.0 D
Market Way to Unicorn Road WB NE-NW WBR 100825 100841 41 46 -5 -10.87% 0.8 � 223.2 10.9 51.1 D
Market Way to Unicorn Road EB NE-S WBU 100825 100840 346 331 15 4.53% 0.8 � 223.2 10.9 9.7 A
Market Way to Alfred Road NE-SW WBT 100825 100843 1192 1155 37 3.20% 1.1 � 223.2 10.9 20.0 C
Unicorn Road EB to Unicorn Road WB S-NW NBT 100851 100841 17 18 -1 -3.77% 0.2 � 65.5 9.2 42.9 D
Unicorn Road EB to Market Way S-NE NBR 100851 100035 125 134 -9 -6.72% 0.8 � 65.5 9.2 42.5 D
Unicorn Road EB to Alfred Road S-SW NBL 100851 100843 16 22 -6 -27.27% 1.4 � 50.8 0.9 39.0 D
Alfred Road to Unicorn Road WB SW-NW EBL 100037 100841 67 61 6 9.84% 0.8 � 167.0 13.6 16.1 B
Alfred Road to Market Way SW-NE EBT 100037 100035 942 977 -35 -3.58% 1.1 � 167.0 13.6 15.9 B
All 0 0 2841 2837 4.3333333 0.15% - - 223.2 7.9 19.6 B
508 Stanhope Road Stanhope Road to Stanhope Road S-S NBU 100849 100850 0 1 -1 -100.00% 1.4 � 23.9 0.1 0.0 A
Stanhope Road to Edinburgh Road WB S-SE NBR 100849 100853 0 5 -5 -100.00% 3.2 � 23.9 0.1 0.0 A
Stanhope Road to Unicorn road S-N NBT 100849 100842 130 135 -5 -3.70% 0.4 � 23.9 0.1 4.4 A
Stanhope Road to Edinburgh Road EB S-W NBL 100849 100854 8 25 -17 -68.00% 4.2 � 23.9 0.1 16.8 C
Edinburgh Road WB to Stanhope Road E-S WBL 100852 100850 15 7 8 114.29% 2.4 � 72.7 0.5 11.8 B
Edinburgh Road WB to Edinburgh Road WB E-SE WBL 100852 100853 0 1 -1 -100.00% 1.4 � 72.7 0.5 0.0 A
Edinburgh Road WB to Unicorn road E-N WBR 100852 100842 27 33 -6 -18.18% 1.1 � 72.7 0.5 16.0 C
Edinburgh Road WB to Edinburgh Road EB E-W WBT 100852 100854 58 34 24 70.59% 3.5 � 72.7 0.5 18.3 C
Unicorn road to Stanhope Road N-S SBT 100848 100850 320 291 29 9.97% 1.7 � 27.2 0.1 1.4 A
Unicorn road to Edinburgh Road WB N-SE SBT 100848 100853 22 41 -19 -46.34% 3.4 � 27.2 0.1 1.7 A
Unicorn road to Unicorn road N-N SBU 100848 100842 0 3 -3 -100.00% 2.4 � 27.2 0.1 0.0 A
Unicorn road to Edinburgh Road EB N-W SBR 100848 100854 24 14 10 71.43% 2.3 � 27.2 0.1 1.5 A
Edinburgh Road EB to Stanhope Road W-S EBR 100855 100850 8 14 -6 -41.46% 1.7 � 42.7 0.2 12.7 B
Edinburgh Road EB to Edinburgh Road WB W-SE EBT 100855 100853 28 28 0 1.20% 0.1 � 42.7 0.2 13.4 B
Edinburgh Road EB to Unicorn road W-N EBL 100855 100842 0 3 -3 -100.00% 2.3 � 42.7 0.2 0.0 A
Edinburgh Road EB to Edinburgh Road EB W-W EBU 100855 100854 0 0 0 0.00% 0.0 � 42.7 0.2 0.0 A
All 0 0 639 634 5 0.79% - - 72.7 0.2 5.2 A
509 Queen Street Queen St to Alfred Road W-NE EBL 100039 100037 236 227 9 3.96% 0.6 � 57.9 7.1 23.2 C
Queen St to Bishop Crispian Way W-E EBT 100039 100855 37 44 -7 -15.91% 1.1 � 49.1 5.5 72.3 E
Alfred Road to Queen St NE-W WBT 97 100863 321 314 7 2.23% 0.4 � 234.3 42.6 61.8 E
Alfred Road to Anglesea Road NE-S WBR 100844 100862 933 888 45 5.07% 1.5 � 230.5 18.5 11.8 B
Bishop Crispian Way to Queen St E-W WBT 100857 100863 90 73 17 23.29% 1.9 � 102.0 11.0 59.7 E
Anglesea Road to Queen St S-W NBL 100859 100863 37 37 0 0.00% 0.0 � 75.9 0.5 12.8 B
Anglesea Road to Alfred Road S-NE NBR 100859 100037 773 811 -38 -4.69% 1.4 � 116.1 7.9 13.0 B
All 0 0 2427 2394 33 1.38% - - 234.3 13.3 22.7 C
510 St Michael's Gyratory St Paul's Road to Wiltshire Street S-E NBR 11 9 0 0 0 0.00% 0.0 � 17.3 0.1 0.0 A
St Paul's Road to Waltham St S-S NBU 11 10 0 0 0 0.00% 0.0 � 17.3 0.1 0.0 A
St Paul's Road to Guildhall Walk S-NE NBT 11 12 0 0 0 0.00% 0.0 � 17.3 0.1 0.0 A
St Paul's Road to Cambridge Road S-SW NBL 11 100883 0 0 0 0.00% 0.0 � 17.3 0.1 0.0 A
St Paul's Road to Hampshire Terrace S-S NBU 11 100889 0 0 0 0.00% 0.0 � 17.3 0.1 0.0 A
St Paul's Road to Winston churchill avenue S-E NBR 11 100902 0 0 0 0.00% 0.0 � 17.3 0.1 0.0 A
St Paul's Road to Anglesea Road S-N NBT 11 100859 44 43 1 2.33% 0.2 � 17.3 0.1 8.2 A
Cambridge Road to Wiltshire Street SW-E EBT 100882 9 7 8 -1 -12.50% 0.4 � 96.8 1.2 22.3 C
Cambridge Road to Waltham St SW-S EBR 100882 10 0 0 0 0.00% 0.0 � 96.8 1.2 0.0 A
Cambridge Road to Guildhall Walk SW-NE EBT 100882 12 23 21 2 9.52% 0.4 � 96.8 1.2 23.5 C
Cambridge Road to Cambridge Road SW-SW EBU 100882 100883 0 0 0 0.00% 0.0 � 96.8 1.2 0.0 A
Cambridge Road to Hampshire Terrace SW-S EBR 100882 100889 8 7 1 14.29% 0.4 � 96.8 1.2 24.2 C
Cambridge Road to Winston churchill avenue SW-E EBT 100882 100902 122 117 5 4.27% 0.5 � 96.8 1.2 22.7 C
Cambridge Road to Anglesea Road SW-N EBL 100882 100859 252 255 -3 -1.18% 0.2 � 96.8 1.2 10.1 B
Hampshire Terrace to Wiltshire Street S-E NBR 100888 9 3 3 0 0.00% 0.0 � 225.2 12.4 29.2 D
Hampshire Terrace to Waltham St S-S NBU 100888 10 1 1 0 0.00% 0.0 � 225.2 12.4 20.0 C
Hampshire Terrace to Guildhall Walk S-NE NBT 100888 12 25 25 0 0.00% 0.0 � 225.2 12.4 33.5 D
Hampshire Terrace to Cambridge Road S-SW NBL 100888 100883 11 10 1 10.00% 0.3 � 225.2 12.4 17.6 C
Hampshire Terrace to Hampshire Terrace S-S NBU 100888 100889 4 3 1 33.33% 0.5 � 225.2 12.4 27.9 D
Hampshire Terrace to Winston churchill avenue S-E NBR 100888 100902 73 73 0 0.00% 0.0 � 225.2 12.4 38.4 E
Hampshire Terrace to Anglesea Road S-N NBT 100888 100859 342 334 8 2.40% 0.4 � 225.2 12.4 24.3 C
Winston churchill avenue to Wiltshire Street E-E WBU 100907 9 7 7 0 0.00% 0.0 � 62.9 6.7 24.7 C
Winston churchill avenue to Waltham St E-S WBL 100907 10 16 15 1 6.67% 0.3 � 62.9 6.7 16.2 B
Winston churchill avenue to Guildhall Walk E-NE WBR 100907 12 21 18 3 16.67% 0.7 � 62.9 6.7 41.5 D
Winston churchill avenue to Cambridge Road E-SW WBT 100907 100883 148 146 2 1.37% 0.2 � 62.9 6.7 31.3 C
Winston churchill avenue to Hampshire Terrace E-S WBL 100907 100889 102 104 -2 -1.92% 0.2 � 62.9 6.7 23.0 C
Winston churchill avenue to Winston churchill avenue E-E WBU 100907 100902 14 14 0 0.00% 0.0 � 62.9 6.7 42.4 D
Winston churchill avenue to Anglesea Road E-N WBR 100907 100859 84 82 2 2.44% 0.2 � 62.9 6.7 30.7 C
Anglesea Road to Wiltshire Street N-E SBL 100869 9 43 42 1 2.38% 0.2 � 79.4 0.9 18.7 C
Anglesea Road to Waltham St N-S SBT 100869 10 0 0 0 0.00% 0.0 � 79.4 0.9 0.0 A
Anglesea Road to Guildhall Walk N-NE SBL 100869 12 80 77 3 3.90% 0.3 � 79.4 0.9 13.5 B
Anglesea Road to Cambridge Road N-SW SBR 100869 100883 155 136 19 13.97% 1.6 � 79.4 0.9 22.7 C
Anglesea Road to Hampshire Terrace N-S SBT 100869 100889 343 316 27 8.54% 1.5 � 79.4 0.9 18.3 C
Anglesea Road to Winston churchill avenue N-E SBL 100869 100902 130 118 12 10.17% 1.1 � 79.4 0.9 11.6 B
Anglesea Road to Anglesea Road N-N SBU 100869 100859 49 48 1 2.08% 0.1 � 79.4 0.9 24.8 C
All 0 0 2104 2023 81 4.00% - - 225.2 4.3 21.3 C
511 Park Road Park Road to Anglesea Road W-N EBL 100879 100859 129 132 -3 -2.27% 0.3 � 73.8 7.1 34.6 C
Anglesea Road SB to Park Road N-W SBR 100862 100880 152 136 16 11.76% 1.3 � 230.8 16.4 54.8 D
Anglesea Road SB to Anglesea Road SB N-S SBT 100862 100865 800 752 48 6.38% 1.7 � 230.8 16.4 9.9 A
Anglesea Road to Park Road S-W NBL 100859 100880 54 54 0 0.00% 0.0 � 86.9 5.2 10.3 B
Anglesea Road to Anglesea Road S-N NBT 100859 100859 677 716 -39 -5.45% 1.5 � 86.9 5.2 8.8 A
All 0 0 1811 1790 21 1.17% - - 230.8 10.0 15.1 B
512 Princess Royal Road Princess Royal Road to Mile end Road NB W-N EBL 100681 101021 132 133 -1 -0.75% 0.1 � 51.0 4.2 20.9 C
Mile end Road SB to Princess Royal Road NE-W WBT 4 100682 215 208 7 3.37% 0.5 � 41.1 4.1 20.5 C
Mile end Road NB to Princess Royal Road S-W NBL 3 100682 137 98 39 39.80% 3.6 � 42.4 0.8 6.7 A
Mile end Road NB to Mile end Road NB S-N NBT 100612 101021 1702 1500 202 13.47% 5.0 � 160.7 6.2 7.4 A
All 0 0 2186 1939 247 12.74% - - 160.7 3.8 9.4 A
0 Network Total All 30378 29459 919 3.12% - 99% 235.9 11.9 26.3 D
Overall Total 103599 106476 -2877 -2.70% - 100% 235.9 13.8 26.0 D
09
:00
-10
:00
26/09/2014 11:45 Node Evaluation Results_AM.xlsm

From To Direction Lower Upper Accept
Winston Churchill Avenue Anglesea Road Northbound 39 40 34 46 �
Anglesea Road Queen Street (NB) Northbound 118 186 119 252 �
Queen Street (NB) Cascade's Approach Northbound 185 263 181 345 �
Cascade's Approach Marketway Roundabout Northbound 212 301 210 391 �
Marketway Roundabout Mile End Roundabout Northbound 276 386 242 529 �
Mile End Roundabout Princess Royal Road Northbound 307 418 267 569 �
Princess Royal Road Rudmore Roundabout Northbound 365 488 326 648 �
Rudmore Roundabout Princess Royal Road Southbound 39 41 35 47 �
Princess Royal Road Mile End Roundabout Southbound 60 67 51 84 �
Mile End Roundabout Marketway Roundabout Southbound 92 107 79 134 �
Marketway Roundabout Cascade's Approach Southbound 127 135 105 164 �
Cascade's Approach Queen Street(SB) Southbound 185 211 162 258 �
Queen Street(SB) Anglesea Road Southbound 235 250 197 302 �
Anglesea Road Winston Churchill Avenue Southbound 250 265 208 322 �
92.9%
Winston Churchill Avenue Anglesea Road Northbound 48 53 41 64 �
Anglesea Road Queen Street (NB) Northbound 128 196 124 269 �
Queen Street (NB) Cascade's Approach Northbound 196 283 180 386 �
Cascade's Approach Marketway Roundabout Northbound 225 311 198 424 �
Marketway Roundabout Mile End Roundabout Northbound 306 373 233 514 �
Mile End Roundabout Princess Royal Road Northbound 332 404 250 559 �
Princess Royal Road Rudmore Roundabout Northbound 387 470 299 640 �
Rudmore Roundabout Princess Royal Road Southbound 40 41 35 47 �
Princess Royal Road Mile End Roundabout Southbound 62 70 60 81 �
Mile End Roundabout Marketway Roundabout Southbound 112 127 108 146 �
Marketway Roundabout Cascade's Approach Southbound 160 174 148 200 �
Cascade's Approach Queen Street(SB) Southbound 246 245 208 281 �
Queen Street(SB) Anglesea Road Southbound 317 320 271 368 �
Anglesea Road Winston Churchill Avenue Southbound 335 330 280 379 �
100.0%
Winston Churchill Avenue Anglesea Road Northbound 44 42 34 50 �
Anglesea Road Queen Street (NB) Northbound 98 131 106 155 �
Queen Street (NB) Cascade's Approach Northbound 155 182 148 215 �
Cascade's Approach Marketway Roundabout Northbound 184 209 167 251 �
Marketway Roundabout Mile End Roundabout Northbound 255 258 197 321 �
Mile End Roundabout Princess Royal Road Northbound 280 290 219 361 �
Princess Royal Road Rudmore Roundabout Northbound 323 341 260 423 �
Rudmore Roundabout Princess Royal Road Southbound 40 39 33 45 �
Princess Royal Road Mile End Roundabout Southbound 61 65 52 78 �
Mile End Roundabout Marketway Roundabout Southbound 100 96 78 113 �
Marketway Roundabout Cascade's Approach Southbound 143 128 101 154 �
Cascade's Approach Queen Street(SB) Southbound 215 193 155 232 �
Queen Street(SB) Anglesea Road Southbound 268 248 196 300 �
Anglesea Road Winston Churchill Avenue Southbound 285 263 203 323 �
92.9%
95.2%
Overall 0700-0800
Overall 0800-0900
Overall 0900-1000
Overall 0700-1000
Description
Average Limits 95% or 15%Weighted Model
Average
Average Journey Times (secs) All Vehicles
Observed
Average
26/09/2014 11:48 Travel Time & Delay Summary_AM.xlsm

0
100
200
300
400
500
600
Winston ChurchillAvenue
Anglesea Road Queen Street (NB) Cascade's Approach Marketway Roundabout Mile End Roundabout Princess Royal Road
Avera
ge T
ravel T
ime (
sec)
Location
0700-0800 Northbound Travel Time Comparison
Modelled
Observed Average

0
100
200
300
400
500
600
Winston ChurchillAvenue
Anglesea Road Queen Street (NB) Cascade's Approach MarketwayRoundabout
Mile End Roundabout Princess Royal Road
Av
era
ge T
rav
el T
ime (
sec)
Location
0800-0900 Northbound Travel Time Comparison
Model Average
Observed Average

0
100
200
300
400
500
600
Winston ChurchillAvenue
Anglesea Road Queen Street (NB) Cascade's Approach Marketway Roundabout Mile End Roundabout Princess Royal Road
Avera
ge T
ravel T
ime (
sec)
Location
0900-1000 Northbound Travel Time Comparison
Model Average
Observed Average

0
50
100
150
200
250
300
350
400
Rudmore Roundabout Princess Royal Road Mile End Roundabout Marketway Roundabout Cascade's Approach Queen Street(SB) Anglesea Road
Avera
ge T
ravel T
ime (
sec)
Location
0700-0800 Southbound Travel Time Comparison
Modelled
Observed Average

0
50
100
150
200
250
300
350
400
Rudmore Roundabout Princess Royal Road Mile End Roundabout Marketway Roundabout Cascade's Approach Queen Street(SB) Anglesea Road
Avera
ge T
ravel T
ime (
sec)
Location
0700-0800 Southbound Travel Time Comparison
Modelled
Observed Average

0
50
100
150
200
250
300
350
400
Rudmore Roundabout Princess Royal Road Mile End Roundabout Marketway Roundabout Cascade's Approach Queen Street(SB) Anglesea Road
Av
era
ge T
rav
el T
ime (
sec)
Location
0800-0900 Southbound Travel Time Comparison
Modelled Average
Observed Average

0
50
100
150
200
250
300
350
400
Rudmore Roundabout Princess Royal Road Mile End Roundabout Marketway Roundabout Cascade's Approach Queen Street(SB) Anglesea Road
Avera
ge T
ravel T
ime (
sec)
Location
0900-1000 Southbound Travel Time Comparison
Model Average
Observed Average
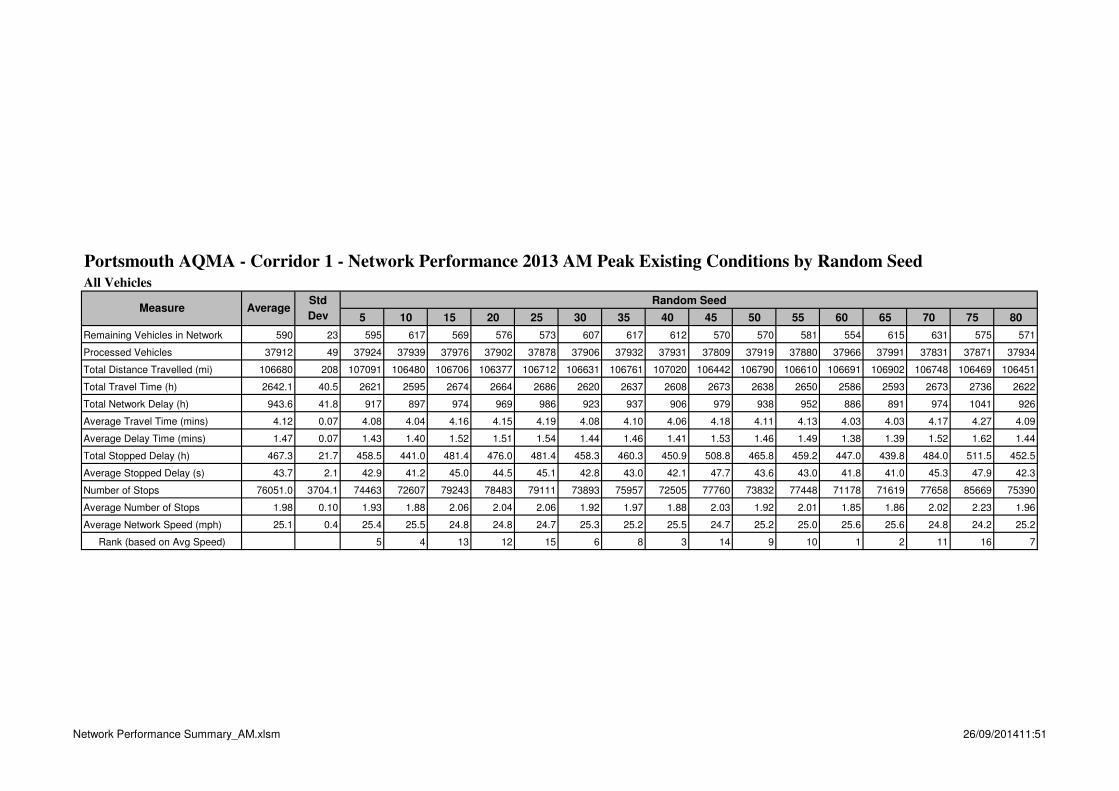
Portsmouth AQMA - Corridor 1 - Network Performance 2013 AM Peak Existing Conditions by Random SeedAll Vehicles
Std Random Seed
Dev 5 10 15 20 25 30 35 40 45 50 55 60 65 70 75 80
Remaining Vehicles in Network 590 23 595 617 569 576 573 607 617 612 570 570 581 554 615 631 575 571
Processed Vehicles 37912 49 37924 37939 37976 37902 37878 37906 37932 37931 37809 37919 37880 37966 37991 37831 37871 37934
Total Distance Travelled (mi) 106680 208 107091 106480 106706 106377 106712 106631 106761 107020 106442 106790 106610 106691 106902 106748 106469 106451
Total Travel Time (h) 2642.1 40.5 2621 2595 2674 2664 2686 2620 2637 2608 2673 2638 2650 2586 2593 2673 2736 2622
Total Network Delay (h) 943.6 41.8 917 897 974 969 986 923 937 906 979 938 952 886 891 974 1041 926
Average Travel Time (mins) 4.12 0.07 4.08 4.04 4.16 4.15 4.19 4.08 4.10 4.06 4.18 4.11 4.13 4.03 4.03 4.17 4.27 4.09
Average Delay Time (mins) 1.47 0.07 1.43 1.40 1.52 1.51 1.54 1.44 1.46 1.41 1.53 1.46 1.49 1.38 1.39 1.52 1.62 1.44
Total Stopped Delay (h) 467.3 21.7 458.5 441.0 481.4 476.0 481.4 458.3 460.3 450.9 508.8 465.8 459.2 447.0 439.8 484.0 511.5 452.5
Average Stopped Delay (s) 43.7 2.1 42.9 41.2 45.0 44.5 45.1 42.8 43.0 42.1 47.7 43.6 43.0 41.8 41.0 45.3 47.9 42.3
Number of Stops 76051.0 3704.1 74463 72607 79243 78483 79111 73893 75957 72505 77760 73832 77448 71178 71619 77658 85669 75390
Average Number of Stops 1.98 0.10 1.93 1.88 2.06 2.04 2.06 1.92 1.97 1.88 2.03 1.92 2.01 1.85 1.86 2.02 2.23 1.96
Average Network Speed (mph) 25.1 0.4 25.4 25.5 24.8 24.8 24.7 25.3 25.2 25.5 24.7 25.2 25.0 25.6 25.6 24.8 24.2 25.2
Rank (based on Avg Speed) 5 4 13 12 15 6 8 3 14 9 10 1 2 11 16 7
AverageMeasure
Network Performance Summary_AM.xlsm 26/09/201411:51

53
Portsmouth Corridor 1 Air Quality Management Area VISSIM Model Assessment
C. 2013 Existing PM Peak Model Output Results

Portsmouth AQMA - Corridor 1 - Existing Conditions 2013 PM Peak
Links Volume Queue Length (m) Delay (secs)
Time Node Description Direction Movement From To Model Count Mod-Cnt % Diff* GEH Accept Max Average Average LOS†
501 Rudmore Roundabout M275 SB to M275 NB NW-S SBT 101011 101011 1957 1979 -22 -1.11% 0.5 � 235.8 1.0 2.1 A
M275 NB to M275 SB S-NW SBT 101022 101022 3220 3298 -78 -2.37% 1.4 � 0.0 0.0 2.6 A
A2047 Kingston Cresent to Wharf Road E-W WBT 101211 101412 2 2 0 0.00% 0.0 � 77.1 8.4 4.9 A
A2047 Kingston Cresent to M275 NB Service Road E-S WBL 101211 1010121 65 77 -12 -15.58% 1.4 � 77.1 8.4 2.8 A
A2047 Kingston Cresent to A2047 Kingston Cresent E-SE WBL 101211 101222 0 0 0 0.00% 0.0 � 77.1 8.4 0.0 A
A2047 Kingston Cresent to A3 Twyford Avenue E-NE WBU 101211 101621 138 130 8 6.15% 0.7 � 77.1 8.4 17.0 C
A2047 Kingston Cresent to M275 SB Service Road E-NW WBR 101211 101711 451 433 18 4.16% 0.9 � 77.1 8.4 15.0 C
M275 SB Service Road to Wharf Road NW-W SBR 101311 101412 110 109 1 0.92% 0.1 � 235.7 112.0 70.8 F
M275 SB Service Road to A3 Twyford Avenue NW-NE SBL 101311 101621 235 250 -15 -6.00% 1.0 � 235.7 112.0 157.5 F
M275 SB Service Road to M275 SB Service Road NW-NW SBU 101311 101711 30 28 2 7.14% 0.4 � 235.7 112.0 76.4 F
M275 SB Service Road to A2047 Kingston Cresent NW-SE SBL 101311 101222 399 401 -2 -0.50% 0.1 � 235.7 112.0 95.8 F
M275 SB Service Road to M275 NB Service Road NW-S SBT 101311 1010121 41 49 -8 -16.33% 1.2 � 235.7 112.0 78.6 F
A3 Twyford Avenue to Wharf Road NE-W WBT 101321 101412 15 14 1 7.14% 0.3 � 213.9 3.5 17.9 C
A3 Twyford Avenue to A3 Twyford Avenue NE-NE WBU 101321 101621 9 7 2 28.57% 0.7 � 213.9 3.5 24.5 C
A3 Twyford Avenue to M275 SB Service Road NE-NW WBR 101321 101711 122 122 0 0.00% 0.0 � 213.9 3.5 20.5 C
A3 Twyford Avenue to A2047 Kingston Cresent NE-SE WBL 101321 101222 131 132 -1 -0.76% 0.1 � 213.9 3.5 12.9 B
A3 Twyford Avenue to M275 NB Service Road NE-S WBU 101321 1010121 368 372 -4 -1.08% 0.2 � 213.9 3.5 20.3 C
Wharf Road to Wharf Road W-W EBU 101531 101412 0 0 0 0.00% 0.0 � 122.8 4.8 5.6 A
Wharf Road to A3 Twyford Avenue W-NE EBT 101531 101621 43 46 -3 -6.52% 0.4 � 122.8 4.8 45.8 E
Wharf Road to M275 SB Service Road W-NW EBL 101531 101711 334 326 8 2.45% 0.4 � 122.8 4.8 31.9 D
Wharf Road to A2047 Kingston Cresent W-SE EBT 101531 101222 52 52 0 0.00% 0.0 � 122.8 4.8 54.6 F
Wharf Road to M275 NB Service Road W-S WBR 101531 1010121 104 110 -6 -5.45% 0.6 � 122.8 4.8 48.1 E
M275 NB Service Road to Wharf Road S-W NBL 101423 101412 80 77 3 3.90% 0.3 � 148.6 5.2 3.4 A
M275 NB Service Road to A3 Twyford Avenue S-NE NBR 101423 101621 499 526 -27 -5.13% 1.2 � 148.6 5.2 34.7 D
M275 NB Service Road to M275 SB Service Road S-NW NBT 101423 101711 89 126 -37 -29.37% 3.6 � 148.6 5.2 10.0 A
M275 NB Service Road to A2047 Kingston Cresent S-SE NBR 101423 101222 136 148 -12 -8.11% 1.0 � 148.6 5.2 17.9 C
M275 NB Service Road to M275 NB Service Road S-S NBU 101423 1010121 4 0 4 0.00% 2.8 � 148.6 5.2 28.0 D
All 0 0 8632 8814 -182 -2% - - 235.8 24.8 18.9 C
502 Mile End Roundabout Mile End Road to Mile End Road N-N SBU 100613 100612 66 65 1 1.54% 0.1 � 236.0 16.8 63.7 E
Mile End Road to Commercial Road N-S SBT 100613 100111 1770 1821 -51 -2.80% 1.2 � 236.0 16.8 20.7 C
Mile End Road to Church Street N-E SBL 100613 100311 599 618 -19 -3.07% 0.8 � 236.0 16.8 21.4 C
Hope Street to Mile End Road SW-N NBT 100033 100612 1979 2086 -107 -5.13% 2.4 � 231.4 96.5 29.9 C
Hope Street to Mile End Road SW-N NBT 100641 100612 0 0 0 0.00% 0.0 � 25.0 0.8 0.0 A
Hope Street to Commercial Road SW-S NBU 100641 100111 20 47 -27 -57.45% 4.7 � 25.0 0.8 173.3 F
Hope Street to Church Street SW-E NBR 100641 100311 53 56 -3 -5.36% 0.4 � 25.0 0.8 102.0 F
Commercial Road to Mile End Road S-N NBT 100632 100612 505 529 -24 -4.54% 1.1 � 71.8 3.3 41.6 D
Commercial Road to Commercial Road S-S NBU 100632 100111 3 8 -5 -62.50% 2.1 � 71.8 3.3 66.7 E
Commercial Road to Church Street S-E NBR 100632 100311 13 20 -7 -35.00% 1.7 � 71.8 3.3 79.0 E
Church Street to Mile End Road E-N WBR 100621 100612 499 508 -9 -1.77% 0.4 � 225.5 61.0 101.9 F
Church Street to Commercial Road E-S WBL 100621 100111 12 15 -3 -20.00% 0.8 � 225.5 61.0 95.5 F
Church Street to Church Street E-E WBU 100621 100311 0 0 0 0.00% 0.0 � 225.5 61.0 0.0 A
All 0 0 5520 5773 -253 -4.38% - - 236.0 26.3 35.4 D
503 Cascade's Approach Cascade's Approach to Cascade's Approach S-SW NBL 100826 100827 0 0 0 0.00% 0.0 � 43.0 2.0 0.0 A
Cascade's Approach to Marketway WB S-E NBR 100826 100801 100 101 -1 -0.99% 0.1 � 43.0 2.0 13.0 B
Cascade's Approach to Marketway EB S-W NBL 100826 100825 45 45 0 0.00% 0.0 � 43.0 2.0 11.1 B
Marketway WB to Cascade's Approach NE-SW WBT 2 100827 48 51 -3 -5.88% 0.4 � 224.5 6.5 4.9 A
Marketway WB to Marketway WB NE-E WBL 2 100801 44 52 -8 -15.38% 1.2 � 224.5 6.5 13.0 B
Marketway WB to Marketway EB NE-W WBT 2 100825 1451 1573 -122 -7.76% 3.1 � 224.5 6.5 12.0 B
Marketway EB to Cascade's Approach SW-SW EBU 100824 100827 36 36 0 0.00% 0.0 � 29.3 0.3 6.8 A
Marketway EB to Hope Street SW-N EBL 100042 100042 1927 2058 -131 -6.37% 2.9 � 0.0 0.0 5.2 A
Marketway WB to Marketway EB NE-W WBT 2 79 33 31 2 6.45% 0.4 � 76.4 0.0 6.0 A
Marketway EB to Marketway WB SW-E EBT 100824 100801 196 177 19 10.73% 1.4 � 29.3 0.3 7.4 A
Marketway EB to Marketway EB SW-W NBL 100824 100825 18 16 2 12.50% 0.5 � 29.3 0.3 7.4 A
All 0 0 3897 4140 -243 -5.87% - - 224.5 2.4 8.2 A
504 Marketway Roundabout Commercial Road NB to Commercial Road SB S-N NBT 100805 100113 6 8 -2 -25.00% 0.8 � 51.5 2.7 43.6 E
Commercial Road NB to Marketway S-W NBL 100805 1 17 14 3 21.43% 0.8 � 51.5 2.7 36.2 E
Commercial Road NB to Cornmill street S-SE NBR 100805 100808 6 6 0 0.00% 0.0 � 51.5 2.7 30.9 D
Commercial Road SB to Commercial Road SB N-N SBU 100111 100113 22 22 0 0.00% 0.0 � 235.5 23.5 21.5 C
Commercial Road SB to Marketway N-W SBR 100111 1 1372 1460 -88 -6.03% 2.3 � 235.5 23.5 24.7 C
Commercial Road SB to Cornmill street N-SE SBT 100111 100808 394 409 -15 -3.67% 0.7 � 235.5 23.5 35.4 E
Marketway to Commercial Road SB W-N EBL 100804 100113 191 211 -20 -9.48% 1.4 � 90.3 1.3 10.9 B
Marketway to Marketway W-W EBU 100804 1 2 5 -3 -60.00% 1.6 � 90.3 1.3 12.7 B
Marketway to Cornmill street W-SE EBT 100804 100808 114 116 -2 -1.72% 0.2 � 90.3 1.3 18.3 C
Cornmill street to Commercial Road NB E-SW WBT 100806 100807 3 8 -5 -62.50% 2.1 � 109.8 1.8 3.3 A
Cornmill street to Commercial Road SB E-N WBR 100806 100113 299 306 -7 -2.29% 0.4 � 124.0 5.2 12.7 B
Cornmill street to Marketway E-W WBT 100806 1 184 180 4 2.22% 0.3 � 124.0 5.2 12.2 B
Cornmill street to Cornmill street E-SE WBL 100806 100808 0 0 0 0.00% 0.0 � 124.0 5.2 0.0 A
All 0 0 2610 2745 -135 -4.92% - - 235.5 7.7 22.9 C
505 A2030 roundabout Lake Road NB to Lake Road NB SW-W NBL 100814 100818 0 1 -1 -100.00% 1.4 � 80.9 0.4 0.0 A
Lake Road NB to Cornmill street SW-NW EBL 100814 100806 185 185 0 0.00% 0.0 � 80.9 0.4 3.8 A
Lake Road NB to Lake Road SB SW-E EBT 100814 100816 103 105 -2 -1.90% 0.2 � 80.9 0.4 8.4 A
Cornmill street to Lake Road NB NW-W SBR 100808 100818 57 58 -1 -1.72% 0.1 � 92.5 6.4 25.5 D
Cornmill street to Cornmill street NW-NW SBU 100808 100806 3 8 -5 -62.50% 2.1 � 92.5 6.4 41.7 E
Cornmill street to Lake Road SB NW-E SBL 100808 100816 450 473 -23 -4.86% 1.1 � 92.5 6.4 25.9 D
Lake Road SB to Lake Road NB E-W WBT 100817 100818 27 25 2 8.00% 0.4 � 200.2 1.8 5.8 A
Lake Road SB to Cornmill street E-NW WBT 100817 100806 302 301 1 0.33% 0.1 � 200.2 1.8 7.7 A
Lake Road SB to Lake Road SB E-E WBU 100817 100816 0 0 0 0.00% 0.0 � 200.2 1.8 0.0 A
All 0 0 1128 1156 -28 -2.42% - - 200.2 2.9 15.4 C
506 Holbrook Road Roundabout Lake Road SB to Lake Road SB NE-E WBL 100820 100819 0 0 0 0.00% 0.0 � 161.1 20.0 0.0 A
Lake Road SB to Holbrook Road NE-S WBR 100820 100821 160 163 -3 -1.84% 0.2 � 161.1 20.0 32.1 D
Lake Road SB to Church Street NE-NW WBR 100820 100313 72 73 -1 -1.37% 0.1 � 161.1 20.0 34.4 D
Lake Road SB to Lake Road NB NE-W WBT 100820 100817 178 176 2 1.14% 0.2 � 161.1 20.0 35.0 D
Holbrook Road to Lake Road SB SE-E NBR 100847 100819 339 341 -2 -0.59% 0.1 � 226.5 14.6 21.1 C
Holbrook Road to Holbrook Road SE-S NBL 100847 100821 0 0 0 0.00% 0.0 � 226.5 14.6 0.0 A
Holbrook Road to Church Street SE-NW NBT 100847 100313 403 406 -3 -0.74% 0.1 � 226.5 14.6 20.4 C
Holbrook Road to Lake Road NB SE-W NBL 100847 100817 140 135 5 3.70% 0.4 � 226.5 14.6 6.6 A
Church Street to Lake Road SB NW-E SBL 100311 100819 64 71 -7 -9.86% 0.9 � 225.4 34.5 50.8 F
Church Street to Holbrook Road NW-S SBT 100311 100821 401 421 -20 -4.75% 1.0 � 225.4 34.5 48.6 E
Church Street to Church Street NW-NW SBU 100311 100313 0 0 0 0.00% 0.0 � 225.4 34.5 0.0 A
Church Street to Lake Road NB NW-W SBR 100311 100817 14 15 -1 -6.67% 0.3 � 225.4 34.5 56.0 F
Lake Road NB to Lake Road SB SW-E EBT 100816 100819 239 258 -19 -7.36% 1.2 � 235.9 115.0 99.3 F
Lake Road NB to Holbrook Road SW-S EBR 100816 100821 298 310 -12 -3.87% 0.7 � 235.9 115.0 99.1 F
Lake Road NB to Church Street SW-NW EBL 100816 100313 11 10 1 10.00% 0.3 � 235.9 115.0 84.6 F
Lake Road NB to Lake Road NB SW-W NBL 100816 100817 0 0 0 0.00% 0.0 � 235.9 115.0 0.0 A
All 0 0 2318 2379 -61 -2.56% - - 235.9 46.0 46.6 E
507 Unicorn Road Unicorn Road WB to Market Way NW-NE SBL 100837 100035 294 296 -2 -0.68% 0.1 � 74.7 13.1 42.6 D
Unicorn Road WB to Unicorn Road EB NW-S SBT 100837 100840 113 110 3 2.73% 0.3 � 75.9 12.6 41.6 D
Unicorn Road WB to Alfred Road NW-SW SBR 100837 100843 99 96 3 3.13% 0.3 � 75.9 12.6 41.4 D
Market Way to Unicorn Road WB NE-NW WBR 100825 100841 27 25 2 8.00% 0.4 � 219.5 11.1 52.2 D
Market Way to Unicorn Road EB NE-S WBU 100825 100840 262 275 -13 -4.73% 0.8 � 219.5 11.1 16.0 B
Market Way to Alfred Road NE-SW WBT 100825 100843 1250 1334 -84 -6.30% 2.3 � 219.5 11.1 21.0 C
Unicorn Road EB to Unicorn Road WB S-NW NBT 100851 100841 13 14 -1 -9.30% 0.4 � 86.6 14.4 42.7 D
Unicorn Road EB to Market Way S-NE NBR 100851 100035 183 198 -15 -7.58% 1.1 � 86.6 14.4 47.5 D
Unicorn Road EB to Alfred Road S-SW NBL 100851 100843 15 21 -6 -28.57% 1.4 � 84.5 1.0 47.6 D
Alfred Road to Unicorn Road WB SW-NW EBL 100037 100841 30 28 2 7.14% 0.4 � 229.4 37.9 23.1 C
Alfred Road to Market Way SW-NE EBT 100037 100035 1696 1793 -97 -5.41% 2.3 � 229.4 37.9 21.8 C
All 0 0 3983 4190 -207.3333 -4.95% - - 229.4 16.1 25.4 C
508 Stanhope Road Stanhope Road to Stanhope Road S-S NBU 100849 100850 0 6 -6 -100.00% 3.5 � 22.0 0.1 0.0 A
Stanhope Road to Edinburgh Road WB S-SE NBR 100849 100853 0 3 -3 -100.00% 2.4 � 22.0 0.1 0.0 A
Stanhope Road to Unicorn road S-N NBT 100849 100842 180 185 -5 -2.70% 0.4 � 22.0 0.1 4.9 A
Stanhope Road to Edinburgh Road EB S-W NBL 100849 100854 8 19 -11 -57.89% 3.0 � 22.0 0.1 15.4 C
Edinburgh Road WB to Stanhope Road E-S WBL 100852 100850 24 14 10 71.43% 2.3 � 47.6 0.6 13.6 B
Edinburgh Road WB to Edinburgh Road WB E-SE WBL 100852 100853 0 0 0 0.00% 0.0 � 47.6 0.6 0.0 A
Edinburgh Road WB to Unicorn road E-N WBR 100852 100842 30 38 -8 -21.05% 1.4 � 47.6 0.6 17.0 C
Edinburgh Road WB to Edinburgh Road EB E-W WBT 100852 100854 64 44 20 45.45% 2.7 � 47.6 0.6 17.9 C
Unicorn road to Stanhope Road N-S SBT 100848 100850 343 334 9 2.69% 0.5 � 28.0 0.1 1.6 A
Unicorn road to Edinburgh Road WB N-SE SBT 100848 100853 23 42 -19 -45.24% 3.3 � 28.0 0.1 1.6 A
Unicorn road to Unicorn road N-N SBU 100848 100842 1 5 -4 -80.00% 2.3 � 28.0 0.1 3.8 A
Unicorn road to Edinburgh Road EB N-W SBR 100848 100854 7 4 3 75.00% 1.3 � 28.0 0.1 3.8 A
Edinburgh Road EB to Stanhope Road W-S EBR 100855 100850 8 16 -8 -48.66% 2.2 � 35.7 0.1 9.3 A
Edinburgh Road EB to Edinburgh Road WB W-SE EBT 100855 100853 28 32 -4 -12.50% 0.7 � 35.7 0.1 10.2 B
Edinburgh Road EB to Unicorn road W-N EBL 100855 100842 0 5 -5 -100.00% 3.3 � 35.7 0.1 0.0 A
Edinburgh Road EB to Edinburgh Road EB W-W EBU 100855 100854 0 0 0 0.00% 0.0 � 35.7 0.1 0.0 A
All 0 0 717 747 -29.91667 -4.01% - - 47.6 0.2 5.5 A
509 Queen Street Queen St to Alfred Road W-NE EBL 100039 100037 495 473 22 4.65% 1.0 � 163.0 16.6 29.8 C
Queen St to Bishop Crispian Way W-E EBT 100039 100855 38 53 -15 -28.30% 2.2 � 154.2 8.1 70.8 E
Alfred Road to Queen St NE-W WBT 97 100863 305 322 -17 -5.28% 1.0 � 224.9 29.5 51.5 D
Alfred Road to Anglesea Road NE-S WBR 100844 100862 1051 1129 -78 -6.91% 2.4 � 221.4 9.1 10.3 B
Bishop Crispian Way to Queen St E-W WBT 100857 100863 80 67 13 19.40% 1.5 � 84.1 8.6 51.9 D
Anglesea Road to Queen St S-W NBL 100859 100863 20 16 4 25.00% 0.9 � 70.1 0.3 19.7 B
Anglesea Road to Alfred Road S-NE NBR 100859 100037 1218 1348 -130 -9.64% 3.6 � 224.5 17.2 20.6 C
All 0 0 3206 3408 -202 -5.93% - - 224.9 12.8 22.9 C
510 St Michael's Gyratory St Paul's Road to Wiltshire Street S-E NBR 11 9 0 0 0 0.00% 0.0 � 31.9 0.4 0.0 A
St Paul's Road to Waltham St S-S NBU 11 10 0 0 0 0.00% 0.0 � 31.9 0.4 0.0 A
St Paul's Road to Guildhall Walk S-NE NBT 11 12 0 0 0 0.00% 0.0 � 31.9 0.4 0.0 A
St Paul's Road to Cambridge Road S-SW NBL 11 100883 0 0 0 0.00% 0.0 � 31.9 0.4 0.0 A
St Paul's Road to Hampshire Terrace S-S NBU 11 100889 0 0 0 0.00% 0.0 � 31.9 0.4 0.0 A
St Paul's Road to Winston churchill avenue S-E NBR 11 100902 0 0 0 0.00% 0.0 � 31.9 0.4 0.0 A
St Paul's Road to Anglesea Road S-N NBT 11 100859 104 105 -1 -0.95% 0.1 � 31.9 0.4 11.1 B
Cambridge Road to Wiltshire Street SW-E EBT 100882 9 3 3 0 0.00% 0.0 � 173.1 2.8 25.4 C
Cambridge Road to Waltham St SW-S EBR 100882 10 0 0 0 0.00% 0.0 � 173.1 2.8 0.0 A
Cambridge Road to Guildhall Walk SW-NE EBT 100882 12 12 12 0 0.00% 0.0 � 173.1 2.8 27.8 C
Cambridge Road to Cambridge Road SW-SW EBU 100882 100883 1 1 0 0.00% 0.0 � 173.1 2.8 23.0 C
Cambridge Road to Hampshire Terrace SW-S EBR 100882 100889 9 4 5 125.00% 2.0 � 173.1 2.8 28.4 C
Cambridge Road to Winston churchill avenue SW-E EBT 100882 100902 170 170 0 0.00% 0.0 � 173.1 2.8 25.1 C
Cambridge Road to Anglesea Road SW-N EBL 100882 100859 418 427 -9 -2.11% 0.4 � 173.1 2.8 14.0 B
Hampshire Terrace to Wiltshire Street S-E NBR 100888 9 0 0 0 0.00% 0.0 � 127.4 9.8 0.0 A
Hampshire Terrace to Waltham St S-S NBU 100888 10 0 0 0 0.00% 0.0 � 127.4 9.8 0.0 A
Hampshire Terrace to Guildhall Walk S-NE NBT 100888 12 12 12 0 0.00% 0.0 � 127.4 9.8 35.6 E
Hampshire Terrace to Cambridge Road S-SW NBL 100888 100883 18 18 0 0.00% 0.0 � 127.4 9.8 22.8 C
Hampshire Terrace to Hampshire Terrace S-S NBU 100888 100889 6 2 4 200.00% 2.0 � 127.4 9.8 36.9 E
Hampshire Terrace to Winston churchill avenue S-E NBR 100888 100902 57 54 3 5.56% 0.4 � 127.4 9.8 34.6 D
Hampshire Terrace to Anglesea Road S-N NBT 100888 100859 324 323 1 0.31% 0.1 � 127.4 9.8 25.3 D
Winston churchill avenue to Wiltshire Street E-E WBU 100907 9 4 4 0 0.00% 0.0 � 68.6 10.0 35.0 C
Winston churchill avenue to Waltham St E-S WBL 100907 10 4 4 0 0.00% 0.0 � 68.6 10.0 19.1 B
Winston churchill avenue to Guildhall Walk E-NE WBR 100907 12 12 13 -1 -7.69% 0.3 � 68.6 10.0 49.7 D
Winston churchill avenue to Cambridge Road E-SW WBT 100907 100883 155 155 0 0.00% 0.0 � 68.6 10.0 40.0 D
Winston churchill avenue to Hampshire Terrace E-S WBL 100907 100889 86 81 5 6.17% 0.5 � 68.6 10.0 31.6 C
Winston churchill avenue to Winston churchill avenue E-E WBU 100907 100902 21 21 0 0.00% 0.0 � 68.6 10.0 46.5 D
Winston churchill avenue to Anglesea Road E-N WBR 100907 100859 163 168 -5 -2.98% 0.4 � 68.6 10.0 40.6 D
Anglesea Road to Wiltshire Street N-E SBL 100869 9 20 26 -6 -23.08% 1.3 � 81.9 1.4 19.7 C
Anglesea Road to Waltham St N-S SBT 100869 10 0 0 0 0.00% 0.0 � 81.9 1.4 0.0 A
Anglesea Road to Guildhall Walk N-NE SBL 100869 12 20 25 -5 -20.00% 1.1 � 81.9 1.4 10.2 B
Anglesea Road to Cambridge Road N-SW SBR 100869 100883 173 192 -19 -9.90% 1.4 � 81.9 1.4 25.2 D
Anglesea Road to Hampshire Terrace N-S SBT 100869 100889 519 546 -27 -4.95% 1.2 � 81.9 1.4 21.2 C
Anglesea Road to Winston churchill avenue N-E SBL 100869 100902 107 118 -11 -9.32% 1.0 � 81.9 1.4 10.2 B
Anglesea Road to Anglesea Road N-N SBU 100869 100859 75 89 -14 -15.73% 1.5 � 81.9 1.4 30.0 D
All 0 0 2492 2573 -81 -3.15% - - 173.1 4.9 24.0 C
511 Park Road Park Road to Anglesea Road W-N EBL 100879 100859 273 271 2 0.74% 0.1 � 120.1 24.5 56.5 E
Anglesea Road SB to Park Road N-W SBR 100862 100880 139 130 9 6.92% 0.8 � 225.4 22.2 56.0 E
Anglesea Road SB to Anglesea Road SB N-S SBT 100862 100865 916 999 -83 -8.31% 2.7 � 225.4 22.2 14.5 B
Anglesea Road to Park Road S-W NBL 100859 100880 35 36 -1 -2.78% 0.2 � 198.6 10.2 13.5 B
Anglesea Road to Anglesea Road S-N NBT 100859 100859 982 1093 -111 -10.16% 3.4 � 198.6 10.2 12.0 B
All 0 0 2344 2529 -185 -7.32% - - 225.4 17.9 20.8 C
512 Princess Royal Road Princess Royal Road to Mile end Road NB W-N EBL 100681 101021 1067 1067 0 0.00% 0.0 � 235.7 147.0 102.6 F
Mile end Road SB to Princess Royal Road NE-W WBT 4 100682 85 83 2 2.41% 0.2 � 38.7 3.2 34.6 C
Mile end Road NB to Princess Royal Road S-W NBL 3 100682 90 80 10 12.50% 1.1 � 36.8 1.5 17.4 B
Mile end Road NB to Mile end Road NB S-N NBT 100612 101021 2954 3108 -154 -4.95% 2.8 � 225.4 51.7 20.8 C
All 0 0 4195 4338 -143 -3.30% - - 235.7 50.8 41.8 D
0 NETWORK TOTALS All All 41041 42792 -1751 -4.09% - 100% 236.0 15.8 25.3 D
16
:00
-17
:00
26/09/2014 11:59 Node Evaluation Results_PM.xlsm

501 Rudmore Roundabout M275 SB to M275 NB NW-S SBT 101011 101011 2387 2374 13 0.55% 0.3 � 225.4 1.0 3.5 A
M275 NB to M275 SB S-NW SBT 101022 101022 2639 2648 -9 -0.34% 0.2 � 0.0 0.0 1.9 A
A2047 Kingston Cresent to Wharf Road E-W WBT 101211 101412 7 7 0 0.00% 0.0 � 80.6 12.3 9.7 A
A2047 Kingston Cresent to M275 NB Service Road E-S WBL 101211 1010121 59 65 -6 -9.23% 0.8 � 80.6 12.3 4.1 A
A2047 Kingston Cresent to A2047 Kingston Cresent E-SE WBL 101211 101222 0 0 0 0.00% 0.0 � 80.6 12.3 0.0 A
A2047 Kingston Cresent to A3 Twyford Avenue E-NE WBU 101211 101621 187 181 6 3.31% 0.4 � 80.6 12.3 20.2 C
A2047 Kingston Cresent to M275 SB Service Road E-NW WBR 101211 101711 490 470 20 4.26% 0.9 � 80.6 12.3 18.4 C
M275 SB Service Road to Wharf Road NW-W SBR 101311 101412 86 90 -4 -4.44% 0.4 � 235.7 140.0 121.1 F
M275 SB Service Road to A3 Twyford Avenue NW-NE SBL 101311 101621 295 300 -5 -1.67% 0.3 � 235.7 140.0 226.9 F
M275 SB Service Road to M275 SB Service Road NW-NW SBU 101311 101711 23 23 0 0.00% 0.0 � 235.7 140.0 117.9 F
M275 SB Service Road to A2047 Kingston Cresent NW-SE SBL 101311 101222 459 476 -17 -3.57% 0.8 � 235.7 140.0 145.4 F
M275 SB Service Road to M275 NB Service Road NW-S SBT 101311 1010121 22 39 -17 -43.59% 3.1 � 235.7 140.0 133.5 F
A3 Twyford Avenue to Wharf Road NE-W WBT 101321 101412 14 11 3 27.27% 0.8 � 134.6 3.9 17.7 C
A3 Twyford Avenue to A3 Twyford Avenue NE-NE WBU 101321 101621 10 9 1 11.11% 0.3 � 134.6 3.9 23.7 C
A3 Twyford Avenue to M275 SB Service Road NE-NW WBR 101321 101711 194 199 -5 -2.51% 0.4 � 134.6 3.9 21.5 C
A3 Twyford Avenue to A2047 Kingston Cresent NE-SE WBL 101321 101222 127 132 -5 -3.79% 0.4 � 134.6 3.9 14.9 B
A3 Twyford Avenue to M275 NB Service Road NE-S WBU 101321 1010121 389 387 2 0.52% 0.1 � 134.6 3.9 21.3 C
Wharf Road to Wharf Road W-W EBU 101531 101412 0 0 0 0.00% 0.0 � 161.0 5.7 0.0 A
Wharf Road to A3 Twyford Avenue W-NE EBT 101531 101621 46 46 0 0.00% 0.0 � 161.0 5.7 49.7 E
Wharf Road to M275 SB Service Road W-NW EBL 101531 101711 246 244 2 0.82% 0.1 � 161.0 5.7 29.3 D
Wharf Road to A2047 Kingston Cresent W-SE EBT 101531 101222 35 37 -2 -5.41% 0.3 � 161.0 5.7 56.0 F
Wharf Road to M275 NB Service Road W-S WBR 101531 1010121 74 74 0 0.00% 0.0 � 161.0 5.7 55.0 F
M275 NB Service Road to Wharf Road S-W NBL 101423 101412 36 44 -8 -18.18% 1.3 � 226.7 30.1 5.0 A
M275 NB Service Road to A3 Twyford Avenue S-NE NBR 101423 101621 470 483 -13 -2.69% 0.6 � 226.7 30.1 71.4 F
M275 NB Service Road to M275 SB Service Road S-NW NBT 101423 101711 78 109 -31 -28.44% 3.2 � 226.7 30.1 15.1 C
M275 NB Service Road to A2047 Kingston Cresent S-SE NBR 101423 101222 115 121 -6 -4.96% 0.6 � 226.7 30.1 23.9 C
M275 NB Service Road to M275 NB Service Road S-S NBU 101423 1010121 5 0 5 0.00% 3.2 � 226.7 30.1 64.1 F
All 0 0 8494 8569 -75 -1% - - 235.7 35.6 28.6 D
502 Mile End Roundabout Mile End Road to Mile End Road N-N SBU 100613 100612 53 56 -3 -5.36% 0.4 � 235.9 22.3 64.1 E
Mile End Road to Commercial Road N-S SBT 100613 100111 2120 2119 1 0.05% 0.0 � 235.9 22.3 21.5 C
Mile End Road to Church Street N-E SBL 100613 100311 694 672 22 3.27% 0.8 � 235.9 22.3 26.5 C
Hope Street to Mile End Road SW-N NBT 100033 100612 1746 1848 -102 -5.52% 2.4 � 225.1 57.2 25.1 C
Hope Street to Mile End Road SW-N NBT 100641 100612 0 0 0 0.00% 0.0 � 34.1 1.0 0.0 A
Hope Street to Commercial Road SW-S NBU 100641 100111 24 54 -30 -55.56% 4.8 � 34.1 1.0 117.7 F
Hope Street to Church Street SW-E NBR 100641 100311 60 63 -3 -4.76% 0.4 � 34.1 1.0 102.6 F
Commercial Road to Mile End Road S-N NBT 100632 100612 502 510 -8 -1.57% 0.4 � 69.2 3.7 43.8 D
Commercial Road to Commercial Road S-S NBU 100632 100111 6 12 -6 -50.00% 2.0 � 69.2 3.7 75.6 E
Commercial Road to Church Street S-E NBR 100632 100311 13 19 -6 -31.58% 1.5 � 69.2 3.7 78.0 E
Church Street to Mile End Road E-N WBR 100621 100612 479 464 15 3.23% 0.7 � 215.2 47.2 92.6 F
Church Street to Commercial Road E-S WBL 100621 100111 16 21 -5 -23.81% 1.2 � 215.2 47.2 80.6 F
Church Street to Church Street E-E WBU 100621 100311 0 0 0 0.00% 0.0 � 215.2 47.2 0.0 A
All 0 0 5713 5838 -125 -2.14% - - 235.9 21.5 33.3 C
503 Cascade's Approach Cascade's Approach to Cascade's Approach S-SW NBL 100826 100827 0 0 0 0.00% 0.0 � 82.8 7.9 0.0 A
Cascade's Approach to Marketway WB S-E NBR 100826 100801 123 124 -1 -0.81% 0.1 � 82.8 7.9 38.7 E
Cascade's Approach to Marketway EB S-W NBL 100826 100825 41 40 1 2.50% 0.2 � 82.8 7.9 24.5 C
Marketway WB to Cascade's Approach NE-SW WBT 2 100827 14 15 -1 -6.67% 0.3 � 231.4 16.3 5.3 A
Marketway WB to Marketway WB NE-E WBL 2 100801 80 82 -2 -2.44% 0.2 � 231.4 16.3 16.8 C
Marketway WB to Marketway EB NE-W WBT 2 100825 1875 1929 -54 -2.80% 1.2 � 231.4 16.3 16.4 C
Marketway EB to Cascade's Approach SW-SW EBU 100824 100827 10 13 -3 -23.08% 0.9 � 41.2 0.4 6.2 A
Marketway EB to Hope Street SW-N EBL 100042 100042 1694 1843 -149 -8.08% 3.5 � 0.0 0.0 4.5 A
Marketway WB to Marketway EB NE-W WBT 2 79 27 31 -4 -12.90% 0.7 � 36.1 0.0 7.3 A
Marketway EB to Marketway WB SW-E EBT 100824 100801 161 137 24 17.52% 2.0 � 41.2 0.4 7.2 A
Marketway EB to Marketway EB SW-W NBL 100824 100825 27 11 16 145.45% 3.7 � 41.2 0.4 6.7 A
All 0 0 4052 4225 -173 -4.09% - - 231.4 6.7 11.7 B
504 Marketway Roundabout Commercial Road NB to Commercial Road SB S-N NBT 100805 100113 9 10 -1 -10.00% 0.3 � 38.4 3.5 40.6 E
Commercial Road NB to Marketway S-W NBL 100805 1 21 21 0 0.00% 0.0 � 38.4 3.5 33.0 D
Commercial Road NB to Cornmill street S-SE NBR 100805 100808 10 9 1 11.11% 0.3 � 38.4 3.5 31.2 D
Commercial Road SB to Commercial Road SB N-N SBU 100111 100113 3 3 0 0.00% 0.0 � 231.5 23.4 23.7 C
Commercial Road SB to Marketway N-W SBR 100111 1 1760 1789 -29 -1.62% 0.7 � 231.5 23.4 28.7 D
Commercial Road SB to Cornmill street N-SE SBT 100111 100808 404 414 -10 -2.42% 0.5 � 231.5 23.4 26.4 D
Marketway to Commercial Road SB W-N EBL 100804 100113 176 207 -31 -14.98% 2.2 � 68.7 1.1 10.2 B
Marketway to Marketway W-W EBU 100804 1 5 7 -2 -28.57% 0.8 � 68.7 1.1 13.6 B
Marketway to Cornmill street W-SE EBT 100804 100808 103 124 -21 -16.94% 2.0 � 68.7 1.1 19.3 C
Cornmill street to Commercial Road NB E-SW WBT 100806 100807 6 12 -6 -50.00% 2.0 � 157.1 9.8 2.2 A
Cornmill street to Commercial Road SB E-N WBR 100806 100113 316 311 5 1.61% 0.3 � 175.3 16.6 24.5 C
Cornmill street to Marketway E-W WBT 100806 1 164 163 1 0.61% 0.1 � 175.3 16.6 24.5 C
Cornmill street to Cornmill street E-SE WBL 100806 100808 0 0 0 0.00% 0.0 � 175.3 16.6 0.0 A
All 0 0 2975 3070 -95 -3.09% - - 231.5 11.1 26.4 D
505 A2030 roundabout Lake Road NB to Lake Road NB SW-W NBL 100814 100818 0 0 0 0.00% 0.0 � 88.3 7.7 0.0 A
Lake Road NB to Cornmill street SW-NW EBL 100814 100806 208 216 -8 -3.70% 0.5 � 88.3 7.7 31.7 D
Lake Road NB to Lake Road SB SW-E EBT 100814 100816 103 105 -2 -1.90% 0.2 � 88.3 7.7 21.2 C
Cornmill street to Lake Road NB NW-W SBR 100808 100818 45 46 -1 -2.17% 0.1 � 91.6 5.5 23.4 C
Cornmill street to Cornmill street NW-NW SBU 100808 100806 6 12 -6 -50.00% 2.0 � 91.6 5.5 36.5 E
Cornmill street to Lake Road SB NW-E SBL 100808 100816 467 501 -34 -6.79% 1.5 � 91.6 5.5 22.4 C
Lake Road SB to Lake Road NB E-W WBT 100817 100818 20 18 2 11.11% 0.5 � 231.5 9.6 29.1 D
Lake Road SB to Cornmill street E-NW WBT 100817 100806 270 258 12 4.65% 0.7 � 231.5 9.6 35.9 E
Lake Road SB to Lake Road SB E-E WBU 100817 100816 0 0 0 0.00% 0.0 � 231.5 9.6 0.0 A
All 0 0 1118 1156 -38 -3.29% - - 231.5 7.6 27.2 D
506 Holbrook Road Roundabout Lake Road SB to Lake Road SB NE-E WBL 100820 100819 2 2 0 0.00% 0.0 � 224.7 24.5 31.7 D
Lake Road SB to Holbrook Road NE-S WBR 100820 100821 200 203 -3 -1.48% 0.2 � 224.7 24.5 35.1 E
Lake Road SB to Church Street NE-NW WBR 100820 100313 74 77 -3 -3.90% 0.3 � 224.7 24.5 37.4 E
Lake Road SB to Lake Road NB NE-W WBT 100820 100817 148 143 5 3.50% 0.4 � 224.7 24.5 39.8 E
Holbrook Road to Lake Road SB SE-E NBR 100847 100819 326 327 -1 -0.31% 0.1 � 224.9 8.9 20.4 C
Holbrook Road to Holbrook Road SE-S NBL 100847 100821 1 1 0 0.00% 0.0 � 224.9 8.9 3.0 A
Holbrook Road to Church Street SE-NW NBT 100847 100313 346 346 0 0.00% 0.0 � 224.9 8.9 20.6 C
Holbrook Road to Lake Road NB SE-W NBL 100847 100817 123 119 4 3.36% 0.4 � 224.9 8.9 8.8 A
Church Street to Lake Road SB NW-E SBL 100311 100819 86 83 3 3.61% 0.3 � 235.8 66.8 90.9 F
Church Street to Holbrook Road NW-S SBT 100311 100821 396 386 10 2.59% 0.5 � 235.8 66.8 85.1 F
Church Street to Church Street NW-NW SBU 100311 100313 0 0 0 0.00% 0.0 � 235.8 66.8 0.0 A
Church Street to Lake Road NB NW-W SBR 100311 100817 13 13 0 0.00% 0.0 � 235.8 66.8 72.8 F
Lake Road NB to Lake Road SB SW-E EBT 100816 100819 209 217 -8 -3.69% 0.5 � 236.0 90.2 77.4 F
Lake Road NB to Holbrook Road SW-S EBR 100816 100821 351 377 -26 -6.90% 1.4 � 236.0 90.2 74.2 F
Lake Road NB to Church Street SW-NW EBL 100816 100313 13 12 1 8.33% 0.3 � 236.0 90.2 80.9 F
Lake Road NB to Lake Road NB SW-W NBL 100816 100817 1 1 0 0.00% 0.0 � 236.0 90.2 18.1 C
All 0 0 2288 2307 -19 -0.82% - - 236.0 47.6 51.1 F
507 Unicorn Road Unicorn Road WB to Market Way NW-NE SBL 100837 100035 77 84 -7 -8.33% 0.8 � 51.0 4.3 45.0 D
Unicorn Road WB to Unicorn Road EB NW-S SBT 100837 100840 59 56 3 5.36% 0.4 � 52.2 7.6 46.1 D
Unicorn Road WB to Alfred Road NW-SW SBR 100837 100843 96 91 5 5.49% 0.5 � 52.2 7.6 47.4 D
Market Way to Unicorn Road WB NE-NW WBR 100825 100841 23 28 -5 -17.86% 1.0 � 222.7 19.9 36.0 D
Market Way to Unicorn Road EB NE-S WBU 100825 100840 352 350 2 0.57% 0.1 � 222.7 19.9 14.8 B
Market Way to Alfred Road NE-SW WBT 100825 100843 1594 1602 -8 -0.50% 0.2 � 222.7 19.9 22.2 C
Unicorn Road EB to Unicorn Road WB S-NW NBT 100851 100841 16 16 0 0.00% 0.0 � 107.6 14.3 48.1 D
Unicorn Road EB to Market Way S-NE NBR 100851 100035 184 203 -19 -9.36% 1.4 � 107.6 14.3 45.8 D
Unicorn Road EB to Alfred Road S-SW NBL 100851 100843 18 22 -4 -18.18% 0.9 � 91.7 1.3 50.3 D
Alfred Road to Unicorn Road WB SW-NW EBL 100037 100841 18 20 -2 -10.00% 0.5 � 220.1 18.3 13.0 B
Alfred Road to Market Way SW-NE EBT 100037 100035 1627 1717 -90 -5.24% 2.2 � 220.1 18.3 13.2 B
All 0 0 4064 4189 -125 -2.98% - - 222.7 13.3 20.7 C
508 Stanhope Road Stanhope Road to Stanhope Road S-S NBU 100849 100850 0 1 -1 -100.00% 1.4 � 57.6 0.2 0.0 A
Stanhope Road to Edinburgh Road WB S-SE NBR 100849 100853 0 3 -3 -100.00% 2.4 � 57.6 0.2 0.0 A
Stanhope Road to Unicorn road S-N NBT 100849 100842 193 199 -6 -3.02% 0.4 � 57.6 0.2 4.8 A
Stanhope Road to Edinburgh Road EB S-W NBL 100849 100854 8 16 -8 -50.00% 2.3 � 57.6 0.2 16.8 C
Edinburgh Road WB to Stanhope Road E-S WBL 100852 100850 26 19 7 36.84% 1.5 � 68.3 0.6 12.0 B
Edinburgh Road WB to Edinburgh Road WB E-SE WBL 100852 100853 0 0 0 0.00% 0.0 � 68.3 0.6 0.0 A
Edinburgh Road WB to Unicorn road E-N WBR 100852 100842 24 31 -7 -22.58% 1.3 � 68.3 0.6 16.8 C
Edinburgh Road WB to Edinburgh Road EB E-W WBT 100852 100854 46 31 15 48.39% 2.4 � 68.3 0.6 17.8 C
Unicorn road to Stanhope Road N-S SBT 100848 100850 382 357 25 7.00% 1.3 � 37.0 0.1 1.4 A
Unicorn road to Edinburgh Road WB N-SE SBT 100848 100853 23 42 -19 -45.24% 3.3 � 37.0 0.1 1.8 A
Unicorn road to Unicorn road N-N SBU 100848 100842 0 1 -1 -100.00% 1.4 � 37.0 0.1 0.0 A
Unicorn road to Edinburgh Road EB N-W SBR 100848 100854 6 6 0 0.00% 0.0 � 37.0 0.1 1.8 A
Edinburgh Road EB to Stanhope Road W-S EBR 100855 100850 8 20 -12 -59.75% 3.2 � 41.6 0.2 5.4 A
Edinburgh Road EB to Edinburgh Road WB W-SE EBT 100855 100853 27 31 -4 -11.71% 0.7 � 41.6 0.2 12.7 B
Edinburgh Road EB to Unicorn road W-N EBL 100855 100842 0 10 -10 -100.00% 4.5 � 41.6 0.2 0.0 A
Edinburgh Road EB to Edinburgh Road EB W-W EBU 100855 100854 0 0 0 0.00% 0.0 � 41.6 0.2 0.0 A
All 0 0 744 766 -22.45714 -2.93% - - 68.3 0.3 4.8 A
509 Queen Street Queen St to Alfred Road W-NE EBL 100039 100037 463 436 27 6.19% 1.3 � 127.6 15.2 27.4 C
Queen St to Bishop Crispian Way W-E EBT 100039 100855 33 61 -28 -45.90% 4.1 � 118.8 5.5 68.0 E
Alfred Road to Queen St NE-W WBT 97 100863 358 372 -14 -3.76% 0.7 � 229.0 59.5 66.6 E
Alfred Road to Anglesea Road NE-S WBR 100844 100862 1357 1343 14 1.04% 0.4 � 224.9 20.3 14.4 B
Bishop Crispian Way to Queen St E-W WBT 100857 100863 59 53 6 11.32% 0.8 � 79.2 8.8 64.1 E
Anglesea Road to Queen St S-W NBL 100859 100863 22 15 7 46.67% 1.6 � 58.8 0.3 19.7 B
Anglesea Road to Alfred Road S-NE NBR 100859 100037 1186 1301 -115 -8.84% 3.3 � 183.9 14.7 19.4 B
All 0 0 3479 3581 -102 -2.85% - - 229.0 17.8 24.6 C
510 St Michael's Gyratory St Paul's Road to Wiltshire Street S-E NBR 11 9 0 0 0 0.00% 0.0 � 54.0 1.6 0.0 A
St Paul's Road to Waltham St S-S NBU 11 10 0 0 0 0.00% 0.0 � 54.0 1.6 0.0 A
St Paul's Road to Guildhall Walk S-NE NBT 11 12 0 0 0 0.00% 0.0 � 54.0 1.6 0.0 A
St Paul's Road to Cambridge Road S-SW NBL 11 100883 0 0 0 0.00% 0.0 � 54.0 1.6 0.0 A
St Paul's Road to Hampshire Terrace S-S NBU 11 100889 2 0 2 0.00% 2.0 � 54.0 1.6 15.6 C
St Paul's Road to Winston churchill avenue S-E NBR 11 100902 0 0 0 0.00% 0.0 � 54.0 1.6 0.0 A
St Paul's Road to Anglesea Road S-N NBT 11 100859 142 143 -1 -0.70% 0.1 � 54.0 1.6 18.1 C
Cambridge Road to Wiltshire Street SW-E EBT 100882 9 1 1 0 0.00% 0.0 � 109.4 2.0 20.8 C
Cambridge Road to Waltham St SW-S EBR 100882 10 0 0 0 0.00% 0.0 � 109.4 2.0 0.0 A
Cambridge Road to Guildhall Walk SW-NE EBT 100882 12 26 25 1 4.00% 0.2 � 109.4 2.0 21.9 C
Cambridge Road to Cambridge Road SW-SW EBU 100882 100883 2 2 0 0.00% 0.0 � 109.4 2.0 36.9 D
Cambridge Road to Hampshire Terrace SW-S EBR 100882 100889 8 4 4 100.00% 1.6 � 109.4 2.0 32.4 C
Cambridge Road to Winston churchill avenue SW-E EBT 100882 100902 133 131 2 1.53% 0.2 � 109.4 2.0 23.3 C
Cambridge Road to Anglesea Road SW-N EBL 100882 100859 378 379 -1 -0.26% 0.1 � 109.4 2.0 13.0 B
Hampshire Terrace to Wiltshire Street S-E NBR 100888 9 0 0 0 0.00% 0.0 � 186.7 12.5 0.0 A
Hampshire Terrace to Waltham St S-S NBU 100888 10 0 0 0 0.00% 0.0 � 186.7 12.5 0.0 A
Hampshire Terrace to Guildhall Walk S-NE NBT 100888 12 8 7 1 14.29% 0.4 � 186.7 12.5 46.1 E
Hampshire Terrace to Cambridge Road S-SW NBL 100888 100883 13 14 -1 -7.14% 0.3 � 186.7 12.5 21.4 C
Hampshire Terrace to Hampshire Terrace S-S NBU 100888 100889 6 1 5 500.00% 2.7 � 186.7 12.5 49.3 E
Hampshire Terrace to Winston churchill avenue S-E NBR 100888 100902 51 52 -1 -1.92% 0.1 � 186.7 12.5 37.0 E
Hampshire Terrace to Anglesea Road S-N NBT 100888 100859 302 306 -4 -1.31% 0.2 � 186.7 12.5 29.7 D
Winston churchill avenue to Wiltshire Street E-E WBU 100907 9 4 4 0 0.00% 0.0 � 99.8 12.9 34.8 C
Winston churchill avenue to Waltham St E-S WBL 100907 10 7 7 0 0.00% 0.0 � 99.8 12.9 28.9 C
Winston churchill avenue to Guildhall Walk E-NE WBR 100907 12 23 23 0 0.00% 0.0 � 99.8 12.9 57.1 E
Winston churchill avenue to Cambridge Road E-SW WBT 100907 100883 164 163 1 0.61% 0.1 � 99.8 12.9 49.0 D
Winston churchill avenue to Hampshire Terrace E-S WBL 100907 100889 99 97 2 2.06% 0.2 � 99.8 12.9 40.3 D
Winston churchill avenue to Winston churchill avenue E-E WBU 100907 100902 9 8 1 12.50% 0.3 � 99.8 12.9 57.9 E
Winston churchill avenue to Anglesea Road E-N WBR 100907 100859 166 168 -2 -1.19% 0.2 � 99.8 12.9 50.6 D
Anglesea Road to Wiltshire Street N-E SBL 100869 9 43 55 -12 -21.82% 1.7 � 75.1 1.7 28.3 D
Anglesea Road to Waltham St N-S SBT 100869 10 0 0 0 0.00% 0.0 � 75.1 1.7 0.0 A
Anglesea Road to Guildhall Walk N-NE SBL 100869 12 17 17 0 0.00% 0.0 � 75.1 1.7 11.1 B
Anglesea Road to Cambridge Road N-SW SBR 100869 100883 172 172 0 0.00% 0.0 � 75.1 1.7 32.5 D
Anglesea Road to Hampshire Terrace N-S SBT 100869 100889 735 726 9 1.24% 0.3 � 75.1 1.7 28.6 D
Anglesea Road to Winston churchill avenue N-E SBL 100869 100902 100 88 12 13.64% 1.2 � 75.1 1.7 10.2 B
Anglesea Road to Anglesea Road N-N SBU 100869 100859 117 119 -2 -1.68% 0.2 � 75.1 1.7 38.3 E
All 0 0 2726 2712 14 0.52% - - 186.7 6.1 29.2 D
511 Park Road Park Road to Anglesea Road W-N EBL 100879 100859 229 226 3 1.33% 0.2 � 116.6 18.8 51.7 D
Anglesea Road SB to Park Road N-W SBR 100862 100880 174 162 12 7.41% 0.9 � 228.3 40.4 69.6 E
Anglesea Road SB to Anglesea Road SB N-S SBT 100862 100865 1184 1181 3 0.25% 0.1 � 228.3 40.4 19.9 B
Anglesea Road to Park Road S-W NBL 100859 100880 40 45 -5 -11.11% 0.8 � 145.2 8.9 12.1 B
Anglesea Road to Anglesea Road S-N NBT 100859 100859 967 1090 -123 -11.28% 3.8 � 145.2 8.9 10.9 B
All 0 0 2594 2704 -110 -4.07% - - 228.3 23.5 22.6 C
512 Princess Royal Road Princess Royal Road to Mile end Road NB W-N EBL 100681 101021 613 598 15 2.51% 0.6 � 224.0 50.0 49.5 D
Mile end Road SB to Princess Royal Road NE-W WBT 4 100682 92 89 3 3.37% 0.3 � 31.8 3.3 32.7 C
Mile end Road NB to Princess Royal Road S-W NBL 3 100682 74 74 0 0.00% 0.0 � 35.7 0.9 12.0 B
Mile end Road NB to Mile end Road NB S-N NBT 100612 101021 2721 2804 -83 -2.96% 1.6 � 229.4 30.7 15.4 B
All 0 0 3501 3565 -64 -1.80% - - 229.4 21.2 21.8 C
0 NETWORK TOTALS All 41749 42682 -933 -2.19% - 100% 236.0 17.8 26.2 D
17
:00
-18
:00
26/09/2014 11:59 Node Evaluation Results_PM.xlsm

501 Rudmore Roundabout M275 SB to M275 NB NW-S SBT 101011 101011 2015 1974 41 2.08% 0.9 � 0.0 0.0 1.6 A
M275 NB to M275 SB S-NW SBT 101022 101022 1474 1432 42 2.93% 1.1 � 0.0 0.0 0.9 A
A2047 Kingston Cresent to Wharf Road E-W WBT 101211 101412 29 25 4 16.00% 0.8 � 74.6 4.9 5.4 A
A2047 Kingston Cresent to M275 NB Service Road E-S WBL 101211 1010121 74 81 -7 -8.64% 0.8 � 74.6 4.9 2.1 A
A2047 Kingston Cresent to A2047 Kingston Cresent E-SE WBL 101211 101222 0 0 0 0.00% 0.0 � 74.6 4.9 0.0 A
A2047 Kingston Cresent to A3 Twyford Avenue E-NE WBU 101211 101621 156 142 14 9.86% 1.1 � 74.6 4.9 12.8 B
A2047 Kingston Cresent to M275 SB Service Road E-NW WBR 101211 101711 336 313 23 7.35% 1.3 � 74.6 4.9 11.7 B
M275 SB Service Road to Wharf Road NW-W SBR 101311 101412 153 148 5 3.38% 0.4 � 231.5 45.8 43.1 E
M275 SB Service Road to A3 Twyford Avenue NW-NE SBL 101311 101621 290 260 30 11.54% 1.8 � 231.5 45.8 87.0 F
M275 SB Service Road to M275 SB Service Road NW-NW SBU 101311 101711 12 11 1 9.09% 0.3 � 231.5 45.8 73.1 F
M275 SB Service Road to A2047 Kingston Cresent NW-SE SBL 101311 101222 460 442 18 4.07% 0.8 � 231.5 45.8 63.8 F
M275 SB Service Road to M275 NB Service Road NW-S SBT 101311 1010121 41 47 -6 -12.77% 0.9 � 231.5 45.8 47.4 E
A3 Twyford Avenue to Wharf Road NE-W WBT 101321 101412 4 4 0 0.00% 0.0 � 192.8 4.1 20.0 C
A3 Twyford Avenue to A3 Twyford Avenue NE-NE WBU 101321 101621 0 0 0 0.00% 0.0 � 192.8 4.1 0.0 A
A3 Twyford Avenue to M275 SB Service Road NE-NW WBR 101321 101711 168 163 5 3.07% 0.4 � 192.8 4.1 19.5 C
A3 Twyford Avenue to A2047 Kingston Cresent NE-SE WBL 101321 101222 118 118 0 0.00% 0.0 � 192.8 4.1 11.7 B
A3 Twyford Avenue to M275 NB Service Road NE-S WBU 101321 1010121 377 368 9 2.45% 0.5 � 192.8 4.1 19.6 C
Wharf Road to Wharf Road W-W EBU 101531 101412 2 2 0 0.00% 0.0 � 43.8 0.9 20.8 C
Wharf Road to A3 Twyford Avenue W-NE EBT 101531 101621 19 19 0 0.00% 0.0 � 43.8 0.9 34.6 D
Wharf Road to M275 SB Service Road W-NW EBL 101531 101711 128 119 9 7.56% 0.8 � 43.8 0.9 28.0 D
Wharf Road to A2047 Kingston Cresent W-SE EBT 101531 101222 29 29 0 0.00% 0.0 � 43.8 0.9 37.1 E
Wharf Road to M275 NB Service Road W-S WBR 101531 1010121 61 61 0 0.00% 0.0 � 43.8 0.9 34.8 D
M275 NB Service Road to Wharf Road S-W NBL 101423 101412 38 38 0 0.00% 0.0 � 89.3 0.3 2.1 A
M275 NB Service Road to A3 Twyford Avenue S-NE NBR 101423 101621 303 311 -8 -2.57% 0.5 � 89.3 0.3 15.6 C
M275 NB Service Road to M275 SB Service Road S-NW NBT 101423 101711 55 59 -4 -6.78% 0.5 � 89.3 0.3 5.3 A
M275 NB Service Road to A2047 Kingston Cresent S-SE NBR 101423 101222 91 95 -4 -4.21% 0.4 � 89.3 0.3 13.3 B
M275 NB Service Road to M275 NB Service Road S-S NBU 101423 1010121 5 5 0 0.00% 0.0 � 89.3 0.3 11.3 B
All 0 0 6438 6266 172 3% - - 231.5 10.4 16.1 C
502 Mile End Roundabout Mile End Road to Mile End Road N-N SBU 100613 100612 49 49 0 0.00% 0.0 � 128.4 11.9 57.4 E
Mile End Road to Commercial Road N-S SBT 100613 100111 1915 1881 34 1.81% 0.8 � 128.4 11.9 12.9 B
Mile End Road to Church Street N-E SBL 100613 100311 548 542 6 1.11% 0.3 � 128.4 11.9 17.2 B
Hope Street to Mile End Road SW-N NBT 100033 100612 1120 1159 -39 -3.36% 1.2 � 224.2 13.8 14.4 B
Hope Street to Mile End Road SW-N NBT 100641 100612 0 0 0 0.00% 0.0 � 42.1 1.3 0.0 A
Hope Street to Commercial Road SW-S NBU 100641 100111 39 76 -37 -48.68% 4.9 � 42.1 1.3 98.6 F
Hope Street to Church Street SW-E NBR 100641 100311 58 59 -1 -1.69% 0.1 � 42.1 1.3 89.2 F
Commercial Road to Mile End Road S-N NBT 100632 100612 261 236 25 10.59% 1.6 � 26.9 0.4 34.1 C
Commercial Road to Commercial Road S-S NBU 100632 100111 10 19 -9 -47.37% 2.4 � 26.9 0.4 70.9 E
Commercial Road to Church Street S-E NBR 100632 100311 15 21 -6 -28.57% 1.4 � 26.9 0.4 70.0 E
Church Street to Mile End Road E-N WBR 100621 100612 364 356 8 2.25% 0.4 � 172.8 20.1 57.7 E
Church Street to Commercial Road E-S WBL 100621 100111 20 20 0 0.00% 0.0 � 172.8 20.1 52.8 D
Church Street to Church Street E-E WBU 100621 100311 0 0 0 0.00% 0.0 � 172.8 20.1 0.0 A
All 0 0 4399 4418 -19 -0.43% - - 224.2 8.8 21.5 C
503 Cascade's Approach Cascade's Approach to Cascade's Approach S-SW NBL 100826 100827 0 0 0 0.00% 0.0 � 46.2 0.8 0.0 A
Cascade's Approach to Marketway WB S-E NBR 100826 100801 34 29 5 17.24% 0.9 � 46.2 0.8 18.5 C
Cascade's Approach to Marketway EB S-W NBL 100826 100825 4 6 -2 -33.33% 0.9 � 46.2 0.8 9.9 A
Marketway WB to Cascade's Approach NE-SW WBT 2 100827 3 2 1 50.00% 0.6 � 203.9 7.6 4.7 A
Marketway WB to Marketway WB NE-E WBL 2 100801 35 39 -4 -10.26% 0.7 � 203.9 7.6 13.8 B
Marketway WB to Marketway EB NE-W WBT 2 100825 1654 1669 -15 -0.90% 0.4 � 203.9 7.6 12.2 B
Marketway EB to Cascade's Approach SW-SW EBU 100824 100827 0 3 -3 -100.00% 2.4 � 39.7 0.1 0.0 A
Marketway EB to Hope Street SW-N EBL 100042 100042 1044 1127 -83 -7.36% 2.5 � 0.0 0.0 2.5 A
Marketway WB to Marketway EB NE-W WBT 2 79 21 24 -3 -12.50% 0.6 � 0.0 0.0 5.6 A
Marketway EB to Marketway WB SW-E EBT 100824 100801 146 116 30 25.86% 2.6 � 39.7 0.1 3.6 A
Marketway EB to Marketway EB SW-W NBL 100824 100825 24 13 11 84.62% 2.6 � 39.7 0.1 3.5 A
All 0 0 2964 3028 -64 -2.11% - - 203.9 2.3 8.3 A
504 Marketway Roundabout Commercial Road NB to Commercial Road SB S-N NBT 100805 100113 4 7 -3 -42.86% 1.3 � 37.6 1.9 39.6 E
Commercial Road NB to Marketway S-W NBL 100805 1 8 7 1 14.29% 0.4 � 37.6 1.9 47.2 E
Commercial Road NB to Cornmill street S-SE NBR 100805 100808 6 4 2 50.00% 0.9 � 37.6 1.9 19.5 C
Commercial Road SB to Commercial Road SB N-N SBU 100111 100113 9 12 -3 -25.00% 0.9 � 162.0 6.5 14.2 B
Commercial Road SB to Marketway N-W SBR 100111 1 1566 1566 0 0.00% 0.0 � 162.0 6.5 16.6 C
Commercial Road SB to Cornmill street N-SE SBT 100111 100808 428 418 10 2.39% 0.5 � 162.0 6.5 11.4 B
Marketway to Commercial Road SB W-N EBL 100804 100113 93 83 10 12.05% 1.1 � 54.0 0.3 7.9 A
Marketway to Marketway W-W EBU 100804 1 1 4 -3 -75.00% 1.9 � 54.0 0.3 5.3 A
Marketway to Cornmill street W-SE EBT 100804 100808 88 93 -5 -5.38% 0.5 � 54.0 0.3 10.0 A
Cornmill street to Commercial Road NB E-SW WBT 100806 100807 12 19 -7 -36.84% 1.8 � 53.2 0.3 0.4 A
Cornmill street to Commercial Road SB E-N WBR 100806 100113 179 173 6 3.47% 0.5 � 67.4 2.5 12.9 B
Cornmill street to Marketway E-W WBT 100806 1 124 123 1 0.81% 0.1 � 67.4 2.5 12.4 B
Cornmill street to Cornmill street E-SE WBL 100806 100808 0 0 0 0.00% 0.0 � 67.4 2.5 0.0 A
All 0 0 2519 2509 10 0.40% - - 162.0 2.6 14.7 B
505 A2030 roundabout Lake Road NB to Lake Road NB SW-W NBL 100814 100818 0 0 0 0.00% 0.0 � 14.5 0.0 0.0 A
Lake Road NB to Cornmill street SW-NW EBL 100814 100806 107 105 2 1.90% 0.2 � 14.5 0.0 2.1 A
Lake Road NB to Lake Road SB SW-E EBT 100814 100816 59 59 0 0.00% 0.0 � 14.5 0.0 1.6 A
Cornmill street to Lake Road NB NW-W SBR 100808 100818 35 36 -1 -2.78% 0.2 � 15.9 0.4 4.1 A
Cornmill street to Cornmill street NW-NW SBU 100808 100806 12 19 -7 -36.84% 1.8 � 15.9 0.4 4.5 A
Cornmill street to Lake Road SB NW-E SBL 100808 100816 477 479 -2 -0.42% 0.1 � 15.9 0.4 3.9 A
Lake Road SB to Lake Road NB E-W WBT 100817 100818 8 9 -1 -11.11% 0.3 � 35.0 0.4 4.8 A
Lake Road SB to Cornmill street E-NW WBT 100817 100806 194 191 3 1.57% 0.2 � 35.0 0.4 4.3 A
Lake Road SB to Lake Road SB E-E WBU 100817 100816 0 0 0 0.00% 0.0 � 35.0 0.4 0.0 A
All 0 0 891 898 -7 -0.78% - - 35.0 0.3 3.6 A
506 Holbrook Road Roundabout Lake Road SB to Lake Road SB NE-E WBL 100820 100819 4 4 0 0.00% 0.0 � 223.7 10.8 10.4 B
Lake Road SB to Holbrook Road NE-S WBR 100820 100821 204 201 3 1.49% 0.2 � 223.7 10.8 21.3 C
Lake Road SB to Church Street NE-NW WBR 100820 100313 51 51 0 0.00% 0.0 � 223.7 10.8 19.7 C
Lake Road SB to Lake Road NB NE-W WBT 100820 100817 118 119 -1 -0.84% 0.1 � 223.7 10.8 24.5 C
Holbrook Road to Lake Road SB SE-E NBR 100847 100819 207 208 -1 -0.48% 0.1 � 109.2 1.4 8.8 A
Holbrook Road to Holbrook Road SE-S NBL 100847 100821 0 0 0 0.00% 0.0 � 109.2 1.4 1.7 A
Holbrook Road to Church Street SE-NW NBT 100847 100313 303 297 6 2.02% 0.3 � 109.2 1.4 8.1 A
Holbrook Road to Lake Road NB SE-W NBL 100847 100817 78 77 1 1.30% 0.1 � 109.2 1.4 4.1 A
Church Street to Lake Road SB NW-E SBL 100311 100819 53 53 0 0.00% 0.0 � 163.8 8.9 21.6 C
Church Street to Holbrook Road NW-S SBT 100311 100821 321 329 -8 -2.43% 0.4 � 163.8 8.9 21.9 C
Church Street to Church Street NW-NW SBU 100311 100313 0 0 0 0.00% 0.0 � 163.8 8.9 0.0 A
Church Street to Lake Road NB NW-W SBR 100311 100817 3 3 0 0.00% 0.0 � 163.8 8.9 29.5 D
Lake Road NB to Lake Road SB SW-E EBT 100816 100819 156 156 0 0.00% 0.0 � 223.6 10.5 15.1 C
Lake Road NB to Holbrook Road SW-S EBR 100816 100821 380 377 3 0.80% 0.2 � 223.6 10.5 16.0 C
Lake Road NB to Church Street SW-NW EBL 100816 100313 4 4 0 0.00% 0.0 � 223.6 10.5 12.2 B
Lake Road NB to Lake Road NB SW-W NBL 100816 100817 1 1 0 0.00% 0.0 � 223.6 10.5 13.5 B
All 0 0 1882 1880 2 0.11% - - 223.7 7.9 15.8 C
507 Unicorn Road Unicorn Road WB to Market Way NW-NE SBL 100837 100035 11 13 -2 -15.38% 0.6 � 13.2 0.6 38.2 D
Unicorn Road WB to Unicorn Road EB NW-S SBT 100837 100840 5 3 2 66.67% 1.0 � 13.9 0.8 39.9 D
Unicorn Road WB to Alfred Road NW-SW SBR 100837 100843 11 9 2 22.22% 0.6 � 13.9 0.8 44.4 D
Market Way to Unicorn Road WB NE-NW WBR 100825 100841 12 6 6 100.00% 2.0 � 217.8 2.9 17.1 B
Market Way to Unicorn Road EB NE-S WBU 100825 100840 297 294 3 1.02% 0.2 � 217.8 2.9 6.4 A
Market Way to Alfred Road NE-SW WBT 100825 100843 1406 1388 18 1.30% 0.5 � 217.8 2.9 10.3 B
Unicorn Road EB to Unicorn Road WB S-NW NBT 100851 100841 2 2 0 0.00% 0.0 � 73.6 5.4 25.4 C
Unicorn Road EB to Market Way S-NE NBR 100851 100035 115 134 -19 -14.18% 1.7 � 73.6 5.4 31.5 C
Unicorn Road EB to Alfred Road S-SW NBL 100851 100843 25 29 -4 -13.79% 0.8 � 53.3 1.0 29.1 C
Alfred Road to Unicorn Road WB SW-NW EBL 100037 100841 7 8 -1 -12.50% 0.4 � 138.8 6.7 8.0 A
Alfred Road to Market Way SW-NE EBT 100037 100035 1092 1112 -20 -1.80% 0.6 � 138.8 6.7 8.7 A
All 0 0 2982 2998 -16 -0.53% - - 217.8 3.3 10.6 B
508 Stanhope Road Stanhope Road to Stanhope Road S-S NBU 100849 100850 0 0 0 0.00% 0.0 � 20.9 0.0 0.0 A
Stanhope Road to Edinburgh Road WB S-SE NBR 100849 100853 0 4 -4 -100.00% 2.8 � 20.9 0.0 0.0 A
Stanhope Road to Unicorn road S-N NBT 100849 100842 118 126 -8 -6.35% 0.7 � 20.9 0.0 3.8 A
Stanhope Road to Edinburgh Road EB S-W NBL 100849 100854 8 15 -7 -46.67% 2.1 � 20.9 0.0 12.6 B
Edinburgh Road WB to Stanhope Road E-S WBL 100852 100850 15 8 7 87.50% 2.1 � 46.5 0.2 8.8 A
Edinburgh Road WB to Edinburgh Road WB E-SE WBL 100852 100853 0 1 -1 -100.00% 1.4 � 46.5 0.2 0.0 A
Edinburgh Road WB to Unicorn road E-N WBR 100852 100842 22 30 -8 -26.67% 1.6 � 46.5 0.2 13.6 B
Edinburgh Road WB to Edinburgh Road EB E-W WBT 100852 100854 42 33 9 27.27% 1.5 � 46.5 0.2 13.3 B
Unicorn road to Stanhope Road N-S SBT 100848 100850 274 253 21 8.30% 1.3 � 44.1 0.0 0.9 A
Unicorn road to Edinburgh Road WB N-SE SBT 100848 100853 20 23 -3 -13.04% 0.6 � 44.1 0.0 1.7 A
Unicorn road to Unicorn road N-N SBU 100848 100842 0 5 -5 -100.00% 3.2 � 44.1 0.0 0.0 A
Unicorn road to Edinburgh Road EB N-W SBR 100848 100854 8 16 -8 -50.00% 2.3 � 44.1 0.0 1.1 A
Edinburgh Road EB to Stanhope Road W-S EBR 100855 100850 4 15 -11 -72.99% 3.5 � 30.8 0.0 17.0 C
Edinburgh Road EB to Edinburgh Road WB W-SE EBT 100855 100853 12 21 -9 -42.99% 2.2 � 30.8 0.0 9.6 A
Edinburgh Road EB to Unicorn road W-N EBL 100855 100842 0 4 -4 -100.00% 2.9 � 30.8 0.0 2.0 A
Edinburgh Road EB to Edinburgh Road EB W-W EBU 100855 100854 0 0 0 0.00% 0.0 � 30.8 0.0 0.0 A
All 0 0 523 554 -31 -5.60% - - 46.5 0.1 3.8 A
509 Queen Street Queen St to Alfred Road W-NE EBL 100039 100037 274 258 16 6.20% 1.0 � 59.0 7.1 22.9 C
Queen St to Bishop Crispian Way W-E EBT 100039 100855 16 40 -24 -60.00% 4.5 � 42.7 2.0 53.4 D
Alfred Road to Queen St NE-W WBT 97 100863 317 310 7 2.26% 0.4 � 224.8 28.3 47.2 D
Alfred Road to Anglesea Road NE-S WBR 100844 100862 1128 1116 12 1.08% 0.4 � 223.7 5.9 7.9 A
Bishop Crispian Way to Queen St E-W WBT 100857 100863 59 64 -5 -7.81% 0.6 � 52.6 6.9 55.0 E
Anglesea Road to Queen St S-W NBL 100859 100863 29 22 7 31.82% 1.4 � 29.2 0.3 12.1 B
Anglesea Road to Alfred Road S-NE NBR 100859 100037 818 862 -44 -5.10% 1.5 � 108.0 8.3 13.7 B
All 0 0 2641 2672 -31 -1.16% - - 224.8 8.4 17.4 B
510 St Michael's Gyratory St Paul's Road to Wiltshire Street S-E NBR 11 9 0 0 0 0.00% 0.0 � 24.3 0.3 0.0 A
St Paul's Road to Waltham St S-S NBU 11 10 0 0 0 0.00% 0.0 � 24.3 0.3 0.0 A
St Paul's Road to Guildhall Walk S-NE NBT 11 12 0 0 0 0.00% 0.0 � 24.3 0.3 0.0 A
St Paul's Road to Cambridge Road S-SW NBL 11 100883 0 0 0 0.00% 0.0 � 24.3 0.3 0.0 A
St Paul's Road to Hampshire Terrace S-S NBU 11 100889 0 0 0 0.00% 0.0 � 24.3 0.3 0.0 A
St Paul's Road to Winston churchill avenue S-E NBR 11 100902 0 0 0 0.00% 0.0 � 24.3 0.3 0.0 A
St Paul's Road to Anglesea Road S-N NBT 11 100859 60 59 1 1.69% 0.1 � 24.3 0.3 11.0 B
Cambridge Road to Wiltshire Street SW-E EBT 100882 9 1 1 0 0.00% 0.0 � 77.9 1.0 15.7 B
Cambridge Road to Waltham St SW-S EBR 100882 10 0 0 0 0.00% 0.0 � 77.9 1.0 0.0 A
Cambridge Road to Guildhall Walk SW-NE EBT 100882 12 16 16 0 0.00% 0.0 � 77.9 1.0 17.4 B
Cambridge Road to Cambridge Road SW-SW EBU 100882 100883 1 1 0 0.00% 0.0 � 77.9 1.0 24.7 C
Cambridge Road to Hampshire Terrace SW-S EBR 100882 100889 8 4 4 100.00% 1.6 � 77.9 1.0 23.1 C
Cambridge Road to Winston churchill avenue SW-E EBT 100882 100902 131 127 4 3.15% 0.4 � 77.9 1.0 17.1 B
Cambridge Road to Anglesea Road SW-N EBL 100882 100859 220 228 -8 -3.51% 0.5 � 77.9 1.0 7.6 A
Hampshire Terrace to Wiltshire Street S-E NBR 100888 9 0 0 0 0.00% 0.0 � 119.0 4.2 0.0 A
Hampshire Terrace to Waltham St S-S NBU 100888 10 0 0 0 0.00% 0.0 � 119.0 4.2 0.0 A
Hampshire Terrace to Guildhall Walk S-NE NBT 100888 12 10 11 -1 -9.09% 0.3 � 119.0 4.2 24.0 C
Hampshire Terrace to Cambridge Road S-SW NBL 100888 100883 17 15 2 13.33% 0.5 � 119.0 4.2 15.9 C
Hampshire Terrace to Hampshire Terrace S-S NBU 100888 100889 5 0 5 0.00% 3.2 � 119.0 4.2 32.4 D
Hampshire Terrace to Winston churchill avenue S-E NBR 100888 100902 53 52 1 1.92% 0.1 � 119.0 4.2 24.7 C
Hampshire Terrace to Anglesea Road S-N NBT 100888 100859 323 326 -3 -0.92% 0.2 � 119.0 4.2 15.7 C
Winston churchill avenue to Wiltshire Street E-E WBU 100907 9 4 4 0 0.00% 0.0 � 53.0 8.6 29.0 C
Winston churchill avenue to Waltham St E-S WBL 100907 10 12 11 1 9.09% 0.3 � 53.0 8.6 24.4 C
Winston churchill avenue to Guildhall Walk E-NE WBR 100907 12 11 10 1 10.00% 0.3 � 53.0 8.6 46.1 D
Winston churchill avenue to Cambridge Road E-SW WBT 100907 100883 160 160 0 0.00% 0.0 � 53.0 8.6 36.6 D
Winston churchill avenue to Hampshire Terrace E-S WBL 100907 100889 111 106 5 4.72% 0.5 � 53.0 8.6 30.0 C
Winston churchill avenue to Winston churchill avenue E-E WBU 100907 100902 13 14 -1 -7.14% 0.3 � 53.0 8.6 43.3 D
Winston churchill avenue to Anglesea Road E-N WBR 100907 100859 95 99 -4 -4.04% 0.4 � 53.0 8.6 38.3 D
Anglesea Road to Wiltshire Street N-E SBL 100869 9 36 34 2 5.88% 0.3 � 80.7 1.0 20.0 C
Anglesea Road to Waltham St N-S SBT 100869 10 0 0 0 0.00% 0.0 � 80.7 1.0 0.0 A
Anglesea Road to Guildhall Walk N-NE SBL 100869 12 4 6 -2 -33.33% 0.9 � 80.7 1.0 7.2 A
Anglesea Road to Cambridge Road N-SW SBR 100869 100883 178 174 4 2.30% 0.3 � 80.7 1.0 24.0 C
Anglesea Road to Hampshire Terrace N-S SBT 100869 100889 601 595 6 1.01% 0.2 � 80.7 1.0 20.1 C
Anglesea Road to Winston churchill avenue N-E SBL 100869 100902 70 80 -10 -12.50% 1.2 � 80.7 1.0 8.2 A
Anglesea Road to Anglesea Road N-N SBU 100869 100859 26 29 -3 -10.34% 0.6 � 80.7 1.0 26.0 D
All 0 0 2165 2162 3 0.14% - - 119.0 3.0 20.7 C
511 Park Road Park Road to Anglesea Road W-N EBL 100879 100859 192 191 1 0.52% 0.1 � 80.3 9.3 32.8 C
Anglesea Road SB to Park Road N-W SBR 100862 100880 217 196 21 10.71% 1.5 � 224.7 13.4 34.4 C
Anglesea Road SB to Anglesea Road SB N-S SBT 100862 100865 914 920 -6 -0.65% 0.2 � 224.7 13.4 7.1 A
Anglesea Road to Park Road S-W NBL 100859 100880 55 54 1 1.85% 0.1 � 83.0 5.7 11.3 B
Anglesea Road to Anglesea Road S-N NBT 100859 100859 643 693 -50 -7.22% 1.9 � 83.0 5.7 10.0 A
All 0 0 2020 2054 -34 -1.66% - - 224.7 9.5 13.5 B
512 Princess Royal Road Princess Royal Road to Mile end Road NB W-N EBL 100681 101021 224 215 9 4.19% 0.6 � 100.3 5.8 20.6 C
Mile end Road SB to Princess Royal Road NE-W WBT 4 100682 67 64 3 4.69% 0.4 � 24.3 1.2 17.1 B
Mile end Road NB to Princess Royal Road S-W NBL 3 100682 77 75 2 2.67% 0.2 � 25.3 0.4 6.1 A
Mile end Road NB to Mile end Road NB S-N NBT 100612 101021 1723 1725 -2 -0.12% 0.0 � 106.1 6.0 7.3 A
All 0 0 2090 2079 11 0.53% - - 106.1 3.4 9.0 A
0 Network Total All 31514 31518 -4 -0.01% - 100% 231.5 5.1 14.7 B
Overall Total 114304 116993 -2689 -2.30% - 100% 236.0 12.9 22.7 C
18
:00
-19
:00
26/09/2014 11:59 Node Evaluation Results_PM.xlsm

From To DirectionObserved
AverageLower Upper Accept
Winston Churchill Avenue Anglesea Road Northbound 48 60 45 76 �
Anglesea Road Queen Street (NB) Northbound 124 181 73 288 �
Queen Street (NB)Cascade's
ApproachNorthbound 196 285 143 426 �
Cascade's ApproachMarketway
RoundaboutNorthbound 227 320 169 471 �
Marketway RoundaboutMile End
RoundaboutNorthbound 294 418 201 634 �
Mile End RoundaboutPrincess Royal
RoadNorthbound 333 484 236 731 �
Princess Royal RoadRudmore
RoundaboutNorthbound 395 563 273 853 �
Rudmore RoundaboutPrincess Royal
RoadSouthbound 41 42 36 48 �
Princess Royal RoadMile End
RoundaboutSouthbound 65 70 58 82 �
Mile End RoundaboutMarketway
RoundaboutSouthbound 113 118 97 139 �
Marketway RoundaboutCascade's
ApproachSouthbound 154 157 125 190 �
Cascade's Approach Queen Street(SB) Southbound 228 231 189 272 �
Queen Street(SB) Anglesea Road Southbound 286 307 246 368 �
Anglesea RoadWinston Churchill
AvenueSouthbound 302 318 256 379 �
100.0%
Winston Churchill Avenue Anglesea Road Northbound 52 45 32 59 �
Anglesea Road Queen Street (NB) Northbound 127 126 94 159 �
Queen Street (NB)Cascade's
ApproachNorthbound 185 191 130 251 �
Cascade's ApproachMarketway
RoundaboutNorthbound 215 223 149 296 �
Marketway RoundaboutMile End
RoundaboutNorthbound 293 333 233 434 �
Mile End RoundaboutPrincess Royal
RoadNorthbound 327 379 258 500 �
Princess Royal RoadRudmore
RoundaboutNorthbound 416 481 295 668 �
Rudmore RoundaboutPrincess Royal
RoadSouthbound 41 55 30 80 �
Princess Royal RoadMile End
RoundaboutSouthbound 67 87 42 131 �
Mile End RoundaboutMarketway
RoundaboutSouthbound 119 154 86 222 �
Marketway RoundaboutCascade's
ApproachSouthbound 166 213 110 315 �
Cascade's Approach Queen Street(SB) Southbound 244 326 168 484 �
Queen Street(SB) Anglesea Road Southbound 308 399 219 580 �
Anglesea RoadWinston Churchill
AvenueSouthbound 327 415 230 599 �
100.0%
Winston Churchill Avenue Anglesea Road Northbound 46 45 31 58 �
Anglesea Road Queen Street (NB) Northbound 101 126 86 165 �
Queen Street (NB)Cascade's
ApproachNorthbound 150 179 124 233 �
Cascade's ApproachMarketway
RoundaboutNorthbound 177 210 146 274 �
Marketway RoundaboutMile End
RoundaboutNorthbound 234 263 195 330 �
Mile End RoundaboutPrincess Royal
RoadNorthbound 258 293 219 366 �
Princess Royal RoadRudmore
RoundaboutNorthbound 306 354 271 435 �
Rudmore RoundaboutPrincess Royal
RoadSouthbound 40 42 36 49 �
Princess Royal RoadMile End
RoundaboutSouthbound 61 67 49 85 �
Mile End RoundaboutMarketway
RoundaboutSouthbound 100 106 80 131 �
Marketway RoundaboutCascade's
ApproachSouthbound 141 138 104 172 �
Cascade's Approach Queen Street(SB) Southbound 201 203 148 258 �
Queen Street(SB) Anglesea Road Southbound 251 249 188 310 �
Anglesea RoadWinston Churchill
AvenueSouthbound 266 265 202 328 �
100.0%
100.0%
Overall 1700-1800
Overall 1800-1900
Overall 1600-1900
DescriptionAverage Journey Times (secs) All Vehicles
Weighted
Model Average
Average Limits 95% or 15%
Overall 1600-1700
26/09/2014 11:57 Travel Time & Delay Summary_PM.xlsm

0
100
200
300
400
500
600
Winston Churchill
Avenue
Anglesea Road Queen Street (NB) Cascade's
Approach
Marketway
Roundabout
Mile End
Roundabout
Princess Royal
Road
Avera
ge T
ravel T
ime (
sec)
Location
1600-1700 Northbound Travel Time Comparison
Modelled
Observed Average

0
100
200
300
400
500
600
Winston Churchill
Avenue
Anglesea Road Queen Street (NB) Cascade's
Approach
Marketway
Roundabout
Mile End
Roundabout
Princess Royal
Road
Av
era
ge T
arv
el T
ime (
sec)
Location
1700-1800 Northound Travel Time Comparison
Modelled
Observed Average

0
100
200
300
400
500
600
Winston Churchill
Avenue
Anglesea Road Queen Street (NB) Cascade's
Approach
Marketway
Roundabout
Mile End
Roundabout
Princess Royal
Road
Av
era
ge
Tra
ve
l T
ime
(se
c)
Location
1800-1900 Northbound Travel Time Comparison
Model Average
Observed Average

0
50
100
150
200
250
300
350
400
450
Rudmore
Roundabout
Princess Royal
Road
Mile End
Roundabout
Marketway
Roundabout
Cascade's
Approach
Queen Street(SB) Anglesea Road
Av
era
ge
Tra
ve
l T
ime
(se
c)
Location
1600-1700 Southbound Travel Time Comparison
Modelled
Observed Average

0
50
100
150
200
250
300
350
400
450
Rudmore
Roundabout
Princess Royal
Road
Mile End
Roundabout
Marketway
Roundabout
Cascade's
Approach
Queen Street(SB) Anglesea Road
Av
era
ge
Tra
ve
l T
ime
(se
c)
Location
1700-1800 Southbound Travel Time Comparison
Modelled Average
Observed Average

0
50
100
150
200
250
300
350
400
450
Rudmore
Roundabout
Princess Royal
Road
Mile End
Roundabout
Marketway
Roundabout
Cascade's
Approach
Queen Street(SB) Anglesea Road
Av
era
ge
Tra
ve
l T
ime
(se
c)
Location
1800-1900 Southbound Travel Time Comparison
Model Average
Observed Average

Portsmouth AQMA - Corridor 1 - Network Performance 2013 PM Peak Existing Conditions by Random SeedAll Vehicles
Std Random Seed
Measure Average Dev 5 10 15 20 25 30 35 40 45 50 55 60 65 70 75 80
Remaining Vehicles in Network 567 31 567 580 575 569 548 585 570 587 565 525 533 519 586 653 550 559
Processed Vehicles 47561 55 47571 47569 47514 47544 47638 47547 47585 47515 47590 47561 47473 47646 47596 47439 47585 47598
Total Distance Travelled (mi) 113558 251 113932 113518 113795 113334 113814 113786 112965 113449 113608 113480 113233 113792 113449 113553 113734 113491
Total Travel Time (h) 2774.5 99.2 2725 2919 2703 2766 2710 2719 2794 2694 2699 2763 3045 2681 2738 2884 2821 2731
Total Network Delay (h) 933.6 100.3 882 1078 857 927 865 875 962 856 857 925 1207 837 899 1042 976 893
Average Travel Time (mins) 3.46 0.13 3.40 3.64 3.37 3.45 3.37 3.39 3.48 3.36 3.36 3.45 3.81 3.34 3.41 3.60 3.52 3.40
Average Delay Time (mins) 1.16 0.13 1.10 1.34 1.07 1.16 1.08 1.09 1.20 1.07 1.07 1.15 1.51 1.04 1.12 1.30 1.22 1.11
Total Stopped Delay (h) 467.9 39.7 446.2 506.9 448.4 458.8 442.2 448.8 485.6 437.7 442.5 472.2 596.4 430.9 456.5 475.6 477.5 459.5
Average Stopped Delay (s) 35.0 3.0 33.4 37.9 33.6 34.3 33.0 33.6 36.3 32.8 33.1 35.4 44.7 32.2 34.1 35.6 35.7 34.4
Number of Stops 89170.9 9686.0 85994 103381 80760 89076 81994 82308 92610 81111 81794 89103 114735 79486 86897 100044 92153 85288
Average Number of Stops 1.85 0.20 1.79 2.15 1.68 1.85 1.70 1.71 1.92 1.69 1.70 1.85 2.39 1.65 1.80 2.08 1.91 1.77
Average Network Speed (mph) 25.5 0.9 26.0 24.2 26.2 25.5 26.1 26.0 25.1 26.2 26.2 25.5 23.1 26.4 25.7 24.5 25.0 25.8
Rank (based on Avg Speed) 7 15 3 11 5 6 12 2 4 10 16 1 9 14 13 8
Network Performance Summary_PM.xlsm 26/09/201411:52

54
Portsmouth Corridor 1 Air Quality Management Area VISSIM Model Assessment
D. 2013 Existing Inter Peak Model Output Results

Portsmouth AQMA - Corridor 1 - Existing Conditions 2013 IP Peak
Links Volume Queue Length (m) Delay (secs)
Time Node Description Direction Movement From To Model Count Mod-Cnt % Diff* GEH Accept Max Average Average LOS†
501 Rudmore Roundabout M275 SB to M275 NB NW-S SBT 101011 101011 1435 1410 25 1.77% 0.7 � 0.0 0.0 0.9 A
M275 NB to M275 SB S-NW SBT 101022 101022 1304 1369 -65 -4.75% 1.8 � 0.0 0.0 0.8 A
A2047 Kingston Cresent to Wharf Road E-W WBT 101211 101412 21 23 -2 -8.70% 0.4 � 78.2 5.9 7.2 A
A2047 Kingston Cresent to M275 NB Service Road E-S WBL 101211 1010121 95 101 -6 -5.94% 0.6 � 78.2 5.9 2.4 A
A2047 Kingston Cresent to A2047 Kingston Cresent E-SE WBL 101211 101222 0 0 0 0.00% 0.0 � 78.2 5.9 0.0 A
A2047 Kingston Cresent to A3 Twyford Avenue E-NE WBU 101211 101621 129 128 1 0.78% 0.1 � 78.2 5.9 14.6 B
A2047 Kingston Cresent to M275 SB Service Road E-NW WBR 101211 101711 300 303 -3 -0.99% 0.2 � 78.2 5.9 13.2 B
M275 SB Service Road to Wharf Road NW-W SBR 101311 101412 126 133 -7 -5.26% 0.6 � 141.2 4.6 7.0 A
M275 SB Service Road to A3 Twyford Avenue NW-NE SBL 101311 101621 111 105 6 5.71% 0.6 � 141.2 4.6 16.3 C
M275 SB Service Road to M275 SB Service Road NW-NW SBU 101311 101711 25 23 2 8.70% 0.4 � 141.2 4.6 7.3 A
M275 SB Service Road to A2047 Kingston Cresent NW-SE SBL 101311 101222 224 230 -6 -2.61% 0.4 � 141.2 4.6 17.2 C
M275 SB Service Road to M275 NB Service Road NW-S SBT 101311 1010121 74 90 -16 -17.78% 1.8 � 141.2 4.6 13.0 B
A3 Twyford Avenue to Wharf Road NE-W WBT 101321 101412 22 23 -1 -4.35% 0.2 � 86.5 2.6 14.1 B
A3 Twyford Avenue to A3 Twyford Avenue NE-NE WBU 101321 101621 21 20 1 5.00% 0.2 � 86.5 2.6 16.4 C
A3 Twyford Avenue to M275 SB Service Road NE-NW WBR 101321 101711 92 90 2 2.22% 0.2 � 86.5 2.6 16.1 C
A3 Twyford Avenue to A2047 Kingston Cresent NE-SE WBL 101321 101222 115 116 -1 -0.86% 0.1 � 86.5 2.6 13.3 B
A3 Twyford Avenue to M275 NB Service Road NE-S WBU 101321 1010121 429 431 -2 -0.46% 0.1 � 86.5 2.6 19.1 C
Wharf Road to Wharf Road W-W EBU 101531 101412 4 4 0 0.00% 0.0 � 85.0 2.5 52.5 F
Wharf Road to A3 Twyford Avenue W-NE EBT 101531 101621 21 20 1 5.00% 0.2 � 85.0 2.5 41.1 E
Wharf Road to M275 SB Service Road W-NW EBL 101531 101711 95 92 3 3.26% 0.3 � 85.0 2.5 27.3 D
Wharf Road to A2047 Kingston Cresent W-SE EBT 101531 101222 14 14 0 0.00% 0.0 � 85.0 2.5 49.2 E
Wharf Road to M275 NB Service Road W-S WBR 101531 1010121 56 59 -3 -5.08% 0.4 � 85.0 2.5 43.7 E
M275 NB Service Road to Wharf Road S-W NBL 101423 101412 53 67 -14 -20.90% 1.8 � 82.9 0.2 2.0 A
M275 NB Service Road to A3 Twyford Avenue S-NE NBR 101423 101621 263 283 -20 -7.07% 1.2 � 82.9 0.2 13.1 B
M275 NB Service Road to M275 SB Service Road S-NW NBT 101423 101711 84 93 -9 -9.68% 1.0 � 82.9 0.2 6.2 A
M275 NB Service Road to A2047 Kingston Cresent S-SE NBR 101423 101222 114 131 -17 -12.98% 1.5 � 82.9 0.2 12.0 B
M275 NB Service Road to M275 NB Service Road S-S NBU 101423 1010121 4 0 4 0.00% 2.8 � 82.9 0.2 11.5 B
All 0 0 5230 5358 -128 -2% - - 141.2 2.9 7.7 A
502 Mile End Roundabout Mile End Road to Mile End Road N-N SBU 100613 100612 113 111 2 1.80% 0.2 � 70.6 4.3 47.1 D
Mile End Road to Commercial Road N-S SBT 100613 100111 1454 1454 0 0.00% 0.0 � 70.6 4.3 7.2 A
Mile End Road to Church Street N-E SBL 100613 100311 403 398 5 1.26% 0.2 � 70.6 4.3 9.9 A
Hope Street to Mile End Road SW-N NBT 100033 100612 1110 1143 -33 -2.89% 1.0 � 103.6 7.9 9.1 A
Hope Street to Mile End Road SW-N NBT 100641 100612 0 0 0 0.00% 0.0 � 24.9 0.5 0.0 A
Hope Street to Commercial Road SW-S NBU 100641 100111 18 44 -26 -59.09% 4.7 � 24.9 0.5 70.9 E
Hope Street to Church Street SW-E NBR 100641 100311 54 47 7 14.89% 1.0 � 24.9 0.5 67.2 E
Commercial Road to Mile End Road S-N NBT 100632 100612 348 414 -66 -15.94% 3.4 � 29.5 0.7 37.3 D
Commercial Road to Commercial Road S-S NBU 100632 100111 9 20 -11 -55.00% 2.9 � 29.5 0.7 54.5 D
Commercial Road to Church Street S-E NBR 100632 100311 15 29 -14 -48.28% 3.0 � 29.5 0.7 58.2 E
Church Street to Mile End Road E-N WBR 100621 100612 238 234 4 1.71% 0.3 � 105.3 13.6 57.8 E
Church Street to Commercial Road E-S WBL 100621 100111 11 15 -4 -26.67% 1.1 � 105.3 13.6 55.2 E
Church Street to Church Street E-E WBU 100621 100311 0 0 0 0.00% 0.0 � 105.3 13.6 0.0 A
All 0 0 3773 3909 -136 -3.48% - - 105.3 5.0 16.8 B
503 Cascade's Approach Cascade's Approach to Cascade's Approach S-SW NBL 100826 100827 0 0 0 0.00% 0.0 � 19.8 0.2 0.0 A
Cascade's Approach to Marketway WB S-E NBR 100826 100801 8 8 0 0.00% 0.0 � 19.8 0.2 10.0 B
Cascade's Approach to Marketway EB S-W NBL 100826 100825 2 2 0 0.00% 0.0 � 19.8 0.2 25.6 D
Marketway WB to Cascade's Approach NE-SW WBT 2 100827 12 13 -1 -7.69% 0.3 � 231.3 14.5 4.5 A
Marketway WB to Marketway WB NE-E WBL 2 100801 9 10 -1 -10.00% 0.3 � 231.3 14.5 15.8 C
Marketway WB to Marketway EB NE-W WBT 2 100825 1351 1398 -47 -3.36% 1.3 � 231.3 14.5 16.2 C
Marketway EB to Cascade's Approach SW-SW EBU 100824 100827 0 0 0 0.00% 0.0 � 48.3 0.3 0.0 A
Marketway EB to Hope Street SW-N EBL 100042 100042 1060 1109 -49 -4.42% 1.5 � 0.0 0.0 2.2 A
Marketway WB to Marketway EB NE-W WBT 2 79 32 33 -1 -3.03% 0.2 � 0.0 0.0 5.8 A
Marketway EB to Marketway WB SW-E EBT 100824 100801 346 374 -28 -7.49% 1.5 � 48.3 0.3 5.2 A
Marketway EB to Marketway EB SW-W NBL 100824 100825 7 0 7 0.00% 3.7 � 48.3 0.3 5.5 A
All 0 0 2826 2947 -121 -4.11% - - 231.3 4.1 9.4 A
504 Marketway Roundabout Commercial Road NB to Commercial Road SB S-N NBT 100805 100113 6 8 -2 -25.00% 0.8 � 39.2 2.7 40.3 E
Commercial Road NB to Marketway S-W NBL 100805 1 19 17 2 11.76% 0.5 � 39.2 2.7 34.3 D
Commercial Road NB to Cornmill street S-SE NBR 100805 100808 8 7 1 14.29% 0.4 � 39.2 2.7 25.0 D
Commercial Road SB to Commercial Road SB N-N SBU 100111 100113 79 76 3 3.95% 0.3 � 105.8 4.1 15.8 C
Commercial Road SB to Marketway N-W SBR 100111 1 1191 1218 -27 -2.22% 0.8 � 105.8 4.1 15.5 C
Commercial Road SB to Cornmill street N-SE SBT 100111 100808 231 239 -8 -3.35% 0.5 � 105.8 4.1 8.1 A
Marketway to Commercial Road SB W-N EBL 100804 100113 165 198 -33 -16.67% 2.4 � 68.3 1.3 11.7 B
Marketway to Marketway W-W EBU 100804 1 8 10 -2 -20.00% 0.7 � 68.3 1.3 13.8 B
Marketway to Cornmill street W-SE EBT 100804 100808 182 182 0 0.00% 0.0 � 68.3 1.3 13.4 B
Cornmill street to Commercial Road NB E-SW WBT 100806 100807 11 0 11 0.00% 4.7 � 88.8 0.8 0.9 A
Cornmill street to Commercial Road SB E-N WBR 100806 100113 226 222 4 1.80% 0.3 � 103.1 3.3 11.7 B
Cornmill street to Marketway E-W WBT 100806 1 196 192 4 2.08% 0.3 � 103.1 3.3 11.8 B
Cornmill street to Cornmill street E-SE WBL 100806 100808 0 0 0 0.00% 0.0 � 103.1 3.3 0.0 A
All 0 0 2319 2369 -50 -2.11% - - 105.8 2.7 13.8 B
505 A2030 roundabout Lake Road NB to Lake Road NB SW-W NBL 100814 100818 0 0 0 0.00% 0.0 � 19.9 0.0 0.0 A
Lake Road NB to Cornmill street SW-NW EBL 100814 100806 63 62 1 1.61% 0.1 � 19.9 0.0 3.1 A
Lake Road NB to Lake Road SB SW-E EBT 100814 100816 15 16 -1 -6.25% 0.3 � 19.9 0.0 2.1 A
Cornmill street to Lake Road NB NW-W SBR 100808 100818 70 76 -6 -7.89% 0.7 � 41.7 1.3 2.8 A
Cornmill street to Cornmill street NW-NW SBU 100808 100806 11 0 11 0.00% 4.7 � 41.7 1.3 5.0 A
Cornmill street to Lake Road SB NW-E SBL 100808 100816 338 352 -14 -3.98% 0.8 � 41.7 1.3 3.0 A
Lake Road SB to Lake Road NB E-W WBT 100817 100818 15 14 1 7.14% 0.3 � 70.1 1.9 9.2 A
Lake Road SB to Cornmill street E-NW WBT 100817 100806 359 352 7 1.99% 0.4 � 70.1 1.9 7.6 A
Lake Road SB to Lake Road SB E-E WBU 100817 100816 0 0 0 0.00% 0.0 � 70.1 1.9 0.0 A
All 0 0 871 872 -1 -0.11% - - 70.1 1.1 5.0 A
506 Holbrook Road Roundabout Lake Road SB to Lake Road SB NE-E WBL 100820 100819 0 1 -1 -100.00% 1.4 � 189.4 14.7 5.0 A
Lake Road SB to Holbrook Road NE-S WBR 100820 100821 116 120 -4 -3.33% 0.4 � 189.4 14.7 30.8 D
Lake Road SB to Church Street NE-NW WBR 100820 100313 55 58 -3 -5.17% 0.4 � 189.4 14.7 29.7 D
Lake Road SB to Lake Road NB NE-W WBT 100820 100817 197 199 -2 -1.01% 0.1 � 189.4 14.7 30.8 D
Holbrook Road to Lake Road SB SE-E NBR 100847 100819 119 126 -7 -5.56% 0.6 � 44.0 0.8 6.7 A
Holbrook Road to Holbrook Road SE-S NBL 100847 100821 1 1 0 0.00% 0.0 � 44.0 0.8 2.9 A
Holbrook Road to Church Street SE-NW NBT 100847 100313 131 128 3 2.34% 0.3 � 44.0 0.8 6.3 A
Holbrook Road to Lake Road NB SE-W NBL 100847 100817 171 164 7 4.27% 0.5 � 44.0 0.8 4.5 A
Church Street to Lake Road SB NW-E SBL 100311 100819 57 60 -3 -5.00% 0.4 � 79.3 3.9 13.3 B
Church Street to Holbrook Road NW-S SBT 100311 100821 412 407 5 1.23% 0.2 � 79.3 3.9 13.8 B
Church Street to Church Street NW-NW SBU 100311 100313 0 0 0 0.00% 0.0 � 79.3 3.9 0.0 A
Church Street to Lake Road NB NW-W SBR 100311 100817 3 3 0 0.00% 0.0 � 79.3 3.9 13.1 B
Lake Road NB to Lake Road SB SW-E EBT 100816 100819 134 141 -7 -4.96% 0.6 � 59.7 0.9 4.5 A
Lake Road NB to Holbrook Road SW-S EBR 100816 100821 209 218 -9 -4.13% 0.6 � 59.7 0.9 5.2 A
Lake Road NB to Church Street SW-NW EBL 100816 100313 9 9 0 0.00% 0.0 � 59.7 0.9 4.0 A
Lake Road NB to Lake Road NB SW-W NBL 100816 100817 0 0 0 0.00% 0.0 � 59.7 0.9 0.0 A
All 0 0 1613 1635 -22 -1.35% - - 189.4 5.1 13.6 B
507 Unicorn Road Unicorn Road WB to Market Way NW-NE SBL 100837 100035 373 376 -3 -0.80% 0.2 � 76.7 12.0 33.5 C
Unicorn Road WB to Unicorn Road EB NW-S SBT 100837 100840 18 17 1 5.88% 0.2 � 67.5 4.9 43.4 D
Unicorn Road WB to Alfred Road NW-SW SBR 100837 100843 31 25 6 24.00% 1.1 � 67.5 4.9 40.9 D
Market Way to Unicorn Road WB NE-NW WBR 100825 100841 175 166 9 5.42% 0.7 � 229.0 36.6 97.9 F
Market Way to Unicorn Road EB NE-S WBU 100825 100840 222 207 15 7.25% 1.0 � 229.0 36.6 15.2 B
Market Way to Alfred Road NE-SW WBT 100825 100843 1009 1027 -18 -1.75% 0.6 � 229.0 36.6 28.6 C
Unicorn Road EB to Unicorn Road WB S-NW NBT 100851 100841 87 83 5 5.45% 0.5 � 106.9 13.0 46.1 D
Unicorn Road EB to Market Way S-NE NBR 100851 100035 96 108 -12 -11.11% 1.2 � 106.9 13.0 43.7 D
Unicorn Road EB to Alfred Road S-SW NBL 100851 100843 8 14 -6 -42.86% 1.8 � 31.6 0.5 46.7 D
Alfred Road to Unicorn Road WB SW-NW EBL 100037 100841 146 138 8 5.80% 0.7 � 172.9 22.8 22.4 C
Alfred Road to Market Way SW-NE EBT 100037 100035 947 999 -52 -5.21% 1.7 � 172.9 22.8 22.7 C
All 0 0 3112 3160 -47.5 -1.50% - - 229.0 18.5 31.3 C
508 Stanhope Road Stanhope Road to Stanhope Road S-S NBU 100849 100850 0 0 0 0.00% 0.0 � 29.8 0.1 0.0 A
Stanhope Road to Edinburgh Road WB S-SE NBR 100849 100853 0 1 -1 -100.00% 1.4 � 29.8 0.1 0.0 A
Stanhope Road to Unicorn road S-N NBT 100849 100842 168 175 -7 -4.00% 0.5 � 29.8 0.1 4.3 A
Stanhope Road to Edinburgh Road EB S-W NBL 100849 100854 8 15 -7 -46.67% 2.1 � 29.8 0.1 18.5 C
Edinburgh Road WB to Stanhope Road E-S WBL 100852 100850 2 1 1 100.00% 0.8 � 46.5 0.2 9.6 A
Edinburgh Road WB to Edinburgh Road WB E-SE WBL 100852 100853 0 0 0 0.00% 0.0 � 46.5 0.2 0.0 A
Edinburgh Road WB to Unicorn road E-N WBR 100852 100842 23 28 -5 -17.86% 1.0 � 46.5 0.2 13.5 B
Edinburgh Road WB to Edinburgh Road EB E-W WBT 100852 100854 44 31 13 41.94% 2.1 � 46.5 0.2 17.6 C
Unicorn road to Stanhope Road N-S SBT 100848 100850 194 187 7 3.74% 0.5 � 26.6 0.0 1.3 A
Unicorn road to Edinburgh Road WB N-SE SBT 100848 100853 22 30 -8 -26.67% 1.6 � 26.6 0.0 1.5 A
Unicorn road to Unicorn road N-N SBU 100848 100842 1 1 0 0.00% 0.0 � 26.6 0.0 1.5 A
Unicorn road to Edinburgh Road EB N-W SBR 100848 100854 25 6 19 316.67% 4.8 � 26.6 0.0 1.5 A
Edinburgh Road EB to Stanhope Road W-S EBR 100855 100850 8 17 -9 -51.52% 2.4 � 47.3 0.2 13.2 B
Edinburgh Road EB to Edinburgh Road WB W-SE EBT 100855 100853 27 28 -1 -3.57% 0.2 � 47.3 0.2 15.3 C
Edinburgh Road EB to Unicorn road W-N EBL 100855 100842 0 1 -1 -100.00% 1.0 � 47.3 0.2 0.0 A
Edinburgh Road EB to Edinburgh Road EB W-W EBU 100855 100854 0 0 0 0.00% 0.0 � 47.3 0.2 0.0 A
All 0 0 522 520 2 0.38% - - 47.3 0.2 5.4 A
509 Queen Street Queen St to Alfred Road W-NE EBL 100039 100037 303 293 10 3.41% 0.6 � 71.5 8.9 22.8 C
Queen St to Bishop Crispian Way W-E EBT 100039 100855 35 45 -10 -22.22% 1.6 � 58.1 5.0 67.1 E
Alfred Road to Queen St NE-W WBT 97 100863 292 311 -19 -6.11% 1.1 � 192.2 21.2 43.3 D
Alfred Road to Anglesea Road NE-S WBR 100844 100862 758 755 3 0.40% 0.1 � 123.0 3.5 7.0 A
Bishop Crispian Way to Queen St E-W WBT 100857 100863 77 52 25 48.08% 3.1 � 88.7 9.5 56.9 E
Anglesea Road to Queen St S-W NBL 100859 100863 25 27 -2 -7.41% 0.4 � 56.2 0.4 15.7 B
Anglesea Road to Alfred Road S-NE NBR 100859 100037 783 844 -61 -7.23% 2.1 � 96.0 8.5 15.2 B
All 0 0 2273 2327 -54 -2.32% - - 192.2 8.1 19.3 B
510 St Michael's Gyratory St Paul's Road to Wiltshire Street S-E NBR 11 9 0 0 0 0.00% 0.0 � 15.8 0.1 0.0 A
St Paul's Road to Waltham St S-S NBU 11 10 0 0 0 0.00% 0.0 � 15.8 0.1 0.0 A
St Paul's Road to Guildhall Walk S-NE NBT 11 12 0 0 0 0.00% 0.0 � 15.8 0.1 0.0 A
St Paul's Road to Cambridge Road S-SW NBL 11 100883 0 0 0 0.00% 0.0 � 15.8 0.1 0.0 A
St Paul's Road to Hampshire Terrace S-S NBU 11 100889 0 0 0 0.00% 0.0 � 15.8 0.1 0.0 A
St Paul's Road to Winston churchill avenue S-E NBR 11 100902 0 0 0 0.00% 0.0 � 15.8 0.1 0.0 A
St Paul's Road to Anglesea Road S-N NBT 11 100859 37 37 0 0.00% 0.0 � 15.8 0.1 9.5 A
Cambridge Road to Wiltshire Street SW-E EBT 100882 9 1 0 1 0.00% 1.4 � 88.8 2.0 9.5 A
Cambridge Road to Waltham St SW-S EBR 100882 10 0 0 0 0.00% 0.0 � 88.8 2.0 0.0 A
Cambridge Road to Guildhall Walk SW-NE EBT 100882 12 23 22 1 4.55% 0.2 � 88.8 2.0 24.0 C
Cambridge Road to Cambridge Road SW-SW EBU 100882 100883 2 2 0 0.00% 0.0 � 88.8 2.0 26.8 C
Cambridge Road to Hampshire Terrace SW-S EBR 100882 100889 10 9 1 11.11% 0.3 � 88.8 2.0 23.7 C
Cambridge Road to Winston churchill avenue SW-E EBT 100882 100902 136 132 4 3.03% 0.3 � 88.8 2.0 24.3 C
Cambridge Road to Anglesea Road SW-N EBL 100882 100859 205 208 -3 -1.44% 0.2 � 88.8 2.0 11.2 B
Hampshire Terrace to Wiltshire Street S-E NBR 100888 9 1 1 0 0.00% 0.0 � 125.0 3.5 18.9 C
Hampshire Terrace to Waltham St S-S NBU 100888 10 0 0 0 0.00% 0.0 � 125.0 3.5 0.0 A
Hampshire Terrace to Guildhall Walk S-NE NBT 100888 12 19 18 1 5.56% 0.2 � 125.0 3.5 27.9 D
Hampshire Terrace to Cambridge Road S-SW NBL 100888 100883 20 20 0 0.00% 0.0 � 125.0 3.5 13.9 B
Hampshire Terrace to Hampshire Terrace S-S NBU 100888 100889 3 3 0 0.00% 0.0 � 125.0 3.5 26.9 D
Hampshire Terrace to Winston churchill avenue S-E NBR 100888 100902 77 76 1 1.32% 0.1 � 125.0 3.5 28.5 D
Hampshire Terrace to Anglesea Road S-N NBT 100888 100859 289 289 0 0.00% 0.0 � 125.0 3.5 16.6 C
Winston churchill avenue to Wiltshire Street E-E WBU 100907 9 7 7 0 0.00% 0.0 � 47.1 5.8 20.4 C
Winston churchill avenue to Waltham St E-S WBL 100907 10 19 20 -1 -5.00% 0.2 � 47.1 5.8 14.4 B
Winston churchill avenue to Guildhall Walk E-NE WBR 100907 12 21 22 -1 -4.55% 0.2 � 47.1 5.8 43.0 D
Winston churchill avenue to Cambridge Road E-SW WBT 100907 100883 135 135 0 0.00% 0.0 � 47.1 5.8 31.6 C
Winston churchill avenue to Hampshire Terrace E-S WBL 100907 100889 81 77 4 5.19% 0.5 � 47.1 5.8 20.6 C
Winston churchill avenue to Winston churchill avenue E-E WBU 100907 100902 6 6 0 0.00% 0.0 � 47.1 5.8 46.5 D
Winston churchill avenue to Anglesea Road E-N WBR 100907 100859 99 101 -2 -1.98% 0.2 � 47.1 5.8 31.2 C
Anglesea Road to Wiltshire Street N-E SBL 100869 9 28 27 1 3.70% 0.2 � 65.4 0.8 16.8 C
Anglesea Road to Waltham St N-S SBT 100869 10 0 0 0 0.00% 0.0 � 65.4 0.8 0.0 A
Anglesea Road to Guildhall Walk N-NE SBL 100869 12 40 38 2 5.26% 0.3 � 65.4 0.8 11.3 B
Anglesea Road to Cambridge Road N-SW SBR 100869 100883 101 107 -6 -5.61% 0.6 � 65.4 0.8 22.2 C
Anglesea Road to Hampshire Terrace N-S SBT 100869 100889 349 345 4 1.16% 0.2 � 65.4 0.8 17.4 C
Anglesea Road to Winston churchill avenue N-E SBL 100869 100902 53 58 -5 -8.62% 0.7 � 65.4 0.8 10.8 B
Anglesea Road to Anglesea Road N-N SBU 100869 100859 47 52 -5 -9.62% 0.7 � 65.4 0.8 25.6 D
All 0 0 1807 1812 -5 -0.28% - - 125.0 2.4 20.1 C
511 Park Road Park Road to Anglesea Road W-N EBL 100879 100859 177 175 2 1.14% 0.2 � 92.6 9.4 33.8 C
Anglesea Road SB to Park Road N-W SBR 100862 100880 145 125 20 16.00% 1.7 � 157.1 9.0 34.7 C
Anglesea Road SB to Anglesea Road SB N-S SBT 100862 100865 616 630 -14 -2.22% 0.6 � 157.1 9.0 5.5 A
Anglesea Road to Park Road S-W NBL 100859 100880 0 0 0 0.00% 0.0 � 63.6 5.0 0.0 A
Anglesea Road to Anglesea Road S-N NBT 100859 100859 634 696 -62 -8.91% 2.4 � 63.6 5.0 9.9 A
All 0 0 1571 1626 -55 -3.38% - - 157.1 7.5 13.1 B
512 Princess Royal Road Princess Royal Road to Mile end Road NB W-N EBL 100681 101021 191 190 1 0.53% 0.1 � 78.0 5.4 21.5 C
Mile end Road SB to Princess Royal Road NE-W WBT 4 100682 122 126 -4 -3.17% 0.4 � 38.2 2.5 20.2 C
Mile end Road NB to Princess Royal Road S-W NBL 3 100682 169 151 18 11.92% 1.4 � 53.4 1.1 7.3 A
Mile end Road NB to Mile end Road NB S-N NBT 100612 101021 1629 1751 -122 -6.97% 3.0 � 84.2 5.6 7.3 A
All 0 0 2112 2218 -106 -4.78% - - 84.2 3.7 9.3 A
0 NETWORK TOTALS All All 28028 28753 -725 -2.52% - 100% 231.3 4.3 14.6 B
12
:00
-13
:00
26/09/2014 12:02 Node Evaluation Results_IP.xlsm

501 Rudmore Roundabout M275 SB to M275 NB NW-S SBT 101011 101011 1352 1333 19 1.43% 0.5 � 0.0 0.0 0.8 A
M275 NB to M275 SB S-NW SBT 101022 101022 1370 1420 -50 -3.52% 1.3 � 0.0 0.0 0.9 A
A2047 Kingston Cresent to Wharf Road E-W WBT 101211 101412 33 32 1 3.13% 0.2 � 79.2 5.1 6.4 A
A2047 Kingston Cresent to M275 NB Service Road E-S WBL 101211 1010121 63 77 -14 -18.18% 1.7 � 79.2 5.1 2.4 A
A2047 Kingston Cresent to A2047 Kingston Cresent E-SE WBL 101211 101222 1 1 0 0.00% 0.0 � 79.2 5.1 8.0 A
A2047 Kingston Cresent to A3 Twyford Avenue E-NE WBU 101211 101621 130 134 -4 -2.99% 0.3 � 79.2 5.1 13.2 B
A2047 Kingston Cresent to M275 SB Service Road E-NW WBR 101211 101711 290 284 6 2.11% 0.4 � 79.2 5.1 12.4 B
M275 SB Service Road to Wharf Road NW-W SBR 101311 101412 172 172 0 0.00% 0.0 � 89.3 4.0 7.4 A
M275 SB Service Road to A3 Twyford Avenue NW-NE SBL 101311 101621 90 92 -2 -2.17% 0.2 � 89.3 4.0 14.6 B
M275 SB Service Road to M275 SB Service Road NW-NW SBU 101311 101711 6 6 0 0.00% 0.0 � 89.3 4.0 6.1 A
M275 SB Service Road to A2047 Kingston Cresent NW-SE SBL 101311 101222 232 233 -1 -0.43% 0.1 � 89.3 4.0 16.7 C
M275 SB Service Road to M275 NB Service Road NW-S SBT 101311 1010121 64 66 -2 -3.03% 0.2 � 89.3 4.0 12.4 B
A3 Twyford Avenue to Wharf Road NE-W WBT 101321 101412 23 24 -1 -4.17% 0.2 � 101.0 2.2 14.6 B
A3 Twyford Avenue to A3 Twyford Avenue NE-NE WBU 101321 101621 19 18 1 5.56% 0.2 � 101.0 2.2 16.0 C
A3 Twyford Avenue to M275 SB Service Road NE-NW WBR 101321 101711 79 77 2 2.60% 0.2 � 101.0 2.2 15.4 C
A3 Twyford Avenue to A2047 Kingston Cresent NE-SE WBL 101321 101222 113 114 -1 -0.88% 0.1 � 101.0 2.2 13.1 B
A3 Twyford Avenue to M275 NB Service Road NE-S WBU 101321 1010121 389 391 -2 -0.51% 0.1 � 101.0 2.2 17.8 C
Wharf Road to Wharf Road W-W EBU 101531 101412 3 2 1 50.00% 0.6 � 69.4 1.5 39.2 E
Wharf Road to A3 Twyford Avenue W-NE EBT 101531 101621 19 20 -1 -5.00% 0.2 � 69.4 1.5 35.0 D
Wharf Road to M275 SB Service Road W-NW EBL 101531 101711 124 125 -1 -0.80% 0.1 � 69.4 1.5 28.0 D
Wharf Road to A2047 Kingston Cresent W-SE EBT 101531 101222 16 19 -3 -15.79% 0.7 � 69.4 1.5 38.7 E
Wharf Road to M275 NB Service Road W-S WBR 101531 1010121 70 71 -1 -1.41% 0.1 � 69.4 1.5 38.4 E
M275 NB Service Road to Wharf Road S-W NBL 101423 101412 97 110 -13 -11.82% 1.3 � 27.1 0.0 2.2 A
M275 NB Service Road to A3 Twyford Avenue S-NE NBR 101423 101621 271 293 -22 -7.51% 1.3 � 27.1 0.0 12.3 B
M275 NB Service Road to M275 SB Service Road S-NW NBT 101423 101711 68 100 -32 -32.00% 3.5 � 27.1 0.0 6.2 A
M275 NB Service Road to A2047 Kingston Cresent S-SE NBR 101423 101222 99 107 -8 -7.48% 0.8 � 27.1 0.0 11.3 B
M275 NB Service Road to M275 NB Service Road S-S NBU 101423 1010121 4 0 4 0.00% 2.8 � 27.1 0.0 9.1 A
All 0 0 5198 5321 -123 -2% - - 101.0 2.4 7.4 A
502 Mile End Roundabout Mile End Road to Mile End Road N-N SBU 100613 100612 89 94 -5 -5.32% 0.5 � 71.4 3.7 45.8 D
Mile End Road to Commercial Road N-S SBT 100613 100111 1338 1337 1 0.07% 0.0 � 71.4 3.7 6.9 A
Mile End Road to Church Street N-E SBL 100613 100311 410 394 16 4.06% 0.8 � 71.4 3.7 9.8 A
Hope Street to Mile End Road SW-N NBT 100033 100612 1154 1189 -35 -2.94% 1.0 � 162.2 8.8 9.3 A
Hope Street to Mile End Road SW-N NBT 100641 100612 0 0 0 0.00% 0.0 � 35.7 0.6 0.0 A
Hope Street to Commercial Road SW-S NBU 100641 100111 17 39 -22 -56.41% 4.2 � 35.7 0.6 72.4 E
Hope Street to Church Street SW-E NBR 100641 100311 64 55 9 16.36% 1.2 � 35.7 0.6 69.5 E
Commercial Road to Mile End Road S-N NBT 100632 100612 401 468 -67 -14.32% 3.2 � 39.3 0.8 38.1 D
Commercial Road to Commercial Road S-S NBU 100632 100111 3 10 -7 -70.00% 2.7 � 39.3 0.8 47.8 D
Commercial Road to Church Street S-E NBR 100632 100311 8 20 -12 -60.00% 3.2 � 39.3 0.8 58.6 E
Church Street to Mile End Road E-N WBR 100621 100612 229 231 -2 -0.87% 0.1 � 93.6 12.5 54.5 D
Church Street to Commercial Road E-S WBL 100621 100111 14 19 -5 -26.32% 1.2 � 93.6 12.5 51.6 D
Church Street to Church Street E-E WBU 100621 100311 0 0 0 0.00% 0.0 � 93.6 12.5 0.0 A
All 0 0 3726 3856 -130 -3.37% - - 162.2 4.7 16.9 B
503 Cascade's Approach Cascade's Approach to Cascade's Approach S-SW NBL 100826 100827 0 0 0 0.00% 0.0 � 11.1 0.1 0.0 A
Cascade's Approach to Marketway WB S-E NBR 100826 100801 2 4 -2 -50.00% 1.2 � 11.1 0.1 5.9 A
Cascade's Approach to Marketway EB S-W NBL 100826 100825 13 11 2 18.18% 0.6 � 11.1 0.1 7.2 A
Marketway WB to Cascade's Approach NE-SW WBT 2 100827 31 37 -6 -16.22% 1.0 � 95.2 2.2 4.7 A
Marketway WB to Marketway WB NE-E WBL 2 100801 14 14 0 0.00% 0.0 � 95.2 2.2 9.8 A
Marketway WB to Marketway EB NE-W WBT 2 100825 1195 1229 -34 -2.77% 1.0 � 95.2 2.2 8.9 A
Marketway EB to Cascade's Approach SW-SW EBU 100824 100827 0 0 0 0.00% 0.0 � 64.5 0.4 0.0 A
Marketway EB to Hope Street SW-N EBL 100042 100042 1145 1196 -51 -4.26% 1.5 � 0.0 0.0 2.9 A
Marketway WB to Marketway EB NE-W WBT 2 79 30 31 -1 -3.23% 0.2 � 4.6 0.0 4.5 A
Marketway EB to Marketway WB SW-E EBT 100824 100801 393 422 -29 -6.87% 1.4 � 64.5 0.4 7.1 A
Marketway EB to Marketway EB SW-W NBL 100824 100825 8 0 8 0.00% 4.0 � 64.5 0.4 6.1 A
All 0 0 2832 2944 -112 -3.80% - - 95.2 0.7 6.1 A
504 Marketway Roundabout Commercial Road NB to Commercial Road SB S-N NBT 100805 100113 6 7 -1 -14.29% 0.4 � 38.6 2.0 36.7 E
Commercial Road NB to Marketway S-W NBL 100805 1 14 13 1 7.69% 0.3 � 38.6 2.0 36.7 E
Commercial Road NB to Cornmill street S-SE NBR 100805 100808 6 6 0 0.00% 0.0 � 38.6 2.0 24.4 C
Commercial Road SB to Commercial Road SB N-N SBU 100111 100113 40 45 -5 -11.11% 0.8 � 93.6 2.5 13.7 B
Commercial Road SB to Marketway N-W SBR 100111 1 1096 1109 -13 -1.17% 0.4 � 93.6 2.5 13.3 B
Commercial Road SB to Cornmill street N-SE SBT 100111 100808 238 250 -12 -4.80% 0.8 � 93.6 2.5 8.5 A
Marketway to Commercial Road SB W-N EBL 100804 100113 197 243 -46 -18.93% 3.1 � 94.1 1.1 11.5 B
Marketway to Marketway W-W EBU 100804 1 8 10 -2 -20.00% 0.7 � 94.1 1.1 11.4 B
Marketway to Cornmill street W-SE EBT 100804 100808 186 182 4 2.20% 0.3 � 94.1 1.1 13.0 B
Cornmill street to Commercial Road NB E-SW WBT 100806 100807 3 0 3 0.00% 2.4 � 22.5 0.1 1.1 A
Cornmill street to Commercial Road SB E-N WBR 100806 100113 199 192 7 3.65% 0.5 � 36.7 1.2 7.5 A
Cornmill street to Marketway E-W WBT 100806 1 187 178 9 5.06% 0.7 � 36.7 1.2 7.9 A
Cornmill street to Cornmill street E-SE WBL 100806 100808 0 11 -11 -100.00% 4.7 � 36.7 1.2 0.0 A
All 0 0 2181 2246 -65 -2.89% - - 94.1 1.6 11.9 B
505 A2030 roundabout Lake Road NB to Lake Road NB SW-W NBL 100814 100818 0 2 -2 -100.00% 2.0 � 14.8 0.0 0.0 A
Lake Road NB to Cornmill street SW-NW EBL 100814 100806 79 77 2 2.60% 0.2 � 14.8 0.0 1.6 A
Lake Road NB to Lake Road SB SW-E EBT 100814 100816 55 55 0 0.00% 0.0 � 14.8 0.0 1.8 A
Cornmill street to Lake Road NB NW-W SBR 100808 100818 91 95 -4 -4.21% 0.4 � 40.3 1.3 3.2 A
Cornmill street to Cornmill street NW-NW SBU 100808 100806 3 0 3 0.00% 2.4 � 40.3 1.3 4.4 A
Cornmill street to Lake Road SB NW-E SBL 100808 100816 336 354 -18 -5.08% 1.0 � 40.3 1.3 3.2 A
Lake Road SB to Lake Road NB E-W WBT 100817 100818 40 38 2 5.26% 0.3 � 39.9 1.4 5.7 A
Lake Road SB to Cornmill street E-NW WBT 100817 100806 308 304 4 1.32% 0.2 � 39.9 1.4 5.4 A
Lake Road SB to Lake Road SB E-E WBU 100817 100816 0 0 0 0.00% 0.0 � 39.9 1.4 0.0 A
All 0 0 912 925 -13 -1.41% - - 40.3 0.9 3.9 A
506 Holbrook Road Roundabout Lake Road SB to Lake Road SB NE-E WBL 100820 100819 5 4 1 25.00% 0.5 � 231.5 60.0 59.4 F
Lake Road SB to Holbrook Road NE-S WBR 100820 100821 226 225 1 0.44% 0.1 � 231.5 60.0 60.2 F
Lake Road SB to Church Street NE-NW WBR 100820 100313 72 74 -2 -2.70% 0.2 � 231.5 60.0 63.8 F
Lake Road SB to Lake Road NB NE-W WBT 100820 100817 188 180 8 4.44% 0.6 � 231.5 60.0 62.7 F
Holbrook Road to Lake Road SB SE-E NBR 100847 100819 207 210 -3 -1.43% 0.2 � 58.4 1.1 7.9 A
Holbrook Road to Holbrook Road SE-S NBL 100847 100821 0 0 0 0.00% 0.0 � 58.4 1.1 0.0 A
Holbrook Road to Church Street SE-NW NBT 100847 100313 115 119 -4 -3.36% 0.4 � 58.4 1.1 7.2 A
Holbrook Road to Lake Road NB SE-W NBL 100847 100817 152 153 -1 -0.65% 0.1 � 58.4 1.1 4.5 A
Church Street to Lake Road SB NW-E SBL 100311 100819 73 71 2 2.82% 0.2 � 114.8 6.0 16.0 C
Church Street to Holbrook Road NW-S SBT 100311 100821 372 368 4 1.09% 0.2 � 114.8 6.0 16.2 C
Church Street to Church Street NW-NW SBU 100311 100313 0 0 0 0.00% 0.0 � 114.8 6.0 0.0 A
Church Street to Lake Road NB NW-W SBR 100311 100817 8 8 0 0.00% 0.0 � 114.8 6.0 19.3 C
Lake Road NB to Lake Road SB SW-E EBT 100816 100819 107 113 -6 -5.31% 0.6 � 77.8 2.4 7.2 A
Lake Road NB to Holbrook Road SW-S EBR 100816 100821 270 283 -13 -4.59% 0.8 � 77.8 2.4 7.9 A
Lake Road NB to Church Street SW-NW EBL 100816 100313 12 12 0 0.00% 0.0 � 77.8 2.4 6.0 A
Lake Road NB to Lake Road NB SW-W NBL 100816 100817 1 1 0 0.00% 0.0 � 77.8 2.4 6.7 A
All 0 0 1807 1821 -14 -0.77% - - 231.5 17.4 24.2 C
507 Unicorn Road Unicorn Road WB to Market Way NW-NE SBL 100837 100035 281 290 -9 -3.10% 0.5 � 57.7 10.0 33.0 C
Unicorn Road WB to Unicorn Road EB NW-S SBT 100837 100840 9 11 -2 -18.18% 0.6 � 59.0 4.4 32.0 C
Unicorn Road WB to Alfred Road NW-SW SBR 100837 100843 39 31 8 25.81% 1.4 � 59.0 4.4 40.3 D
Market Way to Unicorn Road WB NE-NW WBR 100825 100841 91 84 7 8.33% 0.7 � 172.1 2.7 54.4 D
Market Way to Unicorn Road EB NE-S WBU 100825 100840 229 220 9 4.09% 0.6 � 172.1 2.7 8.6 A
Market Way to Alfred Road NE-SW WBT 100825 100843 935 936 -1 -0.11% 0.0 � 172.1 2.7 14.4 B
Unicorn Road EB to Unicorn Road WB S-NW NBT 100851 100841 35 32 3 10.06% 0.6 � 83.4 11.4 42.8 D
Unicorn Road EB to Market Way S-NE NBR 100851 100035 146 156 -10 -6.41% 0.8 � 83.4 11.4 40.7 D
Unicorn Road EB to Alfred Road S-SW NBL 100851 100843 13 16 -3 -18.75% 0.8 � 29.9 0.6 39.2 D
Alfred Road to Unicorn Road WB SW-NW EBL 100037 100841 71 70 1 1.43% 0.1 � 180.9 23.3 21.2 C
Alfred Road to Market Way SW-NE EBT 100037 100035 1124 1172 -48 -4.10% 1.4 � 180.9 23.3 20.5 C
All 0 0 2971 3018 -46.8 -1.55% - - 180.9 8.8 21.5 C
508 Stanhope Road Stanhope Road to Stanhope Road S-S NBU 100849 100850 0 3 -3 -100.00% 2.4 � 23.6 0.1 0.0 A
Stanhope Road to Edinburgh Road WB S-SE NBR 100849 100853 0 4 -4 -100.00% 2.8 � 23.6 0.1 0.0 A
Stanhope Road to Unicorn road S-N NBT 100849 100842 168 173 -5 -2.89% 0.4 � 23.6 0.1 4.2 A
Stanhope Road to Edinburgh Road EB S-W NBL 100849 100854 8 20 -12 -60.00% 3.2 � 23.6 0.1 17.0 C
Edinburgh Road WB to Stanhope Road E-S WBL 100852 100850 13 4 9 225.00% 3.1 � 32.7 0.2 10.9 B
Edinburgh Road WB to Edinburgh Road WB E-SE WBL 100852 100853 0 0 0 0.00% 0.0 � 32.7 0.2 0.0 A
Edinburgh Road WB to Unicorn road E-N WBR 100852 100842 24 30 -6 -20.00% 1.2 � 32.7 0.2 13.2 B
Edinburgh Road WB to Edinburgh Road EB E-W WBT 100852 100854 50 31 19 61.29% 3.0 � 32.7 0.2 15.3 C
Unicorn road to Stanhope Road N-S SBT 100848 100850 193 164 29 17.68% 2.2 � 44.8 0.0 1.3 A
Unicorn road to Edinburgh Road WB N-SE SBT 100848 100853 23 37 -14 -37.84% 2.6 � 44.8 0.0 1.5 A
Unicorn road to Unicorn road N-N SBU 100848 100842 0 0 0 0.00% 0.0 � 44.8 0.0 0.0 A
Unicorn road to Edinburgh Road EB N-W SBR 100848 100854 23 30 -7 -23.33% 1.4 � 44.8 0.0 1.4 A
Edinburgh Road EB to Stanhope Road W-S EBR 100855 100850 8 18 -10 -55.06% 2.7 � 40.4 0.2 6.1 A
Edinburgh Road EB to Edinburgh Road WB W-SE EBT 100855 100853 27 30 -3 -11.18% 0.6 � 40.4 0.2 14.3 B
Edinburgh Road EB to Unicorn road W-N EBL 100855 100842 0 1 -1 -100.00% 1.3 � 40.4 0.2 0.0 A
Edinburgh Road EB to Edinburgh Road EB W-W EBU 100855 100854 0 0 0 0.00% 0.0 � 40.4 0.2 0.0 A
All 0 0 536 545 -9 -1.65% - - 44.8 0.1 5.3 A
509 Queen Street Queen St to Alfred Road W-NE EBL 100039 100037 290 275 15 5.45% 0.9 � 62.9 8.4 22.5 C
Queen St to Bishop Crispian Way W-E EBT 100039 100855 34 49 -15 -30.61% 2.3 � 48.7 5.3 72.7 E
Alfred Road to Queen St NE-W WBT 97 100863 261 254 7 2.76% 0.4 � 148.1 15.1 36.8 D
Alfred Road to Anglesea Road NE-S WBR 100844 100862 722 729 -7 -0.96% 0.3 � 124.9 2.2 5.0 A
Bishop Crispian Way to Queen St E-W WBT 100857 100863 81 81 0 0.00% 0.0 � 79.4 9.4 55.2 E
Anglesea Road to Queen St S-W NBL 100859 100863 40 38 2 5.26% 0.3 � 56.3 0.7 16.5 B
Anglesea Road to Alfred Road S-NE NBR 100859 100037 898 967 -69 -7.14% 2.3 � 93.4 10.4 15.9 B
All 0 0 2324 2393 -69 -2.88% - - 148.1 7.3 17.9 B
510 St Michael's Gyratory St Paul's Road to Wiltshire Street S-E NBR 11 9 0 0 0 0.00% 0.0 � 13.9 0.1 0.0 A
St Paul's Road to Waltham St S-S NBU 11 10 0 0 0 0.00% 0.0 � 13.9 0.1 0.0 A
St Paul's Road to Guildhall Walk S-NE NBT 11 12 0 0 0 0.00% 0.0 � 13.9 0.1 0.0 A
St Paul's Road to Cambridge Road S-SW NBL 11 100883 0 0 0 0.00% 0.0 � 13.9 0.1 0.0 A
St Paul's Road to Hampshire Terrace S-S NBU 11 100889 0 0 0 0.00% 0.0 � 13.9 0.1 0.0 A
St Paul's Road to Winston churchill avenue S-E NBR 11 100902 0 0 0 0.00% 0.0 � 13.9 0.1 0.0 A
St Paul's Road to Anglesea Road S-N NBT 11 100859 42 42 0 0.00% 0.0 � 13.9 0.1 10.6 B
Cambridge Road to Wiltshire Street SW-E EBT 100882 9 2 2 0 0.00% 0.0 � 98.7 1.9 22.3 C
Cambridge Road to Waltham St SW-S EBR 100882 10 1 1 0 0.00% 0.0 � 98.7 1.9 12.5 B
Cambridge Road to Guildhall Walk SW-NE EBT 100882 12 15 16 -1 -6.25% 0.3 � 98.7 1.9 23.8 C
Cambridge Road to Cambridge Road SW-SW EBU 100882 100883 2 3 -1 -33.33% 0.6 � 98.7 1.9 33.0 C
Cambridge Road to Hampshire Terrace SW-S EBR 100882 100889 5 4 1 25.00% 0.5 � 98.7 1.9 23.6 C
Cambridge Road to Winston churchill avenue SW-E EBT 100882 100902 123 120 3 2.50% 0.3 � 98.7 1.9 24.2 C
Cambridge Road to Anglesea Road SW-N EBL 100882 100859 211 214 -3 -1.40% 0.2 � 98.7 1.9 11.1 B
Hampshire Terrace to Wiltshire Street S-E NBR 100888 9 1 1 0 0.00% 0.0 � 148.5 6.6 29.3 D
Hampshire Terrace to Waltham St S-S NBU 100888 10 0 0 0 0.00% 0.0 � 148.5 6.6 0.0 A
Hampshire Terrace to Guildhall Walk S-NE NBT 100888 12 14 15 -1 -6.67% 0.3 � 148.5 6.6 30.3 D
Hampshire Terrace to Cambridge Road S-SW NBL 100888 100883 22 21 1 4.76% 0.2 � 148.5 6.6 18.5 C
Hampshire Terrace to Hampshire Terrace S-S NBU 100888 100889 3 3 0 0.00% 0.0 � 148.5 6.6 33.3 D
Hampshire Terrace to Winston churchill avenue S-E NBR 100888 100902 81 82 -1 -1.22% 0.1 � 148.5 6.6 32.3 D
Hampshire Terrace to Anglesea Road S-N NBT 100888 100859 334 336 -2 -0.60% 0.1 � 148.5 6.6 20.5 C
Winston churchill avenue to Wiltshire Street E-E WBU 100907 9 3 4 -1 -25.00% 0.5 � 54.9 6.1 18.4 B
Winston churchill avenue to Waltham St E-S WBL 100907 10 23 24 -1 -4.17% 0.2 � 54.9 6.1 14.4 B
Winston churchill avenue to Guildhall Walk E-NE WBR 100907 12 14 14 0 0.00% 0.0 � 54.9 6.1 42.6 D
Winston churchill avenue to Cambridge Road E-SW WBT 100907 100883 151 148 3 2.03% 0.2 � 54.9 6.1 31.2 C
Winston churchill avenue to Hampshire Terrace E-S WBL 100907 100889 113 110 3 2.73% 0.3 � 54.9 6.1 20.9 C
Winston churchill avenue to Winston churchill avenue E-E WBU 100907 100902 12 12 0 0.00% 0.0 � 54.9 6.1 41.9 D
Winston churchill avenue to Anglesea Road E-N WBR 100907 100859 116 119 -3 -2.52% 0.3 � 54.9 6.1 30.7 C
Anglesea Road to Wiltshire Street N-E SBL 100869 9 24 28 -4 -14.29% 0.8 � 67.2 0.5 16.1 C
Anglesea Road to Waltham St N-S SBT 100869 10 0 0 0 0.00% 0.0 � 67.2 0.5 0.0 A
Anglesea Road to Guildhall Walk N-NE SBL 100869 12 17 20 -3 -15.00% 0.7 � 67.2 0.5 10.8 B
Anglesea Road to Cambridge Road N-SW SBR 100869 100883 118 131 -13 -9.92% 1.2 � 67.2 0.5 23.4 C
Anglesea Road to Hampshire Terrace N-S SBT 100869 100889 312 295 17 5.76% 1.0 � 67.2 0.5 16.9 C
Anglesea Road to Winston churchill avenue N-E SBL 100869 100902 105 111 -6 -5.41% 0.6 � 67.2 0.5 10.7 B
Anglesea Road to Anglesea Road N-N SBU 100869 100859 33 37 -4 -10.81% 0.7 � 67.2 0.5 24.9 C
All 0 0 1897 1913 -16 -0.84% - - 148.5 3.0 20.8 C
511 Park Road Park Road to Anglesea Road W-N EBL 100879 100859 242 243 -1 -0.41% 0.1 � 110.1 14.0 35.3 D
Anglesea Road SB to Park Road N-W SBR 100862 100880 118 104 14 13.46% 1.3 � 150.5 6.9 33.9 C
Anglesea Road SB to Anglesea Road SB N-S SBT 100862 100865 612 625 -13 -2.08% 0.5 � 150.5 6.9 4.6 A
Anglesea Road to Park Road S-W NBL 100859 100880 0 0 0 0.00% 0.0 � 73.7 5.9 0.0 A
Anglesea Road to Anglesea Road S-N NBT 100859 100859 712 762 -50 -6.56% 1.8 � 73.7 5.9 10.3 B
All 0 0 1683 1734 -51 -2.94% - - 150.5 7.9 13.5 B
512 Princess Royal Road Princess Royal Road to Mile end Road NB W-N EBL 100681 101021 148 146 2 1.37% 0.2 � 62.5 4.7 20.9 C
Mile end Road SB to Princess Royal Road NE-W WBT 4 100682 118 113 5 4.42% 0.5 � 24.0 2.5 20.6 C
Mile end Road NB to Princess Royal Road S-W NBL 3 100682 117 98 19 19.39% 1.8 � 32.8 0.7 6.7 A
Mile end Road NB to Mile end Road NB S-N NBT 100612 101021 1765 1884 -119 -6.32% 2.8 � 114.4 6.1 7.4 A
All 0 0 2148 2241 -93 -4.15% - - 114.4 3.5 9.0 A
0 NETWORK TOTALS All 28215 28957 -742 -2.56% - 100% 231.5 4.5 13.5 B
Overall Total 56243 57709 -1466 -2.54% - 100% 231.5 4.4 14.1 B
13
:00
-14
:00
26/09/2014 12:02 Node Evaluation Results_IP.xlsm

From To DirectionObserved
AverageLower Upper Accept
Winston Churchill Avenue Anglesea Road Northbound 46 49 33 65 �
Anglesea Road Queen Street (NB) Northbound 114 107 61 153 �
Queen Street (NB) Cascade's Approach Northbound 181 165 102 228 �
Cascade's ApproachMarketway
RoundaboutNorthbound 213 237 134 338 �
Marketway RoundaboutChurch Street
RoundaboutNorthbound 278 449 292 603 �
Church Street Roundabout Princess Royal Road Northbound 303 479 314 641 �
Princess Royal Road Rudmore Roundabout Northbound 348 520 352 687 �
Rudmore Roundabout Princess Royal Road Southbound 40 36 31 42 �
Princess Royal RoadChurch Street
RoundaboutSouthbound 56 55 46 63 �
Church Street RoundaboutMarketway
RoundaboutSouthbound 93 85 72 98 �
Marketway Roundabout Cascade's Approach Southbound 137 119 101 138 �
Cascade's Approach Queen Street(SB) Southbound 209 184 144 224 �
Queen Street(SB) Anglesea Road Southbound 256 233 184 282 �
Anglesea RoadWinston Churchill
AvenueSouthbound 272 261 194 329 �
78.6%
Winston Churchill Avenue Anglesea Road Northbound 46 51 35 67 �
Anglesea Road Queen Street (NB) Northbound 115 120 65 175 �
Queen Street (NB) Cascade's Approach Northbound 181 200 131 270 �
Cascade's ApproachMarketway
RoundaboutNorthbound 212 263 139 387 �
Marketway RoundaboutChurch Street
RoundaboutNorthbound 279 522 300 744 �
Church Street Roundabout Princess Royal Road Northbound 303 549 323 775 �
Princess Royal Road Rudmore Roundabout Northbound 348 596 365 827 �
Rudmore Roundabout Princess Royal Road Southbound 40 40 34 46 �
Princess Royal RoadChurch Street
RoundaboutSouthbound 56 63 50 75 �
Church Street RoundaboutMarketway
RoundaboutSouthbound 92 106 84 127 �
Marketway Roundabout Cascade's Approach Southbound 128 138 107 168 �
Cascade's Approach Queen Street(SB) Southbound 189 212 165 257 �
Queen Street(SB) Anglesea Road Southbound 235 266 205 325 �
Anglesea RoadWinston Churchill
AvenueSouthbound 251 287 215 358 �
76.9%
78.6%
Overall 1300-1400
Overall 1200-1400
DescriptionAverage Journey Times (secs) All Vehicles
Weighted Model
Average
Average Limits 95% or 15%
Overall 1200-1300
26/09/2014 12:00 Travel Time & Delay Summary_IP.xlsm

0
100
200
300
400
500
600
700
Winston ChurchillAvenue
Anglesea Road Queen Street (NB) Cascade'sApproach
MarketwayRoundabout
Church StreetRoundabout
Princess RoyalRoad
Avera
ge T
ravel T
ime (
sec)
Location
1200-1300 Northbound Travel Time Comparison
Modelled
Observed Average

0
100
200
300
400
500
600
700
Winston ChurchillAvenue
Anglesea Road Queen Street (NB) Cascade'sApproach
MarketwayRoundabout
Church StreetRoundabout
Princess RoyalRoad
Av
era
ge T
rav
el T
ime (
sec)
Location
1300-1400 Northbound Travel Time Comparison
Modelled
Observed Average

0
50
100
150
200
250
300
RudmoreRoundabout
Princess RoyalRoad
Church StreetRoundabout
MarketwayRoundabout
Cascade'sApproach
Queen Street(SB) Anglesea Road
Avera
ge T
ravel T
ime (
sec)
Location
1200-1300 Southbound Travel Time Comparison
Modelled
Observed Average

0
50
100
150
200
250
300
RudmoreRoundabout
Princess RoyalRoad
Church StreetRoundabout
MarketwayRoundabout
Cascade'sApproach
Queen Street(SB) Anglesea Road
Av
era
ge T
rav
el T
ime (
sec)
Location
1300-1400 Southbound Travel Time Comparison
Modelled Average
Observed Average

Portsmouth AQMA - Corridor 1 - Network Performance 2013 Inter Peak Existing Conditions by Random SeedAll Vehicles
Std Random Seed
Measure Average Dev 5 10 15 20 25 30 35 40 45 50 55 60 65 70 75 80
Remaining Vehicles in Network 632 28 588 627 640 646 643 695 598 658 668 630 596 613 616 626 646 628
Processed Vehicles 31727 30 31741 31768 31686 31719 31735 31689 31757 31707 31709 31702 31727 31784 31752 31720 31687 31754
Total Distance Travelled (mi) 50469 164 50471 50563 50302 50151 50768 50369 50303 50394 50615 50645 50488 50421 50270 50572 50603 50565
Total Travel Time (h) 1218.6 10.9 1215 1222 1202 1229 1223 1228 1209 1215 1211 1216 1213 1244 1206 1210 1231 1224
Total Network Delay (h) 349.3 10.7 346 351 335 364 349 359 341 348 341 344 342 374 340 340 360 355
Average Travel Time (mins) 2.26 0.02 2.25 2.26 2.23 2.28 2.27 2.27 2.24 2.25 2.24 2.26 2.25 2.30 2.24 2.24 2.28 2.27
Average Delay Time (mins) 0.65 0.02 0.64 0.65 0.62 0.67 0.65 0.67 0.63 0.64 0.63 0.64 0.63 0.69 0.63 0.63 0.67 0.66
Total Stopped Delay (h) 198.9 5.1 197.0 201.1 192.5 204.3 200.4 205.1 194.9 196.4 195.7 196.5 195.2 210.8 194.0 194.0 204.1 200.4
Average Stopped Delay (s) 22.1 0.6 21.9 22.3 21.4 22.7 22.3 22.8 21.7 21.8 21.8 21.9 21.7 23.4 21.6 21.6 22.7 22.3
Number of Stops 38191.1 1068.3 37899 38153 36798 39887 37914 38900 37408 37952 37084 37959 37574 40658 37469 37226 39368 38809
Average Number of Stops 1.18 0.03 1.17 1.18 1.14 1.23 1.17 1.20 1.16 1.17 1.15 1.17 1.16 1.26 1.16 1.15 1.22 1.20
Average Network Speed (mph) 25.7 0.2 25.8 25.7 26.0 25.4 25.8 25.5 25.9 25.8 26.0 25.9 25.9 25.2 25.9 26.0 25.5 25.7
Rank (based on Avg Speed) 8 11 1 15 9 14 7 10 3 5 6 16 4 2 13 12
Network Performance Summary_IP.xlsm 26/09/201412:02

55
Portsmouth Corridor 1 Air Quality Management Area VISSIM Model Assessment
E. Rudmore Roundabout and Marketway Bus Lane Drawings

5
5
5
5
5
5
5
5
5
5
5
5
5
5
5
5
5
5
5
5
5
5
5
5
5
5
5
5
5
5
5
5
5
5
5
5
5
5
5
5
5
5
5
5
5
5
5
5
5
5
5
6
6
6
6
6
4
4
4
4
3
3
3
3
4
4
4
3
3
3
3
6
6
6
6
6
4
4
4
4
2
2
2
2
2
2
2
2
2
2
2
2
2
2
2
2
2
2
2
2
2
2
2
2
2
2
2
2
2
2
2
2
1
1
1
1
1
1
1
1
1
1
1
1
1
1
1
1
1
1
1
1
1
1
1
1
1
1
1
1
1
1
1
1
1
1
1
1
1
1
1
1
1
1
1
1
1
1
1
1
1
1
1
1
1
1
1
1
1
1
1
1
1
3
3
3
3
3
1
1
1
1
1
3
3
3
3
3
3
3
3
1
1
1
1
1
1
1
1
1
1
1
1
1
1
1
1
2
2
2
1
1
1
1
1
1
1
1
1
1
1
1
1
1
1
1
1
1
1
1
1
1
1
1
1
1
1
1
1
1
1
1
1
1
1
1
1
5
5
5
5
5
5
5
5
5
1
1
1
1
1
1
1
1
1
1
1
1
1
1
1
1
1
1
1
1
1
1
2
2
2
2
2
2
2
2
2
2
2
2
2
1
1
1
1 1
PE
2 2
3 3
4 4
5 5
CUT LINE
A
A
CONTROLLER 2
CONTROLLER 1
B
A
C
D
B
CA
D
CONTROLLER 1 PHASES
CONTROLLER 2 PHASES
F
E
MOVA Loop General Spacing
Dimensions in metres
1 2
C
B
3
ALL RED
METHOD OF CONTROL STREAM 1
CONTROLLER 1
B
D
A
D
4
DUMMY G
5 6 7
METHOD OF CONTROL STREAM 2
CONTROLLER 1
E
F
ALL RED
1 2
B
3
ALL RED
METHOD OF CONTROL STREAM 1
CONTROLLER 2
A
DUMMY E
4 5
C
6
ALL RED
METHOD OF
CONTROLLER 2
D
DUMMY F
CONTROL STREAM 2
REFER TO DRAWING
461757-M275-1200-003
Halcrow Group Limited
www.halcrow.com
Elms House, 43 Brook Green, London, W6 7EF
Tel +44 (0)20 3479 8000 Fax +44 (0)20 3479 8001
A
This drawing is to be read in conjunction with the General Layout
Series which provides a cross reference between the drawings
and the Designer's Health and Safety Risk Assessment(s) and
identifies those areas of Significant Residual Risk
Significant Residual Risks
Reproduced by permission of Ordnance Survey on behalf of
HMSO. Crown copyright and database right 2012. All rights
reserved. Ordnance Survey Licence number:
RUDMORE ROUNDABOUT
TRAFFIC SIGNAL DESIGN
SHEET 1 OF 4
M275 TIPNER INTERCHANGE
XXXXXXXXXX

5
5
5
5
5
5
5
5
5
5
5
5
5
5
5
5
5
5
5
5
5
5
5
5
4
4
4
6
6
6
6
6
4
4
4
4
2
2
2
2
2
2
2
2
2
2
2
2
2
2
2
2
2
2
2
2
2
2
2
2
2
2
2
2
2
2
2
2
2
2
2
2
2
1
1
1
1
1
1
1
1
1
1
1
1
1
1
1
1
1
1
1
1
1
1
1
1
1
1
1
1
1
1
1
1
1
1
1
1
1
1
1
1
1
1
1
1
2
2
2
2
2
2
2
2
2
2
2
1
1
1
1
1
1
1
1
1
1
1
2
2
2
2
2
2
2
2
2
2
2
2
2
2
2
2
2
2
2
2
2
2
2
2
2
2
1
1
1
1
1
1
1
1
1
1
1
1
1
1
1
1
1
1
1
1
1
1
1
1
1
1
1
2
2
2
2
2
2
2
2
2
2
2
2
2
2
2
2
2
2
2
2
2
2
2
2
2
2
2
2
2
2
2
2
2
2
2
2
2
2
2
3
1
1 1
PE
2 2
3 3
4 4
5 5
MOVA Loop General Spacing
Dimensions in metres
B
A
C
D
B
CA
D
CONTROLLER 1 PHASES CONTROLLER 2 PHASES
CUT LINE
A
A
F
E
5 6 7
METHOD OF CONTROL STREAM 2
CONTROLLER 1
E
F
ALL RED
1 2
C
B
3
ALL RED
METHOD OF CONTROL STREAM 1
CONTROLLER 1
B
D
A
D
4
DUMMY E
REFER TO DRAWING
461757-M275-1200-002
Halcrow Group Limited
www.halcrow.com
Elms House, 43 Brook Green, London, W6 7EF
Tel +44 (0)20 3479 8000 Fax +44 (0)20 3479 8001
A
This drawing is to be read in conjunction with the General Layout
Series which provides a cross reference between the drawings
and the Designer's Health and Safety Risk Assessment(s) and
identifies those areas of Significant Residual Risk
Significant Residual Risks
Reproduced by permission of Ordnance Survey on behalf of
HMSO. Crown copyright and database right 2012. All rights
reserved. Ordnance Survey Licence number: 100019671.
RUDMORE ROUNDABOUT
TRAFFIC SIGNAL DESIGN
SHEET 2 OF 4
M275 TIPNER INTERCHANGE
FOR CONSTRUCTION

NOTES
1) All roadmarkings are to be removed by an
appropriate method, suitable for the existing
carriageway type. Contractor is to ensure that
they allow for this in their rate buildup.
2) All road markings and signs to comply with
The Traffic Signs Regulations and General
Directions 2002 and subsequent amendments in
2011.
3) Please refer to the lining schedules for further
details of road marking sizes as appropriate.
4) The location of line markings and signs are to
be confirmed by site engineer prior to installation.
KEY
M1
RM2
New road marking or existing road
markings to be refreshed.
Existing road marking to be removed
New road layout ahead sign position
to be confirmed with site engineer
prior to installation.
Red antiskid (min SRV 65) 5m length
across width of bus lane
new road layout ahead sign -
location to be confirmed with site
engineer prior to installation
4.0m
3.5m
End of bus lane to be moved
60m back from stop line.
M1
M1
M1
M2
M2
M2
M2
M2
M3
M17
M4
M6
M6
M8
RM1
RM2
RM3
RM4
RM7
RM7
RM7
RM7
M15
M15
M15
M13
M13
M12
M12
M12
M14
M14
M14
M9
M9
M4
M17
ORDNANCE SURVEY COPY RIGHT
Based or reproduced from the 2008
Ordnance Survey 1/1000 base with the
permission of HMSO crown copyright
reserved. License No. LA-100019671
This is a C.A.D. drawing and may only be modified by hand in accordance with QA Procedure
Notify C.A. of any discrepancies before ordering materials.
All dimensions to be checked on site prior to
commencement of any work
*** DO NOT SCALE FROM THIS DRAWING***
NOTE:
PCC A1 FRAME
TRANSPORT AND ENVIRONMENT SERVICE
MILE END ROAD
LANE IMPROVEMENTS
SIGNING AND
ROAD MARKINGS
HWI871/4001B
EB/YV EB YV
March 2014 NOT TO SCALE
*
A 24.3.14 Addition of BUS LANE markings and Red Antiskid (EB)
B 24.3.14 Addition of EXCEPT BUSES markings (EB)
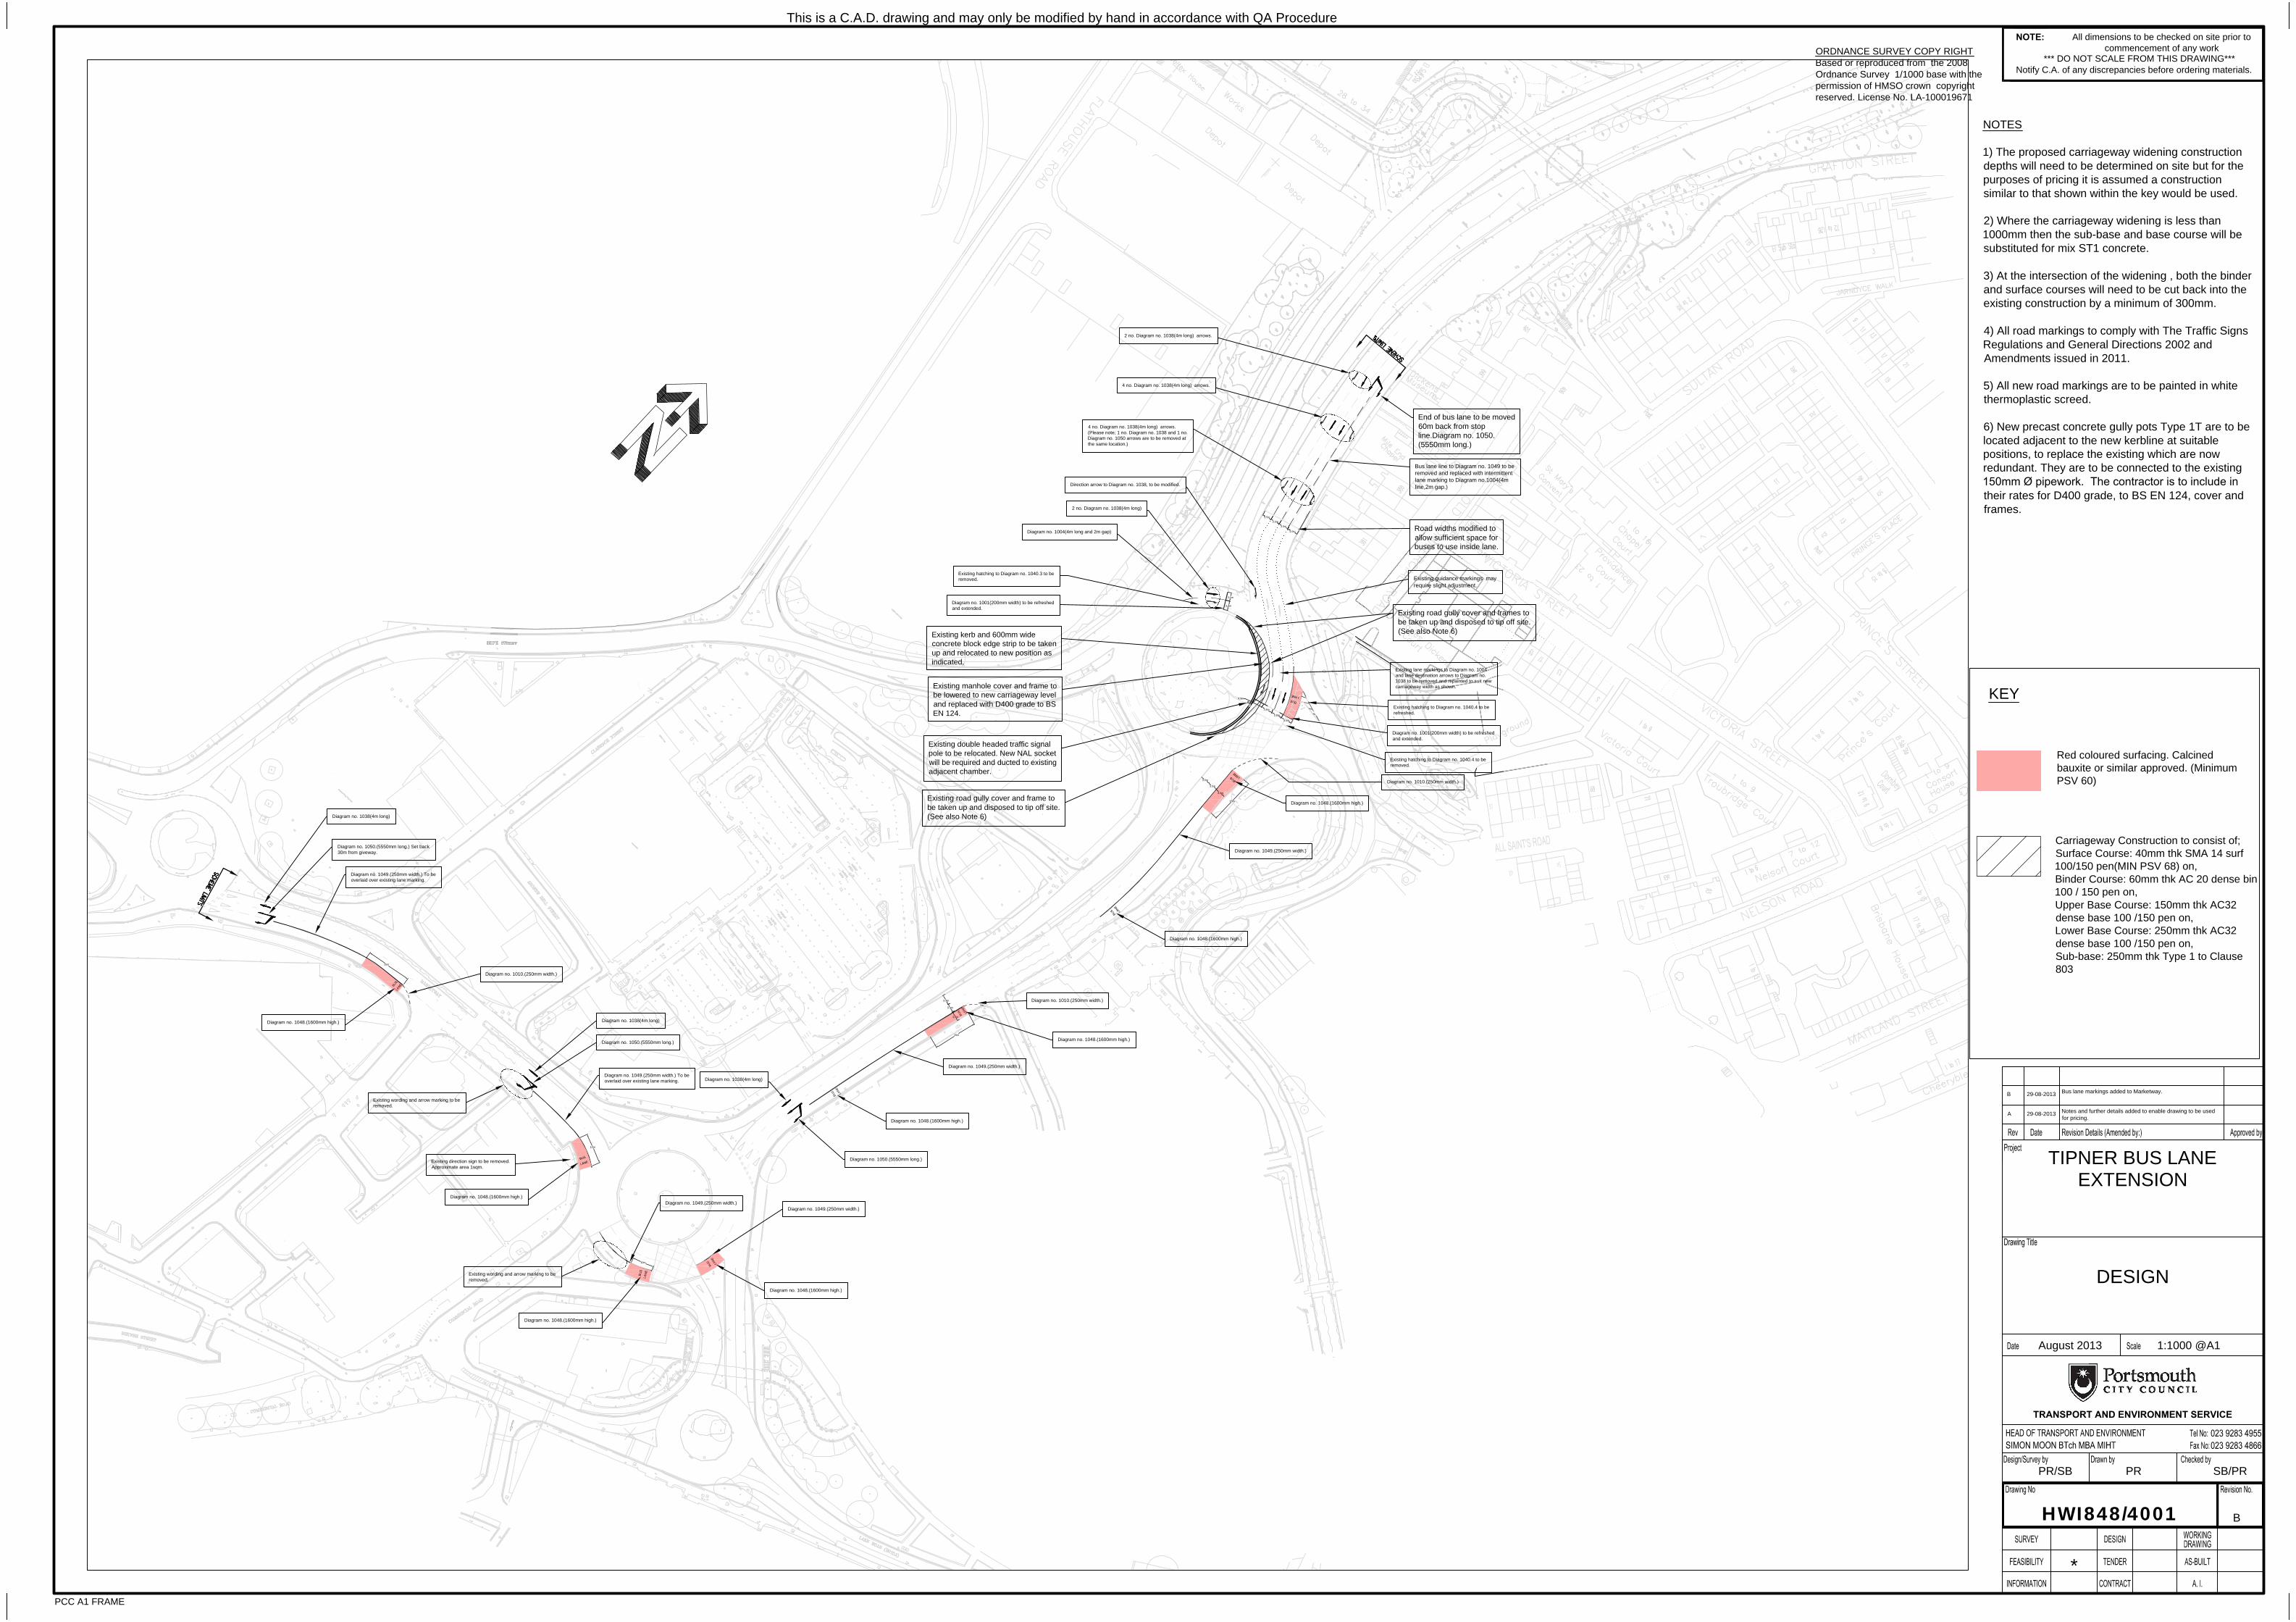
&
C
A
R
P
A
R
K
S
L
A
N
E
B
U
S
L
A
N
E
B
U
S
4.0m
3.5m
3.5m
3.5m
4.0m
4.0m
3.5m
3.5m
Existing hatching to Diagram no. 1040.3 to be
removed.
End of bus lane to be moved
60m back from stop
line.Diagram no. 1050.
(5550mm long.)
4.3m
3.8m
3.8m
3.1m
3.4m
Existing kerb and 600mm wide
concrete block edge strip to be taken
up and relocated to new position as
indicated.
Road widths modified to
allow sufficient space for
buses to use inside lane.
L
A
N
E
B
U
S
3.6m
3.4m
3.4m
Existing hatching to Diagram no. 1040.4 to be
removed.
Existing hatching to Diagram no. 1040.4 to be
refreshed.
Existing guidance markings may
require slight adjustment.
Direction arrow to Diagram no. 1038, to be modified.
Bus lane line to Diagram no. 1049 to be
removed and replaced with intermittent
lane marking to Diagram no.1004(4m
line,2m gap.)
B
U
S
E
S
&
C
A
R
P
A
R
K
S
Diagram no. 1048.(1600mm high.)
Diagram no. 1048.(1600mm high.)
Diagram no. 1048.(1600mm high.)
Diagram no. 1050.(5550mm long.)
Existing manhole cover and frame to
be lowered to new carriageway level
and replaced with D400 grade to BS
EN 124.
Existing double headed traffic signal
pole to be relocated. New NAL socket
will be required and ducted to existing
adjacent chamber.
Diagram no. 1048.(1600mm high.)
Diagram no. 1049.(250mm width.)
Diagram no. 1038(4m long)
Diagram no. 1048.(1600mm high.)
Diagram no. 1048.(1600mm high.)
Diagram no. 1049.(250mm width.)
Diagram no. 1010.(250mm width.)
Diagram no. 1010.(250mm width.)
Diagram no. 1049.(250mm width.)
Diagram no. 1049.(250mm width.)
2 no. Diagram no. 1038(4m long) arrows.
2 no. Diagram no. 1038(4m long)
4 no. Diagram no. 1038(4m long) arrows.
4 no. Diagram no. 1038(4m long) arrows.
(Please note; 1 no. Diagram no. 1038 and 1 no.
Diagram no. 1050 arrows are to be removed at
the same location.)
Diagram no. 1001(200mm width) to be refreshed
and extended.
Existing wording and arrow marking to be
removed.
15m
15m
10m
Existing lane markings to Diagram no. 1004
and lane destination arrows to Diagram no.
1038 to be removed and repainted to suit new
carriageway width as shown.
Existing road gully cover and frames to
be taken up and disposed to tip off site.
(See also Note 6)
Existing road gully cover and frame to
be taken up and disposed to tip off site.
(See also Note 6)
Diagram no. 1001(200mm width) to be refreshed
and extended.
Diagram no. 1004(4m long and 2m gap)
B
U
S
E
S
B
U
S
E
S
&
C
A
R
P
A
R
K
S
10m
Diagram no. 1049.(250mm width.) To be
overlaid over existing lane marking.
Diagram no. 1049.(250mm width.) To be
overlaid over existing lane marking.
Existing wording and arrow marking to be
removed.
Diagram no. 1010.(250mm width.)
Diagram no. 1048.(1600mm high.)
Diagram no. 1048.(1600mm high.)
Existing direction sign to be removed.
Approximate area 1sqm.
Diagram no. 1050.(5550mm long.)
Diagram no. 1038(4m long)
Diagram no. 1038(4m long)
Diagram no. 1050.(5550mm long.) Set back
30m from giveway.
15m
Red coloured surfacing. Calcined
bauxite or similar approved. (Minimum
PSV 60)
KEY
Carriageway Construction to consist of;
Surface Course: 40mm thk SMA 14 surf
100/150 pen(MIN PSV 68) on,
Binder Course: 60mm thk AC 20 dense bin
100 / 150 pen on,
Upper Base Course: 150mm thk AC32
dense base 100 /150 pen on,
Lower Base Course: 250mm thk AC32
dense base 100 /150 pen on,
Sub-base: 250mm thk Type 1 to Clause
803
ORDNANCE SURVEY COPY RIGHT
Based or reproduced from the 2008
Ordnance Survey 1/1000 base with the
permission of HMSO crown copyright
reserved. License No. LA-100019671
This is a C.A.D. drawing and may only be modified by hand in accordance with QA Procedure
Notify C.A. of any discrepancies before ordering materials.
All dimensions to be checked on site prior to
commencement of any work
*** DO NOT SCALE FROM THIS DRAWING***
NOTE:
PCC A1 FRAME
TRANSPORT AND ENVIRONMENT SERVICE
TIPNER BUS LANE
EXTENSION
DESIGN
HWI848/4001B
PR/SB PR SB/PR
August 2013 1:1000 @A1
*
A 29-08-2013
NOTES
1) The proposed carriageway widening construction
depths will need to be determined on site but for the
purposes of pricing it is assumed a construction
similar to that shown within the key would be used.
2) Where the carriageway widening is less than
1000mm then the sub-base and base course will be
substituted for mix ST1 concrete.
3) At the intersection of the widening , both the binder
and surface courses will need to be cut back into the
existing construction by a minimum of 300mm.
4) All road markings to comply with The Traffic Signs
Regulations and General Directions 2002 and
Amendments issued in 2011.
5) All new road markings are to be painted in white
thermoplastic screed.
6) New precast concrete gully pots Type 1T are to be
located adjacent to the new kerbline at suitable
positions, to replace the existing which are now
redundant. They are to be connected to the existing
150mm Ø pipework. The contractor is to include in
their rates for D400 grade, to BS EN 124, cover and
frames.
Notes and further details added to enable drawing to be used
for pricing.
B 29-08-2013
Bus lane markings added to Marketway.

56
Portsmouth Corridor 1 Air Quality Management Area VISSIM Model Assessment
F. 2013 AM Peak Comparison Results

Portsmouth AQMA - Corridor 1 - 2013 AM Peak Comparison
Time Node Description Direction Movement Base DM DS1 DS2 Base DM DS1 DS2 Base DM DS1 DS2 Base DM DS1 DS2 Base DM DS1 DS2
501 Rudmore Roundabout M275 SB to M275 SB NW-S SBT 2606 2715 2715 2713 0.0 0.0 0.0 0.0 0.0 0.0 0.0 0.0 2.5 1.9 2.0 1.9 A A A A
M275 NB to M275 NB S-NW NBT 2006 1965 1963 1964 0.0 0.0 0.0 0.0 0.0 0.0 0.0 0.0 2.0 1.7 1.7 1.8 A A A A
A2047 Kingston Cresent to Wharf Road E-W WBT 47 70 69 69 84.7 234.6 224.9 178.8 17.6 15.9 16.7 15.5 10.6 20.1 21.2 19.9 B C C C
A2047 Kingston Cresent to M275 SB Service Road E-S WBL 35 48 48 48 84.7 234.6 224.9 178.8 17.6 15.9 16.7 15.5 2.5 11.7 12.4 11.6 A B B B
A2047 Kingston Cresent to A2047 Kingston Cresent E-SE WBL 0 0 0 0 84.7 234.6 224.9 178.8 17.6 15.9 16.7 15.5 0.0 0.0 0.0 0.0 A A A A
A2047 Kingston Cresent to A3 Twyford Avenue E-NE WBU 11 20 20 20 84.7 234.6 224.9 178.8 17.6 15.9 16.7 15.5 31.4 34.2 35.1 34.7 D D E D
A2047 Kingston Cresent to M275 NB Service Road E-NW WBR 375 534 532 533 84.7 234.6 224.9 178.8 17.6 15.9 16.7 15.5 29.7 35.8 37.7 35.9 D E E E
M275 SB Service Road to Wharf Road NW-W SBR 469 474 473 473 49.3 95.3 95.3 96.7 0.2 9.3 9.2 9.3 5.7 16.7 16.7 16.6 A B B B
M275 SB Service Road to A3 Twyford Avenue NW-NE SBL 96 100 100 100 49.3 95.3 95.3 96.7 0.2 9.3 9.2 9.3 5.8 16.1 16.1 16.0 A B B B
M275 SB Service Road to M275 NB Service Road NW-NW SBU 1 11 11 11 49.3 95.3 95.3 96.7 0.2 9.3 9.2 9.3 2.4 21.0 21.0 20.3 A C C C
M275 SB Service Road to A2047 Kingston Cresent NW-SE SBL 284 348 348 348 49.3 95.3 95.3 96.7 0.2 9.3 9.2 9.3 10.1 16.1 16.1 16.2 B B B B
M275 SB Service Road to M275 SB Service Road NW-S SBT 86 90 90 90 49.3 95.3 95.3 96.7 0.2 9.3 9.2 9.3 7.3 16.8 16.5 17.0 A B B B
A3 Twyford Avenue to Wharf Road NE-W WBT 50 48 48 48 223.7 231.5 231.5 231.5 8.6 85.6 86.2 87.1 21.7 140.8 144.7 144.7 C F F F
A3 Twyford Avenue to A3 Twyford Avenue NE-NE WBU 13 6 6 6 223.7 231.5 231.5 231.5 8.6 85.6 86.2 87.1 25.7 152.3 161.3 158.9 D F F F
A3 Twyford Avenue to M275 NB Service Road NE-NW WBR 353 390 389 389 223.7 231.5 231.5 231.5 8.6 85.6 86.2 87.1 26.7 127.4 129.7 129.7 D F F F
A3 Twyford Avenue to A2047 Kingston Cresent NE-SE WBR2 34 37 37 37 223.7 231.5 231.5 231.5 8.6 85.6 86.2 87.1 14.8 150.0 151.7 151.8 B F F F
A3 Twyford Avenue to M275 SB Service Road NE-S WBL 293 374 373 373 223.7 231.5 231.5 231.5 8.6 85.6 86.2 87.1 22.4 110.7 112.4 113.0 C F F F
Wharf Road to Wharf Road W-W EBU 2 2 2 2 52.8 58.3 58.3 58.3 0.6 0.3 0.3 0.3 20.8 79.2 79.4 71.2 C E E E
Wharf Road to A3 Twyford Avenue W-NE EBT 14 9 9 9 52.8 58.3 58.3 58.3 0.6 0.3 0.3 0.3 33.0 71.2 71.2 69.6 D E E E
Wharf Road to M275 NB Service Road W-NW EBL 169 158 158 157 52.8 58.3 58.3 58.3 0.6 0.3 0.3 0.3 30.3 30.1 30.1 30.0 D C C C
Wharf Road to A2047 Kingston Cresent W-SE EBR 8 7 7 8 52.8 58.3 58.3 58.3 0.6 0.3 0.3 0.3 39.0 91.7 91.7 97.5 E F F F
Wharf Road to M275 SB Service Road W-S EBR2 23 30 30 30 52.8 58.3 58.3 58.3 0.6 0.3 0.3 0.3 39.4 95.4 95.5 95.2 E F F F
M275 NB Service Road to Wharf Road S-W NBL 144 128 127 127 45.3 26.9 31.7 36.9 0.1 0.0 0.0 0.0 4.7 25.8 26.3 27.6 A C C C
M275 NB Service Road to A3 Twyford Avenue S-NE NBR2 110 93 93 93 45.3 26.9 31.7 36.9 0.1 0.0 0.0 0.0 30.8 27.1 27.7 28.0 D C C C
M275 NB Service Road to M275 BB Service Road S-NW NBT 90 100 100 100 45.3 26.9 31.7 36.9 0.1 0.0 0.0 0.0 19.4 34.6 33.4 36.7 C C C D
M275 NB Service Road to A2047 Kingston Cresent S-SE NBR 20 30 30 30 45.3 26.9 31.7 36.9 0.1 0.0 0.0 0.0 32.2 37.4 36.3 39.5 D D D D
M275 NB Service Road to M275 SB Service Road S-S NBU 3 0 0 0 45.3 26.9 31.7 36.9 0.1 0.0 0.0 0.0 35.2 0.0 0.0 0.0 E A A A
All 7341 7784 7777 7778 223.7 234.6 231.5 231.5 5.0 20.6 20.8 20.8 8.3 22.0 22.3 22.3 A C C C
502 Mile End Roundabout Mile End Road to Mile End Road N-N SBU 108 123 123 123 121.2 231.3 224.8 173.5 9.0 11.8 11.8 10.6 58.4 56.6 56.6 57.2 E E E E
Mile End Road to Commercial Road N-S SBT 1395 1545 1545 1542 121.2 231.3 224.8 173.5 9.0 11.8 11.8 10.6 11.3 11.7 11.6 12.0 B B B B
Mile End Road to Church Street N-E SBL 508 531 531 531 121.2 231.3 224.8 173.5 9.0 11.8 11.8 10.6 16.0 12.2 12.2 11.0 B B B B
Hope Street to Mile End Road SW-N NBT 1321 1360 1361 1359 224.6 224.1 223.6 223.9 22.8 24.2 25.5 25.9 18.0 18.2 18.6 19.1 B B B B
Hope Street to Mile End Road SW-N NBT 0 0 0 0 12.5 13.1 12.6 13.7 0.1 0.1 0.1 0.1 0.0 0.0 0.0 0.0 A A A A
Hope Street to Commercial Road SW-S NBU 0 0 0 0 12.5 13.1 12.6 13.7 0.1 0.1 0.1 0.1 0.0 0.0 0.0 0.0 A A A A
Hope Street to Church Street SW-E NBR 12 10 10 10 12.5 13.1 12.6 13.7 0.1 0.1 0.1 0.1 85.6 75.3 72.0 69.6 F E E E
Commercial Road to Mile End Road S-N NBT 477 467 467 467 49.7 50.0 55.1 51.7 3.4 3.5 3.4 3.4 42.1 41.6 40.9 41.2 D D D D
Commercial Road to Commercial Road S-S NBU 0 0 0 0 49.7 50.0 55.1 51.7 3.4 3.5 3.4 3.4 0.0 0.0 0.0 0.0 A A A A
Commercial Road to Church Street S-E NBR 2 1 1 2 49.7 50.0 55.1 51.7 3.4 3.5 3.4 3.4 59.8 31.0 37.1 38.4 E C D D
Church Street to Mile End Road E-N WBR 545 432 432 434 231.5 231.5 234.6 234.6 143.6 185.1 184.8 185.8 181.0 315.4 301.3 316.3 F F F F
Church Street to Commercial Road E-S WBL 2 19 19 18 231.5 231.5 234.6 234.6 143.6 185.1 184.8 185.8 145.9 292.5 294.0 293.3 F F F F
Church Street to Church Street E-E WBU 0 0 0 0 231.5 231.5 234.6 234.6 143.6 185.1 184.8 185.8 0.0 0.0 0.0 0.0 A A A A
All 4370 4488 4489 4486 231.5 231.5 234.6 234.6 37.8 48.1 48.1 48.1 39.9 48.6 47.3 49.0 D D D D
503 Cascade's Approach Cascade's Approach to Cascade's Approach S-SW NBL 0 0 0 0 20.0 12.9 11.4 11.4 0.2 0.2 0.2 0.2 0.0 0.0 0.0 0.0 A A A A
Cascade's Approach to Marketway WB S-E NBR 11 11 11 11 20.0 12.9 11.4 11.4 0.2 0.2 0.2 0.2 11.8 12.2 13.6 12.3 B B B B
Cascade's Approach to Marketway EB S-W NBL 0 0 0 0 20.0 12.9 11.4 11.4 0.2 0.2 0.2 0.2 0.0 0.0 0.0 0.0 A A A A
Marketway WB to Cascade's Approach NE-SW WBT 68 69 68 69 142.3 196.0 156.1 188.7 2.5 3.4 2.7 2.5 2.7 4.9 3.5 3.3 A A A A
Marketway WB to Marketway WB NE-E WBL 7 7 7 7 142.3 196.0 156.1 188.7 2.5 3.4 2.7 2.5 8.9 10.0 8.9 8.1 A A A A
Marketway WB to Marketway EB NE-W WBT 1250 1356 1363 1357 142.3 196.0 156.1 188.7 2.5 3.4 2.7 2.5 7.5 8.3 6.5 6.4 A A A A
Marketway EB to Cascade's Approach SW-SW EBU 2 1 1 1 27.8 224.5 37.4 30.7 0.1 0.2 0.1 0.1 3.1 2.6 2.9 2.4 A A A A
Marketway EB to Hope Street SW-N EBL 1323 1361 1362 1362 0.0 0.0 0.0 0.0 0.0 0.0 0.0 0.0 3.8 4.2 4.0 4.1 A A A A
Marketway WB to Marketway EB NE-W WBT 24 23 24 23 0.0 6.0 10.3 18.8 0.0 0.0 0.0 0.0 3.7 3.2 1.6 1.6 A A A A
Marketway EB to Marketway WB SW-E EBT 74 77 77 77 27.8 224.5 37.4 30.7 0.1 0.2 0.1 0.1 4.2 4.7 4.4 4.7 A A A A
Marketway EB to Marketway EB SW-W NBL 4 4 4 4 27.8 224.5 37.4 30.7 0.1 0.2 0.1 0.1 4.2 4.5 4.0 4.1 A A A A
All 2763 2909 2916 2911 142.3 224.5 156.1 188.7 0.8 1.0 0.8 0.8 5.5 6.2 5.2 5.2 A A A A
504 Marketway Roundabout Commercial Road NB to Commercial Road SB S-N NBT 7 7 7 7 38.6 38.4 38.2 38.3 2.3 2.0 2.1 1.9 31.2 30.3 31.8 28.8 D D D D
Commercial Road NB to Marketway S-W NBL 8 8 8 8 38.6 38.4 38.2 38.3 2.3 2.0 2.1 1.9 51.1 48.5 50.6 47.8 F E F E
Commercial Road NB to Cornmill street S-SE NBR 6 5 6 6 38.6 38.4 38.2 38.3 2.3 2.0 2.1 1.9 21.3 24.4 23.5 22.6 C C C C
Commercial Road SB to Commercial Road SB N-N SBU 56 60 60 60 121.9 207.7 198.6 224.0 2.3 3.8 3.9 4.0 9.7 10.9 10.8 10.8 A B B B
Commercial Road SB to Marketway N-W SBR 1222 1348 1351 1346 121.9 207.7 198.6 224.0 2.3 3.8 3.9 4.0 9.1 11.4 10.7 11.0 A B B B
Commercial Road SB to Cornmill street N-SE SBT 113 130 131 130 121.9 207.7 198.6 224.0 2.3 3.8 3.9 4.0 5.0 6.6 6.6 6.8 A A A A
Marketway to Commercial Road SB W-N EBL 38 40 40 40 59.5 108.6 101.3 71.4 0.9 1.0 1.4 1.3 9.3 9.7 9.3 8.2 A A A A
Marketway to Marketway W-W EBU 1 0 0 0 59.5 108.6 101.3 71.4 0.9 1.0 1.4 1.3 4.9 1.1 1.4 1.4 A A A A
Marketway to Cornmill street W-SE EBT 48 50 50 50 59.5 108.6 101.3 71.4 0.9 1.0 1.4 1.3 13.6 13.7 14.7 14.9 B B B B
Cornmill street to Commercial Road NB E-SW WBT 1 4 4 4 87.6 83.0 84.3 89.3 2.6 3.5 3.9 3.8 0.2 1.2 1.3 2.3 A A A A
Cornmill street to Commercial Road SB E-N WBR 445 432 432 433 101.9 97.2 98.5 103.5 6.6 8.1 8.4 8.2 12.9 15.5 14.9 14.9 B C B B
Cornmill street to Marketway E-W WBT 143 134 135 134 101.9 97.2 98.5 103.5 6.6 8.1 8.4 8.2 10.0 12.3 12.7 12.3 B B B B
Cornmill street to Cornmill street E-SE WBL 0 0 0 0 101.9 97.2 98.5 103.5 6.6 8.1 8.4 8.2 0.0 0.0 0.0 0.0 A A A A
All 2088 2219 2224 2218 121.9 207.7 198.6 224.0 3.0 3.7 3.9 3.9 10.1 12.2 11.7 11.8 B B B B
505 A2030 roundabout Lake Road NB to Lake Road NB SW-W NBL 0 0 0 0 42.2 32.0 60.9 43.4 0.1 0.2 0.4 0.3 0.0 0.0 0.0 0.0 A A A A
Lake Road NB to Cornmill street SW-NW EBL 63 64 64 64 42.2 32.0 60.9 43.4 0.1 0.2 0.4 0.3 7.0 8.2 9.8 9.4 A A A A
Lake Road NB to Lake Road SB SW-E EBT 15 15 15 15 42.2 32.0 60.9 43.4 0.1 0.2 0.4 0.3 4.7 4.5 6.0 5.0 A A A A
Cornmill street to Lake Road NB NW-W SBR 34 37 37 37 28.4 27.6 27.8 28.4 0.6 0.6 0.6 0.6 2.4 2.8 2.8 2.8 A A A A
Cornmill street to Cornmill street NW-NW SBU 0 0 0 0 28.4 27.6 27.8 28.4 0.6 0.6 0.6 0.6 0.0 0.0 0.0 0.0 A A A A
Cornmill street to Lake Road SB NW-E SBL 132 149 148 148 28.4 27.6 27.8 28.4 0.6 0.6 0.6 0.6 2.0 2.0 2.0 2.0 A A A A
Lake Road SB to Lake Road NB E-W WBT 12 11 11 11 164.6 161.5 147.0 190.6 4.0 3.1 3.5 3.9 17.4 17.0 20.7 20.9 C C C C
Lake Road SB to Cornmill street E-NW WBT 529 508 511 509 164.6 161.5 147.0 190.6 4.0 3.1 3.5 3.9 13.7 13.2 13.9 14.2 B B B B
Lake Road SB to Lake Road SB E-E WBU 0 0 0 0 164.6 161.5 147.0 190.6 4.0 3.1 3.5 3.9 0.0 0.0 0.0 0.0 A A A A
All 785 783 786 784 164.6 161.5 147.0 190.6 1.6 1.3 1.5 1.6 10.6 10.0 10.7 10.9 B B B B
506 Holbrook Road Roundabout Lake Road SB to Lake Road SB NE-E WBL 0 0 0 0 205.1 231.5 197.4 231.4 11.7 26.1 1.7 26.0 16.3 13.4 15.4 13.1 C B C B
Lake Road SB to Holbrook Road NE-S WBR 116 112 117 111 205.1 231.5 197.4 231.4 11.7 26.1 1.7 26.0 25.3 42.8 14.4 42.7 D E B E
Lake Road SB to Church Street NE-NW WBR 55 55 55 54 205.1 231.5 197.4 231.4 11.7 26.1 1.7 26.0 24.9 54.7 58.3 53.3 C F F F
Lake Road SB to Lake Road NB NE-W WBT 191 194 198 193 205.1 231.5 197.4 231.4 11.7 26.1 1.7 26.0 25.4 37.4 21.6 37.2 D E C E
Holbrook Road to Lake Road SB SE-E NBR 118 95 95 96 231.4 231.5 231.5 231.5 34.1 92.2 93.3 92.2 41.8 175.4 178.7 174.3 E F F F
Holbrook Road to Holbrook Road SE-S NBL 1 1 1 1 231.4 231.5 231.5 231.5 34.1 92.2 93.3 92.2 10.0 9.1 9.7 8.8 A A A A
Holbrook Road to Church Street SE-NW NBT 522 433 429 435 231.4 231.5 231.5 231.5 34.1 92.2 93.3 92.2 36.0 153.6 167.8 150.2 E F F F
Holbrook Road to Lake Road NB SE-W NBL 348 323 323 325 231.4 231.5 231.5 231.5 34.1 92.2 93.3 92.2 12.7 76.1 76.5 74.1 B F F F
Church Street to Lake Road SB NW-E SBL 59 60 61 60 113.7 148.5 71.4 140.0 3.3 4.4 0.2 4.5 20.2 20.1 12.1 18.3 C C B C
Church Street to Holbrook Road NW-S SBT 421 432 433 432 113.7 148.5 71.4 140.0 3.3 4.4 0.2 4.5 16.0 17.7 15.7 19.4 C C C C
Church Street to Church Street NW-NW SBU 0 0 0 0 113.7 148.5 71.4 140.0 3.3 4.4 0.2 4.5 0.0 0.0 0.0 0.0 A A A A
Church Street to Lake Road NB NW-W SBR 4 4 4 4 113.7 148.5 71.4 140.0 3.3 4.4 0.2 4.5 19.1 18.4 15.5 20.2 C C C C
Lake Road NB to Lake Road SB SW-E EBT 54 57 57 57 55.6 85.3 55.5 55.2 1.5 1.1 1.3 1.1 9.3 6.7 7.2 7.1 A A A A
Lake Road NB to Holbrook Road SW-S EBR 85 98 98 97 55.6 85.3 55.5 55.2 1.5 1.1 1.3 1.1 9.5 8.1 8.2 7.7 A A A A
Lake Road NB to Church Street SW-NW EBL 5 5 5 5 55.6 85.3 55.5 55.2 1.5 1.1 1.3 1.1 12.6 18.5 43.5 19.8 B C E C
Lake Road NB to Lake Road NB SW-W NBL 0 0 0 0 55.6 85.3 55.5 55.2 1.5 1.1 1.3 1.1 0.0 0.0 0.0 0.0 A A A A
All 1980 1869 1877 1871 231.4 231.5 231.5 231.5 12.7 30.9 24.1 31.0 23.6 70.6 69.9 69.9 C F F F
507 Unicorn Road Unicorn Road WB to Market Way NW-NE SBL 34 34 34 34 20.7 24.1 36.5 31.7 1.4 1.7 1.6 1.6 30.5 33.4 31.4 31.5 C C C C
Unicorn Road WB to Unicorn Road EB NW-S SBT 15 17 17 17 43.3 31.2 37.7 33.0 3.4 3.3 3.3 3.3 53.2 55.4 51.9 53.8 D E D D
Unicorn Road WB to Alfred Road NW-SW SBR 32 31 31 31 43.3 31.2 37.7 33.0 3.4 3.3 3.3 3.3 58.8 53.8 55.2 54.9 E D E D
Market Way to Unicorn Road WB NE-NW WBR 247 261 260 260 186.8 221.2 218.7 208.3 10.7 15.3 13.6 13.0 59.0 64.5 60.3 60.0 E E E E
Market Way to Unicorn Road EB NE-S WBU 180 197 198 198 186.8 221.2 218.7 208.3 10.7 15.3 13.6 13.0 7.8 8.9 8.3 8.3 A A A A
Market Way to Alfred Road NE-SW WBT 848 932 933 933 186.8 221.2 218.7 208.3 10.7 15.3 13.6 13.0 14.4 16.2 15.4 15.2 B B B B
Unicorn Road EB to Unicorn Road WB S-NW NBT 88 88 88 88 86.2 127.5 94.4 109.1 15.4 15.6 16.1 16.0 55.1 54.0 56.3 55.4 E D E E
Unicorn Road EB to Market Way S-NE NBR 91 93 93 93 86.2 127.5 94.4 109.1 15.4 15.6 16.1 16.0 52.2 52.5 53.3 53.5 D D D D
Unicorn Road EB to Alfred Road S-SW NBL 7 7 7 7 45.2 48.4 58.9 58.9 0.5 0.5 0.6 0.5 53.0 52.6 51.0 54.5 D D D D
Alfred Road to Unicorn Road WB SW-NW EBL 192 192 192 193 221.2 227.3 224.0 224.3 39.3 44.5 43.4 42.0 26.9 28.9 28.2 27.1 C C C C
Alfred Road to Market Way SW-NE EBT 1281 1323 1325 1324 221.2 227.3 224.0 224.3 39.3 44.5 43.4 42.0 26.5 28.7 27.9 27.8 C C C C
All 3016 3174 3177 3176 221.2 227.3 224.0 224.3 13.7 15.9 15.3 14.9 26.9 28.6 27.7 27.5 C C C C
508 Stanhope Road Stanhope Road to Stanhope Road S-S NBU 0 0 0 0 32.5 30.1 30.1 26.2 0.1 0.1 0.1 0.1 0.0 0.0 0.0 0.0 A A A A
Stanhope Road to Edinburgh Road WB S-SE NBR 0 0 0 0 32.5 30.1 30.1 26.2 0.1 0.1 0.1 0.1 0.0 0.0 0.0 0.0 A A A A
Stanhope Road to Unicorn road S-N NBT 165 169 169 169 32.5 30.1 30.1 26.2 0.1 0.1 0.1 0.1 4.3 4.2 4.3 4.3 A A A A
Stanhope Road to Edinburgh Road EB S-W NBL 9 9 9 9 32.5 30.1 30.1 26.2 0.1 0.1 0.1 0.1 14.3 14.3 13.7 14.0 B B B B
Edinburgh Road WB to Stanhope Road E-S WBL 2 2 2 2 39.6 49.9 40.3 40.7 0.1 0.1 0.1 0.2 7.3 10.2 8.0 9.3 A B A A
Edinburgh Road WB to Edinburgh Road WB E-SE WBL 0 0 0 0 39.6 49.9 40.3 40.7 0.1 0.1 0.1 0.2 0.0 0.0 0.0 0.0 A A A A
Edinburgh Road WB to Unicorn road E-N WBR 22 22 22 22 39.6 49.9 40.3 40.7 0.1 0.1 0.1 0.2 15.1 15.5 16.3 15.5 C C C C
Edinburgh Road WB to Edinburgh Road EB E-W WBT 35 35 35 35 39.6 49.9 40.3 40.7 0.1 0.1 0.1 0.2 19.2 18.4 18.5 18.4 C C C C
Unicorn road to Stanhope Road N-S SBT 168 184 185 185 35.3 32.2 30.8 31.7 0.0 0.0 0.0 0.0 1.0 0.9 1.0 1.0 A A A A
Unicorn road to Edinburgh Road WB N-SE SBT 16 17 17 17 35.3 32.2 30.8 31.7 0.0 0.0 0.0 0.0 1.6 1.5 1.5 1.5 A A A A
Unicorn road to Unicorn road N-N SBU 0 0 0 0 35.3 32.2 30.8 31.7 0.0 0.0 0.0 0.0 0.0 0.0 0.0 0.0 A A A A
Unicorn road to Edinburgh Road EB N-W SBR 10 13 13 13 35.3 32.2 30.8 31.7 0.0 0.0 0.0 0.0 0.0 0.0 0.0 0.0 A A A A
Edinburgh Road EB to Stanhope Road W-S EBR 8 8 8 8 57.6 29.4 31.3 29.4 0.1 0.1 0.1 0.1 2.5 3.6 3.8 3.8 A A A A
Edinburgh Road EB to Edinburgh Road WB W-SE EBT 20 20 20 20 57.6 29.4 31.3 29.4 0.1 0.1 0.1 0.1 12.5 11.7 11.8 11.8 B B B B
Edinburgh Road EB to Unicorn road W-N EBL 0 0 0 0 57.6 29.4 31.3 29.4 0.1 0.1 0.1 0.1 0.0 0.0 0.0 0.0 A A A A
Edinburgh Road EB to Edinburgh Road EB W-W EBU 0 0 0 0 57.6 29.4 31.3 29.4 0.1 0.1 0.1 0.1 0.0 0.0 0.0 0.0 A A A A
All 455 478 478 478 57.6 49.9 40.3 40.7 0.1 0.1 0.1 0.1 5.1 4.8 4.9 4.8 A A A A
509 Queen Street Queen St to Alfred Road W-NE EBL 323 333 333 333 67.6 76.9 84.1 75.3 10.6 10.9 11.1 11.0 27.3 27.7 28.3 27.6 C C C C
Queen St to Bishop Crispian Way W-E EBT 28 28 28 28 49.3 68.1 75.3 66.6 4.0 4.1 4.2 4.1 58.1 58.7 59.0 59.1 E E E E
Alfred Road to Queen St NE-W WBT 221 234 234 234 201.8 224.2 220.7 184.5 14.1 16.4 16.0 16.0 38.4 42.1 41.6 41.0 D D D D
Alfred Road to Anglesea Road NE-S WBR 662 722 723 722 110.5 160.2 134.9 126.4 1.6 3.2 2.7 2.8 4.5 6.4 6.0 5.7 A A A A
Bishop Crispian Way to Queen St E-W WBT 53 54 54 54 58.3 75.0 56.3 62.9 5.8 5.8 5.7 5.7 49.8 49.9 49.4 48.3 D D D D
Anglesea Road to Queen St S-W NBL 42 44 44 44 99.9 177.9 96.4 225.4 0.9 1.0 0.8 1.2 23.3 23.7 24.3 24.8 C C C C
Anglesea Road to Alfred Road S-NE NBR 1156 1179 1180 1179 224.7 227.5 224.5 231.4 16.3 16.5 16.9 16.7 21.4 23.0 22.9 23.0 C C C C
All 2484 2594 2595 2593 224.7 227.5 224.5 231.4 7.6 8.3 8.2 8.2 20.3 21.6 21.5 21.4 C C C C
510 St Michael's Gyratory St Paul's Road to Wiltshire Street S-E NBR 0 0 0 0 26.7 32.8 30.1 32.9 0.2 0.2 0.2 0.2 0.0 0.0 0.0 0.0 A A A A
St Paul's Road to Waltham St S-S NBU 0 0 0 0 26.7 32.8 30.1 32.9 0.2 0.2 0.2 0.2 0.0 0.0 0.0 0.0 A A A A
St Paul's Road to Guildhall Walk S-NE NBT 0 0 0 0 26.7 32.8 30.1 32.9 0.2 0.2 0.2 0.2 0.0 0.0 0.0 0.0 A A A A
St Paul's Road to Cambridge Road S-SW NBL 0 0 0 0 26.7 32.8 30.1 32.9 0.2 0.2 0.2 0.2 0.0 0.0 0.0 0.0 A A A A
St Paul's Road to Hampshire Terrace S-S NBU 0 0 0 0 26.7 32.8 30.1 32.9 0.2 0.2 0.2 0.2 0.0 0.0 0.0 0.0 A A A A
St Paul's Road to Winston churchill avenue S-E NBR 0 0 0 0 26.7 32.8 30.1 32.9 0.2 0.2 0.2 0.2 0.0 0.0 0.0 0.0 A A A A
St Paul's Road to Anglesea Road S-N NBT 103 103 103 103 26.7 32.8 30.1 32.9 0.2 0.2 0.2 0.2 5.8 8.7 8.8 8.5 A A A A
Cambridge Road to Wiltshire Street SW-E EBT 0 0 0 0 100.8 94.0 94.0 94.0 0.4 1.0 1.0 1.0 0.0 0.0 0.0 0.0 A A A A
Cambridge Road to Waltham St SW-S EBR 0 0 0 0 100.8 94.0 94.0 94.0 0.4 1.0 1.0 1.0 0.0 0.0 0.0 0.0 A A A A
Cambridge Road to Guildhall Walk SW-NE EBT 6 6 6 6 100.8 94.0 94.0 94.0 0.4 1.0 1.0 1.0 22.6 46.2 43.4 46.6 C D D D
Cambridge Road to Cambridge Road SW-SW EBU 0 0 0 0 100.8 94.0 94.0 94.0 0.4 1.0 1.0 1.0 0.0 0.0 0.0 0.0 A A A A
Cambridge Road to Hampshire Terrace SW-S EBR 0 0 0 0 100.8 94.0 94.0 94.0 0.4 1.0 1.0 1.0 0.0 0.0 0.0 0.0 A A A A
Cambridge Road to Winston churchill avenue SW-E EBT 52 52 53 53 100.8 94.0 94.0 94.0 0.4 1.0 1.0 1.0 22.0 41.8 41.6 41.0 C D D D
Cambridge Road to Anglesea Road SW-N EBL 387 400 400 400 100.8 94.0 94.0 94.0 0.4 1.0 1.0 1.0 8.7 7.7 7.4 7.3 A A A A
Hampshire Terrace to Wiltshire Street S-E NBR 0 0 0 0 220.8 231.4 231.5 231.5 15.8 43.4 42.7 46.7 0.0 0.0 0.0 0.0 A A A A
Hampshire Terrace to Waltham St S-S NBU 0 0 0 0 220.8 231.4 231.5 231.5 15.8 43.4 42.7 46.7 0.0 0.0 0.0 0.0 A A A A
Hampshire Terrace to Guildhall Walk S-NE NBT 9 9 9 9 220.8 231.4 231.5 231.5 15.8 43.4 42.7 46.7 33.4 60.7 60.8 62.5 D F F F
Hampshire Terrace to Cambridge Road S-SW NBL 5 5 5 5 220.8 231.4 231.5 231.5 15.8 43.4 42.7 46.7 12.2 29.0 29.3 29.6 B D D D
Hampshire Terrace to Hampshire Terrace S-S NBU 1 1 1 1 220.8 231.4 231.5 231.5 15.8 43.4 42.7 46.7 11.2 11.5 9.9 9.4 B B A A
Hampshire Terrace to Winston churchill avenue S-E NBR 34 33 33 33 220.8 231.4 231.5 231.5 15.8 43.4 42.7 46.7 31.6 67.1 68.2 71.2 D F F F
Hampshire Terrace to Anglesea Road S-N NBT 588 589 590 587 220.8 231.4 231.5 231.5 15.8 43.4 42.7 46.7 21.8 40.0 39.0 40.9 C E E E
Winston churchill avenue to Wiltshire Street E-E WBU 6 6 6 6 55.6 61.3 43.7 46.3 4.0 3.4 3.5 3.3 19.0 15.6 16.1 15.7 B B B B
Winston churchill avenue to Waltham St E-S WBL 29 29 29 29 55.6 61.3 43.7 46.3 4.0 3.4 3.5 3.3 13.0 12.4 11.7 10.6 B B B B
Winston churchill avenue to Guildhall Walk E-NE WBR 4 3 3 3 55.6 61.3 43.7 46.3 4.0 3.4 3.5 3.3 36.0 56.4 47.4 47.5 D E D D
Winston churchill avenue to Cambridge Road E-SW WBT 91 92 92 91 55.6 61.3 43.7 46.3 4.0 3.4 3.5 3.3 21.5 22.5 23.7 22.6 C C C C
Winston churchill avenue to Hampshire Terrace E-S WBL 45 44 44 44 55.6 61.3 43.7 46.3 4.0 3.4 3.5 3.3 13.9 12.5 12.4 13.0 B B B B
Winston churchill avenue to Winston churchill avenue E-E WBU 8 8 8 8 55.6 61.3 43.7 46.3 4.0 3.4 3.5 3.3 34.8 52.7 57.9 57.7 C D E E
Winston churchill avenue to Anglesea Road E-N WBR 115 119 119 119 55.6 61.3 43.7 46.3 4.0 3.4 3.5 3.3 20.2 20.7 20.7 20.1 C C C C
Anglesea Road to Wiltshire Street N-E SBL 21 25 25 25 41.3 73.4 65.4 64.8 0.1 3.0 2.8 2.8 11.9 17.6 17.7 17.3 B B B B
Anglesea Road to Waltham St N-S SBT 0 0 0 0 41.3 73.4 65.4 64.8 0.1 3.0 2.8 2.8 0.0 0.0 0.0 0.0 A A A A
Anglesea Road to Guildhall Walk N-NE SBL 52 55 54 54 41.3 73.4 65.4 64.8 0.1 3.0 2.8 2.8 9.6 14.6 13.9 15.0 A B B B
Anglesea Road to Cambridge Road N-SW SBR 141 149 148 149 41.3 73.4 65.4 64.8 0.1 3.0 2.8 2.8 14.8 22.2 22.5 22.7 B C C C
Anglesea Road to Hampshire Terrace N-S SBT 226 247 246 247 41.3 73.4 65.4 64.8 0.1 3.0 2.8 2.8 11.3 16.9 15.9 17.0 B B B B
Anglesea Road to Winston churchill avenue N-E SBL 56 55 56 56 41.3 73.4 65.4 64.8 0.1 3.0 2.8 2.8 9.5 14.6 13.9 14.9 A B B B
Anglesea Road to Anglesea Road N-N SBU 42 41 41 41 41.3 73.4 65.4 64.8 0.1 3.0 2.8 2.8 16.4 24.4 23.4 24.1 C C C C
All 2020 2070 2070 2068 220.8 231.4 231.5 231.5 4.1 10.2 10.1 10.8 15.8 23.9 23.5 24.2 C C C C
511 Park Road Park Road to Anglesea Road W-N EBL 69 69 69 69 90.8 89.0 89.0 89.0 5.6 6.2 6.2 6.2 48.0 50.7 50.8 50.6 D D D D
Anglesea Road SB to Park Road N-W SBR 107 117 116 118 151.0 225.5 225.2 225.4 12.8 16.6 16.9 16.6 51.6 56.9 55.7 54.5 D E E D
Anglesea Road SB to Anglesea Road SB N-S SBT 547 585 584 585 151.0 225.5 225.2 225.4 12.8 16.6 16.9 16.6 9.3 10.9 11.1 11.7 A B B B
Anglesea Road to Park Road S-W NBL 21 20 19 19 190.2 154.5 135.5 140.1 12.9 12.2 12.0 12.3 13.7 10.8 12.2 12.3 B B B B
Anglesea Road to Anglesea Road S-N NBT 1165 1190 1190 1188 190.2 154.5 135.5 140.1 12.9 12.2 12.0 12.3 12.7 11.3 11.3 11.5 B B B B
All 1909 1981 1979 1979 190.2 225.5 225.2 225.4 11.4 12.7 12.8 12.8 15.2 15.3 15.2 15.5 B B B B
512 Princess Royal Road Princess Royal Road to Mile end Road NB W-N EBL 114 114 114 114 68.5 75.3 52.1 59.7 4.5 4.0 3.9 3.9 26.6 25.0 24.0 24.2 C C C C
Mile end Road SB to Princess Royal Road NE-W WBT 1004 1024 1022 1023 183.1 155.4 161.9 168.2 26.7 25.5 26.7 26.6 32.0 30.4 31.7 31.4 C C C C
Mile end Road NB to Princess Royal Road S-W NBL 164 165 165 165 60.8 62.7 74.2 51.2 2.3 2.1 2.2 2.2 12.7 12.4 12.5 13.1 B B B B
Mile end Road NB to Mile end Road NB S-N NBT 2280 2212 2216 2211 226.6 225.0 224.3 235.1 22.6 23.1 22.8 23.5 14.4 14.8 14.7 15.2 B B B B
All 3561 3515 3516 3512 226.6 225.0 224.3 235.1 14.0 13.7 13.9 14.0 19.7 19.6 19.8 20.1 B B B C
0 NETWORK TOTALS All All 32771 33865 33884 33853 231.5 234.6 234.6 235.1 8.1 14.7 14.1 14.8 18.0 25.7 25.4 25.7 C C C C
LOS
07
:00
-08
:00
Volume Max QL (m) Avg QL (m) Delay (secs)
05/01/2015 13:55 Node Evaluation Comparison.xlsm

501 Rudmore Roundabout M275 SB to M275 SB NW-S SBT 2975 2962 2959 2970 0.0 226.5 229.6 16.8 0.0 3.7 6.0 0.0 2.9 7.2 9.4 2.8 A A A A
M275 NB to M275 NB S-NW NBT 2314 2230 2248 2239 0.0 0.0 0.0 0.0 0.0 0.0 0.0 0.0 2.1 1.7 1.6 1.6 A A A A
A2047 Kingston Cresent to Wharf Road E-W WBT 44 46 46 46 82.2 225.3 233.5 224.6 20.0 10.2 10.8 10.7 11.6 19.9 24.6 22.7 B C C C
A2047 Kingston Cresent to M275 SB Service Road E-S WBL 48 59 59 59 82.2 225.3 233.5 224.6 20.0 10.2 10.8 10.7 3.6 11.3 13.7 13.1 A B B B
A2047 Kingston Cresent to A2047 Kingston Cresent E-SE WBL 1 0 0 0 82.2 225.3 233.5 224.6 20.0 10.2 10.8 10.7 18.8 0.0 0.0 0.0 C A A A
A2047 Kingston Cresent to A3 Twyford Avenue E-NE WBU 43 63 63 63 82.2 225.3 233.5 224.6 20.0 10.2 10.8 10.7 29.0 33.5 35.4 34.9 D D E D
A2047 Kingston Cresent to M275 NB Service Road E-NW WBR 446 442 444 443 82.2 225.3 233.5 224.6 20.0 10.2 10.8 10.7 28.9 33.2 35.8 35.1 D D E E
M275 SB Service Road to Wharf Road NW-W SBR 326 343 343 344 97.6 96.4 92.5 96.4 2.0 13.8 13.9 13.9 7.4 18.1 18.3 18.0 A B B B
M275 SB Service Road to A3 Twyford Avenue NW-NE SBL 110 145 145 146 97.6 96.4 92.5 96.4 2.0 13.8 13.9 13.9 10.0 19.4 19.5 19.2 B B B B
M275 SB Service Road to M275 NB Service Road NW-NW SBU 11 20 20 20 97.6 96.4 92.5 96.4 2.0 13.8 13.9 13.9 9.0 20.5 21.3 20.5 A C C C
M275 SB Service Road to A2047 Kingston Cresent NW-SE SBL 466 481 481 482 97.6 96.4 92.5 96.4 2.0 13.8 13.9 13.9 13.3 19.5 19.6 19.5 B B B B
M275 SB Service Road to M275 SB Service Road NW-S SBT 171 166 167 167 97.6 96.4 92.5 96.4 2.0 13.8 13.9 13.9 10.0 19.0 19.3 18.6 A B B B
A3 Twyford Avenue to Wharf Road NE-W WBT 40 42 42 42 178.1 231.5 231.5 231.5 9.5 153.9 152.6 152.1 27.1 238.7 243.7 239.7 D F F F
A3 Twyford Avenue to A3 Twyford Avenue NE-NE WBU 6 19 19 19 178.1 231.5 231.5 231.5 9.5 153.9 152.6 152.1 25.3 252.9 254.3 248.6 D F F F
A3 Twyford Avenue to M275 NB Service Road NE-NW WBR 261 344 347 348 178.1 231.5 231.5 231.5 9.5 153.9 152.6 152.1 30.2 249.7 250.8 245.3 D F F F
A3 Twyford Avenue to A2047 Kingston Cresent NE-SE WBR2 42 130 130 130 178.1 231.5 231.5 231.5 9.5 153.9 152.6 152.1 20.0 231.2 233.6 227.4 C F F F
A3 Twyford Avenue to M275 SB Service Road NE-S WBL 304 449 450 451 178.1 231.5 231.5 231.5 9.5 153.9 152.6 152.1 29.7 232.4 233.4 229.2 D F F F
Wharf Road to Wharf Road W-W EBU 5 1 1 1 40.9 45.3 45.3 39.9 0.8 0.2 0.2 0.2 38.0 75.6 76.2 66.3 E E E E
Wharf Road to A3 Twyford Avenue W-NE EBT 19 18 18 18 40.9 45.3 45.3 39.9 0.8 0.2 0.2 0.2 33.1 72.8 72.9 72.8 D E E E
Wharf Road to M275 NB Service Road W-NW EBL 97 81 81 81 40.9 45.3 45.3 39.9 0.8 0.2 0.2 0.2 26.8 25.7 25.7 25.9 D C C C
Wharf Road to A2047 Kingston Cresent W-SE EBR 20 18 18 18 40.9 45.3 45.3 39.9 0.8 0.2 0.2 0.2 35.8 87.4 87.4 89.8 E F F F
Wharf Road to M275 SB Service Road W-S EBR2 33 45 45 45 40.9 45.3 45.3 39.9 0.8 0.2 0.2 0.2 35.5 92.3 92.3 91.2 E F F F
M275 NB Service Road to Wharf Road S-W NBL 124 106 107 106 39.7 36.3 31.7 25.1 0.1 0.0 0.0 0.0 4.0 24.3 24.6 24.4 A C C C
M275 NB Service Road to A3 Twyford Avenue S-NE NBR2 159 169 169 169 39.7 36.3 31.7 25.1 0.1 0.0 0.0 0.0 26.4 28.1 27.3 27.9 D C C C
M275 NB Service Road to M275 BB Service Road S-NW NBT 80 65 64 65 39.7 36.3 31.7 25.1 0.1 0.0 0.0 0.0 14.9 29.9 30.8 30.7 B C C C
M275 NB Service Road to A2047 Kingston Cresent S-SE NBR 46 55 56 56 39.7 36.3 31.7 25.1 0.1 0.0 0.0 0.0 23.6 37.6 36.7 37.5 C D D D
M275 NB Service Road to M275 SB Service Road S-S NBU 4 0 0 0 39.7 36.3 31.7 25.1 0.1 0.0 0.0 0.0 18.0 0.0 0.0 0.0 C A A A
All 8193 8498 8522 8527 178.1 231.5 233.5 231.5 6.0 33.1 33.1 32.8 8.7 37.7 38.9 36.0 A D D D
502 Mile End Roundabout Mile End Road to Mile End Road N-N SBU 82 71 71 72 164.4 235.9 235.9 235.9 16.7 94.6 93.4 81.8 60.4 76.2 79.0 78.1 E E E E
Mile End Road to Commercial Road N-S SBT 2418 2531 2530 2551 164.4 235.9 235.9 235.9 16.7 94.6 93.4 81.8 15.3 53.4 53.9 55.3 B D D E
Mile End Road to Church Street N-E SBL 591 621 622 626 164.4 235.9 235.9 235.9 16.7 94.6 93.4 81.8 18.8 52.8 54.1 38.5 B D D D
Hope Street to Mile End Road SW-N NBT 1667 1708 1710 1710 228.0 225.5 225.0 226.4 33.4 34.8 34.5 33.5 18.7 18.7 18.5 18.3 B B B B
Hope Street to Mile End Road SW-N NBT 0 0 0 0 22.9 13.6 13.7 13.6 0.2 0.1 0.1 0.1 0.0 0.0 0.0 0.0 A A A A
Hope Street to Commercial Road SW-S NBU 1 0 0 0 22.9 13.6 13.7 13.6 0.2 0.1 0.1 0.1 73.7 0.0 0.0 0.0 E A A A
Hope Street to Church Street SW-E NBR 18 11 11 11 22.9 13.6 13.7 13.6 0.2 0.1 0.1 0.1 88.6 73.4 78.0 75.8 F E E E
Commercial Road to Mile End Road S-N NBT 366 333 355 343 52.3 46.2 60.1 38.9 1.3 0.9 1.1 1.0 40.5 38.9 38.9 38.6 D D D D
Commercial Road to Commercial Road S-S NBU 0 0 0 0 52.3 46.2 60.1 38.9 1.3 0.9 1.1 1.0 0.0 0.0 0.0 0.0 A A A A
Commercial Road to Church Street S-E NBR 1 5 5 6 52.3 46.2 60.1 38.9 1.3 0.9 1.1 1.0 41.2 49.4 46.6 53.2 D D D D
Church Street to Mile End Road E-N WBR 556 461 459 461 231.5 235.8 233.7 235.9 222.1 222.6 221.6 222.3 396.6 493.1 501.8 497.0 F F F F
Church Street to Commercial Road E-S WBL 11 6 6 6 231.5 235.8 233.7 235.9 222.1 222.6 221.6 222.3 468.5 400.3 729.5 519.8 F F F F
Church Street to Church Street E-E WBU 0 0 0 0 231.5 235.8 233.7 235.9 222.1 222.6 221.6 222.3 0.0 0.0 0.0 0.0 A A A A
All 5711 5746 5768 5784 231.5 235.9 235.9 235.9 58.0 76.1 75.6 73.0 57.2 78.1 79.1 77.5 E E E E
503 Cascade's Approach Cascade's Approach to Cascade's Approach S-SW NBL 0 0 0 0 13.0 12.9 13.2 12.9 0.3 0.3 0.4 0.4 0.0 0.0 0.0 0.0 A A A A
Cascade's Approach to Marketway WB S-E NBR 5 5 5 5 13.0 12.9 13.2 12.9 0.3 0.3 0.4 0.4 21.0 18.2 21.3 22.4 C C C C
Cascade's Approach to Marketway EB S-W NBL 10 10 10 10 13.0 12.9 13.2 12.9 0.3 0.3 0.4 0.4 16.7 20.7 26.5 23.6 C C D C
Marketway WB to Cascade's Approach NE-SW WBT 110 105 105 108 231.5 231.3 232.8 231.3 22.5 27.1 26.7 25.4 5.5 15.4 14.4 13.8 A C B B
Marketway WB to Marketway WB NE-E WBL 21 21 21 22 231.5 231.3 232.8 231.3 22.5 27.1 26.7 25.4 18.9 20.1 18.8 18.6 C C C C
Marketway WB to Marketway EB NE-W WBT 1940 2019 2023 2035 231.5 231.3 232.8 231.3 22.5 27.1 26.7 25.4 17.7 18.9 17.3 16.6 C C C C
Marketway EB to Cascade's Approach SW-SW EBU 9 8 8 8 141.1 36.5 51.0 34.8 0.2 0.2 0.2 0.2 4.8 4.8 4.7 5.1 A A A A
Marketway EB to Hope Street SW-N EBL 1643 1683 1680 1679 0.0 0.0 0.0 0.0 0.0 0.0 0.0 0.0 5.0 5.0 4.7 4.8 A A A A
Marketway WB to Marketway EB NE-W WBT 30 30 30 30 109.2 183.6 228.8 193.3 0.1 0.1 0.7 0.3 5.9 5.2 3.6 3.8 A A A A
Marketway EB to Marketway WB SW-E EBT 142 144 143 143 141.1 36.5 51.0 34.8 0.2 0.2 0.2 0.2 6.4 6.6 6.1 6.2 A A A A
Marketway EB to Marketway EB SW-W NBL 6 6 6 6 141.1 36.5 51.0 34.8 0.2 0.2 0.2 0.2 6.9 6.8 7.7 7.8 A A A A
All 3916 4031 4031 4045 231.5 231.3 232.8 231.3 6.3 7.5 7.5 7.1 11.5 12.4 11.5 11.1 B B B B
504 Marketway Roundabout Commercial Road NB to Commercial Road SB S-N NBT 13 14 14 14 50.5 40.0 38.6 44.8 3.0 3.7 3.5 3.9 30.5 33.2 34.4 32.6 D D D D
Commercial Road NB to Marketway S-W NBL 12 12 12 13 50.5 40.0 38.6 44.8 3.0 3.7 3.5 3.9 50.2 50.4 49.3 51.9 F F E F
Commercial Road NB to Cornmill street S-SE NBR 5 6 6 5 50.5 40.0 38.6 44.8 3.0 3.7 3.5 3.9 27.8 34.5 31.9 34.7 D D D D
Commercial Road SB to Commercial Road SB N-N SBU 37 37 36 37 229.1 230.9 230.8 231.2 29.0 35.5 33.8 35.6 25.4 28.4 27.1 27.5 D D D D
Commercial Road SB to Marketway N-W SBR 2025 2108 2101 2128 229.1 230.9 230.8 231.2 29.0 35.5 33.8 35.6 29.2 33.5 31.0 30.9 D D D D
Commercial Road SB to Cornmill street N-SE SBT 353 377 375 380 229.1 230.9 230.8 231.2 29.0 35.5 33.8 35.6 20.0 19.6 19.5 19.3 C C C C
Marketway to Commercial Road SB W-N EBL 73 79 79 79 61.4 54.8 64.8 82.2 1.0 0.8 1.3 1.3 9.9 9.8 8.6 9.1 A A A A
Marketway to Marketway W-W EBU 0 0 0 0 61.4 54.8 64.8 82.2 1.0 0.8 1.3 1.3 2.6 4.7 0.9 2.4 A A A A
Marketway to Cornmill street W-SE EBT 75 73 72 73 61.4 54.8 64.8 82.2 1.0 0.8 1.3 1.3 13.5 12.4 13.9 13.0 B B B B
Cornmill street to Commercial Road NB E-SW WBT 1 6 7 6 157.7 160.4 160.6 158.7 12.1 32.3 31.8 24.2 0.2 13.9 8.0 13.7 A B A B
Cornmill street to Commercial Road SB E-N WBR 285 243 268 254 171.9 174.6 174.8 172.9 19.8 43.4 42.8 34.1 31.0 55.6 49.9 47.3 D F E E
Cornmill street to Marketway E-W WBT 106 90 102 95 171.9 174.6 174.8 172.9 19.8 43.4 42.8 34.1 34.0 61.7 54.2 52.1 D F F F
Cornmill street to Cornmill street E-SE WBL 0 0 0 0 171.9 174.6 174.8 172.9 19.8 43.4 42.8 34.1 0.0 0.0 0.0 0.0 A A A A
All 2985 3044 3072 3083 229.1 230.9 230.8 231.2 13.1 21.7 21.2 19.1 27.6 33.1 31.0 30.5 D D D D
505 A2030 roundabout Lake Road NB to Lake Road NB SW-W NBL 0 0 0 0 82.1 83.4 85.6 83.7 3.8 19.0 18.2 12.4 0.0 0.0 0.0 0.0 A A A A
Lake Road NB to Cornmill street SW-NW EBL 75 66 71 71 82.1 83.4 85.6 83.7 3.8 19.0 18.2 12.4 23.2 129.1 128.5 81.0 C F F F
Lake Road NB to Lake Road SB SW-E EBT 52 45 50 51 82.1 83.4 85.6 83.7 3.8 19.0 18.2 12.4 8.6 83.3 72.6 43.4 A F F E
Cornmill street to Lake Road NB NW-W SBR 84 87 87 88 32.4 28.6 91.6 28.8 1.2 1.1 1.3 1.0 6.0 10.4 10.8 8.5 A B B A
Cornmill street to Cornmill street NW-NW SBU 0 0 0 0 32.4 28.6 91.6 28.8 1.2 1.1 1.3 1.0 0.0 0.0 0.0 0.0 A A A A
Cornmill street to Lake Road SB NW-E SBL 347 367 364 368 32.4 28.6 91.6 28.8 1.2 1.1 1.3 1.0 3.8 3.5 4.3 3.1 A A A A
Lake Road SB to Lake Road NB E-W WBT 35 31 34 32 231.4 230.9 231.5 231.5 8.4 23.5 24.0 15.8 13.4 42.7 42.2 30.3 B E E D
Lake Road SB to Cornmill street E-NW WBT 319 277 308 287 231.4 230.9 231.5 231.5 8.4 23.5 24.0 15.8 27.1 79.1 77.6 61.5 D F F F
Lake Road SB to Lake Road SB E-E WBU 0 0 0 0 231.4 230.9 231.5 231.5 8.4 23.5 24.0 15.8 0.0 0.0 0.0 0.0 A A A A
All 911 872 914 897 231.4 230.9 231.5 231.5 4.5 14.5 14.5 9.7 14.3 40.1 43.4 30.7 B E E D
506 Holbrook Road Roundabout Lake Road SB to Lake Road SB NE-E WBL 4 4 4 4 231.5 235.6 230.8 236.0 166.9 201.3 15.6 201.6 118.8 232.0 60.8 236.9 F F F F
Lake Road SB to Holbrook Road NE-S WBR 212 195 229 194 231.5 235.6 230.8 236.0 166.9 201.3 15.6 201.6 200.0 275.1 35.3 279.1 F F E F
Lake Road SB to Church Street NE-NW WBR 66 62 68 62 231.5 235.6 230.8 236.0 166.9 201.3 15.6 201.6 188.5 277.9 90.2 283.4 F F F F
Lake Road SB to Lake Road NB NE-W WBT 209 202 231 202 231.5 235.6 230.8 236.0 166.9 201.3 15.6 201.6 193.7 273.6 42.5 279.1 F F E F
Holbrook Road to Lake Road SB SE-E NBR 175 136 129 134 235.8 236.0 235.8 235.9 174.2 193.8 196.5 194.3 310.9 466.0 489.9 468.2 F F F F
Holbrook Road to Holbrook Road SE-S NBL 0 0 0 0 235.8 236.0 235.8 235.9 174.2 193.8 196.5 194.3 0.0 0.0 0.0 0.0 A A A A
Holbrook Road to Church Street SE-NW NBT 477 388 376 388 235.8 236.0 235.8 235.9 174.2 193.8 196.5 194.3 310.5 478.8 527.5 480.5 F F F F
Holbrook Road to Lake Road NB SE-W NBL 151 122 119 122 235.8 236.0 235.8 235.9 174.2 193.8 196.5 194.3 208.9 338.0 352.7 338.7 F F F F
Church Street to Lake Road SB NW-E SBL 86 91 90 91 171.1 227.9 218.1 226.6 11.4 16.6 2.0 19.4 43.2 41.9 40.7 55.5 E E E F
Church Street to Holbrook Road NW-S SBT 444 462 462 464 171.1 227.9 218.1 226.6 11.4 16.6 2.0 19.4 38.1 46.5 35.8 48.0 E E E E
Church Street to Church Street NW-NW SBU 0 0 0 0 171.1 227.9 218.1 226.6 11.4 16.6 2.0 19.4 0.0 0.0 0.0 0.0 A A A A
Church Street to Lake Road NB NW-W SBR 8 8 8 8 171.1 227.9 218.1 226.6 11.4 16.6 2.0 19.4 99.9 69.5 29.8 83.2 F F D F
Lake Road NB to Lake Road SB SW-E EBT 104 110 110 111 223.6 129.3 218.1 194.3 11.1 5.2 6.6 6.1 19.2 11.0 12.9 12.5 C B B B
Lake Road NB to Holbrook Road SW-S EBR 277 289 290 295 223.6 129.3 218.1 194.3 11.1 5.2 6.6 6.1 20.1 12.2 13.5 14.0 C B B B
Lake Road NB to Church Street SW-NW EBL 12 10 11 11 223.6 129.3 218.1 194.3 11.1 5.2 6.6 6.1 32.3 28.8 56.1 28.5 D D F D
Lake Road NB to Lake Road NB SW-W NBL 1 1 1 1 223.6 129.3 218.1 194.3 11.1 5.2 6.6 6.1 13.4 11.6 12.0 11.5 B B B B
All 2224 2080 2125 2085 235.8 236.0 235.8 236.0 90.9 104.2 55.2 105.3 161.2 215.2 166.1 216.9 F F F F
507 Unicorn Road Unicorn Road WB to Market Way NW-NE SBL 52 53 54 53 28.9 39.9 49.4 35.2 3.0 3.5 3.5 3.4 42.6 46.8 45.6 45.5 D D D D
Unicorn Road WB to Unicorn Road EB NW-S SBT 11 11 11 11 37.4 40.3 50.6 30.1 3.1 3.3 3.5 3.3 57.6 53.9 55.6 56.2 E D E E
Unicorn Road WB to Alfred Road NW-SW SBR 29 28 28 28 37.4 40.3 50.6 30.1 3.1 3.3 3.5 3.3 62.2 65.1 69.8 68.0 E E E E
Market Way to Unicorn Road WB NE-NW WBR 73 74 75 75 224.8 224.5 224.7 231.4 24.9 35.8 37.0 35.0 64.5 68.1 69.5 68.9 E E E E
Market Way to Unicorn Road EB NE-S WBU 310 324 326 327 224.8 224.5 224.7 231.4 24.9 35.8 37.0 35.0 14.5 15.5 15.8 14.7 B B B B
Market Way to Alfred Road NE-SW WBT 1581 1636 1639 1648 224.8 224.5 224.7 231.4 24.9 35.8 37.0 35.0 25.9 31.4 32.5 30.3 C C C C
Unicorn Road EB to Unicorn Road WB S-NW NBT 35 35 36 36 92.3 94.8 100.5 90.4 14.6 15.5 16.0 15.5 51.5 55.9 56.5 55.4 D E E E
Unicorn Road EB to Market Way S-NE NBR 145 150 150 150 92.3 94.8 100.5 90.4 14.6 15.5 16.0 15.5 52.3 54.3 55.7 54.3 D D E D
Unicorn Road EB to Alfred Road S-SW NBL 12 11 11 10 30.1 58.5 50.8 55.2 0.7 0.9 0.7 0.9 49.7 58.6 59.6 60.6 D E E E
Alfred Road to Unicorn Road WB SW-NW EBL 99 98 98 98 225.7 223.6 222.5 222.3 37.5 38.6 39.1 38.8 21.6 22.9 21.4 23.3 C C C C
Alfred Road to Market Way SW-NE EBT 1603 1639 1631 1633 225.7 223.6 222.5 222.3 37.5 38.6 39.1 38.8 22.8 22.9 23.2 23.0 C C C C
All 3949 4061 4057 4069 225.7 224.5 224.7 231.4 17.2 20.6 21.1 20.4 26.2 28.7 29.4 28.3 C C C C
508 Stanhope Road Stanhope Road to Stanhope Road S-S NBU 0 0 0 0 26.0 50.5 38.7 31.0 0.1 0.1 0.1 0.1 0.0 0.0 0.0 0.0 A A A A
Stanhope Road to Edinburgh Road WB S-SE NBR 0 0 0 0 26.0 50.5 38.7 31.0 0.1 0.1 0.1 0.1 0.0 0.0 0.0 0.0 A A A A
Stanhope Road to Unicorn road S-N NBT 167 171 171 171 26.0 50.5 38.7 31.0 0.1 0.1 0.1 0.1 4.3 4.4 4.3 4.4 A A A A
Stanhope Road to Edinburgh Road EB S-W NBL 8 8 8 8 26.0 50.5 38.7 31.0 0.1 0.1 0.1 0.1 14.3 13.8 13.9 14.7 B B B B
Edinburgh Road WB to Stanhope Road E-S WBL 12 11 11 11 76.3 35.2 75.6 71.5 0.4 0.4 0.4 0.4 7.9 9.7 9.7 9.0 A A A A
Edinburgh Road WB to Edinburgh Road WB E-SE WBL 0 0 0 0 76.3 35.2 75.6 71.5 0.4 0.4 0.4 0.4 0.0 0.0 0.0 0.0 A A A A
Edinburgh Road WB to Unicorn road E-N WBR 24 24 24 24 76.3 35.2 75.6 71.5 0.4 0.4 0.4 0.4 13.7 14.3 14.7 14.4 B B B B
Edinburgh Road WB to Edinburgh Road EB E-W WBT 49 49 50 49 76.3 35.2 75.6 71.5 0.4 0.4 0.4 0.4 21.7 21.0 21.3 20.5 C C C C
Unicorn road to Stanhope Road N-S SBT 279 294 295 296 47.1 33.0 24.3 35.8 0.0 0.0 0.0 0.1 1.2 1.2 1.2 1.2 A A A A
Unicorn road to Edinburgh Road WB N-SE SBT 24 23 24 23 47.1 33.0 24.3 35.8 0.0 0.0 0.0 0.1 1.6 1.7 1.4 2.0 A A A A
Unicorn road to Unicorn road N-N SBU 0 0 0 0 47.1 33.0 24.3 35.8 0.0 0.0 0.0 0.1 0.0 0.0 0.0 0.0 A A A A
Unicorn road to Edinburgh Road EB N-W SBR 17 19 19 19 47.1 33.0 24.3 35.8 0.0 0.0 0.0 0.1 2.1 2.1 1.5 1.4 A A A A
Edinburgh Road EB to Stanhope Road W-S EBR 8 8 8 8 41.0 37.1 36.9 39.5 0.1 0.1 0.1 0.1 11.3 10.8 10.8 10.8 B B B B
Edinburgh Road EB to Edinburgh Road WB W-SE EBT 24 24 24 24 41.0 37.1 36.9 39.5 0.1 0.1 0.1 0.1 12.6 12.3 12.2 12.3 B B B B
Edinburgh Road EB to Unicorn road W-N EBL 0 0 0 0 41.0 37.1 36.9 39.5 0.1 0.1 0.1 0.1 0.0 0.0 0.0 0.0 A A A A
Edinburgh Road EB to Edinburgh Road EB W-W EBU 0 0 0 0 41.0 37.1 36.9 39.5 0.1 0.1 0.1 0.1 0.0 0.0 0.0 0.0 A A A A
All 613 631 633 634 76.3 50.5 75.6 71.5 0.2 0.2 0.2 0.2 5.1 5.0 5.0 5.0 A A A A
509 Queen Street Queen St to Alfred Road W-NE EBL 402 409 410 409 81.0 85.6 92.6 85.6 14.0 14.3 14.3 14.2 27.9 28.5 28.6 28.6 C C C C
Queen St to Bishop Crispian Way W-E EBT 32 32 32 32 72.2 76.9 83.8 76.9 6.6 6.8 6.7 6.7 70.0 70.2 70.0 70.0 E E E E
Alfred Road to Queen St NE-W WBT 389 405 405 409 230.8 228.9 231.0 231.4 90.7 106.3 109.6 109.9 86.7 96.3 96.5 98.7 F F F F
Alfred Road to Anglesea Road NE-S WBR 1217 1261 1263 1270 227.8 227.6 227.2 228.8 49.1 61.0 61.1 57.5 22.9 23.0 24.2 21.9 C C C C
Bishop Crispian Way to Queen St E-W WBT 73 75 76 75 106.4 88.6 99.9 88.4 9.2 10.0 9.7 9.6 58.9 60.3 58.7 59.0 E E E E
Anglesea Road to Queen St S-W NBL 17 18 18 18 8.7 59.0 68.5 36.2 0.2 0.2 0.3 0.2 20.3 21.4 21.2 20.2 C C C C
Anglesea Road to Alfred Road S-NE NBR 1300 1327 1325 1323 225.9 170.5 223.1 224.6 17.7 16.7 16.6 16.4 22.3 22.3 22.3 22.0 C C C C
All 3430 3528 3529 3537 230.8 228.9 231.0 231.4 26.8 30.7 31.2 30.7 31.8 33.1 33.5 32.8 C C C C
510 St Michael's Gyratory St Paul's Road to Wiltshire Street S-E NBR 0 0 0 0 42.9 43.1 47.5 48.3 0.8 1.0 1.2 1.0 0.0 0.0 0.0 0.0 A A A A
St Paul's Road to Waltham St S-S NBU 0 0 0 0 42.9 43.1 47.5 48.3 0.8 1.0 1.2 1.0 0.0 0.0 0.0 0.0 A A A A
St Paul's Road to Guildhall Walk S-NE NBT 0 0 0 0 42.9 43.1 47.5 48.3 0.8 1.0 1.2 1.0 0.0 0.0 0.0 0.0 A A A A
St Paul's Road to Cambridge Road S-SW NBL 0 0 0 0 42.9 43.1 47.5 48.3 0.8 1.0 1.2 1.0 0.0 0.0 0.0 0.0 A A A A
St Paul's Road to Hampshire Terrace S-S NBU 0 0 0 0 42.9 43.1 47.5 48.3 0.8 1.0 1.2 1.0 0.0 0.0 0.0 0.0 A A A A
St Paul's Road to Winston churchill avenue S-E NBR 0 0 0 0 42.9 43.1 47.5 48.3 0.8 1.0 1.2 1.0 0.0 0.0 0.0 0.0 A A A A
St Paul's Road to Anglesea Road S-N NBT 185 185 185 185 42.9 43.1 47.5 48.3 0.8 1.0 1.2 1.0 12.1 16.4 18.2 16.3 B C C C
Cambridge Road to Wiltshire Street SW-E EBT 3 4 4 4 224.0 190.2 190.2 190.2 2.8 4.3 4.3 4.4 29.0 48.3 52.6 52.0 C D D D
Cambridge Road to Waltham St SW-S EBR 0 0 0 0 224.0 190.2 190.2 190.2 2.8 4.3 4.3 4.4 0.0 0.0 0.0 0.0 A A A A
Cambridge Road to Guildhall Walk SW-NE EBT 19 19 19 19 224.0 190.2 190.2 190.2 2.8 4.3 4.3 4.4 26.7 49.5 51.6 50.4 C D D D
Cambridge Road to Cambridge Road SW-SW EBU 3 3 3 3 224.0 190.2 190.2 190.2 2.8 4.3 4.3 4.4 33.5 45.4 47.2 57.3 C D D E
Cambridge Road to Hampshire Terrace SW-S EBR 3 3 3 3 224.0 190.2 190.2 190.2 2.8 4.3 4.3 4.4 30.8 57.4 54.2 51.3 C E D D
Cambridge Road to Winston churchill avenue SW-E EBT 132 130 130 129 224.0 190.2 190.2 190.2 2.8 4.3 4.3 4.4 27.4 54.0 52.4 53.7 C D D D
Cambridge Road to Anglesea Road SW-N EBL 546 561 561 561 224.0 190.2 190.2 190.2 2.8 4.3 4.3 4.4 14.4 12.6 12.4 12.6 B B B B
Hampshire Terrace to Wiltshire Street S-E NBR 1 2 2 2 231.5 234.4 231.5 235.9 32.7 149.7 164.3 164.7 48.2 242.2 262.4 268.8 E F F F
Hampshire Terrace to Waltham St S-S NBU 0 0 0 0 231.5 234.4 231.5 235.9 32.7 149.7 164.3 164.7 0.0 0.0 0.0 0.0 A A A A
Hampshire Terrace to Guildhall Walk S-NE NBT 13 11 12 11 231.5 234.4 231.5 235.9 32.7 149.7 164.3 164.7 68.1 307.4 317.2 321.0 F F F F
Hampshire Terrace to Cambridge Road S-SW NBL 16 14 14 14 231.5 234.4 231.5 235.9 32.7 149.7 164.3 164.7 63.1 265.0 267.0 283.7 F F F F
Hampshire Terrace to Hampshire Terrace S-S NBU 1 1 1 0 231.5 234.4 231.5 235.9 32.7 149.7 164.3 164.7 26.4 107.2 105.3 99.6 D F F F
Hampshire Terrace to Winston churchill avenue S-E NBR 34 34 34 33 231.5 234.4 231.5 235.9 32.7 149.7 164.3 164.7 67.1 280.0 283.0 295.6 F F F F
Hampshire Terrace to Anglesea Road S-N NBT 339 359 358 358 231.5 234.4 231.5 235.9 32.7 149.7 164.3 164.7 52.6 241.6 249.1 263.2 F F F F
Winston churchill avenue to Wiltshire Street E-E WBU 5 5 5 5 90.9 61.9 68.4 69.1 10.2 8.4 8.6 8.6 31.8 29.2 29.7 25.6 C C C C
Winston churchill avenue to Waltham St E-S WBL 50 50 50 50 90.9 61.9 68.4 69.1 10.2 8.4 8.6 8.6 21.1 17.5 19.3 18.5 C B B B
Winston churchill avenue to Guildhall Walk E-NE WBR 10 10 10 10 90.9 61.9 68.4 69.1 10.2 8.4 8.6 8.6 45.5 79.5 80.6 79.3 D E F E
Winston churchill avenue to Cambridge Road E-SW WBT 178 176 176 176 90.9 61.9 68.4 69.1 10.2 8.4 8.6 8.6 38.3 38.3 39.9 38.7 D D D D
Winston churchill avenue to Hampshire Terrace E-S WBL 119 120 120 120 90.9 61.9 68.4 69.1 10.2 8.4 8.6 8.6 30.4 26.7 28.9 26.6 C C C C
Winston churchill avenue to Winston churchill avenue E-E WBU 23 23 23 23 90.9 61.9 68.4 69.1 10.2 8.4 8.6 8.6 51.2 74.7 76.1 76.7 D E E E
Winston churchill avenue to Anglesea Road E-N WBR 119 119 119 119 90.9 61.9 68.4 69.1 10.2 8.4 8.6 8.6 38.4 40.7 41.1 40.3 D D D D
Anglesea Road to Wiltshire Street N-E SBL 45 46 47 46 72.2 71.0 72.6 68.0 0.9 5.7 5.5 5.7 21.9 24.9 26.5 25.4 C C C C
Anglesea Road to Waltham St N-S SBT 0 0 0 0 72.2 71.0 72.6 68.0 0.9 5.7 5.5 5.7 0.0 0.0 0.0 0.0 A A A A
Anglesea Road to Guildhall Walk N-NE SBL 79 78 78 79 72.2 71.0 72.6 68.0 0.9 5.7 5.5 5.7 13.1 17.5 16.5 17.2 B B B B
Anglesea Road to Cambridge Road N-SW SBR 268 290 291 295 72.2 71.0 72.6 68.0 0.9 5.7 5.5 5.7 28.2 34.6 35.7 34.2 D C D C
Anglesea Road to Hampshire Terrace N-S SBT 377 406 408 410 72.2 71.0 72.6 68.0 0.9 5.7 5.5 5.7 22.1 26.3 27.0 26.1 C C C C
Anglesea Road to Winston churchill avenue N-E SBL 92 96 95 96 72.2 71.0 72.6 68.0 0.9 5.7 5.5 5.7 12.3 16.1 16.5 16.0 B B B B
Anglesea Road to Anglesea Road N-N SBU 74 71 71 72 72.2 71.0 72.6 68.0 0.9 5.7 5.5 5.7 30.9 37.0 38.9 36.9 D D D D
All 2734 2814 2816 2822 231.5 234.4 231.5 235.9 9.5 33.8 36.8 36.9 27.8 59.4 61.2 62.2 D E E E
511 Park Road Park Road to Anglesea Road W-N EBL 140 143 143 143 94.1 98.1 98.1 98.1 11.8 11.7 11.7 11.7 52.4 51.3 51.3 51.3 D D D D
Anglesea Road SB to Park Road N-W SBR 256 267 267 269 234.7 234.3 231.1 231.4 65.1 62.3 65.2 62.1 111.8 100.3 108.3 103.4 F F F F
Anglesea Road SB to Anglesea Road SB N-S SBT 944 992 997 1004 234.7 234.3 231.1 231.4 65.1 62.3 65.2 62.1 26.6 23.7 24.4 20.8 C C C C
Anglesea Road to Park Road S-W NBL 49 52 51 52 225.5 179.1 159.0 219.8 12.8 11.2 11.3 11.7 14.3 10.6 10.6 10.6 B B B B
Anglesea Road to Anglesea Road S-N NBT 1150 1177 1176 1175 225.5 179.1 159.0 219.8 12.8 11.2 11.3 11.7 12.3 10.3 10.4 10.5 B B B B
All 2538 2630 2634 2642 234.7 234.3 231.1 231.4 33.5 31.7 32.9 31.9 29.9 26.8 27.8 26.1 C C C C
512 Princess Royal Road Princess Royal Road to Mile end Road NB W-N EBL 119 118 119 118 91.3 59.8 69.5 68.0 5.7 5.2 5.3 5.5 28.7 27.1 27.2 28.3 C C C C
Mile end Road SB to Princess Royal Road NE-W WBT 446 442 442 444 119.8 120.5 106.8 106.6 11.9 10.7 10.9 10.8 32.4 34.6 35.9 31.8 C C D C
Mile end Road NB to Princess Royal Road S-W NBL 81 86 86 86 41.9 33.4 25.3 23.9 0.5 0.5 0.5 0.5 7.0 6.7 6.4 6.2 A A A A
Mile end Road NB to Mile end Road NB S-N NBT 2598 2497 2518 2508 223.5 170.2 193.0 205.2 15.0 13.2 13.7 13.2 9.4 8.8 9.0 8.8 A A A A
All 3244 3142 3164 3155 223.5 170.2 193.0 205.2 8.3 7.4 7.6 7.5 13.2 13.1 13.4 12.7 B B B B
0 NETWORK TOTALS All 40450 41077 41266 41281 235.8 236.0 235.9 236.0 21.3 35.1 31.1 35.1 32.3 46.7 44.8 45.9 D D D D
08
:00
-09
:00
05/01/2015 13:55 Node Evaluation Comparison.xlsm

501 Rudmore Roundabout M275 SB to M275 SB NW-S SBT 1983 2132 2134 2125 0.0 225.4 231.3 226.8 0.0 0.5 2.8 1.7 1.3 1.7 4.8 3.2 A A A A
M275 NB to M275 NB S-NW NBT 1389 1376 1377 1380 0.0 0.0 0.0 0.0 0.0 0.0 0.0 0.0 1.0 0.9 0.8 0.9 A A A A
A2047 Kingston Cresent to Wharf Road E-W WBT 31 31 31 31 81.9 57.0 64.0 59.0 9.6 1.1 1.1 1.2 8.6 8.6 8.4 8.8 A A A A
A2047 Kingston Cresent to M275 SB Service Road E-S WBL 65 82 82 82 81.9 57.0 64.0 59.0 9.6 1.1 1.1 1.2 2.5 4.7 4.5 4.6 A A A A
A2047 Kingston Cresent to A2047 Kingston Cresent E-SE WBL 0 0 0 0 81.9 57.0 64.0 59.0 9.6 1.1 1.1 1.2 0.0 0.0 0.0 0.0 A A A A
A2047 Kingston Cresent to A3 Twyford Avenue E-NE WBU 88 85 85 85 81.9 57.0 64.0 59.0 9.6 1.1 1.1 1.2 19.0 27.6 27.6 27.2 C D D D
A2047 Kingston Cresent to M275 NB Service Road E-NW WBR 349 349 348 348 81.9 57.0 64.0 59.0 9.6 1.1 1.1 1.2 18.4 13.2 13.0 13.4 C B B B
M275 SB Service Road to Wharf Road NW-W SBR 124 146 145 145 96.8 90.1 90.1 89.8 1.7 8.2 8.2 7.9 5.4 14.9 14.8 14.8 A B B B
M275 SB Service Road to A3 Twyford Avenue NW-NE SBL 81 113 113 112 96.8 90.1 90.1 89.8 1.7 8.2 8.2 7.9 9.5 16.0 15.9 15.3 A B B B
M275 SB Service Road to M275 NB Service Road NW-NW SBU 15 13 13 13 96.8 90.1 90.1 89.8 1.7 8.2 8.2 7.9 5.8 19.9 20.0 20.0 A B C B
M275 SB Service Road to A2047 Kingston Cresent NW-SE SBL 299 352 352 351 96.8 90.1 90.1 89.8 1.7 8.2 8.2 7.9 12.2 16.6 16.6 15.9 B B B B
M275 SB Service Road to M275 SB Service Road NW-S SBT 73 86 85 85 96.8 90.1 90.1 89.8 1.7 8.2 8.2 7.9 8.8 16.2 16.1 16.0 A B B B
A3 Twyford Avenue to Wharf Road NE-W WBT 25 18 18 18 219.3 231.5 231.5 231.5 3.6 69.6 63.4 61.6 17.9 153.1 143.1 137.5 C F F F
A3 Twyford Avenue to A3 Twyford Avenue NE-NE WBU 21 26 25 26 219.3 231.5 231.5 231.5 3.6 69.6 63.4 61.6 19.8 150.3 144.9 141.8 C F F F
A3 Twyford Avenue to M275 NB Service Road NE-NW WBR 128 141 142 141 219.3 231.5 231.5 231.5 3.6 69.6 63.4 61.6 20.1 140.5 132.2 126.7 C F F F
A3 Twyford Avenue to A2047 Kingston Cresent NE-SE WBR2 127 121 121 121 219.3 231.5 231.5 231.5 3.6 69.6 63.4 61.6 15.4 112.0 104.1 99.4 C F F F
A3 Twyford Avenue to M275 SB Service Road NE-S WBL 477 517 516 515 219.3 231.5 231.5 231.5 3.6 69.6 63.4 61.6 21.9 112.4 106.6 100.1 C F F F
Wharf Road to Wharf Road W-W EBU 4 0 0 0 46.2 25.0 25.0 25.0 0.5 0.0 0.0 0.0 30.7 0.0 0.0 0.0 D A A A
Wharf Road to A3 Twyford Avenue W-NE EBT 30 19 19 19 46.2 25.0 25.0 25.0 0.5 0.0 0.0 0.0 31.1 70.6 70.8 70.7 D E E E
Wharf Road to M275 NB Service Road W-NW EBL 62 80 80 80 46.2 25.0 25.0 25.0 0.5 0.0 0.0 0.0 25.9 26.0 26.0 26.4 D C C C
Wharf Road to A2047 Kingston Cresent W-SE EBR 10 16 16 16 46.2 25.0 25.0 25.0 0.5 0.0 0.0 0.0 33.9 84.9 85.0 84.2 D F F F
Wharf Road to M275 SB Service Road W-S EBR2 53 45 45 45 46.2 25.0 25.0 25.0 0.5 0.0 0.0 0.0 33.7 83.6 83.7 81.9 D F F F
M275 NB Service Road to Wharf Road S-W NBL 85 55 55 56 21.5 24.8 57.1 42.4 0.0 0.0 0.0 0.0 2.3 22.4 23.3 22.5 A C C C
M275 NB Service Road to A3 Twyford Avenue S-NE NBR2 219 233 234 234 21.5 24.8 57.1 42.4 0.0 0.0 0.0 0.0 10.6 25.9 26.8 27.2 B C C C
M275 NB Service Road to M275 BB Service Road S-NW NBT 81 69 70 69 21.5 24.8 57.1 42.4 0.0 0.0 0.0 0.0 7.1 25.7 26.3 27.4 A C C C
M275 NB Service Road to A2047 Kingston Cresent S-SE NBR 51 74 74 75 21.5 24.8 57.1 42.4 0.0 0.0 0.0 0.0 12.3 31.2 32.2 32.0 B C C C
M275 NB Service Road to M275 SB Service Road S-S NBU 14 0 0 0 21.5 24.8 57.1 42.4 0.0 0.0 0.0 0.0 9.1 0.0 0.0 0.0 A A A A
All 5881 6179 6180 6172 219.3 231.5 231.5 231.5 2.9 14.7 13.6 13.2 7.3 23.0 23.3 21.9 A C C C
502 Mile End Roundabout Mile End Road to Mile End Road N-N SBU 104 84 84 83 130.8 235.9 231.5 235.9 11.4 27.9 34.9 31.6 54.3 57.3 63.6 63.7 D E E E
Mile End Road to Commercial Road N-S SBT 1846 2035 2036 2012 130.8 235.9 231.5 235.9 11.4 27.9 34.9 31.6 12.3 21.2 27.5 25.6 B C C C
Mile End Road to Church Street N-E SBL 530 579 577 571 130.8 235.9 231.5 235.9 11.4 27.9 34.9 31.6 16.8 22.8 28.4 29.5 B C C C
Hope Street to Mile End Road SW-N NBT 996 1067 1068 1067 180.0 221.8 210.9 208.7 13.5 14.8 15.1 14.9 15.1 15.0 15.3 15.1 B B B B
Hope Street to Mile End Road SW-N NBT 0 0 0 0 28.1 25.2 23.3 23.4 0.3 0.5 0.4 0.5 0.0 0.0 0.0 0.0 A A A A
Hope Street to Commercial Road SW-S NBU 8 0 0 0 28.1 25.2 23.3 23.4 0.3 0.5 0.4 0.5 104.0 0.0 0.0 0.0 F A A A
Hope Street to Church Street SW-E NBR 18 38 38 38 28.1 25.2 23.3 23.4 0.3 0.5 0.4 0.5 86.5 76.7 74.3 76.0 F E E E
Commercial Road to Mile End Road S-N NBT 242 240 238 239 37.1 33.8 51.1 33.8 0.4 0.4 0.5 0.5 39.2 36.4 36.7 36.8 D D D D
Commercial Road to Commercial Road S-S NBU 0 2 2 2 37.1 33.8 51.1 33.8 0.4 0.4 0.5 0.5 0.0 57.0 56.9 55.0 A E E E
Commercial Road to Church Street S-E NBR 2 19 19 19 37.1 33.8 51.1 33.8 0.4 0.4 0.5 0.5 67.5 56.5 49.7 53.3 E E D D
Church Street to Mile End Road E-N WBR 493 416 410 417 231.5 231.5 234.6 235.7 181.6 220.2 206.3 222.3 417.0 553.8 488.6 524.8 F F F F
Church Street to Commercial Road E-S WBL 20 26 26 26 231.5 231.5 234.6 235.7 181.6 220.2 206.3 222.3 397.7 514.3 495.3 520.8 F F F F
Church Street to Church Street E-E WBU 0 0 0 0 231.5 231.5 234.6 235.7 181.6 220.2 206.3 222.3 0.0 0.0 0.0 0.0 A A A A
All 4257 4504 4497 4473 231.5 235.9 234.6 235.9 45.7 58.6 57.0 60.0 65.3 74.1 71.7 74.9 E E E E
503 Cascade's Approach Cascade's Approach to Cascade's Approach S-SW NBL 0 0 0 0 25.1 24.5 21.9 21.9 0.6 0.7 0.9 0.8 0.0 0.0 0.0 0.0 A A A A
Cascade's Approach to Marketway WB S-E NBR 23 23 23 23 25.1 24.5 21.9 21.9 0.6 0.7 0.9 0.8 14.5 16.5 20.4 18.3 B C C C
Cascade's Approach to Marketway EB S-W NBL 13 13 13 13 25.1 24.5 21.9 21.9 0.6 0.7 0.9 0.8 7.9 10.1 13.1 12.1 A B B B
Marketway WB to Cascade's Approach NE-SW WBT 135 152 151 150 227.2 228.0 230.3 228.8 10.8 12.8 18.7 15.5 5.7 11.2 11.4 11.5 A B B B
Marketway WB to Marketway WB NE-E WBL 43 41 41 41 227.2 228.0 230.3 228.8 10.8 12.8 18.7 15.5 14.0 15.2 15.4 15.6 B C C C
Marketway WB to Marketway EB NE-W WBT 1501 1653 1651 1640 227.2 228.0 230.3 228.8 10.8 12.8 18.7 15.5 13.6 15.5 16.0 15.4 B C C C
Marketway EB to Cascade's Approach SW-SW EBU 34 32 32 32 43.4 38.8 37.2 43.7 0.2 0.2 0.2 0.2 4.4 4.4 4.7 4.5 A A A A
Marketway EB to Hope Street SW-N EBL 951 1017 1022 1021 0.0 0.0 0.0 0.0 0.0 0.0 0.0 0.0 2.6 2.8 2.8 2.8 A A A A
Marketway WB to Marketway EB NE-W WBT 31 33 31 32 146.1 224.4 127.1 223.6 0.2 0.1 0.2 0.5 6.3 5.7 5.0 5.1 A A A A
Marketway EB to Marketway WB SW-E EBT 132 136 136 137 43.4 38.8 37.2 43.7 0.2 0.2 0.2 0.2 4.1 4.5 4.7 4.7 A A A A
Marketway EB to Marketway EB SW-W NBL 4 4 4 4 43.4 38.8 37.2 43.7 0.2 0.2 0.2 0.2 5.6 5.4 5.0 5.6 A A A A
All 2867 3103 3105 3091 227.2 228.0 230.3 228.8 3.2 3.7 5.4 4.6 9.0 10.4 10.7 10.4 A B B B
504 Marketway Roundabout Commercial Road NB to Commercial Road SB S-N NBT 6 6 6 6 38.7 50.4 38.4 49.6 3.0 3.5 3.0 3.2 48.6 53.5 43.8 50.4 E F E F
Commercial Road NB to Marketway S-W NBL 13 14 14 13 38.7 50.4 38.4 49.6 3.0 3.5 3.0 3.2 44.7 49.2 46.9 46.6 E E E E
Commercial Road NB to Cornmill street S-SE NBR 9 9 9 9 38.7 50.4 38.4 49.6 3.0 3.5 3.0 3.2 28.0 23.8 28.7 22.3 D C D C
Commercial Road SB to Commercial Road SB N-N SBU 52 51 51 50 225.5 228.7 228.8 231.3 8.5 16.0 20.3 16.5 15.9 21.9 23.8 22.4 C C C C
Commercial Road SB to Marketway N-W SBR 1564 1739 1744 1717 225.5 228.7 228.8 231.3 8.5 16.0 20.3 16.5 17.4 25.1 26.7 25.3 C D D D
Commercial Road SB to Cornmill street N-SE SBT 270 299 301 296 225.5 228.7 228.8 231.3 8.5 16.0 20.3 16.5 11.5 14.0 15.7 14.7 B B C B
Marketway to Commercial Road SB W-N EBL 65 67 67 67 102.6 65.0 88.7 80.4 0.9 0.9 1.3 1.3 9.0 9.2 9.0 9.4 A A A A
Marketway to Marketway W-W EBU 2 2 2 2 102.6 65.0 88.7 80.4 0.9 0.9 1.3 1.3 7.2 21.8 18.0 17.6 A C C C
Marketway to Cornmill street W-SE EBT 91 96 97 96 102.6 65.0 88.7 80.4 0.9 0.9 1.3 1.3 12.7 12.7 13.9 13.4 B B B B
Cornmill street to Commercial Road NB E-SW WBT 4 14 13 13 159.2 168.1 160.1 155.7 5.4 19.0 19.3 14.7 2.2 5.4 5.8 4.7 A A A A
Cornmill street to Commercial Road SB E-N WBR 201 211 206 209 173.4 182.3 174.3 169.9 9.0 25.9 25.8 21.0 17.9 34.6 34.1 30.6 C D D D
Cornmill street to Marketway E-W WBT 178 180 171 176 173.4 182.3 174.3 169.9 9.0 25.9 25.8 21.0 17.1 31.3 31.3 29.2 C D D D
Cornmill street to Cornmill street E-SE WBL 0 0 0 0 173.4 182.3 174.3 169.9 9.0 25.9 25.8 21.0 0.0 0.0 0.0 0.0 A A A A
All 2455 2687 2681 2656 225.5 228.7 228.8 231.3 5.4 12.1 13.1 10.8 16.6 24.2 25.4 23.9 C C D C
505 A2030 roundabout Lake Road NB to Lake Road NB SW-W NBL 0 0 0 0 81.5 86.1 92.7 85.5 3.0 13.4 14.6 8.1 0.0 0.0 0.0 0.0 A A A A
Lake Road NB to Cornmill street SW-NW EBL 89 91 88 91 81.5 86.1 92.7 85.5 3.0 13.4 14.6 8.1 29.7 99.3 96.3 63.8 D F F F
Lake Road NB to Lake Road SB SW-E EBT 90 87 84 88 81.5 86.1 92.7 85.5 3.0 13.4 14.6 8.1 13.1 50.7 45.3 26.1 B F E D
Cornmill street to Lake Road NB NW-W SBR 82 86 85 85 82.6 81.5 82.1 82.6 1.8 1.4 1.4 1.5 7.6 10.7 12.1 10.7 A B B B
Cornmill street to Cornmill street NW-NW SBU 1 3 3 3 82.6 81.5 82.1 82.6 1.8 1.4 1.4 1.5 32.3 31.4 43.6 23.9 D D E C
Cornmill street to Lake Road SB NW-E SBL 289 316 320 314 82.6 81.5 82.1 82.6 1.8 1.4 1.4 1.5 6.5 4.5 4.8 5.3 A A A A
Lake Road SB to Lake Road NB E-W WBT 50 51 50 51 231.5 231.5 231.5 231.5 15.3 52.7 53.7 32.8 28.6 83.8 86.2 53.3 D F F F
Lake Road SB to Cornmill street E-NW WBT 289 304 292 299 231.5 231.5 231.5 231.5 15.3 52.7 53.7 32.8 40.7 115.1 118.0 77.1 E F F F
Lake Road SB to Lake Road SB E-E WBU 0 0 0 0 231.5 231.5 231.5 231.5 15.3 52.7 53.7 32.8 0.0 0.0 0.0 0.0 A A A A
All 889 937 922 931 231.5 231.5 231.5 231.5 6.7 22.5 23.3 14.1 22.3 59.0 57.5 39.2 C F F E
506 Holbrook Road Roundabout Lake Road SB to Lake Road SB NE-E WBL 2 2 1 2 231.5 231.5 231.4 231.5 84.7 165.3 31.3 160.8 124.7 250.7 75.4 237.8 F F F F
Lake Road SB to Holbrook Road NE-S WBR 173 167 162 171 231.5 231.5 231.4 231.5 84.7 165.3 31.3 160.8 129.5 270.9 61.3 246.1 F F F F
Lake Road SB to Church Street NE-NW WBR 59 57 60 58 231.5 231.5 231.4 231.5 84.7 165.3 31.3 160.8 123.2 272.5 102.7 262.1 F F F F
Lake Road SB to Lake Road NB NE-W WBT 207 210 206 215 231.5 231.5 231.4 231.5 84.7 165.3 31.3 160.8 124.1 267.9 80.8 247.4 F F F F
Holbrook Road to Lake Road SB SE-E NBR 194 190 186 194 235.9 235.9 235.8 235.9 72.0 153.1 170.7 163.1 139.8 333.6 389.9 340.5 F F F F
Holbrook Road to Holbrook Road SE-S NBL 1 1 1 1 235.9 235.9 235.8 235.9 72.0 153.1 170.7 163.1 5.0 71.3 82.7 108.7 A F F F
Holbrook Road to Church Street SE-NW NBT 378 365 363 375 235.9 235.9 235.8 235.9 72.0 153.1 170.7 163.1 149.0 344.2 428.3 350.7 F F F F
Holbrook Road to Lake Road NB SE-W NBL 102 105 103 108 235.9 235.9 235.8 235.9 72.0 153.1 170.7 163.1 124.2 277.8 329.9 270.9 F F F F
Church Street to Lake Road SB NW-E SBL 79 88 89 88 230.9 234.6 225.4 228.8 17.1 41.0 11.7 35.5 53.7 69.1 41.3 61.6 F F E F
Church Street to Holbrook Road NW-S SBT 427 469 472 463 230.9 234.6 225.4 228.8 17.1 41.0 11.7 35.5 45.0 71.1 47.6 66.5 E F E F
Church Street to Church Street NW-NW SBU 1 1 1 1 230.9 234.6 225.4 228.8 17.1 41.0 11.7 35.5 14.5 18.5 94.8 40.7 B C F E
Church Street to Lake Road NB NW-W SBR 13 13 13 13 230.9 234.6 225.4 228.8 17.1 41.0 11.7 35.5 48.5 87.6 74.3 78.8 E F F F
Lake Road NB to Lake Road SB SW-E EBT 153 165 165 165 231.5 189.1 235.8 187.1 12.9 12.0 12.9 10.1 21.1 19.9 19.9 17.3 C C C C
Lake Road NB to Holbrook Road SW-S EBR 222 229 230 229 231.5 189.1 235.8 187.1 12.9 12.0 12.9 10.1 22.5 22.3 22.4 19.6 C C C C
Lake Road NB to Church Street SW-NW EBL 9 10 10 10 231.5 189.1 235.8 187.1 12.9 12.0 12.9 10.1 21.0 24.0 45.5 29.4 C C E D
Lake Road NB to Lake Road NB SW-W NBL 0 0 0 0 231.5 189.1 235.8 187.1 12.9 12.0 12.9 10.1 0.0 0.0 0.0 0.0 A A A A
All 2020 2072 2063 2090 235.9 235.9 235.8 235.9 46.7 92.8 56.6 92.4 91.0 186.0 159.8 182.8 F F F F
507 Unicorn Road Unicorn Road WB to Market Way NW-NE SBL 49 54 53 54 34.3 38.4 32.2 26.4 2.3 2.6 2.8 2.6 35.3 39.7 41.1 39.3 D D D D
Unicorn Road WB to Unicorn Road EB NW-S SBT 20 20 20 20 27.4 37.8 29.5 27.6 2.5 2.6 2.9 2.8 40.4 41.5 44.4 43.2 D D D D
Unicorn Road WB to Alfred Road NW-SW SBR 26 27 27 27 27.4 37.8 29.5 27.6 2.5 2.6 2.9 2.8 43.0 45.0 52.4 48.1 D D D D
Market Way to Unicorn Road WB NE-NW WBR 41 44 45 45 223.2 224.1 225.0 224.8 10.9 15.1 19.8 16.3 51.1 54.3 56.7 55.0 D D E D
Market Way to Unicorn Road EB NE-S WBU 346 376 373 372 223.2 224.1 225.0 224.8 10.9 15.1 19.8 16.3 9.7 10.4 12.1 11.4 A B B B
Market Way to Alfred Road NE-SW WBT 1192 1311 1314 1306 223.2 224.1 225.0 224.8 10.9 15.1 19.8 16.3 20.0 23.1 25.1 23.9 C C C C
Unicorn Road EB to Unicorn Road WB S-NW NBT 17 17 17 17 65.5 83.6 81.9 75.2 9.2 10.2 10.4 10.3 42.9 43.0 48.4 44.7 D D D D
Unicorn Road EB to Market Way S-NE NBR 125 129 129 129 65.5 83.6 81.9 75.2 9.2 10.2 10.4 10.3 42.5 45.7 46.9 46.9 D D D D
Unicorn Road EB to Alfred Road S-SW NBL 16 17 17 17 50.8 35.8 49.8 49.9 0.9 0.9 1.2 1.0 39.0 39.0 47.9 42.3 D D D D
Alfred Road to Unicorn Road WB SW-NW EBL 67 63 64 63 167.0 177.2 160.6 165.4 13.6 15.1 14.5 14.5 16.1 16.0 15.6 16.4 B B B B
Alfred Road to Market Way SW-NE EBT 942 999 1005 1003 167.0 177.2 160.6 165.4 13.6 15.1 14.5 14.5 15.9 16.5 16.0 15.8 B B B B
All 2841 3056 3063 3053 223.2 224.1 225.0 224.8 7.9 9.5 10.8 9.8 19.6 21.5 22.7 21.9 B C C C
508 Stanhope Road Stanhope Road to Stanhope Road S-S NBU 0 0 0 0 23.9 24.4 27.3 21.5 0.1 0.1 0.1 0.1 0.0 0.0 0.0 0.0 A A A A
Stanhope Road to Edinburgh Road WB S-SE NBR 0 0 0 0 23.9 24.4 27.3 21.5 0.1 0.1 0.1 0.1 0.0 0.0 0.0 0.0 A A A A
Stanhope Road to Unicorn road S-N NBT 130 135 135 135 23.9 24.4 27.3 21.5 0.1 0.1 0.1 0.1 4.4 4.6 4.6 4.5 A A A A
Stanhope Road to Edinburgh Road EB S-W NBL 8 8 8 8 23.9 24.4 27.3 21.5 0.1 0.1 0.1 0.1 16.8 15.8 17.2 15.4 C C C C
Edinburgh Road WB to Stanhope Road E-S WBL 15 16 15 15 72.7 40.9 69.0 78.1 0.5 0.6 0.6 0.6 11.8 10.7 10.2 12.5 B B B B
Edinburgh Road WB to Edinburgh Road WB E-SE WBL 0 0 0 0 72.7 40.9 69.0 78.1 0.5 0.6 0.6 0.6 0.0 0.0 0.0 0.0 A A A A
Edinburgh Road WB to Unicorn road E-N WBR 27 27 27 26 72.7 40.9 69.0 78.1 0.5 0.6 0.6 0.6 16.0 16.0 15.6 15.8 C C C C
Edinburgh Road WB to Edinburgh Road EB E-W WBT 58 58 58 58 72.7 40.9 69.0 78.1 0.5 0.6 0.6 0.6 18.3 18.6 18.8 18.3 C C C C
Unicorn road to Stanhope Road N-S SBT 320 348 347 346 27.2 43.4 52.6 41.3 0.1 0.1 0.1 0.1 1.4 1.4 1.4 1.4 A A A A
Unicorn road to Edinburgh Road WB N-SE SBT 22 23 22 23 27.2 43.4 52.6 41.3 0.1 0.1 0.1 0.1 1.7 1.8 1.4 1.7 A A A A
Unicorn road to Unicorn road N-N SBU 0 0 0 0 27.2 43.4 52.6 41.3 0.1 0.1 0.1 0.1 0.0 0.0 0.0 0.0 A A A A
Unicorn road to Edinburgh Road EB N-W SBR 24 24 24 23 27.2 43.4 52.6 41.3 0.1 0.1 0.1 0.1 1.5 1.5 1.6 1.4 A A A A
Edinburgh Road EB to Stanhope Road W-S EBR 8 8 8 8 42.7 44.9 44.5 40.6 0.2 0.2 0.1 0.1 12.7 12.4 12.3 12.4 B B B B
Edinburgh Road EB to Edinburgh Road WB W-SE EBT 28 28 28 28 42.7 44.9 44.5 40.6 0.2 0.2 0.1 0.1 13.4 13.6 13.4 13.6 B B B B
Edinburgh Road EB to Unicorn road W-N EBL 0 0 0 0 42.7 44.9 44.5 40.6 0.2 0.2 0.1 0.1 0.0 0.0 0.0 0.0 A A A A
Edinburgh Road EB to Edinburgh Road EB W-W EBU 0 0 0 0 42.7 44.9 44.5 40.6 0.2 0.2 0.1 0.1 0.0 0.0 0.0 0.0 A A A A
All 639 674 672 671 72.7 44.9 69.0 78.1 0.2 0.2 0.2 0.2 5.2 5.2 5.1 5.1 A A A A
509 Queen Street Queen St to Alfred Road W-NE EBL 236 245 245 245 57.9 69.6 69.6 69.6 7.1 7.4 7.3 7.3 23.2 22.9 22.8 22.9 C C C C
Queen St to Bishop Crispian Way W-E EBT 37 37 37 37 49.1 60.8 60.8 60.8 5.5 5.5 5.5 5.5 72.3 72.5 72.5 72.5 E E E E
Alfred Road to Queen St NE-W WBT 321 352 353 349 234.3 231.4 232.6 230.6 42.6 60.1 59.5 56.7 61.8 70.3 69.5 67.4 E E E E
Alfred Road to Anglesea Road NE-S WBR 933 1025 1028 1020 230.5 225.4 228.8 226.8 18.5 26.5 28.3 28.8 11.8 15.5 15.9 16.4 B B B B
Bishop Crispian Way to Queen St E-W WBT 90 92 91 91 102.0 99.3 88.5 93.3 11.0 10.1 10.3 10.2 59.7 56.4 57.7 56.4 E E E E
Anglesea Road to Queen St S-W NBL 37 39 39 39 75.9 72.5 82.8 76.9 0.5 0.6 0.6 0.7 12.8 13.0 13.3 13.8 B B B B
Anglesea Road to Alfred Road S-NE NBR 773 825 826 829 116.1 145.2 116.2 108.7 7.9 8.7 8.5 8.6 13.0 13.5 13.3 13.4 B B B B
All 2427 2614 2618 2609 234.3 231.4 232.6 230.6 13.3 17.0 17.2 16.8 22.7 25.2 25.3 25.1 C C C C
510 St Michael's Gyratory St Paul's Road to Wiltshire Street S-E NBR 0 0 0 0 17.3 17.5 17.5 17.6 0.1 0.1 0.1 0.1 0.0 0.0 0.0 0.0 A A A A
St Paul's Road to Waltham St S-S NBU 0 0 0 0 17.3 17.5 17.5 17.6 0.1 0.1 0.1 0.1 0.0 0.0 0.0 0.0 A A A A
St Paul's Road to Guildhall Walk S-NE NBT 0 0 0 0 17.3 17.5 17.5 17.6 0.1 0.1 0.1 0.1 0.0 0.0 0.0 0.0 A A A A
St Paul's Road to Cambridge Road S-SW NBL 0 0 0 0 17.3 17.5 17.5 17.6 0.1 0.1 0.1 0.1 0.0 0.0 0.0 0.0 A A A A
St Paul's Road to Hampshire Terrace S-S NBU 0 0 0 0 17.3 17.5 17.5 17.6 0.1 0.1 0.1 0.1 0.0 0.0 0.0 0.0 A A A A
St Paul's Road to Winston churchill avenue S-E NBR 0 0 0 0 17.3 17.5 17.5 17.6 0.1 0.1 0.1 0.1 0.0 0.0 0.0 0.0 A A A A
St Paul's Road to Anglesea Road S-N NBT 44 44 44 44 17.3 17.5 17.5 17.6 0.1 0.1 0.1 0.1 8.2 11.2 10.3 10.5 A B B B
Cambridge Road to Wiltshire Street SW-E EBT 7 7 8 7 96.8 157.8 157.8 157.8 1.2 2.2 2.2 2.2 22.3 40.1 43.1 43.0 C D D D
Cambridge Road to Waltham St SW-S EBR 0 0 0 0 96.8 157.8 157.8 157.8 1.2 2.2 2.2 2.2 0.0 0.0 0.0 0.0 A A A A
Cambridge Road to Guildhall Walk SW-NE EBT 23 22 22 22 96.8 157.8 157.8 157.8 1.2 2.2 2.2 2.2 23.5 45.9 48.3 46.2 C D D D
Cambridge Road to Cambridge Road SW-SW EBU 0 0 0 0 96.8 157.8 157.8 157.8 1.2 2.2 2.2 2.2 0.0 0.0 0.0 0.0 A A A A
Cambridge Road to Hampshire Terrace SW-S EBR 8 7 7 8 96.8 157.8 157.8 157.8 1.2 2.2 2.2 2.2 24.2 39.5 38.5 42.2 C D D D
Cambridge Road to Winston churchill avenue SW-E EBT 122 123 123 123 96.8 157.8 157.8 157.8 1.2 2.2 2.2 2.2 22.7 44.5 45.1 44.8 C D D D
Cambridge Road to Anglesea Road SW-N EBL 252 268 267 267 96.8 157.8 157.8 157.8 1.2 2.2 2.2 2.2 10.1 10.3 10.4 10.1 B B B B
Hampshire Terrace to Wiltshire Street S-E NBR 3 3 4 4 225.2 235.9 235.8 235.9 12.4 54.1 53.5 59.4 29.2 63.6 71.1 89.8 D F F F
Hampshire Terrace to Waltham St S-S NBU 1 1 1 1 225.2 235.9 235.8 235.9 12.4 54.1 53.5 59.4 20.0 29.5 27.6 26.2 C D D D
Hampshire Terrace to Guildhall Walk S-NE NBT 25 28 28 29 225.2 235.9 235.8 235.9 12.4 54.1 53.5 59.4 33.5 111.1 110.3 123.0 D F F F
Hampshire Terrace to Cambridge Road S-SW NBL 11 10 10 10 225.2 235.9 235.8 235.9 12.4 54.1 53.5 59.4 17.6 62.1 59.5 73.5 C F F F
Hampshire Terrace to Hampshire Terrace S-S NBU 4 3 4 4 225.2 235.9 235.8 235.9 12.4 54.1 53.5 59.4 27.9 106.1 98.9 101.0 D F F F
Hampshire Terrace to Winston churchill avenue S-E NBR 73 73 73 75 225.2 235.9 235.8 235.9 12.4 54.1 53.5 59.4 38.4 135.7 138.2 150.9 E F F F
Hampshire Terrace to Anglesea Road S-N NBT 342 373 372 376 225.2 235.9 235.8 235.9 12.4 54.1 53.5 59.4 24.3 95.0 94.4 108.3 C F F F
Winston churchill avenue to Wiltshire Street E-E WBU 7 8 8 8 62.9 47.9 49.8 54.0 6.7 6.3 6.1 6.3 24.7 22.6 23.5 20.8 C C C C
Winston churchill avenue to Waltham St E-S WBL 16 16 16 16 62.9 47.9 49.8 54.0 6.7 6.3 6.1 6.3 16.2 15.8 15.9 14.0 B B B B
Winston churchill avenue to Guildhall Walk E-NE WBR 21 19 20 20 62.9 47.9 49.8 54.0 6.7 6.3 6.1 6.3 41.5 65.1 68.0 64.9 D E E E
Winston churchill avenue to Cambridge Road E-SW WBT 148 148 148 148 62.9 47.9 49.8 54.0 6.7 6.3 6.1 6.3 31.3 33.6 33.4 33.9 C C C C
Winston churchill avenue to Hampshire Terrace E-S WBL 102 100 100 101 62.9 47.9 49.8 54.0 6.7 6.3 6.1 6.3 23.0 23.0 22.0 22.8 C C C C
Winston churchill avenue to Winston churchill avenue E-E WBU 14 13 14 13 62.9 47.9 49.8 54.0 6.7 6.3 6.1 6.3 42.4 69.1 70.1 70.0 D E E E
Winston churchill avenue to Anglesea Road E-N WBR 84 85 86 85 62.9 47.9 49.8 54.0 6.7 6.3 6.1 6.3 30.7 33.6 33.2 32.9 C C C C
Anglesea Road to Wiltshire Street N-E SBL 43 46 46 46 79.4 72.2 132.7 76.6 0.9 5.1 5.4 5.3 18.7 22.6 22.1 22.0 C C C C
Anglesea Road to Waltham St N-S SBT 0 0 0 0 79.4 72.2 132.7 76.6 0.9 5.1 5.4 5.3 0.0 0.0 0.0 0.0 A A A A
Anglesea Road to Guildhall Walk N-NE SBL 80 87 90 88 79.4 72.2 132.7 76.6 0.9 5.1 5.4 5.3 13.5 18.0 18.7 18.6 B B B B
Anglesea Road to Cambridge Road N-SW SBR 155 167 168 164 79.4 72.2 132.7 76.6 0.9 5.1 5.4 5.3 22.7 29.5 29.8 30.1 C C C C
Anglesea Road to Hampshire Terrace N-S SBT 343 368 367 364 79.4 72.2 132.7 76.6 0.9 5.1 5.4 5.3 18.3 22.7 22.6 23.5 C C C C
Anglesea Road to Winston churchill avenue N-E SBL 130 151 154 150 79.4 72.2 132.7 76.6 0.9 5.1 5.4 5.3 11.6 17.0 17.9 17.9 B B B B
Anglesea Road to Anglesea Road N-N SBU 49 53 54 53 79.4 72.2 132.7 76.6 0.9 5.1 5.4 5.3 24.8 31.5 32.2 32.2 C C C C
All 2104 2225 2231 2223 225.2 235.9 235.8 235.9 4.3 13.6 13.5 14.7 21.3 42.0 42.0 45.6 C D D D
511 Park Road Park Road to Anglesea Road W-N EBL 129 133 133 133 73.8 60.8 60.8 60.8 7.1 7.3 7.3 7.3 34.6 34.6 34.6 34.6 C C C C
Anglesea Road SB to Park Road N-W SBR 152 170 171 166 230.8 231.5 231.5 235.9 16.4 20.2 20.4 20.5 54.8 59.1 59.0 59.5 D E E E
Anglesea Road SB to Anglesea Road SB N-S SBT 800 872 874 863 230.8 231.5 231.5 235.9 16.4 20.2 20.4 20.5 9.9 11.2 11.7 12.4 A B B B
Anglesea Road to Park Road S-W NBL 54 54 54 54 86.9 67.8 80.6 81.5 5.2 5.2 5.1 5.3 10.3 8.7 8.5 8.5 B A A A
Anglesea Road to Anglesea Road S-N NBT 677 723 722 727 86.9 67.8 80.6 81.5 5.2 5.2 5.1 5.3 8.8 8.1 8.0 8.2 A A A A
All 1811 1952 1954 1943 230.8 231.5 231.5 235.9 10.0 11.6 11.6 11.8 15.1 15.9 16.1 16.4 B B B B
512 Princess Royal Road Princess Royal Road to Mile end Road NB W-N EBL 132 133 133 133 51.0 63.5 51.1 61.6 4.2 3.7 3.7 3.8 20.9 19.8 19.7 20.4 C B B C
Mile end Road SB to Princess Royal Road NE-W WBT 215 220 220 218 41.1 47.8 44.0 43.3 4.1 3.9 4.1 4.0 20.5 20.5 23.4 22.2 C C C C
Mile end Road NB to Princess Royal Road S-W NBL 137 132 130 133 42.4 47.7 37.6 47.2 0.8 0.8 0.7 0.7 6.7 6.5 6.3 6.5 A A A A
Mile end Road NB to Mile end Road NB S-N NBT 1702 1678 1672 1676 160.7 120.9 115.7 122.5 6.2 5.7 5.9 6.1 7.4 7.1 7.3 7.3 A A A A
All 2186 2162 2156 2161 160.7 120.9 115.7 122.5 3.8 3.6 3.6 3.7 9.4 9.3 9.6 9.6 A A A A
0 Network Total All 30378 32166 32141 32071 235.9 235.9 235.8 235.9 11.9 22.9 19.4 22.4 26.3 40.2 38.4 39.7 D D D D
103599 107108 107291 107205 235.9 236.0 235.9 236.0 13.8 24.2 21.5 24.1 26.0 38.1 36.8 37.6 D D D D
09
:00
-10
:00
Overall Total
05/01/2015 13:55 Node Evaluation Comparison.xlsm

0
50
100
150
200
250
300
350
400
450
Winston ChurchillAvenue
Anglesea Road Queen Street (NB) Cascade's Approach Marketway Roundabout Mile End Roundabout Princess Royal Road
Av
era
ge T
rav
el T
ime (
sec)
Location
0700-0800 Northbound Travel Time Comparison
Base
DM
DS1
DS2

0
50
100
150
200
250
300
350
400
450
Winston ChurchillAvenue
Anglesea Road Queen Street (NB) Cascade's Approach Marketway Roundabout Mile End Roundabout Princess Royal Road
Av
era
ge T
rav
el T
ime (
sec)
Location
0800-0900 Northbound Travel Time Comparison
Base
DM
DS1
DS2

0
50
100
150
200
250
300
350
400
450
Winston ChurchillAvenue
Anglesea Road Queen Street (NB) Cascade's Approach Marketway Roundabout Mile End Roundabout Princess Royal Road
Av
era
ge T
rav
el T
ime (
sec)
Location
0900-1000 Northbound Travel Time Comparison
Base
DM
DS1
DS2

0
50
100
150
200
250
300
350
400
450
Rudmore Roundabout Princess Royal Road Mile End Roundabout Marketway Roundabout Cascade's Approach Queen Street(SB) Anglesea Road
Av
era
ge T
rav
el T
ime (
sec)
Location
0700-0800 Southbound Travel Time Comparison
Base
DM
DS1
DS2

0
50
100
150
200
250
300
350
400
450
Rudmore Roundabout Princess Royal Road Mile End Roundabout Marketway Roundabout Cascade's Approach Queen Street(SB) Anglesea Road
Av
era
ge T
rav
el T
ime (
sec)
Location
0800-0900 Southbound Travel Time Comparison
Base
DM
DS1
DS2

0
50
100
150
200
250
300
350
400
450
Rudmore Roundabout Princess Royal Road Mile End Roundabout Marketway Roundabout Cascade's Approach Queen Street(SB) Anglesea Road
Av
era
ge T
rav
el T
ime (
sec)
Location
0900-1000 Southbound Travel Time Comparison
Base
DM
DS1
DS2

57
Portsmouth Corridor 1 Air Quality Management Area VISSIM Model Assessment
G. 2013 PM Peak Comparison Results

Portsmouth AQMA - Corridor 1 - 2013 PM Peak Comparison
Time Node Description Direction Movement Base DM DS1 DS2 Base DM DS1 DS2 Base DM DS1 DS2 Base DM DS1 DS2 Base DM DS1 DS2
501 Rudmore Roundabout M275 SB to M275 SB NW-S SBT 1957 1944 1955 1952 235.8 235.8 234.6 228.6 1.0 3.1 1.4 0.8 2.1 4.8 2.6 1.9 A A A A
M275 NB to M275 NB S-NW NBT 3220 3167 3170 3167 0.0 0.0 0.0 0.0 0.0 0.0 0.0 0.0 2.6 2.0 2.1 2.0 A A A A
A2047 Kingston Cresent to Wharf Road E-W WBT 2 2 2 2 77.1 77.4 77.1 80.2 8.4 1.9 2.0 2.1 4.9 8.2 7.9 8.1 A A A A
A2047 Kingston Cresent to M275 SB Service Road E-S WBL 65 66 66 66 77.1 77.4 77.1 80.2 8.4 1.9 2.0 2.1 2.8 4.1 4.1 4.1 A A A A
A2047 Kingston Cresent to A2047 Kingston Cresent E-SE WBL 0 0 0 0 77.1 77.4 77.1 80.2 8.4 1.9 2.0 2.1 0.0 0.0 0.0 0.0 A A A A
A2047 Kingston Cresent to A3 Twyford Avenue E-NE WBU 138 137 137 137 77.1 77.4 77.1 80.2 8.4 1.9 2.0 2.1 17.0 23.5 23.4 23.3 C C C C
A2047 Kingston Cresent to M275 NB Service Road E-NW WBR 451 453 453 453 77.1 77.4 77.1 80.2 8.4 1.9 2.0 2.1 15.0 21.4 21.4 21.7 C C C C
M275 SB Service Road to Wharf Road NW-W SBR 110 111 111 111 235.7 113.9 109.3 108.4 112.0 16.4 16.1 16.1 70.8 20.9 21.0 20.9 F C C C
M275 SB Service Road to A3 Twyford Avenue NW-NE SBL 235 242 242 242 235.7 113.9 109.3 108.4 112.0 16.4 16.1 16.1 157.5 22.2 21.8 21.9 F C C C
M275 SB Service Road to M275 NB Service Road NW-NW SBU 30 31 31 31 235.7 113.9 109.3 108.4 112.0 16.4 16.1 16.1 76.4 27.7 27.6 27.7 F D D D
M275 SB Service Road to A2047 Kingston Cresent NW-SE SBL 399 397 397 397 235.7 113.9 109.3 108.4 112.0 16.4 16.1 16.1 95.8 22.5 22.1 22.2 F C C C
M275 SB Service Road to M275 SB Service Road NW-S SBT 41 41 41 41 235.7 113.9 109.3 108.4 112.0 16.4 16.1 16.1 78.6 21.1 21.0 20.7 F C C C
A3 Twyford Avenue to Wharf Road NE-W WBT 15 15 15 15 213.9 129.3 129.3 129.3 3.5 10.5 10.5 10.3 17.9 41.4 41.1 40.3 C E E E
A3 Twyford Avenue to A3 Twyford Avenue NE-NE WBU 9 9 9 9 213.9 129.3 129.3 129.3 3.5 10.5 10.5 10.3 24.5 50.5 51.8 50.0 C F F E
A3 Twyford Avenue to M275 NB Service Road NE-NW WBR 122 123 123 123 213.9 129.3 129.3 129.3 3.5 10.5 10.5 10.3 20.5 45.8 45.8 45.5 C E E E
A3 Twyford Avenue to A2047 Kingston Cresent NE-SE WBR2 131 130 130 130 213.9 129.3 129.3 129.3 3.5 10.5 10.5 10.3 12.9 33.4 33.3 32.3 B D D D
A3 Twyford Avenue to M275 SB Service Road NE-S WBL 368 370 370 370 213.9 129.3 129.3 129.3 3.5 10.5 10.5 10.3 20.3 33.4 33.4 33.0 C D D D
Wharf Road to Wharf Road W-W EBU 0 0 0 0 122.8 159.3 159.3 157.3 4.8 2.4 2.4 2.1 5.6 10.0 10.0 0.0 A B B A
Wharf Road to A3 Twyford Avenue W-NE EBT 43 42 42 43 122.8 159.3 159.3 157.3 4.8 2.4 2.4 2.1 45.8 87.8 87.8 89.6 E F F F
Wharf Road to M275 NB Service Road W-NW EBL 334 334 334 334 122.8 159.3 159.3 157.3 4.8 2.4 2.4 2.1 31.9 31.5 31.5 31.2 D D D D
Wharf Road to A2047 Kingston Cresent W-SE EBR 52 52 52 52 122.8 159.3 159.3 157.3 4.8 2.4 2.4 2.1 54.6 114.7 114.9 116.6 F F F F
Wharf Road to M275 SB Service Road W-S EBR2 104 105 105 105 122.8 159.3 159.3 157.3 4.8 2.4 2.4 2.1 48.1 115.4 115.5 114.2 E F F F
M275 NB Service Road to Wharf Road S-W NBL 80 77 78 78 148.6 147.3 143.6 117.8 5.2 2.7 3.2 2.3 3.4 21.9 23.0 21.1 A C C C
M275 NB Service Road to A3 Twyford Avenue S-NE NBR2 499 496 495 493 148.6 147.3 143.6 117.8 5.2 2.7 3.2 2.3 34.7 35.0 35.1 33.8 D D E D
M275 NB Service Road to M275 BB Service Road S-NW NBT 89 88 88 87 148.6 147.3 143.6 117.8 5.2 2.7 3.2 2.3 10.0 23.8 25.3 23.8 A C D C
M275 NB Service Road to A2047 Kingston Cresent S-SE NBR 136 134 134 133 148.6 147.3 143.6 117.8 5.2 2.7 3.2 2.3 17.9 52.8 52.7 50.7 C F F F
M275 NB Service Road to M275 SB Service Road S-S NBU 4 4 4 4 148.6 147.3 143.6 117.8 5.2 2.7 3.2 2.3 28.0 44.1 46.9 45.8 D E E E
All 8632 8569 8584 8575 235.8 235.8 234.6 228.6 24.8 6.4 6.4 6.1 18.9 15.3 14.8 14.5 C C B B
502 Mile End Roundabout Mile End Road to Mile End Road N-N SBU 66 66 66 66 236.0 236.0 235.9 231.3 16.8 21.6 16.0 19.0 63.7 63.5 60.7 62.8 E E E E
Mile End Road to Commercial Road N-S SBT 1770 1761 1774 1768 236.0 236.0 235.9 231.3 16.8 21.6 16.0 19.0 20.7 26.3 19.4 22.3 C C B C
Mile End Road to Church Street N-E SBL 599 598 602 601 236.0 236.0 235.9 231.3 16.8 21.6 16.0 19.0 21.4 21.4 16.4 16.6 C C B B
Hope Street to Mile End Road SW-N NBT 1979 1980 1979 1974 231.4 231.5 231.2 231.5 96.5 92.6 97.2 91.1 29.9 28.8 30.0 28.4 C C C C
Hope Street to Mile End Road SW-N NBT 0 0 0 0 25.0 26.7 30.2 30.1 0.8 1.0 0.9 1.0 0.0 0.0 0.0 0.0 A A A A
Hope Street to Commercial Road SW-S NBU 20 19 20 20 25.0 26.7 30.2 30.1 0.8 1.0 0.9 1.0 173.3 177.9 180.7 166.2 F F F F
Hope Street to Church Street SW-E NBR 53 54 54 53 25.0 26.7 30.2 30.1 0.8 1.0 0.9 1.0 102.0 82.9 83.3 83.3 F F F F
Commercial Road to Mile End Road S-N NBT 505 505 507 505 71.8 52.1 50.3 53.3 3.3 2.9 3.1 2.9 41.6 42.7 43.1 42.1 D D D D
Commercial Road to Commercial Road S-S NBU 3 3 3 4 71.8 52.1 50.3 53.3 3.3 2.9 3.1 2.9 66.7 73.2 64.7 66.2 E E E E
Commercial Road to Church Street S-E NBR 13 14 14 13 71.8 52.1 50.3 53.3 3.3 2.9 3.1 2.9 79.0 56.1 52.7 52.8 E E D D
Church Street to Mile End Road E-N WBR 499 443 443 445 225.5 231.5 231.5 231.5 61.0 171.8 171.2 172.0 101.9 240.9 239.3 226.7 F F F F
Church Street to Commercial Road E-S WBL 12 9 10 10 225.5 231.5 231.5 231.5 61.0 171.8 171.2 172.0 95.5 238.4 258.7 241.9 F F F F
Church Street to Church Street E-E WBU 0 0 0 0 225.5 231.5 231.5 231.5 61.0 171.8 171.2 172.0 0.0 0.0 0.0 0.0 A A A A
All 5520 5452 5469 5459 236.0 236.0 235.9 231.5 26.3 52.7 51.6 52.0 35.4 47.5 45.1 44.4 D D D D
503 Cascade's Approach Cascade's Approach to Cascade's Approach S-SW NBL 0 0 0 0 43.0 46.2 42.9 43.0 2.0 2.0 2.0 2.0 0.0 0.0 0.0 0.0 A A A A
Cascade's Approach to Marketway WB S-E NBR 100 101 101 101 43.0 46.2 42.9 43.0 2.0 2.0 2.0 2.0 13.0 13.1 12.6 13.0 B B B B
Cascade's Approach to Marketway EB S-W NBL 45 45 46 45 43.0 46.2 42.9 43.0 2.0 2.0 2.0 2.0 11.1 11.0 12.2 10.8 B B B B
Marketway WB to Cascade's Approach NE-SW WBT 48 48 48 47 224.5 223.7 224.8 224.5 6.5 5.0 5.5 5.6 4.9 8.6 9.7 10.2 A A A B
Marketway WB to Marketway WB NE-E WBL 44 45 45 45 224.5 223.7 224.8 224.5 6.5 5.0 5.5 5.6 13.0 12.1 13.8 14.2 B B B B
Marketway WB to Marketway EB NE-W WBT 1451 1445 1458 1454 224.5 223.7 224.8 224.5 6.5 5.0 5.5 5.6 12.0 11.5 12.6 13.0 B B B B
Marketway EB to Cascade's Approach SW-SW EBU 36 36 36 36 29.3 56.3 218.1 67.5 0.3 0.3 0.4 0.3 6.8 6.3 6.2 6.3 A A A A
Marketway EB to Hope Street SW-N EBL 1927 1930 1927 1930 0.0 194.8 88.8 12.0 0.0 0.3 0.1 0.0 5.2 5.2 5.1 5.4 A A A A
Marketway WB to Marketway EB NE-W WBT 33 34 34 34 76.4 33.7 81.7 105.4 0.0 0.0 0.0 0.1 6.0 5.2 5.8 6.4 A A A A
Marketway EB to Marketway WB SW-E EBT 196 194 195 195 29.3 56.3 218.1 67.5 0.3 0.3 0.4 0.3 7.4 7.4 7.5 7.7 A A A A
Marketway EB to Marketway EB SW-W NBL 18 15 15 15 29.3 56.3 218.1 67.5 0.3 0.3 0.4 0.3 7.4 8.2 7.6 7.8 A A A A
All 3897 3892 3904 3901 224.5 223.7 224.8 224.5 2.4 2.0 2.1 2.2 8.2 8.1 8.5 8.8 A A A A
504 Marketway Roundabout Commercial Road NB to Commercial Road SB S-N NBT 6 6 6 6 51.5 44.5 50.7 44.4 2.7 2.7 2.7 2.7 43.6 44.8 45.3 42.6 E E E E
Commercial Road NB to Marketway S-W NBL 17 17 17 17 51.5 44.5 50.7 44.4 2.7 2.7 2.7 2.7 36.2 36.0 36.6 36.0 E E E E
Commercial Road NB to Cornmill street S-SE NBR 6 6 6 6 51.5 44.5 50.7 44.4 2.7 2.7 2.7 2.7 30.9 36.3 31.1 31.2 D E D D
Commercial Road SB to Commercial Road SB N-N SBU 22 22 22 22 235.5 228.7 225.2 235.8 23.5 23.3 14.6 16.8 21.5 22.3 21.1 20.9 C C C C
Commercial Road SB to Marketway N-W SBR 1372 1362 1371 1369 235.5 228.7 225.2 235.8 23.5 23.3 14.6 16.8 24.7 26.4 22.0 24.0 C D C C
Commercial Road SB to Cornmill street N-SE SBT 394 390 394 393 235.5 228.7 225.2 235.8 23.5 23.3 14.6 16.8 35.4 32.8 23.2 24.3 E D C C
Marketway to Commercial Road SB W-N EBL 191 191 190 189 90.3 90.5 76.8 68.9 1.3 1.2 1.2 1.1 10.9 10.5 11.3 11.4 B B B B
Marketway to Marketway W-W EBU 2 2 2 2 90.3 90.5 76.8 68.9 1.3 1.2 1.2 1.1 12.7 13.1 17.0 15.6 B B C C
Marketway to Cornmill street W-SE EBT 114 112 113 112 90.3 90.5 76.8 68.9 1.3 1.2 1.2 1.1 18.3 20.2 18.4 18.1 C C C C
Cornmill street to Commercial Road NB E-SW WBT 3 3 3 3 109.8 89.5 84.3 92.2 1.8 2.0 1.8 2.4 3.3 0.4 5.3 3.3 A A A A
Cornmill street to Commercial Road SB E-N WBR 299 299 302 301 124.0 103.7 98.5 106.4 5.2 5.8 5.7 6.5 12.7 14.3 14.4 15.1 B B B C
Cornmill street to Marketway E-W WBT 184 184 187 185 124.0 103.7 98.5 106.4 5.2 5.8 5.7 6.5 12.2 13.9 14.8 15.7 B B B C
Cornmill street to Cornmill street E-SE WBL 0 0 0 0 124.0 103.7 98.5 106.4 5.2 5.8 5.7 6.5 0.0 0.0 0.0 0.0 A A A A
All 2610 2594 2613 2606 235.5 228.7 225.2 235.8 7.7 7.7 5.7 6.4 22.9 23.7 20.0 21.4 C C C C
505 A2030 roundabout Lake Road NB to Lake Road NB SW-W NBL 0 0 0 0 80.9 80.4 58.7 80.5 0.4 0.4 0.3 0.7 0.0 0.0 0.0 0.0 A A A A
Lake Road NB to Cornmill street SW-NW EBL 185 186 187 187 80.9 80.4 58.7 80.5 0.4 0.4 0.3 0.7 3.8 3.9 4.2 5.5 A A A A
Lake Road NB to Lake Road SB SW-E EBT 103 104 104 104 80.9 80.4 58.7 80.5 0.4 0.4 0.3 0.7 8.4 9.4 8.1 9.0 A A A A
Cornmill street to Lake Road NB NW-W SBR 57 56 57 57 92.5 97.4 87.5 83.3 6.4 9.2 5.9 5.0 25.5 26.6 20.7 22.0 D D C C
Cornmill street to Cornmill street NW-NW SBU 3 3 3 3 92.5 97.4 87.5 83.3 6.4 9.2 5.9 5.0 41.7 51.7 15.3 50.2 E F C F
Cornmill street to Lake Road SB NW-E SBL 450 446 450 449 92.5 97.4 87.5 83.3 6.4 9.2 5.9 5.0 25.9 28.4 21.5 23.0 D D C C
Lake Road SB to Lake Road NB E-W WBT 27 27 27 27 200.2 162.8 66.3 49.2 1.8 1.5 1.5 1.4 5.8 6.3 6.6 6.0 A A A A
Lake Road SB to Cornmill street E-NW WBT 302 301 305 303 200.2 162.8 66.3 49.2 1.8 1.5 1.5 1.4 7.7 7.8 7.8 8.2 A A A A
Lake Road SB to Lake Road SB E-E WBU 0 0 0 0 200.2 162.8 66.3 49.2 1.8 1.5 1.5 1.4 0.0 0.0 0.0 0.0 A A A A
All 1128 1123 1133 1130 200.2 162.8 87.5 83.3 2.9 3.7 2.6 2.4 15.4 16.6 13.4 14.5 C C B B
506 Holbrook Road Roundabout Lake Road SB to Lake Road SB NE-E WBL 0 0 0 0 161.1 189.1 153.9 179.8 20.0 18.8 1.0 17.4 0.0 0.0 0.0 0.0 A A A A
Lake Road SB to Holbrook Road NE-S WBR 160 160 160 160 161.1 189.1 153.9 179.8 20.0 18.8 1.0 17.4 32.1 31.0 15.2 30.0 D D C D
Lake Road SB to Church Street NE-NW WBR 72 72 72 72 161.1 189.1 153.9 179.8 20.0 18.8 1.0 17.4 34.4 33.7 23.6 32.3 D D C D
Lake Road SB to Lake Road NB NE-W WBT 178 178 179 179 161.1 189.1 153.9 179.8 20.0 18.8 1.0 17.4 35.0 35.5 21.9 34.0 D E C D
Holbrook Road to Lake Road SB SE-E NBR 339 337 337 338 226.5 228.6 231.5 231.3 14.6 23.2 27.0 23.1 21.1 27.9 30.3 27.9 C D D D
Holbrook Road to Holbrook Road SE-S NBL 0 0 0 0 226.5 228.6 231.5 231.3 14.6 23.2 27.0 23.1 0.0 0.0 0.0 0.0 A A A A
Holbrook Road to Church Street SE-NW NBT 403 400 399 400 226.5 228.6 231.5 231.3 14.6 23.2 27.0 23.1 20.4 27.3 33.2 27.7 C D D D
Holbrook Road to Lake Road NB SE-W NBL 140 139 139 139 226.5 228.6 231.5 231.3 14.6 23.2 27.0 23.1 6.6 9.4 9.5 9.2 A A A A
Church Street to Lake Road SB NW-E SBL 64 61 63 61 225.4 201.0 81.8 225.5 34.5 24.2 1.6 25.9 50.8 53.1 25.5 47.6 F F D E
Church Street to Holbrook Road NW-S SBT 401 380 384 380 225.4 201.0 81.8 225.5 34.5 24.2 1.6 25.9 48.6 51.3 38.4 48.2 E F E E
Church Street to Church Street NW-NW SBU 0 0 0 0 225.4 201.0 81.8 225.5 34.5 24.2 1.6 25.9 0.0 0.0 0.0 0.0 A A A A
Church Street to Lake Road NB NW-W SBR 14 13 13 13 225.4 201.0 81.8 225.5 34.5 24.2 1.6 25.9 56.0 41.9 52.4 55.3 F E F F
Lake Road NB to Lake Road SB SW-E EBT 239 237 239 238 235.9 231.5 231.5 231.5 115.0 114.9 105.8 109.5 99.3 98.0 90.6 93.5 F F F F
Lake Road NB to Holbrook Road SW-S EBR 298 297 299 298 235.9 231.5 231.5 231.5 115.0 114.9 105.8 109.5 99.1 100.4 92.0 95.7 F F F F
Lake Road NB to Church Street SW-NW EBL 11 11 11 11 235.9 231.5 231.5 231.5 115.0 114.9 105.8 109.5 84.6 89.0 82.9 79.0 F F F F
Lake Road NB to Lake Road NB SW-W NBL 0 0 0 0 235.9 231.5 231.5 231.5 115.0 114.9 105.8 109.5 0.0 0.0 0.0 0.0 A A A A
All 2318 2285 2297 2288 235.9 231.5 231.5 231.5 46.0 45.3 33.9 44.0 46.6 49.3 43.5 47.5 E E E E
507 Unicorn Road Unicorn Road WB to Market Way NW-NE SBL 294 294 294 294 74.7 83.0 79.3 95.8 13.1 13.2 13.2 13.1 42.6 44.1 44.0 43.7 D D D D
Unicorn Road WB to Unicorn Road EB NW-S SBT 113 113 112 112 75.9 84.3 80.6 97.1 12.6 12.8 12.9 12.7 41.6 41.3 41.6 40.9 D D D D
Unicorn Road WB to Alfred Road NW-SW SBR 99 98 98 98 75.9 84.3 80.6 97.1 12.6 12.8 12.9 12.7 41.4 42.2 41.0 41.4 D D D D
Market Way to Unicorn Road WB NE-NW WBR 27 27 28 27 219.5 194.4 215.7 220.1 11.1 9.1 9.8 10.5 52.2 54.5 53.6 57.9 D D D E
Market Way to Unicorn Road EB NE-S WBU 262 274 276 275 219.5 194.4 215.7 220.1 11.1 9.1 9.8 10.5 16.0 14.7 15.2 15.9 B B B B
Market Way to Alfred Road NE-SW WBT 1250 1227 1242 1239 219.5 194.4 215.7 220.1 11.1 9.1 9.8 10.5 21.0 19.7 19.4 20.4 C B B C
Unicorn Road EB to Unicorn Road WB S-NW NBT 13 13 14 14 86.6 87.4 94.0 100.6 14.4 14.6 14.9 15.0 42.7 43.7 41.8 42.3 D D D D
Unicorn Road EB to Market Way S-NE NBR 183 183 184 183 86.6 87.4 94.0 100.6 14.4 14.6 14.9 15.0 47.5 48.2 49.2 49.4 D D D D
Unicorn Road EB to Alfred Road S-SW NBL 15 16 16 16 84.5 56.9 63.5 63.5 1.0 1.1 1.1 1.2 47.6 50.8 50.7 54.0 D D D D
Alfred Road to Unicorn Road WB SW-NW EBL 30 29 30 29 229.4 225.4 224.1 222.2 37.9 36.9 36.0 37.4 23.1 22.7 21.8 21.7 C C C C
Alfred Road to Market Way SW-NE EBT 1696 1696 1695 1699 229.4 225.4 224.1 222.2 37.9 36.9 36.0 37.4 21.8 21.5 21.0 21.8 C C C C
All 3983 3969 3988 3987 229.4 225.4 224.1 222.2 16.1 15.5 15.6 16.0 25.4 24.9 24.6 25.3 C C C C
508 Stanhope Road Stanhope Road to Stanhope Road S-S NBU 0 0 0 0 22.0 46.0 34.6 29.3 0.1 0.2 0.2 0.2 0.0 0.0 0.0 0.0 A A A A
Stanhope Road to Edinburgh Road WB S-SE NBR 0 0 0 0 22.0 46.0 34.6 29.3 0.1 0.2 0.2 0.2 0.0 0.0 0.0 0.0 A A A A
Stanhope Road to Unicorn road S-N NBT 180 181 181 181 22.0 46.0 34.6 29.3 0.1 0.2 0.2 0.2 4.9 5.1 5.0 5.0 A A A A
Stanhope Road to Edinburgh Road EB S-W NBL 8 8 8 8 22.0 46.0 34.6 29.3 0.1 0.2 0.2 0.2 15.4 16.6 17.0 16.2 C C C C
Edinburgh Road WB to Stanhope Road E-S WBL 24 24 24 24 47.6 46.9 62.6 64.5 0.6 0.6 0.7 0.7 13.6 11.9 12.4 12.4 B B B B
Edinburgh Road WB to Edinburgh Road WB E-SE WBL 0 0 0 0 47.6 46.9 62.6 64.5 0.6 0.6 0.7 0.7 0.0 0.0 0.0 0.0 A A A A
Edinburgh Road WB to Unicorn road E-N WBR 30 30 30 30 47.6 46.9 62.6 64.5 0.6 0.6 0.7 0.7 17.0 17.7 17.7 17.5 C C C C
Edinburgh Road WB to Edinburgh Road EB E-W WBT 64 64 64 64 47.6 46.9 62.6 64.5 0.6 0.6 0.7 0.7 17.9 18.0 18.5 18.5 C C C C
Unicorn road to Stanhope Road N-S SBT 343 342 344 343 28.0 49.6 42.6 44.4 0.1 0.1 0.1 0.1 1.6 1.6 1.6 1.7 A A A A
Unicorn road to Edinburgh Road WB N-SE SBT 23 23 23 23 28.0 49.6 42.6 44.4 0.1 0.1 0.1 0.1 1.6 1.5 1.7 1.4 A A A A
Unicorn road to Unicorn road N-N SBU 1 1 1 1 28.0 49.6 42.6 44.4 0.1 0.1 0.1 0.1 3.8 4.0 3.6 3.3 A A A A
Unicorn road to Edinburgh Road EB N-W SBR 7 20 20 20 28.0 49.6 42.6 44.4 0.1 0.1 0.1 0.1 3.8 4.0 3.6 3.3 A A A A
Edinburgh Road EB to Stanhope Road W-S EBR 8 8 8 8 35.7 40.2 41.5 41.7 0.1 0.1 0.1 0.1 9.3 7.9 8.2 8.5 A A A A
Edinburgh Road EB to Edinburgh Road WB W-SE EBT 28 28 28 28 35.7 40.2 41.5 41.7 0.1 0.1 0.1 0.1 10.2 10.1 10.2 10.2 B B B B
Edinburgh Road EB to Unicorn road W-N EBL 0 1 1 1 35.7 40.2 41.5 41.7 0.1 0.1 0.1 0.1 0.0 8.3 8.7 8.3 A A A A
Edinburgh Road EB to Edinburgh Road EB W-W EBU 0 0 0 0 35.7 40.2 41.5 41.7 0.1 0.1 0.1 0.1 0.0 0.0 0.0 0.0 A A A A
All 717 730 732 731 47.6 49.6 62.6 64.5 0.2 0.3 0.3 0.3 5.5 5.5 5.5 5.6 A A A A
509 Queen Street Queen St to Alfred Road W-NE EBL 495 490 490 490 163.0 163.0 163.7 172.0 16.6 21.6 21.4 21.8 29.8 35.6 35.3 35.8 C D D D
Queen St to Bishop Crispian Way W-E EBT 38 39 39 39 154.2 154.5 155.0 163.2 8.1 13.2 13.1 13.3 70.8 71.7 71.1 71.4 E E E E
Alfred Road to Queen St NE-W WBT 305 292 295 294 224.9 225.3 223.7 224.5 29.5 25.7 24.9 26.4 51.5 48.5 47.5 49.0 D D D D
Alfred Road to Anglesea Road NE-S WBR 1051 1042 1055 1049 221.4 208.8 221.5 218.4 9.1 6.8 6.9 7.9 10.3 8.7 8.7 9.5 B A A A
Bishop Crispian Way to Queen St E-W WBT 80 93 93 93 84.1 89.3 85.1 84.4 8.6 10.2 10.0 10.0 51.9 54.1 53.1 54.0 D D D D
Anglesea Road to Queen St S-W NBL 20 20 20 20 70.1 75.8 84.0 79.9 0.3 0.3 0.4 0.2 19.7 19.1 19.7 18.5 B B B B
Anglesea Road to Alfred Road S-NE NBR 1218 1221 1221 1223 224.5 208.0 217.6 190.2 17.2 16.5 16.4 16.4 20.6 20.6 20.5 20.5 C C C C
All 3206 3196 3212 3207 224.9 225.3 223.7 224.5 12.8 13.5 13.3 13.7 22.9 23.2 22.9 23.4 C C C C
510 St Michael's Gyratory St Paul's Road to Wiltshire Street S-E NBR 0 0 0 0 31.9 26.8 30.5 26.8 0.4 0.4 0.4 0.4 0.0 0.0 0.0 0.0 A A A A
St Paul's Road to Waltham St S-S NBU 0 0 0 0 31.9 26.8 30.5 26.8 0.4 0.4 0.4 0.4 0.0 0.0 0.0 0.0 A A A A
St Paul's Road to Guildhall Walk S-NE NBT 0 0 0 0 31.9 26.8 30.5 26.8 0.4 0.4 0.4 0.4 0.0 0.0 0.0 0.0 A A A A
St Paul's Road to Cambridge Road S-SW NBL 0 0 0 0 31.9 26.8 30.5 26.8 0.4 0.4 0.4 0.4 0.0 0.0 0.0 0.0 A A A A
St Paul's Road to Hampshire Terrace S-S NBU 0 0 0 0 31.9 26.8 30.5 26.8 0.4 0.4 0.4 0.4 0.0 0.0 0.0 0.0 A A A A
St Paul's Road to Winston churchill avenue S-E NBR 0 0 0 0 31.9 26.8 30.5 26.8 0.4 0.4 0.4 0.4 0.0 0.0 0.0 0.0 A A A A
St Paul's Road to Anglesea Road S-N NBT 104 104 105 105 31.9 26.8 30.5 26.8 0.4 0.4 0.4 0.4 11.1 13.1 12.8 13.2 B B B B
Cambridge Road to Wiltshire Street SW-E EBT 3 3 3 3 173.1 157.1 157.2 157.1 2.8 4.0 4.1 4.0 25.4 45.3 47.2 47.2 C D D D
Cambridge Road to Waltham St SW-S EBR 0 0 0 0 173.1 157.1 157.2 157.1 2.8 4.0 4.1 4.0 0.0 0.0 0.0 0.0 A A A A
Cambridge Road to Guildhall Walk SW-NE EBT 12 13 13 13 173.1 157.1 157.2 157.1 2.8 4.0 4.1 4.0 27.8 44.8 46.2 47.5 C D D D
Cambridge Road to Cambridge Road SW-SW EBU 1 1 1 1 173.1 157.1 157.2 157.1 2.8 4.0 4.1 4.0 23.0 32.2 33.6 29.3 C C C C
Cambridge Road to Hampshire Terrace SW-S EBR 9 9 9 9 173.1 157.1 157.2 157.1 2.8 4.0 4.1 4.0 28.4 42.7 41.1 45.1 C D D D
Cambridge Road to Winston churchill avenue SW-E EBT 170 170 170 170 173.1 157.1 157.2 157.1 2.8 4.0 4.1 4.0 25.1 46.3 47.0 47.0 C D D D
Cambridge Road to Anglesea Road SW-N EBL 418 419 419 420 173.1 157.1 157.2 157.1 2.8 4.0 4.1 4.0 14.0 11.9 12.2 12.4 B B B B
Hampshire Terrace to Wiltshire Street S-E NBR 0 0 0 0 127.4 146.6 209.9 224.0 9.8 15.3 15.1 16.8 0.0 0.0 0.0 0.0 A A A A
Hampshire Terrace to Waltham St S-S NBU 0 0 0 0 127.4 146.6 209.9 224.0 9.8 15.3 15.1 16.8 0.0 0.0 0.0 0.0 A A A A
Hampshire Terrace to Guildhall Walk S-NE NBT 12 12 12 12 127.4 146.6 209.9 224.0 9.8 15.3 15.1 16.8 35.6 59.9 64.7 65.4 E F F F
Hampshire Terrace to Cambridge Road S-SW NBL 18 18 18 18 127.4 146.6 209.9 224.0 9.8 15.3 15.1 16.8 22.8 30.0 30.7 32.0 C D D D
Hampshire Terrace to Hampshire Terrace S-S NBU 6 5 5 5 127.4 146.6 209.9 224.0 9.8 15.3 15.1 16.8 36.9 53.8 58.1 63.4 E F F F
Hampshire Terrace to Winston churchill avenue S-E NBR 57 57 57 58 127.4 146.6 209.9 224.0 9.8 15.3 15.1 16.8 34.6 65.6 66.4 70.1 D F F F
Hampshire Terrace to Anglesea Road S-N NBT 324 322 323 322 127.4 146.6 209.9 224.0 9.8 15.3 15.1 16.8 25.3 32.7 32.5 34.4 D D D D
Winston churchill avenue to Wiltshire Street E-E WBU 4 4 4 4 68.6 64.7 57.1 54.4 10.0 7.7 7.6 7.6 35.0 29.8 27.3 29.0 C C C C
Winston churchill avenue to Waltham St E-S WBL 4 4 4 4 68.6 64.7 57.1 54.4 10.0 7.7 7.6 7.6 19.1 13.1 13.0 13.3 B B B B
Winston churchill avenue to Guildhall Walk E-NE WBR 12 12 12 12 68.6 64.7 57.1 54.4 10.0 7.7 7.6 7.6 49.7 72.6 75.1 75.1 D E E E
Winston churchill avenue to Cambridge Road E-SW WBT 155 156 156 156 68.6 64.7 57.1 54.4 10.0 7.7 7.6 7.6 40.0 36.5 37.0 35.7 D D D D
Winston churchill avenue to Hampshire Terrace E-S WBL 86 86 86 86 68.6 64.7 57.1 54.4 10.0 7.7 7.6 7.6 31.6 26.3 25.6 25.5 C C C C
Winston churchill avenue to Winston churchill avenue E-E WBU 21 21 21 21 68.6 64.7 57.1 54.4 10.0 7.7 7.6 7.6 46.5 67.2 71.5 69.1 D E E E
Winston churchill avenue to Anglesea Road E-N WBR 163 163 164 164 68.6 64.7 57.1 54.4 10.0 7.7 7.6 7.6 40.6 36.5 37.4 36.7 D D D D
Anglesea Road to Wiltshire Street N-E SBL 20 20 20 20 81.9 72.0 75.4 70.8 1.4 6.7 6.7 6.3 19.7 25.0 25.6 24.8 C C C C
Anglesea Road to Waltham St N-S SBT 0 0 0 0 81.9 72.0 75.4 70.8 1.4 6.7 6.7 6.3 0.0 0.0 0.0 0.0 A A A A
Anglesea Road to Guildhall Walk N-NE SBL 20 19 20 20 81.9 72.0 75.4 70.8 1.4 6.7 6.7 6.3 10.2 16.7 17.1 16.5 B B B B
Anglesea Road to Cambridge Road N-SW SBR 173 174 176 177 81.9 72.0 75.4 70.8 1.4 6.7 6.7 6.3 25.2 31.1 31.1 32.1 D C C C
Anglesea Road to Hampshire Terrace N-S SBT 519 508 515 513 81.9 72.0 75.4 70.8 1.4 6.7 6.7 6.3 21.2 25.0 25.7 26.2 C C C C
Anglesea Road to Winston churchill avenue N-E SBL 107 106 107 106 81.9 72.0 75.4 70.8 1.4 6.7 6.7 6.3 10.2 16.2 15.9 15.7 B B B B
Anglesea Road to Anglesea Road N-N SBU 75 75 77 77 81.9 72.0 75.4 70.8 1.4 6.7 6.7 6.3 30.0 34.0 34.2 34.9 D C C C
All 2492 2480 2496 2495 173.1 157.1 209.9 224.0 4.9 6.8 6.8 7.0 24.0 28.5 28.9 29.4 C D D D
511 Park Road Park Road to Anglesea Road W-N EBL 273 273 273 273 120.1 120.3 120.3 120.3 24.5 24.7 24.7 24.7 56.5 56.6 56.6 56.6 E E E E
Anglesea Road SB to Park Road N-W SBR 139 136 138 137 225.4 224.3 224.5 225.5 22.2 23.0 23.4 24.5 56.0 58.6 57.1 57.5 E E E E
Anglesea Road SB to Anglesea Road SB N-S SBT 916 907 915 911 225.4 224.3 224.5 225.5 22.2 23.0 23.4 24.5 14.5 14.6 15.0 15.9 B B B B
Anglesea Road to Park Road S-W NBL 35 35 35 35 198.6 114.7 121.0 118.5 10.2 9.4 9.4 9.2 13.5 10.8 10.6 9.6 B B B A
Anglesea Road to Anglesea Road S-N NBT 982 985 986 986 198.6 114.7 121.0 118.5 10.2 9.4 9.4 9.2 12.0 10.8 10.8 10.7 B B B B
All 2344 2335 2346 2341 225.4 224.3 224.5 225.5 17.9 17.9 18.1 18.4 20.8 20.4 20.5 20.8 C C C C
512 Princess Royal Road Princess Royal Road to Mile end Road NB W-N EBL 1067 1066 1062 1063 235.7 235.8 235.9 235.9 147.0 127.0 126.4 125.0 102.6 90.6 88.3 89.3 F F F F
Mile end Road SB to Princess Royal Road NE-W WBT 85 83 84 84 38.7 29.6 32.8 29.9 3.2 3.0 3.1 3.0 34.6 33.8 33.2 33.5 C C C C
Mile end Road NB to Princess Royal Road S-W NBL 90 88 88 88 36.8 45.2 36.3 37.9 1.5 1.5 1.3 1.5 17.4 17.0 15.8 16.3 B B B B
Mile end Road NB to Mile end Road NB S-N NBT 2954 2904 2907 2907 225.4 226.1 235.7 231.2 51.7 48.4 49.9 47.6 20.8 20.4 20.8 20.0 C C C C
All 4195 4141 4140 4143 235.7 235.8 235.9 235.9 50.8 45.0 45.2 44.3 41.8 38.7 38.2 38.0 D D D D
0 NETWORK TOTALS All All 41041 40767 40914 40862 236.0 236.0 235.9 235.9 15.8 15.1 13.7 14.8 25.3 26.2 25.2 25.5 D C C C
LOS
16
:00
-17
:00
Volume Max QL (m) Avg QL (m) Delay (secs)
26/09/2014 12:04 Node Evaluation Comparison.xlsm

501 Rudmore Roundabout M275 SB to M275 SB NW-S SBT 2387 2410 2398 2401 225.4 231.5 225.3 231.4 1.0 5.0 0.2 5.0 3.5 8.9 1.6 7.1 A A A A
M275 NB to M275 NB S-NW NBT 2639 2603 2607 2609 0.0 0.0 0.0 0.0 0.0 0.0 0.0 0.0 1.9 1.5 1.6 1.5 A A A A
A2047 Kingston Cresent to Wharf Road E-W WBT 7 7 7 7 80.6 78.5 81.1 81.2 12.3 3.2 3.2 3.0 9.7 9.4 10.3 10.0 A A B A
A2047 Kingston Cresent to M275 SB Service Road E-S WBL 59 60 60 60 80.6 78.5 81.1 81.2 12.3 3.2 3.2 3.0 4.1 4.8 5.0 4.7 A A A A
A2047 Kingston Cresent to A2047 Kingston Cresent E-SE WBL 0 0 0 0 80.6 78.5 81.1 81.2 12.3 3.2 3.2 3.0 0.0 0.0 0.0 0.0 A A A A
A2047 Kingston Cresent to A3 Twyford Avenue E-NE WBU 187 188 188 188 80.6 78.5 81.1 81.2 12.3 3.2 3.2 3.0 20.2 25.0 25.0 24.8 C C C C
A2047 Kingston Cresent to M275 NB Service Road E-NW WBR 490 487 487 487 80.6 78.5 81.1 81.2 12.3 3.2 3.2 3.0 18.4 23.6 23.7 23.2 C C C C
M275 SB Service Road to Wharf Road NW-W SBR 86 89 89 89 235.7 139.6 121.0 171.4 140.0 26.0 23.5 27.5 121.1 20.5 20.4 20.5 F C C C
M275 SB Service Road to A3 Twyford Avenue NW-NE SBL 295 301 300 300 235.7 139.6 121.0 171.4 140.0 26.0 23.5 27.5 226.9 29.9 26.6 32.4 F D D D
M275 SB Service Road to M275 NB Service Road NW-NW SBU 23 22 22 22 235.7 139.6 121.0 171.4 140.0 26.0 23.5 27.5 117.9 29.8 29.8 29.3 F D D D
M275 SB Service Road to A2047 Kingston Cresent NW-SE SBL 459 468 468 467 235.7 139.6 121.0 171.4 140.0 26.0 23.5 27.5 145.4 31.9 28.5 34.5 F D D D
M275 SB Service Road to M275 SB Service Road NW-S SBT 22 22 22 22 235.7 139.6 121.0 171.4 140.0 26.0 23.5 27.5 133.5 21.4 20.1 22.3 F C C C
A3 Twyford Avenue to Wharf Road NE-W WBT 14 14 14 14 134.6 180.8 180.8 218.1 3.9 12.9 12.8 12.9 17.7 39.4 40.0 40.2 C E E E
A3 Twyford Avenue to A3 Twyford Avenue NE-NE WBU 10 10 10 10 134.6 180.8 180.8 218.1 3.9 12.9 12.8 12.9 23.7 43.5 43.0 44.9 C E E E
A3 Twyford Avenue to M275 NB Service Road NE-NW WBR 194 195 195 195 134.6 180.8 180.8 218.1 3.9 12.9 12.8 12.9 21.5 49.6 49.5 49.5 C E E E
A3 Twyford Avenue to A2047 Kingston Cresent NE-SE WBR2 127 129 129 129 134.6 180.8 180.8 218.1 3.9 12.9 12.8 12.9 14.9 36.1 35.9 35.5 B E E E
A3 Twyford Avenue to M275 SB Service Road NE-S WBL 389 395 395 395 134.6 180.8 180.8 218.1 3.9 12.9 12.8 12.9 21.3 36.2 36.1 35.8 C E E E
Wharf Road to Wharf Road W-W EBU 0 0 0 0 161.0 56.2 56.2 63.2 5.7 0.4 0.5 0.6 0.0 0.0 0.0 0.0 A A A A
Wharf Road to A3 Twyford Avenue W-NE EBT 46 45 45 46 161.0 56.2 56.2 63.2 5.7 0.4 0.5 0.6 49.7 89.1 89.1 86.1 E F F F
Wharf Road to M275 NB Service Road W-NW EBL 246 248 248 247 161.0 56.2 56.2 63.2 5.7 0.4 0.5 0.6 29.3 29.1 29.1 28.8 D D D D
Wharf Road to A2047 Kingston Cresent W-SE EBR 35 35 35 35 161.0 56.2 56.2 63.2 5.7 0.4 0.5 0.6 56.0 113.9 114.2 114.5 F F F F
Wharf Road to M275 SB Service Road W-S EBR2 74 73 73 73 161.0 56.2 56.2 63.2 5.7 0.4 0.5 0.6 55.0 112.4 112.5 115.0 F F F F
M275 NB Service Road to Wharf Road S-W NBL 36 36 36 36 226.7 158.9 167.5 132.4 30.1 3.2 4.2 2.8 5.0 21.2 22.2 20.8 A C C C
M275 NB Service Road to A3 Twyford Avenue S-NE NBR2 470 466 467 467 226.7 158.9 167.5 132.4 30.1 3.2 4.2 2.8 71.4 34.9 37.5 35.2 F D E E
M275 NB Service Road to M275 BB Service Road S-NW NBT 78 78 78 77 226.7 158.9 167.5 132.4 30.1 3.2 4.2 2.8 15.1 25.9 26.6 23.9 C D D C
M275 NB Service Road to A2047 Kingston Cresent S-SE NBR 115 115 114 115 226.7 158.9 167.5 132.4 30.1 3.2 4.2 2.8 23.9 50.0 52.5 50.3 C E F F
M275 NB Service Road to M275 SB Service Road S-S NBU 5 5 5 5 226.7 158.9 167.5 132.4 30.1 3.2 4.2 2.8 64.1 49.6 44.2 48.1 F E E E
All 8494 8500 8492 8496 235.7 231.5 225.3 231.4 35.6 8.6 8.2 8.8 28.6 17.4 15.1 17.0 D C C C
502 Mile End Roundabout Mile End Road to Mile End Road N-N SBU 53 53 53 53 235.9 235.8 235.9 231.3 22.3 32.6 18.2 29.6 64.1 67.7 59.4 68.9 E E E E
Mile End Road to Commercial Road N-S SBT 2120 2137 2125 2126 235.9 235.8 235.9 231.3 22.3 32.6 18.2 29.6 21.5 32.1 19.0 30.8 C C B C
Mile End Road to Church Street N-E SBL 694 700 696 696 235.9 235.8 235.9 231.3 22.3 32.6 18.2 29.6 26.5 29.1 17.0 23.7 C C B C
Hope Street to Mile End Road SW-N NBT 1746 1749 1749 1751 225.1 225.0 225.4 226.6 57.2 55.4 55.2 56.1 25.1 24.1 23.8 23.8 C C C C
Hope Street to Mile End Road SW-N NBT 0 0 0 0 34.1 29.4 30.2 28.7 1.0 1.0 1.0 1.0 0.0 0.0 0.0 0.0 A A A A
Hope Street to Commercial Road SW-S NBU 24 24 23 24 34.1 29.4 30.2 28.7 1.0 1.0 1.0 1.0 117.7 123.6 117.4 118.1 F F F F
Hope Street to Church Street SW-E NBR 60 59 59 59 34.1 29.4 30.2 28.7 1.0 1.0 1.0 1.0 102.6 82.7 80.3 80.1 F F F F
Commercial Road to Mile End Road S-N NBT 502 499 499 495 69.2 65.7 67.1 64.8 3.7 3.1 3.2 3.0 43.8 44.0 43.5 42.7 D D D D
Commercial Road to Commercial Road S-S NBU 6 5 5 5 69.2 65.7 67.1 64.8 3.7 3.1 3.2 3.0 75.6 67.5 68.0 67.2 E E E E
Commercial Road to Church Street S-E NBR 13 13 13 13 69.2 65.7 67.1 64.8 3.7 3.1 3.2 3.0 78.0 53.1 51.9 53.0 E D D D
Church Street to Mile End Road E-N WBR 479 441 443 442 215.2 231.5 231.5 232.8 47.2 221.6 220.9 220.7 92.6 440.2 416.0 402.8 F F F F
Church Street to Commercial Road E-S WBL 16 15 15 15 215.2 231.5 231.5 232.8 47.2 221.6 220.9 220.7 80.6 511.8 481.4 418.7 F F F F
Church Street to Church Street E-E WBU 0 0 0 0 215.2 231.5 231.5 232.8 47.2 221.6 220.9 220.7 0.0 0.0 0.0 0.0 A A A A
All 5713 5694 5680 5679 235.9 235.8 235.9 232.8 21.5 63.9 60.4 63.0 33.3 64.7 56.1 60.3 C E E E
503 Cascade's Approach Cascade's Approach to Cascade's Approach S-SW NBL 0 0 0 0 82.8 85.1 70.8 67.5 7.9 7.5 6.4 6.8 0.0 0.0 0.0 0.0 A A A A
Cascade's Approach to Marketway WB S-E NBR 123 123 122 123 82.8 85.1 70.8 67.5 7.9 7.5 6.4 6.8 38.7 36.9 32.0 34.1 E E D D
Cascade's Approach to Marketway EB S-W NBL 41 41 41 40 82.8 85.1 70.8 67.5 7.9 7.5 6.4 6.8 24.5 22.0 20.8 19.7 C C C C
Marketway WB to Cascade's Approach NE-SW WBT 14 15 15 14 231.4 225.0 226.8 224.7 16.3 13.8 13.1 14.0 5.3 13.3 14.2 13.7 A B B B
Marketway WB to Marketway WB NE-E WBL 80 80 80 80 231.4 225.0 226.8 224.7 16.3 13.8 13.1 14.0 16.8 17.1 17.3 17.2 C C C C
Marketway WB to Marketway EB NE-W WBT 1875 1883 1872 1868 231.4 225.0 226.8 224.7 16.3 13.8 13.1 14.0 16.4 15.8 16.3 16.4 C C C C
Marketway EB to Cascade's Approach SW-SW EBU 10 10 10 10 41.2 101.0 74.8 110.8 0.4 0.5 0.4 0.5 6.2 5.1 5.3 5.6 A A A A
Marketway EB to Hope Street SW-N EBL 1694 1692 1695 1694 0.0 0.0 0.0 0.0 0.0 0.0 0.0 0.0 4.5 4.4 4.3 4.5 A A A A
Marketway WB to Marketway EB NE-W WBT 27 27 27 27 36.1 6.5 98.9 13.0 0.0 0.0 0.1 0.0 7.3 5.9 6.7 7.0 A A A A
Marketway EB to Marketway WB SW-E EBT 161 160 160 160 41.2 101.0 74.8 110.8 0.4 0.5 0.4 0.5 7.2 7.5 7.2 7.3 A A A A
Marketway EB to Marketway EB SW-W NBL 27 22 22 22 41.2 101.0 74.8 110.8 0.4 0.5 0.4 0.5 6.7 6.8 6.8 6.9 A A A A
All 4052 4052 4043 4038 231.4 225.0 226.8 224.7 6.7 5.9 5.4 5.8 11.7 11.3 11.3 11.5 B B B B
504 Marketway Roundabout Commercial Road NB to Commercial Road SB S-N NBT 9 8 8 8 38.4 39.2 45.0 39.2 3.5 3.5 3.6 3.6 40.6 43.3 41.1 42.9 E E E E
Commercial Road NB to Marketway S-W NBL 21 22 21 22 38.4 39.2 45.0 39.2 3.5 3.5 3.6 3.6 33.0 33.7 33.8 34.3 D D D D
Commercial Road NB to Cornmill street S-SE NBR 10 10 10 10 38.4 39.2 45.0 39.2 3.5 3.5 3.6 3.6 31.2 30.3 34.0 29.4 D D D D
Commercial Road SB to Commercial Road SB N-N SBU 3 3 3 3 231.5 229.5 232.8 225.4 23.4 18.9 12.9 13.8 23.7 22.5 22.7 23.6 C C C C
Commercial Road SB to Marketway N-W SBR 1760 1773 1762 1760 231.5 229.5 232.8 225.4 23.4 18.9 12.9 13.8 28.7 27.9 25.9 26.6 D D D D
Commercial Road SB to Cornmill street N-SE SBT 404 408 404 405 231.5 229.5 232.8 225.4 23.4 18.9 12.9 13.8 26.4 21.8 17.9 17.9 D C C C
Marketway to Commercial Road SB W-N EBL 176 174 175 176 68.7 171.8 67.5 65.7 1.1 1.9 1.3 1.1 10.2 10.7 11.1 10.3 B B B B
Marketway to Marketway W-W EBU 5 5 5 4 68.7 171.8 67.5 65.7 1.1 1.9 1.3 1.1 13.6 19.7 17.3 18.0 B C C C
Marketway to Cornmill street W-SE EBT 103 103 104 104 68.7 171.8 67.5 65.7 1.1 1.9 1.3 1.1 19.3 19.9 17.0 16.5 C C C C
Cornmill street to Commercial Road NB E-SW WBT 6 5 5 5 157.1 142.4 145.6 135.0 9.8 12.1 11.3 11.0 2.2 3.9 4.6 4.0 A A A A
Cornmill street to Commercial Road SB E-N WBR 316 314 315 309 175.3 156.6 159.9 149.2 16.6 19.5 18.9 18.6 24.5 27.9 28.6 29.1 C D D D
Cornmill street to Marketway E-W WBT 164 162 163 163 175.3 156.6 159.9 149.2 16.6 19.5 18.9 18.6 24.5 28.0 29.3 29.4 C D D D
Cornmill street to Cornmill street E-SE WBL 0 0 0 0 175.3 156.6 159.9 149.2 16.6 19.5 18.9 18.6 0.0 0.0 0.0 0.0 A A A A
All 2975 2987 2975 2969 231.5 229.5 232.8 225.4 11.1 11.0 9.4 9.4 26.4 25.9 24.2 24.5 D D C C
505 A2030 roundabout Lake Road NB to Lake Road NB SW-W NBL 0 0 0 0 88.3 83.2 85.6 85.5 7.7 10.5 7.4 8.4 0.0 0.0 0.0 0.0 A A A A
Lake Road NB to Cornmill street SW-NW EBL 208 207 211 206 88.3 83.2 85.6 85.5 7.7 10.5 7.4 8.4 31.7 36.3 27.6 29.3 D E D D
Lake Road NB to Lake Road SB SW-E EBT 103 102 103 102 88.3 83.2 85.6 85.5 7.7 10.5 7.4 8.4 21.2 24.3 15.6 19.6 C C C C
Cornmill street to Lake Road NB NW-W SBR 45 43 44 43 91.6 82.7 86.0 82.4 5.5 2.4 2.2 1.8 23.4 16.0 13.4 11.7 C C B B
Cornmill street to Cornmill street NW-NW SBU 6 5 5 5 91.6 82.7 86.0 82.4 5.5 2.4 2.2 1.8 36.5 22.6 21.6 15.0 E C C C
Cornmill street to Lake Road SB NW-E SBL 467 473 468 470 91.6 82.7 86.0 82.4 5.5 2.4 2.2 1.8 22.4 14.2 11.9 12.5 C B B B
Lake Road SB to Lake Road NB E-W WBT 20 20 20 20 231.5 224.5 110.8 116.4 9.6 5.4 2.7 2.5 29.1 15.6 9.6 11.3 D C A B
Lake Road SB to Cornmill street E-NW WBT 270 267 264 265 231.5 224.5 110.8 116.4 9.6 5.4 2.7 2.5 35.9 31.5 23.9 23.7 E D C C
Lake Road SB to Lake Road SB E-E WBU 0 0 0 0 231.5 224.5 110.8 116.4 9.6 5.4 2.7 2.5 0.0 0.0 0.0 0.0 A A A A
All 1118 1117 1116 1111 231.5 224.5 110.8 116.4 7.6 6.1 4.1 4.2 27.2 23.0 18.0 18.5 D C C C
506 Holbrook Road Roundabout Lake Road SB to Lake Road SB NE-E WBL 2 2 2 2 224.7 186.7 75.0 189.6 24.5 23.7 0.5 22.4 31.7 42.2 23.8 42.5 D E C E
Lake Road SB to Holbrook Road NE-S WBR 200 201 200 201 224.7 186.7 75.0 189.6 24.5 23.7 0.5 22.4 35.1 35.0 15.9 33.5 E D C D
Lake Road SB to Church Street NE-NW WBR 74 74 74 74 224.7 186.7 75.0 189.6 24.5 23.7 0.5 22.4 37.4 41.3 29.3 38.2 E E D E
Lake Road SB to Lake Road NB NE-W WBT 148 148 147 147 224.7 186.7 75.0 189.6 24.5 23.7 0.5 22.4 39.8 38.5 19.8 36.7 E E C E
Holbrook Road to Lake Road SB SE-E NBR 326 327 328 327 224.9 231.4 230.8 231.5 8.9 36.5 40.7 26.5 20.4 44.7 43.5 32.0 C E E D
Holbrook Road to Holbrook Road SE-S NBL 1 1 1 1 224.9 231.4 230.8 231.5 8.9 36.5 40.7 26.5 3.0 8.4 4.8 4.7 A A A A
Holbrook Road to Church Street SE-NW NBT 346 348 349 348 224.9 231.4 230.8 231.5 8.9 36.5 40.7 26.5 20.6 45.0 53.2 32.1 C E F D
Holbrook Road to Lake Road NB SE-W NBL 123 124 124 124 224.9 231.4 230.8 231.5 8.9 36.5 40.7 26.5 8.8 17.4 15.0 11.9 A C B B
Church Street to Lake Road SB NW-E SBL 86 81 80 81 235.8 231.4 131.3 230.8 66.8 47.3 2.5 42.3 90.9 97.1 49.6 100.7 F F E F
Church Street to Holbrook Road NW-S SBT 396 381 378 378 235.8 231.4 131.3 230.8 66.8 47.3 2.5 42.3 85.1 81.7 55.4 81.2 F F F F
Church Street to Church Street NW-NW SBU 0 0 0 0 235.8 231.4 131.3 230.8 66.8 47.3 2.5 42.3 0.0 0.0 0.0 0.0 A A A A
Church Street to Lake Road NB NW-W SBR 13 12 12 12 235.8 231.4 131.3 230.8 66.8 47.3 2.5 42.3 72.8 108.5 32.3 92.2 F F D F
Lake Road NB to Lake Road SB SW-E EBT 209 211 209 210 236.0 231.5 235.3 231.5 90.2 73.3 74.9 78.6 77.4 65.3 66.3 70.3 F F F F
Lake Road NB to Holbrook Road SW-S EBR 351 353 352 352 236.0 231.5 235.3 231.5 90.2 73.3 74.9 78.6 74.2 62.3 64.1 65.8 F F F F
Lake Road NB to Church Street SW-NW EBL 13 12 12 12 236.0 231.5 235.3 231.5 90.2 73.3 74.9 78.6 80.9 71.7 85.1 75.6 F F F F
Lake Road NB to Lake Road NB SW-W NBL 1 1 1 1 236.0 231.5 235.3 231.5 90.2 73.3 74.9 78.6 18.1 25.5 36.5 20.0 C D E C
All 2288 2276 2270 2271 236.0 231.5 235.3 231.5 47.6 45.2 29.6 42.4 51.1 55.3 46.7 51.7 F F E F
507 Unicorn Road Unicorn Road WB to Market Way NW-NE SBL 77 77 77 78 51.0 51.2 46.5 47.8 4.3 4.7 4.5 4.5 45.0 46.9 47.5 46.9 D D D D
Unicorn Road WB to Unicorn Road EB NW-S SBT 59 60 59 59 52.2 52.5 50.1 52.9 7.6 7.4 7.6 7.5 46.1 44.0 44.9 45.5 D D D D
Unicorn Road WB to Alfred Road NW-SW SBR 96 96 97 97 52.2 52.5 50.1 52.9 7.6 7.4 7.6 7.5 47.4 46.0 46.8 45.5 D D D D
Market Way to Unicorn Road WB NE-NW WBR 23 23 23 23 222.7 219.1 222.0 217.6 19.9 18.1 15.3 16.8 36.0 36.7 36.9 36.9 D D D D
Market Way to Unicorn Road EB NE-S WBU 352 365 364 362 222.7 219.1 222.0 217.6 19.9 18.1 15.3 16.8 14.8 14.5 13.4 14.2 B B B B
Market Way to Alfred Road NE-SW WBT 1594 1586 1572 1575 222.7 219.1 222.0 217.6 19.9 18.1 15.3 16.8 22.2 21.3 19.5 20.4 C C B C
Unicorn Road EB to Unicorn Road WB S-NW NBT 16 16 16 16 107.6 102.2 93.4 95.7 14.3 14.7 14.6 14.6 48.1 50.8 51.1 49.6 D D D D
Unicorn Road EB to Market Way S-NE NBR 184 184 184 184 107.6 102.2 93.4 95.7 14.3 14.7 14.6 14.6 45.8 46.6 46.0 46.5 D D D D
Unicorn Road EB to Alfred Road S-SW NBL 18 19 20 20 91.7 63.7 78.0 78.1 1.3 1.4 1.4 1.4 50.3 50.7 49.4 47.7 D D D D
Alfred Road to Unicorn Road WB SW-NW EBL 18 18 18 18 220.1 217.6 216.4 219.4 18.3 19.0 18.8 20.2 13.0 14.2 10.9 13.7 B B B B
Alfred Road to Market Way SW-NE EBT 1627 1624 1622 1619 220.1 217.6 216.4 219.4 18.3 19.0 18.8 20.2 13.2 13.9 13.7 14.3 B B B B
All 4064 4067 4051 4050 222.7 219.1 222.0 219.4 13.3 13.0 12.2 12.8 20.7 20.6 19.7 20.4 C C B C
508 Stanhope Road Stanhope Road to Stanhope Road S-S NBU 0 0 0 0 57.6 21.2 33.2 36.8 0.2 0.1 0.2 0.2 0.0 0.0 0.0 0.0 A A A A
Stanhope Road to Edinburgh Road WB S-SE NBR 0 0 0 0 57.6 21.2 33.2 36.8 0.2 0.1 0.2 0.2 0.0 0.0 0.0 0.0 A A A A
Stanhope Road to Unicorn road S-N NBT 193 193 193 193 57.6 21.2 33.2 36.8 0.2 0.1 0.2 0.2 4.8 4.6 4.7 4.8 A A A A
Stanhope Road to Edinburgh Road EB S-W NBL 8 8 8 8 57.6 21.2 33.2 36.8 0.2 0.1 0.2 0.2 16.8 15.1 14.7 15.3 C C B C
Edinburgh Road WB to Stanhope Road E-S WBL 26 26 26 26 68.3 40.8 42.1 56.8 0.6 0.6 0.5 0.6 12.0 10.8 10.8 10.9 B B B B
Edinburgh Road WB to Edinburgh Road WB E-SE WBL 0 0 0 0 68.3 40.8 42.1 56.8 0.6 0.6 0.5 0.6 0.0 0.0 0.0 0.0 A A A A
Edinburgh Road WB to Unicorn road E-N WBR 24 24 24 24 68.3 40.8 42.1 56.8 0.6 0.6 0.5 0.6 16.8 17.8 17.1 17.4 C C C C
Edinburgh Road WB to Edinburgh Road EB E-W WBT 46 46 46 46 68.3 40.8 42.1 56.8 0.6 0.6 0.5 0.6 17.8 19.2 19.2 18.7 C C C C
Unicorn road to Stanhope Road N-S SBT 382 381 379 378 37.0 78.3 57.3 72.9 0.1 0.2 0.1 0.1 1.4 1.5 1.5 1.5 A A A A
Unicorn road to Edinburgh Road WB N-SE SBT 23 23 24 23 37.0 78.3 57.3 72.9 0.1 0.2 0.1 0.1 1.8 2.1 2.0 2.1 A A A A
Unicorn road to Unicorn road N-N SBU 0 0 0 0 37.0 78.3 57.3 72.9 0.1 0.2 0.1 0.1 0.0 0.0 0.0 0.0 A A A A
Unicorn road to Edinburgh Road EB N-W SBR 6 21 20 21 37.0 78.3 57.3 72.9 0.1 0.2 0.1 0.1 1.8 1.9 2.1 2.3 A A A A
Edinburgh Road EB to Stanhope Road W-S EBR 8 8 8 8 41.6 43.7 52.5 42.2 0.2 0.2 0.2 0.2 5.4 5.4 5.4 5.6 A A A A
Edinburgh Road EB to Edinburgh Road WB W-SE EBT 27 27 27 27 41.6 43.7 52.5 42.2 0.2 0.2 0.2 0.2 12.7 12.6 12.8 12.8 B B B B
Edinburgh Road EB to Unicorn road W-N EBL 0 1 2 2 41.6 43.7 52.5 42.2 0.2 0.2 0.2 0.2 0.0 6.9 6.5 6.5 A A A A
Edinburgh Road EB to Edinburgh Road EB W-W EBU 0 0 0 0 41.6 43.7 52.5 42.2 0.2 0.2 0.2 0.2 0.0 0.0 0.0 0.0 A A A A
All 744 759 757 756 68.3 78.3 57.3 72.9 0.3 0.3 0.2 0.3 4.8 4.9 4.9 4.9 A A A A
509 Queen Street Queen St to Alfred Road W-NE EBL 463 458 458 458 127.6 160.0 160.0 160.0 15.2 19.3 19.1 19.1 27.4 33.2 32.9 32.9 C C C C
Queen St to Bishop Crispian Way W-E EBT 33 34 35 35 118.8 151.2 151.2 151.2 5.5 9.5 9.2 9.2 68.0 65.2 64.9 64.9 E E E E
Alfred Road to Queen St NE-W WBT 358 343 341 342 229.0 231.5 226.6 228.5 59.5 50.5 46.6 49.6 66.6 61.0 59.5 62.5 E E E E
Alfred Road to Anglesea Road NE-S WBR 1357 1358 1349 1354 224.9 230.9 224.9 224.7 20.3 19.1 14.8 16.6 14.4 12.7 12.0 12.9 B B B B
Bishop Crispian Way to Queen St E-W WBT 59 74 74 74 79.2 77.5 77.2 80.7 8.8 10.1 10.0 10.1 64.1 61.4 61.8 62.5 E E E E
Anglesea Road to Queen St S-W NBL 22 22 22 22 58.8 53.3 66.7 55.3 0.3 0.3 0.3 0.3 19.7 19.8 18.7 19.2 B B B B
Anglesea Road to Alfred Road S-NE NBR 1186 1185 1185 1185 183.9 133.2 112.7 162.5 14.7 13.6 13.4 13.5 19.4 19.0 18.8 19.0 B B B B
All 3479 3474 3464 3469 229.0 231.5 226.6 228.5 17.8 17.5 16.2 16.9 24.6 23.9 23.4 24.1 C C C C
510 St Michael's Gyratory St Paul's Road to Wiltshire Street S-E NBR 0 0 0 0 54.0 42.9 56.4 57.8 1.6 1.3 1.6 1.7 0.0 0.0 0.0 0.0 A A A A
St Paul's Road to Waltham St S-S NBU 0 0 0 0 54.0 42.9 56.4 57.8 1.6 1.3 1.6 1.7 0.0 0.0 0.0 0.0 A A A A
St Paul's Road to Guildhall Walk S-NE NBT 0 0 0 0 54.0 42.9 56.4 57.8 1.6 1.3 1.6 1.7 0.0 0.0 0.0 0.0 A A A A
St Paul's Road to Cambridge Road S-SW NBL 0 0 0 0 54.0 42.9 56.4 57.8 1.6 1.3 1.6 1.7 0.0 0.0 0.0 0.0 A A A A
St Paul's Road to Hampshire Terrace S-S NBU 2 2 2 2 54.0 42.9 56.4 57.8 1.6 1.3 1.6 1.7 15.6 10.8 11.4 10.6 C B B B
St Paul's Road to Winston churchill avenue S-E NBR 0 0 0 0 54.0 42.9 56.4 57.8 1.6 1.3 1.6 1.7 0.0 0.0 0.0 0.0 A A A A
St Paul's Road to Anglesea Road S-N NBT 142 141 141 141 54.0 42.9 56.4 57.8 1.6 1.3 1.6 1.7 18.1 22.1 23.8 23.0 C C C C
Cambridge Road to Wiltshire Street SW-E EBT 1 1 1 1 109.4 120.4 120.3 120.2 2.0 2.9 2.9 2.9 20.8 23.2 38.6 32.1 C C D C
Cambridge Road to Waltham St SW-S EBR 0 0 0 0 109.4 120.4 120.3 120.2 2.0 2.9 2.9 2.9 0.0 0.0 0.0 0.0 A A A A
Cambridge Road to Guildhall Walk SW-NE EBT 26 26 25 25 109.4 120.4 120.3 120.2 2.0 2.9 2.9 2.9 21.9 45.5 44.7 46.8 C D D D
Cambridge Road to Cambridge Road SW-SW EBU 2 2 2 2 109.4 120.4 120.3 120.2 2.0 2.9 2.9 2.9 36.9 57.1 60.9 54.4 D E E D
Cambridge Road to Hampshire Terrace SW-S EBR 8 9 8 9 109.4 120.4 120.3 120.2 2.0 2.9 2.9 2.9 32.4 54.0 52.0 50.0 C D D D
Cambridge Road to Winston churchill avenue SW-E EBT 133 134 134 133 109.4 120.4 120.3 120.2 2.0 2.9 2.9 2.9 23.3 48.3 47.5 49.7 C D D D
Cambridge Road to Anglesea Road SW-N EBL 378 376 376 376 109.4 120.4 120.3 120.2 2.0 2.9 2.9 2.9 13.0 10.9 11.1 11.2 B B B B
Hampshire Terrace to Wiltshire Street S-E NBR 0 0 0 0 186.7 224.9 223.6 224.7 12.5 25.7 26.5 27.6 0.0 0.0 0.0 0.0 A A A A
Hampshire Terrace to Waltham St S-S NBU 0 0 0 0 186.7 224.9 223.6 224.7 12.5 25.7 26.5 27.6 0.0 0.0 0.0 0.0 A A A A
Hampshire Terrace to Guildhall Walk S-NE NBT 8 8 8 8 186.7 224.9 223.6 224.7 12.5 25.7 26.5 27.6 46.1 90.3 92.3 89.9 E F F F
Hampshire Terrace to Cambridge Road S-SW NBL 13 13 13 13 186.7 224.9 223.6 224.7 12.5 25.7 26.5 27.6 21.4 33.6 33.1 33.9 C D D D
Hampshire Terrace to Hampshire Terrace S-S NBU 6 6 6 6 186.7 224.9 223.6 224.7 12.5 25.7 26.5 27.6 49.3 87.3 86.8 89.1 E F F F
Hampshire Terrace to Winston churchill avenue S-E NBR 51 52 52 52 186.7 224.9 223.6 224.7 12.5 25.7 26.5 27.6 37.0 77.1 75.5 81.6 E F F F
Hampshire Terrace to Anglesea Road S-N NBT 302 304 304 303 186.7 224.9 223.6 224.7 12.5 25.7 26.5 27.6 29.7 49.0 49.7 51.0 D E E F
Winston churchill avenue to Wiltshire Street E-E WBU 4 4 4 4 99.8 76.8 73.0 73.2 12.9 10.0 10.2 10.2 34.8 33.1 33.0 31.8 C C C C
Winston churchill avenue to Waltham St E-S WBL 7 7 7 7 99.8 76.8 73.0 73.2 12.9 10.0 10.2 10.2 28.9 19.2 22.0 22.6 C B C C
Winston churchill avenue to Guildhall Walk E-NE WBR 23 23 23 23 99.8 76.8 73.0 73.2 12.9 10.0 10.2 10.2 57.1 87.1 84.4 86.5 E F F F
Winston churchill avenue to Cambridge Road E-SW WBT 164 165 165 164 99.8 76.8 73.0 73.2 12.9 10.0 10.2 10.2 49.0 47.6 47.5 47.8 D D D D
Winston churchill avenue to Hampshire Terrace E-S WBL 99 100 99 100 99.8 76.8 73.0 73.2 12.9 10.0 10.2 10.2 40.3 35.1 36.1 35.8 D D D D
Winston churchill avenue to Winston churchill avenue E-E WBU 9 9 9 9 99.8 76.8 73.0 73.2 12.9 10.0 10.2 10.2 57.9 83.8 86.0 89.2 E F F F
Winston churchill avenue to Anglesea Road E-N WBR 166 166 166 165 99.8 76.8 73.0 73.2 12.9 10.0 10.2 10.2 50.6 47.3 48.4 48.7 D D D D
Anglesea Road to Wiltshire Street N-E SBL 43 42 43 43 75.1 75.3 75.8 133.3 1.7 9.2 9.1 9.2 28.3 32.3 35.2 34.3 D C D C
Anglesea Road to Waltham St N-S SBT 0 0 0 0 75.1 75.3 75.8 133.3 1.7 9.2 9.1 9.2 0.0 0.0 0.0 0.0 A A A A
Anglesea Road to Guildhall Walk N-NE SBL 17 17 16 16 75.1 75.3 75.8 133.3 1.7 9.2 9.1 9.2 11.1 16.7 18.6 18.4 B B B B
Anglesea Road to Cambridge Road N-SW SBR 172 172 171 171 75.1 75.3 75.8 133.3 1.7 9.2 9.1 9.2 32.5 40.3 41.5 41.5 D D D D
Anglesea Road to Hampshire Terrace N-S SBT 735 735 731 730 75.1 75.3 75.8 133.3 1.7 9.2 9.1 9.2 28.6 33.9 35.3 34.8 D C D C
Anglesea Road to Winston churchill avenue N-E SBL 100 101 100 100 75.1 75.3 75.8 133.3 1.7 9.2 9.1 9.2 10.2 16.3 17.0 17.0 B B B B
Anglesea Road to Anglesea Road N-N SBU 117 118 116 117 75.1 75.3 75.8 133.3 1.7 9.2 9.1 9.2 38.3 44.6 46.0 47.3 E D D D
All 2726 2731 2723 2720 186.7 224.9 223.6 224.7 6.1 9.8 10.1 10.3 29.2 36.2 37.0 37.3 D E E E
511 Park Road Park Road to Anglesea Road W-N EBL 229 229 229 229 116.6 132.3 132.3 132.3 18.8 19.5 19.5 19.5 51.7 53.3 53.3 53.3 D D D D
Anglesea Road SB to Park Road N-W SBR 174 175 175 174 228.3 231.4 230.3 231.4 40.4 39.8 38.0 41.5 69.6 70.4 64.6 70.1 E E E E
Anglesea Road SB to Anglesea Road SB N-S SBT 1184 1185 1180 1181 228.3 231.4 230.3 231.4 40.4 39.8 38.0 41.5 19.9 19.7 19.7 20.9 B B B C
Anglesea Road to Park Road S-W NBL 40 40 40 40 145.2 116.8 186.1 133.9 8.9 8.2 8.4 8.3 12.1 8.5 8.8 9.7 B A A A
Anglesea Road to Anglesea Road S-N NBT 967 966 966 965 145.2 116.8 186.1 133.9 8.9 8.2 8.4 8.3 10.9 9.7 9.7 9.8 B A A A
All 2594 2595 2591 2590 228.3 231.4 230.3 231.4 23.5 23.1 22.4 23.8 22.6 22.2 21.8 22.8 C C C C
512 Princess Royal Road Princess Royal Road to Mile end Road NB W-N EBL 613 612 613 614 224.0 223.6 224.0 223.2 50.0 38.4 37.7 38.1 49.5 42.8 42.3 42.9 D D D D
Mile end Road SB to Princess Royal Road NE-W WBT 92 93 93 93 31.8 27.7 26.2 28.5 3.3 3.1 3.0 3.1 32.7 33.7 31.0 33.7 C C C C
Mile end Road NB to Princess Royal Road S-W NBL 74 74 74 75 35.7 35.5 30.6 49.8 0.9 0.7 0.8 0.7 12.0 10.7 11.1 10.6 B B B B
Mile end Road NB to Mile end Road NB S-N NBT 2721 2673 2677 2669 229.4 224.1 221.6 224.4 30.7 26.6 26.2 26.2 15.4 14.0 13.9 13.8 B B B B
All 3501 3452 3457 3451 229.4 224.1 224.0 224.4 21.2 17.2 16.9 17.0 21.8 19.6 19.4 19.5 C B B B
0 NETWORK TOTALS All 41749 41703 41618 41599 236.0 235.8 235.9 232.8 17.8 17.1 14.9 16.6 26.2 28.4 25.9 27.5 D C C C
17
:00
-18
:00
26/09/2014 12:04 Node Evaluation Comparison.xlsm

501 Rudmore Roundabout M275 SB to M275 SB NW-S SBT 2015 2003 2003 2003 0.0 0.0 0.0 0.0 0.0 0.0 0.0 0.0 1.6 0.8 0.8 0.8 A A A A
M275 NB to M275 NB S-NW NBT 1474 1497 1493 1495 0.0 0.0 0.0 0.0 0.0 0.0 0.0 0.0 0.9 0.8 0.8 0.8 A A A A
A2047 Kingston Cresent to Wharf Road E-W WBT 29 29 29 29 74.6 52.8 52.8 56.7 4.9 1.0 1.0 1.0 5.4 10.3 10.2 10.3 A B B B
A2047 Kingston Cresent to M275 SB Service Road E-S WBL 74 74 74 74 74.6 52.8 52.8 56.7 4.9 1.0 1.0 1.0 2.1 3.5 3.5 3.5 A A A A
A2047 Kingston Cresent to A2047 Kingston Cresent E-SE WBL 0 0 0 0 74.6 52.8 52.8 56.7 4.9 1.0 1.0 1.0 0.0 0.0 0.0 0.0 A A A A
A2047 Kingston Cresent to A3 Twyford Avenue E-NE WBU 156 157 157 157 74.6 52.8 52.8 56.7 4.9 1.0 1.0 1.0 12.8 21.2 21.1 21.2 B C C C
A2047 Kingston Cresent to M275 NB Service Road E-NW WBR 336 336 336 336 74.6 52.8 52.8 56.7 4.9 1.0 1.0 1.0 11.7 17.8 17.7 17.9 B C C C
M275 SB Service Road to Wharf Road NW-W SBR 153 148 148 148 231.5 225.3 223.9 224.8 45.8 34.4 33.7 30.0 43.1 25.8 21.8 21.7 E D C C
M275 SB Service Road to A3 Twyford Avenue NW-NE SBL 290 272 273 273 231.5 225.3 223.9 224.8 45.8 34.4 33.7 30.0 87.0 48.2 46.7 40.1 F E E E
M275 SB Service Road to M275 NB Service Road NW-NW SBU 12 12 12 12 231.5 225.3 223.9 224.8 45.8 34.4 33.7 30.0 73.1 32.9 27.6 27.3 F D D D
M275 SB Service Road to A2047 Kingston Cresent NW-SE SBL 460 445 445 446 231.5 225.3 223.9 224.8 45.8 34.4 33.7 30.0 63.8 48.2 46.5 41.4 F E E E
M275 SB Service Road to M275 SB Service Road NW-S SBT 41 42 42 42 231.5 225.3 223.9 224.8 45.8 34.4 33.7 30.0 47.4 27.8 23.4 25.0 E D C C
A3 Twyford Avenue to Wharf Road NE-W WBT 4 4 4 4 192.8 224.0 224.0 224.0 4.1 10.8 10.8 10.7 20.0 34.3 34.3 34.1 C D D D
A3 Twyford Avenue to A3 Twyford Avenue NE-NE WBU 0 0 0 0 192.8 224.0 224.0 224.0 4.1 10.8 10.8 10.7 0.0 0.0 0.0 0.0 A A A A
A3 Twyford Avenue to M275 NB Service Road NE-NW WBR 168 166 166 166 192.8 224.0 224.0 224.0 4.1 10.8 10.8 10.7 19.5 43.2 43.2 43.2 C E E E
A3 Twyford Avenue to A2047 Kingston Cresent NE-SE WBR2 118 118 118 118 192.8 224.0 224.0 224.0 4.1 10.8 10.8 10.7 11.7 31.7 31.7 31.7 B D D D
A3 Twyford Avenue to M275 SB Service Road NE-S WBL 377 376 376 376 192.8 224.0 224.0 224.0 4.1 10.8 10.8 10.7 19.6 31.2 31.2 31.0 C D D D
Wharf Road to Wharf Road W-W EBU 2 2 2 2 43.8 22.0 22.0 25.0 0.9 0.1 0.1 0.1 20.8 104.5 104.6 88.7 C F F F
Wharf Road to A3 Twyford Avenue W-NE EBT 19 20 20 19 43.8 22.0 22.0 25.0 0.9 0.1 0.1 0.1 34.6 88.0 88.0 85.9 D F F F
Wharf Road to M275 NB Service Road W-NW EBL 128 124 124 127 43.8 22.0 22.0 25.0 0.9 0.1 0.1 0.1 28.0 26.8 26.8 27.8 D D D D
Wharf Road to A2047 Kingston Cresent W-SE EBR 29 28 28 28 43.8 22.0 22.0 25.0 0.9 0.1 0.1 0.1 37.1 116.5 116.4 114.2 E F F F
Wharf Road to M275 SB Service Road W-S EBR2 61 62 62 60 43.8 22.0 22.0 25.0 0.9 0.1 0.1 0.1 34.8 113.6 113.5 111.9 D F F F
M275 NB Service Road to Wharf Road S-W NBL 38 39 38 39 89.3 37.1 68.5 58.6 0.3 0.1 0.1 0.1 2.1 21.1 20.0 19.6 A C C C
M275 NB Service Road to A3 Twyford Avenue S-NE NBR2 303 301 301 300 89.3 37.1 68.5 58.6 0.3 0.1 0.1 0.1 15.6 24.6 25.4 25.2 C C D D
M275 NB Service Road to M275 BB Service Road S-NW NBT 55 54 54 54 89.3 37.1 68.5 58.6 0.3 0.1 0.1 0.1 5.3 20.1 21.2 20.6 A C C C
M275 NB Service Road to A2047 Kingston Cresent S-SE NBR 91 94 95 94 89.3 37.1 68.5 58.6 0.3 0.1 0.1 0.1 13.3 44.0 44.1 43.5 B E E E
M275 NB Service Road to M275 SB Service Road S-S NBU 5 5 4 5 89.3 37.1 68.5 58.6 0.3 0.1 0.1 0.1 11.3 37.0 35.2 34.7 B E E D
All 6438 6406 6403 6405 231.5 225.3 224.0 224.8 10.4 8.6 8.5 7.8 16.1 16.4 16.1 15.4 C C C C
502 Mile End Roundabout Mile End Road to Mile End Road N-N SBU 49 49 49 49 128.4 178.8 224.6 225.7 11.9 10.1 10.2 12.9 57.4 54.0 53.8 55.8 E D D E
Mile End Road to Commercial Road N-S SBT 1915 1904 1903 1911 128.4 178.8 224.6 225.7 11.9 10.1 10.2 12.9 12.9 12.7 12.4 14.3 B B B B
Mile End Road to Church Street N-E SBL 548 548 548 548 128.4 178.8 224.6 225.7 11.9 10.1 10.2 12.9 17.2 11.7 11.6 11.7 B B B B
Hope Street to Mile End Road SW-N NBT 1120 1120 1118 1120 224.2 178.6 200.9 177.4 13.8 13.6 13.0 13.7 14.4 14.0 13.6 14.1 B B B B
Hope Street to Mile End Road SW-N NBT 0 0 0 0 42.1 37.1 35.9 36.9 1.3 1.2 1.1 1.2 0.0 0.0 0.0 0.0 A A A A
Hope Street to Commercial Road SW-S NBU 39 39 39 39 42.1 37.1 35.9 36.9 1.3 1.2 1.1 1.2 98.6 98.8 96.9 97.5 F F F F
Hope Street to Church Street SW-E NBR 58 58 57 58 42.1 37.1 35.9 36.9 1.3 1.2 1.1 1.2 89.2 73.5 72.9 73.3 F E E E
Commercial Road to Mile End Road S-N NBT 261 261 262 265 26.9 22.7 24.3 36.1 0.4 0.3 0.3 0.3 34.1 36.4 36.0 35.9 C D D D
Commercial Road to Commercial Road S-S NBU 10 11 10 10 26.9 22.7 24.3 36.1 0.4 0.3 0.3 0.3 70.9 74.2 70.2 66.5 E E E E
Commercial Road to Church Street S-E NBR 15 15 15 16 26.9 22.7 24.3 36.1 0.4 0.3 0.3 0.3 70.0 54.3 51.3 50.4 E D D D
Church Street to Mile End Road E-N WBR 364 396 393 390 172.8 231.5 231.5 231.5 20.1 110.1 106.5 96.7 57.7 282.5 281.0 264.5 E F F F
Church Street to Commercial Road E-S WBL 20 22 22 22 172.8 231.5 231.5 231.5 20.1 110.1 106.5 96.7 52.8 376.9 410.3 395.8 D F F F
Church Street to Church Street E-E WBU 0 0 0 0 172.8 231.5 231.5 231.5 20.1 110.1 106.5 96.7 0.0 0.0 0.0 0.0 A A A A
All 4399 4422 4415 4428 224.2 231.5 231.5 231.5 8.8 29.1 28.3 26.7 21.5 42.7 42.1 41.5 C D D D
503 Cascade's Approach Cascade's Approach to Cascade's Approach S-SW NBL 0 0 0 0 46.2 39.2 34.2 37.6 0.8 0.7 0.7 0.7 0.0 0.0 0.0 0.0 A A A A
Cascade's Approach to Marketway WB S-E NBR 34 34 34 34 46.2 39.2 34.2 37.6 0.8 0.7 0.7 0.7 18.5 16.9 16.8 17.2 C C C C
Cascade's Approach to Marketway EB S-W NBL 4 4 4 3 46.2 39.2 34.2 37.6 0.8 0.7 0.7 0.7 9.9 15.0 14.4 12.6 A B B B
Marketway WB to Cascade's Approach NE-SW WBT 3 3 3 3 203.9 224.3 164.5 166.7 7.6 7.4 5.9 6.1 4.7 9.9 6.3 8.0 A A A A
Marketway WB to Marketway WB NE-E WBL 35 35 34 35 203.9 224.3 164.5 166.7 7.6 7.4 5.9 6.1 13.8 13.2 11.0 11.2 B B B B
Marketway WB to Marketway EB NE-W WBT 1654 1651 1654 1659 203.9 224.3 164.5 166.7 7.6 7.4 5.9 6.1 12.2 12.0 10.1 10.3 B B B B
Marketway EB to Cascade's Approach SW-SW EBU 0 0 0 0 39.7 94.0 31.5 22.7 0.1 0.2 0.1 0.1 0.0 0.0 0.0 0.0 A A A A
Marketway EB to Hope Street SW-N EBL 1044 1042 1042 1042 0.0 0.0 0.0 0.0 0.0 0.0 0.0 0.0 2.5 2.5 2.6 2.6 A A A A
Marketway WB to Marketway EB NE-W WBT 21 21 21 21 0.0 0.0 0.0 12.3 0.0 0.0 0.0 0.0 5.6 4.9 3.8 3.8 A A A A
Marketway EB to Marketway WB SW-E EBT 146 147 147 148 39.7 94.0 31.5 22.7 0.1 0.2 0.1 0.1 3.6 3.7 3.6 3.8 A A A A
Marketway EB to Marketway EB SW-W NBL 24 20 20 20 39.7 94.0 31.5 22.7 0.1 0.2 0.1 0.1 3.5 4.4 4.5 4.0 A A A A
All 2964 2957 2960 2966 203.9 224.3 164.5 166.7 2.3 2.3 1.8 1.9 8.3 8.2 7.1 7.3 A A A A
504 Marketway Roundabout Commercial Road NB to Commercial Road SB S-N NBT 4 4 4 4 37.6 38.0 37.9 38.3 1.9 1.8 1.7 1.8 39.6 40.9 40.7 38.6 E E E E
Commercial Road NB to Marketway S-W NBL 8 8 8 8 37.6 38.0 37.9 38.3 1.9 1.8 1.7 1.8 47.2 46.8 44.5 44.0 E E E E
Commercial Road NB to Cornmill street S-SE NBR 6 6 6 6 37.6 38.0 37.9 38.3 1.9 1.8 1.7 1.8 19.5 20.8 19.5 20.6 C C C C
Commercial Road SB to Commercial Road SB N-N SBU 9 9 9 9 162.0 205.1 191.4 204.9 6.5 5.2 4.2 4.9 14.2 14.4 15.4 14.6 B B C B
Commercial Road SB to Marketway N-W SBR 1566 1561 1561 1566 162.0 205.1 191.4 204.9 6.5 5.2 4.2 4.9 16.6 16.9 15.8 15.9 C C C C
Commercial Road SB to Cornmill street N-SE SBT 428 425 424 427 162.0 205.1 191.4 204.9 6.5 5.2 4.2 4.9 11.4 11.0 10.6 10.7 B B B B
Marketway to Commercial Road SB W-N EBL 93 95 95 96 54.0 42.0 48.8 63.9 0.3 0.3 0.3 0.5 7.9 8.1 6.9 7.5 A A A A
Marketway to Marketway W-W EBU 1 2 1 2 54.0 42.0 48.8 63.9 0.3 0.3 0.3 0.5 5.3 7.4 4.5 10.6 A A A B
Marketway to Cornmill street W-SE EBT 88 87 88 87 54.0 42.0 48.8 63.9 0.3 0.3 0.3 0.5 10.0 9.9 8.9 9.5 A A A A
Cornmill street to Commercial Road NB E-SW WBT 12 12 12 12 53.2 54.2 20.8 94.3 0.3 0.3 0.1 0.4 0.4 1.1 0.4 0.6 A A A A
Cornmill street to Commercial Road SB E-N WBR 179 180 180 183 67.4 68.5 35.0 108.5 2.5 2.4 2.2 2.5 12.9 12.7 11.7 12.5 B B B B
Cornmill street to Marketway E-W WBT 124 123 123 123 67.4 68.5 35.0 108.5 2.5 2.4 2.2 2.5 12.4 12.4 11.6 12.3 B B B B
Cornmill street to Cornmill street E-SE WBL 0 0 0 0 67.4 68.5 35.0 108.5 2.5 2.4 2.2 2.5 0.0 0.0 0.0 0.0 A A A A
All 2519 2512 2512 2522 162.0 205.1 191.4 204.9 2.6 2.3 2.0 2.2 14.7 14.9 13.9 14.1 B B B B
505 A2030 roundabout Lake Road NB to Lake Road NB SW-W NBL 0 0 0 0 14.5 16.1 12.7 77.9 0.0 0.0 0.0 0.2 0.0 0.0 0.0 0.0 A A A A
Lake Road NB to Cornmill street SW-NW EBL 107 105 106 107 14.5 16.1 12.7 77.9 0.0 0.0 0.0 0.2 2.1 1.8 1.4 4.0 A A A A
Lake Road NB to Lake Road SB SW-E EBT 59 60 59 59 14.5 16.1 12.7 77.9 0.0 0.0 0.0 0.2 1.6 2.0 1.7 3.5 A A A A
Cornmill street to Lake Road NB NW-W SBR 35 37 36 36 15.9 15.9 15.9 15.9 0.4 0.4 0.4 0.4 4.1 4.1 3.8 3.9 A A A A
Cornmill street to Cornmill street NW-NW SBU 12 12 12 12 15.9 15.9 15.9 15.9 0.4 0.4 0.4 0.4 4.5 4.6 3.6 3.7 A A A A
Cornmill street to Lake Road SB NW-E SBL 477 471 472 474 15.9 15.9 15.9 15.9 0.4 0.4 0.4 0.4 3.9 4.0 3.9 3.9 A A A A
Lake Road SB to Lake Road NB E-W WBT 8 8 8 8 35.0 39.6 31.4 31.5 0.4 0.4 0.5 0.4 4.8 4.9 5.2 4.8 A A A A
Lake Road SB to Cornmill street E-NW WBT 194 195 195 196 35.0 39.6 31.4 31.5 0.4 0.4 0.5 0.4 4.3 4.1 4.0 4.5 A A A A
Lake Road SB to Lake Road SB E-E WBU 0 0 0 0 35.0 39.6 31.4 31.5 0.4 0.4 0.5 0.4 0.0 0.0 0.0 0.0 A A A A
All 891 889 888 891 35.0 39.6 31.4 77.9 0.3 0.3 0.3 0.3 3.6 3.7 3.5 4.0 A A A A
506 Holbrook Road Roundabout Lake Road SB to Lake Road SB NE-E WBL 4 4 4 4 223.7 162.3 81.5 147.5 10.8 9.5 0.4 10.3 10.4 11.3 7.7 13.1 B B A B
Lake Road SB to Holbrook Road NE-S WBR 204 204 203 204 223.7 162.3 81.5 147.5 10.8 9.5 0.4 10.3 21.3 19.7 11.4 20.2 C C B C
Lake Road SB to Church Street NE-NW WBR 51 50 50 50 223.7 162.3 81.5 147.5 10.8 9.5 0.4 10.3 19.7 20.9 10.3 21.7 C C B C
Lake Road SB to Lake Road NB NE-W WBT 118 118 117 118 223.7 162.3 81.5 147.5 10.8 9.5 0.4 10.3 24.5 22.8 13.4 23.5 C C B C
Holbrook Road to Lake Road SB SE-E NBR 207 207 207 207 109.2 196.2 79.3 64.9 1.4 1.4 1.4 1.1 8.8 9.2 8.8 8.7 A A A A
Holbrook Road to Holbrook Road SE-S NBL 0 0 0 0 109.2 196.2 79.3 64.9 1.4 1.4 1.4 1.1 1.7 1.4 3.4 2.3 A A A A
Holbrook Road to Church Street SE-NW NBT 303 303 303 302 109.2 196.2 79.3 64.9 1.4 1.4 1.4 1.1 8.1 8.2 8.1 7.9 A A A A
Holbrook Road to Lake Road NB SE-W NBL 78 78 78 78 109.2 196.2 79.3 64.9 1.4 1.4 1.4 1.1 4.1 4.6 4.4 4.3 A A A A
Church Street to Lake Road SB NW-E SBL 53 54 53 53 163.8 177.3 64.5 208.2 8.9 7.2 0.2 7.1 21.6 39.8 22.7 25.9 C E C D
Church Street to Holbrook Road NW-S SBT 321 329 326 327 163.8 177.3 64.5 208.2 8.9 7.2 0.2 7.1 21.9 34.0 26.3 30.9 C D D D
Church Street to Church Street NW-NW SBU 0 0 0 0 163.8 177.3 64.5 208.2 8.9 7.2 0.2 7.1 0.0 0.0 0.0 0.0 A A A A
Church Street to Lake Road NB NW-W SBR 3 4 4 4 163.8 177.3 64.5 208.2 8.9 7.2 0.2 7.1 29.5 29.6 55.1 59.5 D D F F
Lake Road NB to Lake Road SB SW-E EBT 156 155 155 155 223.6 225.3 224.3 182.0 10.5 11.3 9.9 9.7 15.1 15.9 14.9 14.3 C C B B
Lake Road NB to Holbrook Road SW-S EBR 380 378 377 379 223.6 225.3 224.3 182.0 10.5 11.3 9.9 9.7 16.0 16.7 15.3 15.3 C C C C
Lake Road NB to Church Street SW-NW EBL 4 4 4 4 223.6 225.3 224.3 182.0 10.5 11.3 9.9 9.7 12.2 15.2 13.7 13.3 B C B B
Lake Road NB to Lake Road NB SW-W NBL 1 1 1 1 223.6 225.3 224.3 182.0 10.5 11.3 9.9 9.7 13.5 14.0 17.8 12.8 B B C B
All 1882 1889 1882 1886 223.7 225.3 224.3 208.2 7.9 7.3 3.0 7.1 15.8 18.5 14.5 17.2 C C B C
507 Unicorn Road Unicorn Road WB to Market Way NW-NE SBL 11 11 11 11 13.2 14.9 14.9 14.4 0.6 0.6 0.5 0.6 38.2 43.7 38.5 41.4 D D D D
Unicorn Road WB to Unicorn Road EB NW-S SBT 5 4 5 4 13.9 16.9 18.5 18.1 0.8 0.7 0.9 0.8 39.9 37.1 45.4 47.6 D D D D
Unicorn Road WB to Alfred Road NW-SW SBR 11 13 12 12 13.9 16.9 18.5 18.1 0.8 0.7 0.9 0.8 44.4 41.3 46.5 39.4 D D D D
Market Way to Unicorn Road WB NE-NW WBR 12 11 11 11 217.8 217.5 215.0 216.8 2.9 3.1 3.3 3.6 17.1 17.3 17.7 17.6 B B B B
Market Way to Unicorn Road EB NE-S WBU 297 302 303 304 217.8 217.5 215.0 216.8 2.9 3.1 3.3 3.6 6.4 6.6 6.6 6.7 A A A A
Market Way to Alfred Road NE-SW WBT 1406 1393 1398 1397 217.8 217.5 215.0 216.8 2.9 3.1 3.3 3.6 10.3 10.3 10.1 10.1 B B B B
Unicorn Road EB to Unicorn Road WB S-NW NBT 2 2 2 2 73.6 74.4 67.7 74.1 5.4 5.3 5.5 5.3 25.4 23.3 21.8 16.3 C C C B
Unicorn Road EB to Market Way S-NE NBR 115 114 114 114 73.6 74.4 67.7 74.1 5.4 5.3 5.5 5.3 31.5 31.2 32.1 31.3 C C C C
Unicorn Road EB to Alfred Road S-SW NBL 25 25 25 25 53.3 58.3 52.4 36.0 1.0 1.1 1.2 1.1 29.1 28.9 31.5 30.2 C C C C
Alfred Road to Unicorn Road WB SW-NW EBL 7 7 7 7 138.8 164.6 131.5 126.5 6.7 6.8 6.3 7.0 8.0 9.8 7.6 10.9 A A A B
Alfred Road to Market Way SW-NE EBT 1092 1084 1088 1086 138.8 164.6 131.5 126.5 6.7 6.8 6.3 7.0 8.7 8.7 8.4 9.0 A A A A
All 2982 2967 2975 2974 217.8 217.5 215.0 216.8 3.3 3.3 3.4 3.5 10.6 10.6 10.5 10.7 B B B B
508 Stanhope Road Stanhope Road to Stanhope Road S-S NBU 0 0 0 0 20.9 21.6 20.5 40.9 0.0 0.1 0.1 0.1 0.0 0.0 0.0 0.0 A A A A
Stanhope Road to Edinburgh Road WB S-SE NBR 0 0 0 0 20.9 21.6 20.5 40.9 0.0 0.1 0.1 0.1 0.0 0.0 0.0 0.0 A A A A
Stanhope Road to Unicorn road S-N NBT 118 118 118 118 20.9 21.6 20.5 40.9 0.0 0.1 0.1 0.1 3.8 3.8 3.8 3.9 A A A A
Stanhope Road to Edinburgh Road EB S-W NBL 8 8 8 8 20.9 21.6 20.5 40.9 0.0 0.1 0.1 0.1 12.6 12.9 12.9 13.2 B B B B
Edinburgh Road WB to Stanhope Road E-S WBL 15 15 15 15 46.5 40.0 39.6 39.5 0.2 0.3 0.2 0.3 8.8 8.0 8.0 8.1 A A A A
Edinburgh Road WB to Edinburgh Road WB E-SE WBL 0 0 0 0 46.5 40.0 39.6 39.5 0.2 0.3 0.2 0.3 0.0 0.0 0.0 0.0 A A A A
Edinburgh Road WB to Unicorn road E-N WBR 22 21 22 22 46.5 40.0 39.6 39.5 0.2 0.3 0.2 0.3 13.6 14.5 14.0 14.3 B B B B
Edinburgh Road WB to Edinburgh Road EB E-W WBT 42 42 42 42 46.5 40.0 39.6 39.5 0.2 0.3 0.2 0.3 13.3 13.4 13.8 13.6 B B B B
Unicorn road to Stanhope Road N-S SBT 274 271 273 274 44.1 27.2 34.1 29.8 0.0 0.0 0.0 0.0 0.9 0.9 0.9 0.9 A A A A
Unicorn road to Edinburgh Road WB N-SE SBT 20 20 20 20 44.1 27.2 34.1 29.8 0.0 0.0 0.0 0.0 1.7 1.8 1.8 1.7 A A A A
Unicorn road to Unicorn road N-N SBU 0 0 0 0 44.1 27.2 34.1 29.8 0.0 0.0 0.0 0.0 0.0 0.0 0.0 0.0 A A A A
Unicorn road to Edinburgh Road EB N-W SBR 8 16 16 16 44.1 27.2 34.1 29.8 0.0 0.0 0.0 0.0 1.1 1.2 1.0 0.9 A A A A
Edinburgh Road EB to Stanhope Road W-S EBR 4 4 4 4 30.8 27.4 28.7 27.8 0.0 0.0 0.0 0.0 17.0 17.0 17.2 16.9 C C C C
Edinburgh Road EB to Edinburgh Road WB W-SE EBT 12 12 12 12 30.8 27.4 28.7 27.8 0.0 0.0 0.0 0.0 9.6 10.2 9.9 10.0 A B A A
Edinburgh Road EB to Unicorn road W-N EBL 0 1 1 1 30.8 27.4 28.7 27.8 0.0 0.0 0.0 0.0 2.0 2.5 2.4 2.4 A A A A
Edinburgh Road EB to Edinburgh Road EB W-W EBU 0 0 0 0 30.8 27.4 28.7 27.8 0.0 0.0 0.0 0.0 0.0 0.0 0.0 0.0 A A A A
All 523 529 531 532 46.5 40.0 39.6 40.9 0.1 0.1 0.1 0.1 3.8 3.8 3.9 3.9 A A A A
509 Queen Street Queen St to Alfred Road W-NE EBL 274 270 269 270 59.0 67.2 67.2 67.2 7.1 8.5 8.5 8.5 22.9 27.3 27.3 27.3 C C C C
Queen St to Bishop Crispian Way W-E EBT 16 17 17 17 42.7 62.4 62.4 62.4 2.0 3.4 3.4 3.4 53.4 53.9 53.9 53.9 D D D D
Alfred Road to Queen St NE-W WBT 317 308 307 310 224.8 224.7 224.6 224.3 28.3 27.5 24.1 26.6 47.2 47.9 44.3 46.1 D D D D
Alfred Road to Anglesea Road NE-S WBR 1128 1131 1130 1130 223.7 223.8 221.8 224.3 5.9 6.1 5.4 6.4 7.9 7.9 7.2 8.0 A A A A
Bishop Crispian Way to Queen St E-W WBT 59 67 67 67 52.6 70.3 76.9 77.6 6.9 7.8 7.4 7.7 55.0 56.5 54.5 55.7 E E D E
Anglesea Road to Queen St S-W NBL 29 29 29 29 29.2 80.1 68.2 84.7 0.3 0.5 0.4 0.5 12.1 14.1 13.6 13.9 B B B B
Anglesea Road to Alfred Road S-NE NBR 818 818 817 817 108.0 91.4 97.1 105.2 8.3 8.5 8.8 8.5 13.7 14.1 14.5 14.2 B B B B
All 2641 2639 2637 2638 224.8 224.7 224.6 224.3 8.4 8.9 8.3 8.8 17.4 18.1 17.4 18.0 B B B B
510 St Michael's Gyratory St Paul's Road to Wiltshire Street S-E NBR 0 0 0 0 24.3 27.0 26.3 27.4 0.3 0.2 0.3 0.3 0.0 0.0 0.0 0.0 A A A A
St Paul's Road to Waltham St S-S NBU 0 0 0 0 24.3 27.0 26.3 27.4 0.3 0.2 0.3 0.3 0.0 0.0 0.0 0.0 A A A A
St Paul's Road to Guildhall Walk S-NE NBT 0 0 0 0 24.3 27.0 26.3 27.4 0.3 0.2 0.3 0.3 0.0 0.0 0.0 0.0 A A A A
St Paul's Road to Cambridge Road S-SW NBL 0 0 0 0 24.3 27.0 26.3 27.4 0.3 0.2 0.3 0.3 0.0 0.0 0.0 0.0 A A A A
St Paul's Road to Hampshire Terrace S-S NBU 0 0 0 0 24.3 27.0 26.3 27.4 0.3 0.2 0.3 0.3 0.0 0.0 0.0 0.0 A A A A
St Paul's Road to Winston churchill avenue S-E NBR 0 0 0 0 24.3 27.0 26.3 27.4 0.3 0.2 0.3 0.3 0.0 0.0 0.0 0.0 A A A A
St Paul's Road to Anglesea Road S-N NBT 60 60 60 60 24.3 27.0 26.3 27.4 0.3 0.2 0.3 0.3 11.0 12.1 12.2 12.3 B B B B
Cambridge Road to Wiltshire Street SW-E EBT 1 1 1 1 77.9 79.3 79.3 79.3 1.0 1.4 1.4 1.4 15.7 23.3 19.5 19.5 B C B B
Cambridge Road to Waltham St SW-S EBR 0 0 0 0 77.9 79.3 79.3 79.3 1.0 1.4 1.4 1.4 0.0 0.0 0.0 0.0 A A A A
Cambridge Road to Guildhall Walk SW-NE EBT 16 16 16 16 77.9 79.3 79.3 79.3 1.0 1.4 1.4 1.4 17.4 37.0 37.2 36.9 B D D D
Cambridge Road to Cambridge Road SW-SW EBU 1 1 1 1 77.9 79.3 79.3 79.3 1.0 1.4 1.4 1.4 24.7 38.8 37.1 33.8 C D D C
Cambridge Road to Hampshire Terrace SW-S EBR 8 8 8 8 77.9 79.3 79.3 79.3 1.0 1.4 1.4 1.4 23.1 42.8 39.2 37.6 C D D D
Cambridge Road to Winston churchill avenue SW-E EBT 131 130 130 131 77.9 79.3 79.3 79.3 1.0 1.4 1.4 1.4 17.1 39.8 40.2 39.6 B D D D
Cambridge Road to Anglesea Road SW-N EBL 220 221 221 221 77.9 79.3 79.3 79.3 1.0 1.4 1.4 1.4 7.6 6.6 6.7 6.5 A A A A
Hampshire Terrace to Wiltshire Street S-E NBR 0 0 0 0 119.0 146.1 159.0 167.5 4.2 5.4 5.5 5.2 0.0 0.0 0.0 0.0 A A A A
Hampshire Terrace to Waltham St S-S NBU 0 0 0 0 119.0 146.1 159.0 167.5 4.2 5.4 5.5 5.2 0.0 0.0 0.0 0.0 A A A A
Hampshire Terrace to Guildhall Walk S-NE NBT 10 10 10 10 119.0 146.1 159.0 167.5 4.2 5.4 5.5 5.2 24.0 49.5 48.8 46.5 C E E E
Hampshire Terrace to Cambridge Road S-SW NBL 17 16 16 16 119.0 146.1 159.0 167.5 4.2 5.4 5.5 5.2 15.9 20.0 19.5 18.5 C C C C
Hampshire Terrace to Hampshire Terrace S-S NBU 5 5 5 5 119.0 146.1 159.0 167.5 4.2 5.4 5.5 5.2 32.4 51.7 48.7 50.0 D F E E
Hampshire Terrace to Winston churchill avenue S-E NBR 53 52 52 52 119.0 146.1 159.0 167.5 4.2 5.4 5.5 5.2 24.7 49.9 50.4 50.0 C E F E
Hampshire Terrace to Anglesea Road S-N NBT 323 322 322 322 119.0 146.1 159.0 167.5 4.2 5.4 5.5 5.2 15.7 18.1 18.4 17.9 C C C C
Winston churchill avenue to Wiltshire Street E-E WBU 4 4 4 4 53.0 59.1 55.9 62.6 8.6 6.3 6.3 6.3 29.0 21.7 27.9 20.0 C C C B
Winston churchill avenue to Waltham St E-S WBL 12 12 12 12 53.0 59.1 55.9 62.6 8.6 6.3 6.3 6.3 24.4 16.4 17.4 15.4 C B B B
Winston churchill avenue to Guildhall Walk E-NE WBR 11 11 11 11 53.0 59.1 55.9 62.6 8.6 6.3 6.3 6.3 46.1 62.2 61.5 66.8 D E E E
Winston churchill avenue to Cambridge Road E-SW WBT 160 159 158 159 53.0 59.1 55.9 62.6 8.6 6.3 6.3 6.3 36.6 33.4 33.2 32.9 D C C C
Winston churchill avenue to Hampshire Terrace E-S WBL 111 111 111 111 53.0 59.1 55.9 62.6 8.6 6.3 6.3 6.3 30.0 23.0 23.0 23.6 C C C C
Winston churchill avenue to Winston churchill avenue E-E WBU 13 13 13 13 53.0 59.1 55.9 62.6 8.6 6.3 6.3 6.3 43.3 62.0 68.3 64.8 D E E E
Winston churchill avenue to Anglesea Road E-N WBR 95 95 94 94 53.0 59.1 55.9 62.6 8.6 6.3 6.3 6.3 38.3 33.4 33.3 33.3 D C C C
Anglesea Road to Wiltshire Street N-E SBL 36 36 36 36 80.7 73.0 83.8 74.6 1.0 6.5 6.4 6.5 20.0 24.6 24.2 24.6 C C C C
Anglesea Road to Waltham St N-S SBT 0 0 0 0 80.7 73.0 83.8 74.6 1.0 6.5 6.4 6.5 0.0 0.0 0.0 0.0 A A A A
Anglesea Road to Guildhall Walk N-NE SBL 4 4 4 4 80.7 73.0 83.8 74.6 1.0 6.5 6.4 6.5 7.2 13.5 13.7 10.3 A B B B
Anglesea Road to Cambridge Road N-SW SBR 178 180 179 180 80.7 73.0 83.8 74.6 1.0 6.5 6.4 6.5 24.0 31.0 30.7 30.5 C C C C
Anglesea Road to Hampshire Terrace N-S SBT 601 602 601 605 80.7 73.0 83.8 74.6 1.0 6.5 6.4 6.5 20.1 25.3 25.2 24.9 C C C C
Anglesea Road to Winston churchill avenue N-E SBL 70 72 71 72 80.7 73.0 83.8 74.6 1.0 6.5 6.4 6.5 8.2 14.6 14.1 15.4 A B B B
Anglesea Road to Anglesea Road N-N SBU 26 27 27 27 80.7 73.0 83.8 74.6 1.0 6.5 6.4 6.5 26.0 33.5 31.2 31.4 D C C C
All 2165 2167 2164 2170 119.0 146.1 159.0 167.5 3.0 4.0 4.0 3.9 20.7 25.1 25.1 24.9 C D D C
511 Park Road Park Road to Anglesea Road W-N EBL 192 192 192 192 80.3 81.0 81.0 81.0 9.3 9.6 9.6 9.6 32.8 33.8 33.8 33.8 C C C C
Anglesea Road SB to Park Road N-W SBR 217 217 217 218 224.7 217.1 222.1 223.3 13.4 14.2 13.7 14.0 34.4 36.3 35.4 36.9 C D D D
Anglesea Road SB to Anglesea Road SB N-S SBT 914 915 914 917 224.7 217.1 222.1 223.3 13.4 14.2 13.7 14.0 7.1 7.3 7.3 7.4 A A A A
Anglesea Road to Park Road S-W NBL 55 55 55 55 83.0 79.9 69.1 77.4 5.7 5.4 5.4 5.3 11.3 9.0 9.7 9.5 B A A A
Anglesea Road to Anglesea Road S-N NBT 643 639 639 639 83.0 79.9 69.1 77.4 5.7 5.4 5.4 5.3 10.0 9.3 9.3 9.2 A A A A
All 2020 2018 2017 2020 224.7 217.1 222.1 223.3 9.5 9.8 9.6 9.6 13.5 13.6 13.6 13.7 B B B B
512 Princess Royal Road Princess Royal Road to Mile end Road NB W-N EBL 224 224 225 224 100.3 92.3 85.8 63.6 5.8 5.1 5.0 4.9 20.6 19.7 19.6 19.1 C B B B
Mile end Road SB to Princess Royal Road NE-W WBT 67 66 66 66 24.3 26.0 20.4 19.8 1.2 1.1 1.2 1.1 17.1 16.9 17.7 16.7 B B B B
Mile end Road NB to Princess Royal Road S-W NBL 77 78 77 77 25.3 31.7 31.9 25.8 0.4 0.5 0.4 0.5 6.1 6.0 5.9 6.1 A A A A
Mile end Road NB to Mile end Road NB S-N NBT 1723 1756 1750 1754 106.1 100.5 94.5 97.1 6.0 6.0 5.9 5.9 7.3 7.2 7.2 7.2 A A A A
All 2090 2123 2118 2121 106.1 100.5 94.5 97.1 3.4 3.2 3.1 3.1 9.0 8.8 8.8 8.7 A A A A
0 Network Total All 31514 31517 31501 31553 231.5 231.5 231.5 231.5 5.1 6.5 5.9 6.1 14.7 18.3 17.6 17.6 B B B B
114304 113987 114033 114014 236.0 236.0 235.9 235.9 12.9 12.9 11.5 12.5 22.7 24.8 23.4 24.0 C C C C
18
:00
-19
:00
Overall Total
26/09/2014 12:04 Node Evaluation Comparison.xlsm

0
50
100
150
200
250
300
350
400
450
Winston ChurchillAvenue
Anglesea Road Queen Street (NB) Cascade's Approach Marketway Roundabout Mile End Roundabout Princess Royal Road
Avera
ge T
ravel T
ime (
sec)
Location
1600-1700 Northbound Travel Time Comparison
Base
DM
DS1
DS2

0
50
100
150
200
250
300
350
400
450
Winston ChurchillAvenue
Anglesea Road Queen Street (NB) Cascade's Approach Marketway Roundabout Mile End Roundabout Princess Royal Road
Avera
ge T
ravel T
ime (
sec)
Location
1700-1800 Northbound Travel Time Comparison
Base
DM
DS1
DS2

0
50
100
150
200
250
300
350
400
450
Winston ChurchillAvenue
Anglesea Road Queen Street (NB) Cascade's Approach Marketway Roundabout Mile End Roundabout Princess Royal Road
Avera
ge T
ravel T
ime (
sec)
Location
1800-1900 Northbound Travel Time Comparison
Base
DM
DS1
DS2

0
50
100
150
200
250
300
350
400
450
Winston ChurchillAvenue
Anglesea Road Queen Street (NB) Cascade's Approach Marketway Roundabout Mile End Roundabout Princess Royal Road
Avera
ge T
ravel T
ime (
sec)
Location
1600-1700 Southbound Travel Time Comparison
Base
DM
DS1
DS2

0
50
100
150
200
250
300
350
400
450
Winston ChurchillAvenue
Anglesea Road Queen Street (NB) Cascade's Approach Marketway Roundabout Mile End Roundabout Princess Royal Road
Avera
ge T
ravel T
ime (
sec)
Location
1700-1800 Southbound Travel Time Comparison
Base
DM
DS1
DS2

0
50
100
150
200
250
300
350
400
450
Winston ChurchillAvenue
Anglesea Road Queen Street (NB) Cascade's Approach Marketway Roundabout Mile End Roundabout Princess Royal Road
Avera
ge T
ravel T
ime (
sec)
Location
1800-1900 Southbound Travel Time Comparison
Base
DM
DS1
DS2

58
Portsmouth Corridor 1 Air Quality Management Area VISSIM Model Assessment
H. 2013 Inter Peak Comparison Results

Portsmouth AQMA - Corridor 1 - 2013 Inter Peak Comparison
Time Node Description Direction Movement Base DM DS1 DS2 Base DM DS1 DS2 Base DM DS1 DS2 Base DM DS1 DS2 Base DM DS1 DS2
501 Rudmore Roundabout M275 SB to M275 SB NW-S SBT 1435 1435 1435 1435 0.0 0.0 0.0 0.0 0.0 0.0 0.0 0.0 0.9 0.6 0.6 0.6 A A A A
M275 NB to M275 NB S-NW NBT 1304 1305 1305 1306 0.0 0.0 0.0 0.0 0.0 0.0 0.0 0.0 0.8 0.7 0.7 0.6 A A A A
A2047 Kingston Cresent to Wharf Road E-W WBT 21 21 21 21 78.2 39.8 39.8 39.2 5.9 0.5 0.5 0.5 7.2 8.2 8.2 7.9 A A A A
A2047 Kingston Cresent to M275 SB Service Road E-S WBL 95 95 95 95 78.2 39.8 39.8 39.2 5.9 0.5 0.5 0.5 2.4 4.0 3.9 3.9 A A A A
A2047 Kingston Cresent to A2047 Kingston Cresent E-SE WBL 0 0 0 0 78.2 39.8 39.8 39.2 5.9 0.5 0.5 0.5 0.0 0.0 0.0 0.0 A A A A
A2047 Kingston Cresent to A3 Twyford Avenue E-NE WBU 129 129 129 129 78.2 39.8 39.8 39.2 5.9 0.5 0.5 0.5 14.6 24.9 24.9 24.9 B C C C
A2047 Kingston Cresent to M275 NB Service Road E-NW WBR 300 299 299 299 78.2 39.8 39.8 39.2 5.9 0.5 0.5 0.5 13.2 11.9 12.0 12.1 B B B B
M275 SB Service Road to Wharf Road NW-W SBR 126 125 125 125 141.2 60.2 60.2 60.2 4.6 5.1 5.1 5.1 7.0 13.3 13.2 13.2 A B B B
M275 SB Service Road to A3 Twyford Avenue NW-NE SBL 111 109 109 109 141.2 60.2 60.2 60.2 4.6 5.1 5.1 5.1 16.3 13.1 13.1 13.1 C B B B
M275 SB Service Road to M275 NB Service Road NW-NW SBU 25 25 25 25 141.2 60.2 60.2 60.2 4.6 5.1 5.1 5.1 7.3 18.3 18.3 18.4 A C C C
M275 SB Service Road to A2047 Kingston Cresent NW-SE SBL 224 222 222 222 141.2 60.2 60.2 60.2 4.6 5.1 5.1 5.1 17.2 13.6 13.6 13.6 C B B B
M275 SB Service Road to M275 SB Service Road NW-S SBT 74 73 73 73 141.2 60.2 60.2 60.2 4.6 5.1 5.1 5.1 13.0 13.5 13.5 13.5 B B B B
A3 Twyford Avenue to Wharf Road NE-W WBT 22 22 22 22 86.5 223.9 223.9 224.5 2.6 16.4 16.5 15.0 14.1 46.0 45.7 44.5 B E E E
A3 Twyford Avenue to A3 Twyford Avenue NE-NE WBU 21 21 21 21 86.5 223.9 223.9 224.5 2.6 16.4 16.5 15.0 16.4 67.2 67.8 66.7 C F F F
A3 Twyford Avenue to M275 NB Service Road NE-NW WBR 92 92 92 92 86.5 223.9 223.9 224.5 2.6 16.4 16.5 15.0 16.1 48.1 48.4 47.7 C E E E
A3 Twyford Avenue to A2047 Kingston Cresent NE-SE WBR2 115 118 118 118 86.5 223.9 223.9 224.5 2.6 16.4 16.5 15.0 13.3 45.8 45.8 42.5 B E E E
A3 Twyford Avenue to M275 SB Service Road NE-S WBL 429 433 433 434 86.5 223.9 223.9 224.5 2.6 16.4 16.5 15.0 19.1 43.5 43.4 41.5 C E E E
Wharf Road to Wharf Road W-W EBU 4 5 5 5 85.0 66.1 66.1 66.1 2.5 0.4 0.4 0.5 52.5 81.0 80.9 80.0 F F F F
Wharf Road to A3 Twyford Avenue W-NE EBT 21 21 21 21 85.0 66.1 66.1 66.1 2.5 0.4 0.4 0.5 41.1 62.5 62.5 66.3 E F F F
Wharf Road to M275 NB Service Road W-NW EBL 95 95 95 95 85.0 66.1 66.1 66.1 2.5 0.4 0.4 0.5 27.3 27.9 27.9 27.3 D D D D
Wharf Road to A2047 Kingston Cresent W-SE EBR 14 14 14 14 85.0 66.1 66.1 66.1 2.5 0.4 0.4 0.5 49.2 77.2 77.2 76.7 E F F F
Wharf Road to M275 SB Service Road W-S EBR2 56 56 56 57 85.0 66.1 66.1 66.1 2.5 0.4 0.4 0.5 43.7 75.5 75.5 77.0 E F F F
M275 NB Service Road to Wharf Road S-W NBL 53 52 53 53 82.9 42.8 62.0 64.8 0.2 0.1 0.1 0.1 2.0 17.9 17.7 17.7 A C C C
M275 NB Service Road to A3 Twyford Avenue S-NE NBR2 263 264 264 265 82.9 42.8 62.0 64.8 0.2 0.1 0.1 0.1 13.1 21.8 22.3 22.7 B C C C
M275 NB Service Road to M275 BB Service Road S-NW NBT 84 84 85 84 82.9 42.8 62.0 64.8 0.2 0.1 0.1 0.1 6.2 20.9 21.3 21.1 A C C C
M275 NB Service Road to A2047 Kingston Cresent S-SE NBR 114 116 116 115 82.9 42.8 62.0 64.8 0.2 0.1 0.1 0.1 12.0 21.9 21.9 21.6 B C C C
M275 NB Service Road to M275 SB Service Road S-S NBU 4 4 4 4 82.9 42.8 62.0 64.8 0.2 0.1 0.1 0.1 11.5 18.3 17.2 18.4 B C C C
All 5230 5235 5236 5238 141.2 223.9 223.9 224.5 2.9 4.2 4.2 3.9 7.7 13.1 13.1 12.9 A B B B
502 Mile End Roundabout Mile End Road to Mile End Road N-N SBU 113 113 113 113 70.6 79.7 79.7 95.1 4.3 4.2 4.2 5.2 47.1 47.2 47.0 47.8 D D D D
Mile End Road to Commercial Road N-S SBT 1454 1454 1454 1454 70.6 79.7 79.7 95.1 4.3 4.2 4.2 5.2 7.2 7.7 7.6 8.6 A A A A
Mile End Road to Church Street N-E SBL 403 403 403 403 70.6 79.7 79.7 95.1 4.3 4.2 4.2 5.2 9.9 8.1 8.1 8.1 A A A A
Hope Street to Mile End Road SW-N NBT 1110 1107 1108 1110 103.6 117.4 122.3 133.9 7.9 7.9 7.8 7.9 9.1 9.1 9.0 9.0 A A A A
Hope Street to Mile End Road SW-N NBT 0 0 0 0 24.9 23.9 30.5 26.3 0.5 0.5 0.5 0.5 0.0 0.0 0.0 0.0 A A A A
Hope Street to Commercial Road SW-S NBU 18 18 18 18 24.9 23.9 30.5 26.3 0.5 0.5 0.5 0.5 70.9 71.0 72.4 70.6 E E E E
Hope Street to Church Street SW-E NBR 54 54 55 55 24.9 23.9 30.5 26.3 0.5 0.5 0.5 0.5 67.2 55.8 55.7 55.9 E E E E
Commercial Road to Mile End Road S-N NBT 348 347 348 348 29.5 44.5 46.0 38.9 0.7 0.7 0.7 0.7 37.3 36.8 36.2 36.7 D D D D
Commercial Road to Commercial Road S-S NBU 9 9 9 8 29.5 44.5 46.0 38.9 0.7 0.7 0.7 0.7 54.5 53.0 48.9 52.8 D D D D
Commercial Road to Church Street S-E NBR 15 15 16 15 29.5 44.5 46.0 38.9 0.7 0.7 0.7 0.7 58.2 44.1 41.8 43.4 E D D D
Church Street to Mile End Road E-N WBR 238 236 238 237 105.3 117.9 118.9 129.7 13.6 15.8 15.5 15.3 57.8 64.0 63.0 62.3 E E E E
Church Street to Commercial Road E-S WBL 11 11 11 11 105.3 117.9 118.9 129.7 13.6 15.8 15.5 15.3 55.2 58.7 57.9 58.1 E E E E
Church Street to Church Street E-E WBU 0 0 0 0 105.3 117.9 118.9 129.7 13.6 15.8 15.5 15.3 0.0 0.0 0.0 0.0 A A A A
All 3773 3766 3771 3771 105.3 117.9 122.3 133.9 5.0 5.5 5.4 5.6 16.8 16.9 16.8 17.2 B B B B
503 Cascade's Approach Cascade's Approach to Cascade's Approach S-SW NBL 0 0 0 0 19.8 22.6 21.9 21.2 0.2 0.2 0.2 0.1 0.0 0.0 0.0 0.0 A A A A
Cascade's Approach to Marketway WB S-E NBR 8 8 8 8 19.8 22.6 21.9 21.2 0.2 0.2 0.2 0.1 10.0 9.6 10.8 8.9 B A B A
Cascade's Approach to Marketway EB S-W NBL 2 2 2 2 19.8 22.6 21.9 21.2 0.2 0.2 0.2 0.1 25.6 26.3 21.5 17.2 D D C C
Marketway WB to Cascade's Approach NE-SW WBT 12 12 12 12 231.3 231.5 229.7 234.8 14.5 17.3 15.9 19.8 4.5 12.2 12.1 12.8 A B B B
Marketway WB to Marketway WB NE-E WBL 9 8 8 8 231.3 231.5 229.7 234.8 14.5 17.3 15.9 19.8 15.8 16.9 18.5 17.1 C C C C
Marketway WB to Marketway EB NE-W WBT 1351 1351 1347 1348 231.3 231.5 229.7 234.8 14.5 17.3 15.9 19.8 16.2 17.4 17.7 19.2 C C C C
Marketway EB to Cascade's Approach SW-SW EBU 0 0 0 0 48.3 76.7 165.4 74.1 0.3 0.2 0.5 0.4 0.0 0.0 0.0 0.2 A A A A
Marketway EB to Hope Street SW-N EBL 1060 1062 1061 1062 0.0 0.0 0.0 0.0 0.0 0.0 0.0 0.0 2.2 2.1 2.2 2.2 A A A A
Marketway WB to Marketway EB NE-W WBT 32 32 32 32 0.0 5.6 0.0 0.0 0.0 0.0 0.0 0.0 5.8 5.3 6.3 6.1 A A A A
Marketway EB to Marketway WB SW-E EBT 346 346 345 346 48.3 76.7 165.4 74.1 0.3 0.2 0.5 0.4 5.2 5.3 5.4 5.4 A A A A
Marketway EB to Marketway EB SW-W NBL 7 7 7 7 48.3 76.7 165.4 74.1 0.3 0.2 0.5 0.4 5.5 5.6 5.6 7.2 A A A A
All 2826 2828 2823 2825 231.3 231.5 229.7 234.8 4.1 4.8 4.5 5.5 9.4 10.0 10.2 10.9 A A B B
504 Marketway Roundabout Commercial Road NB to Commercial Road SB S-N NBT 6 6 6 6 39.2 39.2 39.5 45.8 2.7 2.7 2.9 2.9 40.3 43.5 47.6 44.8 E E E E
Commercial Road NB to Marketway S-W NBL 19 19 19 19 39.2 39.2 39.5 45.8 2.7 2.7 2.9 2.9 34.3 35.7 34.2 36.0 D E D E
Commercial Road NB to Cornmill street S-SE NBR 8 8 8 7 39.2 39.2 39.5 45.8 2.7 2.7 2.9 2.9 25.0 23.8 27.4 27.4 D C D D
Commercial Road SB to Commercial Road SB N-N SBU 79 79 78 79 105.8 126.0 122.8 186.2 4.1 4.8 4.6 5.2 15.8 17.8 17.4 18.1 C C C C
Commercial Road SB to Marketway N-W SBR 1191 1192 1193 1190 105.8 126.0 122.8 186.2 4.1 4.8 4.6 5.2 15.5 17.0 17.3 18.1 C C C C
Commercial Road SB to Cornmill street N-SE SBT 231 231 231 231 105.8 126.0 122.8 186.2 4.1 4.8 4.6 5.2 8.1 8.8 8.6 9.1 A A A A
Marketway to Commercial Road SB W-N EBL 165 165 163 164 68.3 94.1 84.9 106.2 1.3 1.4 1.7 1.6 11.7 11.8 13.2 13.3 B B B B
Marketway to Marketway W-W EBU 8 7 8 7 68.3 94.1 84.9 106.2 1.3 1.4 1.7 1.6 13.8 14.9 18.1 18.3 B B C C
Marketway to Cornmill street W-SE EBT 182 182 182 182 68.3 94.1 84.9 106.2 1.3 1.4 1.7 1.6 13.4 13.1 14.6 14.7 B B B B
Cornmill street to Commercial Road NB E-SW WBT 11 11 11 10 88.8 142.1 130.4 142.3 0.8 2.5 1.7 2.2 0.9 1.4 2.0 1.3 A A A A
Cornmill street to Commercial Road SB E-N WBR 226 226 227 225 103.1 156.3 144.6 156.5 3.3 5.3 4.5 5.0 11.7 13.4 13.4 13.5 B B B B
Cornmill street to Marketway E-W WBT 196 196 196 197 103.1 156.3 144.6 156.5 3.3 5.3 4.5 5.0 11.8 13.6 13.8 14.0 B B B B
Cornmill street to Cornmill street E-SE WBL 0 0 0 0 103.1 156.3 144.6 156.5 3.3 5.3 4.5 5.0 0.0 0.0 0.0 0.0 A A A A
All 2319 2321 2321 2318 105.8 156.3 144.6 186.2 2.7 3.5 3.3 3.6 13.8 15.1 15.4 16.0 B C C C
505 A2030 roundabout Lake Road NB to Lake Road NB SW-W NBL 0 0 0 0 19.9 27.8 16.8 46.0 0.0 0.1 0.0 0.2 0.0 0.0 0.0 0.0 A A A A
Lake Road NB to Cornmill street SW-NW EBL 63 63 63 63 19.9 27.8 16.8 46.0 0.0 0.1 0.0 0.2 3.1 3.9 3.4 4.2 A A A A
Lake Road NB to Lake Road SB SW-E EBT 15 15 15 15 19.9 27.8 16.8 46.0 0.0 0.1 0.0 0.2 2.1 2.4 3.0 4.8 A A A A
Cornmill street to Lake Road NB NW-W SBR 70 71 71 71 41.7 28.8 28.8 28.6 1.3 1.3 1.2 1.2 2.8 3.9 3.2 4.4 A A A A
Cornmill street to Cornmill street NW-NW SBU 11 11 11 10 41.7 28.8 28.8 28.6 1.3 1.3 1.2 1.2 5.0 7.0 6.1 9.6 A A A A
Cornmill street to Lake Road SB NW-E SBL 338 337 339 339 41.7 28.8 28.8 28.6 1.3 1.3 1.2 1.2 3.0 3.1 2.9 3.3 A A A A
Lake Road SB to Lake Road NB E-W WBT 15 15 15 15 70.1 225.0 75.0 215.6 1.9 5.0 2.5 4.6 9.2 18.5 11.0 15.5 A C B C
Lake Road SB to Cornmill street E-NW WBT 359 359 360 360 70.1 225.0 75.0 215.6 1.9 5.0 2.5 4.6 7.6 12.6 8.8 12.0 A B A B
Lake Road SB to Lake Road SB E-E WBU 0 0 0 0 70.1 225.0 75.0 215.6 1.9 5.0 2.5 4.6 0.0 0.0 0.0 0.0 A A A A
All 871 871 873 872 70.1 225.0 75.0 215.6 1.1 2.1 1.3 2.0 5.0 7.5 5.5 7.3 A A A A
506 Holbrook Road Roundabout Lake Road SB to Lake Road SB NE-E WBL 0 0 0 0 189.4 160.4 117.7 176.9 14.7 15.0 0.8 14.8 5.0 5.9 1.9 5.8 A A A A
Lake Road SB to Holbrook Road NE-S WBR 116 117 119 117 189.4 160.4 117.7 176.9 14.7 15.0 0.8 14.8 30.8 31.2 15.7 31.2 D D C D
Lake Road SB to Church Street NE-NW WBR 55 55 55 55 189.4 160.4 117.7 176.9 14.7 15.0 0.8 14.8 29.7 30.6 20.2 30.4 D D C D
Lake Road SB to Lake Road NB NE-W WBT 197 198 199 198 189.4 160.4 117.7 176.9 14.7 15.0 0.8 14.8 30.8 31.3 21.7 30.9 D D C D
Holbrook Road to Lake Road SB SE-E NBR 119 119 119 119 44.0 37.2 55.5 41.5 0.8 0.8 0.9 0.8 6.7 6.7 7.1 6.8 A A A A
Holbrook Road to Holbrook Road SE-S NBL 1 1 1 1 44.0 37.2 55.5 41.5 0.8 0.8 0.9 0.8 2.9 3.1 3.2 3.0 A A A A
Holbrook Road to Church Street SE-NW NBT 131 131 131 131 44.0 37.2 55.5 41.5 0.8 0.8 0.9 0.8 6.3 6.2 6.5 6.3 A A A A
Holbrook Road to Lake Road NB SE-W NBL 171 171 171 171 44.0 37.2 55.5 41.5 0.8 0.8 0.9 0.8 4.5 4.6 4.6 4.5 A A A A
Church Street to Lake Road SB NW-E SBL 57 57 57 57 79.3 98.0 41.3 77.2 3.9 3.6 0.1 3.4 13.3 13.4 8.4 13.1 B B A B
Church Street to Holbrook Road NW-S SBT 412 411 411 411 79.3 98.0 41.3 77.2 3.9 3.6 0.1 3.4 13.8 13.6 11.8 13.3 B B B B
Church Street to Church Street NW-NW SBU 0 0 0 0 79.3 98.0 41.3 77.2 3.9 3.6 0.1 3.4 0.0 0.0 0.0 0.0 A A A A
Church Street to Lake Road NB NW-W SBR 3 3 3 3 79.3 98.0 41.3 77.2 3.9 3.6 0.1 3.4 13.1 11.7 11.5 12.6 B B B B
Lake Road NB to Lake Road SB SW-E EBT 134 134 134 134 59.7 50.5 68.1 54.6 0.9 0.9 1.0 0.9 4.5 4.4 4.6 4.5 A A A A
Lake Road NB to Holbrook Road SW-S EBR 209 208 209 210 59.7 50.5 68.1 54.6 0.9 0.9 1.0 0.9 5.2 5.1 5.1 5.2 A A A A
Lake Road NB to Church Street SW-NW EBL 9 9 9 9 59.7 50.5 68.1 54.6 0.9 0.9 1.0 0.9 4.0 3.9 4.2 4.2 A A A A
Lake Road NB to Lake Road NB SW-W NBL 0 0 0 0 59.7 50.5 68.1 54.6 0.9 0.9 1.0 0.9 0.0 0.0 0.0 0.0 A A A A
All 1613 1612 1616 1614 189.4 160.4 117.7 176.9 5.1 5.1 0.7 5.0 13.6 13.7 10.4 13.5 B B B B
507 Unicorn Road Unicorn Road WB to Market Way NW-NE SBL 373 373 371 371 76.7 66.3 63.5 73.2 12.0 12.3 12.0 12.0 33.5 34.4 33.5 33.5 C C C C
Unicorn Road WB to Unicorn Road EB NW-S SBT 18 19 18 19 67.5 66.6 64.7 74.4 4.9 4.9 4.8 5.2 43.4 42.1 44.4 40.6 D D D D
Unicorn Road WB to Alfred Road NW-SW SBR 31 29 30 30 67.5 66.6 64.7 74.4 4.9 4.9 4.8 5.2 40.9 40.6 42.9 43.2 D D D D
Market Way to Unicorn Road WB NE-NW WBR 175 175 174 173 229.0 226.2 230.5 227.9 36.6 38.8 39.2 36.8 97.9 96.6 100.2 95.5 F F F F
Market Way to Unicorn Road EB NE-S WBU 222 221 223 221 229.0 226.2 230.5 227.9 36.6 38.8 39.2 36.8 15.2 15.8 15.5 16.1 B B B B
Market Way to Alfred Road NE-SW WBT 1009 1008 1007 1010 229.0 226.2 230.5 227.9 36.6 38.8 39.2 36.8 28.6 29.7 29.4 29.4 C C C C
Unicorn Road EB to Unicorn Road WB S-NW NBT 87 88 88 87 106.9 82.9 98.8 106.8 13.0 12.8 13.0 12.7 46.1 44.7 45.9 45.7 D D D D
Unicorn Road EB to Market Way S-NE NBR 96 96 95 96 106.9 82.9 98.8 106.8 13.0 12.8 13.0 12.7 43.7 44.1 43.6 42.6 D D D D
Unicorn Road EB to Alfred Road S-SW NBL 8 8 8 8 31.6 41.9 41.9 41.9 0.5 0.4 0.5 0.5 46.7 41.4 42.4 44.5 D D D D
Alfred Road to Unicorn Road WB SW-NW EBL 146 146 145 146 172.9 215.7 197.7 197.1 22.8 21.0 21.2 21.6 22.4 21.1 21.5 21.3 C C C C
Alfred Road to Market Way SW-NE EBT 947 944 945 946 172.9 215.7 197.7 197.1 22.8 21.0 21.2 21.6 22.7 21.0 21.2 21.8 C C C C
All 3112 3107 3105 3107 229.0 226.2 230.5 227.9 18.5 18.8 18.9 18.4 31.3 31.1 31.2 31.1 C C C C
508 Stanhope Road Stanhope Road to Stanhope Road S-S NBU 0 0 0 0 29.8 25.7 31.6 25.3 0.1 0.1 0.1 0.1 0.0 0.0 0.0 0.0 A A A A
Stanhope Road to Edinburgh Road WB S-SE NBR 0 0 0 0 29.8 25.7 31.6 25.3 0.1 0.1 0.1 0.1 0.0 0.0 0.0 0.0 A A A A
Stanhope Road to Unicorn road S-N NBT 168 168 168 168 29.8 25.7 31.6 25.3 0.1 0.1 0.1 0.1 4.3 4.3 4.3 4.3 A A A A
Stanhope Road to Edinburgh Road EB S-W NBL 8 8 8 8 29.8 25.7 31.6 25.3 0.1 0.1 0.1 0.1 18.5 15.0 16.1 15.4 C C C C
Edinburgh Road WB to Stanhope Road E-S WBL 2 2 2 2 46.5 27.5 27.9 46.7 0.2 0.2 0.2 0.2 9.6 11.8 9.2 11.5 A B A B
Edinburgh Road WB to Edinburgh Road WB E-SE WBL 0 0 0 0 46.5 27.5 27.9 46.7 0.2 0.2 0.2 0.2 0.0 0.0 0.0 0.0 A A A A
Edinburgh Road WB to Unicorn road E-N WBR 23 23 23 23 46.5 27.5 27.9 46.7 0.2 0.2 0.2 0.2 13.5 13.1 13.5 12.9 B B B B
Edinburgh Road WB to Edinburgh Road EB E-W WBT 44 45 45 45 46.5 27.5 27.9 46.7 0.2 0.2 0.2 0.2 17.6 16.8 16.7 16.8 C C C C
Unicorn road to Stanhope Road N-S SBT 194 194 194 193 26.6 37.4 28.0 36.5 0.0 0.0 0.0 0.1 1.3 1.3 1.3 1.4 A A A A
Unicorn road to Edinburgh Road WB N-SE SBT 22 22 22 22 26.6 37.4 28.0 36.5 0.0 0.0 0.0 0.1 1.5 1.6 1.4 1.4 A A A A
Unicorn road to Unicorn road N-N SBU 1 1 1 1 26.6 37.4 28.0 36.5 0.0 0.0 0.0 0.1 1.5 1.5 1.9 2.1 A A A A
Unicorn road to Edinburgh Road EB N-W SBR 25 24 24 24 26.6 37.4 28.0 36.5 0.0 0.0 0.0 0.1 1.5 1.5 1.9 2.1 A A A A
Edinburgh Road EB to Stanhope Road W-S EBR 8 8 8 8 47.3 44.1 44.5 41.8 0.2 0.3 0.2 0.2 13.2 13.3 13.2 13.3 B B B B
Edinburgh Road EB to Edinburgh Road WB W-SE EBT 27 27 27 27 47.3 44.1 44.5 41.8 0.2 0.3 0.2 0.2 15.3 15.3 15.3 15.3 C C C C
Edinburgh Road EB to Unicorn road W-N EBL 0 0 0 0 47.3 44.1 44.5 41.8 0.2 0.3 0.2 0.2 0.0 0.0 0.0 0.0 A A A A
Edinburgh Road EB to Edinburgh Road EB W-W EBU 0 0 0 0 47.3 44.1 44.5 41.8 0.2 0.3 0.2 0.2 0.0 0.0 0.0 0.0 A A A A
All 522 522 523 522 47.3 44.1 44.5 46.7 0.2 0.2 0.1 0.2 5.4 5.3 5.4 5.3 A A A A
509 Queen Street Queen St to Alfred Road W-NE EBL 303 303 303 303 71.5 71.5 71.5 71.5 8.9 8.9 8.9 8.8 22.8 22.8 22.8 22.8 C C C C
Queen St to Bishop Crispian Way W-E EBT 35 35 35 35 58.1 58.1 58.1 58.1 5.0 5.0 5.0 5.0 67.1 67.1 67.1 67.1 E E E E
Alfred Road to Queen St NE-W WBT 292 291 292 293 192.2 221.1 172.4 187.2 21.2 19.6 18.1 19.1 43.3 39.6 37.6 39.1 D D D D
Alfred Road to Anglesea Road NE-S WBR 758 759 758 759 123.0 217.3 168.7 183.5 3.5 2.8 2.7 2.9 7.0 5.8 5.9 6.2 A A A A
Bishop Crispian Way to Queen St E-W WBT 77 77 77 77 88.7 88.2 106.5 89.8 9.5 9.7 9.9 10.0 56.9 57.1 58.2 58.9 E E E E
Anglesea Road to Queen St S-W NBL 25 26 26 26 56.2 56.6 43.2 43.1 0.4 0.4 0.3 0.4 15.7 15.0 14.8 15.8 B B B B
Anglesea Road to Alfred Road S-NE NBR 783 785 784 784 96.0 140.7 180.6 132.8 8.5 8.5 8.5 8.5 15.2 15.4 15.3 15.5 B B B B
All 2273 2275 2275 2277 192.2 221.1 180.6 187.2 8.1 7.8 7.6 7.8 19.3 18.5 18.3 18.7 B B B B
510 St Michael's Gyratory St Paul's Road to Wiltshire Street S-E NBR 0 0 0 0 15.8 16.2 18.3 16.2 0.1 0.1 0.1 0.0 0.0 0.0 0.0 0.0 A A A A
St Paul's Road to Waltham St S-S NBU 0 0 0 0 15.8 16.2 18.3 16.2 0.1 0.1 0.1 0.0 0.0 0.0 0.0 0.0 A A A A
St Paul's Road to Guildhall Walk S-NE NBT 0 0 0 0 15.8 16.2 18.3 16.2 0.1 0.1 0.1 0.0 0.0 0.0 0.0 0.0 A A A A
St Paul's Road to Cambridge Road S-SW NBL 0 0 0 0 15.8 16.2 18.3 16.2 0.1 0.1 0.1 0.0 0.0 0.0 0.0 0.0 A A A A
St Paul's Road to Hampshire Terrace S-S NBU 0 0 0 0 15.8 16.2 18.3 16.2 0.1 0.1 0.1 0.0 0.0 0.0 0.0 0.0 A A A A
St Paul's Road to Winston churchill avenue S-E NBR 0 0 0 0 15.8 16.2 18.3 16.2 0.1 0.1 0.1 0.0 0.0 0.0 0.0 0.0 A A A A
St Paul's Road to Anglesea Road S-N NBT 37 37 37 37 15.8 16.2 18.3 16.2 0.1 0.1 0.1 0.0 9.5 8.6 8.6 7.9 A A A A
Cambridge Road to Wiltshire Street SW-E EBT 1 1 1 1 88.8 93.6 93.6 93.6 2.0 2.0 2.0 2.0 9.5 19.5 14.4 20.5 A B B C
Cambridge Road to Waltham St SW-S EBR 0 0 0 0 88.8 93.6 93.6 93.6 2.0 2.0 2.0 2.0 0.0 0.0 0.0 0.0 A A A A
Cambridge Road to Guildhall Walk SW-NE EBT 23 23 23 23 88.8 93.6 93.6 93.6 2.0 2.0 2.0 2.0 24.0 37.1 38.9 38.6 C D D D
Cambridge Road to Cambridge Road SW-SW EBU 2 2 2 2 88.8 93.6 93.6 93.6 2.0 2.0 2.0 2.0 26.8 36.6 43.0 42.6 C D D D
Cambridge Road to Hampshire Terrace SW-S EBR 10 10 10 10 88.8 93.6 93.6 93.6 2.0 2.0 2.0 2.0 23.7 37.6 34.6 34.6 C D C C
Cambridge Road to Winston churchill avenue SW-E EBT 136 136 137 136 88.8 93.6 93.6 93.6 2.0 2.0 2.0 2.0 24.3 39.2 39.2 39.2 C D D D
Cambridge Road to Anglesea Road SW-N EBL 205 205 205 205 88.8 93.6 93.6 93.6 2.0 2.0 2.0 2.0 11.2 8.8 9.0 8.8 B A A A
Hampshire Terrace to Wiltshire Street S-E NBR 1 1 1 1 125.0 127.3 148.0 135.6 3.5 3.5 3.5 3.4 18.9 26.6 25.6 26.0 C D D D
Hampshire Terrace to Waltham St S-S NBU 0 0 0 0 125.0 127.3 148.0 135.6 3.5 3.5 3.5 3.4 0.0 0.0 0.0 0.0 A A A A
Hampshire Terrace to Guildhall Walk S-NE NBT 19 18 19 19 125.0 127.3 148.0 135.6 3.5 3.5 3.5 3.4 27.9 43.3 43.7 41.1 D E E E
Hampshire Terrace to Cambridge Road S-SW NBL 20 20 20 20 125.0 127.3 148.0 135.6 3.5 3.5 3.5 3.4 13.9 12.9 13.1 12.5 B B B B
Hampshire Terrace to Hampshire Terrace S-S NBU 3 3 3 3 125.0 127.3 148.0 135.6 3.5 3.5 3.5 3.4 26.9 39.0 40.6 39.1 D E E E
Hampshire Terrace to Winston churchill avenue S-E NBR 77 77 77 77 125.0 127.3 148.0 135.6 3.5 3.5 3.5 3.4 28.5 43.6 44.6 43.2 D E E E
Hampshire Terrace to Anglesea Road S-N NBT 289 290 290 290 125.0 127.3 148.0 135.6 3.5 3.5 3.5 3.4 16.6 15.6 15.5 15.6 C C C C
Winston churchill avenue to Wiltshire Street E-E WBU 7 7 7 7 47.1 42.4 48.0 49.5 5.8 4.8 4.9 4.8 20.4 17.7 18.1 17.4 C B B B
Winston churchill avenue to Waltham St E-S WBL 19 19 19 19 47.1 42.4 48.0 49.5 5.8 4.8 4.9 4.8 14.4 11.3 10.9 12.8 B B B B
Winston churchill avenue to Guildhall Walk E-NE WBR 21 21 21 21 47.1 42.4 48.0 49.5 5.8 4.8 4.9 4.8 43.0 55.7 57.9 55.8 D E E E
Winston churchill avenue to Cambridge Road E-SW WBT 135 135 135 134 47.1 42.4 48.0 49.5 5.8 4.8 4.9 4.8 31.6 29.1 29.3 28.5 C C C C
Winston churchill avenue to Hampshire Terrace E-S WBL 81 81 81 81 47.1 42.4 48.0 49.5 5.8 4.8 4.9 4.8 20.6 18.6 18.6 18.5 C B B B
Winston churchill avenue to Winston churchill avenue E-E WBU 6 6 6 6 47.1 42.4 48.0 49.5 5.8 4.8 4.9 4.8 46.5 55.7 53.9 51.4 D E D D
Winston churchill avenue to Anglesea Road E-N WBR 99 100 100 100 47.1 42.4 48.0 49.5 5.8 4.8 4.9 4.8 31.2 27.4 27.8 27.4 C C C C
Anglesea Road to Wiltshire Street N-E SBL 28 27 28 27 65.4 69.2 69.2 66.9 0.8 4.3 4.2 4.3 16.8 22.2 21.1 22.3 C C C C
Anglesea Road to Waltham St N-S SBT 0 0 0 0 65.4 69.2 69.2 66.9 0.8 4.3 4.2 4.3 0.0 0.0 0.0 0.0 A A A A
Anglesea Road to Guildhall Walk N-NE SBL 40 39 39 39 65.4 69.2 69.2 66.9 0.8 4.3 4.2 4.3 11.3 16.9 16.2 16.5 B B B B
Anglesea Road to Cambridge Road N-SW SBR 101 100 100 101 65.4 69.2 69.2 66.9 0.8 4.3 4.2 4.3 22.2 27.5 27.7 27.7 C C C C
Anglesea Road to Hampshire Terrace N-S SBT 349 349 351 350 65.4 69.2 69.2 66.9 0.8 4.3 4.2 4.3 17.4 22.9 22.6 22.9 C C C C
Anglesea Road to Winston churchill avenue N-E SBL 53 52 52 52 65.4 69.2 69.2 66.9 0.8 4.3 4.2 4.3 10.8 16.9 16.3 16.5 B B B B
Anglesea Road to Anglesea Road N-N SBU 47 47 47 47 65.4 69.2 69.2 66.9 0.8 4.3 4.2 4.3 25.6 28.7 28.4 29.4 D C C C
All 1807 1805 1807 1805 125.0 127.3 148.0 135.6 2.4 2.9 2.9 2.9 20.1 23.3 23.4 23.3 C C C C
511 Park Road Park Road to Anglesea Road W-N EBL 177 177 177 177 92.6 92.6 92.6 92.6 9.4 9.4 9.4 9.4 33.8 33.8 33.8 33.8 C C C C
Anglesea Road SB to Park Road N-W SBR 145 145 145 144 157.1 159.5 157.5 161.4 9.0 8.3 8.4 8.5 34.7 33.6 33.7 34.0 C C C C
Anglesea Road SB to Anglesea Road SB N-S SBT 616 615 615 615 157.1 159.5 157.5 161.4 9.0 8.3 8.4 8.5 5.5 4.6 4.9 4.9 A A A A
Anglesea Road to Park Road S-W NBL 0 0 0 0 63.6 86.6 76.3 66.3 5.0 4.9 4.9 4.9 0.0 0.0 0.0 0.0 A A A A
Anglesea Road to Anglesea Road S-N NBT 634 634 634 635 63.6 86.6 76.3 66.3 5.0 4.9 4.9 4.9 9.9 9.3 9.3 9.2 A A A A
All 1571 1571 1571 1571 157.1 159.5 157.5 161.4 7.5 7.1 7.2 7.2 13.1 12.5 12.6 12.6 B B B B
512 Princess Royal Road Princess Royal Road to Mile end Road NB W-N EBL 191 191 190 190 78.0 55.8 59.9 55.8 5.4 4.5 4.8 4.7 21.5 20.4 21.3 21.2 C C C C
Mile end Road SB to Princess Royal Road NE-W WBT 122 123 123 122 38.2 34.5 31.3 32.3 2.5 2.6 2.5 2.6 20.2 20.3 20.0 21.0 C C B C
Mile end Road NB to Princess Royal Road S-W NBL 169 170 169 169 53.4 32.5 41.3 39.8 1.1 1.0 1.1 1.0 7.3 6.7 7.1 6.7 A A A A
Mile end Road NB to Mile end Road NB S-N NBT 1629 1626 1629 1631 84.2 91.0 101.8 104.8 5.6 5.6 5.4 5.3 7.3 7.2 7.2 7.0 A A A A
All 2112 2109 2111 2112 84.2 91.0 101.8 104.8 3.7 3.4 3.4 3.4 9.3 9.1 9.2 9.0 A A A A
0 NETWORK TOTALS All All 28028 28021 28032 28032 231.3 231.5 230.5 234.8 4.3 4.8 4.3 4.8 14.6 15.9 15.7 16.1 B B B B
Delay (secs) LOS
12
:00
-13
:00
Volume Max QL (m) Avg QL (m)
26/09/2014 12:04 Node Evaluation Comparison.xlsm

501 Rudmore Roundabout M275 SB to M275 SB NW-S SBT 1352 1351 1351 1351 0.0 0.0 0.0 0.0 0.0 0.0 0.0 0.0 0.8 0.5 0.5 0.5 A A A A
M275 NB to M275 NB S-NW NBT 1370 1366 1366 1369 0.0 0.0 0.0 0.0 0.0 0.0 0.0 0.0 0.9 0.7 0.7 0.8 A A A A
A2047 Kingston Cresent to Wharf Road E-W WBT 33 33 33 33 79.2 50.4 50.7 49.8 5.1 0.4 0.4 0.4 6.4 7.7 7.8 7.5 A A A A
A2047 Kingston Cresent to M275 SB Service Road E-S WBL 63 63 63 63 79.2 50.4 50.7 49.8 5.1 0.4 0.4 0.4 2.4 3.8 3.8 3.7 A A A A
A2047 Kingston Cresent to A2047 Kingston Cresent E-SE WBL 1 1 1 1 79.2 50.4 50.7 49.8 5.1 0.4 0.4 0.4 8.0 25.8 25.9 25.9 A D D D
A2047 Kingston Cresent to A3 Twyford Avenue E-NE WBU 130 131 131 131 79.2 50.4 50.7 49.8 5.1 0.4 0.4 0.4 13.2 24.2 24.1 24.3 B C C C
A2047 Kingston Cresent to M275 NB Service Road E-NW WBR 290 291 291 291 79.2 50.4 50.7 49.8 5.1 0.4 0.4 0.4 12.4 11.6 11.7 11.7 B B B B
M275 SB Service Road to Wharf Road NW-W SBR 172 174 174 174 89.3 54.8 54.8 54.8 4.0 4.6 4.6 4.6 7.4 13.0 13.0 13.0 A B B B
M275 SB Service Road to A3 Twyford Avenue NW-NE SBL 90 90 90 90 89.3 54.8 54.8 54.8 4.0 4.6 4.6 4.6 14.6 12.6 12.6 12.6 B B B B
M275 SB Service Road to M275 NB Service Road NW-NW SBU 6 6 6 6 89.3 54.8 54.8 54.8 4.0 4.6 4.6 4.6 6.1 20.5 20.5 19.8 A C C C
M275 SB Service Road to A2047 Kingston Cresent NW-SE SBL 232 233 233 233 89.3 54.8 54.8 54.8 4.0 4.6 4.6 4.6 16.7 12.5 12.5 12.5 C B B B
M275 SB Service Road to M275 SB Service Road NW-S SBT 64 64 64 64 89.3 54.8 54.8 54.8 4.0 4.6 4.6 4.6 12.4 14.6 14.6 14.6 B B B B
A3 Twyford Avenue to Wharf Road NE-W WBT 23 23 23 23 101.0 182.2 182.2 180.4 2.2 13.0 12.9 12.5 14.6 44.7 44.8 43.6 B E E E
A3 Twyford Avenue to A3 Twyford Avenue NE-NE WBU 19 19 19 19 101.0 182.2 182.2 180.4 2.2 13.0 12.9 12.5 16.0 68.4 67.8 67.8 C F F F
A3 Twyford Avenue to M275 NB Service Road NE-NW WBR 79 80 80 80 101.0 182.2 182.2 180.4 2.2 13.0 12.9 12.5 15.4 45.2 45.3 45.2 C E E E
A3 Twyford Avenue to A2047 Kingston Cresent NE-SE WBR2 113 114 114 113 101.0 182.2 182.2 180.4 2.2 13.0 12.9 12.5 13.1 41.4 41.3 39.9 B E E E
A3 Twyford Avenue to M275 SB Service Road NE-S WBL 389 386 386 386 101.0 182.2 182.2 180.4 2.2 13.0 12.9 12.5 17.8 38.1 38.1 37.2 C E E E
Wharf Road to Wharf Road W-W EBU 3 2 2 2 69.4 83.4 83.4 66.5 1.5 0.4 0.4 0.4 39.2 76.6 76.6 84.3 E F F F
Wharf Road to A3 Twyford Avenue W-NE EBT 19 19 19 19 69.4 83.4 83.4 66.5 1.5 0.4 0.4 0.4 35.0 61.4 61.3 61.6 D F F F
Wharf Road to M275 NB Service Road W-NW EBL 124 125 125 124 69.4 83.4 83.4 66.5 1.5 0.4 0.4 0.4 28.0 27.8 27.8 27.6 D D D D
Wharf Road to A2047 Kingston Cresent W-SE EBR 16 17 17 16 69.4 83.4 83.4 66.5 1.5 0.4 0.4 0.4 38.7 72.1 72.2 68.8 E F F F
Wharf Road to M275 SB Service Road W-S EBR2 70 69 69 69 69.4 83.4 83.4 66.5 1.5 0.4 0.4 0.4 38.4 76.2 76.2 76.7 E F F F
M275 NB Service Road to Wharf Road S-W NBL 97 98 98 98 27.1 40.6 36.3 40.8 0.0 0.1 0.1 0.1 2.2 17.8 17.9 17.7 A C C C
M275 NB Service Road to A3 Twyford Avenue S-NE NBR2 271 269 267 267 27.1 40.6 36.3 40.8 0.0 0.1 0.1 0.1 12.3 23.5 23.0 22.7 B C C C
M275 NB Service Road to M275 BB Service Road S-NW NBT 68 67 67 67 27.1 40.6 36.3 40.8 0.0 0.1 0.1 0.1 6.2 19.3 19.5 19.6 A C C C
M275 NB Service Road to A2047 Kingston Cresent S-SE NBR 99 98 99 99 27.1 40.6 36.3 40.8 0.0 0.1 0.1 0.1 11.3 21.7 22.6 21.5 B C C C
M275 NB Service Road to M275 SB Service Road S-S NBU 4 4 4 4 27.1 40.6 36.3 40.8 0.0 0.1 0.1 0.1 9.1 20.6 19.3 24.5 A C C C
All 5198 5192 5190 5192 101.0 182.2 182.2 180.4 2.4 3.4 3.4 3.3 7.4 12.4 12.4 12.3 A B B B
502 Mile End Roundabout Mile End Road to Mile End Road N-N SBU 89 89 89 89 71.4 76.8 81.9 83.2 3.7 3.9 3.9 4.8 45.8 46.5 46.5 47.0 D D D D
Mile End Road to Commercial Road N-S SBT 1338 1338 1338 1339 71.4 76.8 81.9 83.2 3.7 3.9 3.9 4.8 6.9 7.4 7.3 8.1 A A A A
Mile End Road to Church Street N-E SBL 410 408 408 408 71.4 76.8 81.9 83.2 3.7 3.9 3.9 4.8 9.8 7.8 7.8 7.9 A A A A
Hope Street to Mile End Road SW-N NBT 1154 1155 1156 1156 162.2 156.5 170.2 157.5 8.8 9.4 8.9 8.9 9.3 9.8 9.3 9.4 A A A A
Hope Street to Mile End Road SW-N NBT 0 0 0 0 35.7 37.8 35.4 31.1 0.6 0.6 0.6 0.6 0.0 0.0 0.0 0.0 A A A A
Hope Street to Commercial Road SW-S NBU 17 17 17 17 35.7 37.8 35.4 31.1 0.6 0.6 0.6 0.6 72.4 72.3 74.5 74.5 E E E E
Hope Street to Church Street SW-E NBR 64 64 64 64 35.7 37.8 35.4 31.1 0.6 0.6 0.6 0.6 69.5 57.7 55.6 58.2 E E E E
Commercial Road to Mile End Road S-N NBT 401 400 399 400 39.3 47.2 46.3 30.7 0.8 0.9 0.9 0.8 38.1 38.4 37.3 37.7 D D D D
Commercial Road to Commercial Road S-S NBU 3 3 4 4 39.3 47.2 46.3 30.7 0.8 0.9 0.9 0.8 47.8 49.7 52.2 63.3 D D D E
Commercial Road to Church Street S-E NBR 8 8 8 8 39.3 47.2 46.3 30.7 0.8 0.9 0.9 0.8 58.6 50.6 46.9 48.7 E D D D
Church Street to Mile End Road E-N WBR 229 229 229 229 93.6 127.8 134.5 143.4 12.5 14.3 14.3 14.8 54.5 60.1 60.4 61.4 D E E E
Church Street to Commercial Road E-S WBL 14 14 13 14 93.6 127.8 134.5 143.4 12.5 14.3 14.3 14.8 51.6 57.3 55.5 56.2 D E E E
Church Street to Church Street E-E WBU 0 0 0 0 93.6 127.8 134.5 143.4 12.5 14.3 14.3 14.8 0.0 0.0 0.0 0.0 A A A A
All 3726 3724 3725 3728 162.2 156.5 170.2 157.5 4.7 5.2 5.2 5.5 16.9 17.2 16.9 17.3 B B B B
503 Cascade's Approach Cascade's Approach to Cascade's Approach S-SW NBL 0 0 0 0 11.1 10.3 10.4 10.5 0.1 0.1 0.1 0.1 0.0 0.0 0.0 0.0 A A A A
Cascade's Approach to Marketway WB S-E NBR 2 2 2 2 11.1 10.3 10.4 10.5 0.1 0.1 0.1 0.1 5.9 5.1 5.4 4.8 A A A A
Cascade's Approach to Marketway EB S-W NBL 13 13 13 13 11.1 10.3 10.4 10.5 0.1 0.1 0.1 0.1 7.2 7.6 7.3 6.9 A A A A
Marketway WB to Cascade's Approach NE-SW WBT 31 32 32 32 95.2 131.0 96.3 96.8 2.2 2.2 2.4 2.5 4.7 7.4 7.9 8.4 A A A A
Marketway WB to Marketway WB NE-E WBL 14 14 14 14 95.2 131.0 96.3 96.8 2.2 2.2 2.4 2.5 9.8 11.0 13.4 12.6 A B B B
Marketway WB to Marketway EB NE-W WBT 1195 1197 1196 1199 95.2 131.0 96.3 96.8 2.2 2.2 2.4 2.5 8.9 9.1 10.5 10.8 A A B B
Marketway EB to Cascade's Approach SW-SW EBU 0 0 0 0 64.5 153.9 105.8 103.4 0.4 0.4 0.5 0.5 0.0 0.0 0.0 0.0 A A A A
Marketway EB to Hope Street SW-N EBL 1145 1146 1146 1148 0.0 0.0 0.0 0.0 0.0 0.0 0.0 0.0 2.9 2.9 2.9 3.1 A A A A
Marketway WB to Marketway EB NE-W WBT 30 30 30 30 4.6 52.1 0.0 4.9 0.0 0.0 0.0 0.0 4.5 5.5 6.8 6.9 A A A A
Marketway EB to Marketway WB SW-E EBT 393 395 395 396 64.5 153.9 105.8 103.4 0.4 0.4 0.5 0.5 7.1 7.0 7.3 7.3 A A A A
Marketway EB to Marketway EB SW-W NBL 8 8 8 8 64.5 153.9 105.8 103.4 0.4 0.4 0.5 0.5 6.1 6.3 6.9 7.1 A A A A
All 2832 2837 2835 2842 95.2 153.9 105.8 103.4 0.7 0.7 0.8 0.8 6.1 6.3 6.9 7.1 A A A A
504 Marketway Roundabout Commercial Road NB to Commercial Road SB S-N NBT 6 6 6 6 38.6 38.8 38.8 38.8 2.0 2.2 2.2 2.2 36.7 36.6 41.5 36.3 E E E E
Commercial Road NB to Marketway S-W NBL 14 14 14 14 38.6 38.8 38.8 38.8 2.0 2.2 2.2 2.2 36.7 36.7 36.1 37.5 E E E E
Commercial Road NB to Cornmill street S-SE NBR 6 6 6 6 38.6 38.8 38.8 38.8 2.0 2.2 2.2 2.2 24.4 22.1 24.2 24.4 C C C C
Commercial Road SB to Commercial Road SB N-N SBU 40 40 40 40 93.6 112.1 95.7 99.3 2.5 2.6 2.7 2.9 13.7 15.0 14.2 15.1 B C B C
Commercial Road SB to Marketway N-W SBR 1096 1093 1092 1094 93.6 112.1 95.7 99.3 2.5 2.6 2.7 2.9 13.3 14.6 14.4 14.8 B B B B
Commercial Road SB to Cornmill street N-SE SBT 238 239 240 239 93.6 112.1 95.7 99.3 2.5 2.6 2.7 2.9 8.5 9.1 8.8 8.8 A A A A
Marketway to Commercial Road SB W-N EBL 197 198 199 199 94.1 104.9 109.6 92.5 1.1 1.3 1.4 1.3 11.5 11.9 13.3 13.2 B B B B
Marketway to Marketway W-W EBU 8 7 8 7 94.1 104.9 109.6 92.5 1.1 1.3 1.4 1.3 11.4 15.3 16.6 17.8 B C C C
Marketway to Cornmill street W-SE EBT 186 187 187 187 94.1 104.9 109.6 92.5 1.1 1.3 1.4 1.3 13.0 13.5 14.8 14.7 B B B B
Cornmill street to Commercial Road NB E-SW WBT 3 3 4 4 22.5 27.3 54.7 20.0 0.1 0.1 0.1 0.1 1.1 0.1 0.3 0.2 A A A A
Cornmill street to Commercial Road SB E-N WBR 199 197 198 198 36.7 41.5 69.0 34.3 1.2 1.4 1.6 1.5 7.5 8.0 8.8 8.7 A A A A
Cornmill street to Marketway E-W WBT 187 190 187 188 36.7 41.5 69.0 34.3 1.2 1.4 1.6 1.5 7.9 8.4 9.0 9.0 A A A A
Cornmill street to Cornmill street E-SE WBL 0 0 0 0 36.7 41.5 69.0 34.3 1.2 1.4 1.6 1.5 0.0 0.0 0.0 0.0 A A A A
All 2181 2179 2180 2181 94.1 112.1 109.6 99.3 1.6 1.7 1.8 1.8 11.9 12.7 13.0 13.1 B B B B
505 A2030 roundabout Lake Road NB to Lake Road NB SW-W NBL 0 0 0 0 14.8 15.4 13.8 14.0 0.0 0.0 0.0 0.0 0.0 0.0 0.0 0.0 A A A A
Lake Road NB to Cornmill street SW-NW EBL 79 79 79 79 14.8 15.4 13.8 14.0 0.0 0.0 0.0 0.0 1.6 1.6 1.7 1.7 A A A A
Lake Road NB to Lake Road SB SW-E EBT 55 55 55 55 14.8 15.4 13.8 14.0 0.0 0.0 0.0 0.0 1.8 1.8 1.8 1.8 A A A A
Cornmill street to Lake Road NB NW-W SBR 91 91 91 92 40.3 28.6 28.7 40.0 1.3 1.3 1.3 1.2 3.2 3.2 3.3 3.2 A A A A
Cornmill street to Cornmill street NW-NW SBU 3 3 4 4 40.3 28.6 28.7 40.0 1.3 1.3 1.3 1.2 4.4 4.0 4.3 4.7 A A A A
Cornmill street to Lake Road SB NW-E SBL 336 338 336 336 40.3 28.6 28.7 40.0 1.3 1.3 1.3 1.2 3.2 3.3 3.2 3.1 A A A A
Lake Road SB to Lake Road NB E-W WBT 40 40 40 40 39.9 42.2 52.7 40.8 1.4 1.6 1.8 1.5 5.7 5.5 6.2 5.7 A A A A
Lake Road SB to Cornmill street E-NW WBT 308 307 307 307 39.9 42.2 52.7 40.8 1.4 1.6 1.8 1.5 5.4 5.4 6.1 5.5 A A A A
Lake Road SB to Lake Road SB E-E WBU 0 0 0 0 39.9 42.2 52.7 40.8 1.4 1.6 1.8 1.5 0.0 0.0 0.0 0.0 A A A A
All 912 914 912 912 40.3 42.2 52.7 40.8 0.9 1.0 1.0 0.9 3.9 3.9 4.1 3.8 A A A A
506 Holbrook Road Roundabout Lake Road SB to Lake Road SB NE-E WBL 5 5 5 5 231.5 231.4 186.1 231.5 60.0 58.2 2.5 55.2 59.4 63.8 27.1 60.8 F F D F
Lake Road SB to Holbrook Road NE-S WBR 226 226 225 225 231.5 231.4 186.1 231.5 60.0 58.2 2.5 55.2 60.2 57.6 18.6 56.0 F F C F
Lake Road SB to Church Street NE-NW WBR 72 72 72 72 231.5 231.4 186.1 231.5 60.0 58.2 2.5 55.2 63.8 61.0 21.7 59.1 F F C F
Lake Road SB to Lake Road NB NE-W WBT 188 187 186 187 231.5 231.4 186.1 231.5 60.0 58.2 2.5 55.2 62.7 60.5 24.8 58.7 F F C F
Holbrook Road to Lake Road SB SE-E NBR 207 207 207 208 58.4 54.7 56.2 44.2 1.1 1.1 1.4 1.1 7.9 8.0 8.5 8.0 A A A A
Holbrook Road to Holbrook Road SE-S NBL 0 0 0 0 58.4 54.7 56.2 44.2 1.1 1.1 1.4 1.1 0.0 0.0 0.0 0.0 A A A A
Holbrook Road to Church Street SE-NW NBT 115 115 115 115 58.4 54.7 56.2 44.2 1.1 1.1 1.4 1.1 7.2 7.1 7.6 7.1 A A A A
Holbrook Road to Lake Road NB SE-W NBL 152 152 152 152 58.4 54.7 56.2 44.2 1.1 1.1 1.4 1.1 4.5 4.5 4.5 4.6 A A A A
Church Street to Lake Road SB NW-E SBL 73 73 73 73 114.8 122.9 40.2 120.9 6.0 5.5 0.0 6.1 16.0 14.8 9.2 16.1 C B A C
Church Street to Holbrook Road NW-S SBT 372 372 372 372 114.8 122.9 40.2 120.9 6.0 5.5 0.0 6.1 16.2 15.9 12.7 16.3 C C B C
Church Street to Church Street NW-NW SBU 0 0 0 0 114.8 122.9 40.2 120.9 6.0 5.5 0.0 6.1 0.0 0.0 0.0 0.0 A A A A
Church Street to Lake Road NB NW-W SBR 8 7 8 8 114.8 122.9 40.2 120.9 6.0 5.5 0.0 6.1 19.3 18.3 15.6 19.3 C C C C
Lake Road NB to Lake Road SB SW-E EBT 107 108 107 108 77.8 78.7 93.8 79.9 2.4 2.4 2.5 2.2 7.2 7.2 7.7 7.2 A A A A
Lake Road NB to Holbrook Road SW-S EBR 270 272 271 270 77.8 78.7 93.8 79.9 2.4 2.4 2.5 2.2 7.9 7.9 7.8 7.7 A A A A
Lake Road NB to Church Street SW-NW EBL 12 12 12 12 77.8 78.7 93.8 79.9 2.4 2.4 2.5 2.2 6.0 6.2 6.0 5.8 A A A A
Lake Road NB to Lake Road NB SW-W NBL 1 1 1 1 77.8 78.7 93.8 79.9 2.4 2.4 2.5 2.2 6.7 5.4 3.2 5.5 A A A A
All 1807 1809 1805 1806 231.5 231.4 186.1 231.5 17.4 16.8 1.6 16.1 24.2 23.4 12.4 23.0 C C B C
507 Unicorn Road Unicorn Road WB to Market Way NW-NE SBL 281 282 282 285 57.7 67.5 62.9 74.7 10.0 10.0 9.9 10.0 33.0 33.5 33.2 33.4 C C C C
Unicorn Road WB to Unicorn Road EB NW-S SBT 9 9 10 9 59.0 68.6 64.2 76.0 4.4 4.4 4.4 4.3 32.0 43.6 39.1 36.7 C D D D
Unicorn Road WB to Alfred Road NW-SW SBR 39 39 38 38 59.0 68.6 64.2 76.0 4.4 4.4 4.4 4.3 40.3 40.1 40.0 38.9 D D D D
Market Way to Unicorn Road WB NE-NW WBR 91 91 91 91 172.1 111.1 215.9 196.6 2.7 2.1 2.8 2.5 54.4 51.5 55.0 53.1 D D D D
Market Way to Unicorn Road EB NE-S WBU 229 231 230 231 172.1 111.1 215.9 196.6 2.7 2.1 2.8 2.5 8.6 8.2 8.6 8.3 A A A A
Market Way to Alfred Road NE-SW WBT 935 934 933 935 172.1 111.1 215.9 196.6 2.7 2.1 2.8 2.5 14.4 13.7 14.8 14.1 B B B B
Unicorn Road EB to Unicorn Road WB S-NW NBT 35 34 34 34 83.4 78.9 77.5 77.8 11.4 11.6 11.5 11.6 42.8 42.6 41.3 43.0 D D D D
Unicorn Road EB to Market Way S-NE NBR 146 146 146 145 83.4 78.9 77.5 77.8 11.4 11.6 11.5 11.6 40.7 42.1 41.1 42.0 D D D D
Unicorn Road EB to Alfred Road S-SW NBL 13 13 13 13 29.9 52.4 40.3 40.7 0.6 0.7 0.7 0.8 39.2 39.3 41.1 42.5 D D D D
Alfred Road to Unicorn Road WB SW-NW EBL 71 71 71 71 180.9 182.3 181.1 199.8 23.3 22.1 23.0 23.9 21.2 18.6 21.7 21.3 C B C C
Alfred Road to Market Way SW-NE EBT 1124 1123 1126 1125 180.9 182.3 181.1 199.8 23.3 22.1 23.0 23.9 20.5 19.9 20.5 21.2 C B C C
All 2971 2972 2973 2977 180.9 182.3 215.9 199.8 8.8 8.5 8.8 8.9 21.5 21.0 21.7 21.8 C C C C
508 Stanhope Road Stanhope Road to Stanhope Road S-S NBU 0 0 0 0 23.6 19.8 19.6 30.4 0.1 0.1 0.1 0.1 0.0 0.0 0.0 0.0 A A A A
Stanhope Road to Edinburgh Road WB S-SE NBR 0 0 0 0 23.6 19.8 19.6 30.4 0.1 0.1 0.1 0.1 0.0 0.0 0.0 0.0 A A A A
Stanhope Road to Unicorn road S-N NBT 168 168 168 168 23.6 19.8 19.6 30.4 0.1 0.1 0.1 0.1 4.2 4.3 4.3 4.3 A A A A
Stanhope Road to Edinburgh Road EB S-W NBL 8 8 8 8 23.6 19.8 19.6 30.4 0.1 0.1 0.1 0.1 17.0 15.3 15.3 15.1 C C C C
Edinburgh Road WB to Stanhope Road E-S WBL 13 13 13 13 32.7 59.1 27.6 29.6 0.2 0.2 0.2 0.2 10.9 10.4 9.4 9.6 B B A A
Edinburgh Road WB to Edinburgh Road WB E-SE WBL 0 0 0 0 32.7 59.1 27.6 29.6 0.2 0.2 0.2 0.2 0.0 0.0 0.0 0.0 A A A A
Edinburgh Road WB to Unicorn road E-N WBR 24 24 24 24 32.7 59.1 27.6 29.6 0.2 0.2 0.2 0.2 13.2 13.4 12.9 12.9 B B B B
Edinburgh Road WB to Edinburgh Road EB E-W WBT 50 51 50 51 32.7 59.1 27.6 29.6 0.2 0.2 0.2 0.2 15.3 15.5 15.5 15.3 C C C C
Unicorn road to Stanhope Road N-S SBT 193 194 194 195 44.8 28.7 43.5 45.5 0.0 0.0 0.0 0.0 1.3 1.3 1.3 1.3 A A A A
Unicorn road to Edinburgh Road WB N-SE SBT 23 23 23 23 44.8 28.7 43.5 45.5 0.0 0.0 0.0 0.0 1.5 1.5 1.6 1.6 A A A A
Unicorn road to Unicorn road N-N SBU 0 0 0 0 44.8 28.7 43.5 45.5 0.0 0.0 0.0 0.0 0.0 0.0 0.0 0.0 A A A A
Unicorn road to Edinburgh Road EB N-W SBR 23 23 23 23 44.8 28.7 43.5 45.5 0.0 0.0 0.0 0.0 1.4 1.3 1.4 1.4 A A A A
Edinburgh Road EB to Stanhope Road W-S EBR 8 8 8 8 40.4 40.4 40.4 40.4 0.2 0.2 0.1 0.1 6.1 6.6 6.2 6.3 A A A A
Edinburgh Road EB to Edinburgh Road WB W-SE EBT 27 27 27 27 40.4 40.4 40.4 40.4 0.2 0.2 0.1 0.1 14.3 14.2 14.2 14.1 B B B B
Edinburgh Road EB to Unicorn road W-N EBL 0 0 0 0 40.4 40.4 40.4 40.4 0.2 0.2 0.1 0.1 0.0 0.0 0.0 0.0 A A A A
Edinburgh Road EB to Edinburgh Road EB W-W EBU 0 0 0 0 40.4 40.4 40.4 40.4 0.2 0.2 0.1 0.1 0.0 0.0 0.0 0.0 A A A A
All 536 539 538 539 44.8 59.1 43.5 45.5 0.1 0.1 0.1 0.1 5.3 5.3 5.2 5.2 A A A A
509 Queen Street Queen St to Alfred Road W-NE EBL 290 290 289 290 62.9 62.9 62.9 62.9 8.4 8.3 8.4 8.3 22.5 22.4 22.5 22.5 C C C C
Queen St to Bishop Crispian Way W-E EBT 34 34 34 34 48.7 48.7 48.7 48.7 5.3 5.3 5.3 5.3 72.7 72.7 72.7 72.7 E E E E
Alfred Road to Queen St NE-W WBT 261 259 258 259 148.1 133.3 128.9 147.2 15.1 15.0 14.9 16.0 36.8 37.0 37.3 39.3 D D D D
Alfred Road to Anglesea Road NE-S WBR 722 725 723 725 124.9 90.2 93.6 95.6 2.2 2.2 2.1 2.2 5.0 5.0 5.0 5.3 A A A A
Bishop Crispian Way to Queen St E-W WBT 81 82 81 81 79.4 96.9 91.0 98.7 9.4 9.9 9.3 9.4 55.2 57.7 55.6 55.4 E E E E
Anglesea Road to Queen St S-W NBL 40 39 39 39 56.3 53.6 52.3 54.9 0.7 0.5 0.5 0.5 16.5 16.0 16.1 15.8 B B B B
Anglesea Road to Alfred Road S-NE NBR 898 897 898 897 93.4 96.1 101.8 131.3 10.4 10.3 10.3 10.3 15.9 16.1 16.0 16.1 B B B B
All 2324 2327 2322 2325 148.1 133.3 128.9 147.2 7.3 7.4 7.2 7.4 17.9 18.0 18.0 18.3 B B B B
510 St Michael's Gyratory St Paul's Road to Wiltshire Street S-E NBR 0 0 0 0 13.9 14.4 12.8 14.6 0.1 0.1 0.1 0.1 0.0 0.0 0.0 0.0 A A A A
St Paul's Road to Waltham St S-S NBU 0 0 0 0 13.9 14.4 12.8 14.6 0.1 0.1 0.1 0.1 0.0 0.0 0.0 0.0 A A A A
St Paul's Road to Guildhall Walk S-NE NBT 0 0 0 0 13.9 14.4 12.8 14.6 0.1 0.1 0.1 0.1 0.0 0.0 0.0 0.0 A A A A
St Paul's Road to Cambridge Road S-SW NBL 0 0 0 0 13.9 14.4 12.8 14.6 0.1 0.1 0.1 0.1 0.0 0.0 0.0 0.0 A A A A
St Paul's Road to Hampshire Terrace S-S NBU 0 0 0 0 13.9 14.4 12.8 14.6 0.1 0.1 0.1 0.1 0.0 0.0 0.0 0.0 A A A A
St Paul's Road to Winston churchill avenue S-E NBR 0 0 0 0 13.9 14.4 12.8 14.6 0.1 0.1 0.1 0.1 0.0 0.0 0.0 0.0 A A A A
St Paul's Road to Anglesea Road S-N NBT 42 42 42 42 13.9 14.4 12.8 14.6 0.1 0.1 0.1 0.1 10.6 7.9 7.6 8.1 B A A A
Cambridge Road to Wiltshire Street SW-E EBT 2 2 2 2 98.7 92.9 92.9 92.9 1.9 1.8 1.8 1.8 22.3 30.1 32.0 31.5 C C C C
Cambridge Road to Waltham St SW-S EBR 1 1 1 1 98.7 92.9 92.9 92.9 1.9 1.8 1.8 1.8 12.5 24.2 18.3 17.1 B C B B
Cambridge Road to Guildhall Walk SW-NE EBT 15 16 16 16 98.7 92.9 92.9 92.9 1.9 1.8 1.8 1.8 23.8 38.7 40.9 36.6 C D D D
Cambridge Road to Cambridge Road SW-SW EBU 2 2 2 2 98.7 92.9 92.9 92.9 1.9 1.8 1.8 1.8 33.0 38.6 41.5 46.1 C D D D
Cambridge Road to Hampshire Terrace SW-S EBR 5 5 5 5 98.7 92.9 92.9 92.9 1.9 1.8 1.8 1.8 23.6 34.7 34.0 34.0 C C C C
Cambridge Road to Winston churchill avenue SW-E EBT 123 124 124 124 98.7 92.9 92.9 92.9 1.9 1.8 1.8 1.8 24.2 40.3 39.3 38.8 C D D D
Cambridge Road to Anglesea Road SW-N EBL 211 212 212 212 98.7 92.9 92.9 92.9 1.9 1.8 1.8 1.8 11.1 9.0 8.9 9.0 B A A A
Hampshire Terrace to Wiltshire Street S-E NBR 1 1 1 1 148.5 123.6 119.9 115.7 6.6 6.0 5.7 5.9 29.3 34.0 34.7 31.8 D D D D
Hampshire Terrace to Waltham St S-S NBU 0 0 0 0 148.5 123.6 119.9 115.7 6.6 6.0 5.7 5.9 0.0 0.0 0.0 0.0 A A A A
Hampshire Terrace to Guildhall Walk S-NE NBT 14 14 14 14 148.5 123.6 119.9 115.7 6.6 6.0 5.7 5.9 30.3 46.1 45.6 48.0 D E E E
Hampshire Terrace to Cambridge Road S-SW NBL 22 22 22 22 148.5 123.6 119.9 115.7 6.6 6.0 5.7 5.9 18.5 16.8 15.9 15.0 C C C C
Hampshire Terrace to Hampshire Terrace S-S NBU 3 3 3 3 148.5 123.6 119.9 115.7 6.6 6.0 5.7 5.9 33.3 40.0 40.5 49.7 D E E E
Hampshire Terrace to Winston churchill avenue S-E NBR 81 81 81 81 148.5 123.6 119.9 115.7 6.6 6.0 5.7 5.9 32.3 47.7 46.6 47.1 D E E E
Hampshire Terrace to Anglesea Road S-N NBT 334 334 334 334 148.5 123.6 119.9 115.7 6.6 6.0 5.7 5.9 20.5 17.9 17.3 17.5 C C C C
Winston churchill avenue to Wiltshire Street E-E WBU 3 3 3 4 54.9 76.8 63.2 75.9 6.1 5.2 5.1 5.0 18.4 22.3 20.9 17.1 B C C B
Winston churchill avenue to Waltham St E-S WBL 23 23 23 23 54.9 76.8 63.2 75.9 6.1 5.2 5.1 5.0 14.4 11.2 11.7 10.4 B B B B
Winston churchill avenue to Guildhall Walk E-NE WBR 14 14 14 14 54.9 76.8 63.2 75.9 6.1 5.2 5.1 5.0 42.6 58.4 59.5 58.4 D E E E
Winston churchill avenue to Cambridge Road E-SW WBT 151 152 151 151 54.9 76.8 63.2 75.9 6.1 5.2 5.1 5.0 31.2 30.0 29.8 29.7 C C C C
Winston churchill avenue to Hampshire Terrace E-S WBL 113 113 113 113 54.9 76.8 63.2 75.9 6.1 5.2 5.1 5.0 20.9 18.2 18.3 18.1 C B B B
Winston churchill avenue to Winston churchill avenue E-E WBU 12 12 12 12 54.9 76.8 63.2 75.9 6.1 5.2 5.1 5.0 41.9 57.8 56.2 59.8 D E E E
Winston churchill avenue to Anglesea Road E-N WBR 116 115 115 115 54.9 76.8 63.2 75.9 6.1 5.2 5.1 5.0 30.7 28.6 28.8 28.2 C C C C
Anglesea Road to Wiltshire Street N-E SBL 24 24 24 24 67.2 69.6 71.4 68.6 0.5 3.9 4.0 3.9 16.1 21.4 23.2 23.7 C C C C
Anglesea Road to Waltham St N-S SBT 0 0 0 0 67.2 69.6 71.4 68.6 0.5 3.9 4.0 3.9 0.0 0.0 0.0 0.0 A A A A
Anglesea Road to Guildhall Walk N-NE SBL 17 16 16 16 67.2 69.6 71.4 68.6 0.5 3.9 4.0 3.9 10.8 18.9 17.2 16.5 B B B B
Anglesea Road to Cambridge Road N-SW SBR 118 118 118 117 67.2 69.6 71.4 68.6 0.5 3.9 4.0 3.9 23.4 28.4 29.8 29.0 C C C C
Anglesea Road to Hampshire Terrace N-S SBT 312 312 311 310 67.2 69.6 71.4 68.6 0.5 3.9 4.0 3.9 16.9 22.2 23.4 23.2 C C C C
Anglesea Road to Winston churchill avenue N-E SBL 105 106 106 106 67.2 69.6 71.4 68.6 0.5 3.9 4.0 3.9 10.7 17.8 17.6 17.6 B B B B
Anglesea Road to Anglesea Road N-N SBU 33 33 33 34 67.2 69.6 71.4 68.6 0.5 3.9 4.0 3.9 24.9 29.2 29.9 29.9 C C C C
All 1897 1900 1899 1898 148.5 123.6 119.9 115.7 3.0 3.4 3.3 3.3 20.8 23.6 23.7 23.6 C C C C
511 Park Road Park Road to Anglesea Road W-N EBL 242 242 242 242 110.1 110.1 110.1 110.1 14.0 14.0 14.0 14.0 35.3 35.3 35.3 35.3 D D D D
Anglesea Road SB to Park Road N-W SBR 118 118 117 117 150.5 124.1 169.9 134.3 6.9 6.8 6.6 6.4 33.9 33.5 32.4 31.6 C C C C
Anglesea Road SB to Anglesea Road SB N-S SBT 612 613 610 612 150.5 124.1 169.9 134.3 6.9 6.8 6.6 6.4 4.6 4.5 4.4 4.7 A A A A
Anglesea Road to Park Road S-W NBL 0 0 0 0 73.7 74.0 79.7 77.9 5.9 5.7 5.7 5.6 0.0 0.0 0.0 1.8 A A A A
Anglesea Road to Anglesea Road S-N NBT 712 712 712 712 73.7 74.0 79.7 77.9 5.9 5.7 5.7 5.6 10.3 9.6 9.6 9.5 B A A A
All 1683 1684 1681 1683 150.5 124.1 169.9 134.3 7.9 7.8 7.7 7.6 13.5 13.1 13.0 13.0 B B B B
512 Princess Royal Road Princess Royal Road to Mile end Road NB W-N EBL 148 148 148 148 62.5 74.3 62.4 69.4 4.7 4.7 4.5 4.4 20.9 21.9 21.4 20.5 C C C C
Mile end Road SB to Princess Royal Road NE-W WBT 118 117 117 117 24.0 36.1 28.7 34.8 2.5 2.5 2.4 2.4 20.6 20.5 20.2 20.4 C C C C
Mile end Road NB to Princess Royal Road S-W NBL 117 117 118 118 32.8 34.8 38.6 37.1 0.7 0.6 0.6 0.7 6.7 6.5 6.5 6.8 A A A A
Mile end Road NB to Mile end Road NB S-N NBT 1765 1763 1763 1765 114.4 80.0 106.8 97.5 6.1 5.7 5.8 5.9 7.4 7.0 7.1 7.2 A A A A
All 2148 2145 2147 2148 114.4 80.0 106.8 97.5 3.5 3.4 3.3 3.3 9.0 8.7 8.8 8.8 A A A A
0 NETWORK TOTALS All 28215 28223 28208 28231 231.5 231.4 215.9 231.5 4.5 4.7 3.3 4.7 13.5 14.6 14.0 14.8 B B B B
56243 56244 56240 56263 231.5 231.5 230.5 234.8 4.4 4.7 3.8 4.7 14.1 15.3 14.9 15.4 B B B BOverall Total
13
:00
-14
:00
26/09/2014 12:04 Node Evaluation Comparison.xlsm

0
50
100
150
200
250
300
350
400
Winston ChurchillAvenue
Anglesea Road Queen Street (NB) Cascade's Approach Marketway Roundabout Mile End Roundabout Princess Royal Road
Avera
ge T
ravel T
ime (
sec)
Location
1200-1300 Northbound Travel Time Comparison
Base
DM
DS1
DS2

0
50
100
150
200
250
300
350
400
Winston ChurchillAvenue
Anglesea Road Queen Street (NB) Cascade's Approach Marketway Roundabout Mile End Roundabout Princess Royal Road
Avera
ge T
ravel T
ime (
sec)
Location
1300-1400 Northbound Travel Time Comparison
Base
DM
DS1
DS2

0
50
100
150
200
250
300
350
Winston ChurchillAvenue
Anglesea Road Queen Street (NB) Cascade's Approach Marketway Roundabout Mile End Roundabout Princess Royal Road
Avera
ge T
ravel T
ime (
sec)
Location
1200-1300 Southbound Travel Time Comparison
Base
DM
DS1
DS2

0
50
100
150
200
250
300
350
Winston ChurchillAvenue
Anglesea Road Queen Street (NB) Cascade's Approach Marketway Roundabout Mile End Roundabout Princess Royal Road
Avera
ge T
ravel T
ime (
sec)
Location
1300-1400 Southbound Travel Time Comparison
Base
DM
DS1
DS2

Matt Hall
Western House (Block B),
Peterborough Business Park,
Lynchwood, Peterborough, PE2 6BP
Email: [email protected]
Telephone: 07803 261342
Direct telephone: 01733 366982
Fax: 01733 366999
© Atkins Ltd except where stated otherwise. The Atkins logo, ‘Carbon Critical Design’ and the strapline ‘Plan Design Enable’ are trademarks of Atkins Ltd.