Embed Size (px)
Citation preview

7 Portfolio Theory
Question 1
Write short note on Factors affecting investment decisions in portfolio management.
Answer Factors affecting Investment Decisions in Portfolio Management (i) Objectives of investment portfolio: There can be many objectives of making an
investment. The manager of a provident fund portfolio has to look for security (low risk) and may be satisfied with none too higher return. An aggressive investment company may, however, be willing to take a high risk in order to have high capital appreciation.
(ii) Selection of investment (a) What types of securities to buy or invest in? There is a wide variety of investments
opportunities available i.e. debentures, convertible bonds, preference shares, equity shares, government securities and bonds, income units, capital units etc.
(b) What should be the proportion of investment in fixed interest/dividend securities and variable interest/dividend bearing securities?
(c) In case investments are to be made in the shares or debentures of companies, which particular industries show potential of growth?
(d) Once industries with high growth potential have been identified, the next step is to select the particular companies, in whose shares or securities investments are to be made.
(iii) Timing of purchase: At what price the share is acquired for the portfolio depends entirely on the timing decision. It is obvious if a person wishes to make any gains, he should “buy cheap and sell dear” i.e. buy when the shares are selling at a low price and sell when they are at a high price.
Question 2
(a) What sort of investor normally views the variance (or Standard Deviation) of an individual security’s return as the security’s proper measure of risk?
(b) What sort of investor rationally views the beta of a security as the security’s proper measure of risk? In answering the question, explain the concept of beta.
© The Institute of Chartered Accountants of India

7.2 Strategic Financial Management
Answer (a) A rational risk-averse investor views the variance (or standard deviation) of her portfolio’s
return as the proper risk of her portfolio. If for some reason or another the investor can hold only one security, the variance of that security’s return becomes the variance of the portfolio’s return. Hence, the variance of the security’s return is the security’s proper measure of risk. While risk is broken into diversifiable and non-diversifiable segments, the market generally does not reward for diversifiable risk since the investor himself is expected to diversify the risk himself. However, if the investor does not diversify he cannot be considered to be an efficient investor. The market, therefore, rewards an investor only for the non-diversifiable risk. Hence, the investor needs to know how much non-diversifiable risk he is taking. This is measured in terms of beta. An investor therefore, views the beta of a security as a proper measure of risk, in evaluating how much the market reward him for the non-diversifiable risk that he is assuming in relation to a security. An investor who is evaluating the non-diversifiable element of risk, that is, extent of deviation of returns viz-a-viz the market therefore consider beta as a proper measure of risk.
(b) If an individual holds a diversified portfolio, she still views the variance (or standard deviation) of her portfolios return as the proper measure of the risk of her portfolio. However, she is no longer interested in the variance of each individual security’s return. Rather she is interested in the contribution of each individual security to the variance of the portfolio. Under the assumption of homogeneous expectations, all individuals hold the market portfolio. Thus, we measure risk as the contribution of an individual security to the variance of the market portfolio. The contribution when standardized properly is the beta of the security. While a very few investors hold the market portfolio exactly, many hold reasonably diversified portfolio. These portfolios are close enough to the market portfolio so that the beta of a security is likely to be a reasonable measure of its risk. In other words, beta of a stock measures the sensitivity of the stock with reference to a broad based market index like BSE sensex. For example, a beta of 1.3 for a stock would indicate that this stock is 30 per cent riskier than the sensex. Similarly, a beta of a 0.8 would indicate that the stock is 20 per cent (100 – 80) less risky than the sensex. However, a beta of one would indicate that the stock is as risky as the stock market index.
Question 3
Distinguish between ‘Systematic risk’ and ‘Unsystematic risk’.
© The Institute of Chartered Accountants of India
Portfolio Theory 7.3
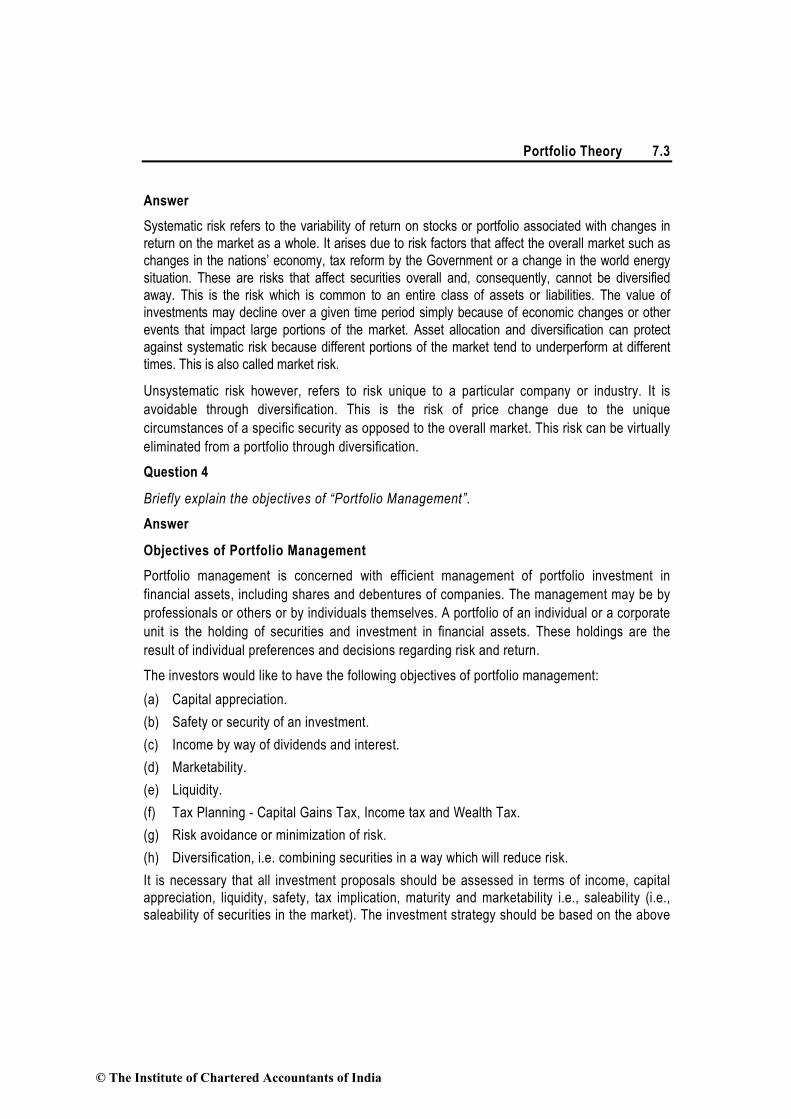
Answer Systematic risk refers to the variability of return on stocks or portfolio associated with changes in return on the market as a whole. It arises due to risk factors that affect the overall market such as changes in the nations’ economy, tax reform by the Government or a change in the world energy situation. These are risks that affect securities overall and, consequently, cannot be diversified away. This is the risk which is common to an entire class of assets or liabilities. The value of investments may decline over a given time period simply because of economic changes or other events that impact large portions of the market. Asset allocation and diversification can protect against systematic risk because different portions of the market tend to underperform at different times. This is also called market risk.
Unsystematic risk however, refers to risk unique to a particular company or industry. It is avoidable through diversification. This is the risk of price change due to the unique circumstances of a specific security as opposed to the overall market. This risk can be virtually eliminated from a portfolio through diversification.
Question 4
Briefly explain the objectives of “Portfolio Management”.
Answer
Objectives of Portfolio Management Portfolio management is concerned with efficient management of portfolio investment in financial assets, including shares and debentures of companies. The management may be by professionals or others or by individuals themselves. A portfolio of an individual or a corporate unit is the holding of securities and investment in financial assets. These holdings are the result of individual preferences and decisions regarding risk and return. The investors would like to have the following objectives of portfolio management: (a) Capital appreciation. (b) Safety or security of an investment. (c) Income by way of dividends and interest. (d) Marketability. (e) Liquidity. (f) Tax Planning - Capital Gains Tax, Income tax and Wealth Tax. (g) Risk avoidance or minimization of risk. (h) Diversification, i.e. combining securities in a way which will reduce risk. It is necessary that all investment proposals should be assessed in terms of income, capital appreciation, liquidity, safety, tax implication, maturity and marketability i.e., saleability (i.e., saleability of securities in the market). The investment strategy should be based on the above
© The Institute of Chartered Accountants of India

7.4 Strategic Financial Management
objectives after a thorough study of goals of the investor, market situation, credit policy and economic environment affecting the financial market. The portfolio management is a complex task. Investment matrix is one of the many approaches which may be used in this connection. The various considerations involved in investment decisions are liquidity, safety and yield of the investment. Image of the organization is also to be taken into account. These considerations may be taken into account and an overall view obtained through a matrix approach by allotting marks for each consideration and totaling them. Question 5
Discuss the various kinds of Systematic and Unsystematic risk?
Answer
There are two types of Risk - Systematic (or non-diversifiable) and unsystematic (or diversifiable) relevant for investment - also, called as general and specific risk. Types of Systematic Risk (i) Market risk: Even if the earning power of the corporate sector and the interest rate
structure remain more or less uncharged prices of securities, equity shares in particular, tend to fluctuate. Major cause appears to be the changing psychology of the investors. The irrationality in the security markets may cause losses unrelated to the basic risks. These losses are the result of changes in the general tenor of the market and are called market risks.
(ii) Interest Rate Risk: The change in the interest rate has a bearing on the welfare of the investors. As the interest rate goes up, the market price of existing fixed income securities falls and vice versa. This happens because the buyer of a fixed income security would not buy it at its par value or face value if its fixed interest rate is lower than the prevailing interest rate on a similar security.
(iii) Social or Regulatory Risk: The social or regulatory risk arises, where an otherwise profitable investment is impaired as a result of adverse legislation, harsh regulatory climate, or in extreme instance nationalization by a socialistic government.
(iv) Purchasing Power Risk: Inflation or rise in prices lead to rise in costs of production, lower margins, wage rises and profit squeezing etc. The return expected by investors will change due to change in real value of returns.
Classification of Unsystematic Risk (i) Business Risk: As a holder of corporate securities (equity shares or debentures) one is
exposed to the risk of poor business performance. This may be caused by a variety of factors like heigthtened competition, emergence of new technologies, development of substitute products, shifts in consumer preferences, inadequate supply of essential
© The Institute of Chartered Accountants of India

Portfolio Theory 7.5
inputs, changes in governmental policies and so on. Often of course the principal factor may be inept and incompetent management.
(ii) Financial Risk: This relates to the method of financing, adopted by the company, high leverage leading to larger debt servicing problem or short term liquidity problems due to bad debts, delayed receivables and fall in current assets or rise in current liabilities.
(iii) Default Risk: Default risk refers to the risk accruing from the fact that a borrower may not pay interest and/or principal on time. Except in the case of highly risky debt instrument, investors seem to be more concerned with the perceived risk of default rather than the actual occurrence of default. Even though the actual default may be highly unlikely, they believe that a change in the perceived default risk of a bond would have an immediate impact on its market price.
Question 6
Discuss the Capital Asset Pricing Model (CAPM) and its relevant assumptions.
Answer
Capital Asset Pricing Model: The mechanical complexity of the Markowitz’s portfolio model kept both practitioners and academics away from adopting the concept for practical use. Its intuitive logic, however, spurred the creativity of a number of researchers who began examining the stock market implications that would arise if all investors used this model As a result what is referred to as the Capital Asset Pricing Model (CAPM), was developed. The Capital Asset Pricing Model was developed by Sharpe, Mossin and Linter in 1960. The model explains the relationship between the expected return, non diversifiable risk and the valuation of securities. It considers the required rate of return of a security on the basis of its contribution to the total risk. It is based on the premises that the diversifiable risk of a security is eliminated when more and more securities are added to the portfolio. However, the systematic risk cannot be diversified and is or related with that of the market portfolio. All securities do not have same level of systematic risk. The systematic risk can be measured by beta, ß under CAPM, the expected return from a security can be expressed as: Expected return on security = Rf + Beta (Rm – Rf) The model shows that the expected return of a security consists of the risk-free rate of interest and the risk premium. The CAPM, when plotted on the graph paper is known as the Security Market Line (SML). A major implication of CAPM is that not only every security but all portfolios too must plot on SML. This implies that in an efficient market, all securities are expected returns commensurate with their riskiness, measured by ß. Relevant Assumptions of CAPM (i) The investor’s objective is to maximize the utility of terminal wealth; (ii) Investors make choices on the basis of risk and return;
© The Institute of Chartered Accountants of India

7.6 Strategic Financial Management
(iii) Investors have identical time horizon; (iv) Investors have homogeneous expectations of risk and return; (v) Information is freely and simultaneously available to investors; (vi) There is risk-free asset, and investor can borrow and lend unlimited amounts at the risk-
free rate; (vii) There are no taxes, transaction costs, restrictions on short rates or other market
imperfections; (viii) Total asset quantity is fixed, and all assets are marketable and divisible. Thus, CAPM provides a conceptual frame work for evaluating any investment decision where capital is committed with a goal of producing future returns. However, there are certain limitations of the theory. Some of these limitations are as follows: (i) Reliability of Beta: Statistically reliable Beta might not exist for shares of many firms. It
may not be possible to determine the cost of equity of all firms using CAPM. All shortcomings that apply to Beta value apply to CAPM too.
(ii) Other Risks: It emphasis only on systematic risk while unsystematic risks are also important to share holders who do not possess a diversified portfolio.
(iii) Information Available: It is extremely difficult to obtain important information on risk- free interest rate and expected return on market portfolio as there are multiple risk- free rates for one while for another, markets being volatile it varies over time period.
Question 7 Discuss the Random Walk Theory.
Answer Many investment managers and stock market analysts believe that stock market prices can never be predicted because they are not a result of any underlying factors but are mere statistical ups and downs. This hypothesis is known as Random Walk hypothesis which states that the behaviour of stock market prices is unpredictable and that there is no relationship between the present prices of the shares and their future prices. Proponents of this hypothesis argue that stock market prices are independent. A British statistician, M. G. Kendell, found that changes in security prices behave nearly as if they are generated by a suitably designed roulette wheel for which each outcome is statistically independent of the past history. In other words, the fact that there are peaks and troughs in stock exchange prices is a mere statistical happening – successive peaks and troughs are unconnected. In the layman's language it may be said that prices on the stock exchange behave exactly the way a drunk would behave while walking in a blind lane, i.e., up and down, with an unsteady way going in any direction he likes, bending on the side once and on the other side the second time.
© The Institute of Chartered Accountants of India

Portfolio Theory 7.7
The supporters of this theory put out a simple argument. It follows that: (a) Prices of shares in stock market can never be predicted. The reason is that the price
trends are not the result of any underlying factors, but that they represent a statistical expression of past data.
(c) There may be periodical ups or downs in share prices, but no connection can be established between two successive peaks (high price of stocks) and troughs (low price of stocks).
Question 8 Explain the three form of Efficient Market Hypothesis.
Answer The EMH theory is concerned with speed with which information effects the prices of securities. As per the study carried out technical analyst it was observed that information is slowly incorporated in the price and it provides an opportunity to earn excess profit. However, once the information is incorporated then investor can not earn this excess profit.
Level of Market Efficiency: That price reflects all available information, the highest order of market efficiency. According to FAMA, there exist three levels of market efficiency:- (i) Weak form efficiency – Price reflect all information found in the record of past prices and
volumes. (ii) Semi – Strong efficiency – Price reflect not only all information found in the record of past
prices and volumes but also all other publicly available information. (iii) Strong form efficiency – Price reflect all available information public as well as private. Question 9 Explain the different challenges to Efficient Market Theory.
Answer Information inadequacy – Information is neither freely available nor rapidly transmitted to all participants in the stock market. There is a calculated attempt by many companies to circulate misinformation. Other challenges are as follows: (a) Limited information processing capabilities – Human information processing
capabilities are sharply limited. According to Herbert Simon every human organism lives in an environment which generates millions of new bits of information every second but the bottle necks of the perceptual apparatus does not admit more than thousand bits per seconds and possibly much less.
David Dreman maintained that under conditions of anxiety and uncertainty, with a vast interacting information grid, the market can become a giant.
© The Institute of Chartered Accountants of India

7.8 Strategic Financial Management
(b) Irrational Behaviour – It is generally believed that investors’ rationality will ensure a close correspondence between market prices and intrinsic values. But in practice this is not true. J. M. Keynes argued that all sorts of consideration enter into the market valuation which is in no way relevant to the prospective yield. This was confirmed by L. C. Gupta who found that the market evaluation processes work haphazardly almost like a blind man firing a gun. The market seems to function largely on hit or miss tactics rather than on the basis of informed beliefs about the long term prospects of individual enterprises.
(c) Monopolistic Influence – A market is regarded as highly competitive. No single buyer or seller is supposed to have undue influence over prices. In practice, powerful institutions and big operators wield great influence over the market. The monopolistic power enjoyed by them diminishes the competitiveness of the market.
Question 10 Discuss how the risk associated with securities is affected by Government policy. Answer The risk from Government policy to securities can be impacted by any of the following factors. (i) Licensing Policy (ii) Restrictions on commodity and stock trading in exchanges (iii) Changes in FDI and FII rules. (iv) Export and import restrictions (v) Restrictions on shareholding in different industry sectors (vi) Changes in tax laws and corporate and Securities laws. Question 11 A stock costing ` 120 pays no dividends. The possible prices that the stock might sell for at the end of the year with the respective probabilities are:
Price Probability 115 0.1 120 0.1 125 0.2 130 0.3 135 0.2 140 0.1
Required: (i) Calculate the expected return. (ii) Calculate the Standard deviation of returns.
© The Institute of Chartered Accountants of India

Portfolio Theory 7.9
Answer Here, the probable returns have to be calculated using the formula
1 0
0 0
P PDRP P
−= +
Calculation of Probable Returns
Possible prices (P1) P1-P0 [(P1-P0)/ P0 ] x 100 ` ` Return (per cent)
115 -5 -4.17 120 0 0.00 125 5 4.17 130 10 8.33 135 15 12.50 140 20 16.67
Calculation of Expected Returns
Possible return Probability Product Xi p(Xi) X1-p(Xi)
-4.17 0.1 -0.417 0.00 0.1 0.000 4.17 0.2 0.834 8.33 0.3 2.499
12.50 0.2 2.500 16.67 0.1 1.667
X = 7.083
Expected return X = 7.083 per Alternatively, it can also be calculated as follows: Expected Price = 115 x 0.1 + 120 x 0.1 + 125 x 0.2 + 130 x 0.3 + 135 x 0.2 + 140 x 0.1 = 128.50
Return = 128 50 120 100120
−×
. = 7.0833%
© The Institute of Chartered Accountants of India
7.10 Strategic Financial Management
Calculation of Standard Deviation of Returns
Probable Probability Deviation Deviation squared
Product
return Xi p(Xi) (Xi – X) (Xi – X)² (Xi – X)²p(Xi) -4.17 0.1 -11.253 126.63 12.66 0.00 0.1 -7.083 50.17 5.017 4.17 0.2 -2.913 8.49 1.698 8.33 0.3 1.247 1.56 0.467
12.50 0.2 5.417 29.34 5.869 16.67 0.1 9.587 91.91 9.191
σ² = 34.902
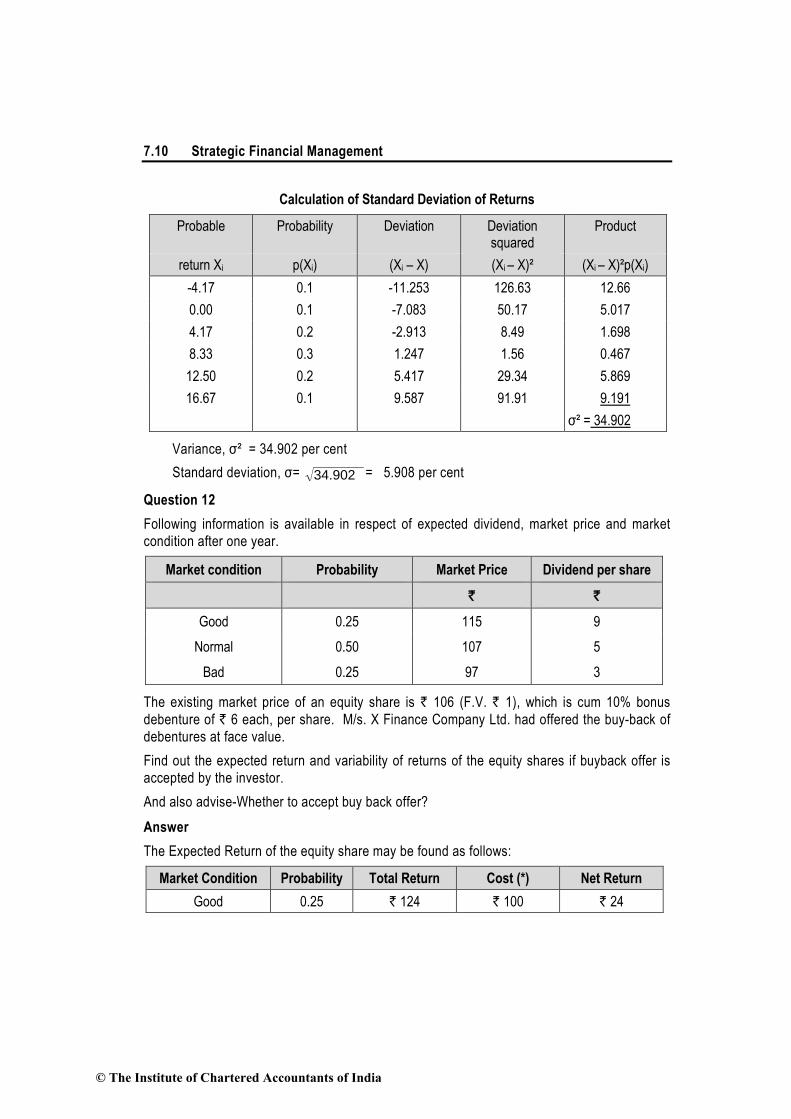
Variance, σ² = 34.902 per cent Standard deviation, σ= 34.902 = 5.908 per cent
Question 12 Following information is available in respect of expected dividend, market price and market condition after one year.
Market condition Probability Market Price Dividend per share
` `
Good 0.25 115 9 Normal 0.50 107 5
Bad 0.25 97 3
The existing market price of an equity share is ` 106 (F.V. ` 1), which is cum 10% bonus debenture of ` 6 each, per share. M/s. X Finance Company Ltd. had offered the buy-back of debentures at face value. Find out the expected return and variability of returns of the equity shares if buyback offer is accepted by the investor. And also advise-Whether to accept buy back offer? Answer The Expected Return of the equity share may be found as follows:
Market Condition Probability Total Return Cost (*) Net Return Good 0.25 ` 124 ` 100 ` 24
© The Institute of Chartered Accountants of India

Portfolio Theory 7.11
Normal 0.50 ` 112 ` 100 ` 12 Bad 0.25 ` 100 ` 100 ` 0
Expected Return = (24 × 0.25) + (12 × 0.50) + (0 × 0.25) = 12= 12 100 12%100
× =
The variability of return can be calculated in terms of standard deviation. V SD = 0.25 (24 – 12)2 + 0.50 (12 – 12)2 + 0.25 (0 – 12)2 = 0.25 (12)2 + 0.50 (0)2 + 0.25 (–12)2 = 36 + 0 + 36
SD = 72 SD = 8.485 or say 8.49 (*) The present market price of the share is ` 106 cum bonus 10% debenture of ` 6 each; hence the net cost is ` 100. M/s X Finance company has offered the buyback of debenture at face value. There is reasonable 10% rate of interest compared to expected return 12% from the market. Considering the dividend rate and market price the creditworthiness of the company seems to be very good. The decision regarding buy-back should be taken considering the maturity period and opportunity in the market. Normally, if the maturity period is low say up to 1 year better to wait otherwise to opt buy back option. Question 13
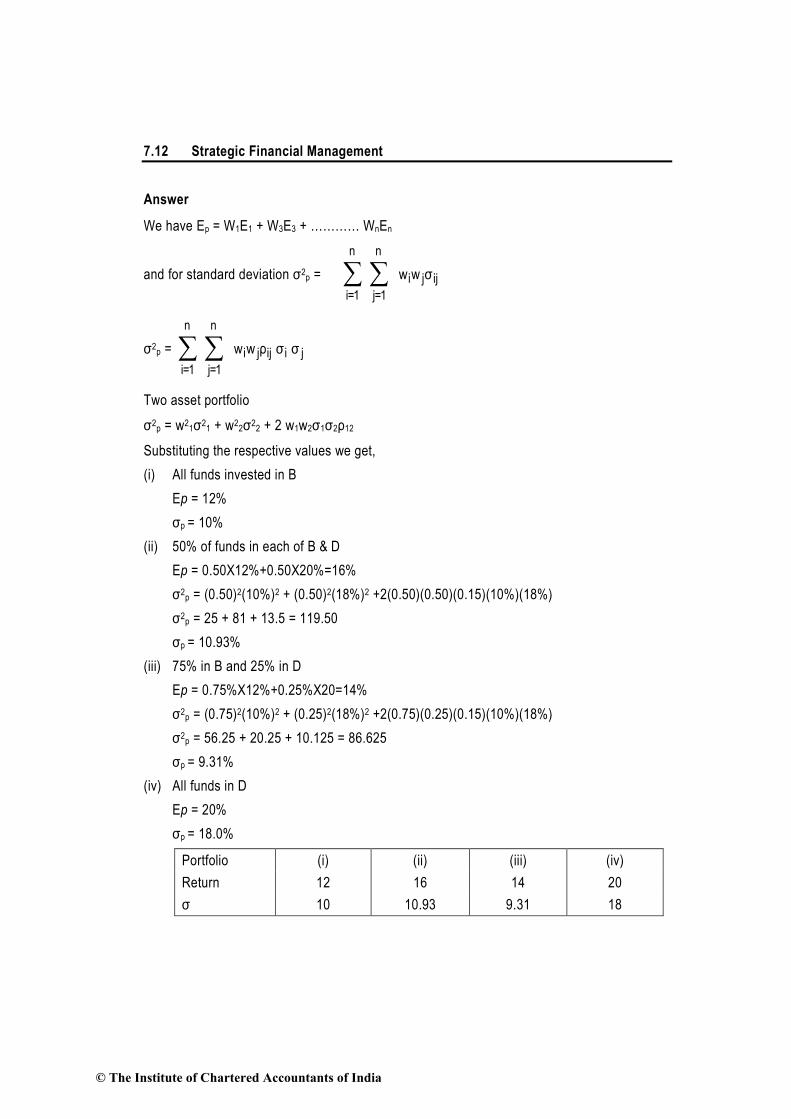
Mr. A is interested to invest ` 1,00,000 in the securities market. He selected two securities B and D for this purpose. The risk return profile of these securities are as follows :
Security Risk ( σ ) Expected Return (ER) B 10% 12% D 18% 20%
Co-efficient of correlation between B and D is 0.15.
You are required to calculate the portfolio return of the following portfolios of B and D to be considered by A for his investment. (i) 100 percent investment in B only; (ii) 50 percent of the fund in B and the rest 50 percent in D; (iii) 75 percent of the fund in B and the rest 25 percent in D; and (iv) 100 percent investment in D only.
Also indicate that which portfolio is best for him from risk as well as return point of view?
© The Institute of Chartered Accountants of India
7.12 Strategic Financial Management
Answer
We have Ep = W1E1 + W3E3 + ………… WnEn
and for standard deviation σ2p = σww ijji
n
1=j
n
1=i∑∑
σ2p = σσρww jiijji
n
1=j
n
1=i∑∑
Two asset portfolio σ2p = w21σ21 + w22σ22 + 2 w1w2σ1σ2ρ12
Substituting the respective values we get, (i) All funds invested in B Ep = 12% σp = 10% (ii) 50% of funds in each of B & D Ep = 0.50X12%+0.50X20%=16% σ2p = (0.50)2(10%)2 + (0.50)2(18%)2 +2(0.50)(0.50)(0.15)(10%)(18%) σ2p = 25 + 81 + 13.5 = 119.50 σp = 10.93% (iii) 75% in B and 25% in D Ep = 0.75%X12%+0.25%X20=14% σ2p = (0.75)2(10%)2 + (0.25)2(18%)2 +2(0.75)(0.25)(0.15)(10%)(18%) σ2p = 56.25 + 20.25 + 10.125 = 86.625 σp = 9.31% (iv) All funds in D Ep = 20% σp = 18.0%
Portfolio (i) (ii) (iii) (iv) Return 12 16 14 20 σ 10 10.93 9.31 18
© The Institute of Chartered Accountants of India

Portfolio Theory 7.13
In the terms of return, we see that portfolio (iv) is the best portfolio. In terms of risk we see that portfolio (iii) is the best portfolio. Question 14 Consider the following information on two stocks, A and B :
Year Return on A (%) Return on B (%) 2016 10 12 2017 16 18
You are required to determine: (i) The expected return on a portfolio containing A and B in the proportion of 40% and 60%
respectively. (ii) The Standard Deviation of return from each of the two stocks. (iii) The covariance of returns from the two stocks. (iv) Correlation coefficient between the returns of the two stocks. (v) The risk of a portfolio containing A and B in the proportion of 40% and 60%.
Answer (i) Expected return of the portfolio A and B
E (A) = (10 + 16) / 2 = 13% E (B) = (12 + 18) / 2 = 15%
Rp = ∑ =+=−
N
liii %2.14)15(6.0)13(4.0RX
(ii) Stock A: Variance = 0.5 (10 – 13)² + 0.5 (16 – 13) ² = 9
Standard deviation = 9 = 3%
Stock B: Variance = 0.5 (12 – 15) ² + 0.5 (18 – 15) ² = 9 Standard deviation = 3%
(iii) Covariance of stocks A and B CovAB = 0.5 (10 – 13) (12 – 15) + 0.5 (16 – 13) (18 – 15) = 9
(iv) Correlation of coefficient
rAB = 133
9CovBA
AB =×
=σσ
© The Institute of Chartered Accountants of India

7.14 Strategic Financial Management
(v) Portfolio Risk
)(XX2XX ABBABAB2
B2
A2
A2
P σσσ+σ+σ=σ
= ( ) ( ) ( ) ( ) ( )( ) ( )( )( )1336.04.0236.034.0 2222 ++
= 32.424.344.1 ++ %3=
Question 15
Following is the data regarding six securities:
A B C D E F
Return (%) 8 8 12 4 9 8 Risk (Standard deviation) 4 5 12 4 5 6
(i) Assuming three will have to be selected, state which ones will be picked. (ii) Assuming perfect correlation, show whether it is preferable to invest 75% in A and 25%
in C or to invest 100% in E
Answer (i) Security A has a return of 8% for a risk of 4, whereas B and F have a higher risk for the
same return. Hence, among them A dominates. For the same degree of risk 4, security D has only a return of 4%. Hence, D is also dominated by A. Securities C and E remain in reckoning as they have a higher return though with higher degree of risk.
Hence, the ones to be selected are A, C & E. Alternatively, three securities can also be found as follows:
© The Institute of Chartered Accountants of India

Portfolio Theory 7.15
Since securities other than A, E and C are not on Efficient Frontier they are rejected.
(ii) The average values for A and C for a proportion of 3 : 1 will be :
Risk =4
)121()43( ×+× = 6%
or 2 2 2 2(0.75) ×(4) +(0.25) ×(12) +2×0.75×0.25×4×12×1 = 6%
Return = 4
)121()83( ×+× = 9%
Therefore: 75% A E 25% C _
Risk 6 5 Return 9% 9% For the same 9% return the risk is lower in E. Hence, E will be preferable.
Question 16 The historical rates of return of two securities over the past ten years are given. Calculate the Covariance and the Correlation coefficient of the two securities:
Years: 1 2 3 4 5 6 7 8 9 10 Security 1: 12 8 7 14 16 15 18 20 16 22 (Return per cent) Security 2: 20 22 24 18 15 20 24 25 22 20 (Return per cent)
Answer
Calculation of Covariance
Year R1 Deviation )RR( 11 -
Deviation 2
11 )RR( -
R2
Deviation )RR( 22 -
Deviation 2
22 )RR( -
Product of
deviations
1 12 -2.8 7.84 20 -1 1 2.8
2 8 -6.8 46.24 22 1 1 -6.8
3 7 -7.8 60.84 24 3 9 -23.4
4 14 -0.8 0.64 18 -3 9 2.4
© The Institute of Chartered Accountants of India

7.16 Strategic Financial Management
5 16 1.2 1.44 15 -6 36 -7.2
6 15 0.2 0.04 20 -1 1 -0.2
7 18 3.2 10.24 24 3 9 9.6
8 20 5.2 27.04 25 4 16 20.8
9 16 1.2 1.44 22 1 1 1.2
10 22 7.2 51.84 20 -1 1 -7.2
14.8=10148
=R1 Σ=207.60 2110210R 2 == Σ=84.00
Covariance = N
]RR[]RR[ 2211
N
1i−−∑
= = -8/10 = -0.8
Standard Deviation of Security 1
N)RR(
=σ2
111
-
76.20=1060.207
=σ1
56.4=σ1
Standard Deviation of Security 2
N)RR(
=σ2
222
-
40.8=1084
=σ2
90.2=σ2
Alternatively, Standard Deviation of securities can also be calculated as follows: Calculation of Standard Deviation
Year R1 R12 R2 R22
1 12 144 20 400 2 8 64 22 484
© The Institute of Chartered Accountants of India

Portfolio Theory 7.17
3 7 49 24 576 4 14 196 18 324 5 16 256 15 225 6 15 225 20 400 7 18 324 24 576 8 20 400 25 625 9 16 256 22 484
10 22 484 20 400 148 2398 210 4494
Standard deviation of security 1:
2
21
21
1 N
)R(RN=σ∑ ∑-
= 100
2190423980=10×10
)148()2398×10( 2 --
= 76.20 = 4.56
Standard deviation of security 2:
2
22
22
2 N)R(RN∑ ∑−
=σ
= =×
−×1010
)210()449410( 2
1004410044940−
= 100840 = 4.8 = 2.90
Correlation Coefficient
2112
Covrσσ
= = 22.138.0
90.256.48.0 −
=×
− = -0.0605
Question 17 An investor has decided to invest to invest ` 1,00,000 in the shares of two companies, namely, ABC and XYZ. The projections of returns from the shares of the two companies along with their probabilities are as follows:
© The Institute of Chartered Accountants of India

7.18 Strategic Financial Management
Probability ABC(%) XYZ(%) .20 12 16
.25 14 10
.25 -7 28
.30 28 -2
You are required to (i) Comment on return and risk of investment in individual shares. (ii) Compare the risk and return of these two shares with a Portfolio of these shares in equal
proportions. (iii) Find out the proportion of each of the above shares to formulate a minimum risk portfolio.
Answer (i)
Probability ABC (%) XYZ (%) 1X2 (%) 1X3 (%) (1) (2) (3) (4) (5)
0.20 12 16 2.40 3.2 0.25 14 10 3.50 2.5 0.25 -7 28 -1.75 7.0 0.30 28 -2 8.40 -0.6
Average return 12.55 12.1
Hence the expected return from ABC = 12.55% and XYZ is 12.1%
Probability (ABC-ABC )
(ABC-ABC )2
1X3 (XYZ-XYZ
)
(XYZ-XYZ )
2
(1)X(6)
(1) (2) (3) (4) (5) (6) 0.20 -0.55 0.3025 0.06 3.9 15.21 3.04 0.25 1.45 2.1025 0.53 -2.1 4.41 1.10 0.25 -19.55 382.2025 95.55 15.9 252.81 63.20 0.30 15.45 238.7025 71.61 -14.1 198.81 59.64
167.75 126.98
σ 2 ABC = 167.75(%)2 ; σ ABC = 12.95% σ 2 XYZ = 126.98(%)2 ; σ XYZ = 11.27%
© The Institute of Chartered Accountants of India
Portfolio Theory 7.19
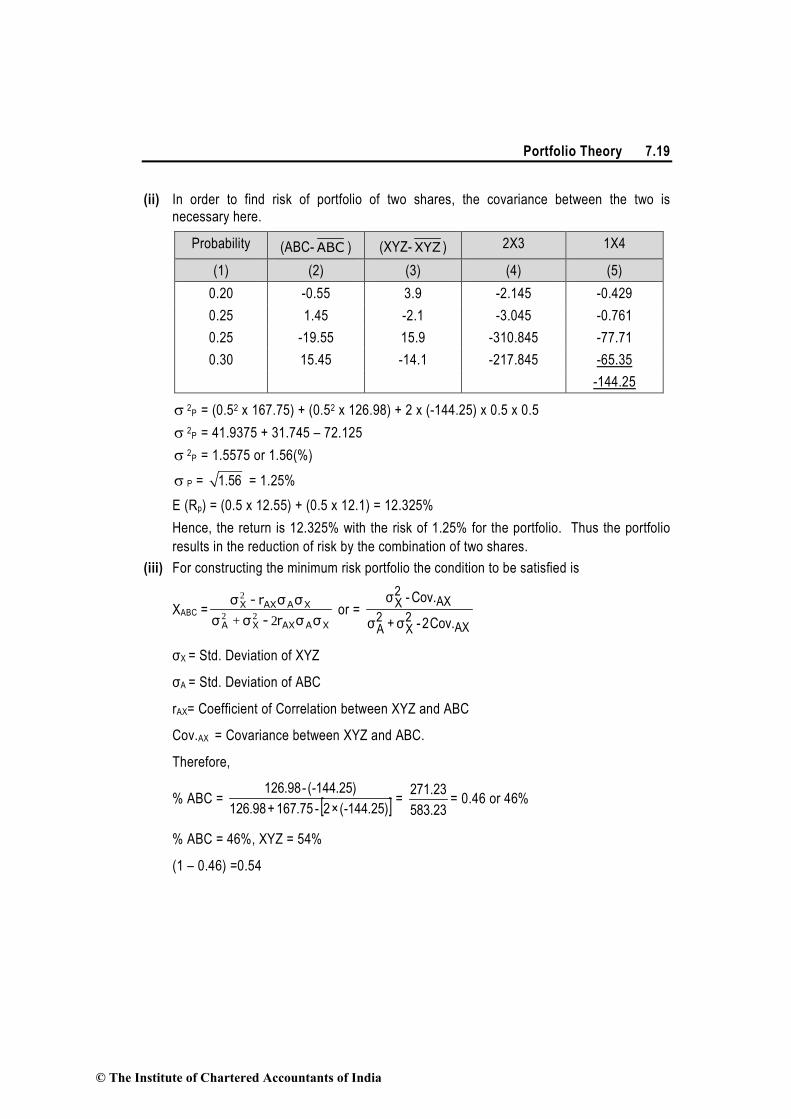
(ii) In order to find risk of portfolio of two shares, the covariance between the two is necessary here.
Probability (ABC-ABC ) (XYZ-XYZ ) 2X3 1X4
(1) (2) (3) (4) (5) 0.20 -0.55 3.9 -2.145 -0.429 0.25 1.45 -2.1 -3.045 -0.761 0.25 -19.55 15.9 -310.845 -77.71 0.30 15.45 -14.1 -217.845 -65.35
-144.25
σ 2P = (0.52 x 167.75) + (0.52 x 126.98) + 2 x (-144.25) x 0.5 x 0.5 σ 2P = 41.9375 + 31.745 – 72.125 σ 2P = 1.5575 or 1.56(%) σ P = 1.56 = 1.25% E (Rp) = (0.5 x 12.55) + (0.5 x 12.1) = 12.325%
Hence, the return is 12.325% with the risk of 1.25% for the portfolio. Thus the portfolio results in the reduction of risk by the combination of two shares.
(iii) For constructing the minimum risk portfolio the condition to be satisfied is
XABC =XAAXXA
XAAXX
σσr-σσσσr-σ
2+ 22
2
or = AX
2X
2A
AX2X
ov.C2-σ+σ
ov.C-σ
σX = Std. Deviation of XYZ
σA = Std. Deviation of ABC
rAX= Coefficient of Correlation between XYZ and ABC
Cov.AX = Covariance between XYZ and ABC.
Therefore,
% ABC = [ ])25.144-(×2-75.167+98.126)25.144-(-98.126
= 271.23583.23
= 0.46 or 46%
% ABC = 46%, XYZ = 54%
(1 – 0.46) =0.54
© The Institute of Chartered Accountants of India

7.20 Strategic Financial Management
Question 18 The following information are available with respect of Krishna Ltd.
Year Krishna Ltd.
Average share price
Dividend per Share
Average Market Index
Dividend Yield
Return on Govt. bonds
` `
2012 245 20 2013 4% 7%
2013 253 22 2130 5% 6%
2014 310 25 2350 6% 6%
2015 330 30 2580 7% 6%
Compute Beta Value of the Krishna Ltd. at the end of 2015 and state your observation.
Answer (i) Computation of Beta Value
Calculation of Returns
Returns D (P P )
P1001 1 0
0=
+ −×
Year Returns
2012 – 13 100245
245)(25322×
−+ = 12.24%
2013 – 14 100253
253)(31025×
−+ = 32.41%
2014 – 15 100310
310)(33030×
−+ = 16.13%
Calculation of Returns from market Index
Year % of Index Appreciation Dividend Yield % Total Return %
2012–13 1002013
2013)(2130×
− = 5.81% 5% 10.81%
2013–14 1002130
2130)(2350×
− = 10.33% 6% 16.33%
© The Institute of Chartered Accountants of India

Portfolio Theory 7.21
2014–15 1002350
2350)(2580×
− = 9.79% 7% 16.79%
Computation of Beta
Year Krishna Ltd. (X) Market Index (Y) XY Y2
2012–13 12.24% 10.81% 132.31 116.86
2013–14 32.41% 16.33% 529.25 266.67
2014–15 16.13% 16.79% 270.82 281.90
Total 60.78% 43.93% 932.38 665.43
Average Return of Krishna Ltd. = 360.78
= 20.26%
Average Market Return = 3
43.93 = 14.64%
Beta (β) = ( )∑∑
−22 YnY
Y Xn -XY= 23(14.64)665.43
14.64×20.26×3-932.38-
= 1.897
(ii) Observation
Expected Return (%) Actual Return (%) Action
2012 – 13 6%+ 1.897(10.81% - 6%) = 15.12% 12.24% Sell
2013 – 14 6%+ 1.897(16.33% - 6%) = 25.60% 32.41% Buy
2014 – 15 6%+ 1.897(16.79% - 6%) = 26.47% 16.13% Sell
Question 19
The distribution of return of security ‘F’ and the market portfolio ‘P’ is given below:
Probability Return %
F P
0.30 30 -10
0.40 20 20
0.30 0 30
© The Institute of Chartered Accountants of India
7.22 Strategic Financial Management
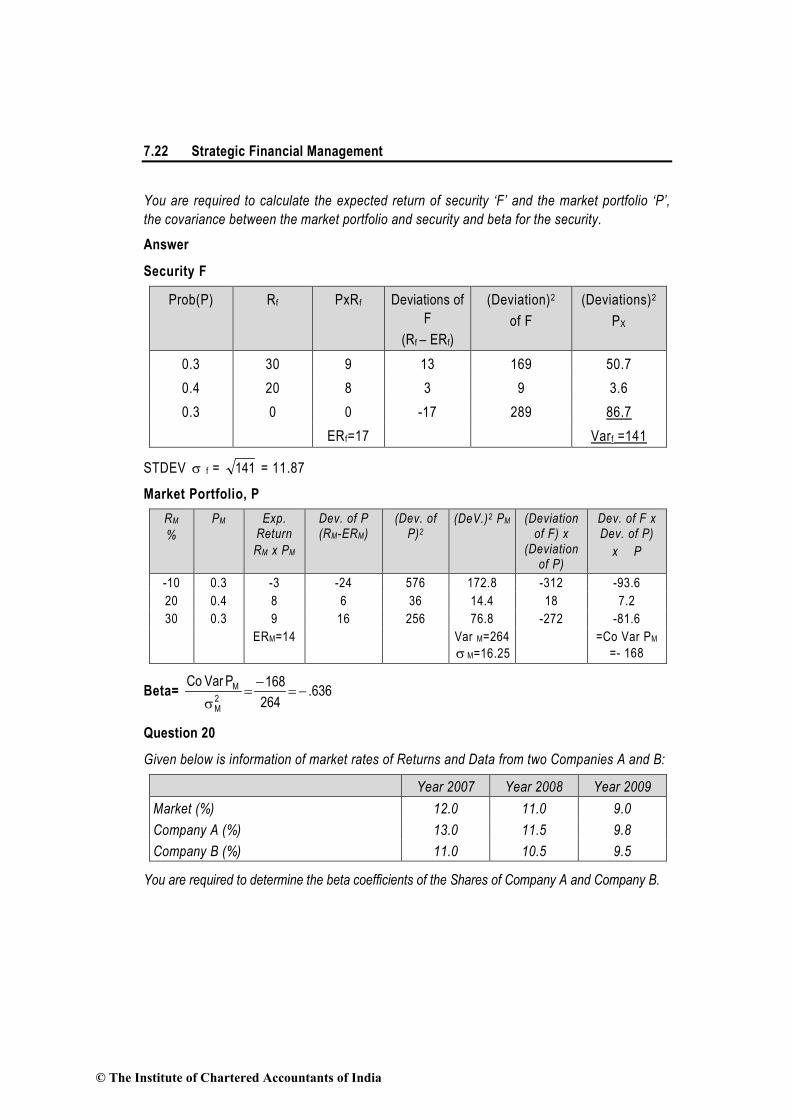
You are required to calculate the expected return of security ‘F’ and the market portfolio ‘P’, the covariance between the market portfolio and security and beta for the security.
Answer
Security F
Prob(P) Rf PxRf Deviations of F
(Rf – ERf)
(Deviation)2
of F (Deviations)2
PX
0.3 30 9 13 169 50.7 0.4 20 8 3 9 3.6 0.3 0 0 -17 289 86.7
ERf=17 Varf =141
STDEV σ f = 141 = 11.87
Market Portfolio, P RM
%
PM Exp. Return
RM x PM
Dev. of P (RM-ERM)
(Dev. of P)2
(DeV.)2 PM (Deviation of F) x
(Deviation of P)
Dev. of F x Dev. of P)
x P
-10 0.3 -3 -24 576 172.8 -312 -93.6 20 0.4 8 6 36 14.4 18 7.2 30 0.3 9 16 256 76.8 -272 -81.6
ERM=14 Var M=264 σ M=16.25
=Co Var PM =- 168
Beta= 636.264168PVarCo
2M
M −=−
=σ
Question 20
Given below is information of market rates of Returns and Data from two Companies A and B:
Year 2007 Year 2008 Year 2009 Market (%) 12.0 11.0 9.0 Company A (%) 13.0 11.5 9.8 Company B (%) 11.0 10.5 9.5
You are required to determine the beta coefficients of the Shares of Company A and Company B.
© The Institute of Chartered Accountants of India

Portfolio Theory 7.23
Answer Company A:
Year Return % (Ra) Market return % (Rm)
Deviation R(a)
Deviation Rm
D Ra × DRm
Rm2
1 13.0 12.0 1.57 1.33 2.09 1.77 2 11.5 11.0 0.07 0.33 0.02 0.11 3 9.8 9.0 −1.63 −1.67 2.72 2.79 34.3 32.0 4.83 4.67
Average Ra = 11.43 Average Rm = 10.67
Covariance = N)R-(R)R-(R ∑ aamm
Covariance = 1.61 = 34.83
Variance (σm2) = N)R-(R 2
mm∑
= 1.557 = 34.67
1.03 = 1.5571.61
= β
Company B:
Year Return % (Rb) Market return % (Rm)
Deviation R(b)
Deviation Rm
D Rb × D Rm
Rm2
1 11.0 12.0 0.67 1.33 0.89 1.77 2 10.5 11.0 0.17 0.33 0.06 0.11 3 9.5 9.0 −0.83 −1.67 1.39 2.79 31.0 32.0 2.34 4.67
Average Rb = 10.33 Average Rm = 10.67
© The Institute of Chartered Accountants of India

7.24 Strategic Financial Management
Covariance = N)R-(R)R-(R bbmm∑
Covariance = 0.78 = 32.34
Variance (σm2) = N)R-(R 2
mm∑
= 1.557 = 34.67
0.50 = 1.5570.78
= β
Question 21 The returns on stock A and market portfolio for a period of 6 years are as follows:
Year Return on A (%) Return on market portfolio (%) 1 12 8 2 15 12 3 11 11 4 2 -4 5 10 9.5 6 -12 -2
You are required to determine: (i) Characteristic line for stock A (ii) The systematic and unsystematic risk of stock A. Answer Characteristic line is given by
ii βα + Rm
βi = 22 )(xnx
yxnxy−Σ−Σ
αi = xβy −
© The Institute of Chartered Accountants of India

Portfolio Theory 7.25
Return on A (Y)
Return on
market (X)
xy x2 (x- )x (x- 2)x (y- )y (y- 2)y
12 8 96 64 2.25 5.06 5.67 32.15 15 12 180 144 6.25 39.06 8.67 75.17 11 11 121 121 5.25 27.56 4.67 21.81 2 -4 -8 16 -9.75 95.06 -4.33 18.75
10 9.5 95 90.25 3.75 14.06 3.67 13.47 -12 -2_ 24 4 -7.75 60.06 -18.33 335.99 38 34.5 508 439.25 240.86 497.34
y = 638 = 6.33
x = 65.34 = 5.75
iβ = 22 )x(nxyxnxy
−Σ−Σ = 2)75.5(625.439
)33.6()75.5(6508−
− = 375.19825.439
385.218508−
−
= 875.240615.289 = 1.202
α = y - β x = 6.33 – 1.202 (5.75) = - 0.58
Hence the characteristic line is -0.58 + 1.202 (Rm)
Total Risk of Market = 2mσ = n
)xx( 2-Σ = 686.240
= 40.14(%)
Total Risk of Stock = 6
34.497 = 82.89 (%)
Systematic Risk = 2βi 2mσ = (1.202)2 x 40.14 = 57.99(%)
Unsystematic Risk is = Total Risk – Systematic Risk = 82.89 - 57.99 = 24.90(%) Question 22
The rates of return on the security of Company X and market portfolio for 10 periods are given below:
© The Institute of Chartered Accountants of India

7.26 Strategic Financial Management
Period Return of Security X (%) Return on Market Portfolio (%) 1 20 22 2 22 20 3 25 18 4 21 16 5 18 20 6 −5 8 7 17 −6 8 19 5 9 −7 6
10 20 11
(i) What is the beta of Security X? (ii) What is the characteristic line for Security X?
Answer
(i)
Period XR MR XX RR − MM RR − ( )XX RR − ( )MM RR − ( )2MM RR −
1 20 22 5 10 50 100 2 22 20 7 8 56 64 3 25 18 10 6 60 36 4 21 16 6 4 24 16 5 18 20 3 8 24 64 6 -5 8 -20 -4 80 16 7 17 -6 2 -18 -36 324 8 19 5 4 -7 -28 49 9 -7 6 -22 -6 132 36
10 20 11 5 -1 -5 1 150 120 357 706 ΣRX ΣRM )RR)(R(R MMXX −−∑ 2
MM )RR( −∑
XR = 15 MR = 12
© The Institute of Chartered Accountants of India

Portfolio Theory 7.27
σ2 M = n
RR2
MM∑
−
−
=10706 = 70.60
CovX M= n
RRRR MMXX∑
−
−
−−
=10357 = 35.70
Betax = M
2MXCov
σ m =
60.7070.35 = 0.505
Alternative Solution
Period X Y Y2 XY 1 20 22 484 440 2 22 20 400 440 3 25 18 324 450 4 21 16 256 336 5 18 20 400 360 6 -5 8 64 -40 7 17 -6 36 -102 8 19 5 25 95 9 -7 6 36 -42
10 20 11 121 220 150 120 2146 2157 X = 15 Y = 12
= 22 --
)(XnXYXnXY
ΣΣ
= 12×12×10-214612×15×10-2157
= 706357
= 0.506
(ii) XR = 15 MR = 12
y = α + βx
15 = α + 0.505 × 12
Alpha (α) = 15 – (0.505 × 12) = 8.94%
© The Institute of Chartered Accountants of India

7.28 Strategic Financial Management
Characteristic line for security X = α + β × RM
Where, RM = Expected return on Market Index
∴Characteristic line for security X = 8.94 + 0.505 RM Question 23
Expected returns on two stocks for particular market returns are given in the following table:
Market Return Aggressive Defensive 7% 4% 9%
25% 40% 18%
You are required to calculate: (a) The Betas of the two stocks. (b) Expected return of each stock, if the market return is equally likely to be 7% or 25%. (c) The Security Market Line (SML), if the risk free rate is 7.5% and market return is equally
likely to be 7% or 25%. (d) The Alphas of the two stocks.
Answer (a) The Betas of two stocks: Aggressive stock - 40% - 4%/25% - 7% = 2 Defensive stock - 18% - 9%/25% - 7% = 0.50 Alternatively, it can also be solved by using the Characteristic Line Relationship as follows: Rs = α + βRm
Where α = Alpha β = Beta Rm= Market Return For Aggressive Stock 4% = α + β(7%) 40% = α + β(25%) 36% = β(18%) β = 2
© The Institute of Chartered Accountants of India

Portfolio Theory 7.29
For Defensive Stock 9% = α + β(7%) 18% = α + β(25%) 9% = β(18%) β =0.50 (b) Expected returns of the two stocks:- Aggressive stock - 0.5 x 4% + 0.5 x 40% = 22% Defensive stock - 0.5 x 9% + 0.5 x 18% = 13.5% (c) Expected return of market portfolio = 0.5 x 7% + 0.5% x 25% = 16% ∴ Market risk prem. = 16% - 7.5% = 8.5% ∴ SML is, required return = 7.5% + βi 8.5% (d) Rs = α + βRm
For Aggressive Stock 22% = αA + 2(16%) αA = -10% For Defensive Stock 13.5% = αD + 0.50(16%) αD = 5.5% Question 24 A study by a Mutual fund has revealed the following data in respect of three securities:
Security σ (%) Correlation with Index, Pm
A 20 0.60 B 18 0.95 C 12 0.75
The standard deviation of market portfolio (BSE Sensex) is observed to be 15%. (i) What is the sensitivity of returns of each stock with respect to the market? (ii) What are the covariances among the various stocks? (iii) What would be the risk of portfolio consisting of all the three stocks equally? (iv) What is the beta of the portfolio consisting of equal investment in each stock? (v) What is the total, systematic and unsystematic risk of the portfolio in (iv) ?
© The Institute of Chartered Accountants of India

7.30 Strategic Financial Management
Answer (i) Sensitivity of each stock with market is given by its beta. Standard deviation of market Index = 15% Variance of market Index = 0.0225 Beta of stocks = σi r/σ m
A = 20 × 0.60/15 = 0.80 B = 18 × 0.95/15 = 1.14 C = 12 × 0.75/15 = 0.60
(ii) Covariance between any 2 stocks = ββ1 2σ 2m
Covariance matrix
Stock/Beta 0.80 1.14 0.60 A 400.000 205.200 108.000 B 205.200 324.000 153.900 C 108.000 153.900 144.000
(iii) Total risk of the equally weighted portfolio (Variance) = 400(1/3)2 + 324(1/3)2 + 144(1/3)2
+ 2 (205.20)(1/3)2 + 2(108.0)(1/3)2 + 2(153.900) (1/3)2 = 200.244
(iv) β of equally weighted portfolio = β p = ∑ β i/N = 3
0.601.140.80 ++
= 0.8467 (v) Systematic Risk β P2σ m2 = (0.8467)2 (15)2 =161.302
Unsystematic Risk = Total Risk – Systematic Risk = 200.244 – 161.302 = 38.942 Question 25 Mr. X owns a portfolio with the following characteristics:
Security A Security B Risk Free security Factor 1 sensitivity 0.80 1.50 0 Factor 2 sensitivity 0.60 1.20 0 Expected Return 15% 20% 10%
It is assumed that security returns are generated by a two factor model.
© The Institute of Chartered Accountants of India
Portfolio Theory 7.31
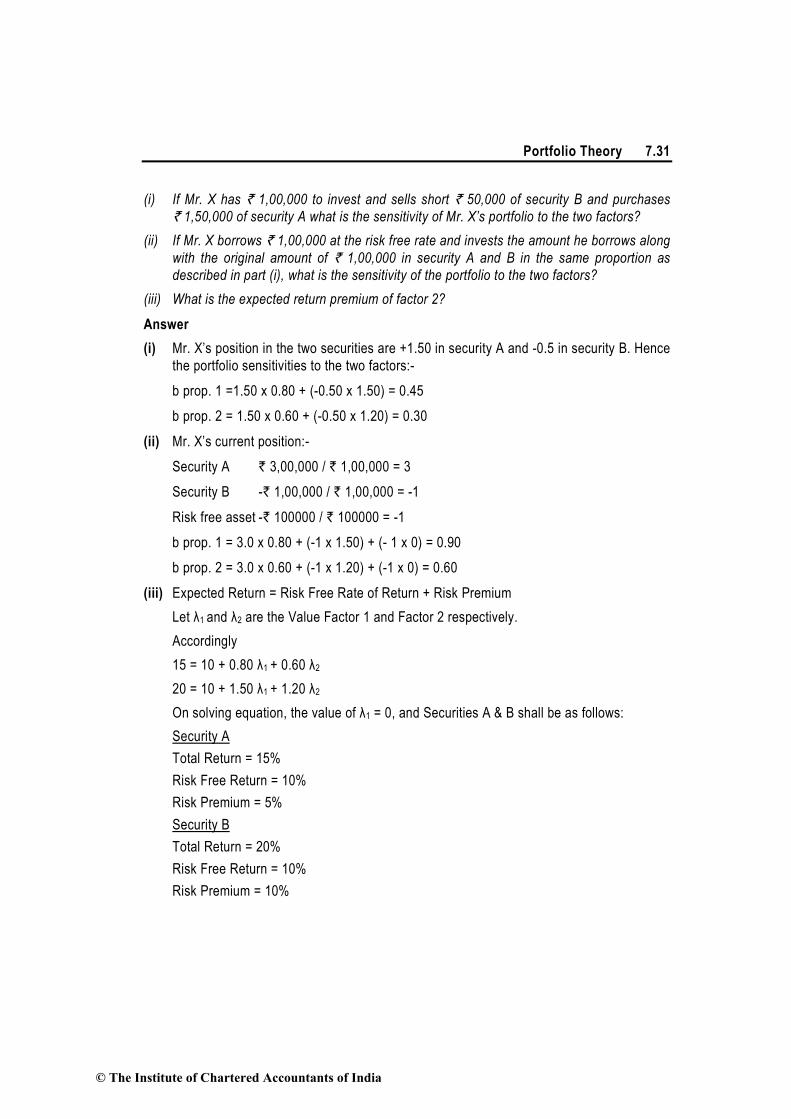
(i) If Mr. X has ` 1,00,000 to invest and sells short ` 50,000 of security B and purchases ` 1,50,000 of security A what is the sensitivity of Mr. X’s portfolio to the two factors?
(ii) If Mr. X borrows ` 1,00,000 at the risk free rate and invests the amount he borrows along with the original amount of ` 1,00,000 in security A and B in the same proportion as described in part (i), what is the sensitivity of the portfolio to the two factors?
(iii) What is the expected return premium of factor 2?
Answer (i) Mr. X’s position in the two securities are +1.50 in security A and -0.5 in security B. Hence
the portfolio sensitivities to the two factors:- b prop. 1 =1.50 x 0.80 + (-0.50 x 1.50) = 0.45 b prop. 2 = 1.50 x 0.60 + (-0.50 x 1.20) = 0.30 (ii) Mr. X’s current position:-
Security A ` 3,00,000 / ` 1,00,000 = 3 Security B -` 1,00,000 / ` 1,00,000 = -1 Risk free asset -` 100000 / ` 100000 = -1 b prop. 1 = 3.0 x 0.80 + (-1 x 1.50) + (- 1 x 0) = 0.90 b prop. 2 = 3.0 x 0.60 + (-1 x 1.20) + (-1 x 0) = 0.60
(iii) Expected Return = Risk Free Rate of Return + Risk Premium Let λ1 and λ2 are the Value Factor 1 and Factor 2 respectively. Accordingly 15 = 10 + 0.80 λ1 + 0.60 λ2
20 = 10 + 1.50 λ1 + 1.20 λ2
On solving equation, the value of λ1 = 0, and Securities A & B shall be as follows: Security A Total Return = 15% Risk Free Return = 10% Risk Premium = 5% Security B Total Return = 20% Risk Free Return = 10% Risk Premium = 10%
© The Institute of Chartered Accountants of India
7.32 Strategic Financial Management
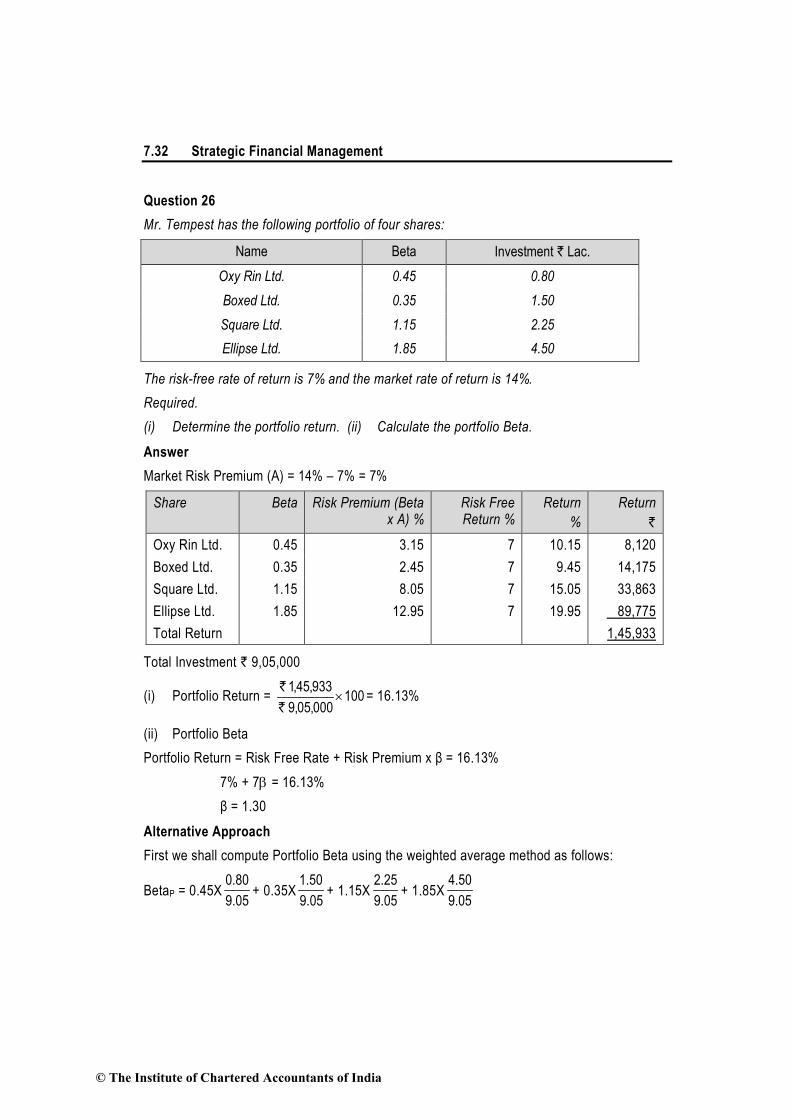
Question 26 Mr. Tempest has the following portfolio of four shares:
Name Beta Investment ` Lac. Oxy Rin Ltd. 0.45 0.80 Boxed Ltd. 0.35 1.50 Square Ltd. 1.15 2.25 Ellipse Ltd. 1.85 4.50
The risk-free rate of return is 7% and the market rate of return is 14%. Required. (i) Determine the portfolio return. (ii) Calculate the portfolio Beta. Answer Market Risk Premium (A) = 14% – 7% = 7%
Share Beta Risk Premium (Beta x A) %
Risk Free Return %
Return %
Return `
Oxy Rin Ltd. 0.45 3.15 7 10.15 8,120 Boxed Ltd. 0.35 2.45 7 9.45 14,175 Square Ltd. 1.15 8.05 7 15.05 33,863 Ellipse Ltd. 1.85 12.95 7 19.95 89,775 Total Return 1,45,933
Total Investment ` 9,05,000
(i) Portfolio Return = 100000,05,9933,45,1
× `
` = 16.13%
(ii) Portfolio Beta Portfolio Return = Risk Free Rate + Risk Premium х β = 16.13% 7% + 7β = 16.13% β = 1.30 Alternative Approach First we shall compute Portfolio Beta using the weighted average method as follows:
BetaP = 0.45X 05.980.0
+ 0.35X 05.950.1
+ 1.15X 05.925.2
+ 1.85X 05.950.4
© The Institute of Chartered Accountants of India
Portfolio Theory 7.33
= 0.45x0.0884+ 0.35X0.1657+ 1.15X0.2486+ 1.85X0.4972 = 0.0398+ 0.058 + 0.2859 + 0.9198 = 1.3035
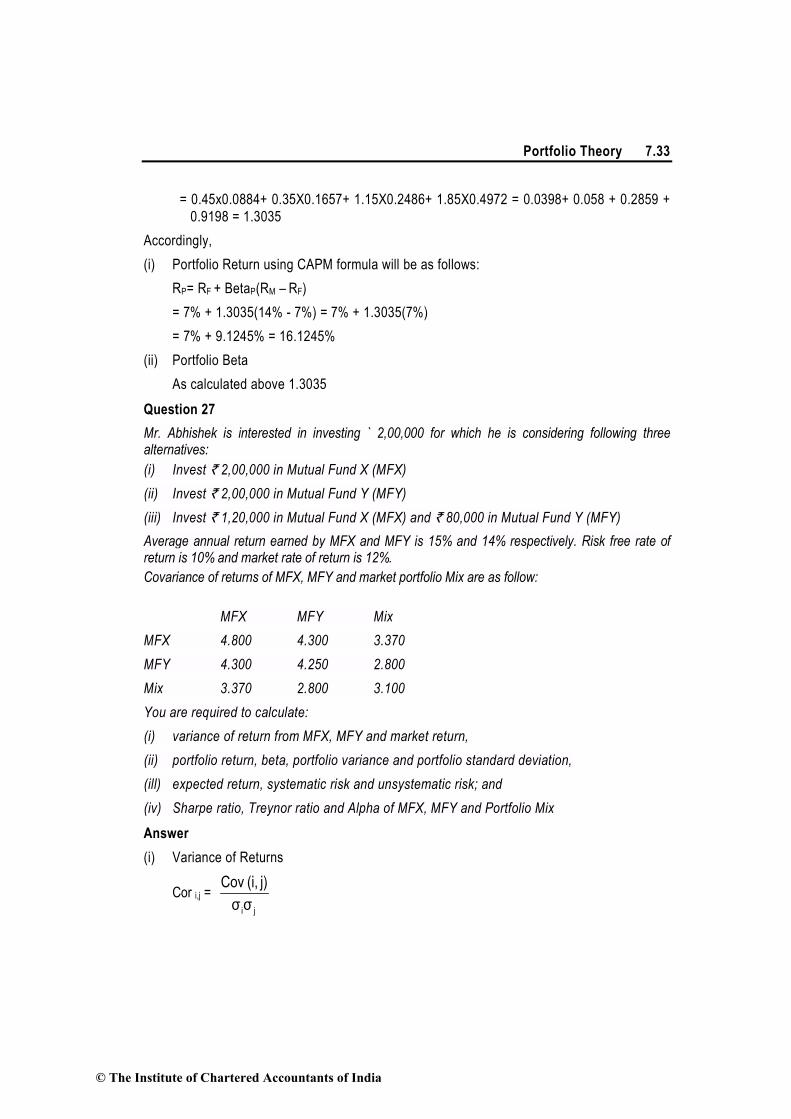
Accordingly, (i) Portfolio Return using CAPM formula will be as follows: RP= RF + BetaP(RM – RF) = 7% + 1.3035(14% - 7%) = 7% + 1.3035(7%) = 7% + 9.1245% = 16.1245% (ii) Portfolio Beta As calculated above 1.3035 Question 27 Mr. Abhishek is interested in investing ` 2,00,000 for which he is considering following three alternatives: (i) Invest ` 2,00,000 in Mutual Fund X (MFX) (ii) Invest ` 2,00,000 in Mutual Fund Y (MFY) (iii) Invest ` 1,20,000 in Mutual Fund X (MFX) and ` 80,000 in Mutual Fund Y (MFY) Average annual return earned by MFX and MFY is 15% and 14% respectively. Risk free rate of return is 10% and market rate of return is 12%. Covariance of returns of MFX, MFY and market portfolio Mix are as follow: MFX MFY Mix MFX 4.800 4.300 3.370 MFY 4.300 4.250 2.800 Mix 3.370 2.800 3.100 You are required to calculate: (i) variance of return from MFX, MFY and market return, (ii) portfolio return, beta, portfolio variance and portfolio standard deviation, (ill) expected return, systematic risk and unsystematic risk; and (iv) Sharpe ratio, Treynor ratio and Alpha of MFX, MFY and Portfolio Mix
Answer (i) Variance of Returns
Cor i,j = jiσσj)(i,Cov
© The Institute of Chartered Accountants of India

7.34 Strategic Financial Management
Accordingly, for MFX
1 = XXσσX)(X,Cov
2Xσ = 4.800
Accordingly, for MFY
1 = YYσσY)(Y,Cov
2Yσ = 4.250
Accordingly, for Market Return
1 = MMσσM)(M,Cov
2Mσ = 3.100
(ii) Portfolio return, beta, variance and standard deviation
Weight of MFX in portfolio = 2,00,0001,20,000 =0.60
Weight of MFY in portfolio = 2,00,00080,000 =0.40
Accordingly Portfolio Return 0.60 × 15% + 0.40 × 14% = 14.60% Beta of each Fund
( )MarketofVariance
MarketFund,Covβ =
3.1003.370β
X= = 1.087
3.1002.800β
Y= = 0.903
Portfolio Beta 0.60 x 1.087 + 0.40 x 0.903 = 1.013 Portfolio Variance
© The Institute of Chartered Accountants of India
Portfolio Theory 7.35
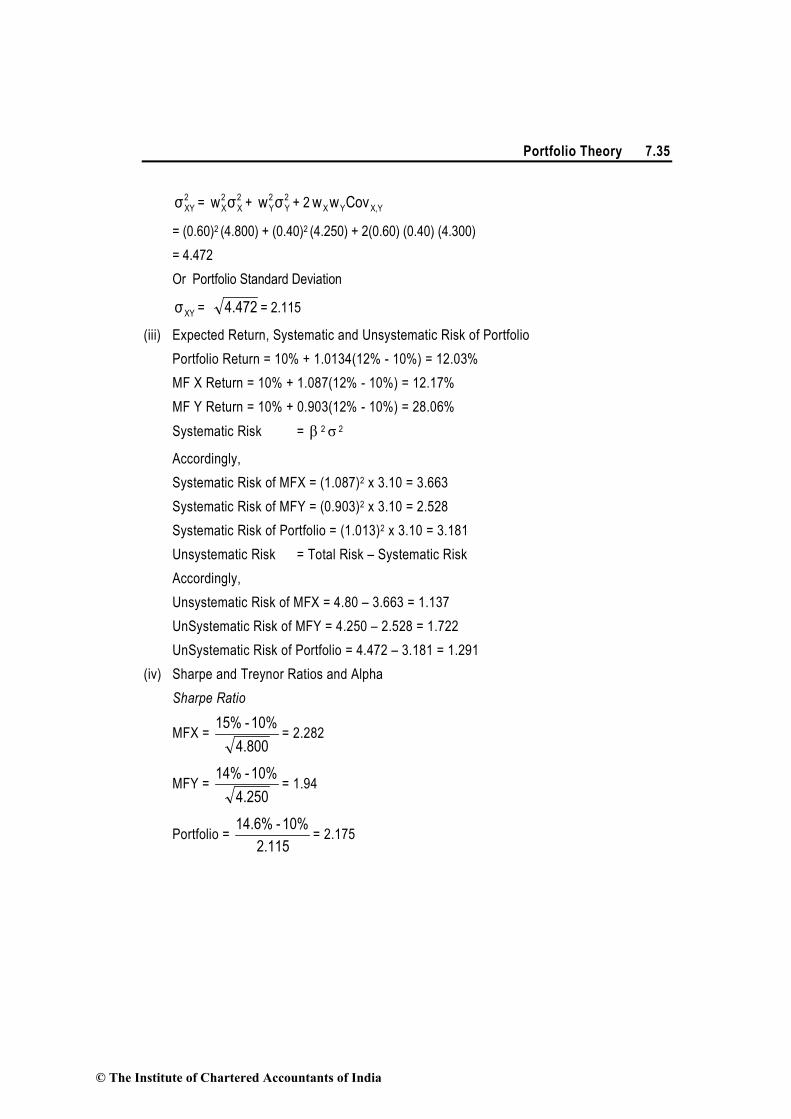
2XYσ = 2
X2Xσw + 2
Y2Yσw + 2 X,YYX Covww
= (0.60)2 (4.800) + (0.40)2 (4.250) + 2(0.60) (0.40) (4.300) = 4.472 Or Portfolio Standard Deviation
XYσ = 4.472 = 2.115
(iii) Expected Return, Systematic and Unsystematic Risk of Portfolio Portfolio Return = 10% + 1.0134(12% - 10%) = 12.03% MF X Return = 10% + 1.087(12% - 10%) = 12.17% MF Y Return = 10% + 0.903(12% - 10%) = 28.06% Systematic Risk = β 2σ 2
Accordingly, Systematic Risk of MFX = (1.087)2 x 3.10 = 3.663 Systematic Risk of MFY = (0.903)2 x 3.10 = 2.528 Systematic Risk of Portfolio = (1.013)2 x 3.10 = 3.181 Unsystematic Risk = Total Risk – Systematic Risk Accordingly, Unsystematic Risk of MFX = 4.80 – 3.663 = 1.137 UnSystematic Risk of MFY = 4.250 – 2.528 = 1.722 UnSystematic Risk of Portfolio = 4.472 – 3.181 = 1.291 (iv) Sharpe and Treynor Ratios and Alpha Sharpe Ratio
MFX = 4.800
10% - 15% = 2.282
MFY = 4.250
10% - 14% = 1.94
Portfolio = 2.115
10% - 14.6% = 2.175
© The Institute of Chartered Accountants of India

7.36 Strategic Financial Management
Treynor Ratio
MFX = 1.087
10% - 15% = 4.60
MFY = 0.903
10% - 14% = 4.43
Portfolio = 1.0134
10% - 14.6% = 4.54
Alpha MFX = 15% - 12.17% = 2.83% MFY = 14% - 11.81% = 2.19% Portfolio = 14.6% - 12.03% = 2.57% Question 28 Amal Ltd. has been maintaining a growth rate of 12% in dividends. The company has paid dividend @ ` 3 per share. The rate of return on market portfolio is 15% and the risk-free rate of return in the market has been observed as10%. The beta co-efficient of the company’s share is 1.2. You are required to calculate the expected rate of return on the company’s shares as per CAPM model and the equilibirium price per share by dividend growth model.
Answer Capital Asset Pricing Model (CAPM) formula for calculation of expected rate of return is ER = Rf + β (Rm – Rf) ER = Expected Return β = Beta of Security Rm = Market Return Rf = Risk free Rate = 10 + [1.2 (15 – 10)] = 10 + 1.2 (5) = 10 + 6 = 16% or 0.16 Applying dividend growth mode for the calculation of per share equilibrium price:-
ER = g+PD
01
© The Institute of Chartered Accountants of India

Portfolio Theory 7.37
or 0.16 = 0
3(1.12) 0.12P
+ or 0.16 – 0.12 = 0
3.36P
or 0.04 P0 = 3.36 or P0 = 3.360.04
= ` 84
Therefore, equilibrium price per share will be ` 84. Question 29 The following information is available in respect of Security X
Equilibrium Return 15% Market Return 15% 7% Treasury Bond Trading at $140 Covariance of Market Return and Security Return 225% Coefficient of Correlation 0.75
You are required to determine the Standard Deviation of Market Return and Security Return.
Answer First we shall compute the β of Security X.
Risk Free Rate = Coupon PaymentCurrent Market Price
= 7140
= 5%
Assuming equilibrium return to be equal to CAPM return then:
15% = Rf + βX(Rm- Rf)
15%= 5% + βX(15%- 5%)
βX = 1
or it can also be computed as follows:
15%15%
RR
s
m = = 1
(i) Standard Deviation of Market Return
βm = X,m2m
Covσ
= 2m
225%σ
=1
σ2m = 225
© The Institute of Chartered Accountants of India

7.38 Strategic Financial Management
σm = 225 = 15% (ii) Standard Deviation of Security Return
βX = XXm
m
σ×ρ
σ= X 0.75
15σ
× =1
σX = 150.75
= 20%
Question 30 Assuming that shares of ABC Ltd. and XYZ Ltd. are correctly priced according to Capital Asset Pricing Model. The expected return from and Beta of these shares are as follows:
Share Beta Expected return ABC 1.2 19.8% XYZ 0.9 17.1%
You are required to derive Security Market Line.
Answer CAPM = Rf+ β (Rm –Rf) Accordingly RABC = Rf+1.2 (Rm – Rf) = 19.8 RXYZ = Rf+ 0.9 (Rm – Rf) = 17.1 19.8 = Rf+1.2 (Rm – Rf) ------(1) 17.1 = Rf+0.9 (Rm – Rf) ------(2) Deduct (2) from (1) 2.7 = 0.3 (Rm – R f) Rm – Rf = 9 Rf = Rm – 9 Substituting in equation (1) 19.8 = (Rm – 9) + 1.2 (Rm – Rm+ 9) 19.8 = Rm - 9 + 10.8 19.8 = Rm+1.8 Then Rm=18% and Rf= 9% Security Market Line = Rf+ β (Market Risk Premium) = 9% + β× 9%
© The Institute of Chartered Accountants of India

Portfolio Theory 7.39
Question 31 A Ltd. has an expected return of 22% and Standard deviation of 40%. B Ltd. has an expected return of 24% and Standard deviation of 38%. A Ltd. has a beta of 0.86 and B Ltd. a beta of 1.24. The correlation coefficient between the return of A Ltd. and B Ltd. is 0.72. The Standard deviation of the market return is 20%. Suggest: (i) Is investing in B Ltd. better than investing in A Ltd.? (ii) If you invest 30% in B Ltd. and 70% in A Ltd., what is your expected rate of return and
portfolio Standard deviation? (iii) What is the market portfolios expected rate of return and how much is the risk-free rate? (iv) What is the beta of Portfolio if A Ltd.’s weight is 70% and B Ltd.’s weight is 30%?
Answer (i) A Ltd. has lower return and higher risk than B Ltd. investing in B Ltd. is better than in A
Ltd. because the returns are higher and the risk, lower. However, investing in both will yield diversification advantage.
(ii) rAB = .22 × 0.7 + .24 × 0.3 = 22.6%
= σ2AB 0.402 X 0.72 + 0.382 X 0.32 + 2X 0.7 X 0.3 X 0.72 X 0.40 X 0.38 =0.1374
2ABAB σ=σ *37% .37 .1374 ===
* Answer = 37.06% is also correct and variation may occur due to approximation. (iii) This risk-free rate will be the same for A and B Ltd. Their rates of return are given as
follows: rA = 22 = rf + (rm – rf) 0.86 rB = 24 = rf + (rm – rf) 1.24 rA – rB = –2 = (rm – rf) (–0.38) rm – rf = –2/–0.38 = 5.26% rA = 22 = rf + (5.26) 0.86 rf = 17.5%* rB = 24 = rf + (5.26) 1.24 rf = 17.5%* rm – 17.5 = 5.26 rm = 22.76%**
© The Institute of Chartered Accountants of India

7.40 Strategic Financial Management
*Answer = 17.47% might occur due to variation in approximation. **Answer may show small variation due to approximation. Exact answer is 22.73%. (iv) βAB = βA × WA + βB × WB = 0.86 × 0.7 + 1.24 × 0.3 = 0.974 Question 32
XYZ Ltd. has substantial cash flow and until the surplus funds are utilised to meet the future capital expenditure, likely to happen after several months, are invested in a portfolio of short-term equity investments, details for which are given below:
Investment No. of shares Beta Market price per share `
Expected dividend yield
I 60,000 1.16 4.29 19.50%
II 80,000 2.28 2.92 24.00%
III 1,00,000 0.90 2.17 17.50%
IV 1,25,000 1.50 3.14 26.00%
The current market return is 19% and the risk free rate is 11%. Required to: (i) Calculate the risk of XYZ’s short-term investment portfolio relative to that of the market; (ii) Whether XYZ should change the composition of its portfolio.
Answer (i) Computation of Beta of Portfolio
Investment No. of shares
Market Price
Market Value
Dividend Yield
Dividend Composition β Weighted β
I. 60,000 4.29 2,57,400 19.50% 50,193 0.2339 1.16 0.27
II. 80,000 2.92 2,33,600 24.00% 56,064 0.2123 2.28 0.48
III. 1,00,000 2.17 2,17,000 17.50% 37,975 0.1972 0.90 0.18
IV. 1,25,000 3.14 3,92,500 26.00% 1,02,050 0.3566 1.50 0.53
11,00,500 2,46,282 1.0000 1.46
Return of the Portfolio 2238.0500,00,11282,46,2
=
Beta of Port Folio 1.46
© The Institute of Chartered Accountants of India
Portfolio Theory 7.41
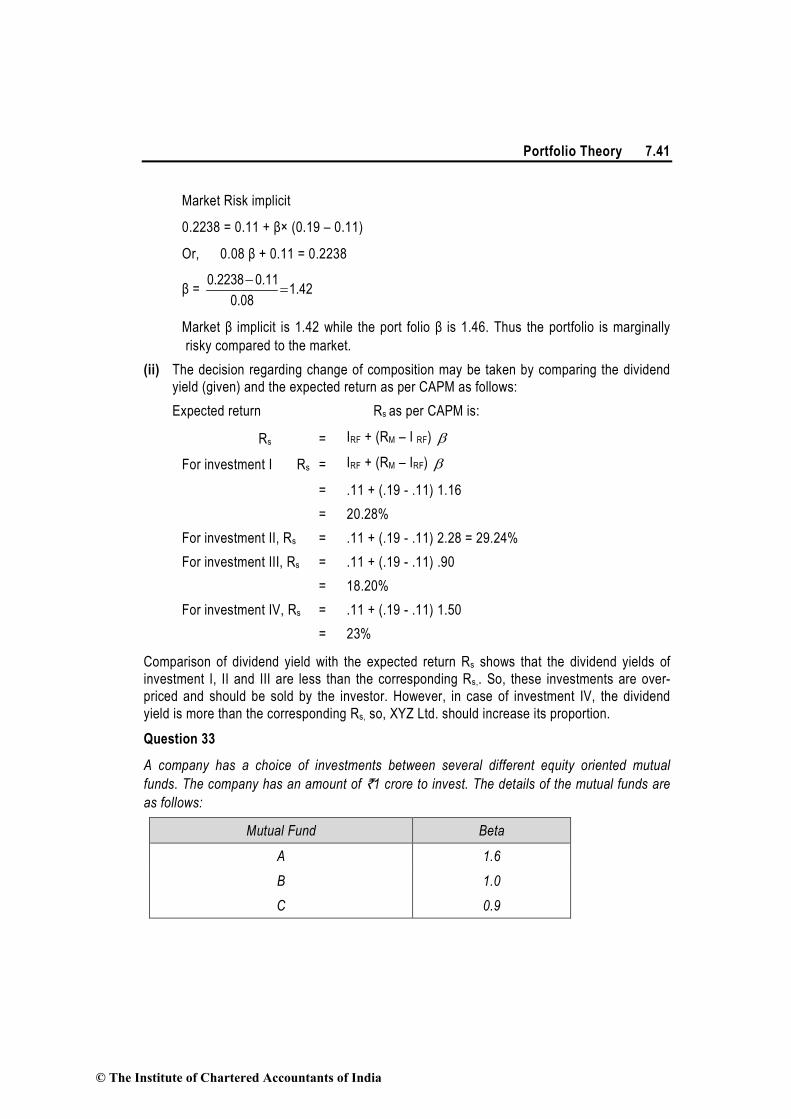
Market Risk implicit
0.2238 = 0.11 + β× (0.19 – 0.11)
Or, 0.08 β + 0.11 = 0.2238
β = 42.108.0
11.02238.0=
−
Market β implicit is 1.42 while the port folio β is 1.46. Thus the portfolio is marginally risky compared to the market.
(ii) The decision regarding change of composition may be taken by comparing the dividend yield (given) and the expected return as per CAPM as follows: Expected return Rs as per CAPM is:
Rs = IRF + (RM – I RF) β
For investment I Rs = IRF + (RM – IRF) β
= .11 + (.19 - .11) 1.16 = 20.28% For investment II, Rs = .11 + (.19 - .11) 2.28 = 29.24% For investment III, Rs = .11 + (.19 - .11) .90 = 18.20% For investment IV, Rs = .11 + (.19 - .11) 1.50 = 23%
Comparison of dividend yield with the expected return Rs shows that the dividend yields of investment I, II and III are less than the corresponding Rs,. So, these investments are over-priced and should be sold by the investor. However, in case of investment IV, the dividend yield is more than the corresponding Rs, so, XYZ Ltd. should increase its proportion. Question 33
A company has a choice of investments between several different equity oriented mutual funds. The company has an amount of `1 crore to invest. The details of the mutual funds are as follows:
Mutual Fund Beta
A 1.6 B 1.0 C 0.9
© The Institute of Chartered Accountants of India

7.42 Strategic Financial Management
D 2.0 E 0.6
Required: (i) If the company invests 20% of its investment in each of the first two mutual funds and an
equal amount in the mutual funds C, D and E, what is the beta of the portfolio? (ii) If the company invests 15% of its investment in C, 15% in A, 10% in E and the balance in
equal amount in the other two mutual funds, what is the beta of the portfolio? (iii) If the expected return of market portfolio is 12% at a beta factor of 1.0, what will be the
portfolios expected return in both the situations given above?
Answer
With 20% investment in each MF Portfolio Beta is the weighted average of the Betas of various securities calculated as below: (i)
Investment Beta (β) Investment (` Lacs)
Weighted Investment
A 1.6 20 32 B 1.0 20 20 C 0.9 20 18 D 2.0 20 40 E 0.6 20 12 100 122 Weighted Beta (β) = 1.22
(ii) With varied percentages of investments portfolio beta is calculated as follows: Investment Beta (β) Investment
(` Lacs) Weighted
Investment A 1.6 15 24 B 1.0 30 30 C 0.9 15 13.5 D 2.0 30 60 E 0.6 10 6 100 133.5 Weighted Beta (β) = 1.335
© The Institute of Chartered Accountants of India

Portfolio Theory 7.43
(iii) Expected return of the portfolio with pattern of investment as in case (i) = 12% × 1.22 i.e. 14.64% Expected Return with pattern of investment as in case (ii) = 12% × 1.335 i.e., 16.02%.
Question 34 Suppose that economy A is growing rapidly and you are managing a global equity fund and so far you have invested only in developed-country stocks only. Now you have decided to add stocks of economy A to your portfolio. The table below shows the expected rates of return, standard deviations, and correlation coefficients (all estimates are for aggregate stock market of developed countries and stock market of Economy A).
Developed Country Stocks
Stocks of Economy A
Expected rate of return (annualized percentage)
10 15
Risk [Annualized Standard Deviation (%)] 16 30
Correlation Coefficient (ρ ) 0.30
Assuming the risk-free interest rate to be 3%, you are required to determine: (a) What percentage of your portfolio should you allocate to stocks of Economy A if you want
to increase the expected rate of return on your portfolio by 0.5%? (b) What will be the standard deviation of your portfolio assuming that stocks of Economy A
are included in the portfolio as calculated above? (c) Also show how well the Fund will be compensated for the risk undertaken due to
inclusion of stocks of Economy A in the portfolio?
Answer (a) Let the weight of stocks of Economy A is expressed as w, then (1- w)×10.0 + w ×15.0 = 10.5 i.e. w = 0.1 or 10%. (b) Variance of portfolio shall be: (0.9)2 (0.16) 2 + (0.1)2 (0.30) 2+ 2(0.9) (0.1) (0.16) (0.30) (0.30) = 0.02423 Standard deviation is (0.02423)½= 0.15565 or 15.6%. (c) The Sharpe ratio will improve by approximately 0.04, as shown below:
Sharpe Ratio = Expected Return - RiskFreeRate of ReturnStandard Deviation
© The Institute of Chartered Accountants of India

7.44 Strategic Financial Management
Investment only in developed countries:16
310 -= 0.437
With inclusion of stocks of Economy A: 6.15
35.10 - = 0.481
Question 35 Mr. FedUp wants to invest an amount of ` 520 lakhs and had approached his Portfolio Manager. The Portfolio Manager had advised Mr. FedUp to invest in the following manner:
Security Moderate Better Good Very Good Best Amount (in ` Lakhs) 60 80 100 120 160 Beta 0.5 1.00 0.80 1.20 1.50
You are required to advise Mr. FedUp in regard to the following, using Capital Asset Pricing Methodology: (i) Expected return on the portfolio, if the Government Securities are at 8% and the NIFTY is
yielding 10%. (ii) Advisability of replacing Security 'Better' with NIFTY.
Answer (i) Computation of Expected Return from Portfolio
Security Beta (β)
Expected Return (r) as per CAPM
Amount (` Lakhs)
Weights (w)
wr
Moderate 0.50 8%+0.50(10% - 8%) = 9% 60 0.115 1.035 Better 1.00 8%+1.00(10% - 8%) = 10% 80 0.154 1.540 Good 0.80 8%+0.80(10% - 8%) = 9.60% 100 0.192 1.843 Very Good 1.20 8%+1.20(10% - 8%) = 10.40% 120 0.231 2.402 Best 1.50 8%+1.50(10% - 8%) = 11% 160 0.308 3.388 Total 520 1 10.208
Thus Expected Return from Portfolio 10.208% say 10.21%. Alternatively, it can be computed as follows:
Average β = 0.50 x 60520
+ 1.00 x 80520
+ 0.80 x 100520
+ 1.20 x 120520
+ 1.50 x 160520
= 1.104
As per CAPM
= 0.08 + 1.104(0.10 – 0.08) = 0.10208 i.e. 10.208%
© The Institute of Chartered Accountants of India
Portfolio Theory 7.45
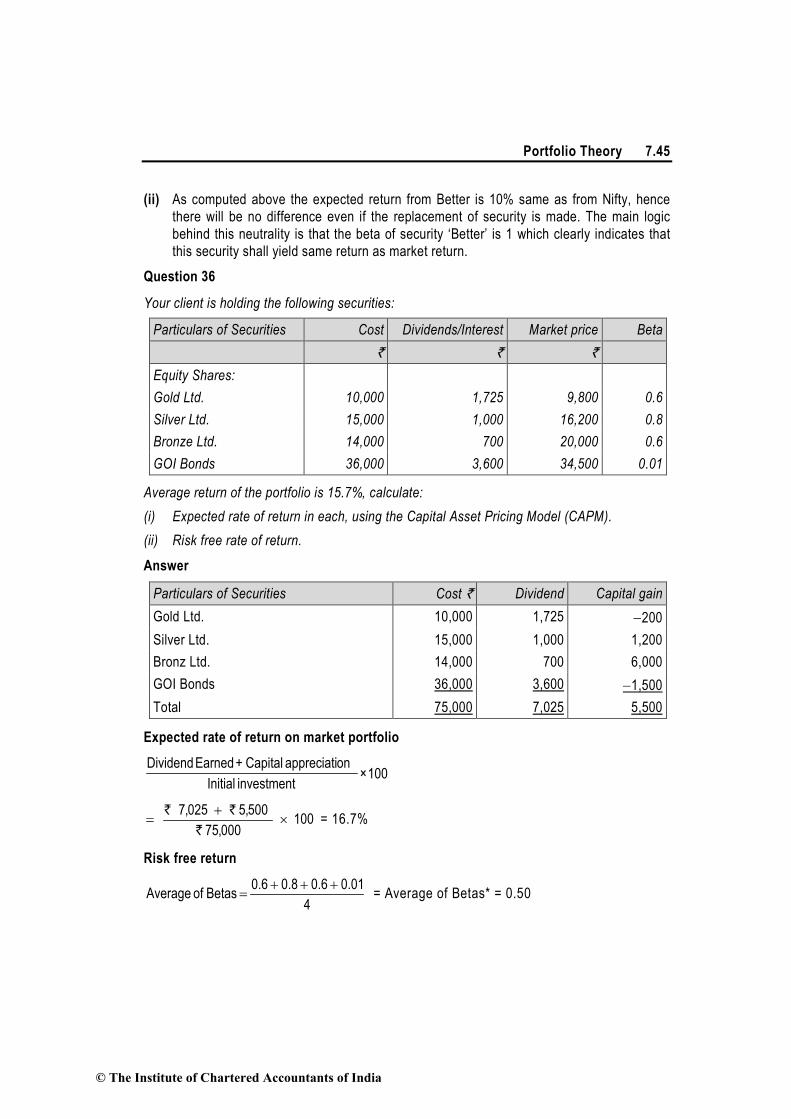
(ii) As computed above the expected return from Better is 10% same as from Nifty, hence there will be no difference even if the replacement of security is made. The main logic behind this neutrality is that the beta of security ‘Better’ is 1 which clearly indicates that this security shall yield same return as market return.
Question 36
Your client is holding the following securities:
Particulars of Securities Cost Dividends/Interest Market price Beta ` ` ` Equity Shares: Gold Ltd. 10,000 1,725 9,800 0.6 Silver Ltd. 15,000 1,000 16,200 0.8 Bronze Ltd. 14,000 700 20,000 0.6 GOI Bonds 36,000 3,600 34,500 0.01
Average return of the portfolio is 15.7%, calculate: (i) Expected rate of return in each, using the Capital Asset Pricing Model (CAPM). (ii) Risk free rate of return.
Answer
Particulars of Securities Cost ` Dividend Capital gain Gold Ltd. 10,000 1,725 −200 Silver Ltd. 15,000 1,000 1,200 Bronz Ltd. 14,000 700 6,000 GOI Bonds 36,000 3,600 −1,500 Total 75,000 7,025 5,500
Expected rate of return on market portfolio
100 × investment Initial onappreciati Capital + Earned Dividend
100 000,75
500,5 025,7 ×+
=`
` ` = 16.7%
Risk free return
4
0.01 0.6 0.8 .60 Betas of Average +++= = Average of Betas* = 0.50
© The Institute of Chartered Accountants of India

7.46 Strategic Financial Management
Average return = Risk free return + Average Betas (Expected return – Risk free return) 15.7 = Risk free return + 0.50 (16.7 – Risk free return) Risk free return = 14.7% * Alternatively, it can also be calculated through Weighted Average Beta. Expected Rate of Return for each security is Rate of Return = Rf + B (Rm – Rf) Gold Ltd. = 14.7 + 0.6 (16.7 – 14.7) = 15.90% Silver Ltd. = 14.7 + 0.8 (16.7 – 14.7) = 16.30% Bronz Ltd. = 14.7 + 0.6 (16.7 – 14.7) = 15.90% GOI Bonds = 14.7 + 0.01 (16.7 – 14.7) = 14.72% * Alternatively, it can also be computed by using Weighted Average Method. Question 37
A holds the following portfolio:
Share/Bond Beta Initial Price Dividends Market Price at end of year ` ` ` Epsilon Ltd. 0.8 25 2 50 Sigma Ltd. 0.7 35 2 60 Omega Ltd. 0.5 45 2 135 GOI Bonds 0.01 1,000 140 1,005
Calculate: (i) The expected rate of return of each security using Capital Asset Pricing Method (CAPM) (ii) The average return of his portfolio. Risk-free return is 14%.
Answer (i) Expected rate of return
Total Investments Dividends Capital Gains Epsilon Ltd. 25 2 25 Sigma Ltd. 35 2 25 Omega Ltd. 45 2 90 GOI Bonds 1,000 140 _5 1,105 146 145
© The Institute of Chartered Accountants of India
Portfolio Theory 7.47
Expected Return on market portfolio= %33.261105
145146=
+
CAPM E(Rp) = RF + β [E(RM) – RF]
Epsilon Ltd 14+0.8 [26.33-14] = 14+9.86 = 23.86% Sigma Ltd. 14+0.7 [26.33-14] = 14+8.63 = 22.63% Omega Ltd. 14+0.5 [26.33-14] = 14+6.17 = 20.17% GOI Bonds 14+0.01 [26.33-14] = 14+0.12 = 14.12%
(ii) Average Return of Portfolio
23.86+ 22.63+ 20.17+ 14.12 80.78= = 20.20%4 4
Alternatively 0.5025=42.01
=40.01+0.5+0.7+0.8
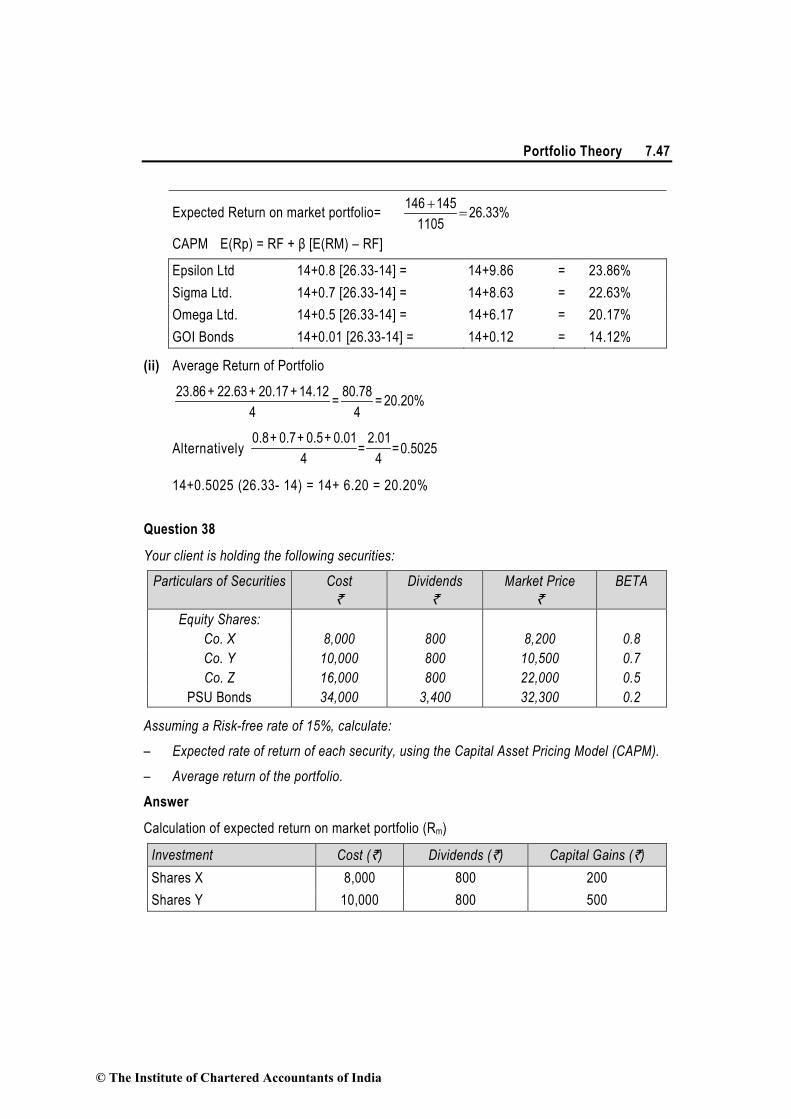
14+0.5025 (26.33- 14) = 14+ 6.20 = 20.20% Question 38
Your client is holding the following securities:
Particulars of Securities Cost `
Dividends `
Market Price `
BETA
Equity Shares: Co. X 8,000 800 8,200 0.8 Co. Y 10,000 800 10,500 0.7 Co. Z 16,000 800 22,000 0.5
PSU Bonds 34,000 3,400 32,300 0.2
Assuming a Risk-free rate of 15%, calculate:
– Expected rate of return of each security, using the Capital Asset Pricing Model (CAPM).
– Average return of the portfolio.
Answer
Calculation of expected return on market portfolio (Rm)
Investment Cost (`) Dividends (`) Capital Gains (`) Shares X 8,000 800 200 Shares Y 10,000 800 500
© The Institute of Chartered Accountants of India

7.48 Strategic Financial Management
Shares Z 16,000 800 6,000 PSU Bonds 34,000 3,400 –1,700 68,000 5,800 5,000
15.88% 100 68,000
5,000 5,800 Rm
=×+
=
Calculation of expected rate of return on individual security: Security
Shares X 15 + 0.8 (15.88 – 15.0) = 15.70% Shares Y 15 + 0.7 (15.88 – 15.0) = 15.62% Shares Z 15 + 0.5 (15.88 – 15.0) = 15.44% PSU Bonds 15 + 0.2 (15.88 – 15.0) = 15.18%
Calculation of the Average Return of the Portfolio:
415.18 15.44 15.62 15.70
+++
= = 15.49%.
Question 39
An investor is holding 1,000 shares of Fatlass Company. Presently the rate of dividend being paid by the company is ` 2 per share and the share is being sold at ` 25 per share in the market. However, several factors are likely to change during the course of the year as indicated below:
Existing Revised Risk free rate 12% 10% Market risk premium 6% 4% Beta value 1.4 1.25 Expected growth rate 5% 9%
In view of the above factors whether the investor should buy, hold or sell the shares? And why?
Answer
On the basis of existing and revised factors, rate of return and price of share is to be calculated. Existing rate of return
= Rf + Beta (Rm – Rf) = 12% + 1.4 (6%) = 20.4%
© The Institute of Chartered Accountants of India

Portfolio Theory 7.49
Revised rate of return
= 10% + 1.25 (4%) = 15% Price of share (original)
13.63 Rs. .154
10.2 .05 - .204
(1.05) 2 g - Kg) (1 D P
eo ===
+=
Price of share (Revised)
36.33 Rs. .06
18.2 .09 - .15
(1.09) 2 P o ===
In case of existing market price of ` 25 per share, rate of return (20.4%) and possible equilibrium price of share at ` 13.63, this share needs to be sold because the share is overpriced (` 25 – 13.63) by ` 11.37. However, under the changed scenario where growth of dividend has been revised at 9% and the return though decreased at 15% but the possible price of share is to be at ` 36.33 and therefore, in order to expect price appreciation to ` 36.33 the investor should hold the shares, if other things remain the same. Question 40 An investor is holding 5,000 shares of X Ltd. Current year dividend rate is ` 3/ share. Market price of the share is ` 40 each. The investor is concerned about several factors which are likely to change during the next financial year as indicated below:
Current Year Next Year Dividend paid /anticipated per share (`) 3 2.5 Risk free rate 12% 10% Market Risk Premium 5% 4% Beta Value 1.3 1.4 Expected growth 9% 7%
In view of the above, advise whether the investor should buy, hold or sell the shares.
Answer On the basis of existing and revised factors, rate of return and price of share is to be calculated. Existing rate of return = Rf + Beta (Rm – Rf) = 12% + 1.3 (5%) = 18.5%
© The Institute of Chartered Accountants of India

7.50 Strategic Financial Management
Revised rate of return = 10% + 1.4 (4%) = 15.60% Price of share (original)
o
e
D (1 + g) 3 (1.09) 3.27 P = = = = 34.42K - g 0.185 - 0.09 0.095
`
Price of share (Revised)
2.50 (1.07) 2.675P = = = 31.10o 0.156 - 0.07 0.086
`
Market price of share of ` 40 is higher in comparison to current equilibrium price of ` 34.42 and revised equity price of ` 31.10. Under this situation investor should sell the share.
Question 41 An investor has two portfolios known to be on minimum variance set for a population of three securities A, B and C having below mentioned weights:
WA WB WC Portfolio X 0.30 0.40 0.30 Portfolio Y 0.20 0.50 0.30
It is supposed that there are no restrictions on short sales. (i) What would be the weight for each stock for a portfolio constructed by investing ` 5,000
in portfolio X and ` 3,000 in portfolio Y?. (ii) Suppose the investor invests ` 4,000 out of ` 8,000 in security A. How he will allocate
the balance between security B and C to ensure that his portfolio is on minimum variance set?
Answer (i) Investment committed to each security would be:-
A (`)
B (`)
C (`)
Total (`)
Portfolio X 1,500 2,000 1,500 5,000 Portfolio Y 600 1,500 900 3,000 Combined Portfolio 2,100 3,500 2,400 8,000 ∴Stock weights 0.26 0.44 0.30
© The Institute of Chartered Accountants of India

Portfolio Theory 7.51
(ii) The equation of critical line takes the following form:- WB = a + bWA Substituting the values of WA & WB from portfolio X and Y in above equation, we get 0.40 = a + 0.30b, and 0.50 = a + 0.20b
Solving above equation we obtain the slope and intercept, a = 0.70 and b= -1 and thus, the critical line is
WB = 0.70 – WA If half of the funds is invested in security A then, WB = 0.70 – 0.50 = 0.20 Since WA + WB + WC = 1
WC = 1 - 0.50 – 0.20 = 0.30 ∴Allocation of funds to security B = 0.20 x 8,000 = ` 1,600, and
Security C = 0.30 x 8,000 = ` 2,400 Question 42
X Co., Ltd., invested on 1.4.2009 in certain equity shares as below:
Name of Co. No. of shares Cost (`) M Ltd. 1,000 (` 100 each) 2,00,000 N Ltd. 500 (` 10 each) 1,50,000
In September, 2009, 10% dividend was paid out by M Ltd. and in October, 2009, 30% dividend paid out by N Ltd. On 31.3.2010 market quotations showed a value of ` 220 and ` 290 per share for M Ltd. and N Ltd. respectively.
On 1.4.2010, investment advisors indicate (a) that the dividends from M Ltd. and N Ltd. for the year ending 31.3.2011 are likely to be 20% and 35%, respectively and (b) that the probabilities of market quotations on 31.3.2011 are as below:
Probability factor Price/share of M Ltd. Price/share of N Ltd. 0.2 220 290 0.5 250 310 0.3 280 330
You are required to: (i) Calculate the average return from the portfolio for the year ended 31.3.2010;
© The Institute of Chartered Accountants of India
7.52 Strategic Financial Management
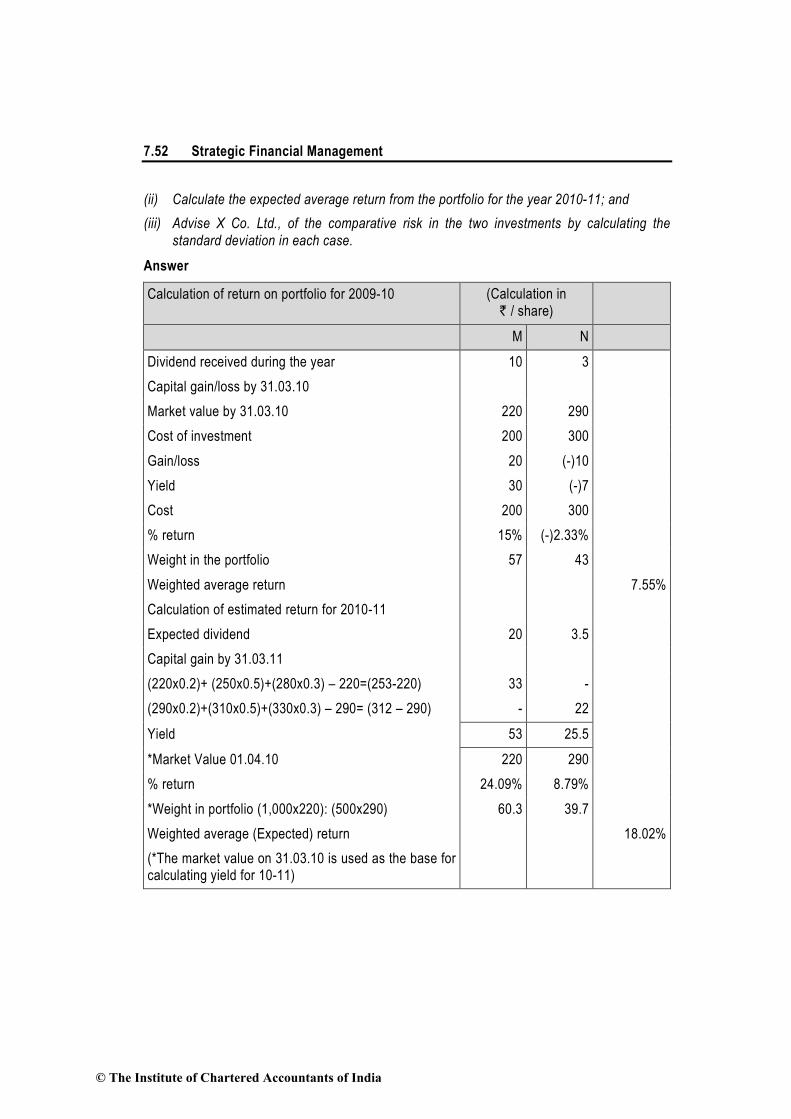
(ii) Calculate the expected average return from the portfolio for the year 2010-11; and (iii) Advise X Co. Ltd., of the comparative risk in the two investments by calculating the
standard deviation in each case.
Answer
Calculation of return on portfolio for 2009-10 (Calculation in ` / share)
M N Dividend received during the year 10 3 Capital gain/loss by 31.03.10 Market value by 31.03.10 220 290 Cost of investment 200 300 Gain/loss 20 (-)10 Yield 30 (-)7 Cost 200 300 % return 15% (-)2.33% Weight in the portfolio 57 43 Weighted average return 7.55% Calculation of estimated return for 2010-11 Expected dividend 20 3.5 Capital gain by 31.03.11 (220x0.2)+ (250x0.5)+(280x0.3) – 220=(253-220) 33 - (290x0.2)+(310x0.5)+(330x0.3) – 290= (312 – 290) - 22 Yield 53 25.5 *Market Value 01.04.10 220 290 % return 24.09% 8.79% *Weight in portfolio (1,000x220): (500x290) 60.3 39.7 Weighted average (Expected) return 18.02% (*The market value on 31.03.10 is used as the base for calculating yield for 10-11)
© The Institute of Chartered Accountants of India

Portfolio Theory 7.53
Calculation of Standard Deviation
M Ltd. Exp.
market value
Exp. gain
Exp. div.
Exp Yield (1)
Prob. Factor
(2)
(1) X(2)
Dev. (PM-
MP )
Square of dev.
(3)
(2) X (3)
220 0 20 20 0.2 4 -33 1089 217.80
250 30 20 50 0.5 25 -3 9 4.50
280 60 20 80 0.3 24 27 729 218.70
53 σ2M = 441.00
Standard Deviation (σM) 21
N Ltd.
Exp. market value
Exp. gain
Exp. div.
Exp Yield (1)
Prob. Factor
(2)
(1) X(2)
Dev. (PN- NP )
Square of dev.
(3)
(2) X (3)
290 0 3.5 3.5 0.2 0.7 -22 484 96.80 310 20 3.5 23.5 0.5 11.75 -2 4 2.00 330 40 3.5 43.5 0.3 13.05 18 324 97.20
25.5 σ2N = 196.00
Standard Deviation (σN) 14
Share of company M Ltd. is more risky as the S.D. is more than company N Ltd. Question 43 An investor holds two stocks A and B. An analyst prepared ex-ante probability distribution for the possible economic scenarios and the conditional returns for two stocks and the market index as shown below:
Economic scenario Probability Conditional Returns % A B Market
Growth 0.40 25 20 18 Stagnation 0.30 10 15 13 Recession 0.30 -5 -8 -3
© The Institute of Chartered Accountants of India

7.54 Strategic Financial Management
The risk free rate during the next year is expected to be around 11%. Determine whether the investor should liquidate his holdings in stocks A and B or on the contrary make fresh investments in them. CAPM assumptions are holding true.
Answer
Expected Return on stock A = E (A) = PAi ii=G,S,R∑
(G,S & R, denotes Growth, Stagnation and Recession ) (0.40)(25) + 0.30(10)+ 0.30(-5) = 11.5% Expected Return on ‘B’ (0.40×20) + (0.30×15) +0.30× (-8)=10.1% Expected Return on Market index (0.40 × 18) + (0.30 × 13) + 0.30 × (-3) =10.2% Variance of Market index (18 - 10.2)2 (0.40) + (13 - 10.2)2 (0.30) + (-3 - 10.2)2 (0.30) = 24.34 + 2.35 + 52.27 = 78.96% Covariance of stock A and Market Index M
Cov. (AM) = i([A - E(A)] [M - E(M)]Pi ii G,S,R∑
=
(25 -11.5) (18 - 10.2)(0.40) + (10 - 11.5) (13 - 10.2) (0.30) + (-5-11.5) (-3-10.2)(0.30) = 42.12 + (-1.26) + 65.34=106.20 Covariance of stock B and Market index M (20-10.1) (18-10.2)(0.40)+(15-10.1)(13-10.2)(0.30) + (-8-10.1)(-3-10.2)(0.30)= 30.89 + 4.12 + 71.67=106.68
Beta for stock A = 1.34578.96
106.20VAR(M)
CoV(AM)==
Beta for Stock B = VarM
CoV(BM) =78.96
106.68 =1.351
Required Return for A
R (A) = Rf +β (M-Rf)
11% + 1.345(10.2 - 11) % = 9.924%
© The Institute of Chartered Accountants of India

Portfolio Theory 7.55
Required Return for B
11% + 1.351 (10.2 – 11) % = 9.92%
Alpha for Stock A
E (A) – R (A) i.e. 11.5 % – 9.924% = 1.576%
Alpha for Stock B
E (B) – R (B) i.e. 10.1% - 9.92% = 0.18%
Since stock A and B both have positive Alpha, therefore, they are UNDERPRICED. The investor should make fresh investment in them. Question 44 Following are the details of a portfolio consisting of three shares:
Share Portfolio weight Beta Expected return in % Total variance A 0.20 0.40 14 0.015 B 0.50 0.50 15 0.025 C 0.30 1.10 21 0.100
Standard Deviation of Market Portfolio Returns = 10% You are given the following additional data: Covariance (A, B) = 0.030 Covariance (A, C) = 0.020 Covariance (B, C) = 0.040 Calculate the following: (i) The Portfolio Beta (ii) Residual variance of each of the three shares (iii) Portfolio variance using Sharpe Index Model (iv) Portfolio variance (on the basis of modern portfolio theory given by Markowitz)
Answer (i) Portfolio Beta 0.20 x 0.40 + 0.50 x 0.50 + 0.30 x 1.10 = 0.66 (ii) Residual Variance To determine Residual Variance first of all we shall compute the Systematic Risk as
follows:
© The Institute of Chartered Accountants of India

7.56 Strategic Financial Management
2M
2A σβ × = (0.40)2(0.01) = 0.0016
2M
2B σβ × = (0.50)2(0.01) = 0.0025
2M
2C σβ × = (1.10)2(0.01) = 0.0121
Residual Variance A 0.015 – 0.0016 = 0.0134 B 0.025 – 0.0025 = 0.0225 C 0.100 – 0.0121 = 0.0879 (iii) Portfolio variance using Sharpe Index Model Systematic Variance of Portfolio = (0.10)2 x (0.66)2 = 0.004356 Unsystematic Variance of Portfolio = 0.0134 x (0.20)2 + 0.0225 x (0.50)2 + 0.0879 x
(0.30)2 = 0.014072 Total Variance = 0.004356 + 0.014072 = 0.018428 (iii) Portfolio variance on the basis of Markowitz Theory
= (wA x wAx 2Aσ ) + (wA x wBxCovAB) + (wA x wCxCovAC) + (wB x wAxCovAB) + (wB x wBx 2
Bσ )
+ (wB x wCxCovBC) + (wC x wAxCovCA) + (wC x wBxCovCB) + (wC x wCx 2cσ )
= (0.20 x 0.20 x 0.015) + (0.20 x 0.50 x 0.030) + (0.20 x 0.30 x 0.020) + (0.20 x 0.50 x 0.030) + (0.50 x 0.50 x 0.025) + (0.50 x 0.30 x 0.040) + (0.30 x 0.20 x 0.020) + (0.30 x 0.50 x 0.040) + (0.30 x 0.30 x 0.10)
= 0.0006 + 0.0030 + 0.0012 + 0.0030 + 0.00625 + 0.0060 + 0.0012 + 0.0060 + 0.0090 = 0.0363 Question 45 Ramesh wants to invest in stock market. He has got the following information about individual securities:
Security Expected Return Beta σ2 ci A 15 1.5 40 B 12 2 20 C 10 2.5 30 D 09 1 10 E 08 1.2 20 F 14 1.5 30
© The Institute of Chartered Accountants of India

Portfolio Theory 7.57
Market index variance is 10 percent and the risk free rate of return is 7%. What should be the optimum portfolio assuming no short sales?
Answer Securities need to be ranked on the basis of excess return to beta ratio from highest to the lowest.
Security iR iβ fi R - R i
fi R - Rβ
A 15 1.5 8 5.33 B 12 2 5 2.5 C 10 2.5 3 1.2 D 9 1 2 2 E 8 1.2 1 0.83 F 14 1.5 7 4.67
Ranked Table:
Security
fi R - R iβ ei
2σ ei
2ifi x )R - (R
σβ
∑= σ
βN
i e ei 2
ifi x )R - (R
ei
2
2i
σβ
∑= σ
βN
i e ei 2
2i
Ci
A 8 1.5 40 0.30 0.30 0.056 0.056 1.923 F 7 1.5 30 0.35 0.65 0.075 0.131 2.814 B 5 2 20 0.50 1.15 0.20 0.331 2.668 D 2 1 10 0.20 1.35 0.10 0.431 2.542 C 3 2.5 30 0.25 1.60 0.208 0.639 2.165 E 1 1.2 20 0.06 1.66 0.072 0.711 2.047
CA = 10 x 0.30 / [1 + ( 10 x 0.056)] = 1.923 CF = 10 x 0.65 / [1 + ( 10 x 0.131)] = 2.814 CB = 10 x 1.15 / [1 + ( 10 x 0.331)] = 2.668 CD = 10 x 1.35 / [1 + ( 10 x 0.431)] = 2.542 CC = 10 x 1.60 / [1 + ( 10 x 0.639)] = 2.165 CE = 10 x 1.66 / [1 + ( 10 x 0.7111)] = 2.047 Cut off point is 2.814
© The Institute of Chartered Accountants of India

7.58 Strategic Financial Management
( )
= - C]
β - RR
[ σβ
Zi
fi
ei2i
i
09435.0 )814.2 - 33.5 (405.1ZA ==
49.59% 0.0928] [0.09435 /0928.0X
%41.50 ] 0928.0 09435.0/ [09435.0X
0928.0 ) 814.2 - 67.4 (305.1Z
F
A
F
=+=
=+=
==
Funds to be invested in security A & F are 50.41% and 49.59% respectively.
Question 46 A Portfolio Manager (PM) has the following four stocks in his portfolio:
Security No. of Shares Market Price per share (`) β
VSL 10,000 50 0.9 CSL 5,000 20 1.0 SML 8,000 25 1.5 APL 2,000 200 1.2
Compute the following: (i) Portfolio beta. (ii) If the PM seeks to reduce the beta to 0.8, how much risk free investment should he bring in? (iii) If the PM seeks to increase the beta to 1.2, how much risk free investment should he
bring in?
Answer
Security No. of shares
(1)
Market Price of Per Share (2)
(1) × (2) % to total (w)
ß (x) wx
VSL 10000 50 500000 0.4167 0.9 0.375 CSL 5000 20 100000 0.0833 1 0.083 SML 8000 25 200000 0.1667 1.5 0.250
© The Institute of Chartered Accountants of India
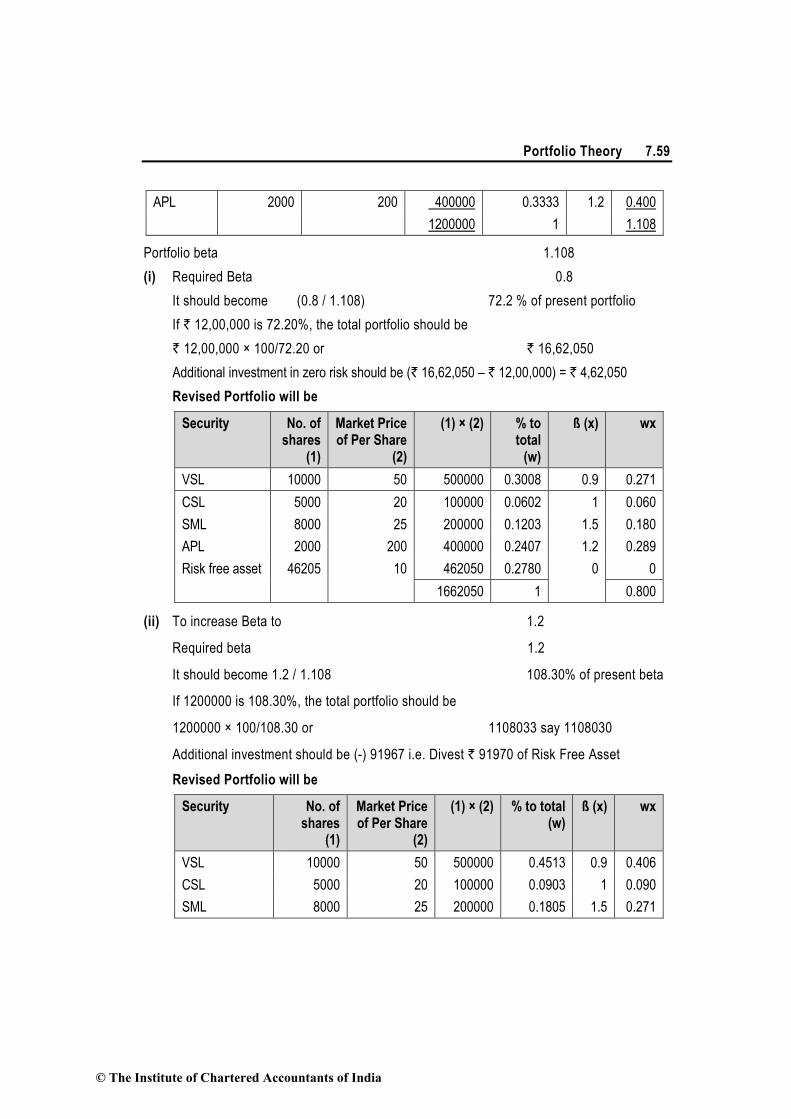
Portfolio Theory 7.59
APL 2000 200 400000 0.3333 1.2 0.400 1200000 1 1.108
Portfolio beta 1.108 (i) Required Beta 0.8 It should become (0.8 / 1.108) 72.2 % of present portfolio If ` 12,00,000 is 72.20%, the total portfolio should be ` 12,00,000 × 100/72.20 or ` 16,62,050 Additional investment in zero risk should be (` 16,62,050 – ` 12,00,000) = ` 4,62,050
Revised Portfolio will be
Security No. of shares
(1)
Market Price of Per Share
(2)
(1) × (2) % to total
(w)
ß (x) wx
VSL 10000 50 500000 0.3008 0.9 0.271 CSL 5000 20 100000 0.0602 1 0.060 SML 8000 25 200000 0.1203 1.5 0.180 APL 2000 200 400000 0.2407 1.2 0.289 Risk free asset 46205 10 462050 0.2780 0 0 1662050 1 0.800
(ii) To increase Beta to 1.2
Required beta 1.2
It should become 1.2 / 1.108 108.30% of present beta
If 1200000 is 108.30%, the total portfolio should be
1200000 × 100/108.30 or 1108033 say 1108030
Additional investment should be (-) 91967 i.e. Divest ` 91970 of Risk Free Asset Revised Portfolio will be
Security No. of shares
(1)
Market Price of Per Share
(2)
(1) × (2) % to total (w)
ß (x) wx
VSL 10000 50 500000 0.4513 0.9 0.406 CSL 5000 20 100000 0.0903 1 0.090 SML 8000 25 200000 0.1805 1.5 0.271
© The Institute of Chartered Accountants of India

7.60 Strategic Financial Management
APL 2000 200 400000 0.3610 1.2 0.433 Risk free asset -9197 10 -91970 -0.0830 0 0 1108030 1 1.20
Portfolio beta 1.20 Question 47 A has portfolio having following features:
Security β Random Error σei Weight
L 1.60 7 0.25
M 1.15 11 0.30
N 1.40 3 0.25
K 1.00 9 0.20
You are required to find out the risk of the portfolio if the standard deviation of the market index (σm) is 18%.
Answer
βp = ∑=
4
1iiiβx
= 1.60 x 0.25 + 1.15 x 0.30 + 1.40 x 0.25 + 1.00 x 0.20 = 0.4 + 0.345 + 0.35 + 0.20 = 1.295 The Standard Deviation (Risk) of the portfolio is = [(1.295)2(18)2+(0.25)2(7)2+(0.30)2(11)2+(0.25)2(3)2+(0.20)2(9)2)] = [543.36 + 3.0625 + 10.89 + 0.5625 + 3.24] = [561.115]½ = 23.69%
Alternative Answer The variance of Security’s Return σ2 = β i2 σ2m + σ2εi Accordingly, variance of various securities
σ2 Weight(w) σ2Xw L (1.60)2 (18)2 + 72 = 878.44 0.25 219.61 M (1.15)2 (18)2 + 112 = 549.49 0.30 164.85 N (1.40)2 (18)2 + 32 = 644.04 0.25 161.01
© The Institute of Chartered Accountants of India
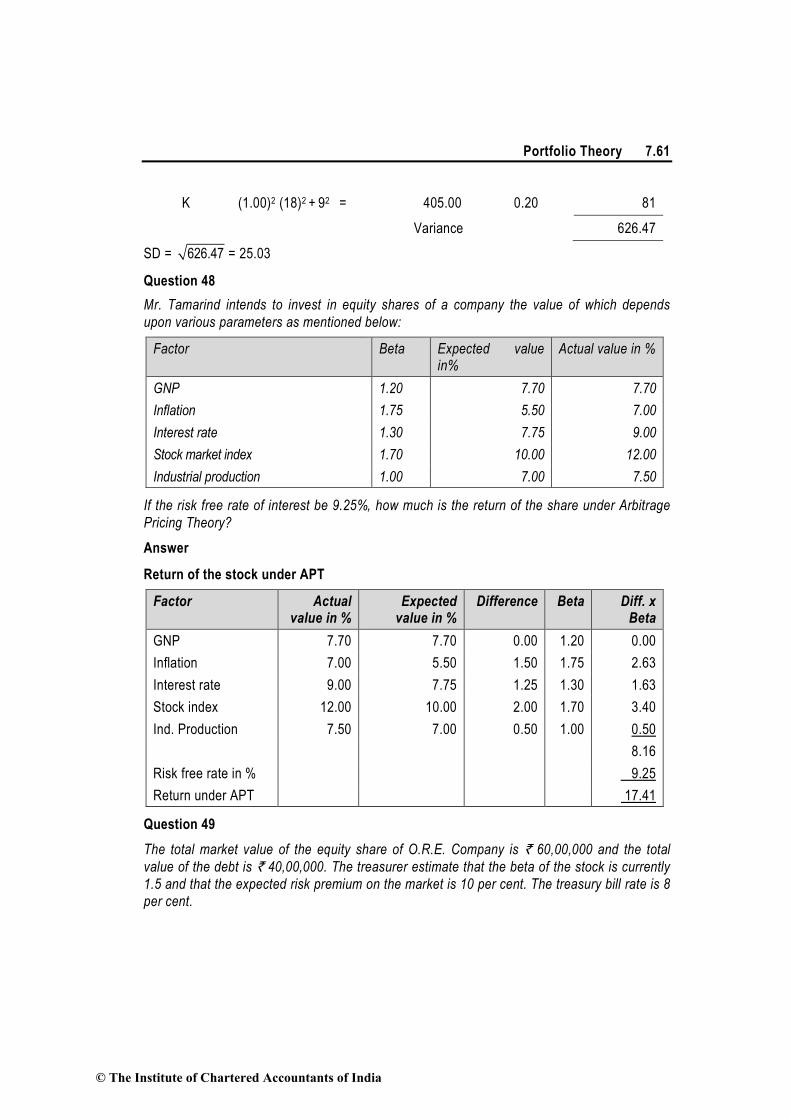
Portfolio Theory 7.61
K (1.00)2 (18)2 + 92 = 405.00 0.20 81 Variance 626.47
SD = 626.47 = 25.03
Question 48 Mr. Tamarind intends to invest in equity shares of a company the value of which depends upon various parameters as mentioned below:
Factor Beta Expected value in%
Actual value in %
GNP 1.20 7.70 7.70 Inflation 1.75 5.50 7.00 Interest rate 1.30 7.75 9.00 Stock market index 1.70 10.00 12.00 Industrial production 1.00 7.00 7.50
If the risk free rate of interest be 9.25%, how much is the return of the share under Arbitrage Pricing Theory?
Answer
Return of the stock under APT
Factor Actual value in %
Expected value in %
Difference Beta Diff. х Beta
GNP 7.70 7.70 0.00 1.20 0.00 Inflation 7.00 5.50 1.50 1.75 2.63 Interest rate 9.00 7.75 1.25 1.30 1.63 Stock index 12.00 10.00 2.00 1.70 3.40 Ind. Production 7.50 7.00 0.50 1.00 0.50 8.16 Risk free rate in % 9.25 Return under APT 17.41
Question 49 The total market value of the equity share of O.R.E. Company is ` 60,00,000 and the total value of the debt is ` 40,00,000. The treasurer estimate that the beta of the stock is currently 1.5 and that the expected risk premium on the market is 10 per cent. The treasury bill rate is 8 per cent.
© The Institute of Chartered Accountants of India

7.62 Strategic Financial Management
Required: (1) What is the beta of the Company’s existing portfolio of assets? (2) Estimate the Company’s Cost of capital and the discount rate for an expansion of the
company’s present business.
Answer
(1) 0D
debt0E
equitycompany VV
× B + VV
× β = β
Note: Since βdebt is not given it is assumed that company debt capital is virtually riskless. If company’s debt capital is riskless than above relationship become:
0
Eequity cequity V
V 1.5; βββ == ompanyHere
As βdebt = 0 VE = ` 60 lakhs. VD = ` 40 lakhs. V0 = ` 100 lakhs.
lakhs100
lakhs60 5.1 company `
` assets ×=β
= 0.9 (2) Company’s cost of equity = Rf + βA × Risk premium Where Rf = Risk free rate of return βA = Beta of company assets Therefore, company’s cost of equity = 8% + 0.9 × 10 = 17% and overall cost of capital
shall be
= 60,00,000 40,00,00017%× +8%×
100,00,000 100,00,000
= 10.20% + 3.20% = 13.40% Alternatively it can also be computed as follows: Cost of Equity = 8% + 1.5 x 10 = 23% Cost of Debt = 8%
WACC (Cost of Capital) = 60,00,000 40,00,00023% 8%
1,00,00,000 1,00,00,000× + × = 17%
© The Institute of Chartered Accountants of India

Portfolio Theory 7.63
In case of expansion of the company’s present business, the same rate of return i.e. 13.40% will be used. However, in case of diversification into new business the risk profile of new business is likely to be different. Therefore, different discount factor has to be worked out for such business.
Question 50 Mr. Nirmal Kumar has categorized all the available stock in the market into the following types: (i) Small cap growth stocks (ii) Small cap value stocks (iii) Large cap growth stocks (iv) Large cap value stocks Mr. Nirmal Kumar also estimated the weights of the above categories of stocks in the market index. Further, the sensitivity of returns on these categories of stocks to the three important factor are estimated to be:
Category of Stocks
Weight in the Market Index
Factor I (Beta) Factor II (Book Price)
Factor III (Inflation)
Small cap growth 25% 0.80 1.39 1.35 Small cap value 10% 0.90 0.75 1.25 Large cap growth 50% 1.165 2.75 8.65 Large cap value 15% 0.85 2.05 6.75 Risk Premium 6.85% -3.5% 0.65%
The rate of return on treasury bonds is 4.5% Required: (a) Using Arbitrage Pricing Theory, determine the expected return on the market index. (b) Using Capital Asset Pricing Model (CAPM), determine the expected return on the market
index. (c) Mr. Nirmal Kumar wants to construct a portfolio constituting only the ‘small cap value’
and ‘large cap growth’ stocks. If the target beta for the desired portfolio is 1, determine the composition of his portfolio.
Answer (a) Method I
Stock’s return Small cap growth = 4.5 + 0.80 x 6.85 + 1.39 x (-3.5) + 1.35 x 0.65 = 5.9925% Small cap value = 4.5 + 0.90 x 6.85 + 0.75 x (-3.5) + 1.25 x 0.65 = 8.8525%
© The Institute of Chartered Accountants of India

7.64 Strategic Financial Management
Large cap growth = 4.5 + 1.165 x 6.85 + 2.75 x (-3.5) + 8.65 x 0.65 = 8.478% Large cap value = 4.5 + 0.85 x 6.85 + 2.05 x (-3.5) + 6.75 x 0.65 = 7.535% Expected return on market index 0.25 x 5.9925 + 0.10 x 8.8525 + 0.50 x 8.478 + 0.15 x 7.535 = 7.7526%
Method II Expected return on the market index
= 4.5% + [0.1x0.9 + 0.25x0.8 + 0.15x0.85 + 0.50x1.165] x 6.85 + [(0.75 x 0.10 + 1.39 x 0.25 + 2.05 x 0.15 + 2.75 x 0.5)] x (-3.5) + [{1.25 x 0.10 + 1.35 x 0.25 + 6.75 x 0.15 + 8.65 x 0.50)] x 0.65
= 4.5 + 6.85 + (-7.3675) + 3.77 = 7.7525%. (b) Using CAPM,
Small cap growth = 4.5 + 6.85 x 0.80 = 9.98% Small cap value = 4.5 + 6.85 x 0.90 = 10.665% Large cap growth = 4.5 + 6.85 x 1.165 = 12.48% Large cap value = 4.5 + 6.85 x 0.85 = 10.3225% Expected return on market index = 0.25 x 9.98 + 0.10 x 10.665 + 0.50 x 12.45 + 0.15 x 10.3225 = 11.33%
(c) Let us assume that Mr. Nirmal will invest X1% in small cap value stock and X2% in large cap growth stock X1 + X2 = 1 0.90 X1 + 1.165 X2 = 1 0.90 X1 + 1.165(1 – X1) = 1 0.90 X1 + 1.165 – 1.165 X1 = 1 0.165 = 0.265 X1
265.0165.0 = X1
0.623 = X1, X2 = 0.377 62.3% in small cap value 37.7% in large cap growth.
© The Institute of Chartered Accountants of India

Portfolio Theory 7.65
Question 51 The following are the data on five mutual funds:
Fund Return Standard Deviation Beta A 15 7 1.25 B 18 10 0.75 C 14 5 1.40 D 12 6 0.98 E 16 9 1.50
You are required to compute Reward to Volatility Ratio and rank these portfolio using: ♦ Sharpe method and ♦ Treynor's method assuming the risk free rate is 6%.
Answer Sharpe Ratio S = (Rp – Rf)/σp
Treynor Ratio T = (Rp – Rf)/βp Where, Rp = Return on Fund Rf = Risk-free rate σp = Standard deviation of Fund βp = Beta of Fund Reward to Variability (Sharpe Ratio)
Mutual Fund
Rp Rf Rp – Rf σp Reward to Variability
Ranking
A 15 6 9 7 1.285 2 B 18 6 12 10 1.20 3 C 14 6 8 5 1.60 1 D 12 6 6 6 1.00 5 E 16 6 10 9 1.11 4
Reward to Volatility (Treynor Ratio) Mutual Fund Rp Rf Rp – Rf βp Reward to Volatility Ranking
A 15 6 9 1.25 7.2 2 B 18 6 12 0.75 16 1 C 14 6 8 1.40 5.71 5 D 12 6 6 0.98 6.12 4 E 16 6 10 1.50 6.67 3
© The Institute of Chartered Accountants of India