Embed Size (px)
Citation preview
Portfolio Review – Fourth Quarter 2020
Q41
FOR INSTITUTIONAL USE ONLY
The information provided in the Portfolio Series Review includes:
Underlying fund allocations
Performance
Allocations by sector, region, asset class and their change over the prior quarter.
In addition, each report includes detailed commentary explaining the fund’sperformance for the quarter. The commentary is provided by CI GAM| Multi-AssetManagement, CI Global Asset Management’s in-house team of investmentprofessionals responsible for managing and monitoring the Portfolio Seriesportfolios.
Q4 2020 Portfolio Series Review
The G
herk
in, Lond
on, U
nited K
ingdo
m
3 Commentary
10 Portfolio Series Income Fund
15 Portfolio Series Conservative Fund
20Portfolio Series Conservative Balanced Fund
25 Portfolio Series Balanced Fund
30 Portfolio Series Balanced Growth Fund
35 Portfolio Series Growth Fund
40Portfolio Series Maximum Growth Fund
45 Benchmark History
FOR INSTITUTIONAL USE ONLY
CommentaryQuarterly Portfolio Review as at December 31, 2020
3
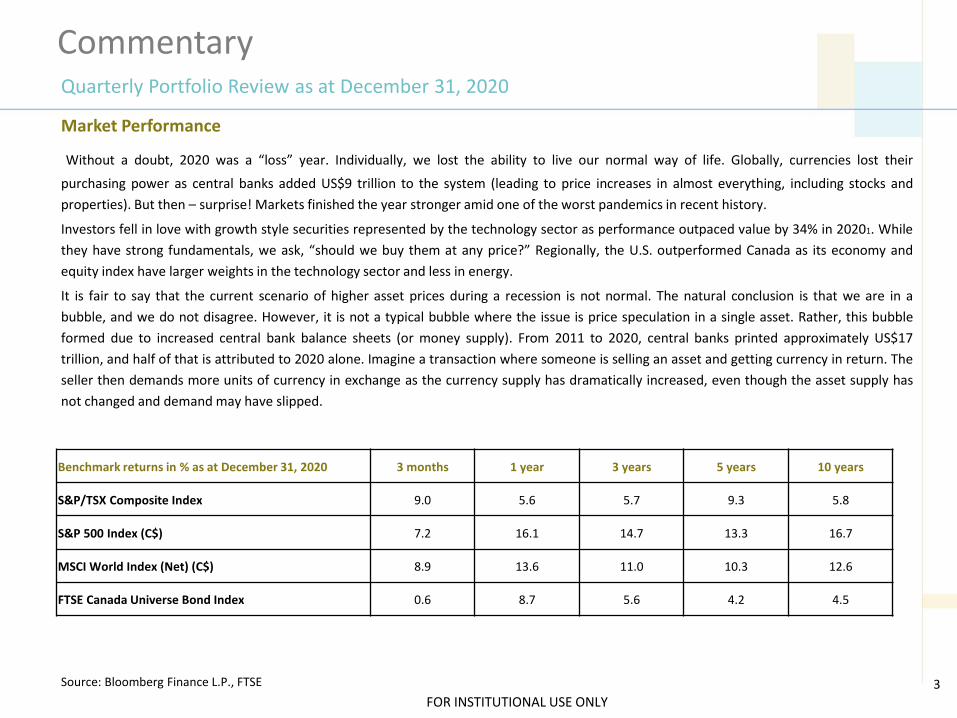
Market Performance
Without a doubt, 2020 was a “loss” year. Individually, we lost the ability to live our normal way of life. Globally, currencies lost their
purchasing power as central banks added US$9 trillion to the system (leading to price increases in almost everything, including stocks and
properties). But then – surprise! Markets finished the year stronger amid one of the worst pandemics in recent history.
Investors fell in love with growth style securities represented by the technology sector as performance outpaced value by 34% in 20201. While
they have strong fundamentals, we ask, “should we buy them at any price?” Regionally, the U.S. outperformed Canada as its economy and
equity index have larger weights in the technology sector and less in energy.
It is fair to say that the current scenario of higher asset prices during a recession is not normal. The natural conclusion is that we are in a
bubble, and we do not disagree. However, it is not a typical bubble where the issue is price speculation in a single asset. Rather, this bubble
formed due to increased central bank balance sheets (or money supply). From 2011 to 2020, central banks printed approximately US$17
trillion, and half of that is attributed to 2020 alone. Imagine a transaction where someone is selling an asset and getting currency in return. The
seller then demands more units of currency in exchange as the currency supply has dramatically increased, even though the asset supply has
not changed and demand may have slipped.
Benchmark returns in % as at December 31, 2020 3 months 1 year 3 years 5 years 10 years
S&P/TSX Composite Index 9.0 5.6 5.7 9.3 5.8
S&P 500 Index (C$) 7.2 16.1 14.7 13.3 16.7
MSCI World Index (Net) (C$) 8.9 13.6 11.0 10.3 12.6
FTSE Canada Universe Bond Index 0.6 8.7 5.6 4.2 4.5
Source: Bloomberg Finance L.P., FTSE
FOR INSTITUTIONAL USE ONLY
Commentary
4
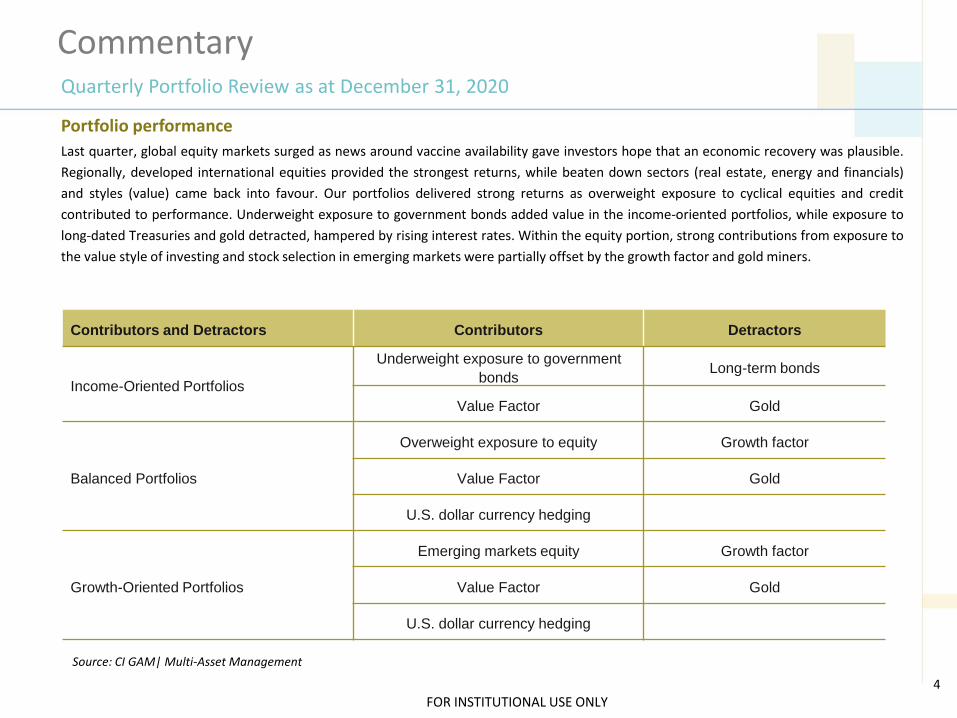
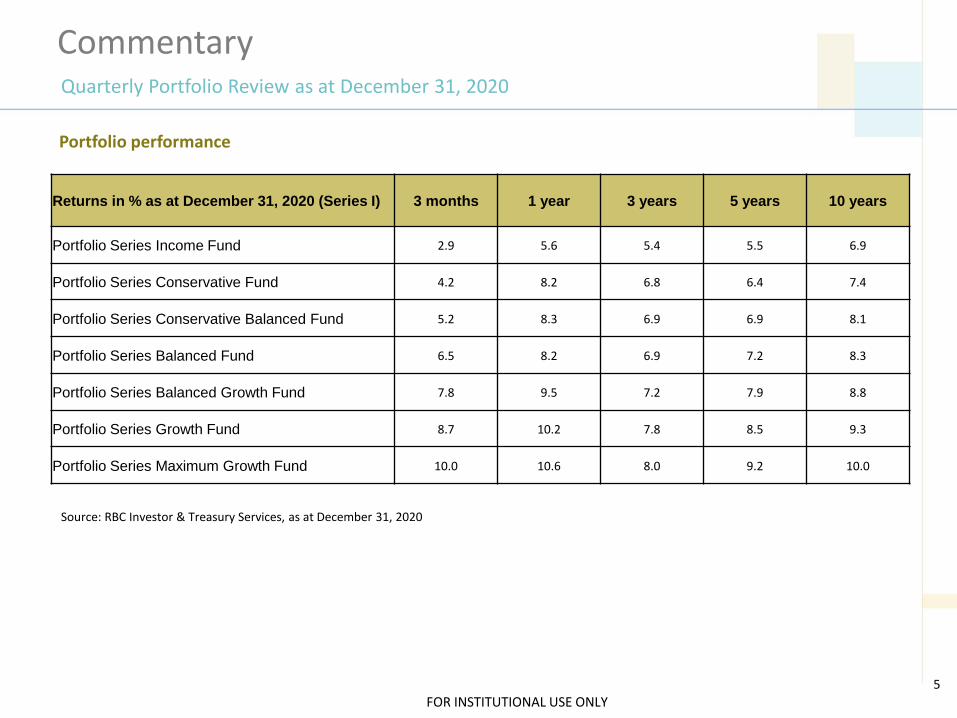
Portfolio performance
Last quarter, global equity markets surged as news around vaccine availability gave investors hope that an economic recovery was plausible.
Regionally, developed international equities provided the strongest returns, while beaten down sectors (real estate, energy and financials)
and styles (value) came back into favour. Our portfolios delivered strong returns as overweight exposure to cyclical equities and credit
contributed to performance. Underweight exposure to government bonds added value in the income-oriented portfolios, while exposure to
long-dated Treasuries and gold detracted, hampered by rising interest rates. Within the equity portion, strong contributions from exposure to
the value style of investing and stock selection in emerging markets were partially offset by the growth factor and gold miners.
Source: CI GAM| Multi-Asset Management
Quarterly Portfolio Review as at December 31, 2020
Contributors and Detractors Contributors Detractors
Income-Oriented Portfolios
Underweight exposure to government
bondsLong-term bonds
Value Factor Gold
Balanced Portfolios
Overweight exposure to equity Growth factor
Value Factor Gold
U.S. dollar currency hedging
Growth-Oriented Portfolios
Emerging markets equity Growth factor
Value Factor Gold
U.S. dollar currency hedging
FOR INSTITUTIONAL USE ONLY
Commentary
5
Returns in % as at December 31, 2020 (Series I) 3 months 1 year 3 years 5 years 10 years
Portfolio Series Income Fund 2.9 5.6 5.4 5.5 6.9
Portfolio Series Conservative Fund 4.2 8.2 6.8 6.4 7.4
Portfolio Series Conservative Balanced Fund 5.2 8.3 6.9 6.9 8.1
Portfolio Series Balanced Fund 6.5 8.2 6.9 7.2 8.3
Portfolio Series Balanced Growth Fund 7.8 9.5 7.2 7.9 8.8
Portfolio Series Growth Fund 8.7 10.2 7.8 8.5 9.3
Portfolio Series Maximum Growth Fund 10.0 10.6 8.0 9.2 10.0
Source: RBC Investor & Treasury Services, as at December 31, 2020
Quarterly Portfolio Review as at December 31, 2020
Portfolio performance
FOR INSTITUTIONAL USE ONLY
Commentary
6
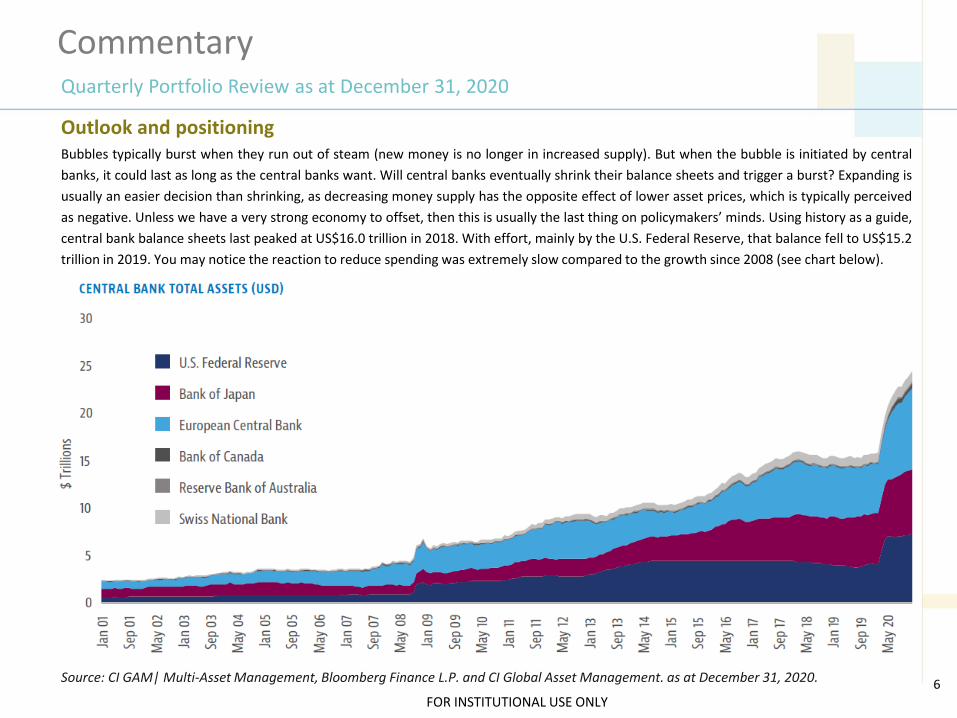
Outlook and positioningBubbles typically burst when they run out of steam (new money is no longer in increased supply). But when the bubble is initiated by central
banks, it could last as long as the central banks want. Will central banks eventually shrink their balance sheets and trigger a burst? Expanding is
usually an easier decision than shrinking, as decreasing money supply has the opposite effect of lower asset prices, which is typically perceived
as negative. Unless we have a very strong economy to offset, then this is usually the last thing on policymakers’ minds. Using history as a guide,
central bank balance sheets last peaked at US$16.0 trillion in 2018. With effort, mainly by the U.S. Federal Reserve, that balance fell to US$15.2
trillion in 2019. You may notice the reaction to reduce spending was extremely slow compared to the growth since 2008 (see chart below).
Source: CI GAM| Multi-Asset Management, Bloomberg Finance L.P. and CI Global Asset Management. as at December 31, 2020.
Quarterly Portfolio Review as at December 31, 2020
FOR INSTITUTIONAL USE ONLY
Commentary
7
Outlook and positioningWith interest rates already at or close to zero, central banks have aggressively used money supply as a tool to combat the market disruption
brought on by the pandemic, similar to the Global Financial Crisis of 2008-09. Policymakers seem very comfortable leaving the bubble as is, and
most of us are not complaining as higher prices is not a problem for investors. However, this doesn’t mean economies are growing rapidly.
Rather, the wealth gap is widening in favour of those who own assets.
For example, inflation – as tracked by the Consumer Price Index (CPI), which measures changes in consumer prices – has been mild over the
last decade. However, we believe the basket of data used to calculate CPI does not accurately capture the inflation of assets such as real estate.
According to CPI, prices have grown at an average annual rate below 2% over the last 10 years, but Toronto real estate has gone up by more
than 8% per year over the same period. Potential homeowners have effectively been priced out of the market because they do not own
inflated assets to sell and they cannot save enough to keep up with the rapid price increases of real estate. As a result, asset owners become
wealthier, while those with little net worth fall further behind. That being said, we believe central banks are still likely to focus on boosting
prices for the “majority” of the population. This means, the large increase in money supply and renewed currency debasement could continue
for years if not decades to come. While unfair, it is not up to us to decide.
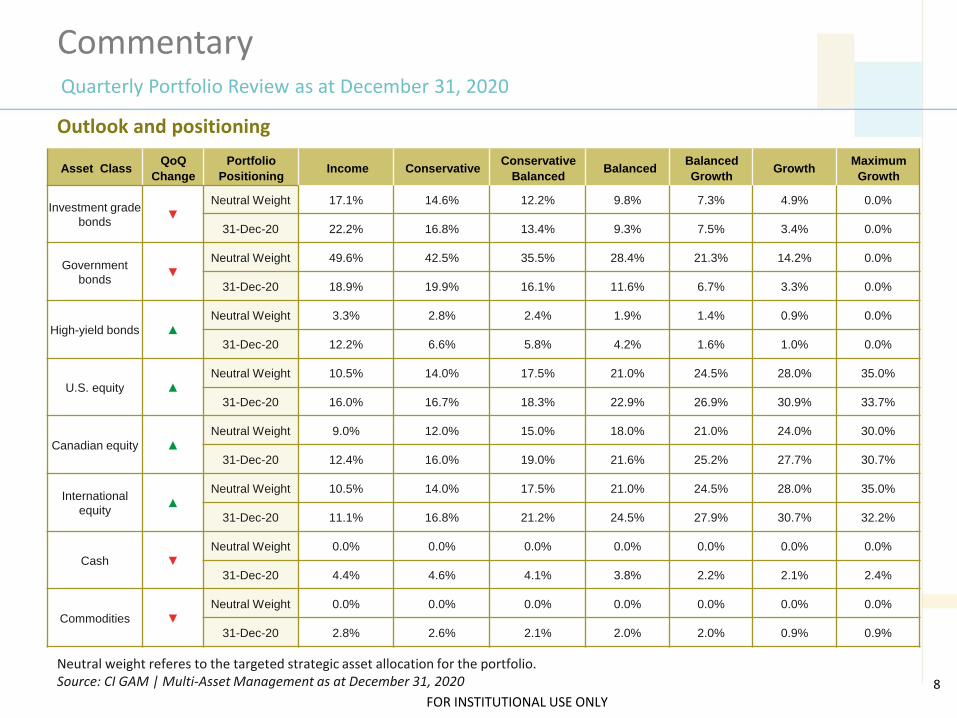
While central banks are aggressively printing money, we believe being defensive and “hiding cash under the mattress” is a losing strategy. We
expect to see improvement in economic activities as vaccination takes hold in 2021. Over the last few months, our goal has been to protect our
investors’ purchasing power in these very unusual market conditions, and we have actively deployed cash and trimmed government-bond
holdings for larger equity exposure. We also believe some underperformers, such as cyclical sectors and small caps, will outperform as they
have been overlooked by investors that wanted the same thing. As always, we continue to monitor market conditions and may from time to
time cut back on our equity exposure to manage downside volatility.
Source: CI GAM| Multi-Asset Management, Bloomberg Finance L.P. and CI Global Asset Management. as at December 31, 2020.
Quarterly Portfolio Review as at December 31, 2020
FOR INSTITUTIONAL USE ONLY
CommentaryQuarterly Portfolio Review as at December 31, 2020
8
Asset ClassQoQ
Change
Portfolio
PositioningIncome Conservative
Conservative
BalancedBalanced
Balanced
GrowthGrowth
Maximum
Growth
Investment grade
bonds▼
Neutral Weight 17.1% 14.6% 12.2% 9.8% 7.3% 4.9% 0.0%
31-Dec-20 22.2% 16.8% 13.4% 9.3% 7.5% 3.4% 0.0%
Government
bonds▼
Neutral Weight 49.6% 42.5% 35.5% 28.4% 21.3% 14.2% 0.0%
31-Dec-20 18.9% 19.9% 16.1% 11.6% 6.7% 3.3% 0.0%
High-yield bonds ▲
Neutral Weight 3.3% 2.8% 2.4% 1.9% 1.4% 0.9% 0.0%
31-Dec-20 12.2% 6.6% 5.8% 4.2% 1.6% 1.0% 0.0%
U.S. equity ▲
Neutral Weight 10.5% 14.0% 17.5% 21.0% 24.5% 28.0% 35.0%
31-Dec-20 16.0% 16.7% 18.3% 22.9% 26.9% 30.9% 33.7%
Canadian equity ▲
Neutral Weight 9.0% 12.0% 15.0% 18.0% 21.0% 24.0% 30.0%
31-Dec-20 12.4% 16.0% 19.0% 21.6% 25.2% 27.7% 30.7%
International
equity▲
Neutral Weight 10.5% 14.0% 17.5% 21.0% 24.5% 28.0% 35.0%
31-Dec-20 11.1% 16.8% 21.2% 24.5% 27.9% 30.7% 32.2%
Cash ▼
Neutral Weight 0.0% 0.0% 0.0% 0.0% 0.0% 0.0% 0.0%
31-Dec-20 4.4% 4.6% 4.1% 3.8% 2.2% 2.1% 2.4%
Commodities ▼
Neutral Weight 0.0% 0.0% 0.0% 0.0% 0.0% 0.0% 0.0%
31-Dec-20 2.8% 2.6% 2.1% 2.0% 2.0% 0.9% 0.9%
Outlook and positioning
Neutral weight referes to the targeted strategic asset allocation for the portfolio.Source: CI GAM | Multi-Asset Management as at December 31, 2020
FOR INSTITUTIONAL USE ONLY
CommentaryQuarterly Portfolio Review as at December 31, 2020
9
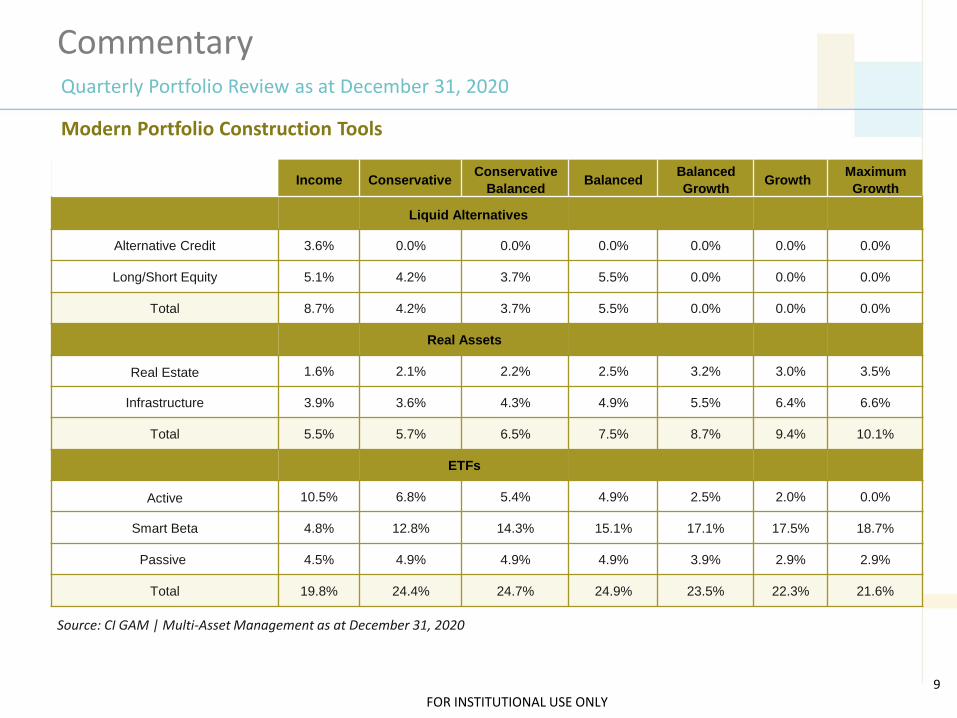
Modern Portfolio Construction Tools
Income ConservativeConservative
BalancedBalanced
Balanced
GrowthGrowth
Maximum
Growth
Liquid Alternatives
Alternative Credit 3.6% 0.0% 0.0% 0.0% 0.0% 0.0% 0.0%
Long/Short Equity 5.1% 4.2% 3.7% 5.5% 0.0% 0.0% 0.0%
Total 8.7% 4.2% 3.7% 5.5% 0.0% 0.0% 0.0%
Real Assets
Real Estate 1.6% 2.1% 2.2% 2.5% 3.2% 3.0% 3.5%
Infrastructure 3.9% 3.6% 4.3% 4.9% 5.5% 6.4% 6.6%
Total 5.5% 5.7% 6.5% 7.5% 8.7% 9.4% 10.1%
ETFs
Active 10.5% 6.8% 5.4% 4.9% 2.5% 2.0% 0.0%
Smart Beta 4.8% 12.8% 14.3% 15.1% 17.1% 17.5% 18.7%
Passive 4.5% 4.9% 4.9% 4.9% 3.9% 2.9% 2.9%
Total 19.8% 24.4% 24.7% 24.9% 23.5% 22.3% 21.6%
Source: CI GAM | Multi-Asset Management as at December 31, 2020
FOR INSTITUTIONAL USE ONLY
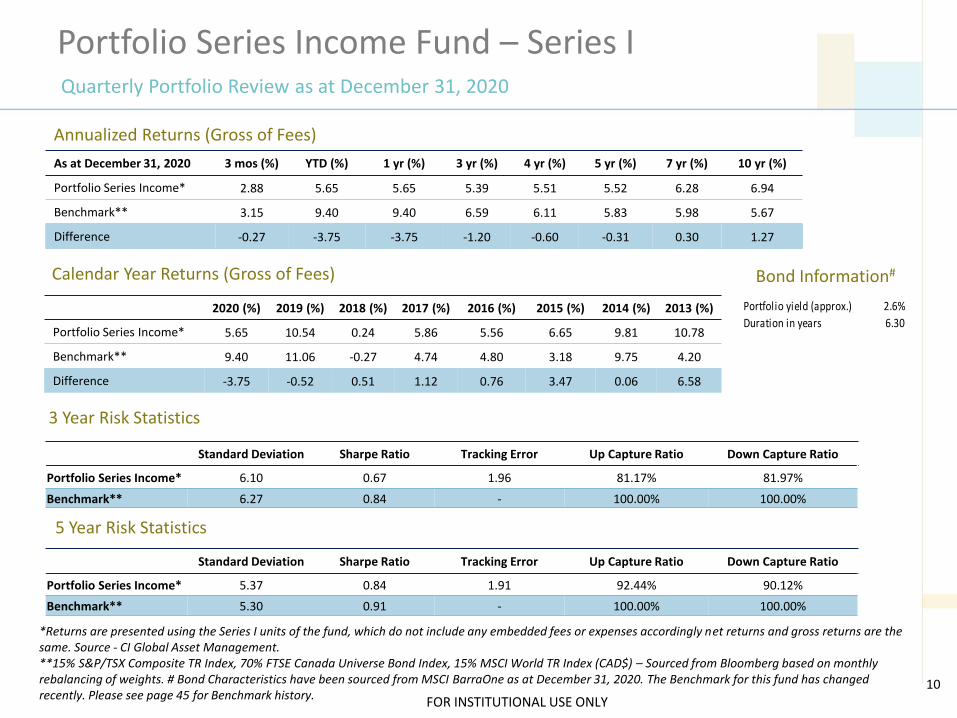
Calendar Year Returns (Gross of Fees)
3 Year Risk Statistics
Portfolio Series Income Fund – Series IQuarterly Portfolio Review as at December 31, 2020
Bond Information#
Annualized Returns (Gross of Fees)
Portfolio yield (approx.) 2.6%
Duration in years 6.30
*Returns are presented using the Series I units of the fund, which do not include any embedded fees or expenses accordingly net returns and gross returns are the same. Source - CI Global Asset Management.**15% S&P/TSX Composite TR Index, 70% FTSE Canada Universe Bond Index, 15% MSCI World TR Index (CAD$) – Sourced from Bloomberg based on monthly rebalancing of weights. # Bond Characteristics have been sourced from MSCI BarraOne as at December 31, 2020. The Benchmark for this fund has changed recently. Please see page 45 for Benchmark history.
10
Standard Deviation Sharpe Ratio Tracking Error Up Capture Ratio Down Capture Ratio
Portfolio Series Income* 6.10 0.67 1.96 81.17% 81.97%
Benchmark** 6.27 0.84 - 100.00% 100.00%
Standard Deviation Sharpe Ratio Tracking Error Up Capture Ratio Down Capture Ratio
Portfolio Series Income* 5.37 0.84 1.91 92.44% 90.12%
Benchmark** 5.30 0.91 - 100.00% 100.00%
5 Year Risk Statistics
As at December 31, 2020 3 mos (%) YTD (%) 1 yr (%) 3 yr (%) 4 yr (%) 5 yr (%) 7 yr (%) 10 yr (%)
Portfolio Series Income* 2.88 5.65 5.65 5.39 5.51 5.52 6.28 6.94
Benchmark** 3.15 9.40 9.40 6.59 6.11 5.83 5.98 5.67
Difference -0.27 -3.75 -3.75 -1.20 -0.60 -0.31 0.30 1.27
2020 (%) 2019 (%) 2018 (%) 2017 (%) 2016 (%) 2015 (%) 2014 (%) 2013 (%)
Portfolio Series Income* 5.65 10.54 0.24 5.86 5.56 6.65 9.81 10.78
Benchmark** 9.40 11.06 -0.27 4.74 4.80 3.18 9.75 4.20
Difference -3.75 -0.52 0.51 1.12 0.76 3.47 0.06 6.58
FOR INSTITUTIONAL USE ONLY
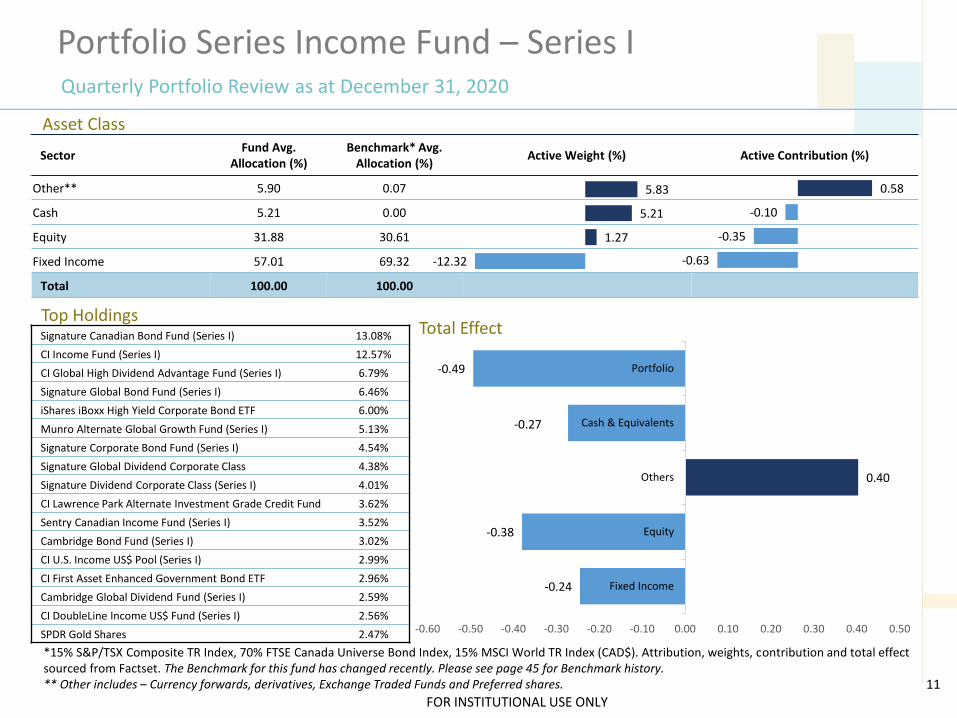
Asset Class
Portfolio Series Income Fund – Series IQuarterly Portfolio Review as at December 31, 2020
Top Holdings
11
SectorFund Avg.
Allocation (%)Benchmark* Avg.
Allocation (%)Active Weight (%) Active Contribution (%)
Other** 5.90 0.07
Cash 5.21 0.00
Equity 31.88 30.61
Fixed Income 57.01 69.32
Total 100.00 100.00
Total Effect
*15% S&P/TSX Composite TR Index, 70% FTSE Canada Universe Bond Index, 15% MSCI World TR Index (CAD$). Attribution, weights, contribution and total effect sourced from Factset. The Benchmark for this fund has changed recently. Please see page 45 for Benchmark history.** Other includes – Currency forwards, derivatives, Exchange Traded Funds and Preferred shares.
Signature Canadian Bond Fund (Series I) 13.08%
CI Income Fund (Series I) 12.57%
CI Global High Dividend Advantage Fund (Series I) 6.79%
Signature Global Bond Fund (Series I) 6.46%
iShares iBoxx High Yield Corporate Bond ETF 6.00%
Munro Alternate Global Growth Fund (Series I) 5.13%
Signature Corporate Bond Fund (Series I) 4.54%
Signature Global Dividend Corporate Class 4.38%
Signature Dividend Corporate Class (Series I) 4.01%
CI Lawrence Park Alternate Investment Grade Credit Fund 3.62%
Sentry Canadian Income Fund (Series I) 3.52%
Cambridge Bond Fund (Series I) 3.02%
CI U.S. Income US$ Pool (Series I) 2.99%
CI First Asset Enhanced Government Bond ETF 2.96%
Cambridge Global Dividend Fund (Series I) 2.59%
CI DoubleLine Income US$ Fund (Series I) 2.56%
SPDR Gold Shares 2.47%
-12.32
1.27
5.21
5.83
-0.63
-0.35
-0.10
0.58
-0.24
-0.38
0.40
-0.27
-0.49
-0.60 -0.50 -0.40 -0.30 -0.20 -0.10 0.00 0.10 0.20 0.30 0.40 0.50
Fixed Income
Equity
Others
Cash & Equivalents
Portfolio
FOR INSTITUTIONAL USE ONLY
Portfolio Series Income Fund – Series IQuarterly Portfolio Review as at December 31, 2020
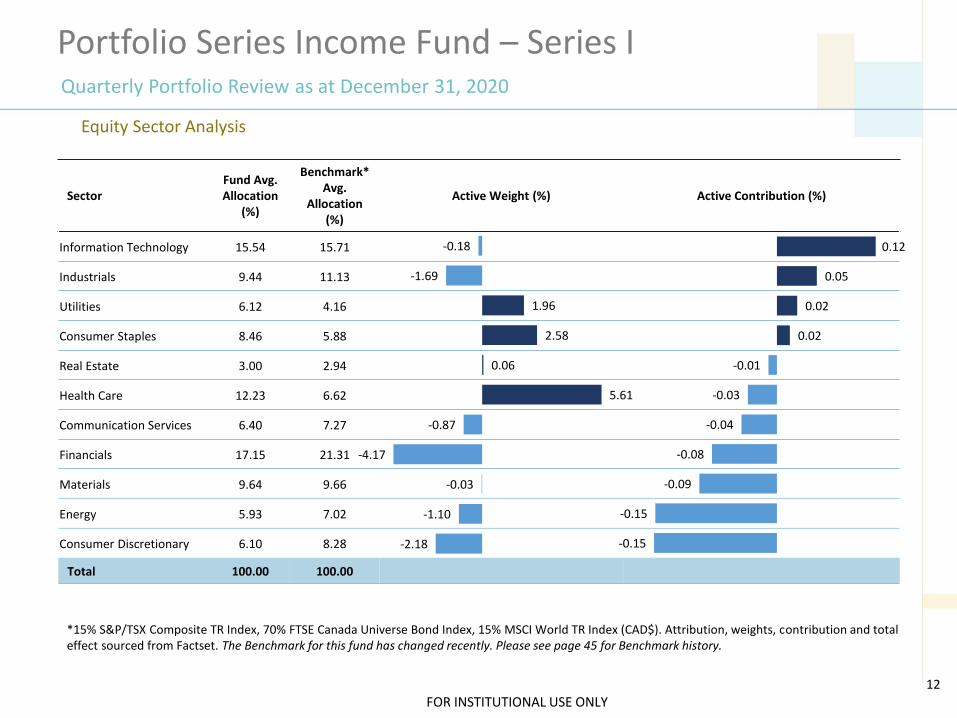
Equity Sector Analysis
12
SectorFund Avg. Allocation
(%)
Benchmark* Avg.
Allocation (%)
Active Weight (%) Active Contribution (%)
Information Technology 15.54 15.71
Industrials 9.44 11.13
Utilities 6.12 4.16
Consumer Staples 8.46 5.88
Real Estate 3.00 2.94
Health Care 12.23 6.62
Communication Services 6.40 7.27
Financials 17.15 21.31
Materials 9.64 9.66
Energy 5.93 7.02
Consumer Discretionary 6.10 8.28
Total 100.00 100.00
*15% S&P/TSX Composite TR Index, 70% FTSE Canada Universe Bond Index, 15% MSCI World TR Index (CAD$). Attribution, weights, contribution and total effect sourced from Factset. The Benchmark for this fund has changed recently. Please see page 45 for Benchmark history.
-2.18
-1.10
-0.03
-4.17
-0.87
5.61
0.06
2.58
1.96
-1.69
-0.18
-0.15
-0.15
-0.09
-0.08
-0.04
-0.03
-0.01
0.02
0.02
0.05
0.12
FOR INSTITUTIONAL USE ONLY
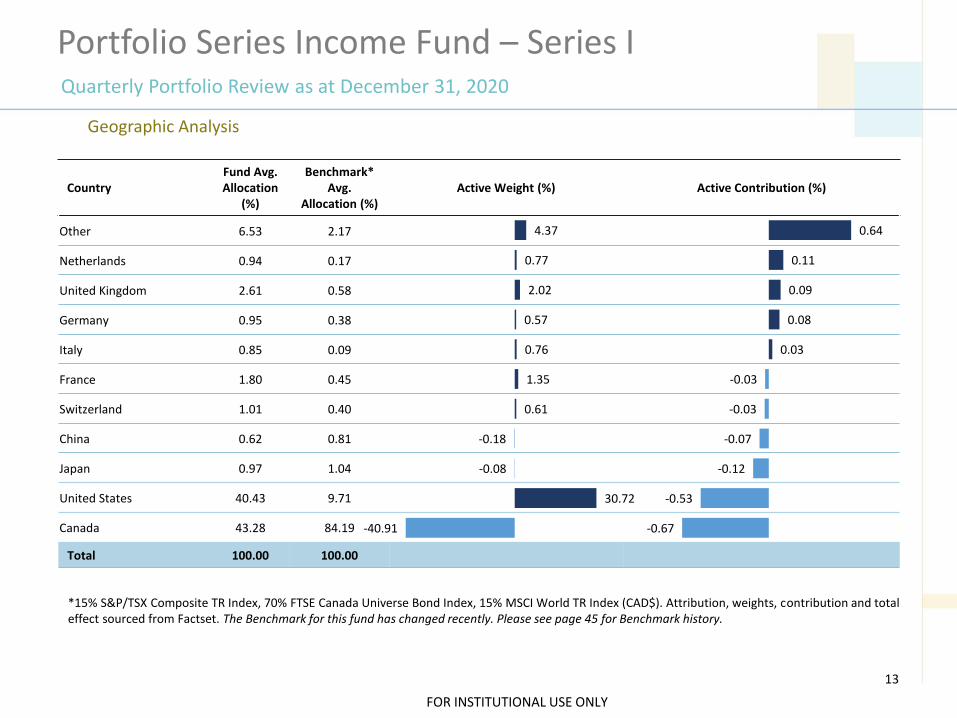
Portfolio Series Income Fund – Series IQuarterly Portfolio Review as at December 31, 2020
13
CountryFund Avg. Allocation
(%)
Benchmark* Avg.
Allocation (%)Active Weight (%) Active Contribution (%)
Other 6.53 2.17
Netherlands 0.94 0.17
United Kingdom 2.61 0.58
Germany 0.95 0.38
Italy 0.85 0.09
France 1.80 0.45
Switzerland 1.01 0.40
China 0.62 0.81
Japan 0.97 1.04
United States 40.43 9.71
Canada 43.28 84.19
Total 100.00 100.00
Geographic Analysis
*15% S&P/TSX Composite TR Index, 70% FTSE Canada Universe Bond Index, 15% MSCI World TR Index (CAD$). Attribution, weights, contribution and total effect sourced from Factset. The Benchmark for this fund has changed recently. Please see page 45 for Benchmark history.
-40.91
30.72
-0.08
-0.18
0.61
1.35
0.76
0.57
2.02
0.77
4.37
-0.67
-0.53
-0.12
-0.07
-0.03
-0.03
0.03
0.08
0.09
0.11
0.64
FOR INSTITUTIONAL USE ONLY
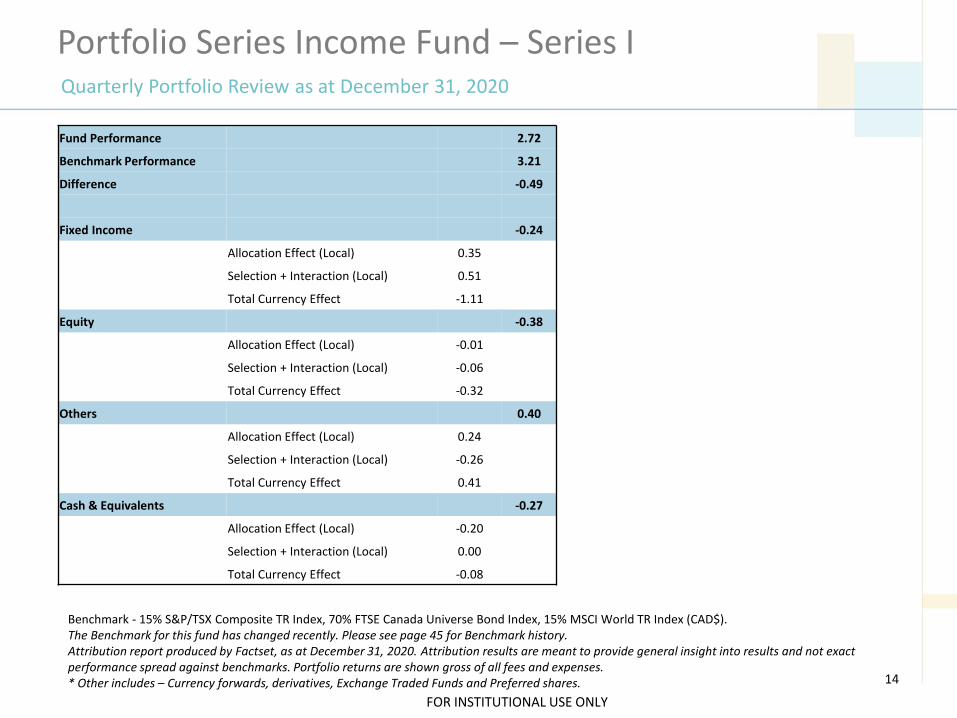
Portfolio Series Income Fund – Series IQuarterly Portfolio Review as at December 31, 2020
14
Fund Performance 2.72
Benchmark Performance 3.21
Difference -0.49
Fixed Income -0.24
Allocation Effect (Local) 0.35
Selection + Interaction (Local) 0.51
Total Currency Effect -1.11
Equity -0.38
Allocation Effect (Local) -0.01
Selection + Interaction (Local) -0.06
Total Currency Effect -0.32
Others 0.40
Allocation Effect (Local) 0.24
Selection + Interaction (Local) -0.26
Total Currency Effect 0.41
Cash & Equivalents -0.27
Allocation Effect (Local) -0.20
Selection + Interaction (Local) 0.00
Total Currency Effect -0.08
Benchmark - 15% S&P/TSX Composite TR Index, 70% FTSE Canada Universe Bond Index, 15% MSCI World TR Index (CAD$). The Benchmark for this fund has changed recently. Please see page 45 for Benchmark history.Attribution report produced by Factset, as at December 31, 2020. Attribution results are meant to provide general insight into results and not exact performance spread against benchmarks. Portfolio returns are shown gross of all fees and expenses.* Other includes – Currency forwards, derivatives, Exchange Traded Funds and Preferred shares.
FOR INSTITUTIONAL USE ONLY
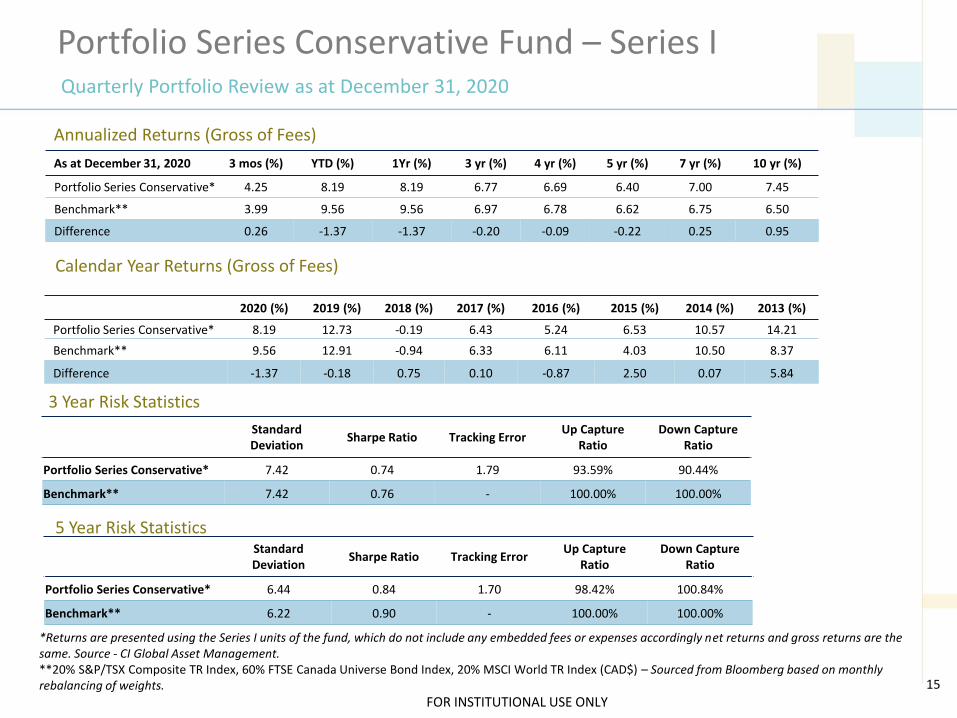
Calendar Year Returns (Gross of Fees)
3 Year Risk Statistics
Portfolio Series Conservative Fund – Series IQuarterly Portfolio Review as at December 31, 2020
Annualized Returns (Gross of Fees)
*Returns are presented using the Series I units of the fund, which do not include any embedded fees or expenses accordingly net returns and gross returns are the same. Source - CI Global Asset Management.**20% S&P/TSX Composite TR Index, 60% FTSE Canada Universe Bond Index, 20% MSCI World TR Index (CAD$) – Sourced from Bloomberg based on monthly rebalancing of weights. 15
Standard Deviation
Sharpe Ratio Tracking ErrorUp Capture
RatioDown Capture
Ratio
Portfolio Series Conservative* 7.42 0.74 1.79 93.59% 90.44%
Benchmark** 7.42 0.76 - 100.00% 100.00%
5 Year Risk Statistics
As at December 31, 2020 3 mos (%) YTD (%) 1Yr (%) 3 yr (%) 4 yr (%) 5 yr (%) 7 yr (%) 10 yr (%)
Portfolio Series Conservative* 4.25 8.19 8.19 6.77 6.69 6.40 7.00 7.45
Benchmark** 3.99 9.56 9.56 6.97 6.78 6.62 6.75 6.50
Difference 0.26 -1.37 -1.37 -0.20 -0.09 -0.22 0.25 0.95
2020 (%) 2019 (%) 2018 (%) 2017 (%) 2016 (%) 2015 (%) 2014 (%) 2013 (%)
Portfolio Series Conservative* 8.19 12.73 -0.19 6.43 5.24 6.53 10.57 14.21
Benchmark** 9.56 12.91 -0.94 6.33 6.11 4.03 10.50 8.37
Difference -1.37 -0.18 0.75 0.10 -0.87 2.50 0.07 5.84
Standard Deviation
Sharpe Ratio Tracking ErrorUp Capture
RatioDown Capture
Ratio
Portfolio Series Conservative* 6.44 0.84 1.70 98.42% 100.84%
Benchmark** 6.22 0.90 - 100.00% 100.00%
FOR INSTITUTIONAL USE ONLY
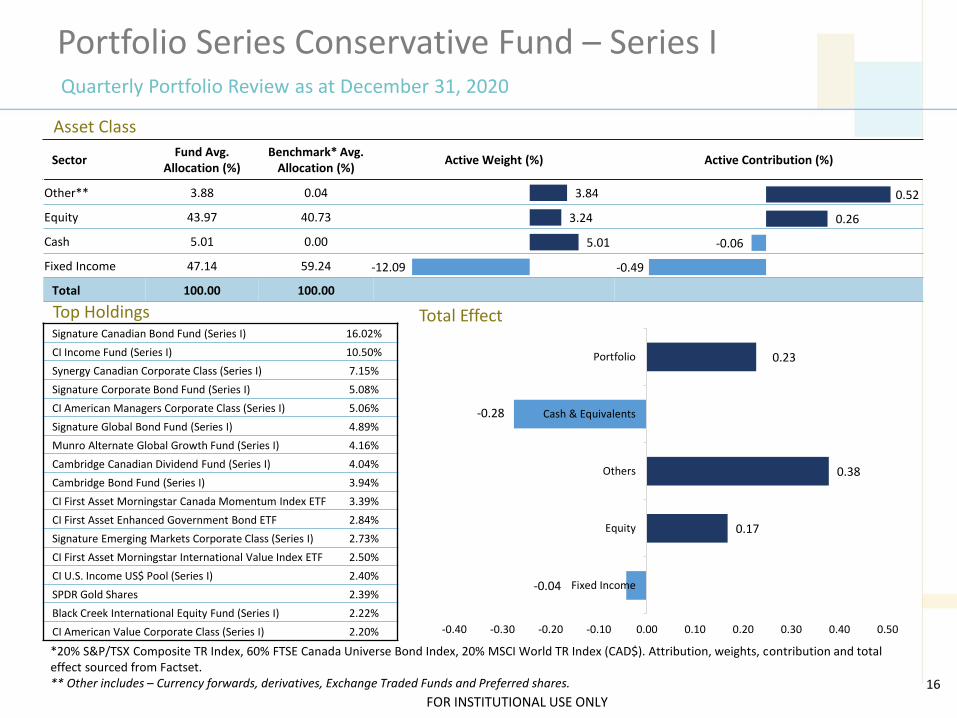
Portfolio Series Conservative Fund – Series IQuarterly Portfolio Review as at December 31, 2020
Top Holdings
16
Signature Canadian Bond Fund (Series I) 16.02%
CI Income Fund (Series I) 10.50%
Synergy Canadian Corporate Class (Series I) 7.15%
Signature Corporate Bond Fund (Series I) 5.08%
CI American Managers Corporate Class (Series I) 5.06%
Signature Global Bond Fund (Series I) 4.89%
Munro Alternate Global Growth Fund (Series I) 4.16%
Cambridge Canadian Dividend Fund (Series I) 4.04%
Cambridge Bond Fund (Series I) 3.94%
CI First Asset Morningstar Canada Momentum Index ETF 3.39%
CI First Asset Enhanced Government Bond ETF 2.84%
Signature Emerging Markets Corporate Class (Series I) 2.73%
CI First Asset Morningstar International Value Index ETF 2.50%
CI U.S. Income US$ Pool (Series I) 2.40%
SPDR Gold Shares 2.39%
Black Creek International Equity Fund (Series I) 2.22%
CI American Value Corporate Class (Series I) 2.20%
SectorFund Avg.
Allocation (%)Benchmark* Avg.
Allocation (%)Active Weight (%) Active Contribution (%)
Other** 3.88 0.04
Equity 43.97 40.73
Cash 5.01 0.00
Fixed Income 47.14 59.24
Total 100.00 100.00
Asset Class
Total Effect
*20% S&P/TSX Composite TR Index, 60% FTSE Canada Universe Bond Index, 20% MSCI World TR Index (CAD$). Attribution, weights, contribution and total effect sourced from Factset. ** Other includes – Currency forwards, derivatives, Exchange Traded Funds and Preferred shares.
-12.09
5.01
3.24
3.84
-0.49
-0.06
0.26
0.52
-0.04
0.17
0.38
-0.28
0.23
-0.40 -0.30 -0.20 -0.10 0.00 0.10 0.20 0.30 0.40 0.50
Fixed Income
Equity
Others
Cash & Equivalents
Portfolio
FOR INSTITUTIONAL USE ONLY
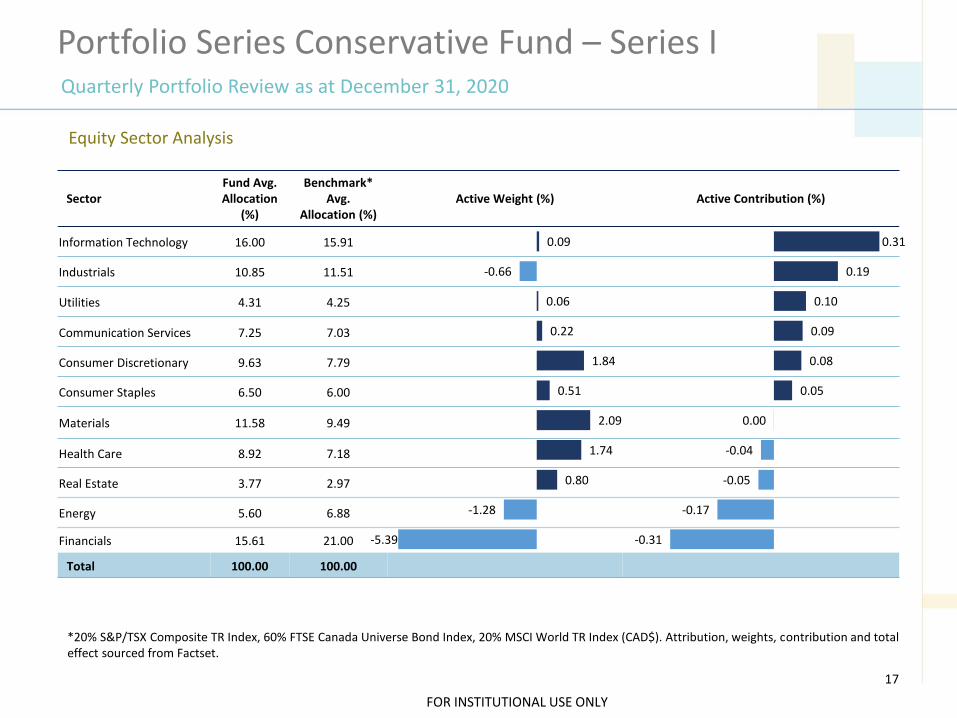
Portfolio Series Conservative Fund – Series IQuarterly Portfolio Review as at December 31, 2020
17
SectorFund Avg. Allocation
(%)
Benchmark* Avg.
Allocation (%)Active Weight (%) Active Contribution (%)
Information Technology 16.00 15.91
Industrials 10.85 11.51
Utilities 4.31 4.25
Communication Services 7.25 7.03
Consumer Discretionary 9.63 7.79
Consumer Staples 6.50 6.00
Materials 11.58 9.49
Health Care 8.92 7.18
Real Estate 3.77 2.97
Energy 5.60 6.88
Financials 15.61 21.00
Total 100.00 100.00
Equity Sector Analysis
*20% S&P/TSX Composite TR Index, 60% FTSE Canada Universe Bond Index, 20% MSCI World TR Index (CAD$). Attribution, weights, contribution and total effect sourced from Factset.
-5.39
-1.28
0.80
1.74
2.09
0.51
1.84
0.22
0.06
-0.66
0.09
-0.31
-0.17
-0.05
-0.04
0.00
0.05
0.08
0.09
0.10
0.19
0.31
FOR INSTITUTIONAL USE ONLY
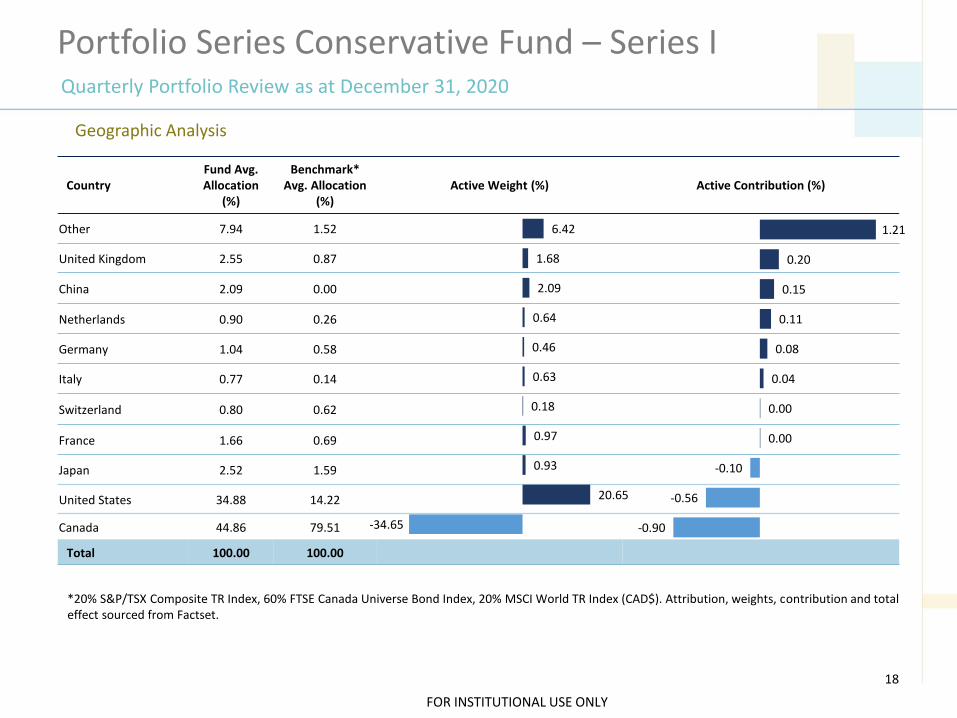
Portfolio Series Conservative Fund – Series IQuarterly Portfolio Review as at December 31, 2020
18
CountryFund Avg. Allocation
(%)
Benchmark* Avg. Allocation
(%)Active Weight (%) Active Contribution (%)
Other 7.94 1.52
United Kingdom 2.55 0.87
China 2.09 0.00
Netherlands 0.90 0.26
Germany 1.04 0.58
Italy 0.77 0.14
Switzerland 0.80 0.62
France 1.66 0.69
Japan 2.52 1.59
United States 34.88 14.22
Canada 44.86 79.51
Total 100.00 100.00
Geographic Analysis
*20% S&P/TSX Composite TR Index, 60% FTSE Canada Universe Bond Index, 20% MSCI World TR Index (CAD$). Attribution, weights, contribution and total effect sourced from Factset.
-34.65
20.65
0.93
0.97
0.18
0.63
0.46
0.64
2.09
1.68
6.42
-0.90
-0.56
-0.10
0.00
0.00
0.04
0.08
0.11
0.15
0.20
1.21
FOR INSTITUTIONAL USE ONLY
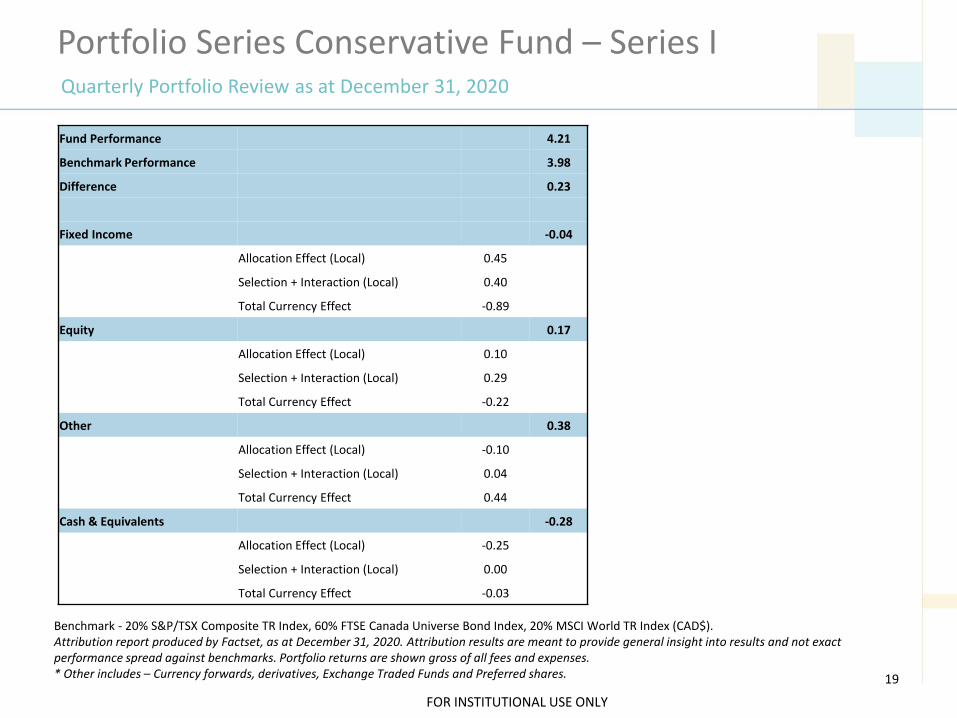
Portfolio Series Conservative Fund – Series IQuarterly Portfolio Review as at December 31, 2020
19
Benchmark - 20% S&P/TSX Composite TR Index, 60% FTSE Canada Universe Bond Index, 20% MSCI World TR Index (CAD$).Attribution report produced by Factset, as at December 31, 2020. Attribution results are meant to provide general insight into results and not exact performance spread against benchmarks. Portfolio returns are shown gross of all fees and expenses.* Other includes – Currency forwards, derivatives, Exchange Traded Funds and Preferred shares.
Fund Performance 4.21
Benchmark Performance 3.98
Difference 0.23
Fixed Income -0.04
Allocation Effect (Local) 0.45
Selection + Interaction (Local) 0.40
Total Currency Effect -0.89
Equity 0.17
Allocation Effect (Local) 0.10
Selection + Interaction (Local) 0.29
Total Currency Effect -0.22
Other 0.38
Allocation Effect (Local) -0.10
Selection + Interaction (Local) 0.04
Total Currency Effect 0.44
Cash & Equivalents -0.28
Allocation Effect (Local) -0.25
Selection + Interaction (Local) 0.00
Total Currency Effect -0.03
FOR INSTITUTIONAL USE ONLY
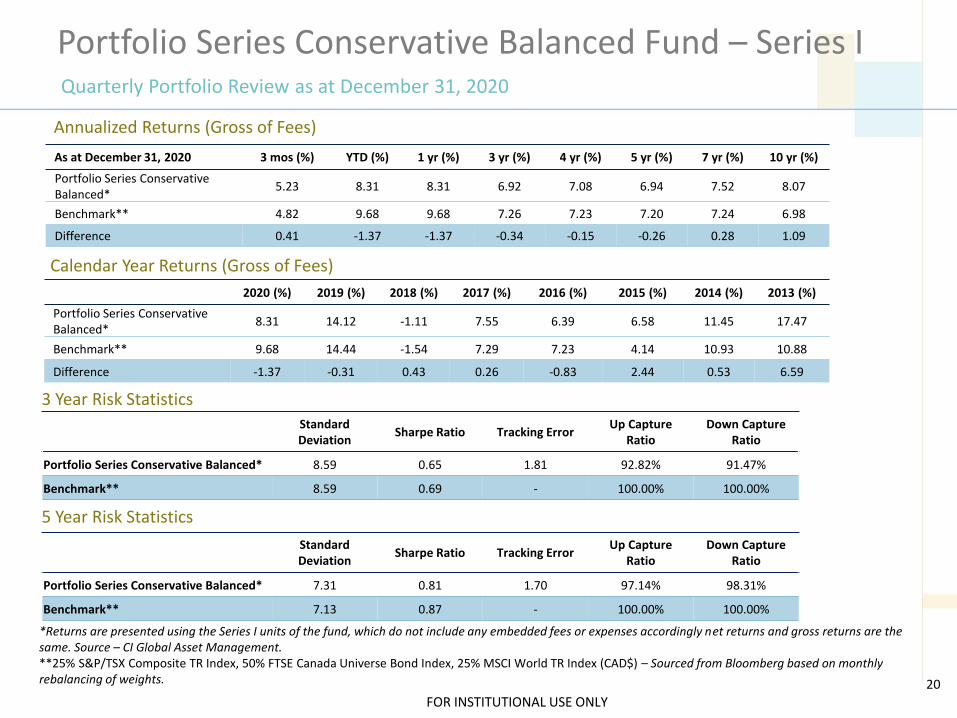
Calendar Year Returns (Gross of Fees)
3 Year Risk Statistics
Portfolio Series Conservative Balanced Fund – Series IQuarterly Portfolio Review as at December 31, 2020
Annualized Returns (Gross of Fees)
*Returns are presented using the Series I units of the fund, which do not include any embedded fees or expenses accordingly net returns and gross returns are the same. Source – CI Global Asset Management.**25% S&P/TSX Composite TR Index, 50% FTSE Canada Universe Bond Index, 25% MSCI World TR Index (CAD$) – Sourced from Bloomberg based on monthly rebalancing of weights. 20
Standard Deviation
Sharpe Ratio Tracking ErrorUp Capture
RatioDown Capture
Ratio
Portfolio Series Conservative Balanced* 8.59 0.65 1.81 92.82% 91.47%
Benchmark** 8.59 0.69 - 100.00% 100.00%
As at December 31, 2020 3 mos (%) YTD (%) 1 yr (%) 3 yr (%) 4 yr (%) 5 yr (%) 7 yr (%) 10 yr (%)
Portfolio Series Conservative Balanced*
5.23 8.31 8.31 6.92 7.08 6.94 7.52 8.07
Benchmark** 4.82 9.68 9.68 7.26 7.23 7.20 7.24 6.98
Difference 0.41 -1.37 -1.37 -0.34 -0.15 -0.26 0.28 1.09
2020 (%) 2019 (%) 2018 (%) 2017 (%) 2016 (%) 2015 (%) 2014 (%) 2013 (%)
Portfolio Series Conservative Balanced*
8.31 14.12 -1.11 7.55 6.39 6.58 11.45 17.47
Benchmark** 9.68 14.44 -1.54 7.29 7.23 4.14 10.93 10.88
Difference -1.37 -0.31 0.43 0.26 -0.83 2.44 0.53 6.59
Standard Deviation
Sharpe Ratio Tracking ErrorUp Capture
RatioDown Capture
Ratio
Portfolio Series Conservative Balanced* 7.31 0.81 1.70 97.14% 98.31%
Benchmark** 7.13 0.87 - 100.00% 100.00%
5 Year Risk Statistics
FOR INSTITUTIONAL USE ONLY
Portfolio Series Conservative Balanced Fund – Series IQuarterly Portfolio Review as at December 31, 2020
Top Holdings
21
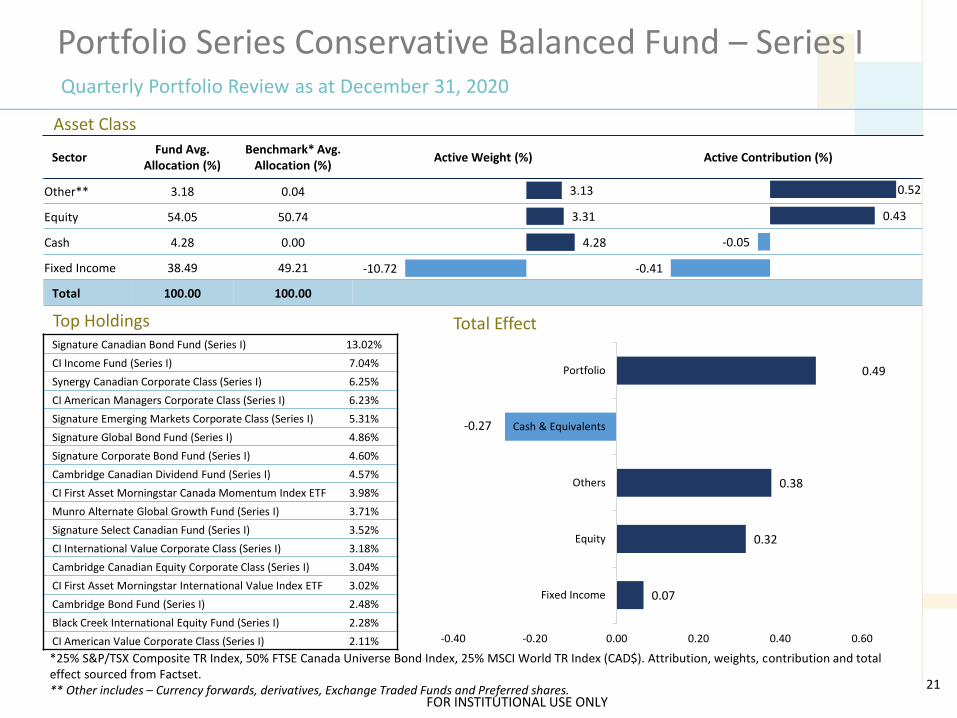
SectorFund Avg.
Allocation (%)Benchmark* Avg.
Allocation (%)Active Weight (%) Active Contribution (%)
Other** 3.18 0.04
Equity 54.05 50.74
Cash 4.28 0.00
Fixed Income 38.49 49.21
Total 100.00 100.00
Asset Class
Signature Canadian Bond Fund (Series I) 13.02%
CI Income Fund (Series I) 7.04%
Synergy Canadian Corporate Class (Series I) 6.25%
CI American Managers Corporate Class (Series I) 6.23%
Signature Emerging Markets Corporate Class (Series I) 5.31%
Signature Global Bond Fund (Series I) 4.86%
Signature Corporate Bond Fund (Series I) 4.60%
Cambridge Canadian Dividend Fund (Series I) 4.57%
CI First Asset Morningstar Canada Momentum Index ETF 3.98%
Munro Alternate Global Growth Fund (Series I) 3.71%
Signature Select Canadian Fund (Series I) 3.52%
CI International Value Corporate Class (Series I) 3.18%
Cambridge Canadian Equity Corporate Class (Series I) 3.04%
CI First Asset Morningstar International Value Index ETF 3.02%
Cambridge Bond Fund (Series I) 2.48%
Black Creek International Equity Fund (Series I) 2.28%
CI American Value Corporate Class (Series I) 2.11%
Total Effect
*25% S&P/TSX Composite TR Index, 50% FTSE Canada Universe Bond Index, 25% MSCI World TR Index (CAD$). Attribution, weights, contribution and total effect sourced from Factset.** Other includes – Currency forwards, derivatives, Exchange Traded Funds and Preferred shares.
-10.72
4.28
3.31
3.13
-0.41
-0.05
0.43
0.52
0.07
0.32
0.38
-0.27
0.49
-0.40 -0.20 0.00 0.20 0.40 0.60
Fixed Income
Equity
Others
Cash & Equivalents
Portfolio
FOR INSTITUTIONAL USE ONLY
Portfolio Series Conservative Balanced Fund – Series IQuarterly Portfolio Review as at December 31, 2020
22
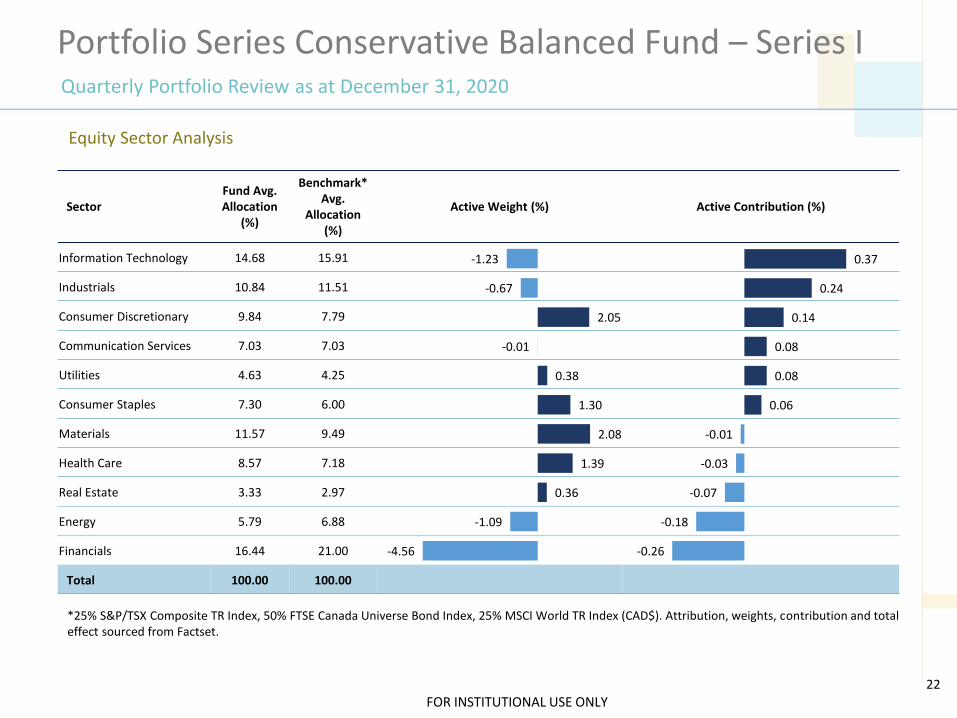
Equity Sector Analysis
SectorFund Avg. Allocation
(%)
Benchmark* Avg.
Allocation (%)
Active Weight (%) Active Contribution (%)
Information Technology 14.68 15.91
Industrials 10.84 11.51
Consumer Discretionary 9.84 7.79
Communication Services 7.03 7.03
Utilities 4.63 4.25
Consumer Staples 7.30 6.00
Materials 11.57 9.49
Health Care 8.57 7.18
Real Estate 3.33 2.97
Energy 5.79 6.88
Financials 16.44 21.00
Total 100.00 100.00
*25% S&P/TSX Composite TR Index, 50% FTSE Canada Universe Bond Index, 25% MSCI World TR Index (CAD$). Attribution, weights, contribution and total effect sourced from Factset.
-4.56
-1.09
0.36
1.39
2.08
1.30
0.38
-0.01
2.05
-0.67
-1.23
-0.26
-0.18
-0.07
-0.03
-0.01
0.06
0.08
0.08
0.14
0.24
0.37
FOR INSTITUTIONAL USE ONLY
Portfolio Series Conservative Balanced Fund – Series IQuarterly Portfolio Review as at December 31, 2020
23
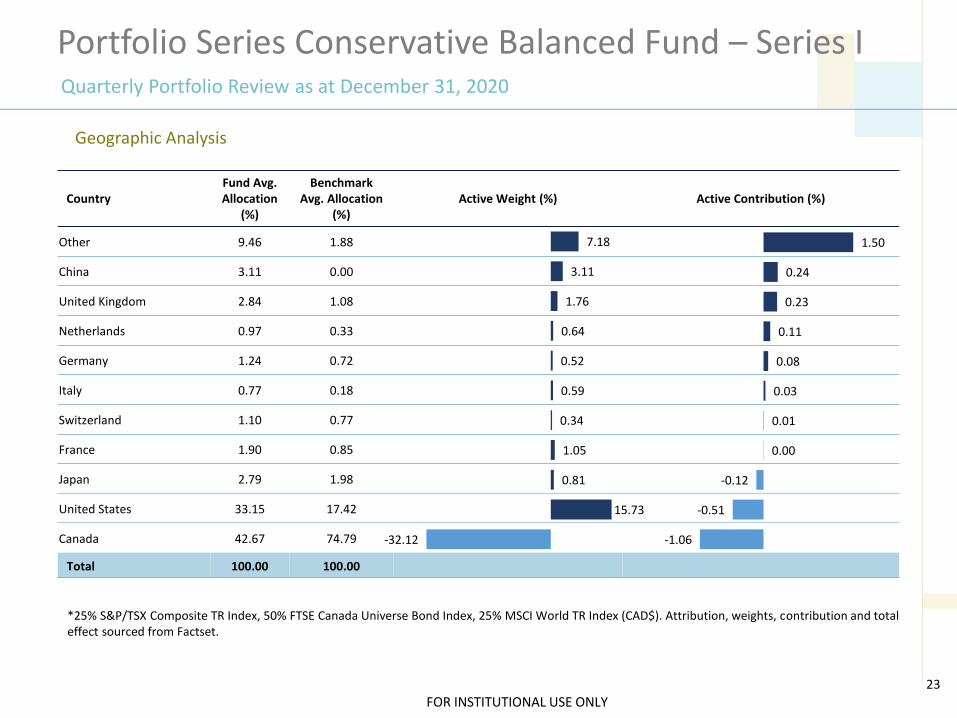
Geographic Analysis
CountryFund Avg. Allocation
(%)
Benchmark Avg. Allocation
(%)Active Weight (%) Active Contribution (%)
Other 9.46 1.88
China 3.11 0.00
United Kingdom 2.84 1.08
Netherlands 0.97 0.33
Germany 1.24 0.72
Italy 0.77 0.18
Switzerland 1.10 0.77
France 1.90 0.85
Japan 2.79 1.98
United States 33.15 17.42
Canada 42.67 74.79
Total 100.00 100.00
*25% S&P/TSX Composite TR Index, 50% FTSE Canada Universe Bond Index, 25% MSCI World TR Index (CAD$). Attribution, weights, contribution and total effect sourced from Factset.
-32.12
15.73
0.81
1.05
0.34
0.59
0.52
0.64
1.76
3.11
7.18
-1.06
-0.51
-0.12
0.00
0.01
0.03
0.08
0.11
0.23
0.24
1.50
FOR INSTITUTIONAL USE ONLY
Portfolio Series Conservative Balanced Fund – Series IQuarterly Portfolio Review as at December 31, 2020
24
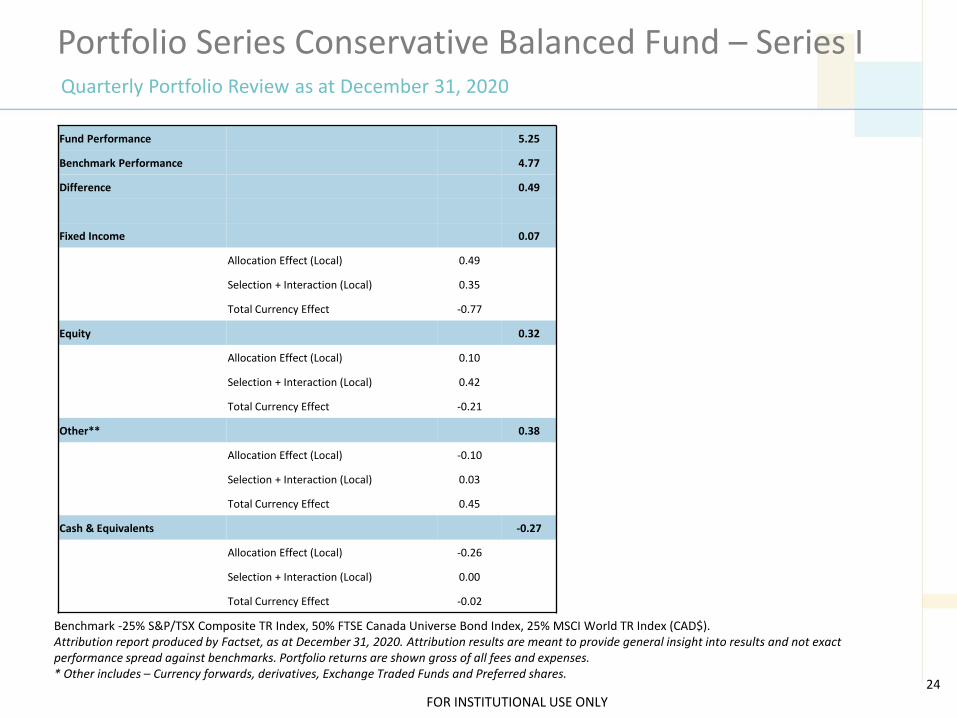
Benchmark -25% S&P/TSX Composite TR Index, 50% FTSE Canada Universe Bond Index, 25% MSCI World TR Index (CAD$).Attribution report produced by Factset, as at December 31, 2020. Attribution results are meant to provide general insight into results and not exact performance spread against benchmarks. Portfolio returns are shown gross of all fees and expenses.* Other includes – Currency forwards, derivatives, Exchange Traded Funds and Preferred shares.
Fund Performance 5.25
Benchmark Performance 4.77
Difference 0.49
Fixed Income 0.07
Allocation Effect (Local) 0.49
Selection + Interaction (Local) 0.35
Total Currency Effect -0.77
Equity 0.32
Allocation Effect (Local) 0.10
Selection + Interaction (Local) 0.42
Total Currency Effect -0.21
Other** 0.38
Allocation Effect (Local) -0.10
Selection + Interaction (Local) 0.03
Total Currency Effect 0.45
Cash & Equivalents -0.27
Allocation Effect (Local) -0.26
Selection + Interaction (Local) 0.00
Total Currency Effect -0.02
FOR INSTITUTIONAL USE ONLY
Calendar Year Returns (Gross of Fees)
3 Year Risk Statistics
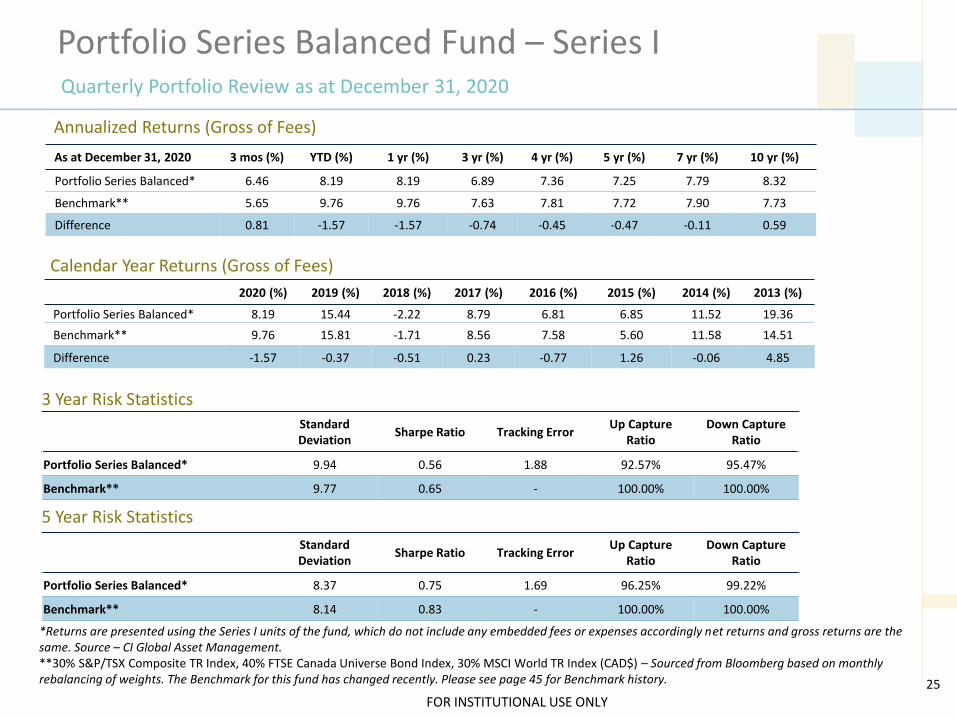
Portfolio Series Balanced Fund – Series IQuarterly Portfolio Review as at December 31, 2020
Annualized Returns (Gross of Fees)
*Returns are presented using the Series I units of the fund, which do not include any embedded fees or expenses accordingly net returns and gross returns are the same. Source – CI Global Asset Management.**30% S&P/TSX Composite TR Index, 40% FTSE Canada Universe Bond Index, 30% MSCI World TR Index (CAD$) – Sourced from Bloomberg based on monthly rebalancing of weights. The Benchmark for this fund has changed recently. Please see page 45 for Benchmark history. 25
Standard Deviation
Sharpe Ratio Tracking ErrorUp Capture
RatioDown Capture
Ratio
Portfolio Series Balanced* 9.94 0.56 1.88 92.57% 95.47%
Benchmark** 9.77 0.65 - 100.00% 100.00%
As at December 31, 2020 3 mos (%) YTD (%) 1 yr (%) 3 yr (%) 4 yr (%) 5 yr (%) 7 yr (%) 10 yr (%)
Portfolio Series Balanced* 6.46 8.19 8.19 6.89 7.36 7.25 7.79 8.32
Benchmark** 5.65 9.76 9.76 7.63 7.81 7.72 7.90 7.73
Difference 0.81 -1.57 -1.57 -0.74 -0.45 -0.47 -0.11 0.59
2020 (%) 2019 (%) 2018 (%) 2017 (%) 2016 (%) 2015 (%) 2014 (%) 2013 (%)
Portfolio Series Balanced* 8.19 15.44 -2.22 8.79 6.81 6.85 11.52 19.36
Benchmark** 9.76 15.81 -1.71 8.56 7.58 5.60 11.58 14.51
Difference -1.57 -0.37 -0.51 0.23 -0.77 1.26 -0.06 4.85
Standard Deviation
Sharpe Ratio Tracking ErrorUp Capture
RatioDown Capture
Ratio
Portfolio Series Balanced* 8.37 0.75 1.69 96.25% 99.22%
Benchmark** 8.14 0.83 - 100.00% 100.00%
5 Year Risk Statistics
FOR INSTITUTIONAL USE ONLY
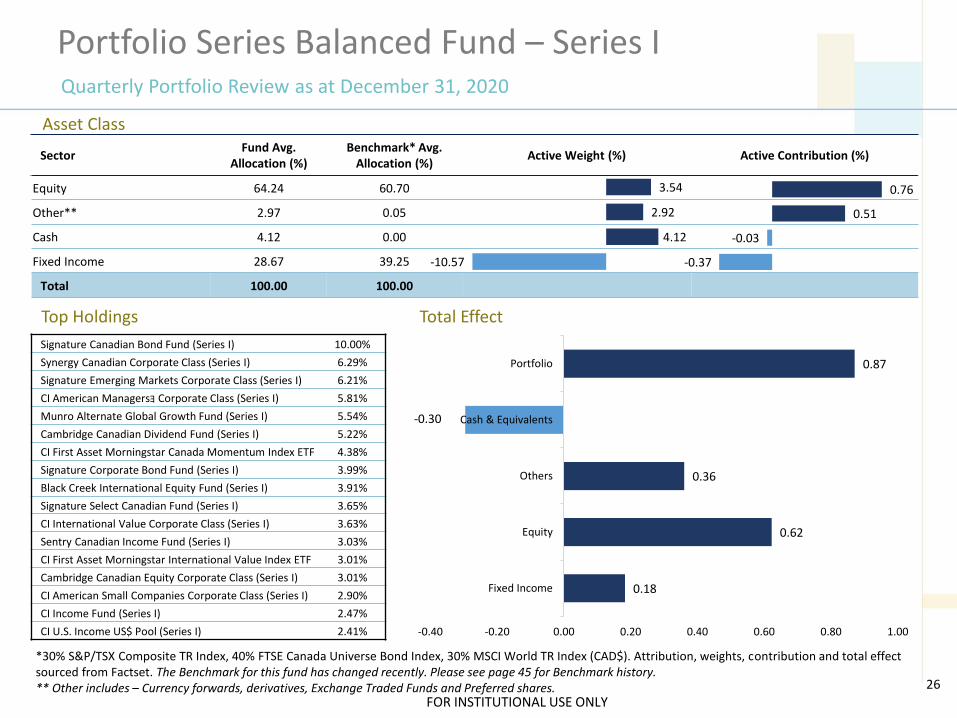
Asset Class
Portfolio Series Balanced Fund – Series IQuarterly Portfolio Review as at December 31, 2020
Top Holdings
26
Signature Canadian Bond Fund (Series I) 10.00%
Synergy Canadian Corporate Class (Series I) 6.29%
Signature Emerging Markets Corporate Class (Series I) 6.21%
CI American Managersョ Corporate Class (Series I) 5.81%
Munro Alternate Global Growth Fund (Series I) 5.54%
Cambridge Canadian Dividend Fund (Series I) 5.22%
CI First Asset Morningstar Canada Momentum Index ETF 4.38%
Signature Corporate Bond Fund (Series I) 3.99%
Black Creek International Equity Fund (Series I) 3.91%
Signature Select Canadian Fund (Series I) 3.65%
CI International Value Corporate Class (Series I) 3.63%
Sentry Canadian Income Fund (Series I) 3.03%
CI First Asset Morningstar International Value Index ETF 3.01%
Cambridge Canadian Equity Corporate Class (Series I) 3.01%
CI American Small Companies Corporate Class (Series I) 2.90%
CI Income Fund (Series I) 2.47%
CI U.S. Income US$ Pool (Series I) 2.41%
SectorFund Avg.
Allocation (%)Benchmark* Avg.
Allocation (%)Active Weight (%) Active Contribution (%)
Equity 64.24 60.70
Other** 2.97 0.05
Cash 4.12 0.00
Fixed Income 28.67 39.25
Total 100.00 100.00
Total Effect
*30% S&P/TSX Composite TR Index, 40% FTSE Canada Universe Bond Index, 30% MSCI World TR Index (CAD$). Attribution, weights, contribution and total effect sourced from Factset. The Benchmark for this fund has changed recently. Please see page 45 for Benchmark history.** Other includes – Currency forwards, derivatives, Exchange Traded Funds and Preferred shares.
0.18
0.62
0.36
-0.30
0.87
-0.40 -0.20 0.00 0.20 0.40 0.60 0.80 1.00
Fixed Income
Equity
Others
Cash & Equivalents
Portfolio
-10.57
4.12
2.92
3.54
-0.37
-0.03
0.51
0.76
FOR INSTITUTIONAL USE ONLY
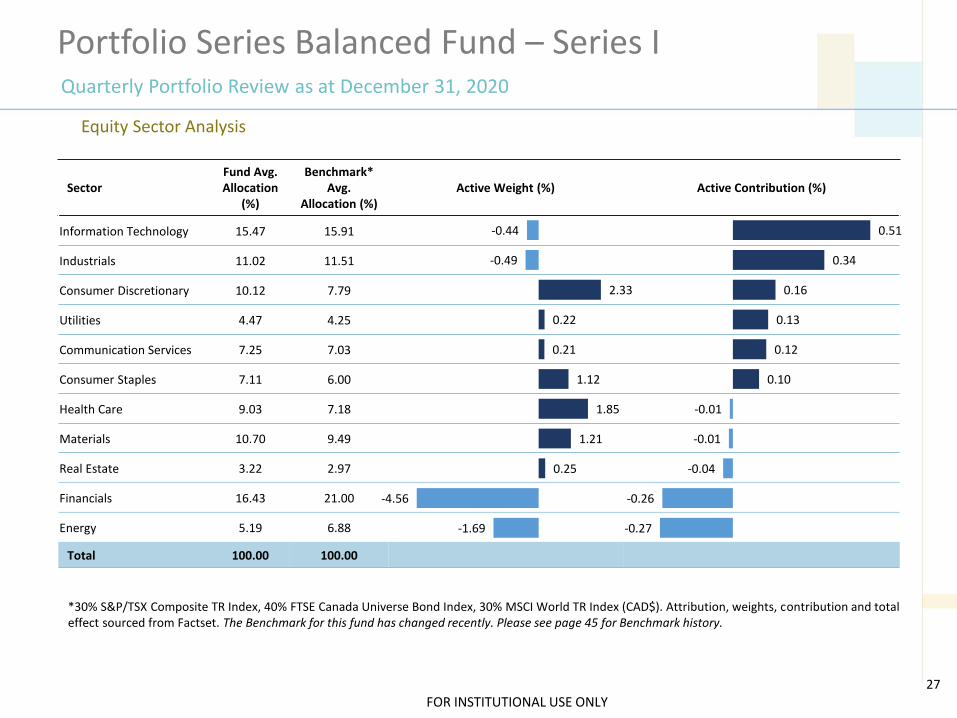
Portfolio Series Balanced Fund – Series IQuarterly Portfolio Review as at December 31, 2020
Equity Sector Analysis
27
SectorFund Avg. Allocation
(%)
Benchmark* Avg.
Allocation (%)Active Weight (%) Active Contribution (%)
Information Technology 15.47 15.91
Industrials 11.02 11.51
Consumer Discretionary 10.12 7.79
Utilities 4.47 4.25
Communication Services 7.25 7.03
Consumer Staples 7.11 6.00
Health Care 9.03 7.18
Materials 10.70 9.49
Real Estate 3.22 2.97
Financials 16.43 21.00
Energy 5.19 6.88
Total 100.00 100.00
*30% S&P/TSX Composite TR Index, 40% FTSE Canada Universe Bond Index, 30% MSCI World TR Index (CAD$). Attribution, weights, contribution and total effect sourced from Factset. The Benchmark for this fund has changed recently. Please see page 45 for Benchmark history.
-1.69
-4.56
0.25
1.21
1.85
1.12
0.21
0.22
2.33
-0.49
-0.44
-0.27
-0.26
-0.04
-0.01
-0.01
0.10
0.12
0.13
0.16
0.34
0.51
FOR INSTITUTIONAL USE ONLY
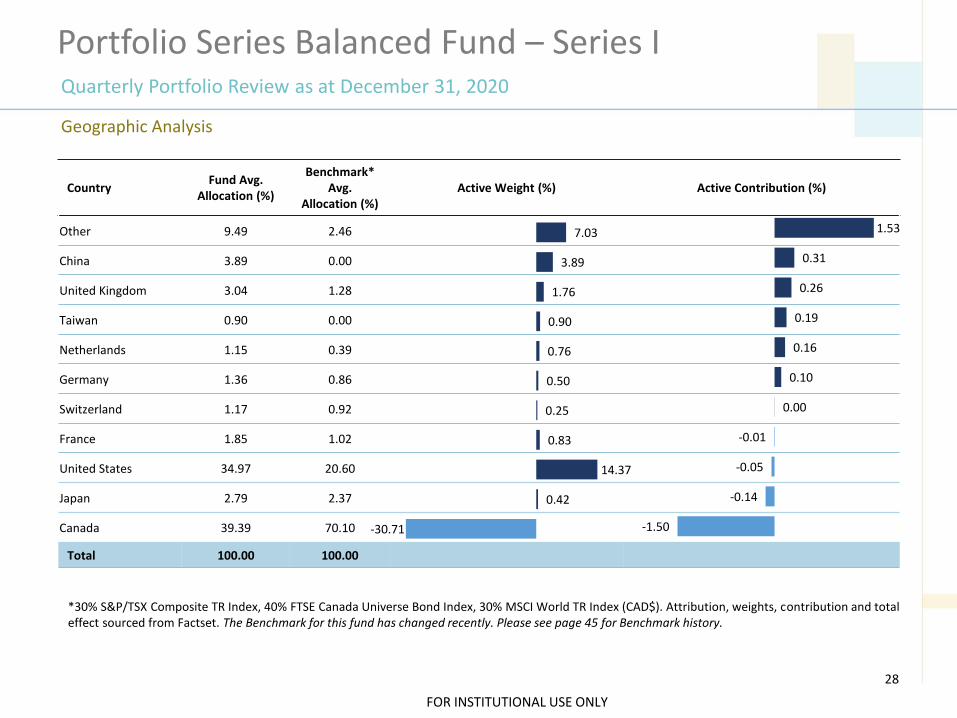
Portfolio Series Balanced Fund – Series IQuarterly Portfolio Review as at December 31, 2020
28
CountryFund Avg.
Allocation (%)
Benchmark* Avg.
Allocation (%)Active Weight (%) Active Contribution (%)
Other 9.49 2.46
China 3.89 0.00
United Kingdom 3.04 1.28
Taiwan 0.90 0.00
Netherlands 1.15 0.39
Germany 1.36 0.86
Switzerland 1.17 0.92
France 1.85 1.02
United States 34.97 20.60
Japan 2.79 2.37
Canada 39.39 70.10
Total 100.00 100.00
Geographic Analysis
*30% S&P/TSX Composite TR Index, 40% FTSE Canada Universe Bond Index, 30% MSCI World TR Index (CAD$). Attribution, weights, contribution and total effect sourced from Factset. The Benchmark for this fund has changed recently. Please see page 45 for Benchmark history.
-30.71
0.42
14.37
0.83
0.25
0.50
0.76
0.90
1.76
3.89
7.03
-1.50
-0.14
-0.05
-0.01
0.00
0.10
0.16
0.19
0.26
0.31
1.53
FOR INSTITUTIONAL USE ONLY
Portfolio Series Balanced Fund – Series IQuarterly Portfolio Review as at December 31, 2020
29
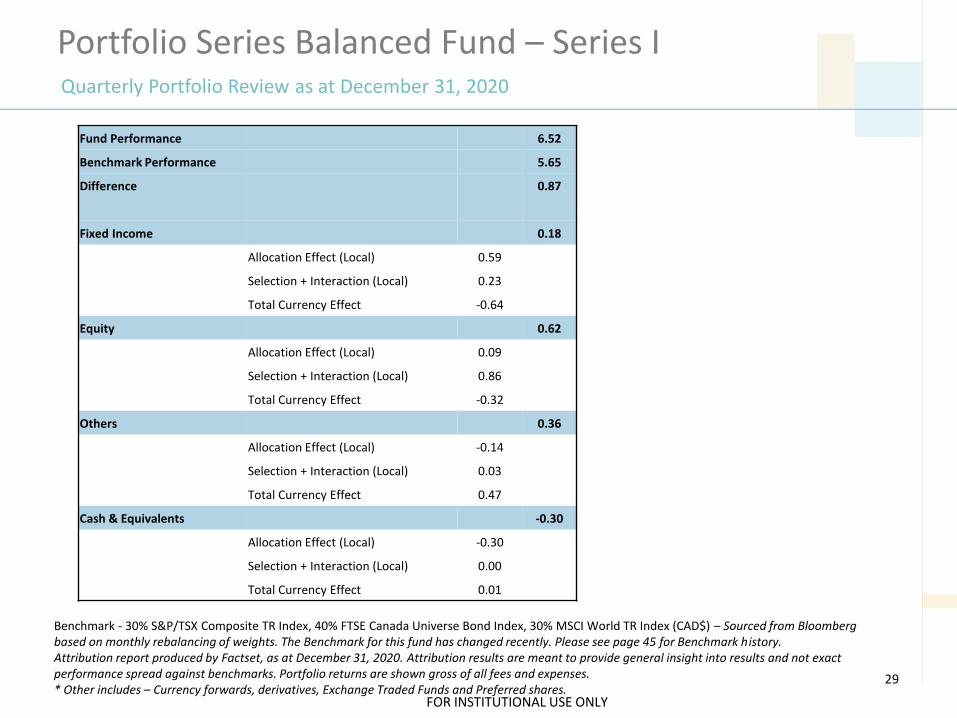
Benchmark - 30% S&P/TSX Composite TR Index, 40% FTSE Canada Universe Bond Index, 30% MSCI World TR Index (CAD$) – Sourced from Bloomberg based on monthly rebalancing of weights. The Benchmark for this fund has changed recently. Please see page 45 for Benchmark history.Attribution report produced by Factset, as at December 31, 2020. Attribution results are meant to provide general insight into results and not exact performance spread against benchmarks. Portfolio returns are shown gross of all fees and expenses.* Other includes – Currency forwards, derivatives, Exchange Traded Funds and Preferred shares.
Fund Performance 6.52
Benchmark Performance 5.65
Difference 0.87
Fixed Income 0.18
Allocation Effect (Local) 0.59
Selection + Interaction (Local) 0.23
Total Currency Effect -0.64
Equity 0.62
Allocation Effect (Local) 0.09
Selection + Interaction (Local) 0.86
Total Currency Effect -0.32
Others 0.36
Allocation Effect (Local) -0.14
Selection + Interaction (Local) 0.03
Total Currency Effect 0.47
Cash & Equivalents -0.30
Allocation Effect (Local) -0.30
Selection + Interaction (Local) 0.00
Total Currency Effect 0.01
FOR INSTITUTIONAL USE ONLY
Calendar Year Returns (Gross of Fees)
3 Year Risk Statistics
Portfolio Series Balanced Growth Fund – Series IQuarterly Portfolio Review as at December 31, 2020
Annualized Returns (Gross of Fees)
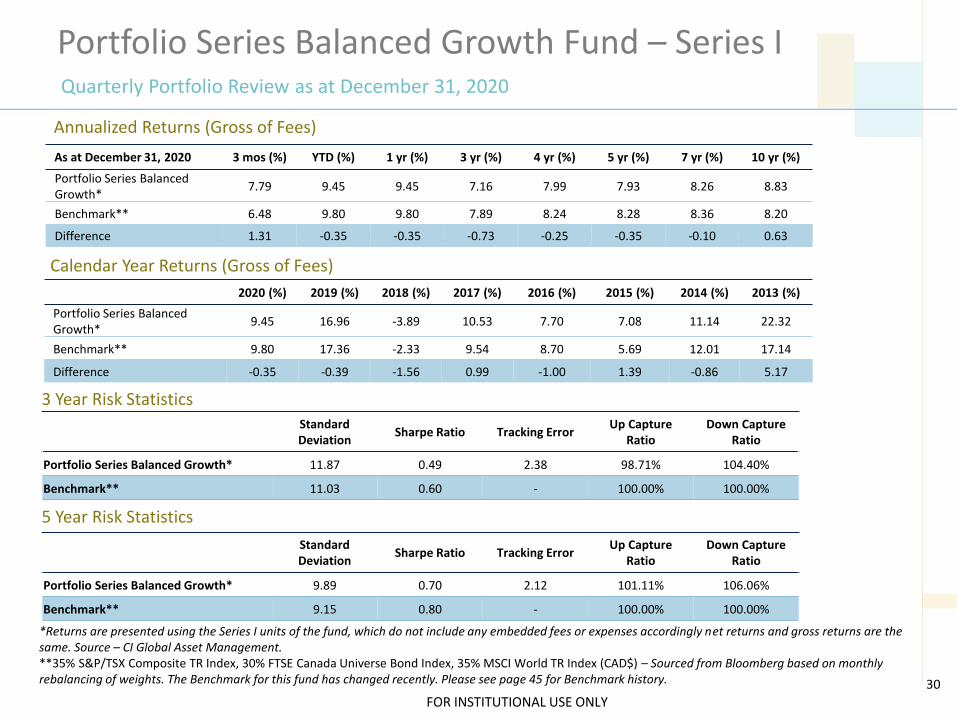
*Returns are presented using the Series I units of the fund, which do not include any embedded fees or expenses accordingly net returns and gross returns are the same. Source – CI Global Asset Management.**35% S&P/TSX Composite TR Index, 30% FTSE Canada Universe Bond Index, 35% MSCI World TR Index (CAD$) – Sourced from Bloomberg based on monthly rebalancing of weights. The Benchmark for this fund has changed recently. Please see page 45 for Benchmark history. 30
Standard Deviation
Sharpe Ratio Tracking ErrorUp Capture
RatioDown Capture
Ratio
Portfolio Series Balanced Growth* 11.87 0.49 2.38 98.71% 104.40%
Benchmark** 11.03 0.60 - 100.00% 100.00%
As at December 31, 2020 3 mos (%) YTD (%) 1 yr (%) 3 yr (%) 4 yr (%) 5 yr (%) 7 yr (%) 10 yr (%)
Portfolio Series Balanced Growth*
7.79 9.45 9.45 7.16 7.99 7.93 8.26 8.83
Benchmark** 6.48 9.80 9.80 7.89 8.24 8.28 8.36 8.20
Difference 1.31 -0.35 -0.35 -0.73 -0.25 -0.35 -0.10 0.63
2020 (%) 2019 (%) 2018 (%) 2017 (%) 2016 (%) 2015 (%) 2014 (%) 2013 (%)
Portfolio Series Balanced Growth*
9.45 16.96 -3.89 10.53 7.70 7.08 11.14 22.32
Benchmark** 9.80 17.36 -2.33 9.54 8.70 5.69 12.01 17.14
Difference -0.35 -0.39 -1.56 0.99 -1.00 1.39 -0.86 5.17
Standard Deviation
Sharpe Ratio Tracking ErrorUp Capture
RatioDown Capture
Ratio
Portfolio Series Balanced Growth* 9.89 0.70 2.12 101.11% 106.06%
Benchmark** 9.15 0.80 - 100.00% 100.00%
5 Year Risk Statistics
FOR INSTITUTIONAL USE ONLY
Asset Class
Portfolio Series Balanced Growth Fund – Series IQuarterly Portfolio Review as at December 31, 2020
Top Holdings
31
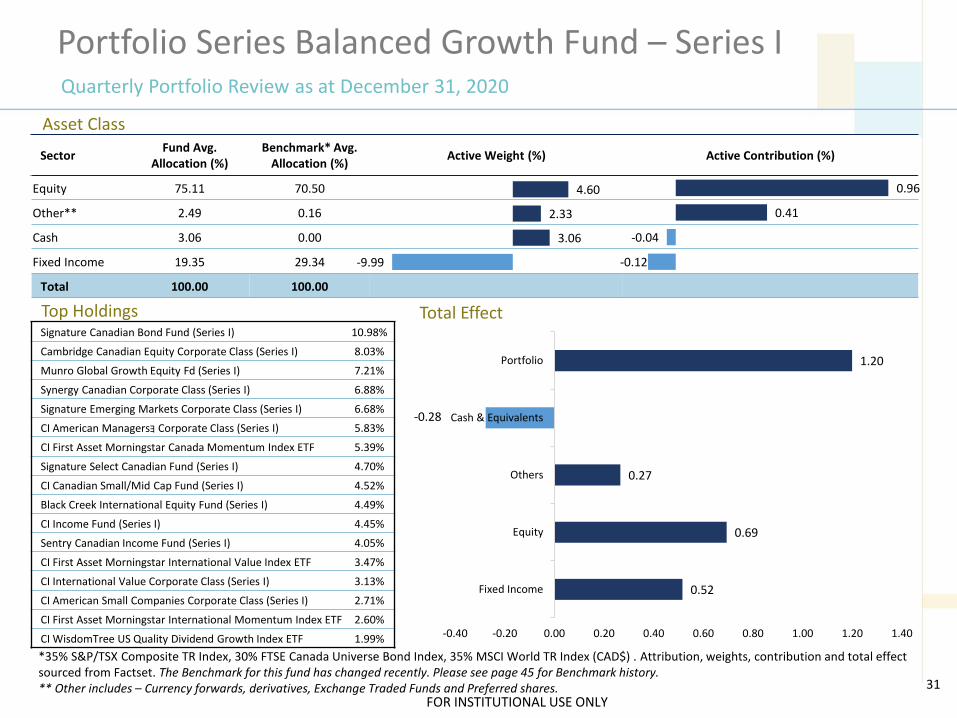
SectorFund Avg.
Allocation (%)Benchmark* Avg.
Allocation (%)Active Weight (%) Active Contribution (%)
Equity 75.11 70.50
Other** 2.49 0.16
Cash 3.06 0.00
Fixed Income 19.35 29.34
Total 100.00 100.00
Total Effect
*35% S&P/TSX Composite TR Index, 30% FTSE Canada Universe Bond Index, 35% MSCI World TR Index (CAD$) . Attribution, weights, contribution and total effect sourced from Factset. The Benchmark for this fund has changed recently. Please see page 45 for Benchmark history.** Other includes – Currency forwards, derivatives, Exchange Traded Funds and Preferred shares.
Signature Canadian Bond Fund (Series I) 10.98%
Cambridge Canadian Equity Corporate Class (Series I) 8.03%
Munro Global Growth Equity Fd (Series I) 7.21%
Synergy Canadian Corporate Class (Series I) 6.88%
Signature Emerging Markets Corporate Class (Series I) 6.68%
CI American Managersョ Corporate Class (Series I) 5.83%
CI First Asset Morningstar Canada Momentum Index ETF 5.39%
Signature Select Canadian Fund (Series I) 4.70%
CI Canadian Small/Mid Cap Fund (Series I) 4.52%
Black Creek International Equity Fund (Series I) 4.49%
CI Income Fund (Series I) 4.45%
Sentry Canadian Income Fund (Series I) 4.05%
CI First Asset Morningstar International Value Index ETF 3.47%
CI International Value Corporate Class (Series I) 3.13%
CI American Small Companies Corporate Class (Series I) 2.71%
CI First Asset Morningstar International Momentum Index ETF 2.60%
CI WisdomTree US Quality Dividend Growth Index ETF 1.99%
-9.99
3.06
2.33
4.60
-0.12
-0.04
0.41
0.96
0.52
0.69
0.27
-0.28
1.20
-0.40 -0.20 0.00 0.20 0.40 0.60 0.80 1.00 1.20 1.40
Fixed Income
Equity
Others
Cash & Equivalents
Portfolio
FOR INSTITUTIONAL USE ONLY
Portfolio Series Balanced Growth Fund – Series IQuarterly Portfolio Review as at December 31, 2020
32
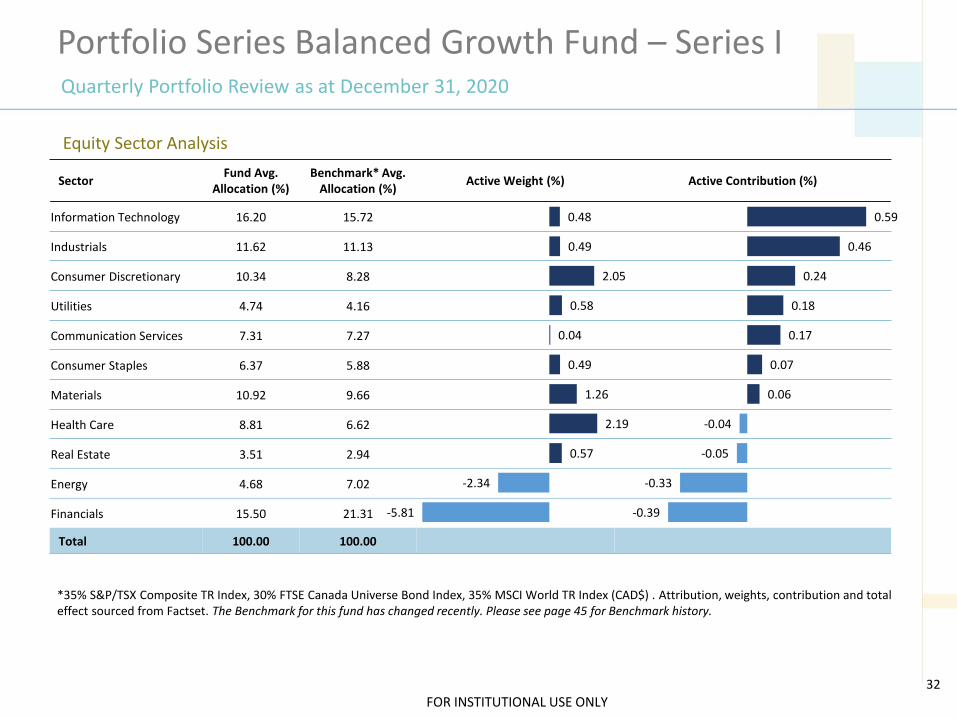
Equity Sector Analysis
SectorFund Avg.
Allocation (%)Benchmark* Avg.
Allocation (%)Active Weight (%) Active Contribution (%)
Information Technology 16.20 15.72
Industrials 11.62 11.13
Consumer Discretionary 10.34 8.28
Utilities 4.74 4.16
Communication Services 7.31 7.27
Consumer Staples 6.37 5.88
Materials 10.92 9.66
Health Care 8.81 6.62
Real Estate 3.51 2.94
Energy 4.68 7.02
Financials 15.50 21.31
Total 100.00 100.00
*35% S&P/TSX Composite TR Index, 30% FTSE Canada Universe Bond Index, 35% MSCI World TR Index (CAD$) . Attribution, weights, contribution and total effect sourced from Factset. The Benchmark for this fund has changed recently. Please see page 45 for Benchmark history.
-5.81
-2.34
0.57
2.19
1.26
0.49
0.04
0.58
2.05
0.49
0.48
-0.39
-0.33
-0.05
-0.04
0.06
0.07
0.17
0.18
0.24
0.46
0.59
FOR INSTITUTIONAL USE ONLY
Portfolio Series Balanced Growth Fund – Series IQuarterly Portfolio Review as at December 31, 2020
33
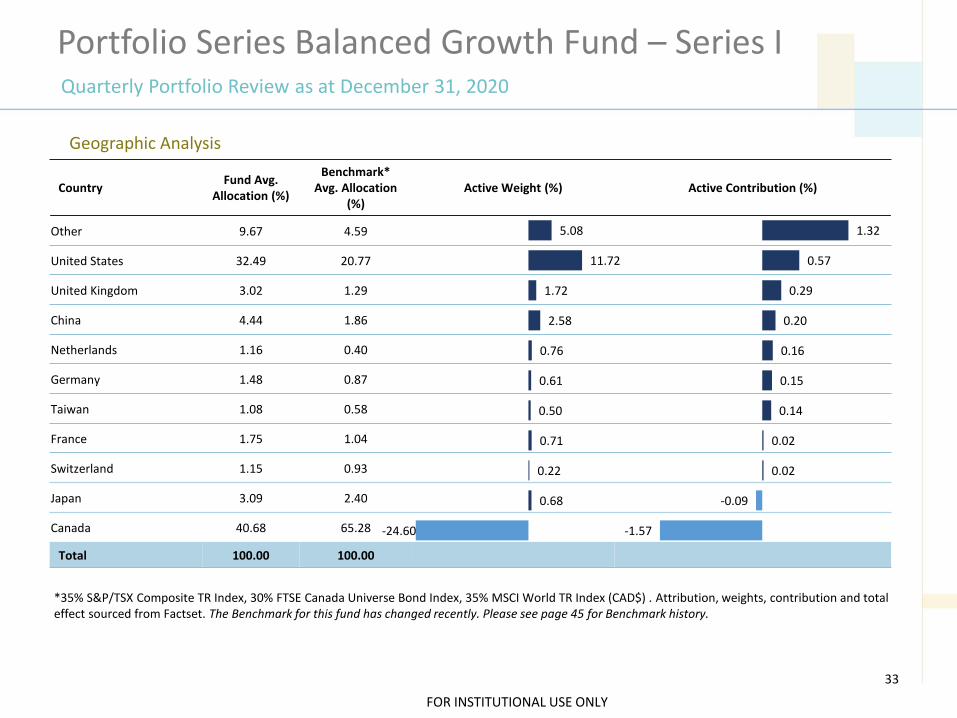
Geographic Analysis
CountryFund Avg.
Allocation (%)
Benchmark* Avg. Allocation
(%)Active Weight (%) Active Contribution (%)
Other 9.67 4.59
United States 32.49 20.77
United Kingdom 3.02 1.29
China 4.44 1.86
Netherlands 1.16 0.40
Germany 1.48 0.87
Taiwan 1.08 0.58
France 1.75 1.04
Switzerland 1.15 0.93
Japan 3.09 2.40
Canada 40.68 65.28
Total 100.00 100.00
*35% S&P/TSX Composite TR Index, 30% FTSE Canada Universe Bond Index, 35% MSCI World TR Index (CAD$) . Attribution, weights, contribution and total effect sourced from Factset. The Benchmark for this fund has changed recently. Please see page 45 for Benchmark history.
-24.60
0.68
0.22
0.71
0.50
0.61
0.76
2.58
1.72
11.72
5.08
-1.57
-0.09
0.02
0.02
0.14
0.15
0.16
0.20
0.29
0.57
1.32
FOR INSTITUTIONAL USE ONLY
Portfolio Series Balanced Growth Fund – Series IQuarterly Portfolio Review as at December 31, 2020
34
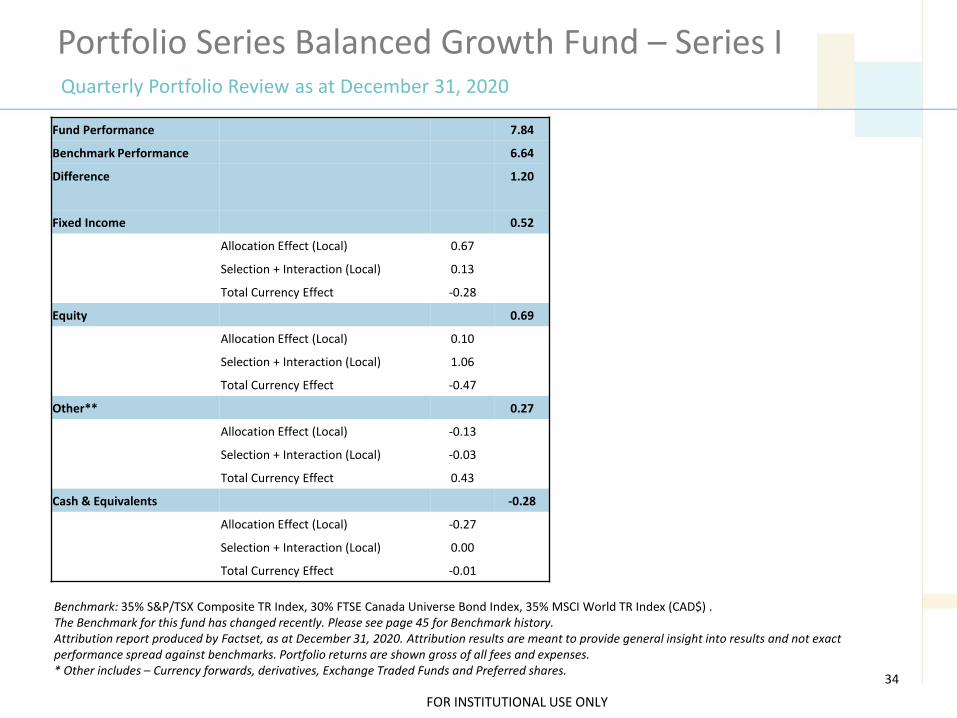
Benchmark: 35% S&P/TSX Composite TR Index, 30% FTSE Canada Universe Bond Index, 35% MSCI World TR Index (CAD$) .The Benchmark for this fund has changed recently. Please see page 45 for Benchmark history.Attribution report produced by Factset, as at December 31, 2020. Attribution results are meant to provide general insight into results and not exact performance spread against benchmarks. Portfolio returns are shown gross of all fees and expenses.* Other includes – Currency forwards, derivatives, Exchange Traded Funds and Preferred shares.
Fund Performance 7.84
Benchmark Performance 6.64
Difference 1.20
Fixed Income 0.52
Allocation Effect (Local) 0.67
Selection + Interaction (Local) 0.13
Total Currency Effect -0.28
Equity 0.69
Allocation Effect (Local) 0.10
Selection + Interaction (Local) 1.06
Total Currency Effect -0.47
Other** 0.27
Allocation Effect (Local) -0.13
Selection + Interaction (Local) -0.03
Total Currency Effect 0.43
Cash & Equivalents -0.28
Allocation Effect (Local) -0.27
Selection + Interaction (Local) 0.00
Total Currency Effect -0.01
FOR INSTITUTIONAL USE ONLY
Calendar Year Returns (Gross of Fees)
3 Year Risk Statistics
Portfolio Series Growth Fund – Series IQuarterly Portfolio Review as at December 31, 2020
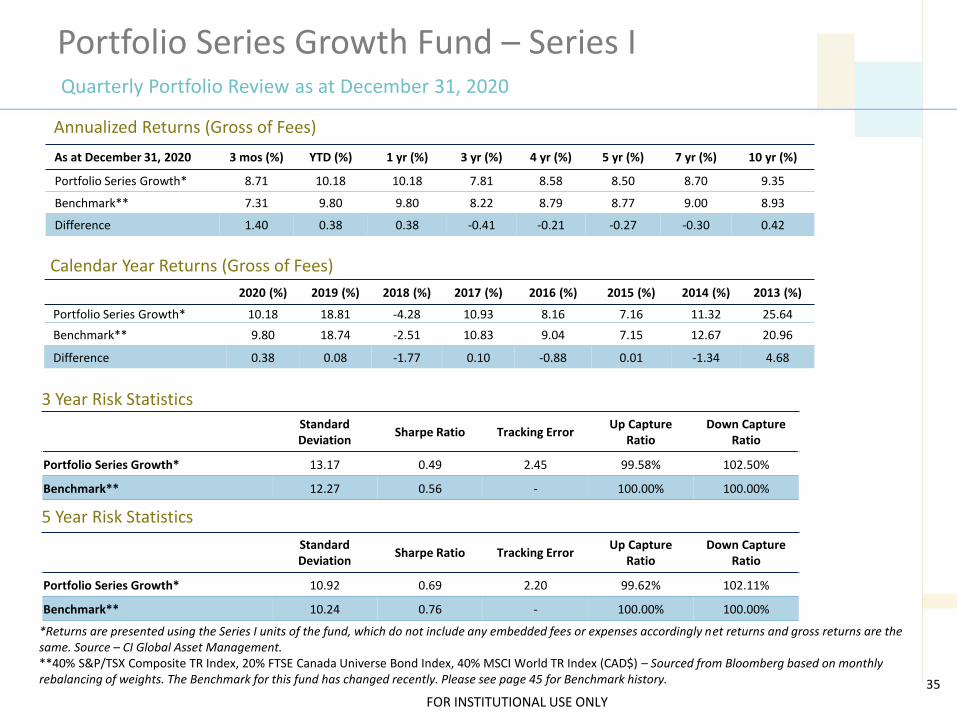
Annualized Returns (Gross of Fees)
*Returns are presented using the Series I units of the fund, which do not include any embedded fees or expenses accordingly net returns and gross returns are the same. Source – CI Global Asset Management.**40% S&P/TSX Composite TR Index, 20% FTSE Canada Universe Bond Index, 40% MSCI World TR Index (CAD$) – Sourced from Bloomberg based on monthly rebalancing of weights. The Benchmark for this fund has changed recently. Please see page 45 for Benchmark history. 35
Standard Deviation
Sharpe Ratio Tracking ErrorUp Capture
RatioDown Capture
Ratio
Portfolio Series Growth* 13.17 0.49 2.45 99.58% 102.50%
Benchmark** 12.27 0.56 - 100.00% 100.00%
As at December 31, 2020 3 mos (%) YTD (%) 1 yr (%) 3 yr (%) 4 yr (%) 5 yr (%) 7 yr (%) 10 yr (%)
Portfolio Series Growth* 8.71 10.18 10.18 7.81 8.58 8.50 8.70 9.35
Benchmark** 7.31 9.80 9.80 8.22 8.79 8.77 9.00 8.93
Difference 1.40 0.38 0.38 -0.41 -0.21 -0.27 -0.30 0.42
2020 (%) 2019 (%) 2018 (%) 2017 (%) 2016 (%) 2015 (%) 2014 (%) 2013 (%)
Portfolio Series Growth* 10.18 18.81 -4.28 10.93 8.16 7.16 11.32 25.64
Benchmark** 9.80 18.74 -2.51 10.83 9.04 7.15 12.67 20.96
Difference 0.38 0.08 -1.77 0.10 -0.88 0.01 -1.34 4.68
Standard Deviation
Sharpe Ratio Tracking ErrorUp Capture
RatioDown Capture
Ratio
Portfolio Series Growth* 10.92 0.69 2.20 99.62% 102.11%
Benchmark** 10.24 0.76 - 100.00% 100.00%
5 Year Risk Statistics
FOR INSTITUTIONAL USE ONLY
Portfolio Series Growth Fund – Series IQuarterly Portfolio Review as at December 31, 2020
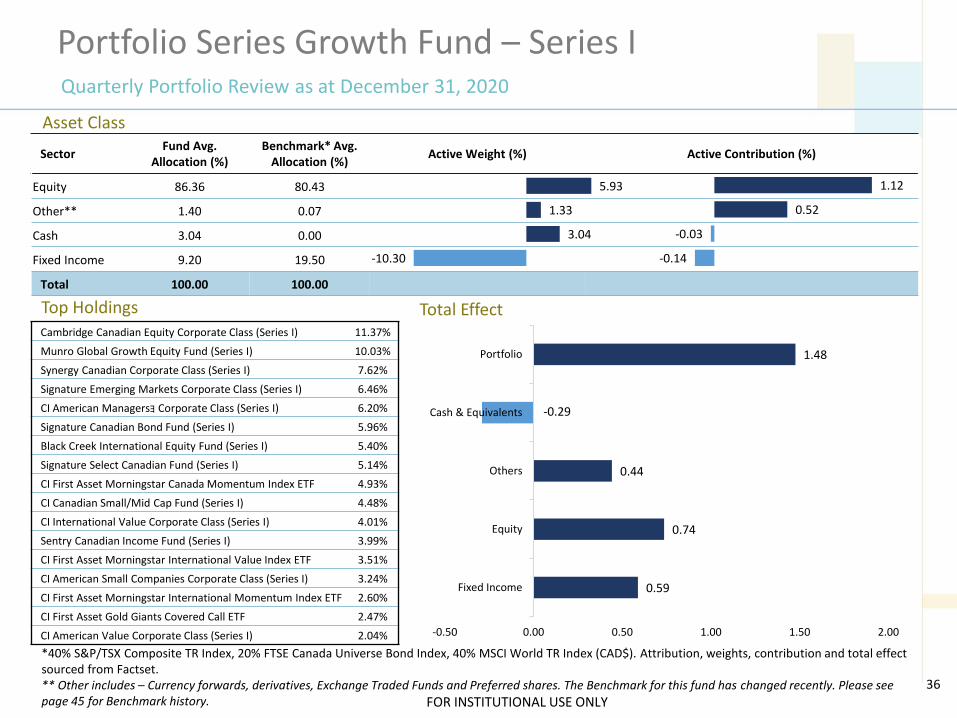
Top Holdings
36
Cambridge Canadian Equity Corporate Class (Series I) 11.37%
Munro Global Growth Equity Fund (Series I) 10.03%
Synergy Canadian Corporate Class (Series I) 7.62%
Signature Emerging Markets Corporate Class (Series I) 6.46%
CI American Managersョ Corporate Class (Series I) 6.20%
Signature Canadian Bond Fund (Series I) 5.96%
Black Creek International Equity Fund (Series I) 5.40%
Signature Select Canadian Fund (Series I) 5.14%
CI First Asset Morningstar Canada Momentum Index ETF 4.93%
CI Canadian Small/Mid Cap Fund (Series I) 4.48%
CI International Value Corporate Class (Series I) 4.01%
Sentry Canadian Income Fund (Series I) 3.99%
CI First Asset Morningstar International Value Index ETF 3.51%
CI American Small Companies Corporate Class (Series I) 3.24%
CI First Asset Morningstar International Momentum Index ETF 2.60%
CI First Asset Gold Giants Covered Call ETF 2.47%
CI American Value Corporate Class (Series I) 2.04%
Asset Class
SectorFund Avg.
Allocation (%)Benchmark* Avg.
Allocation (%)Active Weight (%) Active Contribution (%)
Equity 86.36 80.43
Other** 1.40 0.07
Cash 3.04 0.00
Fixed Income 9.20 19.50
Total 100.00 100.00
Total Effect
*40% S&P/TSX Composite TR Index, 20% FTSE Canada Universe Bond Index, 40% MSCI World TR Index (CAD$). Attribution, weights, contribution and total effect sourced from Factset.** Other includes – Currency forwards, derivatives, Exchange Traded Funds and Preferred shares. The Benchmark for this fund has changed recently. Please see page 45 for Benchmark history.
-10.30
3.04
1.33
5.93
-0.14
-0.03
0.52
1.12
0.59
0.74
0.44
-0.29
1.48
-0.50 0.00 0.50 1.00 1.50 2.00
Fixed Income
Equity
Others
Cash & Equivalents
Portfolio
FOR INSTITUTIONAL USE ONLY
Portfolio Series Growth Fund – Series IQuarterly Portfolio Review as at December 31, 2020
37
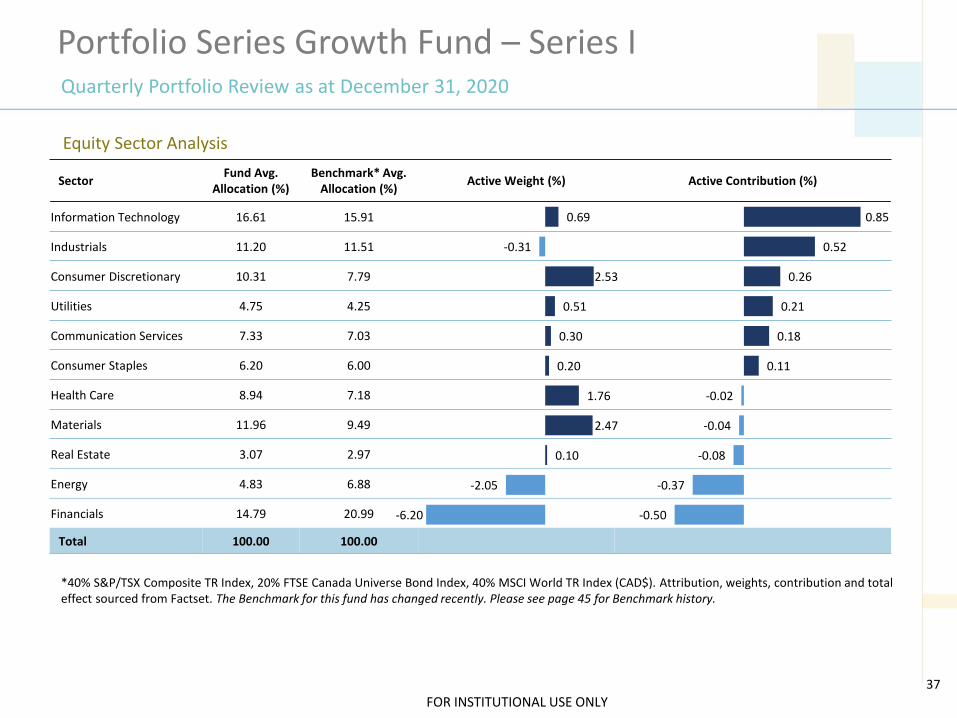
Equity Sector Analysis
SectorFund Avg.
Allocation (%)Benchmark* Avg.
Allocation (%)Active Weight (%) Active Contribution (%)
Information Technology 16.61 15.91
Industrials 11.20 11.51
Consumer Discretionary 10.31 7.79
Utilities 4.75 4.25
Communication Services 7.33 7.03
Consumer Staples 6.20 6.00
Health Care 8.94 7.18
Materials 11.96 9.49
Real Estate 3.07 2.97
Energy 4.83 6.88
Financials 14.79 20.99
Total 100.00 100.00
*40% S&P/TSX Composite TR Index, 20% FTSE Canada Universe Bond Index, 40% MSCI World TR Index (CAD$). Attribution, weights, contribution and total effect sourced from Factset. The Benchmark for this fund has changed recently. Please see page 45 for Benchmark history.
-6.20
-2.05
0.10
2.47
1.76
0.20
0.30
0.51
2.53
-0.31
0.69
-0.50
-0.37
-0.08
-0.04
-0.02
0.11
0.18
0.21
0.26
0.52
0.85
FOR INSTITUTIONAL USE ONLY
Portfolio Series Growth Fund – Series IQuarterly Portfolio Review as at December 31, 2020
38
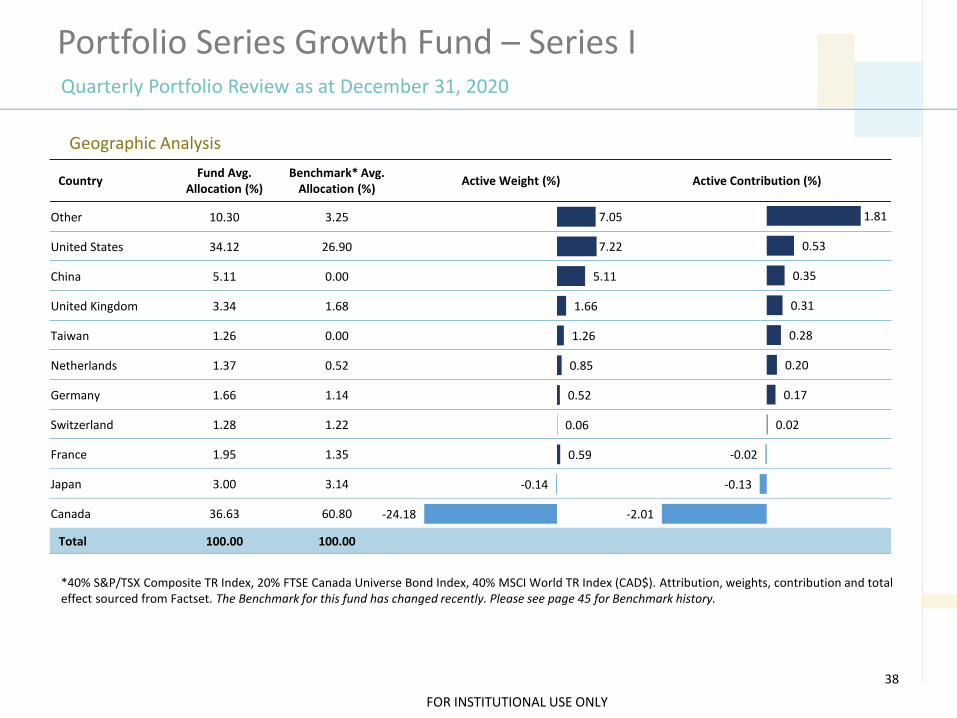
Geographic Analysis
CountryFund Avg.
Allocation (%)Benchmark* Avg.
Allocation (%)Active Weight (%) Active Contribution (%)
Other 10.30 3.25
United States 34.12 26.90
China 5.11 0.00
United Kingdom 3.34 1.68
Taiwan 1.26 0.00
Netherlands 1.37 0.52
Germany 1.66 1.14
Switzerland 1.28 1.22
France 1.95 1.35
Japan 3.00 3.14
Canada 36.63 60.80
Total 100.00 100.00
*40% S&P/TSX Composite TR Index, 20% FTSE Canada Universe Bond Index, 40% MSCI World TR Index (CAD$). Attribution, weights, contribution and total effect sourced from Factset. The Benchmark for this fund has changed recently. Please see page 45 for Benchmark history.
-24.18
-0.14
0.59
0.06
0.52
0.85
1.26
1.66
5.11
7.22
7.05
-2.01
-0.13
-0.02
0.02
0.17
0.20
0.28
0.31
0.35
0.53
1.81
FOR INSTITUTIONAL USE ONLY
Portfolio Series Growth Fund – Series IQuarterly Portfolio Review as at December 31, 2020
39
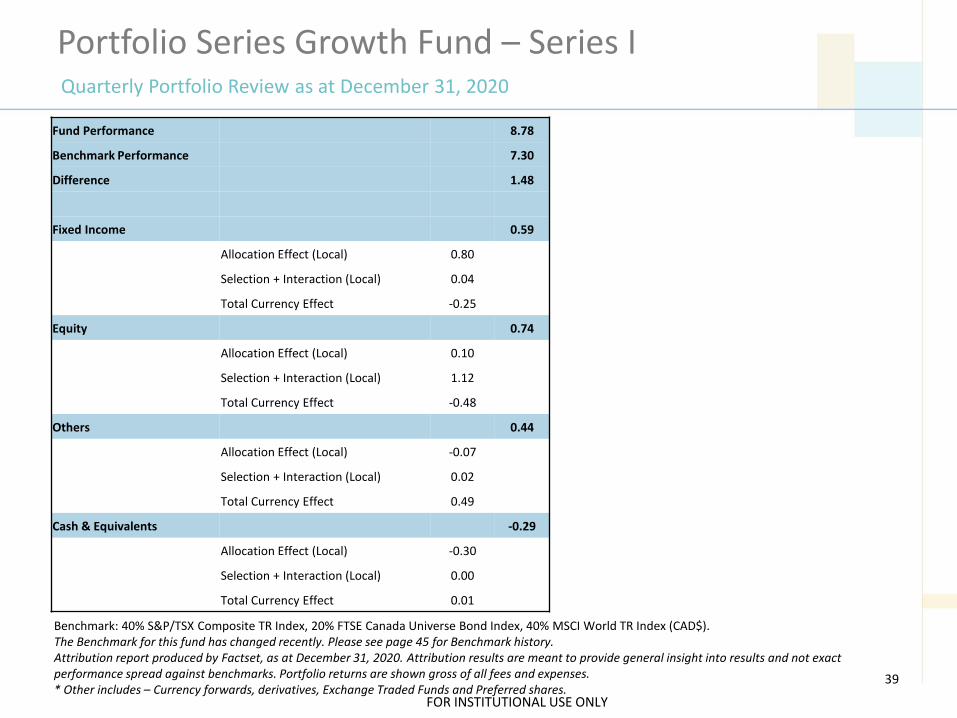
Benchmark: 40% S&P/TSX Composite TR Index, 20% FTSE Canada Universe Bond Index, 40% MSCI World TR Index (CAD$).The Benchmark for this fund has changed recently. Please see page 45 for Benchmark history.Attribution report produced by Factset, as at December 31, 2020. Attribution results are meant to provide general insight into results and not exact performance spread against benchmarks. Portfolio returns are shown gross of all fees and expenses.* Other includes – Currency forwards, derivatives, Exchange Traded Funds and Preferred shares.
Fund Performance 8.78
Benchmark Performance 7.30
Difference 1.48
Fixed Income 0.59
Allocation Effect (Local) 0.80
Selection + Interaction (Local) 0.04
Total Currency Effect -0.25
Equity 0.74
Allocation Effect (Local) 0.10
Selection + Interaction (Local) 1.12
Total Currency Effect -0.48
Others 0.44
Allocation Effect (Local) -0.07
Selection + Interaction (Local) 0.02
Total Currency Effect 0.49
Cash & Equivalents -0.29
Allocation Effect (Local) -0.30
Selection + Interaction (Local) 0.00
Total Currency Effect 0.01
FOR INSTITUTIONAL USE ONLY
Calendar Year Returns (Gross of Fees)
3 Year Risk Statistics
Portfolio Series Maximum Growth Fund – Series IQuarterly Portfolio Review as at December 31, 2020
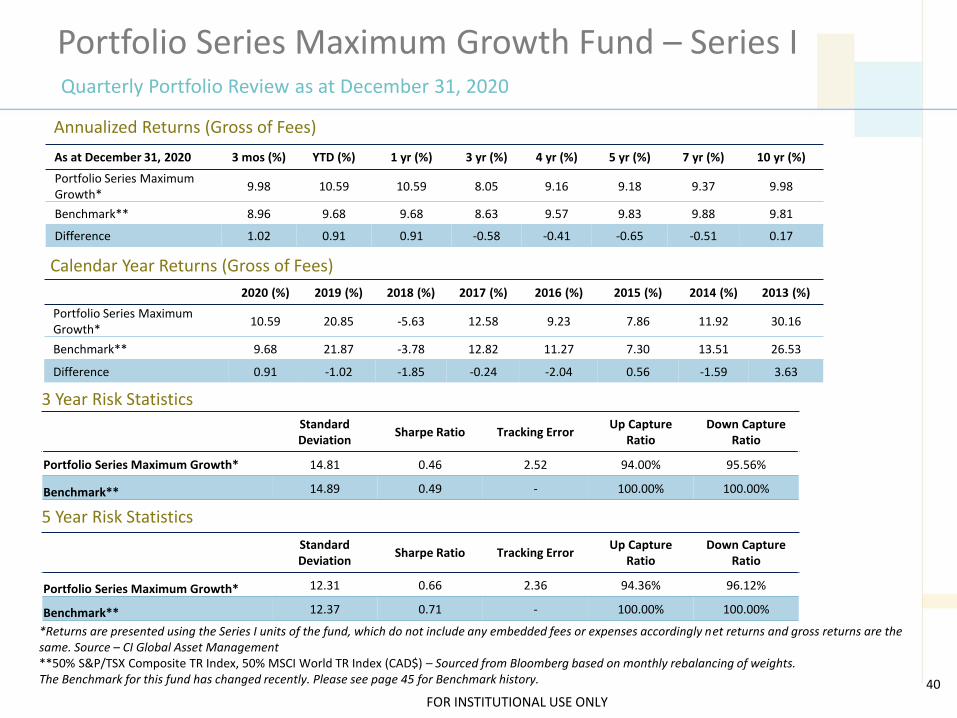
Annualized Returns (Gross of Fees)
*Returns are presented using the Series I units of the fund, which do not include any embedded fees or expenses accordingly net returns and gross returns are the same. Source – CI Global Asset Management**50% S&P/TSX Composite TR Index, 50% MSCI World TR Index (CAD$) – Sourced from Bloomberg based on monthly rebalancing of weights.The Benchmark for this fund has changed recently. Please see page 45 for Benchmark history. 40
Standard Deviation
Sharpe Ratio Tracking ErrorUp Capture
RatioDown Capture
Ratio
Portfolio Series Maximum Growth* 14.81 0.46 2.52 94.00% 95.56%
Benchmark** 14.89 0.49 - 100.00% 100.00%
As at December 31, 2020 3 mos (%) YTD (%) 1 yr (%) 3 yr (%) 4 yr (%) 5 yr (%) 7 yr (%) 10 yr (%)
Portfolio Series Maximum Growth*
9.98 10.59 10.59 8.05 9.16 9.18 9.37 9.98
Benchmark** 8.96 9.68 9.68 8.63 9.57 9.83 9.88 9.81
Difference 1.02 0.91 0.91 -0.58 -0.41 -0.65 -0.51 0.17
2020 (%) 2019 (%) 2018 (%) 2017 (%) 2016 (%) 2015 (%) 2014 (%) 2013 (%)
Portfolio Series Maximum Growth*
10.59 20.85 -5.63 12.58 9.23 7.86 11.92 30.16
Benchmark** 9.68 21.87 -3.78 12.82 11.27 7.30 13.51 26.53
Difference 0.91 -1.02 -1.85 -0.24 -2.04 0.56 -1.59 3.63
Standard Deviation
Sharpe Ratio Tracking ErrorUp Capture
RatioDown Capture
Ratio
Portfolio Series Maximum Growth* 12.31 0.66 2.36 94.36% 96.12%
Benchmark** 12.37 0.71 - 100.00% 100.00%
5 Year Risk Statistics
FOR INSTITUTIONAL USE ONLY
Portfolio Series Maximum Growth Fund – Series IQuarterly Portfolio Review as at December 31, 2020
Top Holdings
41
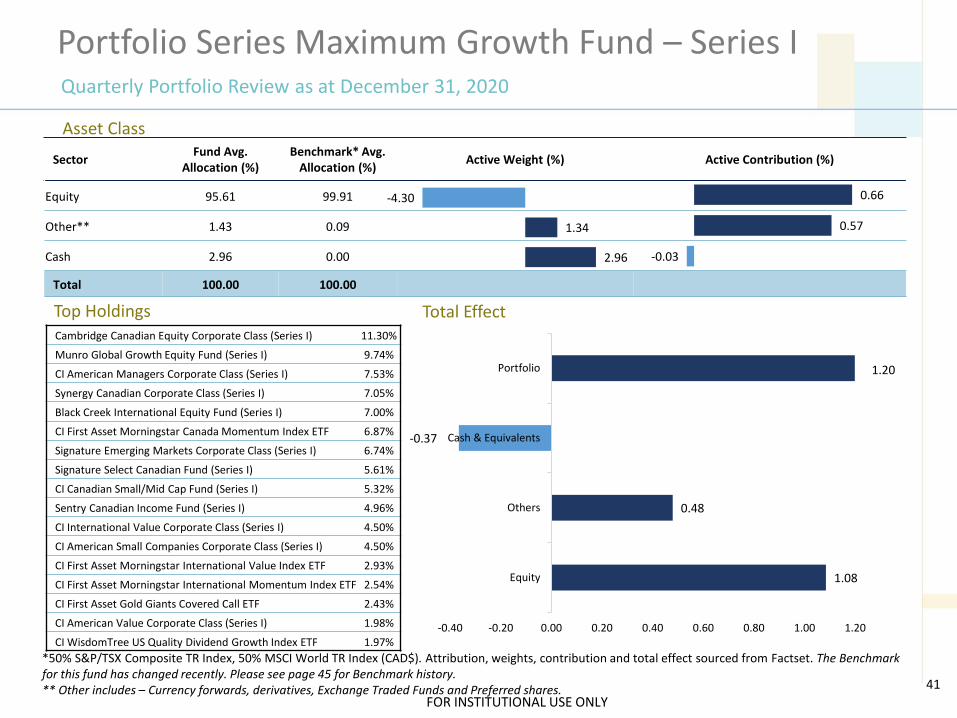
Cambridge Canadian Equity Corporate Class (Series I) 11.30%
Munro Global Growth Equity Fund (Series I) 9.74%
CI American Managers Corporate Class (Series I) 7.53%
Synergy Canadian Corporate Class (Series I) 7.05%
Black Creek International Equity Fund (Series I) 7.00%
CI First Asset Morningstar Canada Momentum Index ETF 6.87%
Signature Emerging Markets Corporate Class (Series I) 6.74%
Signature Select Canadian Fund (Series I) 5.61%
CI Canadian Small/Mid Cap Fund (Series I) 5.32%
Sentry Canadian Income Fund (Series I) 4.96%
CI International Value Corporate Class (Series I) 4.50%
CI American Small Companies Corporate Class (Series I) 4.50%
CI First Asset Morningstar International Value Index ETF 2.93%
CI First Asset Morningstar International Momentum Index ETF 2.54%
CI First Asset Gold Giants Covered Call ETF 2.43%
CI American Value Corporate Class (Series I) 1.98%
CI WisdomTree US Quality Dividend Growth Index ETF 1.97%
Asset Class
SectorFund Avg.
Allocation (%)Benchmark* Avg.
Allocation (%)Active Weight (%) Active Contribution (%)
Equity 95.61 99.91
Other** 1.43 0.09
Cash 2.96 0.00
Total 100.00 100.00
Total Effect
*50% S&P/TSX Composite TR Index, 50% MSCI World TR Index (CAD$). Attribution, weights, contribution and total effect sourced from Factset. The Benchmark for this fund has changed recently. Please see page 45 for Benchmark history.** Other includes – Currency forwards, derivatives, Exchange Traded Funds and Preferred shares.
2.96
1.34
-4.30
-0.03
0.57
0.66
1.08
0.48
-0.37
1.20
-0.40 -0.20 0.00 0.20 0.40 0.60 0.80 1.00 1.20
Equity
Others
Cash & Equivalents
Portfolio
FOR INSTITUTIONAL USE ONLY
Portfolio Series Maximum Growth Fund – Series IQuarterly Portfolio Review as at December 31, 2020
42
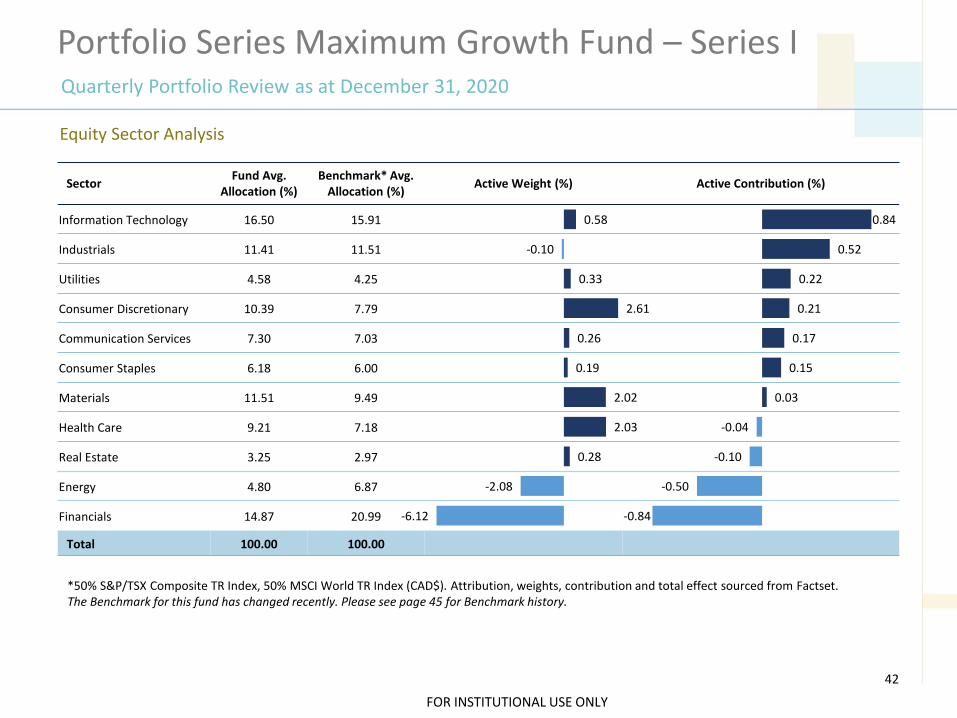
Equity Sector Analysis
SectorFund Avg.
Allocation (%)Benchmark* Avg.
Allocation (%)Active Weight (%) Active Contribution (%)
Information Technology 16.50 15.91
Industrials 11.41 11.51
Utilities 4.58 4.25
Consumer Discretionary 10.39 7.79
Communication Services 7.30 7.03
Consumer Staples 6.18 6.00
Materials 11.51 9.49
Health Care 9.21 7.18
Real Estate 3.25 2.97
Energy 4.80 6.87
Financials 14.87 20.99
Total 100.00 100.00
*50% S&P/TSX Composite TR Index, 50% MSCI World TR Index (CAD$). Attribution, weights, contribution and total effect sourced from Factset.The Benchmark for this fund has changed recently. Please see page 45 for Benchmark history.
-6.12
-2.08
0.28
2.03
2.02
0.19
0.26
2.61
0.33
-0.10
0.58
-0.84
-0.50
-0.10
-0.04
0.03
0.15
0.17
0.21
0.22
0.52
0.84
FOR INSTITUTIONAL USE ONLY
Portfolio Series Maximum Growth Fund – Series IQuarterly Portfolio Review as at December 31, 2020
43
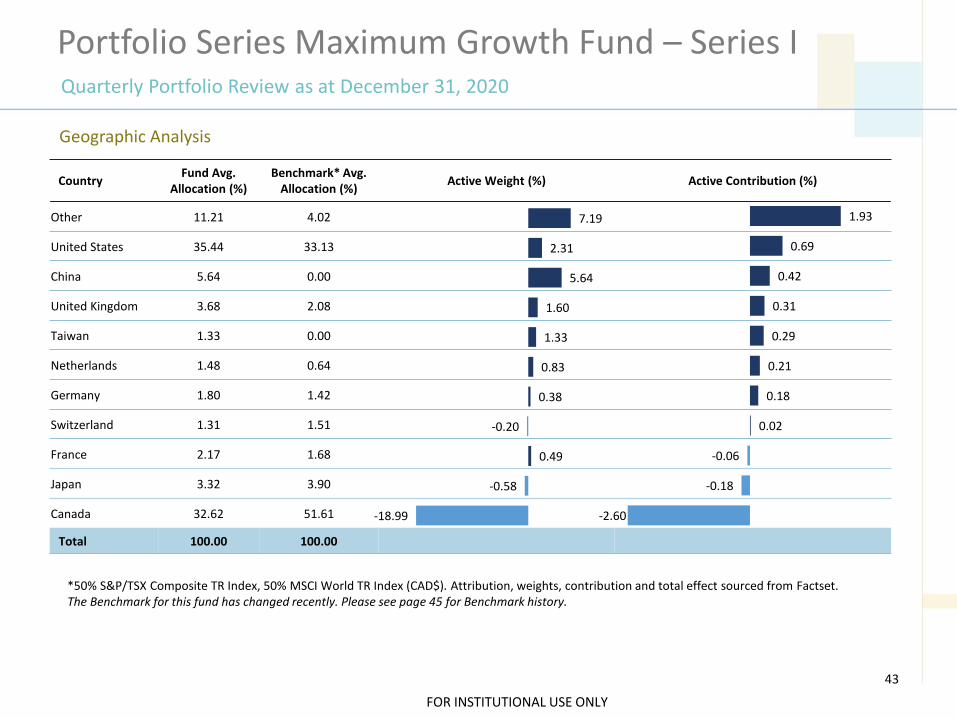
Geographic Analysis
CountryFund Avg.
Allocation (%)Benchmark* Avg.
Allocation (%)Active Weight (%) Active Contribution (%)
Other 11.21 4.02
United States 35.44 33.13
China 5.64 0.00
United Kingdom 3.68 2.08
Taiwan 1.33 0.00
Netherlands 1.48 0.64
Germany 1.80 1.42
Switzerland 1.31 1.51
France 2.17 1.68
Japan 3.32 3.90
Canada 32.62 51.61
Total 100.00 100.00
*50% S&P/TSX Composite TR Index, 50% MSCI World TR Index (CAD$). Attribution, weights, contribution and total effect sourced from Factset.The Benchmark for this fund has changed recently. Please see page 45 for Benchmark history.
-18.99
-0.58
0.49
-0.20
0.38
0.83
1.33
1.60
5.64
2.31
7.19
-2.60
-0.18
-0.06
0.02
0.18
0.21
0.29
0.31
0.42
0.69
1.93
FOR INSTITUTIONAL USE ONLY
Portfolio Series Maximum Growth Fund – Series IQuarterly Portfolio Review as at December 31, 2020
44
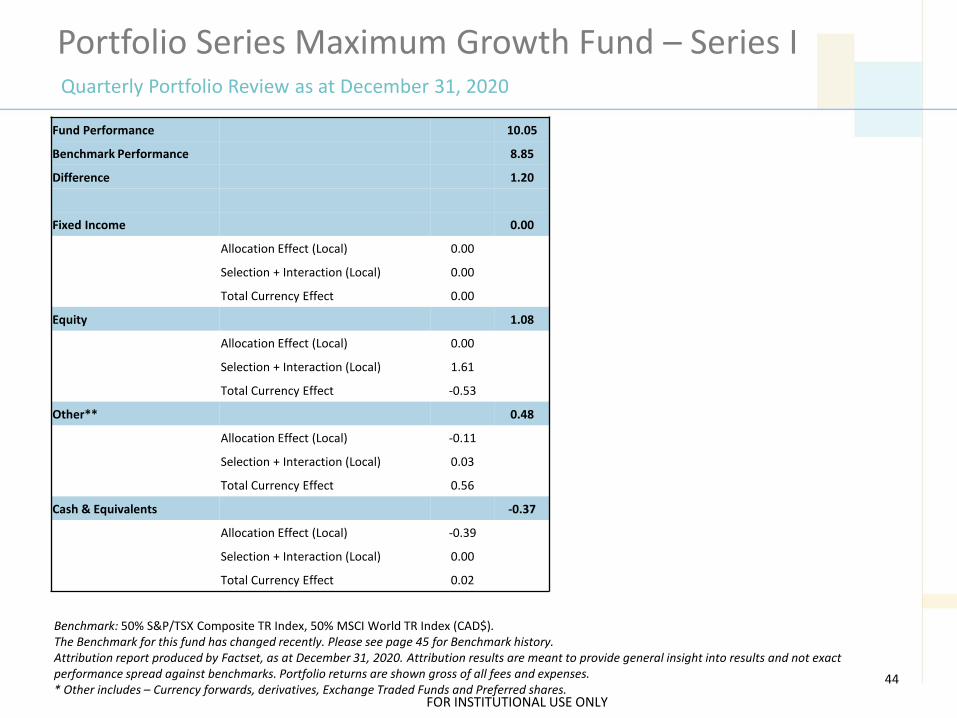
Benchmark: 50% S&P/TSX Composite TR Index, 50% MSCI World TR Index (CAD$).The Benchmark for this fund has changed recently. Please see page 45 for Benchmark history.Attribution report produced by Factset, as at December 31, 2020. Attribution results are meant to provide general insight into results and not exact performance spread against benchmarks. Portfolio returns are shown gross of all fees and expenses.* Other includes – Currency forwards, derivatives, Exchange Traded Funds and Preferred shares.
Fund Performance 10.05
Benchmark Performance 8.85
Difference 1.20
Fixed Income 0.00
Allocation Effect (Local) 0.00
Selection + Interaction (Local) 0.00
Total Currency Effect 0.00
Equity 1.08
Allocation Effect (Local) 0.00
Selection + Interaction (Local) 1.61
Total Currency Effect -0.53
Other** 0.48
Allocation Effect (Local) -0.11
Selection + Interaction (Local) 0.03
Total Currency Effect 0.56
Cash & Equivalents -0.37
Allocation Effect (Local) -0.39
Selection + Interaction (Local) 0.00
Total Currency Effect 0.02
FOR INSTITUTIONAL USE ONLY
Portfolio Series Benchmarks
45
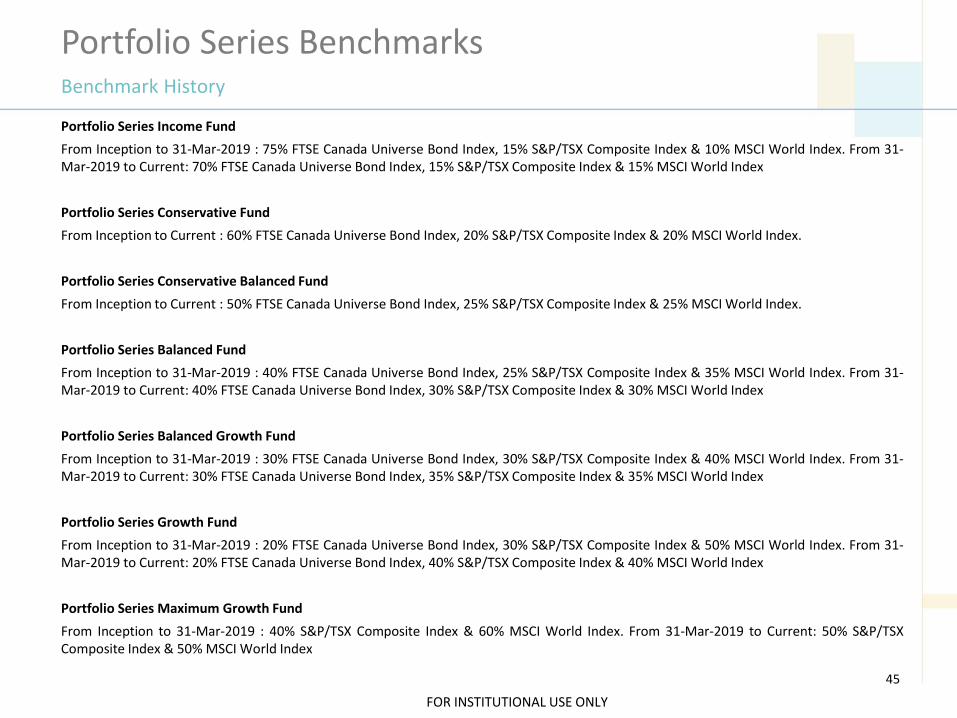
Benchmark History
Portfolio Series Income Fund
From Inception to 31-Mar-2019 : 75% FTSE Canada Universe Bond Index, 15% S&P/TSX Composite Index & 10% MSCI World Index. From 31-Mar-2019 to Current: 70% FTSE Canada Universe Bond Index, 15% S&P/TSX Composite Index & 15% MSCI World Index
Portfolio Series Conservative Fund
From Inception to Current : 60% FTSE Canada Universe Bond Index, 20% S&P/TSX Composite Index & 20% MSCI World Index.
Portfolio Series Conservative Balanced Fund
From Inception to Current : 50% FTSE Canada Universe Bond Index, 25% S&P/TSX Composite Index & 25% MSCI World Index.
Portfolio Series Balanced Fund
From Inception to 31-Mar-2019 : 40% FTSE Canada Universe Bond Index, 25% S&P/TSX Composite Index & 35% MSCI World Index. From 31-Mar-2019 to Current: 40% FTSE Canada Universe Bond Index, 30% S&P/TSX Composite Index & 30% MSCI World Index
Portfolio Series Balanced Growth Fund
From Inception to 31-Mar-2019 : 30% FTSE Canada Universe Bond Index, 30% S&P/TSX Composite Index & 40% MSCI World Index. From 31-Mar-2019 to Current: 30% FTSE Canada Universe Bond Index, 35% S&P/TSX Composite Index & 35% MSCI World Index
Portfolio Series Growth Fund
From Inception to 31-Mar-2019 : 20% FTSE Canada Universe Bond Index, 30% S&P/TSX Composite Index & 50% MSCI World Index. From 31-Mar-2019 to Current: 20% FTSE Canada Universe Bond Index, 40% S&P/TSX Composite Index & 40% MSCI World Index
Portfolio Series Maximum Growth Fund
From Inception to 31-Mar-2019 : 40% S&P/TSX Composite Index & 60% MSCI World Index. From 31-Mar-2019 to Current: 50% S&P/TSXComposite Index & 50% MSCI World Index
FOR INSTITUTIONAL USE ONLY
Portfolio Series
Portfolio Management Teams
CI Global Asset Management
46
Sub-advisors
Quarterly Portfolio Review as at December 31, 2020
FOR INSTITUTIONAL USE ONLY
Portfolio Series
IMPORTANT DISCLAIMERS
Commissions, trailing commissions, management fees and expenses all may be associated with mutual fund investments. Please read the
prospectus before investing. The indicated rates of return are the historical annual compounded total returns gross of fees and expenses payable
by the fund (except for figures of one year or less, which are simple total returns) including changes in security value and reinvestment of all
dividends/distributions and do not take into account sales, redemption, distribution or optional charges or income taxes payable by any
securityholder that would have reduced returns. Mutual funds are not guaranteed, their values change frequently and past performance may not
be repeated.
This presentation is intended only as a general overview and is for information purposes only. It has been prepared solely for the use of the
person(s) to whom it has been delivered and may not be reproduced or used for any other purpose. It is intended only for institutional investment
consultants or institutional investors. It is not meant for the general public.
The contents of this piece are not to be used or construed as investment advice or as an endorsement or recommendation of any entity or
security discussed. Certain statements contained in this communication are based in whole or in part on information provided by third parties and
CI Global Asset Management has taken reasonable steps to ensure their accuracy.
Rates of return are time-weighted and are presented gross of commissions and transaction costs, assuming the reinvestment of dividends and
other earnings. Additional information regarding the Firm’s policies and procedures for calculating and reporting performance returns are available
upon request.
The comparison presented is intended to illustrate the mutual fund’s historical performance as compared with the historical performance of widely
quoted market indices or a weighted blend of widely quoted market indices or another investment fund. There are various important differences
that may exist between the mutual fund and the stated indices or investment fund, that may affect the performance of each. The objectives and
strategies of the mutual fund result in holdings that do not necessarily reflect the constituents of and their weights within the comparable indices or
investment fund. Indices are unmanaged and their returns do not include any sales charges or fees. It is not possible to invest directly in market
indices.
47
Quarterly Portfolio Review as at December 31, 2020
FOR INSTITUTIONAL USE ONLY
Portfolio Series
IMPORTANT DISCLAIMERS
Certain statements in this document are forward-looking. Forward-looking statements (“FLS”) are statements that are predictive in nature, depend
upon or refer to future events or conditions, or that include words such as “may,” “will,” “should,” “could,” “expect,” “anticipate,” “intend,” “plan,”
“believe,” or “estimate,” or other similar expressions. Statements that look forward in time or include anything other than historical information are
subject to risks and uncertainties, and actual results, actions or events could differ materially from those set forth in the FLS. FLS are not
guarantees of future performance and are by their nature based on numerous assumptions. Although the FLS contained herein are based upon
what CI Global Asset Management. and the portfolio manager believe to be reasonable assumptions, neither CI Global Asset Management. nor
the portfolio manager can assure that actual results will be consistent with these FLS. The reader is cautioned to consider the FLS carefully and
not to place undue reliance on FLS. Unless required by applicable law, it is not undertaken, and specifically disclaimed that there is any intention
or obligation to update or revise FLS, whether as a result of new information, future events or otherwise.
Certain statements contained in this communication are based in whole or in part on information provided by third parties and CI Global Asset
Management has taken reasonable steps to ensure their accuracy. Market conditions may change which may impact the information contained in
this document.
CI Institutional Asset Management is a division of CI Global Asset Management. CI Institutional Asset Management mandates is available to
institutional investors such as financial institutions, pension plans, group retirement plans, endowments, foundations and certain individual
investors who meet specified investment criteria. The performance of the mandates is not guaranteed, the values change frequently and past
performance may not be repeated. Past performance is not a reliable indicator of future performance. You should not rely on past performance to
make investment decisions.
48
Quarterly Portfolio Review as at December 31, 2020
FOR INSTITUTIONAL USE ONLY
Portfolio Series
IMPORTANT DISCLAIMERS
Altrinsic Global Advisors, LLC., Black Creek Investment Management Inc., CBRE Global Investors, DoubleLine Capital LP, Epoch Investment
Partners, Inc., Lawrence Park Asset Management Ltd., Manulife, Marret Asset Management Inc., Munro Partners and QV Investors Inc. are
portfolio sub-advisors to certain funds offered and managed by CI Global Asset Management. Marret Asset Management Inc., is a majority owned
subsidiary of CI Financial Corp. and an affiliate of CI Global Asset Management. CI Financial Corp. holds a minority interest in Lawrence Park
Asset Management and Altrinsic Global Advisors, LLC. The CI Exchange-Traded Funds (ETFs) are managed by CI Global Asset Management., a
subsidiary of CI Financial Corp., (TSX: CIX; NYSE: CIXX).
Certain names, words, titles, phrases, logos, icons, graphics or designs in this document may constitute trade names, registered or unregistered
trademarks or service marks of CI Investments Inc., its subsidiaries or affiliates, used with permission.
Not to be reproduced or copied without the prior consent of CI Institutional Asset Management.
CI Global Asset Management is a registered business name of CI Investments Inc.
©CI Investments Inc. 2021. All rights reserved.
Published February 9, 2021
49
Quarterly Portfolio Review as at December 31, 2020

CI Institutional Asset Management2 Queen Street East
19th FloorToronto, Ontario
M5C 3G7Tel: 1.866.760.5274
E-mail: [email protected]


