Embed Size (px)
Citation preview

Analysis of Business Data

Analysis of Business Data Project
BUS1023M
Katherine Cloud CLO13451653
Jessica Harrington HAR12369873
Laura Skerritt SKE11357396
Sarah Neale NEA12360274
1
Table of Contents:
Names Page 2
Introduction Page 3
Company Choices Page 3
Lloyds Company Analysis Page 4
Morrisons Company Analysis Page 6
Domino’s Company Analysis Page 8
Debenhams Company Analysis Page 10
Analysis of Regression Results Page 12
Conclusion Page 12
Appendix Page 13
Bibliography Page 23
2

Introduction:
In this portfolio we will address the following four companies Domino’s, Debenhams, Lloyds, and Morrisons. Each company has been researched fully and the time to invest is now. All of the companies have had scandal in the past however have improved their reputation and are now respectable strong companies. This portfolio will demonstrate the strengths and weaknesses of each company within the past few months. While also analysing the HHI and coefficient correlation, in order to determine the best company.
Company Choices:
The four companies we decided to analyse are Domino’s, Debenhams’s, Lloyds, and Morrisons. As a group we felt the best way to spread risk was by investing in four companies from four different sectors. By doing this the risk remains relatively low. While one sector becomes negative the other sectors may remain positive. This can be noticed by the low correlations each company has with one another. As a group we picked Domino’s as a good company to analyse, as we are all students the company is of close interest. Given the current economic depression we knew Domino’s would be expanding, simply because it is an inexpensive option for dinner. We felt it would be interesting to compare a food industry company to a banking industry because they are very different. We chose Lloyds TSB as we thought it would be interesting to find out information on one of the banks that traditionally has been considered one of the "Big Four" clearing banks. Lloyds has been in the news a lot recently, such as scandals, take overs and competition and it would be of interest to see how this has affected market shares. We decided to choose Morrisons as part of the portfolio as we thought it would be interesting to see how it does compared to businesses in more unstable markets such as Lloyds. We thought that it would be interesting to see if it followed the same trends as the other companies as Morrisons only really has four major competitors. We chose Debenhams because finding out how well the company is doing directly affects Sarah’s family as they have a share in Debenhams. Therefore, if Debenhams is doing well and is forecasted to do well they could either accept higher dividends or sell the share for a high price. However, if Debenhams is not doing well they will not be receiving high dividends and if they decide to sell the share they might get less for what they originally bought it for. In all, the four companies we decided to investigate as a group are all from different sectors, industries, and backgrounds. Making the chosen firms interesting and unique.
3
Lloyd’s Company Analysis:
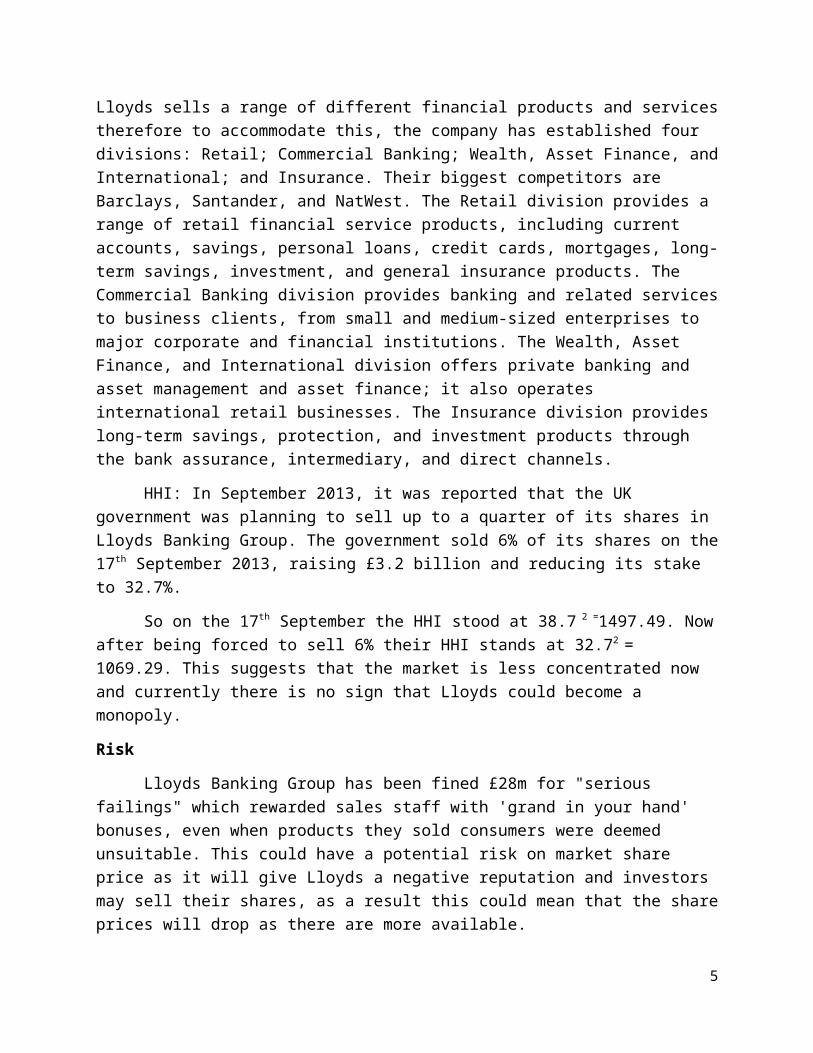
Lloyds TSB is one of many banks that make up Lloyds Banking Group. Lloyds Banking Group place provides banking and financial services to personal, commercial, and corporate customers in the United Kingdom and the international financial service sector. Lloyds sells a range of different financial products and services therefore to accommodate this, the company has established four divisions: Retail; Commercial Banking; Wealth, Asset Finance, and International; and Insurance. Their biggest competitors are Barclays, Santander, and NatWest. The Retail division provides a range of retail financial service products, including current accounts, savings, personal loans, credit cards, mortgages, long-term savings, investment, and general insurance products. The Commercial Banking division provides banking and related services to business clients, from small and medium-sized enterprises to major corporate and financial institutions. The Wealth, Asset Finance, and International division offers private banking and asset management and asset finance; it also operates international retail businesses. The Insurance division provides long-term savings, protection, and investment products through the bank assurance, intermediary, and direct channels.
HHI: In September 2013, it was reported that the UK government was planning to sell up to a quarter of its shares in Lloyds Banking Group. The government sold 6% of its shares on the 17th September 2013, raising £3.2 billion and reducing its stake to 32.7%.
So on the 17th September the HHI stood at 38.7 2 =1497.49. Now after being forced to sell 6% their HHI stands at 32.72 = 1069.29. This suggests that the market is less concentrated now and currently there is no sign that Lloyds could become a monopoly.
Risk
Lloyds Banking Group has been fined £28m for "serious failings" which rewarded sales staff with 'grand in your hand' bonuses, even when products they sold consumers were deemed unsuitable. This could have a potential risk on market share price as it will give Lloyds a negative reputation and investors may sell their shares, as a result this could mean that the share prices will drop as there are more available.
Future
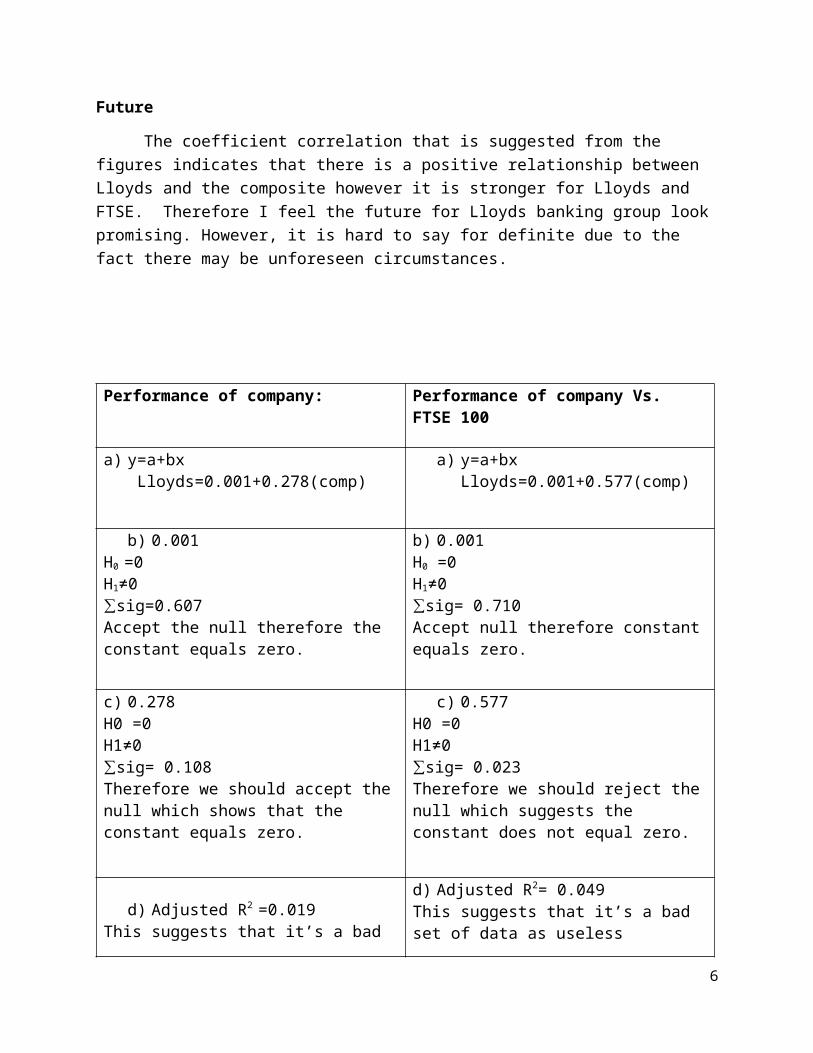
The coefficient correlation that is suggested from the figures indicates that there is a positive relationship between Lloyds and the composite however it is stronger for Lloyds and FTSE. Therefore I feel the future for Lloyds banking group look promising. However, it is hard to say for definite due to the fact there may be unforeseen circumstances.
4
Performance of company: Performance of company Vs. FTSE 100
a) y=a+bx Lloyds=0.001+0.278(comp)
a) y=a+bxLloyds=0.001+0.577(comp)
b) 0.001H0 =0H1≠0∑sig=0.607 Accept the null therefore the constant equals zero.
b) 0.001H0 =0H1≠0∑sig= 0.710 Accept null therefore constant equals zero.
c) 0.278H0 =0H1≠0∑sig= 0.108 Therefore we should accept the null which shows that the constant equals zero.
c) 0.577H0 =0H1≠0∑sig= 0.023 Therefore we should reject the null which suggests the constant does not equal zero.
d) Adjusted R2 =0.019 This suggests that it’s a bad set of data as useless variable are contained. Other variables could be included that are more relevant.
d) Adjusted R2= 0.049This suggests that it’s a bad set of data as useless variables are included
e) bi -1/std error0.278-1/0.171=-4.2The DOF = 84 which gives us a critical value of 1.9886As 4.2>1.9886 – we reject the null which suggest the coefficient is different to 1
e) bi-1/std error0.577-1/0.250=-1.692 Critical value is 1.9886Therefore as 1.692<1.9886 we should accept the null and reject the alternative. Which suggests it’s the same as 1.
5
Morrisons Company Analysis:
Morrisons is a supermarket in the food sector and is the fourth largest supermarket in the UK, behind Tesco, Asda and Sainsbury's. It has a total of 569 stores across the UK and sells a variety of products including clothing, kitchenware, electronics, home ware and groceries. The groceries they sell follow different ranges from low fat, special dietary requirements, children's meals and a premium range of ready meals. They also have an in store butcher and fishmonger. Their stores also have a variety of extra facilities to further improve customer service and satisfaction including cafés, petrol stations, pharmacies, photo printing, dry cleaning and like most stores, car parking.
Morrisons became a public company in 1957 and the Morrisons family still own 15.5%. It has a current share price of 11.3% and a HHI of 127.69; therefore showing that it is far from a monopoly. Morrisons is one of the “big four” supermarkets, behind Tesco with a market share of 30.1%, Sainsbury’s with 16.6% and Asda with 16.4%. After which its closest competitor is the Co-operative group with 4.4%. Due the extremely similar products sold in the stores, there is little differentiation between the supermarkets other than pricing and reward schemes. The pricing differentiation and reward schemes are what all four main supermarkets rely on in order to get ahead of their competitors and increase market share by gaining new customers. Reward schemes encourage potential new customers to shop in their store instead of competitor’s by offering them greater incentives. This is also similar to pricing differentiation. All four main supermarkets use pricing strategies like buy-one-get-one-free and other discounts in order to attract new customers. Although this can be costly in the long term, it often results in return/frequent customers. This price competitiveness can however be taken to extremes in the form of a “price war”, which Asda recently started. A price war would start an almost uncontrollably competitive market in which all supermarkets would try to sell certain products at the lowest price. The extra sales gained through this would then increase market share. If done successfully this could be a very useful method for Asda, Sainsbury’s, Morrisons and the co-operative group, but this should not be undertaken by Tesco as it is already very far ahead of the other supermarkets in terms of share price. However it is not a suitable strategy in the short term as it can be very costly. In general the market is fairly stable as it is hard for new competitors to emerge as there is a rather large barrier to entry and they sell product that there is constant demand for. However, I believe that it is only really unstable and risky in the way that a price war could reduce revenue and result in a loss of customers. In the future I would expect to see more competitiveness between the supermarkets in an attempt to increase profit and share price. I would also expect to see supermarkets to sell more products online. However it is hard to say how Morrisons in particular will do in the future, as to a certain extent its success depends on how the other supermarkets trade. However as Morrisons has only just started offering online shopping, which Asda, Sainsbury’s and Tesco have offered for a while, it is clear to see that it is struggling to keep up with the three main players. This combined with the fact that Morrisons market share has been decreasing for 5 years, doesn’t create a positive view of its future.
6

Performance of Company Performance of Company Vs. FTSE 100
Morrisons=-.001+.521(composite) Morrisons=-.001+.229(FTSE100)
Coefficient equals 0?H₀= coefficient equals 0H₁=coefficient done not equal 0Sigfig=.458We accept the null hypothesis.Therefore we conclude that the coefficient does equal zero.
Coefficient equals 0?H₀= coefficient equals 0H₁= coefficient does not equal 0Sig fig=.258We accept the null hypothesisTherefore we conclude that the coefficient equals zero.
Coefficient equals 0?H₀= coefficient equals 0H₁= coefficient does not equal 0Sig fig=.000We reject the null hypothesis.Therefore we conclude that the coefficient does not equal zero.
Coefficient equals 0?H₀= coefficient equals 0H₁= coefficient does not equal 0Sig fig=.139We accept the null hypothesis Therefore we conclude that the coefficient equals zero.
Adjusted r²=.285Informs investors that about 29% of the variation in the dependent variable is explained by the model. Therefore this is bad data.
Adjusted r²=.014Informs investors 1.4% of the variation in the dependent variable is explained by the model. Therefore this is bad data.
T-ratio H₀= coefficient equals oneH₁= coefficient does not equal one.521-1/.088=-5.44CV=1.9886Therefore we reject the null but accept the alternative hypothesis. Therefore conclude the coefficient of the composition differs from one.
T-ratioH₀= coefficient equals oneH₁= coefficient does not equal one.169-1/.241=-3.45CV=1.9886We reject the null but accept the alternative hypothesisTherefore we conclude the coefficient of FTSE100 differs from one.
7

Domino’s Company Analysis:
Domino’s Pizza is one of the many take-away pizza makers in the industry. Domino’s is currently located in 73 countries with 10,000 stores. The current Domino's menu features a variety of Italian-American entrees and side dishes. Pizza is the primary focus, with traditional, specialty, and custom pizzas available in a variety of crust styles and toppings. In 2011, Domino's launched artisan-style pizzas. Additional entrees include pasta, bread bowls, and oven-baked sandwiches. The menu offers chicken side dishes, breadsticks, as well as beverages and dessert. Domino’s was founded in 1960 by Tom Monaghan, toady it is the second largest pizza-delivery service, behind Pizza Hut. Some of the biggest competitors for Domino’s are Pizza Hut, Papa John’s International, and Little Caesars. Currently Domino’s is in the services sector. Domino's Pizza Group place, together with its subsidiaries, owns, operates, and franchises Domino's Pizza stores in the United Kingdom. As of September 29, 2013, it operated 642 stores in England, 51 in Scotland, and 33 in Wales. It also develops and manages properties; and leases store equipment. The company was formerly known as Domino's Pizza UK & IRL place and changed its name to Domino's Pizza Group place in May 2012. Domino's Pizza Group place was founded in 1960 and is headquartered in Milton Keynes, the United Kingdom.
Domino’s has seen a huge growth in the past few years mostly due to the economic depression. However, recently two senior advisors have announced their resignation from Domino’s. This has caused the company to drop stock prices. With intentions to grow, Domino’s has announced their plans to open 50 stores in the UK. However some financiers believe this could be disastrous due to the company’s failure to deliver good stock prices in the first quarter of 2013. These recent actions can have a potential risk on market share price because as Domino’s makeover its senior management the competitors have time to introduce new products increasing their market share price.
HHI Index: It was announced in December 2013 that the current chief executive officer, Lance Batchelor, would be stepping down. This came six months after the chief financial officer announced his resignation. These actions had an effect on the market share prices making them drop about 10p each time.
Both these actions have caused the market share to drop slightly from 13% to 11%. Therefore making the HHI 121. This means Domino’s is not a monopoly or in the direction to become a monopoly.
With plans to grow Domino’s has a bright future. Once the company has found new senior management it can begin the process of expansion. As noticed in the coefficient correlation the relationship between Domino’s and FTSE 100 is positive, while the relationship is weak there is still a relationship. Similar to the coefficient correlation for the composite and Domino’s, this demonstrates a strong relationship that is also positive. Meaning as the FTSE 100 and composite improve so will Domino’s. Therefore the future of Domino’s looks good, while also challenging.
8

Performance of Company Performance of Company Vs. FTSE 100
Dominos=.000+1.413(composite) Dominos=-.001+.169(FTSE100)
Coefficient equals 0?H₀= coefficient equals zeroH₁= coefficient does not equal zeroSig fig=.409We accept the null hypothesis. Therefore we conclude the coefficient equals zero.
Coefficient equals 0?H₀= coefficient equals zeroH₁= coefficient does not equal zeroSig fig=.553We accept the null hypothesis. Therefore we conclude that the coefficient equals zero.
Coefficient equals 0? H₀= coefficient equals zeroH₁= coefficient does not equal zeroSig fig= .000We reject the null hypothesis and accept the alternative hypothesis. Therefore we conclude the coefficient does not equal zero.
Coefficient equals 0?H₀=coefficient equals zeroH₁= coefficient does not equal zeroSig fig=.485We accept the null hypothesis. Therefore we conclude that the coefficient equals zero.
Adjusted r²=.888This tells investors that about 89% of the variation in the dependent variable is explained. Therefore this is good data.
Adjusted r²=-.006Informs investors that -0.6% of the variation in the dependent variable is explained by the model. Therefore this is terrible data.
T-ratioH₀= coefficient equals oneH₁= coefficient does not equal one1.413-1/.054=7.65CV=1.9886We reject the null hypothesis and accept the alternative. Therefore we conclude the coefficient of composition differs from one.
T-ratioH₀= coefficient equals oneH₁= coefficient does not equal one.169-1/.241=-3.45CV=1.9886Reject the null but accept the alternative hypothesis. Therefore we conclude that coefficient of FTSE 100 differs from one.
9

Debenhams’s Company Analysis:
Debenhams was first established in 1778 in London by William Clark selling high quality fabrics and women’s accessories. Debenhams is now a leading department store that sells products from areas such as clothing for women, men and children, home wares, beauty and health, lingerie, accessories and toys. They pride themselves on high quality service and products that they produce for customers.
Debenhams sells a range of designers including some competitors, e.g. House of Fraser, as well as some of their own brands. However other competitors of Debenhams (which are not sold at Debenhams) are Marks and Spencer’s and John Lewis. This is because they also sell high quality goods from a range of different departments. They have 153 stores in the UK and Ireland and another 48 franchise stores worldwide.
The sector that Debenhams is currently in is the retail sector. The market share for Debenhams is currently 18.6% making the HHI 345.96. Debenhams turnover in 2013 was £2,282 million and profit was £128 million. Revenue in August 2013 increased to £2,282.20 million from £2,229.80 which was the revenue in September 2012. Earnings per share have continually increased since 2011 and in 2013 it increased by 4%. The risk that Debenhams are currently having is that there was a ‘2.7% fall in annual pre-tax profit to £154m, last month’ (Butler, S. 2013). This therefore caused bosses at Debenhams to lose their bonuses and share bonuses this year as the profits had decreased for the company. Also Debenhams were only seen to reach base level of the sales growth and the growth margin performance as well. The future forecasts Debenhams are not seen to be positive as banks expect the retail stores annual pre-tax profit to fall by 12% by August 2014 as banks feel that Debenhams are pricing their products too low to get a good profit margin. As Barclays have shares in Debenhams they also feels that share buybacks will have to be postponed till 2016. Barclays in particular have found a lowered capitol rating to a more underweight rating. This has also been accompanied with 18% downside to the current share price.
10

Performance of Company Performance of Company Vs. FTSE 100
Debenhams=-.001+.532(composite) Debenhams=-.001+.199(FTSE100)
Coefficient equals 0?H₀= coefficient equals zeroH₁= coefficient does not equal zeroSig fig=.631We accept the null hypothesis. Therefore we conclude that the coefficient equals zero.
Coefficient equals 0?H₀= coefficient equals zeroH₁= coefficient does not equal zeroSig fig=.467We accept the null hypothesis. Therefore we conclude that the coefficient equals zero.
Coefficient equals 0?H₀= coefficient equals zeroH₁= coefficient does not equal zeroSig fig=.007We reject the null hypothesis. Therefore we conclude that the coefficient does not equal zero.
Coefficient equals 0?H₀= coefficient equals zeroH₁= coefficient does not equal zeroSig fig=.502We accept the null hypothesis. Therefore we conclude that the coefficient equals zero.
Adjusted r²=.074This tells investors that 7.4% of the variation in the dependent variable is explained by the model. Therefore this is bad data.
Adjusted r²=-.006Informs investors that -0.6% of the variation in the dependent variable is explained by the model. Therefore this is bad data.
T-ratioH₀= coefficient equals oneH₁= coefficient does not equal one.532-1/.191=-2.45CV=1.9886We reject the null hypothesis and accept the alternative hypothesis. Therefore we conclude that the coefficient of composition differs from one.
T-ratioH₀= coefficient equals oneH₁= coefficient does not equal one.199-1/.295=-2.715CV=1.9886We reject the null but accept the alternative. Therefore we conclude the coefficient of FTSE 100 differs from one.
11

Analysis of Regression Results:
After analysing the regression results we feel that Lloyds needs to make some improvements. This is represented in the regression results as firstly the adjusted r2 are both very close to zero; this suggests that a bad variable is included in the data and that a new explanatory would improve the data. Additionally, this is reinforced with the fact that the constants are equal to zero, this means that there is no correlation between two variables, the composite and Lloyds. However, with Lloyd’s vs. FTSE it shows that there is a correlation as it does not equal zero but one. The linear regression for Morrisons shows that it has a very low adjusted r² which suggests that it is not an excellent set of data as it's not as closely related to the FTSE100 as we thought. For the composite hypothesis test we accept the alternative hypothesis that the composite equals one. Therefore showing that there is no relation between Morrisons and the composite model. This is likely to be due to the fact that they are in completely different markets so they will not be effected by the same things. For example Lloyds & Debenhams would be negatively affected by a downturn in the economy where as Dominos would likely not suffer such a loss due to it being the closest substitute to eating out. It is likely to also be the same for Morrisons which sells essential goods so it will not be effected to such an extent. After analysing the regression we found that Domino’s was doing the best so far. Domino’s has the highest r² value which is .889 meaning about 89% of the data is represented in the model. Compared to some of the other firms r² this is a huge difference. This is obvious based on the fact that one of the coefficients does not equal zero. Meaning there is a strong relationship between Domino’s and the Composite. While in the FTSE 100 regression the opposite occurs, in this regression we see that both coefficients equal zero. This demonstrates that there is no relation between FTSE 100 and Domino’s. The performance of Debenhams against the FTSE is considered to be doing poorly as the coefficient equals zero so therefore there is no correlation between the two variables. The composite also equals zero so there is no correlation between the composite and Debenhams. Therefore we can conclude that the performance of Debenhams against the FTSE is poor but against the composite it is slightly better, however in general the performance of Debenhams is very poor.
Conclusion:
Overall, it’s suggested that the four companies in this portfolio are very different. Some companies are growing while others are dropping in share price. Lloyds has been performing poorly over the last three months and this is represented in the regression results. Lloyds as a company has the possibly to increase their market share while also increasing their correlation with FTSE 100. We found that Morrison is the second best company of the four. While it doesn’t have the best regression results it is still a company that plans to grow. After researching Domino’s we feel it has been performing well, although it began 2013 badly the company has improved their share prices and has begun the process of expansion. We conclude that Debenhams is doing poorly overall and therefore we recommend that it would be a bad idea to buy shares in Debenhams as dividends are low and therefore it is not a worthy investment. In all, the four companies we decided to analyse have demonstrated the positives and negatives of an economic depression, while some companies increase others decreases.
12

Appendix:
Correlations
Correlations
FTSE100 Lloyds Morrisons Debenhams Dominos
FTSE100 Pearson Correlation 1 .634** -.258* -.365** .224*
Sig. (2-tailed) .000 .016 .001 .038
N 86 86 86 86 86
Lloyds Pearson Correlation .634** 1 -.065 -.164 .288**
Sig. (2-tailed) .000 .551 .133 .007
N 86 86 86 86 86
Morrisons Pearson Correlation -.258* -.065 1 .516** .217*
Sig. (2-tailed) .016 .551 .000 .045
N 86 86 86 86 86
Debenhams Pearson Correlation -.365** -.164 .516** 1 -.068
Sig. (2-tailed) .001 .133 .000 .535
N 86 86 86 86 86
Dominos Pearson Correlation .224* .288** .217* -.068 1
Sig. (2-tailed) .038 .007 .045 .535
N 86 86 86 86 86
**. Correlation is significant at the 0.01 level (2-tailed).
*. Correlation is significant at the 0.05 level (2-tailed).
Regression
Variables Entered/Removeda
Model
Variables
Entered
Variables
Removed Method
1 FTSE100b . Enter
a. Dependent Variable: Dominos
b. All requested variables entered.
13

Model Summary
Model R R Square
Adjusted R
Square
Std. Error of the
Estimate
1 .076a .006 -.006 .013615958
a. Predictors: (Constant), FTSE100
ANOVAa
Model Sum of Squares df Mean Square F Sig.
1 Regression .000 1 .000 .492 .485b
Residual .016 84 .000
Total .016 85
a. Dependent Variable: Dominos
b. Predictors: (Constant), FTSE100
Coefficientsa
Model
Unstandardized Coefficients
Standardized
Coefficients
t Sig.B Std. Error Beta
1 (Constant) -.001 .001 -.595 .553
FTSE100 .169 .241 .076 .702 .485
a. Dependent Variable: Dominos
Regression
Variables Entered/Removeda
Model
Variables
Entered
Variables
Removed Method
1 Compositeb . Enter
a. Dependent Variable: Dominos
b. All requested variables entered.
Model Summary
14

Model R R Square
Adjusted R
Square
Std. Error of the
Estimate
1 .943a .889 .888 .004544179
a. Predictors: (Constant), Composite
ANOVAa
Model Sum of Squares df Mean Square F Sig.
1 Regression .014 1 .014 674.584 .000b
Residual .002 84 .000
Total .016 85
a. Dependent Variable: Dominos
b. Predictors: (Constant), Composite
Coefficientsa
Model
Unstandardized Coefficients
Standardized
Coefficients
t Sig.B Std. Error Beta
1 (Constant) .000 .000 .831 .409
Composite 1.413 .054 .943 25.973 .000
a. Dependent Variable: Dominos
Regression
Variables Entered/Removeda
Model
Variables
Entered
Variables
Removed Method
1 FTSE100b . Enter
a. Dependent Variable: Morrisons
b. All requested variables entered.
15

Model Summary
Model R R Square
Adjusted R
Square
Std. Error of the
Estimate
1 .161a .026 .014 .008640211
a. Predictors: (Constant), FTSE100
ANOVAa
Model Sum of Squares df Mean Square F Sig.
1 Regression .000 1 .000 2.236 .139b
Residual .006 84 .000
Total .006 85
a. Dependent Variable: Morrisons
b. Predictors: (Constant), FTSE100
Coefficientsa
Model
Unstandardized Coefficients
Standardized
Coefficients
t Sig.B Std. Error Beta
1 (Constant) -.001 .001 -1.140 .258
FTSE100 .229 .153 .161 1.495 .139
a. Dependent Variable: Morrisons
Regression
Variables Entered/Removeda
Model
Variables
Entered
Variables
Removed Method
1 Compositeb . Enter
a. Dependent Variable: Morrisons
b. All requested variables entered.
16

Model Summary
Model R R Square
Adjusted R
Square
Std. Error of the
Estimate
1 .542a .294 .285 .007357416
a. Predictors: (Constant), Composite
ANOVAa
Model Sum of Squares df Mean Square F Sig.
1 Regression .002 1 .002 34.929 .000b
Residual .005 84 .000
Total .006 85
a. Dependent Variable: Morrisons
b. Predictors: (Constant), Composite
Coefficientsa
Model
Unstandardized Coefficients
Standardized
Coefficients
t Sig.B Std. Error Beta
1 (Constant) -.001 .001 -.746 .458
Composite .521 .088 .542 5.910 .000
a. Dependent Variable: Morrisons
Regression
Variables Entered/Removeda
Model
Variables
Entered
Variables
Removed Method
1 FTSE100b . Enter
a. Dependent Variable: Debenhams
b. All requested variables entered.
17

Model Summary
Model R R Square
Adjusted R
Square
Std. Error of the
Estimate
1 .073a .005 -.006 .016649726
a. Predictors: (Constant), FTSE100
ANOVAa
Model Sum of Squares df Mean Square F Sig.
1 Regression .000 1 .000 .455 .502b
Residual .023 84 .000
Total .023 85
a. Dependent Variable: Debenhams
b. Predictors: (Constant), FTSE100
Coefficientsa
Model
Unstandardized Coefficients
Standardized
Coefficients
t Sig.B Std. Error Beta
1 (Constant) -.001 .002 -.731 .467
FTSE100 .199 .295 .073 .674 .502
a. Dependent Variable: Debenhams
Regression
Variables Entered/Removeda
Model
Variables
Entered
Variables
Removed Method
1 Compositeb . Enter
a. Dependent Variable: Debenhams
b. All requested variables entered.
18

Model Summary
Model R R Square
Adjusted R
Square
Std. Error of the
Estimate
1 .291a .084 .074 .015974440
a. Predictors: (Constant), Composite
ANOVAa
Model Sum of Squares df Mean Square F Sig.
1 Regression .002 1 .002 7.746 .007b
Residual .021 84 .000
Total .023 85
a. Dependent Variable: Debenhams
b. Predictors: (Constant), Composite
Coefficientsa
Model
Unstandardized Coefficients
Standardized
Coefficients
t Sig.B Std. Error Beta
1 (Constant) -.001 .002 -.482 .631
Composite .532 .191 .291 2.783 .007
a. Dependent Variable: Debenhams
Regression
Variables Entered/Removeda
Model
Variables
Entered
Variables
Removed Method
1 FTSE100b . Enter
a. Dependent Variable: Lloyds
b. All requested variables entered.
19

Model Summary
Model R R Square
Adjusted R
Square
Std. Error of the
Estimate
1 .244a .060 .049 .014081982
a. Predictors: (Constant), FTSE100
ANOVAa
Model Sum of Squares df Mean Square F Sig.
1 Regression .001 1 .001 5.336 .023b
Residual .017 84 .000
Total .018 85
a. Dependent Variable: Lloyds
b. Predictors: (Constant), FTSE100
Coefficientsa
Model
Unstandardized Coefficients
Standardized
Coefficients
t Sig.B Std. Error Beta
1 (Constant) .001 .002 .373 .710
FTSE100 .577 .250 .244 2.310 .023
a. Dependent Variable: Lloyds
Regression
Variables Entered/Removeda
Model
Variables
Entered
Variables
Removed Method
1 Compositeb . Enter
a. Dependent Variable: Lloyds
20

b. All requested variables entered.
Model Summary
Model R R Square
Adjusted R
Square
Std. Error of the
Estimate
1 .174a .030 .019 .014299821
a. Predictors: (Constant), Composite
ANOVAa
Model Sum of Squares df Mean Square F Sig.
1 Regression .001 1 .001 2.635 .108b
Residual .017 84 .000
Total .018 85
a. Dependent Variable: Lloyds
b. Predictors: (Constant), Composite
Coefficientsa
Model
Unstandardized Coefficients
Standardized
Coefficients
t Sig.B Std. Error Beta
1 (Constant) .001 .002 .516 .607
Composite .278 .171 .174 1.623 .108
a. Dependent Variable: Lloyds
Regression
Variables Entered/Removeda
Model
Variables
Entered
Variables
Removed Method
1 Compositeb . Enter
21

a. Dependent Variable: FTSE100
b. All requested variables entered.
Model Summary
Model R R Square
Adjusted R
Square
Std. Error of the
Estimate
1 .147a .022 .010 .006085717
a. Predictors: (Constant), Composite
ANOVAa
Model Sum of Squares df Mean Square F Sig.
1 Regression .000 1 .000 1.850 .177b
Residual .003 84 .000
Total .003 85
a. Dependent Variable: FTSE100
b. Predictors: (Constant), Composite
Coefficientsa
Model
Unstandardized Coefficients
Standardized
Coefficients
t Sig.B Std. Error Beta
1 (Constant) 5.416E-5 .001 .082 .935
Composite .099 .073 .147 1.360 .177
a. Dependent Variable: FTSE100
22

References
BraveNewTalent. 2013. BraveNewTalent, the talented community. [online] Available at:
http://www.bravenewtalent.com/debenhams#about-us [Accessed: 14 Dec 2013].
Butler, S. 2013. Debenhams bosses lose out on bonuses after profits slip. [online] Available at:
http://www.theguardian.com/business/2013/nov/11/debenhams-bosses-bonuses-profit-fall-retail-uk [Accessed: 14 Dec 2013].
Debenhams.com. 2013. Histoy of Debenhams. [online] Available at:
http://www.debenhams.com/webapp/wcs/stores/servlet/contentView?filepath=/DebenhamsUKSite/Static/history_debenhams_uk.xml&storeId=10701&langId=-1 [Accessed: 14 Dec 2013].
Digitallook.com. 2013. Debenhams News (DEB) Share Prices, Charts, News, Financials, and
More - Digital Look. [online] Available at: http://www.digitallook.com/cgi-bin/dlmedia/security.cgi?csi=190280&action=news&story_id=21331237 [Accessed: 14 Dec 2013].
Digitallook.com. 2013. Debenhams Company Research - Stock Quote (DEB) Share Prices,
Stock Quotes, Charts, News, Financials, and More - Digital Look. [online] Available at: http://www.digitallook.com/cgi-bin/dlmedia/security.cgi?csi=190280&action=financials&sub_action=forecasts&username=&ac= [Accessed: 14 Dec 2013].
Shares.telegraph.co.uk. 2013. Debenhams - Latest Share Price | Shares & Markets - Telegraph. [online] Available at: http://shares.telegraph.co.uk/quote/?epic=DEB [Accessed: 14 Dec 2013].
Domino's Corporate. 2013. Domino's Pizza - Investors - Corporate Profile. [online] Available at:
http://phx.corporate-ir.net/phoenix.zhtml?c=135383&p=irol-homeprofile [Accessed: 14 Dec
2013].
Domino's. 2013. Q3 2013 Financial Results. [report] Domino's, pp. 1-7.
Hoovers.com. 2013. Debenhams plc. Names of Competitors. [online] Available at:
http://www.hoovers.com/company-information/cs/competition.Debenhams_plc.48581e96dab15003.html [Accessed: 14 Dec 2013].
Morrisons. 2013. Untitled. [online] Available at: http://your.morrisons.com/Help-and
information/Store-services/Facilities-for-shoppers-with-disabilities/ [Accessed: 13 Dec
2013].
23

Naylor, T. 2013. Who Would You Rather... Domino's vs. Papa John's. benzinga, [blog] 2nd
December, Available at: http://www.benzinga.com/economics/13/12/4112139/who-would-
you-rather-dominos-or-papa-johns [Accessed: 14 Dec 2013].
Shares.telegraph.co.uk. 2013. Debenhams - Latest Share Price | Shares & Markets - Telegraph. [online] Available at: http://shares.telegraph.co.uk/quote/?epic=DEB [Accessed: 14 Dec 2013].
Titcomb, J. 2013. Domino's Pizza chief resigns amid growth questions. The Telegraph, [online]
6th December. Available at: http://www.telegraph.co.uk/finance/10499865/Dominos-Pizza-
chief-resigns-amid-growth-questions.html [Accessed: 14 Dec 2013].
White, G. 2011. Questor share tip: Grab a slice of Domino's Pizza after share price fall. The
Telegraph, [online] 20th April. Available at:
http://www.telegraph.co.uk/finance/markets/questor/8461624/Questor-share-tip-Grab-a-
slice-of-Dominos-Pizza-after-share-price-fall.html [Accessed: 14 Dec 2013].
Wikipedia. 2013. Morrisons. [online] Available at:
http://en.wikipedia.org/wiki/Morrisons#Financial_performance [Accessed: 13 Dec 2013].
24