Embed Size (px)
Citation preview

The Society for Financial Studies
Portfolio Performance Evaluation: Old Issues and New InsightsAuthor(s): Mark Grinblatt and Sheridan TitmanSource: The Review of Financial Studies, Vol. 2, No. 3 (1989), pp. 393-421Published by: Oxford University Press. Sponsor: The Society for Financial Studies.Stable URL: http://www.jstor.org/stable/2962166Accessed: 06/11/2010 17:22
Your use of the JSTOR archive indicates your acceptance of JSTOR's Terms and Conditions of Use, available athttp://www.jstor.org/page/info/about/policies/terms.jsp. JSTOR's Terms and Conditions of Use provides, in part, that unlessyou have obtained prior permission, you may not download an entire issue of a journal or multiple copies of articles, and youmay use content in the JSTOR archive only for your personal, non-commercial use.
Please contact the publisher regarding any further use of this work. Publisher contact information may be obtained athttp://www.jstor.org/action/showPublisher?publisherCode=oup.
Each copy of any part of a JSTOR transmission must contain the same copyright notice that appears on the screen or printedpage of such transmission.
JSTOR is a not-for-profit service that helps scholars, researchers, and students discover, use, and build upon a wide range ofcontent in a trusted digital archive. We use information technology and tools to increase productivity and facilitate new formsof scholarship. For more information about JSTOR, please contact [email protected].
The Society for Financial Studies and Oxford University Press are collaborating with JSTOR to digitize,preserve and extend access to The Review of Financial Studies.
http://www.jstor.org

Portfolio Performance Evaluation: Old Issues and New Insights
Mark Grinblatt Sheridan Titman University of California, Los Angeles
This article presents a model that provides insights about various measures of portfolio performance. The model explores several criticisms of these mea- sures. These include the problem of identifying an appropriate benchmark portfolio, the possibility of overestimating risk because of market-timing abil- ity, and the failure of informed investors to earn positive risk-adjusted returns because of increasing risk aversion. The article argues that these need not be serious impediments to performance evaluation.
One of the widely held "folk theorems" in finance is that informed investors can achieve a better risk-return trade-off than uninformed investors. Risk, however, is difficult to define and measure in markets with asym- metric information, especially when one considers that it must be evaluated by an uninformed observer. For this reason, there has been a great deal of controversy over whether the performance measures proposed by Treynor (1965), Sharpe (1966), andJensen (1968,1969) can identify investors with superior information.
Jensen's alpha, which measures the deviation of a portfolio from the securities market line, has been the focus of most of the controversy because it is the most
S.T. gratefully acknowledges financial support from the Batterymarch Fellow- ship program. The authors are grateful to Michael Brennan for helpful discus- sions and comments on earlier drafts of this article. They also thank Anat Admati, Thomas Copeland, Brad Cornell, Philip Dybvig, David Hirshleifer, Jonathan Ingersoll, Ronald Masulis, Krishna Ramaswamy, Richard Roll, Stephen Ross, Walter Torous, Brett Trueman, Robert Verrecchia, Arthur Warga, an anonymous referee, and seminar participants at Chicago, Michigan, Northwestern, Wharton, UCLA/USC, and the European Finance Association for their comments. Address reprint requests to Dr. Titman, UCLA Anderson Graduate School of Manage- ment, Los Angeles, CA 90024.
The Review of Financial Studies 1989 Volume 2, number 3, pp. 393-421 ?D 1990 The Review of Financial Studies 0893-9454/90/$1.50

The Review of Financial Studies / v 2 n 3 1989
widely used in academic empirical studies. One criticism of the Jensen measure is that it is based on an upwardly biased estimate of systematic risk for a market-timing investment strategy. Examples provided byJensen (1972), Admati and Ross (1985), and Dybvig and Ross (1985) demonstrate that, because of this, the Jensen measure can assign negative performance to a market timer.
Figure 1, which graphs the excess return of the evaluated portfolio (above a risk-free rate) against the excess return of the benchmark portfolio, illus- trates this deficiency of the Jensen measure. The portfolio manager is constrained here to select a high or low beta portfolio, represented by the steeper and gentler sloped solid lines, respectively. (If the benchmark is mean-variance efficient, both of these lines pass through the origin.) Sup- pose that the manager receives one of two signals: that the benchmark excess return will be rH, which is above its unconditional mean, or it will be rL, which is below its mean. If he acts as a market timer, he will select a high beta portfolio and be at point A upon receipt of the high return signal and at point B if he receives the low return signal. An uninformed observer would estimate the risk of this investment strategy as the slope of the dotted line connecting points A and B, which exceeds the risk of the portfolio in either information state. Moreover, it is even possible, as in this example, that the Jensen measure, which is the intercept of the dotted line at C, may be negative, erroneously indicating that the informed investor is an inferior performer.
The most important contribution of this article is the development of the positive period weighting measure, which is an alternative performance measure that has the same data requirements as the Jensen measure but which correctly identifies informed investors as positive performers. In addition to demonstrating that this measure is not distorted by the timing- related problem discussed above, the article addresses two additional crit- icisms of the Jensen measure that are also relevant for our new measure.
One of these criticisms, advanced by Roll (1978,1979), is that the Jensen measure of a portfolio bears no reliable relation to its true performance because there is no appropriate benchmark portfolio with which to com- pute beta. The CAPM (capital asset pricing model) -related empirical anom- alies documented in the past decade lend weight to this criticism as it applies to traditional benchmark portfolios. Since it is undesirable to clas- sify uninformed investors who engage in passive strategies (e.g., buy and hold small firms) as superior performers, index portfolios that yield such ''anomalies" are inappropriate as performance benchmarks.
It is well known that a Jensen measure employing a mean-variance effi- cient benchmark portfolio correctly classifies uninformed investors as zero performers. However, we demonstrate that the mean-variance efficient port- folio is the appropriate benchmark for both Jensen's alpha and our new measure in that it also correctly classifies informed investors as positive performers. Moreover, in contrast to the market portfolio in tests of the CAPM, which requires the observability of all assets, this benchmark, may
394

Portfolio Performance Evaluation
Excess Return of Managed Portfolio
High Beta Portfolio Choice
A
X ,,,,,,_ Low Beta Portfolio Choice
B,' I ExcessReturnof ' // low high Efficient Portfolio return return
/ rL rH
/ alpha 'C
Figure 1 An example of a negative Jensen measure for a market timer The two solid lines plot the excess return of a managed portfolio consisting of a risk-free investment and an investment in the risky efficient portfolio against the latter's excess return for two different choices of beta. A market-timing strategy, constrained to choose between the two betas, would plot at point A (point B) if information indicated that the excess return of the efficient portfolio was expected to be rH (rL). The slope of the dotted line is the estimated beta in the Jensen measure regression, and the intercept is the Jensen measure.
consist of a relatively small set of assets, since it can be limited to those assets that are managed by the evaluated investor or that he considers tradable. Such a benchmark also provides correct inferences in cases in which the evaluated investor does not optimally select a portfolio on the mean-variance efficient frontier, as we show by allowing for nontraded assets.
The third criticism was raised by Verrecchia (1980), who presented an example in which an informed investor realizes average returns below that expected by uninformed observers who know the risk of the portfolio. This means that informed investors can realize negative risk-adjusted returns, even when returns are properly adjusted for risk. Thus, the example chal-
395

The Review of Financial Studies/ v 2 n 3 1989
lenges the validity of all measures of portfolio performance.1 We demon- strate, however, that counterexamples in the class described by Verrecchia can only occur when the informed investor has unrealistic preferences.
These three criticisms are analyzed within a framework that decomposes the Jensen measure into a bias-in-beta term, a selectivity term reflecting the ability to select investments that will do well relative to the benchmark portfolio, and a timing term representing the contribution to performance of the ability to forecast the return of the benchmark portfolio. In addition to providing insights about the Jensen measure, this decomposition sug- gests two other new performance measures, the selectivity measure and the timing measure, which have desirable properties for evaluating per- formance. We also show that the measure proposed by Cornell (1979) captures the sum of the timing and selectivity terms.
1. The Measures of Performance and Their Decomposition
Our analysis assumes the existence of N risky assets, which trade in fric- tionless markets (i.e., no transaction costs, taxes, short sales restrictions, etc.), at dates t, t = 1, ..., T. We plan to evaluate the performance of an investor over the T periods by examining risk-adjusted portfolio returns that are given by the returns of these assets. We will also assume that a risk-free asset exists and define excess returns relative to the risk-free return. Let
Rjt = excess return of asset j from holding asset j between dates t and t+ 1
xj = the investor's period t portfolio weight on asset j N
rPt = : xZtRkt = period t excess return of the investor's portfolio of the j-=1
N risky assets
where xjt is random, since the investor may alter his portfolio in response to (real or imagined) information. Similarly, let rE, denote the period t excess return of the portfolio of risky assets that is mean-variance efficient from the perspective of an uninformed observer. It has population mean rE and variance '.
The excess returns of each asset can then be expressed as
Rjt= j3rEt + Ejt
where
_cov(Rjt, t)
2-
I Dybvig and Ross (1985) first pointed out that Verrecchia's example applies to the measure of performance proposed by Cornell (1979).
396

Portfolio Performance Evaluation
and, given the efficiency of the benchmark, the mean of ,jt is zero. The excess return of the investor's portfolio can then be expressed as
rPt= pt~rEt + p(1)
where N N
At=: X jLt and jp= =
Note that pE, 2, and f, are not subscripted by t. Throughout the article, the means, variances, and covariances of the excess returns of assets are calculated from the perspective of an uninformed observer who, by assump- tion, views the excess-return vector as being drawn from an i.i.d. (inde- pendently and identically distributed) distribution (henceforth, "the unconditional distribution"). Although the distribution of asset returns, conditioned on the information signals of informed investors, is nonsta- tionary, the model is consistent with a general equilibrium as long as the effect of informed traders on market-clearing prices is negligible.2
I.i.d. unconditional returns imply that the unconditional mean-variance efficient portfolio has constant portfolio weights and that the beliefs of an uninformed investor, and hence his portfolio weights and portfolio beta, must be independent of the realizations of rEt and each Rjt. In contrast, an informed investor may change his portfolio weights in response to new information, inducing a nonzero covariance between his portfolio weights and asset returns.
In later sections, we demonstrate that the ability of various measures to capture superior performance depends on whether the informed investor's information relates to rEt or to the Z.t's. For this reason, it is convenient to distinguish between these types of information.
Definition. An investor is said to have timing information if the expected value of rE, conditioned on his information, is not equal to rEfor at least one time period.
Definition. An investor is said to have selectivity information if the expected value Of (j, conditioned on his information, is nonzero for at least one asset in one time period.
2 The i.i.d. assumption is required because it is otherwise impossible for an uninformed observer to distin- guish between performance and changes in the parameters of the return-generating process. Indeed, any taxonomy that distinguishes between these possibilities is necessarily based on the number of investors who are assumed to observe the nonstationarities. In a market with traders who have special information, only a few investors observe the nonstationarities, whereas in a market with nonstationary parameters, virtually all investors observe the nonstationarities (and only the evaluator is naive). For the analysis of some of the performance measures, this strong stationarity assumption can be relaxed. For example, if the observer can identify the unconditional mean-variance efficient portfolio each period, our results still apply.
397
The Review of Financial Studies/ v 2 n 3 1989
These definitions of timing and selectivity are closely related to their common usage by investment professionals. The two types of information will be explicitly modeled in Section 2.
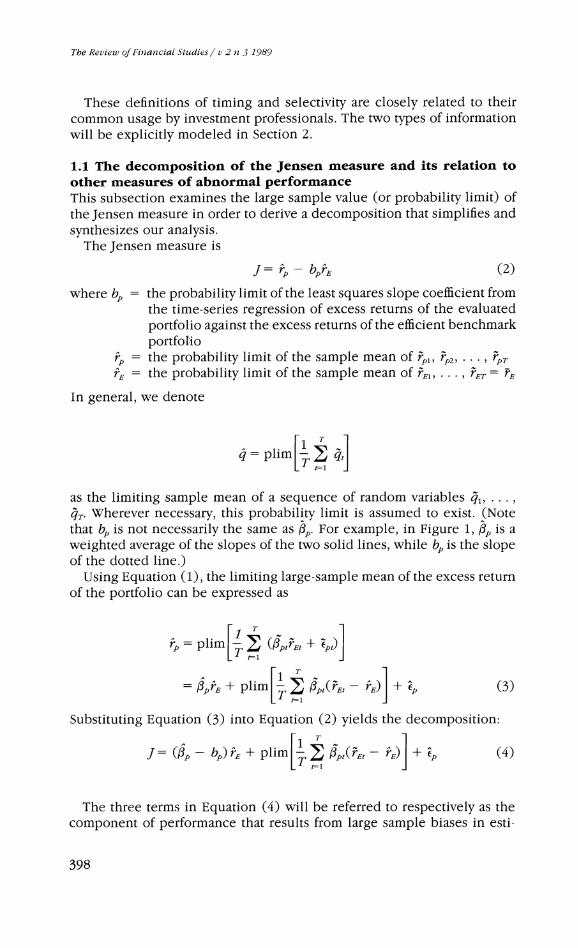
1.1 The decomposition of the Jensen measure and its relation to other measures of abnormal performance This subsection examines the large sample value (or probability limit) of the Jensen measure in order to derive a decomposition that simplifies and synthesizes our analysis.
The Jensen measure is
J= rp - bpE (2)
where bp = the probability limit of the least squares slope coefficient from the time-series regression of excess returns of the evaluated portfolio against the excess returns of the efficient benchmark portfolio
ip = the probability limit of the sample mean of rpi, rp2,..., rpT
rE = the probability limit of the sample mean of E1 ..., ET= rE
In general, we denote
q= plim L4 j
as the limiting sample mean of a sequence of random variables q1, qT. Wherever necessary, this probability limit is assumed to exist. (Note that bp is not necessarily the same as Ap. For example, in Figure 1, fp is a weighted average of the slopes of the two solid lines, while bp is the slope of the dotted line.)
Using Equation (1), the limiting large-sample mean of the excess return of the portfolio can be expressed as
rP = plim (ptEt + Zpt)1
= fprE + Plim4 fPt(Et - rE)1 + p (3)
Substituting Equation (3) into Equation (2) yields the decomposition:
J= ( - bp) rE + PlimL : fpt(pEt r) +E) ? (4)
The three terms in Equation (4) will be referred to respectively as the component of performance that results from large sample biases in esti-
398

Portfolio Performance Evaluation
mated beta, the component that results from timing, and the component that results from selectivity.
If the weights of the evaluated investor's portfolio are observable, the elements of the decomposition can be separately identified. The selectivity measure is constructed by estimating the period t beta of a portfolio as period t's portfolio-weighted average of the individual asset betas. Multi- plying this beta by rET, subtracting from rp, and averaging yields a measure with an asymptotic value of
5 = ip - plim[4 fPtrEtl
After substitution of Equation (3), this can be expressed as
S= p (5)
The counterpart of the selectivity measure, the timing measure, is defined as the sample covariance between the portfolio beta and the excess return of the benchmark portfolio. Its asymptotic value is
TM = plimL4; fpt(kt - E)1 (6)
Cornell (1979) proposed a measure that averages the difference between the holding-period return of an investor's portfolio and the return realized with the same portfolio weights in a benchmark time period outside of the holding period.3 If asset returns in the benchmark period are distrib- uted independently of their respective portfolio weights in the holding period (which is assumed throughout this article), the asymptotic value of this measure can be expressed as
C = rp
- fip E
which, upon substitution of Equation (3), yields
C plim L-[ fpt(Et - rE) + ep (7)
Thus, the Cornell measure captures the sum of the timing and selectivity components.
The components of abnormal performance are analyzed separately in Sections 3, 4, and 5. Section 3 analyzes the bias-in-beta component, Section
I Copeland and Mayers (1982) pointed out that the Cornell approach should be modified by measuring securities' benchmark returns in periods after they were held by investors, rather than before, because trading strategies may be based on past returns. This, however, introduces survivorship bias.
399
The Rev/ieu of Financial Studies/ v 2 n 3 1989
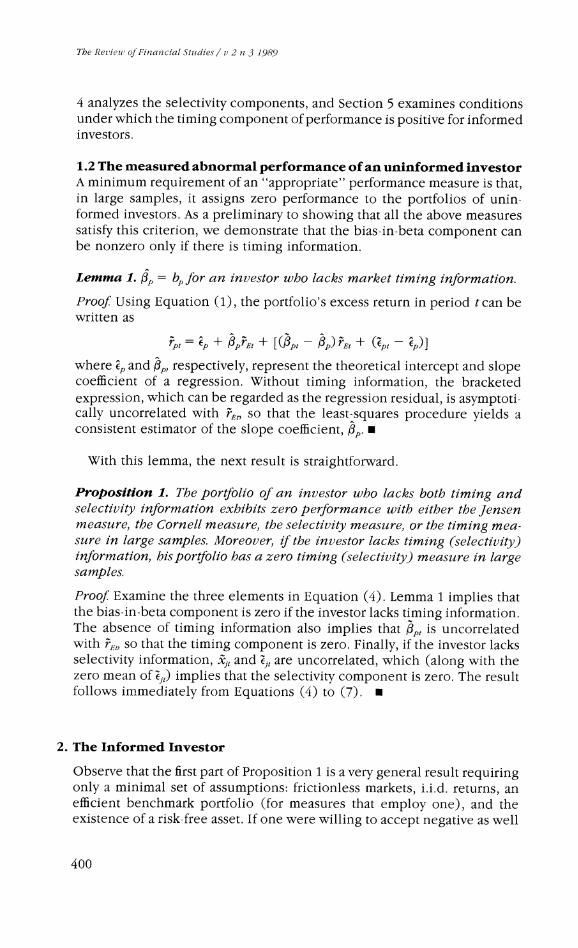
4 analyzes the selectivity components, and Section 5 examines conditions under which the timing component of performance is positive for informed investors.
1.2 The measured abnormal performance of an uninformed investor A minimum requirement of an "appropriate" performance measure is that, in large samples, it assigns zero performance to the portfolios of unin- formed investors. As a preliminary to showing that all the above measures satisfy this criterion, we demonstrate that the bias-in-beta component can be nonzero only if there is timing information.
Lemma 1. fp = bpfor an investor who lacks market timing information.
Proof Using Equation (1), the portfolio's excess return in period tcan be written as
P= + flPrE + [pt - fp) rEt + (-pt- p)
where s and 31, respectively, represent the theoretical intercept and slope coefficient of a regression. Without timing information, the bracketed expression, which can be regarded as the regression residual, is asymptoti- cally uncorrelated with rEt, so that the least-squares procedure yields a consistent estimator of the slope coefficient, Op. U
With this lemma, the next result is straightforward.
Proposition 1. The portfolio of an investor who lacks both timing and selectivity information exhibits zero performance with either the Jensen measure, the Cornell measure, the selectivity measure, or the timing mea- sure in large samples. Moreover, if the investor lacks timing (selectivity) information, his portfolio has a zero timing (selectivity) measure in large samples.
Proof Examine the three elements in Equation (4). Lemma 1 implies that the bias-in-beta component is zero if the investor lacks timing information. The absence of timing information also implies that fpt is uncorrelated with i,Et, so that the timing component is zero. Finally, if the investor lacks selectivity information, xjt and Zjt are uncorrelated, which (along with the zero mean of Qjt) implies that the selectivity component is zero. The result follows immediately from Equations (4) to (7). e
2. The Informed Investor
Observe that the first part of Proposition 1 is a very general result requiring only a minimal set of assumptions: frictionless markets, i.i.d. returns, an efficient benchmark portfolio (for measures that employ one), and the existence of a risk-free asset. If one were willing to accept negative as well
400

Portfolio Performance Evaluation
as positive deviations from zero abnormal performance as an indication of superior information, the analysis could end here. The ability to measure performance would then be an empirical issue that hinges on benchmark observability, the stationarity of returns, data availability, and the small sample properties of the various techniques.
However, since negative measured performance can arise from high transaction costs or embezzlement as well as from superior information, the properties of the performance measures in frictionless markets are not necessarily indicative of their ability to identify superior investment per- formance in a more realistic setting. Thus, it is useful to demonstrate that the measures are generally positive for investment strategies that utilize superior information.4 Although others have pointed out that this more stringent criterion is not always met, we will argue that it can be met under plausible conditions.
To demonstrate this, a model of information and portfolio choice is developed. The model analyzes the signs of unconditional means of the random variables Zp, and 3pt( Et - rE) and determines the conditions under which they (and hence their asymptotic counterparts, the selectivity and timing components) are positive. Because the analysis of the unconditional means does not depend on the time period, time subscripts can be omitted to simplify notation. With this simplification, it is convenient to refer to E(Zp) and cov(fp, rE), respectively, as the selectivity and timing compo- nents.
The model assumes that an investor's wealth consists of an evaluated portion (i.e., investments in the N tradable assets) and an unevaluated portion (i.e., nontradable assets). In addition, the model abstracts from issues that can arise in the multiperiod consumption-investment optimi- zation problem and assumes a form of myopia. Each period's investment decision is assumed to be determined by maximizing the (possibly time- dependent) expected utility of end-of-period wealth,
E[ U( W + WH) ]
conditioned on information available just prior to trading in that period, where
WH = end-of-period wealth from nontradable assets W = end-of-period wealth from managed (i.e., tradable) assets WO(RF +
rp), where WO = wealth available at the beginning of the period for investment in
managed assets RF = one plus the risk-free rate
I It would be better if performance measures could also select the more informed of two investors. Unfor- tunately, risk aversion and preferences for higher-order moments also affect these measures, making it impossible, except for special cases, to extract the information-related component of performance. See, for example, Henriksson and Merton (1981), Admati and Ross (1985), Admati et al. (1986), and Connor and Korajczyk (1986).
401

The Review of Financial Studies/ v 2 n 3 1989
Let the return of the mean-variance efficient portfolio be expressed as
rE= rE + mfn + y
where m is a timing signal observed by the informed investor and y is the realization of uncorrelated random noise. Similarly, the unconditional return of the mean zero residual Zj in the regression,
Rj= =JrE + Ei
can be expressed as
Zi= Sj + 2I j N
where s. is a selection signal observed by the informed investor and zj is the realization of uncorrelated noise. The private information signals, m and sj, are observed before trading in the period and are mean zero by definition.
The information structure is summarized by the equations
Rj =J /:( E + mh + y)+ Sj+
for individual assets and for the evaluated portfolio by
P= p(l E+ m + ) ?p + :p
where
N N
SP iX and = j 111=
which implies Zp = sp + i,p. Note that the portfolio-weighted averages of the Zj's and Sj's of constant-weight portfolios have unconditional expec- tations of zero because of the efficiency of the benchmark and the inde- pendence of .j and z;. The portfolios of informed investors, by contrast, change dynamically in response to information. We represent this in a single period as a random vector of portfolio weights. Such portfolios necessarily have -p's with means of zero but may have -'s with nonzero expected values if the portfolio weights are correlated with their respective Sij)S.
To summarize the information structure for nontradable wealth, we first separate the ratio WH/WO into a market and nonmarket component,
WH/WO = aH + fHrE + C1H
where 3H is the population regression coefficient of WH/WO on rE. As with the tradable assets, we assume that (H = SH + ZH1 where -H is observable.
All the Sj's, s'S, and y are assumed to be jointly normal. Hence, the random vector (, ..., EN, C, rE) is multivariate normally distributed, both unconditionally and conditionally, with unconditional mean (0, 0, . . . , 0, rE) and mean I= (s1, . . . SN, SH, rE + m) conditional on private information.
402

Portfolio Performance Evaluation
Given this information structure, it is possible to characterize the optimal portfolio of the evaluated investor. This follows directly from the standard first order conditions for portfolio optimality,
E[U'(W+ WH)R4= O
Using Stein's Lemma,5 this can be rewritten as6 E(RII) = a(I)cov(W+ WH, RII) (8)
= aWocov(Rp + RH, RII) where the positive parameter a= a(I), termed "the Rubinstein (1973) measure of absolute risk aversion," is defined by
a(I) E[U"(W+ WE) IJ] E[U'(W+ WH)I1]
The informed investor is said to have decreasing (increasing) Rubinstein risk aversion if this measure is a monotonically decreasing (increasing) function of expected utility. This means that with decreasing Rubinstein risk aversion, information that increases (decreases) E[ U( W + WH) I 1] will decrease (increase) a(I).
Section 3 discusses estimation problems that exist for investors with timing information. It is assumed in this analysis that the investor always increases his beta as his information about the market becomes more favorable (i.e., dpl/dm > 0). As we discuss in Section 5, this behavioral assumption does not hold for all utility functions. However, as Lemma 2 demonstrates, investors with independent timing and selectivity infor- mation and nonincreasing Rubinstein absolute-risk aversion will behave in this manner.
Lemma 2. If an investor has independent timing and selectivity infor- mation and nonincreasing Rubinstein absolute risk aversion, then d3P/ am> O.
Proof See the Appendix. e
3. Timing-Related Estimation Problems and Their Solutions
3.1 The bias-in-beta component Consider an investor with timing information but no selectivity informa- tion, as defined by the model in Section 2. We now formally demonstrate the result, illustrated in Figure 1, that a superior investor may display a negative Jensen measure. Here, we assume that the beta response function
I cov[iu, g(u)] = E[g'(D)]cov(ri, v) if g( ) is continuously differentiable, all expectations are finite, and (ui, v) is bivariate normally distributed. See Stein (1973) or Rubinstein (1973) for a proof.
6 The intermediate algebraic steps can be found in Grinblatt and Titman (1983, p. 501).
403

The Review of Financial Studies/ v 2 n 3 1989
is monotonically increasing in the timing signal and symmetric about the long-run target beta, denoted ,Bp, that is,
OP = OP + f(m)
wheref(m) = -f(-m),f(O) = 0, and f'(m) = d3pl/dm > 0.
This model of beta adjustment implies [after substitution into Equation (1)] that
p= pPrE + f('i )(PE + m+ y) + Zp
The large-sample least-squares estimate of the Jensen measure beta is then
b = cov(rp, rE) P a2
-pE + cov[(3p -p)(rE + m + 5), rE] + cov(p, rE) a2 0'2 2
- J f E[(fOp - fp) rE E] E[f(m) (M + y)2]
-~~~~~~~~~~~ 1 p 2 + 2
=p + - COV(fp, rE)
CE
which tends to overestimate the average risk of the portfolio by a factor proportional to the timing component.
Substituting the above expression for bp into Equation (4) yields the large-sample estimate of the Jensen measure,
(1 - )cov(-p, rE)
The positive derivative forf(*) implies a positive timing component. Hence, this expression is negative for positive timing [cov(,Bp, rE) > 0] if the absolute value of the Sharpe ratio of the benchmark, rE/oE, exceeds one. In terms of our decomposition, we have shown that the bias-in-beta com- ponent can be negative and of larger magnitude than the timing compo- nent.7
3.2 Period weighting measures
This defect of the Jensen measure, that it may assign negative performance to market timers, is overcome by the Cornell, selectivity, and timing mea-
7 If f(m) = agplam < 0, so that the investor times perversely, f3p will be underestimated in large samples. If this is the case, the analysis above indicates that the positive bias-in-beta component would dominate the negative timing component if I4 > oE, resulting in a positive Jensen measure. The Jensen measure would thus correctly identify the investor as having superior information, but it would fail to indicate that he was using the information in a contrary manner-to lower returns rather than to increase them.
404

Portfolio Performance Evaluation
sures at the cost of acquiring information about the security holdings of the evaluated portfolio. This subsection introduces a new measure that does not require the observation of portfolio holdings and is not subject to this timing-related problem.
We begin by studying a general class of "period weighting" performance measures, which are weighted sums of the period-by-period portfolio excess returns:
T
a* wtrpt (9)
where wt = w(rEt, T) satisfies
plim WtrEt = 0 (10)
of which the Jensen measure is a special case.8 To ensure that the measure's variance converges to zero as T approaches infinity, the weights, wt, are scaled to sum to one and each weight is assumed to approach zero at a sufficiently rapid rate as the time series gets large.
To show that the Jensen measure is a period weighting measure,9 let
VE - (r Et-E (11) wt = ~ TVE
where VE denotes the (maximum-likelihood) sample variance of r., . . , rET and rE the sample mean. Using the weights from Equation (11), it is easy to verify that the weights (11) satisfy condition (10). Substituting Equation (11) into Equation (9) yields
T
wtrpt = p-bp* E the (small-sample) Jensen measure
where r* and bp* are, respectively, the sample mean and the sample beta of the portfolio returns rpl, . , rpT.
8 Many of the results in the next three sections assume that the timing signal is uncorrelated with each of the selectivity signals (which may be correlated with each other). This has been a fairly standard assumption in the performance literature [e.g., see Jensen (1972) and Admati et al. (1986)]. An example of a selectivity signal that provides no information about the market would be inside information about which of two defense contractors will win a large government contract. Good news to one firm is offset by bad news to the other, so that the overall effect on the economy is unchanged. While information of this type certainly exists, it is unreasonable to assume that all selectivity signals are independent of information about the broader economy. For instance, inside information that the United Auto Workers will strike General Motors affects EGM, but it also has repercussions throughout the economy and can thus affect the "market return." Correlated timing and selectivity information, however, presents technical difficulties in generalizing some of the subsequent results. The technical problems, which only arise when there are wealth effects in addition to correlated timing and selectivity information, are discussed in more detail in later sections.
9 The intercept in the Treynor and Mazuy (1966) regression also falls in this class and is subject to the same bias-in-beta problem as the Jensen measure.
405

The Review of Financial Stuidies tv 2 n1 3 1989
For large rEt, the weights (11) implicit in the Jensen measure are negative. For a positive market timer, the large positive portfolio returns that tend to occur when the benchmark's return is extremely high are multiplied by negative weights, reducing the Jensen measure and possibly making it negative. This suggests that an improved measure, which would not yield this perverse result, could be constructed by replacing the negative weights with positive weights and adjusting the other weights accordingly. This intuition is confirmed in the following proposition:
Proposition 2. Let
T
O*= Wtpt t1
where
Wt = (PEty T)
T
plim wtrEt = 0
plim[Twt] I oo
define a class ofperformance measures calledperiod weighting measures. a. The large-sample period weighting measure of an uninformed inves-
tor's portfolio, plimfio *] = 0. b. plimfci *1 > Ofor the portfolio of an informed investor with selectivity
ability but no timing ability. c. If the period weights additionally satisfy ivt > 0, t = 1, . . ., T, and if
op3/o9mt > Ofor all realizations of the signals of an informed investor with selectivity and/or independent timing information, then plimfi6 *> 0.
Proof See the Appendix. a
Thus, the positive period weighting measures assign zero performance to uninformed investors and positive performance to selectivity ability or timing ability or both, provided that the selectivity and timing information is independent and the investor is a positive market timer. Technical problems associated with wealth effects prevent us from relaxing these assumptions. However, as Proposition Al in the Appendix demonstrates, the positive period weighting measure is always positive for informed investors with constant absolute-risk aversion, even when timing and selec- tivity information is correlated.
An interesting interpretation of the period weighting measures can be
406
Portfolio Performance Evaluation
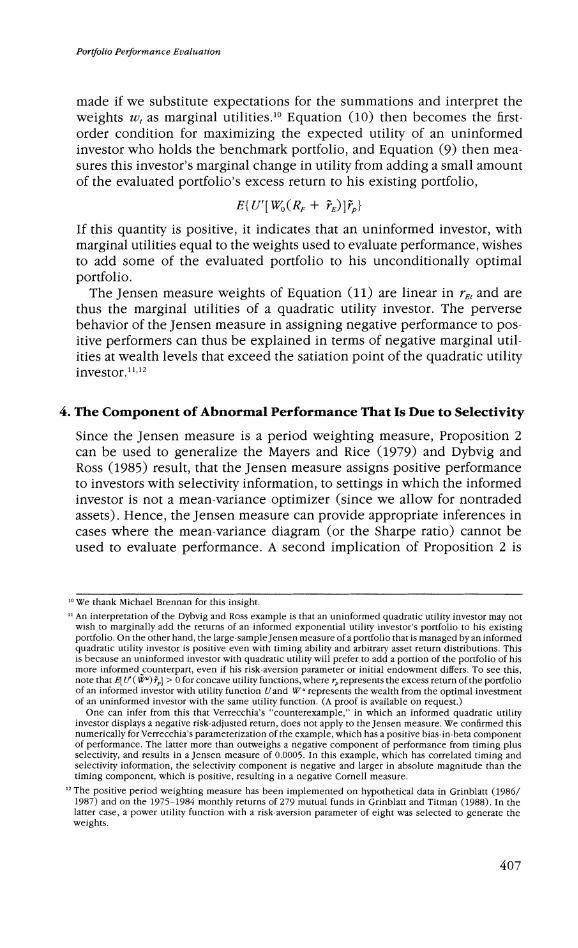
made if we substitute expectations for the summations and interpret the weights wt as marginal utilities.10 Equation (10) then becomes the first- order condition for maximizing the expected utility of an uninformed investor who holds the benchmark portfolio, and Equation (9) then mea- sures this investor's marginal change in utility from adding a small amount of the evaluated portfolio's excess return to his existing portfolio,
E{ U'[ WO(RF + rE)]rp}
If this quantity is positive, it indicates that an uninformed investor, with marginal utilities equal to the weights used to evaluate performance, wishes to add some of the evaluated portfolio to his unconditionally optimal portfolio.
The Jensen measure weights of Equation (11) are linear in rEt and are thus the marginal utilities of a quadratic utility investor. The perverse behavior of the Jensen measure in assigning negative performance to pos- itive performers can thus be explained in terms of negative marginal util- ities at wealth levels that exceed the satiation point of the quadratic utility investor.11,12
4. The Component of Abnormal Performance That Is Due to Selectivity
Since the Jensen measure is a period weighting measure, Proposition 2 can be used to generalize the Mayers and Rice (1979) and Dybvig and Ross (1985) result, that the Jensen measure assigns positive performance to investors with selectivity information, to settings in which the informed investor is not a mean-variance optimizer (since we allow for nontraded assets). Hence, the Jensen measure can provide appropriate inferences in cases where the mean-variance diagram (or the Sharpe ratio) cannot be used to evaluate performance. A second implication of Proposition 2 is
10We thank Michael Brennan for this insight. 11 An interpretation of the Dybvig and Ross example is that an uninformed quadratic utility investor may not
wish to marginally add the returns of an informed exponential utility investor's portfolio to his existing portfolio. On the other hand, the large-sample Jensen measure of a portfolio that is managed by an informed quadratic utility investor is positive even with timing ability and arbitrary asset return distributions. This is because an uninformed investor with quadratic utility will prefer to add a portion of the portfolio of his more informed counterpart, even if his risk-aversion parameter or initial endowment differs. To see this, note that Et i ( Wu) rP] > 0 for concave utility functions, where rp represents the excess return of the portfolio of an informed investor with utility function Uand Wu represents the wealth from the optimal investment of an uninformed investor with the same utility function. (A proof is available on request.)
One can infer from this that Verrecchia's "counterexample," in which an informed quadratic utility investor displays a negative risk-adjusted return, does not apply to the Jensen measure. We confirmed this numerically for Verrecchia's parameterization of the example, which has a positive bias-in-beta component of performance. The latter more than outweighs a negative component of performance from timing plus selectivity, and results in a Jensen measure of 0.0005. In this example, which has correlated timing and selectivity information, the selectivity component is negative and larger in absolute magnitude than the timing component, which is positive, resulting in a negative Cornell measure.
12 The positive period weighting measure has been implemented on hypothetical data in Grinblatt (1986/ 1987) and on the 1975-1984 monthly returns of 279 mutual funds in Grinblatt and Titman (1988). In the latter case, a power utility function with a risk-aversion parameter of eight was selected to generate the weights.
407

The Review of Financial Studies/ v 2 n 3 1989
that the selectivity component is positive if the timing and selectivity signals are independent.13 These results are developed in two corollaries.
Corollary 1. In the absence of timing information, the asymptotic Jensen, Cornell, and selectivity measures (and, hence, the selectivity component) of an informed investor's portfolio are positive.
Proof. The result immediately follows from part b of Proposition 2 for the Jensen measure, since, by Equation (10), the Jensen measure is a period weighting measure. In addition, when there is no timing information, the timing component is zero by Proposition 1, and by Lemma 1 the bias-in- beta component is zero. In conjunction with Equations (4), (5), and (7), this implies that the asymptotic values of all three measures are identical, since each equals the selectivity component. u
Corollary 2. The selectivity component of performance of an informed investor's portfolio (and, hence, the asymptotic selectivity measure), is positive if the investor's selectivity signalfor each asset is distributed inde- pendently of the timing signal.
Proof. This is identical to the proof of part (b) of Proposition 2, which follows from the proof of part (c). -
5. The Timing Component of Abnormal Performance
5.1 Verrecchia's example: the Giffen good effect Verrecchia (1980), responding to some of the restrictive assumptions in the Mayers and Rice model, presented a counterexample to what he called the "broader hypothesis" that "the superior investor will on average achieve a greater return than the uninformed investors expect." Corollaries 1 and 2 imply that the negative performance of an informed investor in Verrec- chia's counterexample must result from timing information, since his assumption of quadratic utility has the same implications for portfolio choice as our assumption that returns are normally distributed. We contend that Verrecchia's critique is linked to perverse income or wealth effects [in the sense of the income/substitution effects and the superior/inferior goods classification in Hicks (1939)]. In Verrecchia's example, the preferences of the informed investor make the efficient portfolio of risky assets a Giffen good (i.e., less is purchased as its expected return increases). Quadratic utility functions have the property that increases in wealth always increase risk aversion, so that information that increases expected wealth, such as a signal of a large "market" return (i.e., large m), can make an investor with quadratic utility so much more averse to risk that he holds less of that
13 Proposition A2 in the Appendix demonstrates that with constant absolute-risk aversion, the selectivity component of performance is positive, even with correlated timing and selectivity information.
408

Portfolio Performance Evaluation
portfolio, rather than more. This wealth effect can induce a negative cor- relation between ,Bp and rE and hence a negative timing component.
This type of behavior is probably pathological. One expects the portfolio beta of most investors to be an increasing, not a decreasing, function of m. If this is the case, an investor with timing information exhibits a positive timing component, as shown in the next proposition.
Proposition 3. The timing component is positive if fp3/Om > O for all realizations of the signals of an investor with timing information and possibly uncorrelated selectivity information.
Proof It suffices to show that E(Opih) > 0. Using the multivariate version of Stein's lemma,14
E (op)= FC ()var(mtz) + E (r)
= t ()var(tm) > 0 O
Corollary 3. Under the conditions specified in Proposition 3, the large- sample timing and Cornell measures of an informed investor will be pos- itive.
Proof. This follows trivially from Equations (6) and (7), Corollary 2, and Proposition 3. U
One can examine the class of utility functions that make aOp/lm > 0 and ask whether this class is broad enough to represent the behavior of most investors. Lemma 2 demonstrated that if the timing and selectivity signals are independent, a sufficient (but not necessary) condition for this inequality to hold is that the investor have nonincreasing Rubinstein abso- lute-risk aversion (defined in Section 2).
Corollary 4. The timing component of the portfolio of an investor with independent timing and selectivity information and nonincreasing Ru- binstein absolute-risk aversion (and hence the large-sample timing and Cornell measures) is positive.
Proof This follows trivially from Lemma 2, Corollary 2, and Proposition 3. .
14 Let v = (i .. NDJ.
cov[ri, g(iV)] = (v E jcov( i>,D) 1= 1 1
if g( ) is a continuously differentiable function, all expectations are finite, and ( ii, v) is multivariate normally distributed. See Losq and Chateau (1982) for a proof.
409

The Review of Financial Studies/ v 2 n 3 1989
We have not been able to prove that Corollary 4 generalizes to cases where timing and selectivity information are correlated. However, the fol- lowing proposition proves that the sum of timing and selectivity (and by extension, the large-sample Cornell measure) is positive in this case for an informed investor with nonincreasing Rubinstein absolute-risk aver- sion.51'16
Proposition 4. If all assets are tradable, and if an informed investor exhibits nonincreasing Rubinstein absolute-risk aversion, then the sum of his portfolio's timing and selectivity components (and, hence, its large- sample Cornell measure) is positive.
Proof See the Appendix. a
The requirement in Proposition 4 that all assets be tradable is dictated by the same technical difficulties that prevent a generalization of Propo- sitions 2 and 3 to a model in which timing and selectivity signals are correlated.17 However, counterexamples to Propositions 2 to 4 in a more general setting are probably unrealistic, since they are necessarily founded on the unlikely possibility that changes in risk aversion will dominate substitution effects.
5.2 Why the timing and selectivity components are fundamentally different Note that both timing and selectivity signals can affect expected wealth and hence the risk aversion of an informed investor. However, with inde- pendent timing and selectivity signals, only the timing information can potentially lead to pathological behavior. Consider, for example, the case of an investor who, with neutral selectivity information [i.e., E(-) = 0], holds the mean-variance efficient portfolio along with IBM stock to hedge against variability in the value of his human capital. If this investor receives favorable private information about IBM that is independent of the "market," his expected wealth increases. However, regardless of how his risk aversion increases or decreases in response to this change in expected wealth, he will always increase his holdings of IBM when he receives favorable private information. To illustrate this, consider the self-financing portfolio con-
15 In a complete markets framework, Verrecchia (1980) implicitly demonstrated that the sum of the timing and selectivity components of the portfolio of an informed investor with constant absolute- or relative-risk aversion is positive, even if the timing and selectivity signals are correlated.
16 Furthermore, Proposition A2 in the Appendix demonstrates that with constant absolute-risk aversion, the timing component of abnormal performance is positive, even with correlated timing and selectivity infor- mation.
17 In both cases, there are realizations of information for which the investor is shorting an asset (but shorting less than for the average information realization) when he knows its expected return will be slightly larger than average. This is because the short position hedges unforecastable changes in the value of other assets in his portfolio-in the case of Proposition 4's generalization, the nontraded assets. For these realizations, an increase in the expected return of the asset decreases expected utility and makes him more risk-averse. With hedging now relatively more valuable, he may increase his short position in response to the infor- mation rather than decrease it.
410

Portfolio Performance Evaluation
sisting of $1 long in IBM stock, 3IBM dollars short in the efficient portfolio, and 1 -0IBM dollars short in the risk-free asset, which has end-of-period value EIBM With neutral information, this self-financing portfolio has an expected end-of-period value of zero (i.e., no risk premium) and the inves- tor will hold the amount of this portfolio that minimizes the unsystematic variance of his total wealth (tradable plus nontradable "nonmarket" risk). Since the portfolio weights of this minimum unsystematic variance port- folio are fixed, changes in the portfolio in response to information always increase risk and will only be taken to increase expected return. Hence, favorable information about IBM always increases the investor's holdings of IBM's unsystematic disturbance, while unfavorable information always decreases the investor's holdings. The same cannot be said for information about the unconditional efficient portfolio, since it carries a risk premium rE. Thus, the different effects of timing and selectivity ability on measured performance stem from timing information being related to priced risk and selectivity information being related to nonpriced risk.
6. The Appropriate Benchmark Portfolio
The preceding sections present conditions under which the unconditional mean-variance efficient portfolio of tradable assets can be used to evaluate portfolio performance. This benchmark portfolio is used with all the mea- sures analyzed here except for the Cornell measure. The intuition for the appropriateness of this portfolio is quite simple. The efficiency of any particular index portfolio will be rejected if a portfolio with constant weights realizes a nonzero performance measure with respect to it.18 Hence, if a managed portfolio realizes significant positive performance and if the effi- ciency of the index used to compute the performance cannot be rejected, the positive performance must be due to portfolio weights that change in response to superior information.
In his reply to Mayers and Rice (1979), Roll (1979) suggested that choosing an appropriate benchmark portfolio may be particularly difficult if uninformed investors need to include real estate and other nonequity assets in their optimal portfolio, as the CAPM suggests. However, our results indicate that the appropriate benchmark portfolio consists only of those assets that can be included in the portfolio being evaluated. For example, portfolio managers who select the oil stocks in a larger portfolio can be evaluated with a mean-variance efficient benchmark portfolio consisting only of oil stocks.19 This is because, from the perspective of these managers, non-oil investments in the complete portfolio may be regarded as non- traded assets. A related example is the case of partially delegated portfolio
18 For a strategy with constant portfolio weights, all the measures that employ benchmark portfolios, with the exception of the timing measure, are asymptotically identical, regardless of the efficiency of the benchmark.
19 This assumes that the covariance between the personally managed portion of the client's wealth and that portion under the jurisdiction of the manager is independent of the manager's information.
411

The Review of Financial Studies/ v 2 n1 3 1989
management, where an investment manager, aware that his clients invest a portion of their assets on their own or with other professionals, regards those investments as nontraded assets. A rational manager should select a portfolio that partly hedges the unmanaged wealth of a representative client. Our results suggest that portfolio performance can be evaluated in these circumstances.20
7. Summary and Conclusions
The ability to evaluate portfolio performance has been questioned in a number of papers. We analyzed the various criticisms of existing perfor- mance measures and introduced new measures that we believe have desir- able properties.
We extended the well-known result that an investor with selectivity but without timing information achieves a positive Jensen measure to settings in which the investor holds nontraded assets, so that the evaluated portfolio is not mean-variance efficient. We also showed that the counterexample to what Verrecchia (1980) called the "Mayers/Rice conjecture" occurs only for investors with timing information who have (what we consider) patho- logical preferences. Finally, we showed that the problems with the Jensen measure resulting from timing-related estimation problems, advanced by Jensen (1972), Dybvig and Ross (1985), and Admati and Ross (1985) can be overcome with a new measure that we call the positive period weighting measure.
This article also addressed the issue of the appropriate benchmark port- folio. Because of its mathematical (and not its equilibrium) properties, the unconditional mean-variance efficient portfolio of assets that are con- sidered tradable by the evaluated investor provides correct inferences about the investor's performance. This indicates that the missing-asset problem, which is important in tests of the CAPM, does not apply to the evaluation of managed portfolios that consist of traded stocks or bonds.
Roll's (1977) critique of CAPM tests led some authors to question the appropriateness of the Jensen methodology.21 However, our analysis illus- trated that links between performance measures and particular equilibrium models are not necessary. Equilibrium models, such as the arbitrage pricing theory, do nothing more than suggest candidates for mean-variance effi- cient benchmarks.22
20 Performance may also be detectable with an efficient benchmark portfolio that includes additional assets not contained in the investor's choice set (e.g., the efficient portfolio of NYSE stocks is an appropriate benchmark for evaluating a portfolio of NYSE oil stocks). If the investor's information provides no infor- mation about either the unconditional mean-variance efficient portfolio of assets within his choice set or the larger portfolio used as the benchmark, our propositions apply to measures that use the larger bench- mark. We have not, however, been able to determine the extent to which this can be generalized.
21 See, for example, Cornell (1979, p. 390) and Wallace (1980). 22 This does not necessarily imply that a one-factor model is superior to the multifactor approach employed
by Lehmann and Modest (1987) and Connor and Korajczyk (1986). Indeed, one may prefer multiple index benchmarks because they generally yield more powerful test statistics and intuition suggests that they are less likely to be inefficient than a single index. The propositions in this article apply directly to multiple indexes if the index portfolios are locally mean-variance efficient, as defined in Grinblatt and Titman (1987).
412

Portfolio Performance Evaluation
An i.i.d. return-generating process was assumed for this analysis. If unconditional returns are nonstationary, a portfolio with constant weights that is ex ante efficient for each time period may not exist. However, the Jensen measure and the positive period weighting measure may still be of interest in this case. After all, many investors would like to know if there are strategies with changing portfolio weights that dominate simple buy- and-hold strategies or rebalancing strategies with constant portfolio weights. If some evaluated portfolios exhibit positive Jensen or positive period weighting measures, it indicates that either the managers of these funds have special information or that the composition of the mean-variance efficient portfolio is changing over time. In either case, the evidence indi- cates that simple passive strategies can be beaten.
Appendix
This Appendix is organized in the following order:
1. Preliminaries for all but Proposition 5 2. Proof of Lemma 2 3. Proof of Proposition 2 4. Proposition Al 5. Proposition A2 6. Proof of Proposition 4
All of the results here assume that returns and information are multivariate normal and that the informed investor maximizes the expected utility of end-of-period wealth.
Preliminaries
The proofs presented here, except for the proof of Proposition 4, are simplified without limiting their generality by considering an equivalent economy formed from N portfolios of the tradable risky assets. In the repackaged securities market, the excess returns of the redefined assets can be written as
R [ [ 1 ] + [ ]
Prior to repackaging, the efficient portfolio's weighting of the N ("market model") residuals was zero, implying linear dependence. This depen- dence has been eliminated in the repackaged market.
We also assume, without loss of generality, that the N X N covariance
413

The Review of Financial Studies/ v 2 n 3 1989
matrix of asset returns conditioned on the information signals, V = var(y, 2T), (T denotes "transpose"), is positive definite. If Ph and .j are uncor- related, y and Zj are uncorrelated, implying that elements V1j and Vjl of this matrix are zero for j 1. V-1 also has off-diagonal elements of zero in the first row and column in this case.
Letting
e = the first column of the identity matrix
a = COV(ZH, R)
S=S2 Z=Z2 an x= XQ
s z- ~~~and
the first-order condition [Equation (8)] for selecting the vector of optimal portfolio weights, x, can be rewritten as
e(IT + m) + s = aWO[Vx + (fHVlle + a)],
which yields portfolio weights
x = V-1[(e(TE + m)) + s/(aWO) - (fHWlje + a)] (Al)
Note that a, the Rubinstein risk-aversion measure, is unconditionally a random variable because it depends on information. An exception to this, in Propositions Al and A2, occurs when the investor has constant absolute- risk aversion, in which case the Arrow-Pratt and Rubinstein measures are identical.
In addition to Equation (Al), Propositions (Al) and (A2) make use of the following
Lemma Al. If a symmetric matrix M is positive definite, then for all i, the product of the ith diagonal element ofM and that in M-1 equals or exceeds one.
Proof Available from authors on request.
Proof of Lemma 2 By Equation (Al),
(eTV-1e)O(T + m) + eWV1s - eTV1(HVlle + a)
_ _ 1 a~oa 1 d m a2 W0 d m aaWO[fp + e71V-1(3HVlje + v)] + eTVle
lO 04Ma 1o =- --dG(3p + ,) + aWeTV-le
414

Portfolio Performance Evaluation
with the last equality following from the independence of the timing and selectivity signals, which makes the (1,1) element of V-1 equal to 1/V11 and the first entry of a zero. This expression is positive because the qua- dratic form on the right side is 1/var(y) and da(I)/am is zero or of the opposite sign of fp + H. To see the latter, note that if fp + f3H is positive (negative), an increase (decrease) in m, ceteris paribus, results in an expected utility increase even if the investor's portfolio weights do not change. Consequently, expected utility increases (and risk aversion decreases) even more after portfolio weights shift in response to these information changes. n
Proof of Proposition 2 The large-sample expectations encountered here easily translate into a more notationally convenient "one-period framework." Because rEt has a stationary distribution, we can view the infinite sequence of time-series drawings of rEt and Twt as random drawings from a population distribution. In this framework, we use the realizations of iw and r to represent some time period fs outcome of Tw, and rEt. Thus, E(iw) = 1, E(&*) = E(wrp), and E(&7E) = 0.
For parts (a) and (b), consider an investor who lacks timing ability. In this case, we first show that the period weighting measure equals the selectivity component.
E(iv-Pp) = E[itv(OpPE + Zp)] = E( wrE)E(/3p) + E(iw)E(Zp) = E(iv-)E(Zp) = E(Zp) (A2)
where the first equality follows from Equation (1) and, in the absence of timing ability, the second follows from the independence of Zp and w and of ilv and op.
a. Equation (A2) is zero since E(Zp) = 0 by the proof of Proposition 1. b. Equation (A2) is positive, since, with selectivity ability, E(Zp) is shown
to be positive by substituting "1" for "iwv" in part (c) and following the steps in the proof of part (c), below, that demonstrate E(&ip) > 0.
c. E(Wiwp) = E(tivEOp) + E(WEP) by Equation (1).
We first demonstrate that E(wip) = E(ivp) = E(i7ST*) > 0. Using Equation (Al),
E(&gp) = E[ iE
a ] + E ( w ) E[zTV-1(fHVlje + a)]
With selectivity signals that are independent of the timing signal, the off- diagonal elements in the first row and column of V-1 are zero. Hence, the term inside the first expectation on the right side of the equation is zero. The last expectation is zero because s has a mean of zero and is indepen- dent of w. Hence,
415

The Review of Financial Studies/ v 2 n 3 1989
E(ivHp) = E WS )-' > O
because a > 0, w > 0, and V-1 is positive definite. The proof is completed by demonstrating that E(w&Efp) > 0. By the law
of iterated expectations,
E( WrEiv p) = ErE ( wrEJp )
and since ivrE is nonstochastic conditional on rE,
E(&PE#p) = ErE[E(lii'Ej rE)E(flpI rE)]
= E{rE:rE?O}[E(&iEI rE)E(/p I rE)]Pr[rE _ 0]
+ E{ rE: rE<o}[E(i W rEI rE)]E(1pjI rE) Pr[ rE < 0]
> E{ rE: rE2O}[E(i#Ej rE|r)p]Pr[rE >- 0]
+ El rE.rE<O}[E(iWirEI rE)3P ]Pr[rE < 0]
where 3p* = E(Op3I r = 0). The inequality follows from iw > 0 and aOplo/m > 0. The latter assumption makes E(p3I rE) an increasing function of rE.23
Note that Op* is independent of PE. Thus,
E ( iwvjp) > p E{rE: rE2O}[E( ivrEI rE)]Pr[rE - 0]
+ fp*E{rE rE<O}[E(wiEI rE)]Pr[rE < 0)
= #p*E(ziv-E) = 0
since E(wivE) = 0. n
Proposition Al. If the Rubinstein measure of absolute risk aversion, a, is constant over all the information realizations of an informed investor, then the expectation of the investor's positive period weighting measure, E(wrp), is positive.
Proof Using Equation (1)
E(ivwrp) = E(wPEOp) + E(t wET*)
where the first element of i is 0 and the ith element is Zi. Using Equation
23 Let g(m I rE) represent the conditional density function of mz given rE = rE. mh and rE are normally distributed. Thus, for any constant c > 0, there exists a unique critical value m* = m* (rE, c) where the conditional density functions g(m I rE) and g(m I rE + c) are equal (i.e., where they cross). For all m > m*, g(m I rE + c) > g(mI rE). For m < m*, g(mI rE + c) < g(mI rE). This implies that the conditional expectation of m given PE = rE + c exceeds the conditional expectation of m given rE = rE. It also implies that any monotonic increasing function of m has the same property. Since Op is a monotonic increasing function of m holding the selectivity signals constant, and since the selectivity signal vector is independent of rE, E(P I rE + c) > E(1p I r6).
416

Portfolio Performance Evaluation
(Al) and noting that &,E is nonstochastic conditional on rE, the timing term
eTV-lePE E(iv aW= E{w4 - ViTV(fHVlle + a)}
+ ErE {wrA4e7V-leE(i I E= rE) + eTV-1E(gIrE= rE)]}
- ___ 2
1var ( t) TV1E (9t) aErE{ wrE[(eTV e) 2 + eTV1 2 II a O L E CE J
> E E [l -E(i)
/ ~2
=E r [eTV-1(-Ve + V11e)]
This is positive because (wr2E)/(G2 aWO) is positive, and Lemma Al implies that the latter factor is positive. The last equality stems from Zj and rEbeing uncorrelated, j = 2, . . ., N, which implies
E -E(?y) = -(Ve - V1le)
Using Equation (Al), the selectivity term,
E(i-*Tk) = E 1w a E - e V(lH3Vle + a)]
1 + E[iv( VVs + iMV1-le)]
a W0
a WErE[ WE( V-s + n-V1-le I rE)]
1 - E{W[E(V'V-l9) + E(,M7TV-le)]} a W0
1 -a E{z2E(.YV-19) + E(ms7V-le)]} > 0 (A3)
a W0
The second equality stems from the zero mean of Z and iw being nonsto- chastic conditional on rE. In the third equality, the independence of e and rE implies the equality of the unconditional and conditional expectations. To see this, regress m and s onto rE and note that the covariances of the regression residuals with e are identical to the covariances of mn and s with e. Finally, the first interior expectation in Equation (A3) is positive because its argument is a quadratic form in a positive definite matrix. The second interior expectation is positive by Lemma Al, as demonstrated in the first
417

The Review of Financial Studies/ v 2 n 3 1989
part of the proof. Since w > 0, the exterior expectation is positive as well. e
Proposition A2. If the Rubinstein measure of absolute risk aversion, a, is constant over all the information realizations of an informed investor, then both the investor's selectivity component and timing component are positive.
Proof.
1. By Equation (Al), the selectivity component of performance is
E(9p) = E(gT)
E(7V- l E) E[TV-lH le + a)] + E[9V-19 + 9T1clih)
- -[E(STV-1S) + E(ms Vle)] a W0
> W E(M A V-1E) a W0
= (-eTV + VlleT)V- le
which is positive by Lemma Al. The last equality stems from -, and rEbeing uncorrelated, j = 2, . . ., N, which implies
E(tms ) = -E(YT) = (e - Vl1eT)
2. From Equation (Al), the timing component,
E(/3pm) = E[w eTV- 1(ei + s)m]
aWW0 + E[e V erEm ~~~~~~~~~~~~~~~~+ eTV1Q3HVlle +vm
= [(eTV-le)var(n) + eTV-lE(sm)] a W0
1 > 1 eTV-1E(sm)
aWo
which is positive, as shown in part (1). m
Proof of Proposition 4 To simplify the proof without loss of generality, redefine the tradable primitive assets in the economy so that
cov(Q5+ O43j5 + Z5) = 0 for i j
418

Portfolio Performance Evaluation
By forming portfolios, one can always repackage the primitive assets to have this covariance structure, although this will not permit the repack- aging used for the other proofs. Investors are indifferent to such repack- agings since they can be undone in their personal portfolios. Moreover, if the sum of the timing and selectivity components of performance is positive in the repackaged economy, it is positive in the original economy because the two sums are identical.
This repackaging allows us to rewrite the standard first-order condition, Equation (8), as
R, + Qm + s, = aW0xvar(_y + Zj) (A4)
Without loss of generality, one can express the deviations of conditional mean returns from unconditional mean returns with the factor model
N
flft+ s=; flf for j =1,...,N i=l
where the normally distributed factors f1, .. ., fN are normalized to have zero mean and zero covariance with each other.
Taking the partial derivative of Equation (A4) with respect tofk, holding f constant for i #4 k, implies
yjk= a W0var (fy + zj) yxj - + 491, aO'fk dafk
or
dxj __j2 _ Xjyjk d9a
aIkf, aW0var(f5 + Hi) a Ofk
Summing over j and noting that yjk is a constant yields
d_Yjk) _
[N N 1k _ _ k X 1d8 fk aL W0var(fl + 2;) d fk J
This is positive because with nonincreasing Rubinstein absolute-risk aver- N
sion, aa/dfk is zero or of opposite sign of : Xjyjk. Thus, the sum of the j=1
timing and selectivity components of performance,
N N N \
E x(-R)=E 2; -'j7jEkk
is positive because
E( Xfjjkfk) E= .i=,2kcov( x_jyjk, Ifk i # k)
419

The Review of Finanicial Studies / v 2 n 3 1989
and the conditional covariance is positive because
N
a 2; 48jyk N _ j=l = 9 8(Xjtjk) o ~~ ~Yk) -
; ~ >
9fk j=l afk
as shown above. u
References Admati, A., and S. Ross, 1985, "Measuring Investment Performance in a Rational Expectations Equilibrium
Model," Journal of Business, 58, 1-26.
Admati, A., S. Bhattacharya, P. Pfleiderer, and S. Ross, 1986, "On Timing and Selectivity,"Journal of Finance, 41,715-730.
Connor, G., and R. Korajczyk, 1986, "Performance Measurement with the Arbitrage Pricing Theory: A New Framework for Analysis," Journal of Financial Economics, 15, 373-394.
Copeland, T., and D. Mayers, 1982, "The Value Line Enigma (1965--1978): A Case Study of Performance Evaluation Issues," Journal of Financial Economics, 10, 289-322.
Cornell, B., 1979, "Asymmetric Information and Portfolio Performance Measurement,"Journal of Financial Economics, 7, 381-391.
Dybvig, P., and S. Ross, 1985, "Differential Information and Performance Measurement using a Security Market Line," Journal of Finance, 40, 383-399.
Grinblatt, M., 1986/1987, "How to Evaluate a Portfolio Manager," Financial Markets and Portfolio Man- agement, 1(2), 97-112.
Grinblatt, M., and S. Titman, 1983, "Factor Pricing in a Finite Economy," Journal of Financial Economics, 12,497-507.
Grinblatt, M., and S. Titman, 1987, "The Relation Between Mean-Variance Efficiency and Arbitrage Pricing," Journal of Business, 60, 97-112.
Grinblatt, M., and S. Titman, 1988, "The Evaluation of Mutual Fund Performance: An Analysis of Monthly Returns," working paper, University of California, Los Angeles.
Grinblatt, M., and S. Titman, 1989, "Mutual Fund Performance: An Analysis of Quarterly Portfolio Holdings," Journal of Business, 62, 393-416.
Henriksson, R., and R. Merton, 1981, "On Market Timing and Investment Performance II: Statistical Pro- cedures for Evaluating Forecasting Skills," Journal of Business, 54, 513-533.
Hicks, J., 1939, Value and Capital, Oxford University Press, London.
Jensen, M., 1968, "The Performance of Mutual Funds in the Period 1945-1964," Journal of Finance, 23, 389-416.
Jensen, M., 1969, "Risk, the Pricing of Capital Assets, and the Evaluation of Investment Portfolios," Journal of Business, 42, 167-247.
Jensen, M., 1972, "Optimal Utilization of Market Forecasts and the Evaluation of Investment Portfolio Performance," in G. Szego and K. Shell (eds.), MathematicalMethods in Investment and Finance, North Holland, Amsterdam.
Lehmann, B., and D. Modest, 1987, "Mutual Fund Performance Evaluation: A Comparison of Benchmarks and Benchmark Comparisons," Journal of Finance, 42, 233-265.
Losq, E., and J. Chateau, 1982, "A Generalization of the CAPM Based on a Property of the Covariance Operator," Journal of Financial and Quantitative Analysis, 17, 783-797.
420

Portfolio Performance Evaluation
Mayers, D., and E. Rice, 1979, "Measuring Portfolio Performance and the Empirical Content of Asset Pricing
Models," Journal of Financial Economics, 7, 3-29.
Roll, R., 1977, "A Critique of the Asset Pricing Theory's Tests; Part I: On Past and Potential Testability of
the Theory," Journal of Financial Economics, 4, 129-176.
Roll, R., 1978, "Ambiguity When Performance Is Measured by the Securities Market Line," Journal of
Finance, 33, 1051-1069.
Roll, R., 1979, "A Reply to Mayers and Rice," Journal of Financial Economics, 7, 391-400.
Rubinstein, M., 1973, "A Comparative Statics Analysis of Risk Premiums," Journal of Business, 46, 605-
615.
Sharpe, W., 1966, "Mutual Fund Performance," Journal of Business, 39, 119-138.
Stein, C., 1973, "Estimation of the Mean of a Multivariate Normal Distribution," Proceedings of the Prague
Symposium on Asymptotic Statistics.
Treynor, J., 1965, "How to Rate Management of Investment Funds," Harvard Business Review, 43, 63-75.
Treynor, J., and F. Mazuy, 1966, "Can Mutual Funds Outguess the Market?" Harvard Business Review, 44,
131-136.
Verrecchia, R., 1980, "The Mayers-Rice Conjecture: A Counterexample," Journal of Financial Economics,
8, 87-100.
Wallace, A., 1980, "Is Beta Dead?" Institutional Investor, 20, 23-30.
421