Embed Size (px)
Citation preview

Portfolio Budget Statements 2017-18
Budget Related Paper No. 1.10
Health Portfolio
Budget Initiatives and Explanations of Appropriations Specified by Outcomes
and Programs by Entity

ii
© Commonwealth of Australia as represented by the Department of Health 2017
ISBN: 978-1-76007-318-3 Online ISBN: 978-1-76007-319-0 Publications Number: 11854
Creative Commons Licence
This publication is licensed under the Creative Commons Attribution 4.0 International Public License available from https://creativecommons.org/licenses/by/4.0/legalcode (“Licence”). You must read and understand the Licence before using any material from this publication.
Restrictions
The Licence may not give you all the permissions necessary for your intended use. For example, other rights (such as publicity, privacy and moral rights) may limit how you use the material found in this publication.
The Licence does not cover, and there is no permission given for, use of any of the following material found in this publication: the Commonwealth Coat of Arms. (By way of information, the terms under which the
Coat of Arms may be used can be found at www.itsanhonour.gov.au); any logos (including the Department of Health's logo) and trademarks; any photographs and images; any signatures; and any material belonging to third parties.
Attribution
Without limiting your obligations under the Licence, the Department of Health requests that you attribute this publication in your work. Any reasonable form of words may be used provided that you: include a reference to this publication and where, practicable, the relevant page
numbers; make it clear that you have permission to use the material under the Creative Commons
Attribution 4.0 International Public License; make it clear whether or not you have changed the material used from this publication; include a copyright notice in relation to the material used. In the case of no change to the
material, the words “© Commonwealth of Australia (Department of Health) 2017” may be used. In the case where the material has been changed or adapted, the words: “Based on Commonwealth of Australia (Department of Health) material” may be used; and
do not suggest that the Department of Health endorses you or your use of the material.
Enquiries
Enquiries regarding any other use of this publication should be addressed to the Branch Manager, Communication Branch, Department of Health, GPO Box 9848, Canberra ACT 2601, or via e-mail to [email protected].

iii

iv
Abbreviations and conventions
The following notation may be used:
NEC/nec not elsewhere classified - nil .. not zero, but rounded to zero N/A not applicable (unless otherwise specified) nfp not for publication $m $ million $b $ billion
Figures in tables and in the text may be rounded. Figures in text are generally rounded to one decimal place, whereas figures in tables are generally rounded to the nearest thousand. Discrepancies in tables between totals and sums of components are due to rounding.
Enquiries
Should you have any enquiries regarding this publication please contact Director, Performance Reporting Section, Organisational Performance Branch, Department of Health on (02) 6289 7181.
Links to Portfolio Budget Statements (including Portfolio Additional Estimates Statements and Portfolio Supplementary Additional Estimates Statements) can be located on the Australian Government Budget website at: www.budget.gov.au

v
CONTENTS
User Guide to the Portfolio Budget Statements ................................................ vii
Portfolio Overview .................................................................................................. 1
Health Portfolio Overview ......................................................................................... 3
Entity Resources and Planned Performance ....................................................... 9
Department of Health .............................................................................................. 11
Australian Aged Care Quality Agency .................................................................. 151
Australian Commission on Safety and Quality in Health Care .............................. 167
Australian Digital Health Agency .......................................................................... 185
Australian Institute of Health and Welfare ............................................................ 205
Australian Radiation Protection and Nuclear Safety Agency ................................ 225
Australian Sports Anti-Doping Authority ............................................................... 243
Australian Sports Commission .............................................................................. 263
Cancer Australia ................................................................................................... 283
Food Standards Australia New Zealand ............................................................... 303
Independent Hospital Pricing Authority ................................................................ 321
National Blood Authority ....................................................................................... 339
National Health Funding Body .............................................................................. 361
National Health and Medical Research Council ................................................... 381
National Mental Health Commission ..................................................................... 401
Organ and Tissue Authority .................................................................................. 419
Professional Services Review .............................................................................. 437
Portfolio Glossary ............................................................................................... 453

vi
vii
USER GUIDE TO THE
PORTFOLIO BUDGET
STATEMENTS

viii

ix
USER GUIDE
The purpose of the 2017-18 Portfolio Budget Statements (PB Statements) is to inform Senators and Members of Parliament of the proposed allocation of resources to Government Outcomes by entities within the Portfolio. Entities receive resources from the annual appropriations acts, special appropriations (including standing appropriations and special accounts), and revenue from other sources.
A key role of the PB Statements is to facilitate the understanding of proposed annual appropriations in Appropriation Bills (No. 1 and No. 2) 2017-18 (or Appropriation (Parliamentary Departments) Bill (No. 1) 2017-18 for the parliamentary departments). In this sense, the PB Statements are Budget related papers and are declared by the Appropriation Acts to be ‘relevant documents’ to the interpretation of the Acts according to section 15AB of the Acts Interpretation Act 1901.
The PB Statements provide information, explanation and justification to enable Parliament to understand the purpose of each outcome proposed in the Bills.
As required under section 12 of the Charter of Budget Honesty Act 1998, only entities within the general government sector are included as part of the Commonwealth general government sector fiscal estimates and produce PB Statements where they receive funding (either directly or via portfolio departments) through the annual appropriation acts.
The Enhanced Commonwealth Performance Framework
The following diagram outlines the key components of the Enhanced Commonwealth Performance Framework. The diagram identifies the content of each of the publications and the relationship between them. Links to the publications for each entity within the portfolio can be found in the introduction to Section 2: Outcomes and Planned Performance.

User Guide
x

1
PORTFOLIO OVERVIEW

2

Portfolio Overview
3
HEALTH PORTFOLIO OVERVIEW
Ministers and Portfolio Responsibilities
The Health Portfolio works towards achieving better health and wellbeing for all Australians, now and for future generations.
The Portfolio’s services are delivered through the 23 Outcomes outlined in Figure 1: Portfolio Structure and Outcomes. Each Portfolio entity has developed performance information to determine its effectiveness in achieving entity-specific Outcomes. Outcome and Program reporting, and resource allocations for each entity are presented in the respective Entity Resources and Planned Performance sections.
For information on resourcing across the portfolio, please refer to Part 1: Agency Financial Resourcing in Budget Paper No. 4 – Agency Resourcing.
Ministerial Changes On 24 January 2017, the Hon Greg Hunt MP was sworn in as the Minister for Health and Minister for Sport; the Hon Ken Wyatt AM, MP as the Minister for Aged Care and Minister for Indigenous Health; and the Hon Dr David Gillespie MP as Assistant Minister for Health.
Portfolio Structure
Minister and Portfolio responsibilities, and a list of the 17 entities currently within the Health Portfolio, can be found in Figure 1.

Portfolio Overview
4
Figure 1: Health Portfolio Structure and Outcomes
The Hon Greg Hunt MP
Minister for Health Minister for Sport
Portfolio Responsibilities
Department of Health:
Outcomes: 1, 2, 3, 4, 5 and 6
Entities:
ACSQHC, AIHW, ASADA, ASC, ASF, CA, Digital Health Agency, IHPA, NHFB, NHMRC, NMHC and PSR
The Hon Ken Wyatt AM, MP
Minister for Aged Care Minister for Indigenous Health
Portfolio Responsibilities
Department of Health:
Outcomes: 1, 2, 4 and 6
Entities:
AACQA, NBA and OTA
The Hon Dr David Gillespie MP
Assistant Minister for Health
Portfolio Responsibilities
Department of Health:
Outcomes: 2 and 5
Entities:
ARPANSA and FSANZ
Department of Health
Martin Bowles PSM Secretary
Outcome 1. Health System Policy, Design and Innovation
Australia’s health system is better equipped to meet current and future health needs by applying research, evaluation, innovation, and use of data to develop and implement integrated, evidence-based health policies, and through support for sustainable funding for health infrastructure.
Outcome 2. Health Access and Support Services
Support for sustainable funding for public hospital services and improved access to high quality, comprehensive and coordinated preventive, primary and mental health care for all Australians, with a focus on those with complex health care needs and those living in regional, rural and remote areas, including through access to a skilled health workforce.
Outcome 3. Sport and Recreation
Improved opportunities for community participation in sport and recreation, excellence in high-performance athletes, and protecting the integrity of sport through investment in sport infrastructure, coordination of Commonwealth involvement in major sporting events, and research and international cooperation on sport issues.
Outcome 4. Individual Health Benefits
Access to cost-effective medicines, medical, dental and hearing services, and improved choice in health services, including through the Pharmaceutical Benefits Scheme, Medicare, targeted assistance strategies and private health insurance.
Outcome 5. Regulation, Safety and Protection
Protection of the health and safety of the Australian community and preparedness to respond to national health emergencies and risks, including through immunisation, initiatives, and regulation of therapeutic goods, chemicals, gene technology, and blood and organ products.
Outcome 6. Ageing and Aged Care
Improved wellbeing for older Australians through targeted support, access to quality care and related information services.

Portfolio Overview
5
Figure 1: Portfolio Structure and Outcomes (continued) – Portfolio Entities
Australian Aged Care Quality Agency
Nick Ryan Chief Executive Officer
Outcome 1. High-quality care for persons receiving Australian Government subsidised aged care through the accreditation of aged care services in residential settings, the quality review of aged care services provided in the community and the provision of quality information to consumers, as well as the provision of information, education and training to aged care providers.
Australian Commission on Safety and Quality in Health Care
Adjunct Professor Debora Picone AM Chief Executive Officer
Outcome 1. Improved safety and quality in health care across the health system, including through the development, support for implementation, and monitoring of national clinical safety and quality guidelines and standards.
Australian Digital Health Agency
Tim Kelsey Chief Executive Officer
Outcome 1. To deliver national digital healthcare systems to enable and support improvement in health outcomes for Australians.
Australian Institute of Health and Welfare
Barry Sandison Director
Outcome 1. A robust evidence-base for the health, housing and community sectors, including through developing and disseminating comparable health and welfare information and statistics.
Australian Radiation Protection and Nuclear Safety Agency
Dr Carl-Magnus Larsson Chief Executive Officer
Outcome 1. Protection of people and the environment through radiation protection and nuclear safety research, policy, advice, codes, standards, services and regulation.
Australian Sports Anti-Doping Authority
Ben McDevitt AM APM Chief Executive Officer
Outcome 1. Protection of the health of athletes and the integrity of Australian sport including through engagement, deterrence, detection and enforcement to minimise the risk of doping.
Australian Sports Commission
Kate Palmer Chief Executive Officer
Outcome 1. Increased participation in organised sport and continued international sporting success including through leadership and development of a cohesive and effective sports sector, provision of targeted financial support, and the operation of the Australian Institute of Sport.
Australian Sports Foundation Limited
Patrick Walker Chief Executive Officer
Outcome 1. Improved Australian sporting infrastructure through assisting eligible organisations to raise funds for registered sporting projects.
Cancer Australia
Professor Helen Zorbas AO Chief Executive Officer
Outcome 1. Minimised impacts of cancer, including through national leadership in cancer control with targeted research, cancer service development, education and consumer support.
Food Standards Australia New Zealand
Mark Booth Chief Executive Officer
Outcome 1. A safe food supply and well-informed consumers in Australia and New Zealand, including through the development of food regulatory measures and the promotion of their consistent implementation, coordination of food recall activities and the monitoring of consumer and industry food practices.
Independent Hospital Pricing Authority
James Downie Chief Executive Officer
Outcome 1. Promote improved efficiency in, and access to, public hospital services primarily through setting efficient national prices and levels of block funding for hospital activities.
National Blood Authority
John Cahill Chief Executive
Outcome 1. Access to a secure supply of safe and affordable blood products, including through national supply arrangements and coordination of best practice standards within agreed funding policies under the national blood arrangements.

Portfolio Overview
6
Figure 1: Portfolio Structure and Outcomes (continued) – Portfolio Entities
National Health Funding Body
Lynton Norris Chief Executive Officer
Outcome 1. Provide transparent and efficient administration of Commonwealth, State and Territory funding of the Australian public hospital system, and support the obligations and responsibilities of the Administrator of the National Health Funding Pool.
National Health and Medical Research Council
Professor Anne Kelso AO Chief Executive Officer
Outcome 1. Improved health and medical knowledge, including through funding research, translating research findings into evidence-based clinical practice, administering legislation governing research, issuing guidelines and advice for ethics in health and the promotion of public health.
National Mental Health Commission
Dr Peggy Brown Chief Executive Officer
Outcome 1. Provide expert advice to the Australian Government and cross-sectoral leadership on the policy, programs, services and systems that support mental health in Australia, including through administering the Annual National Report Card on Mental Health and Suicide Prevention, undertaking performance monitoring and reporting, and engaging consumers and carers.
Organ and Tissue Authority
Ann Smith A/g Chief Executive Officer
Outcome 1. Improved access to organ and tissue transplants, including through a nationally coordinated and consistent approach and system.
Professional Services Review
Professor Julie Quinlivan Director
Outcome 1. A reduction of the risks to patients and costs to the Australian Government of inappropriate clinical practice, including through investigating health services claimed under the Medicare and Pharmaceutical benefits schemes.
Statutory Office Holders
Aged Care Complaints Commissioner
Ms Rae Lamb
Aged Care Pricing Commissioner
Ms Kim Cull
Director, National Industrial Chemicals Notification and Assessment Scheme
Dr Brian Richards
Gene Technology Regulator
Dr Raj Bhula
National Health Funding Pool Administrator
Mr Peter Achterstraat AM

Portfolio Overview
7
Portfolio Resources
Table 1 shows the total resources provided to the Portfolio in the 2017-18 Budget year by entity.
Table 1: Portfolio Resources 2017-18
Appropriations Receipts Total
Bill No. 1$'000
Bill No. 2$'000
Special$'000 $'000 $'000
DEPARTMENTAL
Department of Health 647,489 2,366 - 176,292 826,147
Australian Aged Care Quality Agency 28,458 - - 22,457 50,915
Australian Commission on Safety and Quality in Health Care - - - 21,497 21,497
Australian Digital Health Agency (a) 197,062 53,464 - 35,600 286,126
Australian Institute of Health and Welfare (a) 28,078 - - 33,030 61,108
Australian Organ and Tissue Donation and Transplantation Authority 5,704 - - - 5,704
Australian Radiation Protection and Nuclear Safety Agency 14,794 5,000 - 9,712 29,506
Australian Sports Anti-Doping Authority 12,987 826 - 4,269 18,082
Australian Sports Commission (a) 264,595 1,069 - 24,801 290,465
Australian Sports Foundation Limited - - - 38,200 38,200
Cancer Australia 11,191 - - 127 11,318
Food Standards Australia New Zealand (a) 16,961 - - 2,169 19,130
Independent Hospital Pricing Authority - - - 16,422 16,422
National Blood Authority 6,158 - - 3,617 9,775
National Health Funding Body 5,844 - - - 5,844
National Health and Medical Research Council 39,176 3,879 - 1,500 44,555
National Mental Health Commission 2,736 - - - 2,736
Professional Services Review 5,691 - - - 5,691
Total departmental 1,286,924 66,604 - 389,693 1,743,221

Portfolio Overview
8
Table 1: Portfolio Resources 2017-18 (continued)
Appropriations Receipts Total
Bill No. 1$'000
Bill No. 2$'000
Special$'000 $'000 $'000
ADMINISTERED
Department of Health 8,854,333 25,000 55,853,970 125,825 64,859,128
Australian Organ and Tissue Donation and Transplantation Authority 42,116 - - - 42,116
Cancer Australia 18,679 - - - 18,679
National Blood Authority 3,860 - - 1,198,371 1,202,231
National Health and Medical Research Council 871,932 - - 11,000 882,932
National Mental Health Commission 3,726 - - - 3,726
Total administered 9,794,646 25,000 55,853,970 1,335,196 67,008,812
less non-appropriation funding transfers to Corporate entities - - - (799,059) (799,059)
Total Portfolio 11,081,570 91,604 55,853,970 925,830 67,952,974
All figures are GST exclusive. (a) These entities are not directly appropriated as they are corporate entities under the Public Governance,
Performance and Accountability Act 2013.

9
ENTITY RESOURCES AND PLANNED PERFORMANCE
Department of Health ............................................................................................ 11
Australian Aged Care Quality Agency .............................................................. 151
Australian Commission on Safety and Quality in Health Care ....................... 167
Australian Digital Health Agency ...................................................................... 185
Australian Institute of Health and Welfare ........................................................ 205
Australian Radiation Protection and Nuclear Safety Agency ......................... 225
Australian Sports Anti-Doping Authority ......................................................... 243
Australian Sports Commission ......................................................................... 263
Cancer Australia .................................................................................................. 283
Food Standards Australia New Zealand ........................................................... 303
Independent Hospital Pricing Authority ........................................................... 321
National Blood Authority .................................................................................... 339
National Health Funding Body ........................................................................... 361
National Health and Medical Research Council ............................................... 381
National Mental Health Commission ................................................................. 401
Organ and Tissue Authority ............................................................................... 419
Professional Services Review ........................................................................... 437

10

11
DEPARTMENT OF HEALTH
Entity Resources and Planned Performance

12

13
DEPARTMENT OF HEALTH
Section 1: Entity Overview and Resources ........................................................ 14
1.1 Strategic Direction Statement ..................................................................... 14
1.2 Entity Resource Statement ......................................................................... 23
1.3 Budget Measures ........................................................................................ 26
Section 2: Outcomes and Planned Performance ............................................... 39
Budgeted Expenses and Performance for:
2.1 Outcome 1: Health System Policy, Design and Innovation ........................ 41
2.2 Outcome 2: Health Access and Support Services ...................................... 57
2.3 Outcome 3: Sport and Recreation ............................................................... 81
2.4 Outcome 4: Individual Health Benefits ........................................................ 87
2.5 Outcome 5: Regulation, Safety and Protection ......................................... 109
2.6 Outcome 6: Ageing and Aged Care .......................................................... 125
Section 3: Explanatory Tables and Budgeted Financial Statements ............ 139
3.1 Budgeted Financial Statements ................................................................ 139
3.2 Budgeted Financial Statements Tables .................................................... 141

Budget Statements – Department of Health
14
DEPARTMENT OF HEALTH
Section 1: Entity Overview and Resources
1.1 STRATEGIC DIRECTION STATEMENT
The 2017-18 Budget sets the direction to ensure Australia’s world-class health system continues to improve, and is accessible whenever and wherever people need it.
This Budget supports the Long-Term National Health Plan – based on the four pillars of guaranteeing Medicare and the Pharmaceutical Benefits Scheme; supporting hospitals; prioritising mental and preventive health; and investment in medical research.
The Australian Government will deliver an overall investment in the Long-Term National Health Plan of over $10 billion. This will balance economic policy with health priorities and will increase the investment in health, aged care and sport to $94.2 billion in 2017-18, an increase of 2.8 per cent from the previous year. This funding will enable targeted investment decisions, a focus on high value clinical care, promotion of good health, and genuine collaboration with the health sector to build a holistic and integrated health system.
This is the first time a Government has simultaneously entered into a series of compacts with the Australian Medical Association, Royal Australian College of General Practitioners, Medicines Australia, the Pharmacy Guild and Generic and Biosimilar Medicines Association to provide for the long-term sustainability of our health care system.
Guaranteeing Medicare and access to medicines
The Government is guaranteeing its investment in Medicare so that all Australians can be certain they will continue to have access to the essential health care services they need.
The Government will establish the Medicare Guarantee Fund from 1 July 2017 to ensure the ongoing funding of the Medicare Benefits Schedule (MBS) and the Pharmaceutical Benefits Scheme (PBS) into the future.
The Fund will be credited with revenue raised from the Medicare levy (excluding amounts to meet the Government’s commitment to fund the National Disability Insurance Scheme) as well as a portion of personal income tax receipts sufficient to cover the estimated costs of essential health care provided under the MBS and PBS.
These amounts will be held in the Fund for the sole purpose of meeting the cost of essential health care provided under the MBS and PBS.

Section 1 – Entity Overview and Resources
15
In 2017-18, the Government will increase patient rebates and strengthen and modernise Medicare. The Government will invest $2.4 billion in Medicare, including $1 billion to restore indexation of the Medicare rebate over the next three years – general practitioner bulk-billing incentives from 1 July 2017; standard general practitioner and specialist consultations from 1 July 2018; and specialist procedures and allied health services from 1 July 2019. This brings the total expenditure invested in Medicare to $22.9 billion in 2017-18.
In addition, the Government will maintain the bulk-billing incentives for pathology and diagnostic imaging services, at a cost of $936.7 million over five years. The Government will also reinvest in indexation for targeted diagnostic imaging services from 2020, for the first indexation in their field since 2004. Furthermore, the Government will maintain the current Medicare safety net arrangements at a cost of $317.5 million.
The Government will provide $16.4 million for new listings on the MBS. The Government will also invest $44.2 million over three years in continuing to fund the clinician-led review (the Review) of all 5,700 items on the MBS to ensure they represent best clinical practice.
Alongside the Review, $44.5 million will enable the Medical Services Advisory Committee to continue its work of amending and adding to MBS listings to ensure Medicare remains contemporary and sustainable.
In a further move to improve Medicare’s fiscal sustainability, compliance arrangements will be strengthened by increasing the Government’s debt recovery powers. Currently, only 20 per cent of Medicare debts through inappropriate claiming are recovered. This measure will generate estimated net savings of $103.8 million to be reinvested in Medicare services.
The Government will enforce existing legislation which govern arrangements between doctors and pathology providers.
The Government is committed to ensuring people have access to medicine when they need it. The 2017-18 Budget strengthens the PBS on several fronts, working closely with stakeholders to share responsibility for ensuring the PBS remains sustainable into the future.
Existing arrangements for the PBS co-payment and safety net threshold will be retained at a cost of $955 million.
The Government will work with Medicines Australia through a collaborative five-year compact that will give the industry greater planning certainty and reduce the costs of medicines by an estimated $1.8 billion. The compact commits to provide one-off price reductions for certain medicines that have been on the PBS for 10 and 15 years; lowering of more PBS drug prices over the longer period of the compact; and support for the uptake of lower-cost generic and biosimilar medicines. In a first for the PBS, savings generated by the formal compact with Medicines Australia will fund future, often highly expensive, new PBS listings.

Budget Statements – Department of Health
16
The Government has entered into a compact with the Pharmacy Guild to strengthen the PBS to deliver $210 million for community pharmacies, recognising a lower than anticipated increase in scripts filled by pharmacists. In addition, the Government will provide $15 million to wholesalers in recognition of reduced remuneration due to lower than expected prescription volumes.
The Government will undertake further work to make electronic forms of PBS scripts a legal form of prescription. This will be developed in consultation with doctors and pharmacists and participation will be voluntary with doctors retaining complete control over all scripts.
In addition, the Government will work with community pharmacies to improve medication management programs. This commitment of $600 million over three years will enable pharmacies to offer new or expanded services to consumers, including home visits by pharmacists, helping patients with their medication, and supporting Health Care Homes with medicine management.
Working closely with GPs and other health professionals, the Government is progressing the implementation of the Health Care Homes trial with 20 practices to commence 1 October 2017 and the remaining 180 to commence 1 December 2017.
The Government will spend $1.2 billion on new and amended listings for the PBS. From 1 June 2017, the Government will list the combination medicine, sacubitril with valsartan (Entresto®), for a new treatment for hypertension and heart failure. More than 60,000 Australians with chronic heart failure will benefit from the listing of this new medicine. Without the PBS subsidy, patients would pay more than $1,970 a year for the treatment. Other new listings include medicine for children with cystic fibrosis, and medicine to treat idiopathic pulmonary fibrosis (a debilitating lung disease).
Fulfilling its 2016 election commitment, from 1 April 2017 the Government is providing $54 million over five years to subsidise access to continuous glucose monitoring technology for children and young adults under 21 years of age with insulin-dependent type 1 diabetes, and who face additional challenges in managing their diabetes and blood glucose levels.
In addition, the Government will invest $2.2 million to extend operational funding for the Cardiac Devices Registry and the Australian Breast Device Registry. This will support better health care and outcomes for patients with implanted high-risk cardiac and breast devices.
The Government is committed to improving Australian children’s dental health and ensuring that children across the country have access to dentists when they need it. A further $163.6 million over five years will be provided to increase the two-calendar-year benefits cap from $700 to $1,000 for all children eligible for the Child Dental Benefits Schedule, retrospectively from 1 January 2017.
The Government will provide $145.5 million to enable Primary Health Networks to continue their central role in ensuring their local communities can access after-hours primary health services.

Section 1 – Entity Overview and Resources
17
Supporting our hospitals
The Government will deliver an additional $2.8 billion to public hospitals in this Budget. Since the signing of the Council of Australian Governments (COAG) Heads of Agreement in 2016, the Commonwealth has provided an extra $7.7 billion to support States and Territories to deliver public hospital services.
The Government will increase funding by $4.1 million over three years to the National Health Funding Body (NHFB) to support its existing role and new functions arising from the COAG agreement on public hospital funding. The NHFB, which is an independent statutory authority, supports the Administrator of the National Health Funding Pool in paying and distributing Commonwealth and State and Territory funding for public hospitals – responsible for around $40 billion a year.
The Government will provide $730.4 million upfront to transfer ownership of the Mersey Community Hospital back to the Tasmanian Government on 1 July 2017 and secure the funding for 10 years. This will provide certainty to the providers and consumers of Tasmania’s acute care services.
In addition, the Government will also provide $6.2 million to the Tasmanian Government to support the continued operation of the Missiondale Recovery Centre and palliative care services in Tasmania.
Prioritising mental health, preventive health and sport
With heart disease, cancer and mental illness accounting for almost half the burden of disease in Australia, the Government is funding initiatives to support healthy lifestyles, prioritising mental health, preventive health and sport.
The Government continues to be committed to providing much needed support for vital mental health services aimed at stopping vulnerable people from falling through the cracks and providing quality health services to rural and regional Australia.
Suicide continues to be a significant national public health concern, with over 3,000 people in Australia dying from suicide in 2015. The Government will provide $11.1 million over three years to support the prevention of suicide in areas and specific locations – hotspots – where suicide incidents repeatedly occur. Funding will deliver initiatives, such as signage to encourage people to seek help, building the capacity of existing crisis line services, as well as a National Partnership Agreement which will support States and Territories to deliver small infrastructure projects, such as fencing and surveillance to deter people from attempting suicide.
In addition, funding of $9.1 million over four years will be provided to enable Australians who live in rural and regional Australia to access psychologists via telehealth.
Budget Statements – Department of Health
18
The Government will commit $80 million over four years for community mental health services to assist people with severe mental illness resulting in psychosocial disability who are not eligible for assistance through the National Disability Insurance Scheme. Services will be facilitated through Primary Health Networks to enable a regionally-focused, stepped care approach, improving coordination and integrated care for individuals with psychosocial disabilities. The additional Commonwealth investment will be delivered once agreements have been reached with appropriate commitments from each State and Territory.
Building on the national mental health reforms, the Government will invest $15 million over two years to support mental health research within Australia. The funding will contribute to infrastructure and research targeted at improving early intervention and treatment for people with mental illness, recognising the link between mental health and physical health and wellbeing.
Specifically, this investment provides:
$5 million to Orygen in Melbourne, the National Centre of Excellence in Youth Mental Health, to help complete its integrated healthcare and translational research facility.
$5 million to the Black Dog Institute to support, in collaboration with the Hunter Institute, the translation of research findings into improved and innovative service delivery for people with anxiety and depression.
$5 million to the Sunshine Coast Mind and Neuroscience – Thompson Institute for research in young people with major mood or psychiatric disorders and in suicide prevention.
In addition, the Government will provide a further $58.6 million for mental health service for current and former members of the Australian Defence Force and veterans families.
The Government continues its commitment to improve operation of the My Health Record system, which allows individuals to access and control their own medical history and treatments – such as vaccinations.
Following unanimous support by COAG for a national rollout of the My Health Record, the Government will invest $374.2 million over two years to ensure every Australian has a My Health Record, unless they prefer not to. This will support the expanded rollout of the opt-out model to all Australians, and will continue and improve operations of My Health Record, while making it easier for health providers to register for the system. Opt-out is the fastest way to realise the significant health and economic benefits of My Health Record for all Australians, including through avoided hospital admissions, fewer adverse drug events, reduced duplication of tests, better coordination of care for people seeing multiple healthcare providers, and better informed treatment decisions.

Section 1 – Entity Overview and Resources
19
The Government will provide $10 million to the Heart Foundation for the Prime Minister’s Walk for Life Challenge. This will improve community participation in, and to raise community awareness of, the value of physical activity and its role in preventing chronic disease. The Challenge will increase access to walking and other physical activity programs, including for children in schools, and promote innovative uses of technology to support increased physical activity. In addition, the Government will provide $5 million to the Royal Australian College of General Practitioners for general practitioners to support Australians to achieve a healthy lifestyle through increased physical activity and better nutrition.
In the lead up to the 2018 Gold Coast Commonwealth Games, the Government will commit an additional $15.5 million to maintain sporting grants and services for more than 2,000 aspiring and high performing athletes. In addition, the Government will invest $34.2 million to support a range of operational and security activities for the 2018 Gold Coast Commonwealth Games. The Government will also develop a National Sports Plan, including consideration of a national lottery.
It is estimated that in 2017, breast cancer will become the most commonly diagnosed cancer. Funding of $64.3 million will continue existing arrangements for women aged 70 to 74 years to participate in the BreastScreen Australia Program, which provides free mammograms to screen for the early detection of breast cancer. The measure complements the BreastScreen Australia services already provided under the National Healthcare Agreement targeting women aged 50 to 69.
The Government will also provide an additional $41.6 million to extend an agreement with the Victorian Government to continue research and quality services delivered by the Victorian Cytology Service for cervical cancer.
Prostate cancer is the most common form of cancer affecting Australian men (excluding non-melanoma skin cancer). In 2017, it is estimated that over 16,000 men will be diagnosed with the disease. The Government will spend $5.9 million over three years to expand the current Prostate Cancer Nurse program to fund up to 14 additional prostate cancer nurses across Australia to support men with prostate cancer, bringing the total number from 14 up to 28.
In 2017-18, the Government will continue to fund the production and supply of Australian antivenoms, Q fever vaccine and test kits, and will maintain Australia’s ability to domestically manufacture priority pandemic vaccines to respond to an influenza pandemic. In addition, the Government will provide $85.4 million over three years to support the replenishment of the National Medical Stockpile.

Budget Statements – Department of Health
20
The Government will commit $12.5 million over four years to study the potential effects of Per- and Poly-Fluorinated Alkyl substances exposure on human health. The program will be administered by the National Health and Medical Research Council.
Supporting No Jab, No Pay, the Government will commit $14.1 million over four years through the National Immunisation Program to provide ongoing Catch-Up vaccines for almost 375,000 Australians aged 10 to 19 years, and more than 8,000 adult refugees and humanitarian entrants. In addition, the Government will launch a $5.5 million awareness campaign over three years to improve awareness and uptake of immunisation for children less than five years of age.
The Government will spend $8.3 million over three years to boost funding for palliative care coordination through Primary Health Networks to support people who have a known life-limiting condition by improving choice and quality of care and support.
The Government will provide $4.1 million over four years to support living organ donors. This funding will continue to support living organ donors to ensure that cost is not a barrier when deciding to donate a kidney or part of their liver. With more organs being donated, fewer transplant recipients will require dialysis.
The Government will continue to own and operate the health and aged care payments system. The Government will invest $67.3 million to replace the outmoded IT systems supporting health, aged care and related veterans’ payments with a new digital payments platform, while ensuring the existing systems continue to operate reliably and effectively.
The Government will strengthen and expand the Rheumatic Fever Strategy, worth $18.8 million over four years, continuing to protect Aboriginal and Torres Strait Islander communities at risk of acute rheumatic fever and rheumatic heart disease.
Investing in medical research
Over the next four years the Government will move substantially towards doubling its current medical research funding. This Budget starts the Government’s disbursements from its landmark Medical Research Future Fund (MRFF) worth $20 billion by 2021. This will deliver disbursements of $1.4 billion over the next five years from 2016-17. This will play a key role in building a stronger, sustainable health system, capable of addressing the pressures that confront us: disease complexity; ageing and chronic conditions; lifestyle behaviours; new technologies; communicable diseases; and increasing consumer expectations.

Section 1 – Entity Overview and Resources
21
First earnings of $65.9 million from the MRFF from 2016-17 will fund eight strategic investments, aligned with the independent Australian Medical Research Advisory Board’s Strategy and Priorities. A balance of long-term research and clinical trials will improve health system efficiency, patient care and access, health outcomes, and innovation in health. The initiatives include:
$20 million for preventive health and research translation projects. Including $10 million for Advanced Health Translation Centres and $10 million for the Australian Prevention Partnership Centre.
$33 million for clinical trials to build on Australia’s world class strengths and to ensure Australia is a preferred destination for clinical trial research.
$12.9 million for breakthrough research investments to drive cutting edge science and accelerate research for better treatments and cures.
The Government will invest $10.8 million to fight childhood cancer through research and clinical trials. This includes providing Cancer Australia $4.4 million aimed at increasing Australia’s research capacity to advance diagnosis, treatment, management, analysis, and improve data and awareness of childhood cancer, as well as $1.4 million to fast track international research collaborations of paediatric brain cancer in Australia. In addition, the Government will provide $5 million under the Medical Research Future Fund to CanTeen to improve outcomes for children and young people fighting against cancer.
Furthermore, funding of $68 million will be provided to the South Australian Government to purchase accelerator equipment and treatment rooms to support the establishment of Australia’s first Proton Beam Therapy facility for advanced research and treatment of cancer. These initiatives build on the 2016 election commitment of $20 million for the ground-breaking Zero Childhood Cancer initiative.
In addition, the Government will spend $2.1 million over two years to implement its 2016 election commitment to introduce a ban on cosmetic testing on animals from 1 July 2017.
Ageing and aged care
While many of the measures above will positively impact on older Australians, the Government also continues to be committed to increasing choice in aged care by providing aged care consumers, their families and carers, greater choice, control and flexibility over their aged care needs. Over the next five years the Government will spend $99.3 billion to support aged care services.

Budget Statements – Department of Health
22
The Government will extend funding arrangements for the Commonwealth Home Support Programme (CHSP) of $5.5 billion for a further two years until 30 June 2020. This will benefit consumers receiving home support, and their carers, by providing continuity of essential services such as transport, Meals on Wheels, domestic assistance, personal care, nursing and allied health and respite services. This includes extending funding agreements with CHSP service providers and Regional Assessment Services from 1 July 2018 (1 July 2019 in Victoria), with new funding conditions to provide a greater focus on activities that support independence and wellness and provide more choice for consumers. Under this measure, two-year funding agreements will also be offered to eligible Home and Community Care service providers and assessment services in WA, which are moving to the CHSP from 1 July 2018.
The Government will provide additional funding of $3.1 million for ICT support for the My Aged Care platform. Critical improvements in system performance and efficiency will help ensure timely access to aged care for older people, and enable information technology infrastructure to keep pace with the increase in the number of people using My Aged Care.

Section 1 – Entity Overview and Resources
23
1.2 ENTITY RESOURCE STATEMENT
Table 1.1 shows the total funding from all sources available to the entity for its operations and to deliver programs and services on behalf of the Government.
The table summarises how resources will be applied by Outcome (Government strategic policy objectives) and by Administered (on behalf of the Government or the public) and Departmental (for the entity’s operations) classification.
For more detailed information on special accounts and special appropriations, please refer to Budget Paper No. 4 – Agency Resourcing.
Information in this table is presented on a resourcing (i.e. appropriations/cash available) basis, whilst the ‘Budgeted expenses by Outcome X’ tables in Section 2 and the financial statements in Section 3 are presented on an accrual basis.
Table 1.1: Department of Health Resource Statement – Budget Estimates for 2017-18 as at Budget May 2017
2016-17Estimated
actual$'000
2017-18 Estimate
$'000
DEPARTMENTAL
Prior year appropriation available 117,606 50,903
Annual appropriations
Ordinary annual services (a)
Departmental appropriation 655,162 639,683
s74 retained revenue receipts (b) 18,787 19,117
Departmental capital budget (c) 9,828 7,806
Other services (d)
Equity injection 6,651 2,366
Total departmental annual appropriations 690,428 668,972
Special Accounts (e) (f)
Opening balance 88,717 76,675
Appropriation receipts (g) 13,977 10,254
Non-appropriation receipts 154,965 157,175
Total special account 257,659 244,104
Less appropriations drawn from annual or special appropriations above and credited to Special Accounts and/or payments to corporate entities through annual appropriations (h) (13,977) (10,254)
Total departmental resourcing for Health 1,051,716 953,725

Budget Statements – Department of Health
24
Table 1.1: Department of Health Resource Statement – Budget Estimates for 2017-18 as at Budget May 2017 (continued)
2016-17Estimated
actual$'000
2017-18 Estimate
$'000
ADMINISTERED
Annual appropriations
Ordinary annual services (a)
Outcome 1: Health System Policy, Design and Innovation 124,674 134,436
Outcome 2: Health Access and Support Services 4,039,400 4,132,253
Outcome 3: Sport and Recreation 18,475 19,527
Outcome 4: Individual Health Benefits 1,338,531 1,439,887
Outcome 5: Regulation, Safety and Protection 125,051 119,983
Outcome 6: Ageing and Aged Care 2,771,169 3,008,247
Payments to corporate entities (i) 405,060 560,425
Other services (d)
Administered assets and liabilities 150,537 25,000
Total administered annual appropriations 8,972,897 9,439,758
Special appropriations limited by criteria/entitlement
National Health Act 1953 - blood fractionation, products and blood related products to National Blood Authority 664,802 748,914
Public Governance, Performance and Accountability Act 2013 s77 - repayments 2,000 2,000
Health Insurance Act 1973 - payments relating to the former Health and Hospitals Fund 37,321 37,631
Health Insurance Act 1973 - medical benefits 22,092,457 22,897,861
National Health Act 1953 - pharmaceutical benefits 11,297,940 10,950,710
Private Health Insurance Act 2007 - incentive payments and rebate 6,054,635 6,175,728
Medical Indemnity Act 2002 91,800 96,900
Midwife Professional Indemnity (Commonwealth Contribution) Scheme Act 2010 6,870 4,061
Dental Benefits Act 2008 331,860 346,039
National Health Act 1953 - aids and appliances 354,493 353,784
National Health Act 1953 - essential vaccines 302,619 284,930
Aged Care Act 1997 - home care packages 1,726,419 1,967,122
National Health Act 1953 - continence aids payments 85,291 86,792
Aged Care Act 1997 - residential care 10,885,981 11,429,323
Aged Care Act 1997 - flexible care 431,390 472,175
Aged Care (Accommodation Payment Security) Act 2006 801 -
Total administered special appropriations 54,366,679 55,853,970

Section 1 – Entity Overview and Resources
25
Table 1.1: Department of Health Resource Statement – Budget Estimates for 2017-18 as at Budget May 2017 (continued)
2016-17Estimated
actual$'000
2017-18 Estimate
$'000
Special Accounts (e) (f)
Opening balance 7,070 6,909
Appropriation receipts (g) 5,913 5,966
Non-appropriation receipts 65,019 125,825
Total Special Accounts 78,002 138,700
Total administered resourcing 63,417,578 65,432,428
Less appropriations drawn from annual or special appropriations above and credited to Special Accounts and/or payments to corporate entities through annual appropriations (h) (410,973) (566,391)
Total administered resourcing for Health 63,006,605 64,866,037
Total resourcing for Health 64,058,321 65,819,762
2016-17 2017-18
Average staffing level (number) 4,642 4,398
All figures are GST exclusive. Prepared on resourcing (i.e. appropriation available) basis. (a) Appropriation Bill (No. 1) 2017-18. (b) Estimated retained revenue receipts under section 74 of the PGPA Act 2013. (c) Departmental Capital Budget (DCB) are not separately identified in Appropriation Bill (No. 1) and form part
of ordinary annual services items. Refer to Table 3.5 for further details. For accounting purposes, this amount has been designated as a 'contribution by owner'.
(d) Appropriation Bill (No. 2) 2017-18. (e) For further information on special appropriations and special accounts, please refer to Budget Paper No. 4
- Agency Resourcing. Refer to see Table 2.1.1 for further information on outcome and program expenses broken down by various funding sources, e.g. annual appropriations, special appropriations and special accounts.
(f) Excludes Services for Other Entities and Trust Moneys Special Account as this account is not considered resourcing for the Department of Health.
(g) Amounts credited to the special account(s) from Department of Health's annual and special appropriations. (h) Appropriation receipts from Health annual and special appropriations included above. (i) 'Corporate entities' are corporate Commonwealth entities and Commonwealth companies as defined under
the PGPA Act 2013.

Budget Statements – Department of Health
26
1.3 BUDGET MEASURES
Budget measures in Part 1 relating to the Department of Health are detailed in Budget Paper No. 2 and are summarised below.
Table 1.2: Department of Health 2017-18 Budget Measures
Program 2016-17$'000
2017-18$'000
2018-19$'000
2019-20 $'000
2020-21 $'000
Outcome 1: Health System Policy, Design and Innovation
Guaranteeing Medicare - modernising the health and aged care payments systems
Department of Health
Administered expenses 1.2 - 46,462 - - -
Departmental expenses 1.2 - 4,294 - - -
Department of Human Services
Departmental expenses - 15,558 - - -
Departmental capital - 1,000 - - -
Total - 67,314 - - -
Investing in Medical Research - Medical Research Future Fund
Department of Health
Administered expenses 1.1 - - - - -
Total expenses - - - - -
My Health Record - continuation and expansion
Department of Health
Administered expenses various - (4,615) (72,461) (99,653) (122,809)
Australian Digital Health Agency
Departmental expenses 1.1 - 84,496 211,327 - -
Departmental capital 1.1 - 53,464 37,542 - -
Department of Finance
Departmental expenses - - 135 - -
Department of Human Services
Departmental expenses - (21,695) - - -
Departmental capital - 2,977 - - -
Total - 114,627 176,543 (99,653) (122,809)
Operational Costs for Cardiac and Breast Device Registries - extension
Department of Health
Administered expenses 1.1 - 2,183 - - -
Total expenses - 2,183 - - -

Section 1 – Entity Overview and Resources
27
Table 1.2: Department of Health 2017-18 Budget Measures (continued)
Program 2016-17$'000
2017-18$'000
2018-19$'000
2019-20 $'000
2020-21 $'000
Per-and Poly-Fluorinated Alkyl Substances - National Health Research Program (a)
Department of Health
Administered expenses 1.1 - - - - -
Department of Defence
Departmental expenses - - - - -
Total expenses - - - - -
Proton Beam Facility in South Australia
Department of the Treasury
Administered expenses 1.3 - 68,000 - - -
Total expenses - 68,000 - - -
Supporting Living Organ Donors - continuation and expansion
Department of Health
Administered expenses 1.1 - 825 1,023 1,043 1,247
Total expenses - 825 1,023 1,043 1,247
Outcome 2: Health Access and Support Services
BreastScreen Australia Program - additional support
Department of Health
Administered expenses 2.4 - - - - -
Department of the Treasury
Administered expenses 2.4 - - - - -
Total expenses - - - - -
Cancer Screening - Victorian Cytology Service - continuation
Department of the Treasury
Administered expenses 2.4 - - - - -
Total expenses - - - - -
Greater Choice for at Home Palliative Care
Department of Health
Administered expenses 2.5 - 1,620 3,320 3,320 -
Total expenses - 1,620 3,320 3,320 -
Guaranteeing Medicare - development of the Health Care Homes trial
Department of Health
Administered expenses 2.5 (800) (22,130) (2,618) 25,548 -
4.1 - 43 141 64 -
Total expenses (800) (22,087) (2,477) 25,612 -

Budget Statements – Department of Health
28
Table 1.2: Department of Health 2017-18 Budget Measures (continued)
Program 2016-17$'000
2017-18$'000
2018-19$'000
2019-20 $'000
2020-21 $'000
Healthy Heart Initiative - targeted activities
Department of Health
Administered expenses 2.4 - 7,670 4,634 1,271 1,445
Total expenses - 7,670 4,634 1,271 1,445
National Cancer Screening Register - transition arrangements
Department of Health
Administered expenses 2.4 478 34,162 - - -
4.1 2,207 (5,812) 157 (73) 9,654
Department of Veterans' Affairs
Administered expenses 18 (49) - - 74
Total expenses 2,703 28,301 157 (73) 9,728
National Partnership Agreement on Rheumatic Fever Strategy - continuation and expansion
Department of Health
Administered expenses 2.2 - 1,000 2,003 1,955 1,000
Department of the Treasury
Administered expenses 2.2 - 392 398 401 407
Total expenses - 1,392 2,401 2,356 1,407
Primary Health Networks - supporting after-hours care
Department of Health
Administered expenses 2.5 - (3,800) (12,300) (12,900) (12,900)
Total expenses - (3,800) (12,300) (12,900) (12,900)
Prioritising Mental Health - Psychosocial Support Services - funding
Department of Health
Administered expenses 2.1 - 7,750 23,717 24,074 24,410
Total expenses - 7,750 23,717 24,074 24,410
Prioritising Mental Health - research
Department of Health
Administered expenses 2.1 - 7,500 7,500 - -
Total expenses - 7,500 7,500 - -

Section 1 – Entity Overview and Resources
29
Table 1.2: Department of Health 2017-18 Budget Measures (continued)
Program 2016-17$'000
2017-18$'000
2018-19$'000
2019-20 $'000
2020-21 $'000
Prioritising Mental Health - suicide prevention support programs
Department of Health
Administered expenses 2.1 - 700 710 720 -
Department of the Treasury
Administered expenses 2.1 - 3,000 3,000 3,000 -
Total expenses - 3,700 3,710 3,720 -
Prostate Cancer Nurses Program - continuation and expansion
Department of Health
Administered expenses 2.4 - 1,950 1,950 1,950 -
Total expenses - 1,950 1,950 1,950 -
Quality Improvements in General Practice - implementation of the Practice Incentive Program
Department of Health
Administered expenses 2.6 - - - - -
Department of Human Services
Departmental expenses (6,923) 7,637 722 551 546
Total expenses (6,923) 7,637 722 551 546
Strengthening Aged Care - developing an aged care workforce strategy
Department of Health
Administered expenses 2.3 - (1,460) (460) - -
6.4 - 1,460 460 - -
Total expenses - - - - -
Support for Health Services in Tasmania
Department of Health
Administered expenses 2.7 - (62,661) (62,661) (62,661) (62,661)
Department of the Treasury
Administered expenses 2.7 730,368 1,800 1,800 1,800 800
Total expenses 730,368 (60,861) (60,861) (60,861) (61,861)

Budget Statements – Department of Health
30
Table 1.2: Department of Health 2017-18 Budget Measures (continued)
Program 2016-17$'000
2017-18$'000
2018-19$'000
2019-20 $'000
2020-21 $'000
Outcome 3: Sport and Recreation
Gold Coast 2018 Commonwealth Games - additional Australian Government support
Department of Health 3.1 nfp nfp - - -
Attorney - General's Department nfp nfp - - -
Australian Communication and Media Authority nfp nfp - - -
Australian Criminal Intelligence Commission nfp nfp - - -
Australian Federal Police nfp nfp - - -
Australian Security Intelligence Organisation nfp nfp - - -
Australian Sports Anti-doping Authority 1.1 nfp nfp - - -
Department of Agriculture and Water Resources nfp nfp - - -
Department of Defence - 33,914 250 - -
Department of Foreign Affairs and Trade nfp nfp - - -
Department of Immigration and Border Protection nfp nfp - - -
Tourism Australia nfp nfp - - -
Total - 33,914 250 - -
Outcome 4: Individual Health Benefits
Child Dental Benefits Schedule - increased cap
Department of Health
Administered expenses 4.6 5,063 38,219 42,874 38,790 37,129
Department of Human Services
Departmental expenses 1,541 - - - -
Total expenses 6,604 38,219 42,874 38,790 37,129

Section 1 – Entity Overview and Resources
31
Table 1.2: Department of Health 2017-18 Budget Measures (continued)
Program 2016-17$'000
2017-18$'000
2018-19$'000
2019-20 $'000
2020-21 $'000
Guaranteeing Medicare - aligning reciprocal health care
Department of Health
Administered expenses 4.1 - (331) (494) (504) (520)
Department of Human Services
Departmental expenses 440 709 - - -
Total expenses 440 378 (494) (504) (520)
Guaranteeing Medicare - development of the Health Care Homes trial
Department of Health
Administered expenses 2.5 (800) (22,130) (2,618) 25,548 -
4.1 - 43 141 64 -
Total expenses (800) (22,087) (2,477) 25,612 -
Guaranteeing Medicare - Medicare Benefits Schedule - improved compliance
Department of Health
Administered expenses 4.1 - - (8,400) (29,777) (32,372)
Administered revenue 4.1 - - (12,977) (15,572) (15,572)
Departmental expenses 4.1 - 392 539 448 200
Department of Human Services
Departmental expenses 14 4,519 721 693 696
Departmental capital - 2,652 - - -
Total 14 7,563 (20,117) (44,208) (47,048)
Guaranteeing Medicare - Medicare Benefits Schedule - indexation
Department of Health
Administered expenses 4.1 - 9,173 140,419 389,295 421,029
Department of Veterans' Affairs
Administered expenses - 279 5,553 14,142 22,398
Total expenses - 9,452 145,972 403,437 443,427
Guaranteeing Medicare - Medicare Benefits Schedule - new and amended listings
Department of Health
Administered expenses 4.1 - 1,720 3,735 4,826 5,937
Department of Human Services
Departmental expenses - 4 10 15 19
Department of Veterans' Affairs
Administered expenses - 17 32 39 47
Total expenses - 1,741 3,777 4,880 6,003

Budget Statements – Department of Health
32
Table 1.2: Department of Health 2017-18 Budget Measures (continued)
Program 2016-17$'000
2017-18$'000
2018-19$'000
2019-20 $'000
2020-21 $'000
Guaranteeing Medicare - Medicare Benefits Schedule Review - continuation
Department of Health
Administered expenses 4.1 - 7,880 7,880 5,880 -
Departmental expenses 4.1 - 7,973 7,797 6,786 -
Total expenses - 15,853 15,677 12,666 -
Guaranteeing Medicare - Medical Services Advisory Committee - continuation
Department of Health
Administered expenses 4.1 - 9,983 9,207 8,406 8,541
Departmental expenses 4.1 - 2,091 2,080 2,080 2,091
Total expenses - 12,074 11,287 10,486 10,632
Helping Families with Diabetes - free glucose monitoring devices for young Australians with Type 1 diabetes
Department of Health
Administered expenses 4.8 - - - - -
Total expenses - - - - -
Helping Families with Diabetes - Insulin Pump Program - reducing patient contributions
Department of Health
Administered expenses 4.8 - - - - -
Total expenses - - - - -
Improving Access to Medicines - cheaper medicines
Department of Health
Administered expenses 4.3 - (24,278) (355,381) (418,319) (467,007)
Department of Human Services
Departmental expenses - 230 59 23 11
Department of Veterans' Affairs
Administered expenses - (639) (9,149) (8,786) (8,957)
Total expenses - (24,687) (364,471) (427,082) (475,953)
Improving Access to Medicines - maintaining Remote Area Aboriginal Health Services pharmaceutical dispensing
Department of Health
Administered expenses 4.3 - (2,034) 262 348 438
Department of Human Services
Departmental expenses 104 748 181 181 182
Total expenses 104 (1,286) 443 529 620

Section 1 – Entity Overview and Resources
33
Table 1.2: Department of Health 2017-18 Budget Measures (continued)
Program 2016-17$'000
2017-18$'000
2018-19$'000
2019-20 $'000
2020-21 $'000
Improving Access to Medicines - Pharmaceutical Benefits Scheme - new and amended listings
Department of Health
Administered expenses 4.1 402 2,146 2,007 1,730 1,886
4.3 29,967 206,747 256,468 303,879 336,989
Administered revenue nfp nfp nfp nfp nfp
Department of Human Services
Departmental expenses 423 (173) (59) 33 100
Department of Veterans' Affairs
Administered expenses 588 4,572 5,675 6,696 7,242
Total 31,380 213,292 264,091 312,338 346,217
Improving Access to Medicines - Pharmaceutical Benefits Scheme - price amendments
Department of Health
Administered expenses 4.3 (14,925) (63,972) (64,836) (62,920) (61,298)
Department of Veterans' Affairs
Administered expenses (134) (560) (549) (513) (474)
Total expenses (15,059) (64,532) (65,385) (63,433) (61,772)
Improving Access to Medicines - support for community pharmacies
Department of Health
Administered expenses 4.3 - 69,956 74,983 75,214 -
Department of Veterans' Affairs
Administered expenses - 1,710 1,684 1,453 -
Total expenses - 71,666 76,667 76,667 -
National Cancer Screening Register - transition arrangements
Department of Health
Administered expenses 2.4 478 34,162 - - -
4.1 2,207 (5,812) 157 (73) 9,654
Department of Veterans' Affairs
Administered expenses 18 (49) - - 74
Total expenses 2,703 28,301 157 (73) 9,728
Pathology Approved Collection Centres - strengthening compliance
Department of Health
Departmental expenses 4.7 - 6,008 2,667 2,670 2,681
Departmental capital - 500 - - -
Department of Human Services
Departmental expenses - 2,799 231 202 203
Total - 9,307 2,898 2,872 2,884

Budget Statements – Department of Health
34
Table 1.2: Department of Health 2017-18 Budget Measures (continued)
Program 2016-17$'000
2017-18$'000
2018-19$'000
2019-20 $'000
2020-21 $'000
Prioritising Mental Health - improving telehealth for psychological services in regional, rural and remote Australia
Department of Health
Administered expenses 4.1 - 1,506 2,363 2,484 2,648
Department of Human Services
Departmental expenses - 10 17 18 19
Total expenses - 1,516 2,380 2,502 2,667
Stoma Appliance Scheme - new and amended listings
Department of Health
Administered expenses 4.8 - (7) (2,294) (2,996) (4,234)
Total expenses - (7) (2,294) (2,996) (4,234)
Unlegislated Budget Repair Measures – not proceeding
Department of Health
Administered expenses 4.1 - 293,346 310,338 331,137 349,947
4.3 - 175,958 212,160 254,443 290,614
Departmental expenses 4.1 - (673) (668) (669) (672)
Department of Human Services
Departmental expenses (422) (6,297) (5,547) (4,195) (4,377)
Department of Veterans' Affairs
Administered expenses - 3,536 3,765 3,761 3,756
Total expenses (422) 465,870 520,048 584,477 639,268
Outcome 5: Regulation, Safety and Protection
Ban on Cosmetic Testing on Animals - implementation (a)
Department of Health
Administered expenses 5.1 - - - - -
Total expenses - - - - -
Improving Access to Medicines - antivenoms, Q fever and pandemic influenza vaccines supply
Department of Health
Administered expenses 5.2 nfp nfp nfp nfp nfp
Total expenses nfp nfp nfp nfp nfp
Improving Access to Medicines - National Medical Stockpile - replenishment and operations
Department of Health
Administered expenses 5.2 - 541 4,916 4,899 -
Administered capital 5.2 - 25,000 25,000 25,000 -
Total - 25,541 29,916 29,899 -

Section 1 – Entity Overview and Resources
35
Table 1.2: Department of Health 2017-18 Budget Measures (continued)
Program 2016-17$'000
2017-18$'000
2018-19$'000
2019-20 $'000
2020-21 $'000
Supporting No Jab No Pay - improving awareness and uptake of immunisation
Department of Health
Administered expenses 5.3 - 2,500 1,500 - -
Total expenses - 2,500 1,500 - -
Supporting No Jab No Pay - National Immunisation Program - expansion
Department of Health
Administered expenses 5.3 - (2,080) 5,107 5,107 5,107
Department of the Treasury
Administered expenses 5.3 - 226 226 226 226
Total expenses - (1,854) 5,333 5,333 5,333
Outcome 6: Ageing and Aged Care
Strengthening Aged Care - developing an aged care workforce strategy
Department of Health
Administered expenses 2.3 - (1,460) (460) - -
6.4 - 1,460 460 - -
Total expenses - - - - -
Strengthening Aged Care - Commonwealth Home Support Program Funding Arrangements - extension
Department of Health
Administered expenses 6.2 - - - - -
Total expenses - - - - -
Strengthening Aged Care - My Aged Care - operations
Department of Health
Administered expenses 6.1 - 3,071 - - -
Total expenses - 3,071 - - -
Whole of Government Measures (b)
Public Service Modernisation Fund - agency sustainability
Australian Sports Anti-Doping Authority
Departmental capital 1.1 - - - - -
Australian Sports Commission
Departmental expenses 1.1 - - - - -
National Health and Medical Research Council
Departmental expenses 1.1 - - - - -
Departmental capital 1.1 - - - - -
Total - - - - -

Budget Statements – Department of Health
36
Table 1.2: Department of Health 2017-18 Budget Measures (continued)
Program 2016-17$'000
2017-18$'000
2018-19$'000
2019-20 $'000
2020-21 $'000
Public Service Modernisation Fund - transformation and innovation stream
Department of Health
Departmental expenses 1.1 - - - - -
Australian Institute of Health and Welfare
Departmental expenses 1.1 - - - - -
Total expenses - - - - -
Other Portfolio Measures (b)
Better targeting skilled visas
Department of Immigration and Border Protection
Department of Health
Administered expenses 4.1 - 192 (628) (1,803) (7,663)
4.3 - 39 (112) (494) (1,621)
Total expenses - 231 (740) (2,297) (9,284)
Boosting the Local Care Workforce
Department of Social Services
Department of Health
Administered expenses 6.4 - (3,000) - - -
Total expenses - (3,000) - - -
Commonwealth Redress Scheme for Survivors of Institutional Child Sexual Abuse
Department of Social Services
Department of Health
Administered expenses 2.1 - 1,783 nfp nfp nfp
Departmental expenses 2.1 - 361 nfp nfp nfp
Total expenses - 2,144 nfp nfp nfp
Consistent Income Treatment for Families Receiving Family Tax Benefit Part A
Department of Social Services
Department of Health
Administered expenses 4.1 - - (216) (242) (251)
4.6 - - (2,807) (7,148) (8,586)
Total expenses - - (3,023) (7,390) (8,837)
Enhanced Residency Requirements for Pensioners
Department of Social Services
Department of Health
Administered expenses 4.2 - - (206) (597) (929)
Total expenses - - (206) (597) (929)
Family Tax Benefit Part A rate increase - not proceeding
Department of Social Services
Department of Health
Administered expenses 4.1 - - (18) (18) (19)
Total expenses - - (18) (18) (19)

Section 1 – Entity Overview and Resources
37
Table 1.2: Department of Health 2017-18 Budget Measures (continued)
Program 2016-17$'000
2017-18$'000
2018-19$'000
2019-20 $'000
2020-21 $'000
Funding the Jobs for Families Package
Department of Social Services
Department of Health
Administered expenses 4.1 - (63) (162) (192) (196)
Total expenses - (63) (162) (192) (196)
Improved Access to Health Care for Australian Participants of British Nuclear Tests and Veterans of the British Commonwealth Occupation Force
Department of Veterans' Affairs
Department of Health
Administered expenses 4.1 - (4,115) (3,531) (2,987) (2,537)
4.3 - (6,135) (5,500) (4,718) (4,007)
6.3 - (22,512) (19,685) (17,037) (14,486)
Total expenses - (32,762) (28,716) (24,742) (21,030)
Mental Health Treatment for Current and Former Members of the Australian Defence Force - expanded access
Department of Veteran's Affairs
Department of Health
Administered expenses 4.1 - (257) (585) (589) (476)
6.3 - (427) (2,218) (3,602) (4,873)
Total expenses - (684) (2,803) (4,191) (5,349)
National Disability Insurance Scheme - finalisation of transition arrangements
Department of Social Services
Department of Health
Administered expenses 2.1 - - - (9,407) (14,900)
6.1 - 3,944 2,670 3,599 2,866
6.2 - 263 254,680 300,070 312,452
6.3 - (8,962) (16,299) (31,414) (36,899)
Administered revenue 6.2 - - (4,273) (33,896) -
6.3 - - (17,132) (3,993) -
Departmental expenses 6.1 577 4,648 5,648 3,307 2,811
Australian Aged Care Quality Agency
Departmental expenses 1.1 - - 205 205 207
Total 577 (107) 225,499 228,471 266,537
Supporting No Jab No Pay - Healthy Start for School - new compliance arrangements
Department of Social Services
Department of Health
Administered expenses 4.1 - - 43 36 30
4.6 - - 389 319 258
Total expenses - - 432 355 288
(a) The cost of this measure will be met from within existing resources. (b) The Department of Health is not the lead entity for these measures. Only the Health Portfolio impacts are
shown in this table.

Budget Statements – Department of Health
38

Section 2 – Outcomes and Planned Performance
39
Section 2: Outcomes and Planned Performance
Government outcomes are the intended results, impacts or consequences of actions by the Government on the Australian community. Commonwealth programs are the primary vehicle by which government entities achieve the intended results of their outcome statements. Entities are required to identify the programs which contribute to government outcomes over the Budget and forward years.
Each outcome is described below together with its related programs. The following provides detailed information on expenses for each outcome and program, further broken down by funding source.
Note:
Performance reporting requirements in the Portfolio Budget Statements are part of the Enhanced Commonwealth Performance Framework established by the Public Governance, Performance and Accountability Act 2013. It is anticipated that the performance criteria described in Portfolio Budget Statements will be read with broader information provided in an entity’s corporate plans and annual performance statements – included in Annual Reports – to provide an entity’s complete performance story.
The Department’s most recent corporate plan is available at: www.health.gov.au/internet/publications/publishing.nsf/Content/corporate-plan-2016-17-toc
The Department’s most recent annual performance statement is available at: www.health.gov.au/internet/main/publishing.nsf/Content/ annual-report2015-16
Review of performance information
The Department of Health has undertaken a comprehensive review of its performance information. The purpose of the review was to further develop performance reporting (under the Enhanced Commonwealth Performance Framework) in order to create a clearer picture of the Department's overall performance, with a specific focus on reliable and meaningful reporting, while highlighting public outcomes.
Results against the Department’s performance criteria published in the 2016-17 Health Portfolio Budget Statements will be reported in the Department of Health’s 2016-17 Annual Performance Statements.

Budget Statements – Department of Health
40

Section 2 – Department Outcomes – 1: Health System Policy, Design and Innovation
41
Ou
tco
me
1 2.1 BUDGET EXPENSES AND PERFORMANCE FOR OUTCOME 1
Outcome 1: Health System Policy, Design and Innovation
Australia’s health system is better equipped to meet current and future health needs by applying research, evaluation, innovation, and use of data to develop and implement integrated, evidence-based health policies, and through support for sustainable funding for health infrastructure
Programs Contributing to Outcome 1
Program 1.1: Health Policy Research and Analysis
Program 1.2: Health Innovation and Technology
Program 1.3: Health Infrastructure
Program 1.4: Health Peak and Advisory Bodies
Program 1.5: International Policy
Linked Programs
Other Commonwealth entities that contribute to Outcome 1
Australian Commission on Safety and Quality in Health Care1 Program 1.1: Safety and Quality in Health Care The Australian Commission on Safety and Quality in Health Care contributes to this Outcome by working to strengthen safety and quality across Australia’s health care system in order to reduce patient risks and generate efficiencies (1.1).
Australian Digital Health Agency2 Program 1.1: Digital Health The Australian Digital Health Agency contributes to this Outcome by managing and governing the national digital health strategy, and the design, delivery and operations of the national digital healthcare system (1.2).
Australian Institute of Health and Welfare3 Program 1.1: Develop, Collect, Analyse and Report High Quality National Health and Welfare Information and Statistics for Governments and the Community The Australian Institute of Health and Welfare contributes to this Outcome by providing high quality national health related data and analysis (1.1).
Department of Foreign Affairs and Trade Program 1.5: Payments to International Organisations The Department of Foreign Affairs and Trade contributes to this Outcome by working with the Department of Health in promoting regional and global strategic interests as they relate to health (1.5).
1 Refer to the Australian Commission on Safety and Quality in Health Care chapter in these Portfolio Budget
Statements for further information on the work of this entity. 2 Refer to the Australian Digital Health Agency chapter in these Portfolio Budget Statements for further
information on the work of this entity. 3 Refer to the Australian Institute of Health and Welfare chapter in these Portfolio Budget Statements for
further information on the work of this entity.
Budget Statements – Department of Health
42
Department of Human Services Program 1.2: Services to the Community – Health The Department of Human Services contributes to ensuring that Australia’s health system is better equipped to meet current and future health needs by administering the Australian Organ Donor Register (1.1).
Department of Industry, Innovation and Science Program 1: Supporting Science and Commercialisation Program 2: Growing Business Investment and Improving Business Capability The Department of Industry, Innovation and Science contributes to this Outcome by working with the Department of Health to implement the Biomedical Translation Fund and strategies aimed at making Australia more competitive in relation to clinical trials (1.1).
National Blood Authority4 Program 1.1: National Blood Agreement Management The National Blood Authority works to save and improve Australian lives through a world-class blood supply that is safe, secure, affordable and well-managed (1.1).
National Health and Medical Research Council5 Program 1.1: Health and Medical Research The National Health and Medical Research Council contributes to this Outcome by developing evidence-based health advice for the Australian community, health professionals and Governments, and providing advice on ethical practice in health care and in the conduct of health and medical research (including clinical trials), and administrating research grant programs on behalf of the Department of Health (1.1).
Organ and Tissue Authority6 Program 1.1: A Nationally Coordinated System for Organ and Tissue Donation for Transplantation The Organ and Tissue Authority works to maximise organ and tissue donation for transplantation by increasing the capacity within the health system, and raising community awareness and stakeholder engagement in support of donation (1.1).
The Treasury Program 1.9: National Partnership Payments to the States The Treasury makes National Partnership Payments to the State and Territory Governments as part of the Federal Financial Relations Framework.7 Activities funded through the following National Partnership Agreements contribute to the Government’s objectives identified within this Outcome: - Hepatitis C settlement fund (1.1) - More Clinical Trials in Australia (1.1) - Health infrastructure projects (1.3) - Proton Beam Facility in South Australia (1.3) - Albury-Wodonga Cardiac Catheterisation Laboratory (1.3).
4 Refer to the National Blood Authority chapter in these Portfolio Budget Statements for further information
on the work of this entity. 5 Refer to the National Health and Medical Research Council chapter in these Portfolio Budget Statements
for further information on the work of this entity. 6 Refer to the Organ and Tissue Authority chapter in these Portfolio Budget Statements for further
information on the work of this entity. 7 For Budget estimates relating to the National Partnership component of the program, refer to
Budget Paper No. 3 or Program 1.9 of the Treasury’s Portfolio Budget Statements.

Section 2 – Department Outcomes – 1: Health System Policy, Design and Innovation
43
Ou
tco
me
1 Table 2.1.1: Budgeted Expenses for Outcome 1
Table 2.1.1 shows how much the entity intends to spend (on an accrual basis) on achieving the outcome, broken down by program, as well as by administered and departmental funding sources.
2016-17 Estimated
actual $'000
2017-18 Budget
$'000
2018-19 Forward
Year 1 $'000
2019-20 Forward
Year 2 $'000
2020-21 Forward
Year 3 $'000
Program 1.1: Health Policy Research and Analysis (a)
Administered expenses
Ordinary annual services (b) 55,191 50,512 51,080 53,976 39,389
Special Accounts
Medical Research Future Fund 60,876 121,565 214,913 386,373 642,886
Special appropriations
National Health Act 1953 - blood fractionation, products and blood related products to National Blood Authority 664,802 748,914 800,066 852,943 928,507
Public Governance, Performance and Accountability Act 2013 s77 - repayments 2,000 2,000 2,000 2,000 2,000
Departmental expenses
Departmental appropriation (c) 63,732 60,789 60,711 60,100 59,991
Expenses not requiring appropriation 1,569 1,961 1,659 1,659 in the Budget year (d) 3,966
Total for Program 1.1 850,567 985,349 1,130,731 1,357,051 1,674,432
Program 1.2: Health Innovation and Technology
Administered expenses
Ordinary annual services (b) 41,363 50,533 3,104 369 441
Departmental expenses
Departmental appropriation (c) 11,627 14,276 9,968 9,854 9,833
Expenses not requiring appropriation 197 246 208 208 in the Budget year (d) 733
Total for Program 1.2 53,723 65,006 13,318 10,431 10,482

Budget Statements – Department of Health
44
Table 2.1.1: Budgeted Expenses for Outcome 1 (continued)
2016-17 Estimated
actual $'000
2017-18 Budget
$'000
2018-19 Forward
Year 1 $'000
2019-20 Forward
Year 2 $'000
2020-21 Forward
Year 3 $'000
Program 1.3: Health Infrastructure (a)
Administered expenses
Ordinary annual services (b) 5,797 8,712 911 911 911
Special appropriations
Health Insurance Act 1973 - payments relating to the former Health and Hospitals Fund 37,321 37,631 18,965 - -
Departmental expenses
Departmental appropriation (c) 2,787 2,659 2,656 2,630 2,625
Expenses not requiring appropriation 46 58 49 49 in the Budget year (d) 194
Total for Program 1.3 46,099 49,048 22,590 3,590 3,585
Program 1.4: Health Peak and Advisory Bodies
Administered expenses
Ordinary annual services (b) 7,983 7,559 7,458 7,320 7,657
Departmental expenses
Departmental appropriation (c) 1,504 1,436 1,434 1,420 1,418
Expenses not requiring appropriation 25 31 26 26 in the Budget year (d) 121
Total for Program 1.4 9,608 9,020 8,923 8,766 9,101
Program 1.5: International Policy
Administered expenses
Ordinary annual services (b) 14,340 17,120 17,120 17,651 18,203
Departmental expenses
Departmental appropriation (c) 7,471 7,134 7,125 7,056 7,043
Expenses not requiring appropriation 120 150 127 127 in the Budget year (d) 586
Total for Program 1.5 22,397 24,374 24,395 24,834 25,373
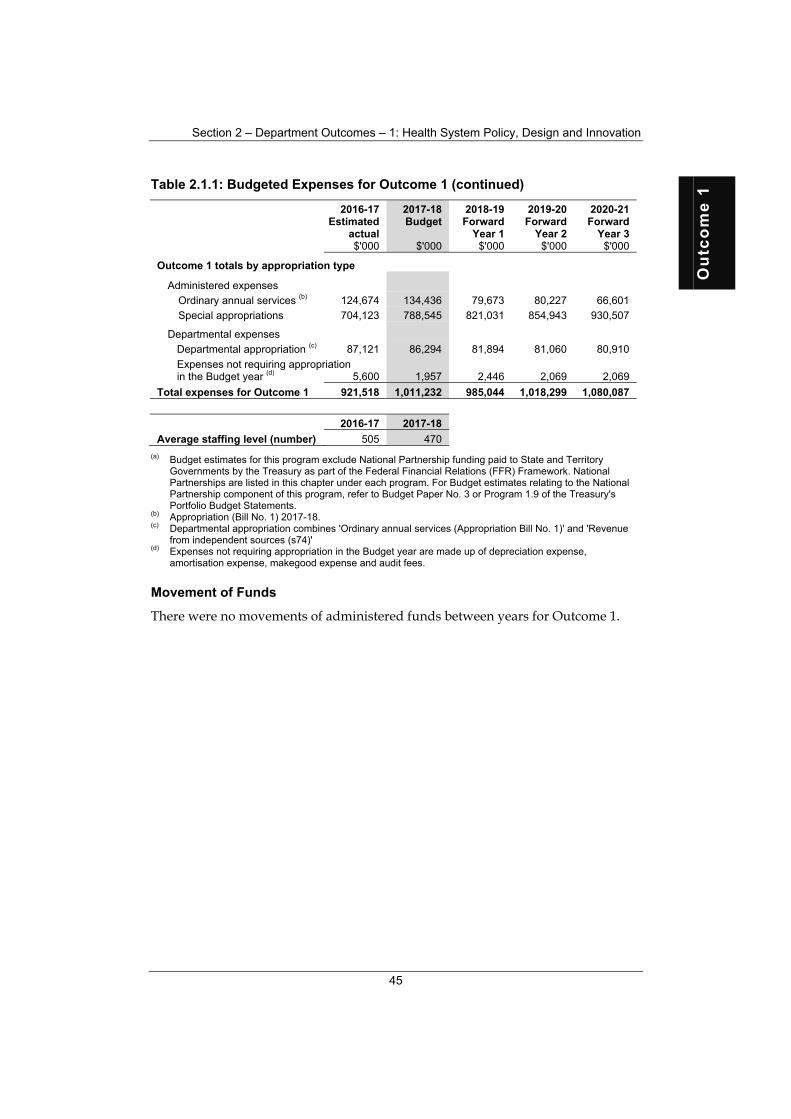
Section 2 – Department Outcomes – 1: Health System Policy, Design and Innovation
45
Ou
tco
me
1 Table 2.1.1: Budgeted Expenses for Outcome 1 (continued)
2016-17 Estimated
actual $'000
2017-18 Budget
$'000
2018-19 Forward
Year 1 $'000
2019-20 Forward
Year 2 $'000
2020-21 Forward
Year 3 $'000
Outcome 1 totals by appropriation type
Administered expenses
Ordinary annual services (b) 124,674 134,436 79,673 80,227 66,601
Special appropriations 704,123 788,545 821,031 854,943 930,507
Departmental expenses
Departmental appropriation (c) 87,121 86,294 81,894 81,060 80,910
Expenses not requiring appropriation 1,957 2,446 2,069 2,069 in the Budget year (d) 5,600
Total expenses for Outcome 1 921,518 1,011,232 985,044 1,018,299 1,080,087
2016-17 2017-18
Average staffing level (number) 505 470
(a) Budget estimates for this program exclude National Partnership funding paid to State and Territory Governments by the Treasury as part of the Federal Financial Relations (FFR) Framework. National Partnerships are listed in this chapter under each program. For Budget estimates relating to the National Partnership component of this program, refer to Budget Paper No. 3 or Program 1.9 of the Treasury's Portfolio Budget Statements.
(b) Appropriation (Bill No. 1) 2017-18. (c) Departmental appropriation combines 'Ordinary annual services (Appropriation Bill No. 1)' and 'Revenue
from independent sources (s74)' (d) Expenses not requiring appropriation in the Budget year are made up of depreciation expense,
amortisation expense, makegood expense and audit fees.
Movement of Funds
There were no movements of administered funds between years for Outcome 1.

Budget Statements – Department of Health
46
Planned Performance for Outcome 1
Tables 2.1.2 – 2.1.6 below detail the performance criteria for each program associated with Outcome 1. These tables also summarise how each program is delivered and where 2017-18 Budget measures have materially changed existing programs.
Table 2.1.2: Performance Criteria for Program 1.1
Purpose
Lead and shape Australia’s health and aged care system and sporting outcomes through evidence-based policy, well targeted programs, and best practice regulation.
Outcome 1: Health System Policy, Design and Innovation
Australia’s health system is better equipped to meet current and future health needs by applying research, evaluation, innovation, and use of data to develop and implement integrated, evidence-based health policies, and through support for sustainable funding for health infrastructure
Program 1.1: Health Policy Research and Analysis
The Australian Government will increase investment in health and medical research, and work to strengthen safety and quality across the health system to reduce patient risks and generate efficiencies. This includes working with States and Territories to ensure a nationally consistent approach to achieving better health outcomes for all Australians. The Government aims to provide Australians with access to an adequate, safe, secure, and affordable blood supply and access to organ, tissue and Haemopoietic Progenitor Cell transplants. The 2017-18 Budget will provide $4.1 million over four years to support living organ donors, to ensure that cost is not a barrier when deciding to donate a kidney or part of their liver. With more organs being donated, fewer transplant recipients will require dialysis. The Government will also invest $2.2 million to extend operational funding for the Cardiac Devices Registry and the Australian Breast Device Registry. This will support better health care and outcomes for patients with implanted high-risk cardiac and breast devices. Over the next four years the Government will move substantially towards doubling its current medical research funding. The 2017-18 Budget starts the Government’s disbursements from its landmark Medical Research Future Fund (MRFF) worth $20 billion by 2021. This will deliver disbursements of $1.4 billion over the next five years from 2016-17. This will play a key role in building a stronger, sustainable health system, capable of addressing the pressures that confront us: disease complexity; ageing and chronic conditions; lifestyle behaviours; new technologies; communicable diseases; and increasing consumer expectations. First earnings of $65.9 million from the MRFF from 2016-17 will fund eight strategic investments, aligned with the independent Australian Medical Research Advisory Board’s Strategy and Priorities. A balance of long-term research and quick win programs will improve health system efficiency, patient care and access, health outcomes, and innovation in health. The initiatives include:
$20 million for preventive health and research translation projects. Including $10 million for Advanced Health Translation Centres and $10 million for the Australian Prevention Partnership Centre.
$33 million for clinical trials and to build on Australia’s world class strengths to ensure Australia is a preferred destination for clinical trial research.
$12.9 million for breakthrough research investments to drive cutting edge science and accelerate research for better treatments and cures.

Section 2 – Department Outcomes – 1: Health System Policy, Design and Innovation
47
Ou
tco
me
1
Delivery
A. Collaborating with States and Territories to facilitate a nationally consistent focus on achieving better health outcomes for all Australians
Support Australian Government officials on the Council of Australian Governments’ Health Council and the Australian Health Ministers’ Advisory Council to collaborate with States and Territories on health issues.
B. Improving health policy research and data capacity
Support health and medical research and innovation through the Medical Research Future Fund, by providing financial assistance to relevant research bodies with the objective of improving the health and wellbeing of Australians.
Invest in promising late-stage biomedical and technological discoveries via the Biomedical Translation Fund with the intent of bringing new drugs, devices and therapies to the market to benefit Australians.
Work with States and Territories to redesign clinical trial operating systems to make it easier to conduct and participate in safe, high quality clinical trials, in accordance with the Government’s More Clinical Trials in Australia measure.
C. Improving access to organ, tissue and Haemopoietic Progenitor Cell transplants and blood and blood products for life saving treatments
Continue to fund and administer the Haemopoietic Progenitor Cell program, providing financial assistance and affordable access for patients requiring life-saving Haemopoietic Progenitor Cell transplants.
In consultation with other Commonwealth entities and State and Territory Governments, utilise the Haemopoietic Progenitor Cell sector review findings to develop improvements in the Haemopoietic Progenitor Cell sector structure, funding mechanisms and governance.
Contribute to the planning and management of the national blood supply through the National Supply Plan and Budget to ensure sufficient access for all eligible Australians to blood and blood products.
Continue to work with the National Blood Authority and States and Territories to progress key policy priority areas under the 2016–18 Jurisdictional Blood Committee Strategic Plan.
Continue to provide policy advice to support the National Blood Authority in managing and maintaining the blood sector systems to provide clinical, data, accountability and supply chain resilience.

Budget Statements – Department of Health
48
Performance criteria
A. Collaborating with States and Territories to facilitate a nationally consistent focus on achieving better health outcomes for all Australians
Support Australian Government officials on the Council of Australian Governments’ (COAG) Health Council and the Australian Health Ministers’ Advisory Council to progress health issues with States and Territories.
2016-17 Estimated result 2017-18 Target 2018-19 (& beyond) Target
Health issues were progressed by Australian Health Ministers’ Advisory Council and the COAG Health Council.8
Health issues will be progressed by Australian Health Ministers’ Advisory Council and the COAG Health Council.
As per 2017-18.
B. Improving health policy research and data capacity
Provide a sustainable source of funding for transformative health and medical research that improves lives, contributes to health system sustainability and drives innovation.
2016-17 Estimated result 2017-18 Target 2018-19 (& beyond) Target
The Australian Medical Research Advisory Board developed and released the Australian Medical Research and Innovation Strategy 2016-2021 and related Priorities 2016–2018.9 These documents will guide future investments for the Medical Research Future Fund in health and medical research. The first Medical Research Future Fund disbursements will fund eight strategic investments.
Further Medical Research Future Fund disbursements will be announced consistent with the Australian Medical Research Advisory Board’s Strategy and Priorities, with an increased focus on long-term and transformative investments. The Australian Medical Research Advisory Board will commence consultation on the 2018–2020 Priorities.
The second set of Medical Research Future Fund Priorities will be released in late 2018 following public consultation. Further disbursements will be made consistent with the Medical Research Future Fund Act 2015.
8 Further information available at: www.coaghealthcouncil.gov.au/Announcements/Meeting-Communiques1 9 Further information available at: www.health.gov.au/internet/main/publishing.nsf/Content/mrff

Section 2 – Department Outcomes – 1: Health System Policy, Design and Innovation
49
Ou
tco
me
1
Improve health outcomes and bring economic benefits to Australia through investing in biomedical discoveries with potential.
2016-17 Estimated result 2017-18 Target 2018-19 (& beyond) Target
Three fund managers were selected and licensed under the Biomedical Translation Fund.10 Each manager has secured private capital that has matched, if not exceeded, the Commonwealth contribution.
Biomedical Translation Fund managers will continue to identify suitable investees and manage portfolio investments consistent with program guidelines.11
As per 2017-18.
Better position Australia globally as a preferred destination for clinical trials.
2016-17 Estimated result 2017-18 Target 2018-19 (& beyond) Target
Council of Australian Governments’ Health Council agreement on principles and key priorities action areas12 were agreed on 24 March 2017. Proposals from States and Territories were received and considered, with project agreements due to be executed in mid-2017.
Assist States and Territories to improve administration efficiency, sponsorship engagement, recruitment and start-up times by streamlining their clinical trial systems. Monitor State and Territory system redesign agendas as per project agreements.
As per 2017-18.
10 Further information available at: www.innovation.gov.au/page/biomedical-translation-fund 11 Further information available at: www.business.gov.au/assistance/biomedical-translation-fund 12 Further information available at: www.health.gov.au/internet/main/publishing.nsf/Content/mr-yr17-dept-
dept005.htm
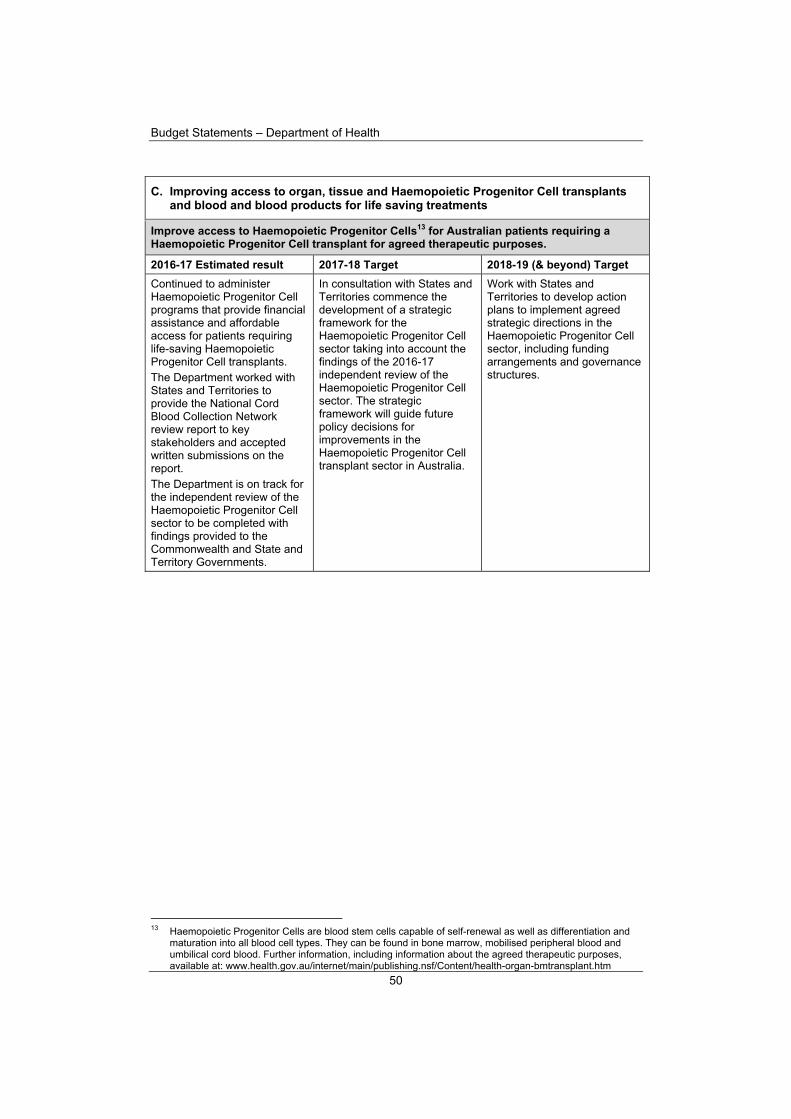
Budget Statements – Department of Health
50
C. Improving access to organ, tissue and Haemopoietic Progenitor Cell transplants and blood and blood products for life saving treatments
Improve access to Haemopoietic Progenitor Cells13 for Australian patients requiring a Haemopoietic Progenitor Cell transplant for agreed therapeutic purposes.
2016-17 Estimated result 2017-18 Target 2018-19 (& beyond) Target
Continued to administer Haemopoietic Progenitor Cell programs that provide financial assistance and affordable access for patients requiring life-saving Haemopoietic Progenitor Cell transplants. The Department worked with States and Territories to provide the National Cord Blood Collection Network review report to key stakeholders and accepted written submissions on the report. The Department is on track for the independent review of the Haemopoietic Progenitor Cell sector to be completed with findings provided to the Commonwealth and State and Territory Governments.
In consultation with States and Territories commence the development of a strategic framework for the Haemopoietic Progenitor Cell sector taking into account the findings of the 2016-17 independent review of the Haemopoietic Progenitor Cell sector. The strategic framework will guide future policy decisions for improvements in the Haemopoietic Progenitor Cell transplant sector in Australia.
Work with States and Territories to develop action plans to implement agreed strategic directions in the Haemopoietic Progenitor Cell sector, including funding arrangements and governance structures.
13 Haemopoietic Progenitor Cells are blood stem cells capable of self-renewal as well as differentiation and
maturation into all blood cell types. They can be found in bone marrow, mobilised peripheral blood and umbilical cord blood. Further information, including information about the agreed therapeutic purposes, available at: www.health.gov.au/internet/main/publishing.nsf/Content/health-organ-bmtransplant.htm

Section 2 – Department Outcomes – 1: Health System Policy, Design and Innovation
51
Ou
tco
me
1
Ensure access to a safe and secure supply of essential blood and blood products to meet Australia’s clinical need through strategic policy and funding contributions.
2016-17 Estimated result 2017-18 Target 2018-19 (& beyond) Target
Under the National Blood Arrangements, continued to work with States and Territories and the National Blood Authority to progress a number of key strategic priority areas under the 2016–18 Jurisdictional Blood Committee’s three year strategic plan. Effectively planned and managed the annual blood supply through supporting the implementation of the 2016-17 National Supply Plan and Budget,14 including management of the Commonwealth’s funding contribution and the strategic development and approval of the 2017-18 National Supply Plan and Budget.
Continue working with States and Territories and the National Blood Authority to meet the objectives of the National Blood Agreement15 through ongoing involvement and contribution to strategic policy development and advice to the Ministerial Council. Effective planning and management of the annual blood supply through supporting the implementation, development and approval of the annual National Supply Plan and Budget, including management of the Commonwealth’s funding contribution under the National Blood Agreement.
As per 2017-18.
Material changes to Program 1.1 resulting from the following measures: Supporting Living Organ Donors – continuation and expansion
14 Further information available at: www.blood.gov.au/supply-planning 15 Further information available at: www.blood.gov.au/national-blood-agreement

Budget Statements – Department of Health
52
Table 2.1.3: Performance Criteria for Program 1.2
Program 1.2: Health Innovation and Technology
The Australian Government will lead the way with a digital health system that aims to meet Australia’s current and future needs. The aim is to facilitate accurate, safe and secure sharing of information between healthcare providers to provide benefits and efficiencies to the healthcare system overall and deliver safer, better quality healthcare. The Government will continue to own and operate the health and aged care payments system. The Government will invest $67.3 million to replace the outmoded IT systems supporting health, aged care and related veterans’ payments with a new digital payments platform, while ensuring the existing systems continue to operate reliably and effectively. The Department will work with the Australian Digital Health Agency to continue the Government’s commitment to improve operation of the My Health Record system, which allows individuals to access and control their own medical history and treatments – such as vaccinations. Following unanimous support by the Council Of Australian Governments for a national rollout of the My Health Record, the Government will invest $374.2 million over two years to ensure every Australian has a My Health Record, unless they prefer not to. This will support the expanded rollout of the opt-out model to all Australians, and will continue and improve operations of My Health Record, while making it easier for health providers to register for the system. For further information refer to the Australian Digital Health Agency chapter in these Portfolio Budget Statements.
Delivery
A. Supporting the Government’s Digital Health agenda
Provide timely and well informed policy advice to the Australian Government.
Work with and support the Australian Digital Health Agency by providing policy and legislative advice.
Identify options for a new digital payments platform for the health and aged care payments system.
Performance criteria
A. Supporting the Government’s Digital Health agenda
Support the Minister and the Australian Digital Health Agency to improve health outcomes for Australians through digital health systems.
2016-17 Estimated result 2017-18 Target 2018-19 (& beyond) Target
National digital health governance arrangements, My Health Record system operations and resources successfully transitioned from the Department and the National eHealth Transition Authority to the Australian Digital Health Agency.
Provide high quality, relevant and well-informed research, policy and legal advice, within agreed timeframes, to inform and support the Australian Government’s digital health agenda.16
As per 2017-18.
Material changes to Program 1.2 resulting from the following measures:
My Health Record – continuation and expansion
16 Further information available at: conversation.digitalhealth.gov.au

Section 2 – Department Outcomes – 1: Health System Policy, Design and Innovation
53
Ou
tco
me
1 Table 2.1.4: Performance Criteria for Program 1.3
Program 1.3: Health Infrastructure
The Australian Government supports improvements to the health system through strategic investments in health infrastructure, which enable general practices to deliver increased health services and increased opportunities to provide teaching and training for health practitioners. In the 2017-18 Budget, funding of $68 million will be provided to the South Australian Government to purchase accelerator equipment and treatment rooms to support the establishment of Australia’s first Proton Beam Therapy facility for advanced research and treatment of cancer.
Delivery
A. Improving and investing in health infrastructure
Work in partnership with general practices to improve and update health infrastructure in rural and regional Australia.
Provide Rural General Practice Grants for existing general practices to strengthen the rural health workforce through additional infrastructure.
Performance criteria
A. Improving and investing in health infrastructure
Investment in health infrastructure supports improved health services.
2016-17 Estimated result 2017-18 Target 2018-19 (& beyond) Target
Infrastructure projects have been monitored and expected outcomes have been met.
Monitor infrastructure projects for compliance to demonstrate effective delivery of infrastructure projects which support local services.
As per 2017-18.
Material changes to Program 1.3 resulting from the following measures:
Proton Beam Facility in South Australia

Budget Statements – Department of Health
54
Table 2.1.5: Performance Criteria for Program 1.4
Program 1.4: Health Peak and Advisory Bodies
The Australian Government will enable national health peak and advisory bodies to contribute to the national health agenda by supporting communication and consultation activities and the provision of expert, evidence-based and impartial advice to inform the development of health policies and programs.
Delivery
A. Engaging with the health sector to communicate and facilitate the development of informed health policy
Support national peak organisations to consult with their members, the wider health sector and the community on health policy and program matters.
Support national peak organisations to share information about particular health matters, including Australian Government health policies and programs, with their members, the health sector and the community.
Performance criteria
A. Engaging with the health sector to communicate and facilitate the development of informed health policy
Successfully harness the health sector to share information relating to the Australian Government’s health agenda.
2016-17 Estimated result 2017-18 Target 2018-19 (& beyond) Target
The Department maintained agreements with health-related national peak and advisory bodies to disseminate information and provide advice on health issues, which were considered when health policies and programs were developed.
Maintain agreements with health-related national peak and advisory bodies in order to harness input into the Australian Government’s health agenda, through information sharing and relevant, well-informed advice.
As per 2017-18.
Material changes to Program 1.4 resulting from the following measures:
There are no material changes to Program 1.4 resulting from measures.

Section 2 – Department Outcomes – 1: Health System Policy, Design and Innovation
55
Ou
tco
me
1 Table 2.1.6: Performance Criteria for Program 1.5
Program 1.5: International Policy
The Australian Government will pursue Australia’s health interests through multilateral engagements, country-to-country partnerships and analysis of international best practice.
Delivery
A. Engaging internationally on health issues
Continue to monitor developments in international best practice, including through collaboration with Commonwealth and State and Territory government agencies and other partners.
Capitalise on Australia’s membership in multilateral institutions and in regional collaborative settings to advance Australia’s international health priorities.
Seek out opportunities, through international engagement, to lead and shape Australia’s health and aged care systems and sporting outcomes.
Develop and forge new bilateral relationships with target countries.
Performance criteria
A. Engaging internationally on health issues
Australia’s health system integrates evidence-based international norms and standards and remains at the forefront of international best practice.
2016-17 Estimated result 2017-18 Target 2018-19 (& beyond) Target
The Department actively engaged internationally to protect the health of Australians and advance Australian interests. Significant fora included the: - World Health Organization
Western Pacific Regional Committee meeting;
- Organisation for Economic Co-operation and Development Ministerial meeting and Health Committee;17
- Asia-Pacific Economic Cooperation Senior Officials Meetings;18 and
- Commonwealth Fund International Symposium.
Australia’s engagement and active participation at the World Health Organization, the Organisation for Economic Co-operation and Development Health Committee and Asia-Pacific Economic Cooperation Health Working Group contributes to development and adoption of international best practice, improved governance and focus on identifying and responding to global health security threats.
As per 2017-18.
17 Further information available at: www.oecd.org/health/ministerial/ministerial-statement-2017.pdf 18 Further information available at: www.apec.org/About-Us/How-APEC-Operates/Working-Level

Budget Statements – Department of Health
56
Australia’s relationships with key countries are strengthened and its interests in health are supported.
2016-17 Estimated result 2017-18 Target 2018-19 (& beyond) Target
The Department has worked to strengthen and invigorate long standing relationships as well as build new relationships with emerging countries in the Western Pacific region. A health cooperation Memorandum of Understanding between Australia and the United States was signed in January 2017. India-Australia and Germany-Australia Memoranda of Understanding were completed in April and May respectively. The Memoranda of Understanding provide platforms to form strategic partnerships on new health related technologies and to continue dialogue on managing global health challenges.
Departmental representatives actively promote international cooperation on a case-by-case basis to build relationships, encourage information exchanges and support capacity building to protect the health of Australians and others in the Western Pacific region. Work with the World Health Organization Western Pacific Regional Office to host the sixty-eighth session of the World Health Organization Regional Committee for the Western Pacific in October 2017.
As per 2017-18.
Material changes to Program 1.5 resulting from the following measures:
There are no material changes to Program 1.5 resulting from measures.

Section 2 – Department Outcomes – 2: Health Access and Support Services
57
Ou
tco
me
2
2.2 BUDGETED EXPENSES AND PERFORMANCE FOR OUTCOME 2
Outcome 2: Health Access and Support Services
Support for sustainable funding for public hospital services and improved access to high quality, comprehensive and coordinated preventive, primary and mental health care for all Australians, with a focus on those with complex health care needs and those living in regional, rural and remote areas, including through access to a skilled health workforce
Programs Contributing to Outcome 2
Program 2.1: Mental Health
Program 2.2: Aboriginal and Torres Strait Islander Health
Program 2.3: Health Workforce
Program 2.4: Preventive Health and Chronic Disease Support
Program 2.5: Primary Health Care Quality and Coordination
Program 2.6: Primary Care Practice Incentives
Program 2.7: Hospital Services
Linked Programs
Other Commonwealth entities that contribute to Outcome 2
Cancer Australia1 Program 1.1: Improved Cancer Control Cancer Australia provides national leadership in cancer control and works with the Department of Health to improve the detection, treatment and survival outcomes for people with cancer (2.4).
Department of Human Services Program 1.2: Services to the Community – Health The Department of Human Services administers payments and services to eligible recipients under the following programs/initiatives administered by the Department of Health, to contribute to the Government’s objectives within this Outcome: - Indigenous access to the Pharmaceutical Benefits Scheme (2.2) - General Practice Rural Incentives Program (2.3) - Practice Nurse Incentive Program (2.3) - Rural Procedural Grants Program (2.3) - Scaling of Rural Workforce Program (2.3) - Support cervical cancer screening (2.4) - Health Care Homes Program (2.5 and 2.6) - Incentive payments to general practices, GPs and Indigenous health services (2.6). In addition, the Department of Human Services administers the National Bowel Cancer Screening Register (2.4).
1 Refer to the Cancer Australia chapter in these Portfolio Budget Statements for further information on the
work of this entity.

Budget Statements – Department of Health
58
Department of Immigration and Border Protection Program 2.4: Refugee and Humanitarian Assistance The Department of Immigration and Border Protection facilitates access to health and support services by determining annual client numbers for the Program of Assistance for Survivors of Torture and Trauma (2.1).
Department of Industry, Innovation and Science Program 3: Program Support Through the National Measurement Institute, the Department of Industry, Innovation and Science contributes to reducing smoking prevalence in Australia by conducting tobacco plain packaging compliance and enforcement activities (2.4).
Department of the Prime Minister and Cabinet Program 2.3: Safety and Wellbeing The Department of the Prime Minister and Cabinet works closely with the Department of Health to ensure the effectiveness of Indigenous health funding, and that mainstream policy, programs and services deliver benefits to Indigenous Australians (2.2).
Department of Social Services Program 3.1: Disability, Mental Health and Carers Program 3.2: National Disability Insurance Scheme The Department of Social Services contributes to improving access to services and supports for people with psychosocial disability through implementation of the National Disability Insurance Scheme and the provision of mental health services (2.1).
Department of Veterans’ Affairs Program 2.1: General Medical Consultations and Services The Department of Veterans’ Affairs (DVA) contributes to the Government’s objectives for the Practice Nurse Incentive Program. Practices eligible for this program that provide GP services to the DVA gold card holders are eligible for an annual payment for each veteran. These practices are identified by Department of Human Services (2.3).
Food Standards Australia New Zealand2 Program 1.1: Food regulatory activity and services to the Minister and Parliament Food Standards Australia New Zealand (FSANZ) contributes to the protection of public health and safety by developing food standards for implementation by the States and Territories. FSANZ also coordinates national food surveillance and recall activities to minimise the risk of adverse health events from food (2.4).
Independent Hospital Pricing Authority3 Program 1.1: Public hospital price determinations The Independent Hospital Pricing Authority determines the National Efficient Price for public hospital services, as the basis for Activity Based Funding and the National Efficient Cost for those public hospital services under block funding arrangements (2.7).
2 Refer to the Food Standards Australia New Zealand chapter in these Portfolio Budget Statements for
further information on the work of this entity. 3 Refer to the Independent Hospital Pricing Authority chapter in these Portfolio Budget Statements for
further information on the work of this entity.

Section 2 – Department Outcomes – 2: Health Access and Support Services
59
Ou
tco
me
2
National Health Funding Body4 Program 1.1: National Health Funding Pool Administration The National Health Funding Body is responsible for the transparent and efficient administration of Commonwealth, State and Territory funding of public hospital services. This includes the administration of payments to and from the National Health Funding Pool to Local Hospital Networks and other parties in accordance with the National Health Reform Agreement. Commonwealth funding is provided by the Treasury (2.7).
National Mental Health Commission5 Program 1.1: National Mental Health Commission The National Mental Health Commission (NMHC) provides insight, advice and evidence on ways to improve Australia’s mental health and suicide prevention systems. The NMHC also acts as a catalyst for change to achieve these improvements (2.1).
The Treasury Program 1.9: National Partnership Payments to the States The Treasury makes National Partnership Payments to the State and Territory Governments as part of the Federal Financial Relations Framework.6 Activities funded through the following National Partnership Agreements contribute to the Government’s objectives within this Outcome: - Suicide Prevention (2.1) - Improving trachoma control services for Indigenous Australians (2.2) - Rheumatic Fever Strategy (2.2) - Northern Territory remote Aboriginal investment (2.2) - Expansion of the BreastScreen Australia Program (2.4) - National Bowel Cancer Screening Program – participant follow-up function (2.4) - Victorian Cytology Service (2.4) - Hummingbird House (2.4) - National Coronial Information System (2.4) - Additional assistance for public hospitals (2.7) - Subacute and acute projects (2.7) - Mersey Community Hospital (Missiondale Recovery Centre and palliative care services in
Tasmania) (2.7).
4 Refer to the National Health Funding Body chapter in these Portfolio Budget Statements for further
information on the work of this entity. 5 Refer to the National Mental Health Commission chapter in these Portfolio Budget Statements for further
information on the work of this entity. 6 For Budget estimates relating to the National Partnership component of the program, refer to
Budget Paper No. 3 or Program 1.9 of the Treasury’s Portfolio Budget Statements.

Budget Statements – Department of Health
60
Table 2.2.1: Budgeted Expenses for Outcome 2
Table 2.2.1 shows how much the entity intends to spend (on an accrual basis) on achieving the outcome, broken down by program, as well as by administered and departmental funding sources.
2016-17 Estimated
actual $'000
2017-18 Budget
$'000
2018-19 Forward
Year 1 $'000
2019-20 Forward
Year 2 $'000
2020-21 Forward
Year 3 $'000
Program 2.1: Mental Health (a)
Administered expenses
Ordinary annual services (b) 711,603 777,669 831,177 589,552 573,702
Departmental expenses
Departmental appropriation (c) 22,933 22,137 21,417 21,192 21,150
Expenses not requiring appropriation 406 508 430 430 in the Budget year (d) 1,360
Total for Program 2.1 735,896 800,212 853,102 611,175 595,283
Program 2.2: Aboriginal and Torres Strait Islander Health (a)
Administered expenses
Ordinary annual services (b) 780,207 865,806 879,264 915,589 952,530
Departmental expenses
Departmental appropriation (c) 41,497 39,577 39,583 39,172 39,095
Expenses not requiring appropriation 709 887 751 751 in the Budget year (d) 3,231
Total for Program 2.2 824,935 906,092 919,734 955,512 992,376
Program 2.3: Health Workforce
Administered expenses
Ordinary annual services (b) 1,292,030 1,302,695 1,270,760 1,261,954 1,312,297
Departmental expenses
Departmental appropriation (c) 34,686 33,024 32,984 32,656 31,305
Expenses not requiring appropriation 586 733 620 620 in the Budget year (d) 1,714
Total for Program 2.3 1,328,430 1,336,305 1,304,477 1,295,230 1,344,222
Program 2.4: Preventative Health and Chronic Disease (a)
Administered expenses
Ordinary annual services (b) 384,973 414,546 377,731 380,528 384,264
Departmental expenses
Departmental appropriation (c) 37,102 34,857 34,810 34,448 34,381
Expenses not requiring appropriation 625 782 662 662 in the Budget year (d) 3,507
Total for Program 2.4 425,582 450,028 413,323 415,638 419,307

Section 2 – Department Outcomes – 2: Health Access and Support Services
61
Ou
tco
me
2
Table 2.2.1: Budgeted Expenses for Outcome 2 (continued)
2016-17 Estimated
actual $'000
2017-18 Budget
$'000
2018-19 Forward
Year 1 $'000
2019-20 Forward
Year 2 $'000
2020-21 Forward
Year 3 $'000
Program 2.5: Primary Health Care Quality and Coordination
Administered expenses
Ordinary annual services (b) 405,076 405,000 435,518 332,367 309,494
Departmental expenses
Departmental appropriation (c) 18,784 17,438 17,445 17,139 17,105
Expenses not requiring appropriation 320 400 338 338 in the Budget year (d) 1,178
Total for Program 2.5 425,038 422,758 453,363 349,844 326,937
Program 2.6: Primary Care Practice Incentives
Administered expenses
Ordinary annual services (b) 372,977 352,063 365,670 365,736 371,221
Departmental expenses
Departmental appropriation (c) 2,134 2,034 2,031 2,011 2,008
Expenses not requiring appropriation 36 45 38 38 in the Budget year (d) 103
Total for Program 2.6 375,214 354,133 367,746 367,785 373,267
Program 2.7: Hospital Services (a)
Administered expenses
Ordinary annual services (b) 92,534 14,474 14,832 14,968 16,056
Non cash expenses (e) 33,197 - - - -
Departmental expenses
Departmental appropriation (c) 27,726 28,535 27,531 25,546 25,542
Expenses not requiring appropriation 3,755 4,696 3,973 3,973 in the Budget year (d) 3,821
Total for Program 2.7 157,278 46,764 47,059 44,487 45,571

Budget Statements – Department of Health
62
Table 2.2.1: Budgeted Expenses for Outcome 2 (continued)
2016-17 Estimated
actual $'000
2017-18 Budget
$'000
2018-19 Forward
Year 1 $'000
2019-20 Forward
Year 2 $'000
2020-21 Forward
Year 3 $'000
Outcome 2 totals by appropriation type
Administered expenses
Ordinary annual services (b) 4,039,400 4,132,253 4,174,952 3,860,694 3,919,564
Non cash expenses (e) 33,197 - - - -
Departmental expenses
Departmental appropriation (c) 184,862 177,602 175,801 172,165 170,587
Expenses not requiring appropriation 6,437 8,051 6,812 6,812 in the Budget year (d) 14,914
Total expenses for Outcome 2 4,272,373 4,316,292 4,358,804 4,039,671 4,096,963
2016-17 2017-18
Average staffing level (number) 1,037 970
(a) Budget estimates for this program exclude National Partnership funding paid to State and Territory Governments by the Treasury as part of the Federal Financial Relations (FFR) Framework. National Partnerships are listed in this chapter under each program. For Budget estimates relating to the National Partnership component of this program, refer to Budget Paper No. 3 or Program 1.9 of the Treasury's Portfolio Budget Statements.
(b) Appropriation (Bill No. 1) 2017-18. (c) Departmental appropriation combines 'Ordinary annual services (Appropriation Bill No. 1)' and 'Revenue
from independent sources (s74)'. (d) Expenses not requiring appropriation in the Budget year are made up of depreciation expense,
amortisation expense, makegood expense and audit fees. (e) Non cash expenses' relates to the depreciation and sales of land and buildings.
Movement of Funds
2016-17 Estimated
actual $'000
2017-18 Budget
$'000
2018-19 Forward
Year 1 $'000
2019-20 Forward
Year 2 $'000
2020-21 Forward
Year 3 $'000
Movement of administered funds between years for Outcome 2
Program 2.4: Preventive Health and Chronic Disease Support (6,048) 6,048 - - -
Total movement of funds (6,048) 6,048 - - -

Section 2 – Department Outcomes – 2: Health Access and Support Services
63
Ou
tco
me
2
Planned Performance for Outcome 2
Tables 2.2.2 – 2.2.8 below detail the performance criteria for each program associated with Outcome 2. These tables also summarise how each program is delivered and where 2017-18 Budget measures have materially changed existing programs.
Table 2.2.2: Performance Criteria for Program 2.1
Purpose
Lead and shape Australia’s health and aged care system and sporting outcomes through evidence-based policy, well targeted programs, and best practice regulation.
Outcome 2: Health Access and Support Services
Support for sustainable funding for public hospital services and improved access to high quality, comprehensive and coordinated preventive, primary and mental health care for all Australians, with a focus on those with complex health care needs and those living in regional, rural and remote areas, including through access to a skilled health workforce
Program 2.1: Mental Health
The Australian Government is committed to supporting Australians with, or at risk of, mental illness and improving service integration in order to develop a more effective mental health system. Through the implementation of mental health reforms under the 2016-17 Mid-Year Economic and Fiscal Outlook Strengthening mental health care in Australia measure, the Government will transform Commonwealth mental health funding and provide leadership to achieve a more efficient, integrated and sustainable mental health system. In 2017-18, the Government will provide $11.1 million over three years to support the prevention of suicide in areas and specific locations – hotspots – where suicide incidents repeatedly occur. Funding will deliver initiatives, such as signage to encourage people to seek help, building the capacity of existing crisis line services, as well as a National Partnership Agreement, which will support States and Territories to deliver small infrastructure projects, such as fencing and surveillance to deter people from attempting suicide. In addition, the Government will commit $80 million over four years for community mental health services to assist people with severe mental illness resulting in psychosocial disability who are not eligible for assistance through the National Disability Insurance Scheme. Services will be facilitated through Primary Health Networks to enable a regionally-focused, stepped care approach, improving coordination and integrated care for individuals with psychosocial disabilities. The additional Commonwealth investment will be delivered once an agreement has been reached with appropriate commitments from each State and Territory. Building on the national mental health reforms, the Government will invest $15 million over two years to support mental health research within Australia. The funding will contribute to infrastructure and research targeted at improving early intervention and treatment for people with mental illness, recognising the link between mental health and physical health and wellbeing. Specifically, this investment provides: • $5 million to Orygen in Melbourne, the National Centre of Excellence in Youth Mental
Health, to help build an integrated healthcare and translational research facility. • $5 million to the Black Dog Institute to support, in collaboration with the Hunter Institute,
the translation of research findings into improved and innovative service delivery for people with anxiety and depression.
• $5 million to the Sunshine Coast Mind and Neuroscience – Thompson Institute for research in young people with major mood or psychiatric disorders and in suicide prevention.

Budget Statements – Department of Health
64
Delivery
A. Supporting people with mental illness through more and better coordinated services
Plan, integrate and commission a regional approach, led by Primary Health Networks, tomental health services at a local level, in partnership with relevant services through a newflexible primary mental health care funding pool.
Establish ‘Head to Health’, a digital mental health gateway aimed at giving Australianseasy access, through multiple channels (website, social media and telephone), to highquality mental health advice and resources when and where they need them.
Design and deliver primary mental health care programs to support a stepped care modelthat reflects the different levels of care needed by consumers.
Continue to work with State and Territory Governments to ensure effective transition ofeligible clients to the National Disability Insurance Scheme for people with severe andcomplex mental illness.
Performance criteria
A. Supporting people with mental illness through more and better coordinated services
Improve mental health care through implementation of reforms under the Strengthening mental health care in Australia measure to achieve a more efficient, integrated and sustainable mental health system.
2016-17 Estimated result 2017-18 Target 2018-19 (& beyond) Target
Transition of regionally delivered mental health and suicide prevention programs to the Primary Health Network funding pool commenced on 1 July 2016. Consultation with the digital mental health sector in the design, development and delivery of the Digital Gateway ‘Head to Health’ is ongoing.
Supporting Primary Health Networks, service providers, and mental health stakeholders to facilitate delivery on mental health reforms through:
Development of Stage 1 of the Digital Gateway ‘Head to Health’.
Delivery of the Fifth Mental Health Plan by 30 September 2017.
Development of Primary Health Network regional mental health and suicide prevention plans by 31 March 2018.
Complete the implementation of the commitment to strengthen the National Mental Health Commission.
Supporting Primary Health Networks, service providers, and mental health stakeholders to continue to deliver on mental health reforms through:
Ongoing monitoring of progress of Primary Health Network commissioning of mental health services.
Delivery of enhancements to the Digital Gateway ‘Head to Health’.
Transition of Partners in Recovery and Day to Day Living Programs into the National Disability Insurance Scheme.
Material changes to Program 2.1 resulting from the following measures:
Prioritising Mental Health – Psychosocial Support Services – funding
National Disability Insurance Scheme – finalisation of transition arrangements

Section 2 – Department Outcomes – 2: Health Access and Support Services
65
Ou
tco
me
2
Table 2.2.3: Performance Criteria for Program 2.2
Program 2.2: Aboriginal and Torres Strait Islander Health
The Australian Government will continue delivery of high quality essential health services to Aboriginal and Torres Strait Islander peoples, and respond to new and emerging health needs. In 2017-18, the Department will continue to focus on activities that support the Aboriginal and Torres Strait Islander Health Plan (2013–2023), including development of Domain Seven of the Implementation Plan: the Social and Cultural Determinants of Health, to be incorporated into the revised Implementation Plan for the National Aboriginal and Torres Strait Islander Health Plan (2018–2023) in 2018. In 2017-18, the Government will commit $18.8 million ($11.2 million has already been provisioned by Government) over four years to strengthen and expand the Australian Government’s Rheumatic Fever Strategy, continuing to protect Aboriginal and Torres Strait Islander communities at risk of acute rheumatic fever and rheumatic heart disease.
Delivery
A. Supporting access to high quality essential health services for Aboriginal and Torres Strait Islander peoples
Implement a funding model for Indigenous primary health care that will increase transparency, reward outcomes and target health need.
Prioritise investment in child and family health through innovative and multi-disciplinary models of care.
Work across portfolios to improve integration of services across child and family health and early childhood services to support wellbeing and development from birth to school.
Maintain investment in activities that tackle Indigenous smoking rates and embed gains made to date.
Trial innovative and culturally appropriate approaches to prevent cancer and to improve obesity-related health behaviours among Indigenous Australians.
Work with the Aboriginal Community Controlled Health Sector and peak bodies and other Aboriginal and Torres Strait Islander stakeholders to access community voices and expertise in policy and program design and evaluation.
Consult with Aboriginal and Torres Strait Islander youth (12–24 year olds) on the design and implementation of the policies and programs that affect them.

Budget Statements – Department of Health
66
Performance criteria
A. Supporting access to high quality essential health services for Aboriginal and Torres Strait Islander peoples
Improve health outcomes of Aboriginal and Torres Strait Islander peoples through implementing actions under the Implementation Plan for the National Aboriginal and Torres Strait Islander Health Plan 2013–2023.7
2016-17 Estimated result 2017-18 Target 2018-19 (& beyond) Target
Established Advisory Group to monitor Implementation Plan progress. Commenced work towards achieving the deliverables and goals for 2018 as specified in the Implementation Plan (2013–2018).
Undertake actions to inform and complete the drafting of the next iteration of the Implementation Plan (2018–2023). Assess progress against the deliverables and goals for 2018 as specified in the Implementation Plan.
Release revised iteration of the Implementation Plan in 2018. Commence work towards achieving the identified deliverables and goals for 2023 as specified in the Implementation Plan.
Reduce the rate difference of child 0-4 mortality rate per 100,000 between Aboriginal and Torres Strait Islander peoples and non-Aboriginal and Torres Strait Islander people.8,9 a. Rate difference. b. Aboriginal and Torres Strait Islander. c. Non-Aboriginal and Torres Strait Islander.
2015 Target10 2016 Target 2017 Target 2018 Target 2019 Target
a. 23–76 19–70 16–65 12–59 N/A11
b. 107–158 101–151 95–143 89–135 N/A
c. 78–89 78–86 74–84 72–82 N/A
Estimated result
a. 88.6
b. 163.6
c. 75.0
7 Further information available at: www.health.gov.au/internet/main/publishing.nsf/Content/indigenous-
implementation-plan 8 Further information available at: www.closingthegap.pmc.gov.au 9 Aboriginal and Torres Strait Islander and non-Aboriginal and Torres Strait Islander rates are contextual
data and are listed to provide a comparison. 10 This measure is reported on a calendar-year basis. 11 This target is linked to the Closing the Gap child mortality target, which ends prior to 2019.

Section 2 – Department Outcomes – 2: Health Access and Support Services
67
Ou
tco
me
2
Reduce the rate difference of chronic disease related mortality rate per 100,000 between Aboriginal and Torres Strait Islander peoples and non-Aboriginal and Torres Strait Islander people.12 a. Rate difference. b. Aboriginal and Torres Strait Islander. c. Non-Aboriginal and Torres Strait Islander.
2015 Target13 2016 Target 2017 Target 2018 Target 2019 Target
a. 185–222 173–209 161–195 148–182 136–169
b. 614–650 593–628 572–606 551–584 530–562
c. 426–431 417–424 409–414 400–405 391–396
Estimated result
a. 325.6
b. 774.4
c. 448.8
Increase the percentage of Aboriginal and/or Torres Strait Islander clients with type 2 diabetes who have had a blood pressure measurement result recorded within the previous 6 months.
2016-17 Estimated result
2017-18 Target
2018-19 Target
2019-20 Target
2020-21 Target
On track to meet 60–65%.
60–65% 60–65% 65–70% 65–70%
Material changes to Program 2.2 resulting from the following measures:
National Partnership Agreement on Rheumatic Fever Strategy – continuation and expansion
12 Aboriginal and Torres Strait Islander and non-Aboriginal and Torres Strait Islander rates are contextual
data and are listed to provide a comparison. 13 This measure is reported on a calendar-year basis.

Budget Statements – Department of Health
68
Table 2.2.4: Performance Criteria for Program 2.3
Program 2.3: Health Workforce
The Australian Government aims to ensure that Australia has the workforce necessary to meet the needs of a sustainable health system. The Government is continuing to address workforce distribution by better targeting and refocussing investment in workforce support and training, with a focus on improving access in regional, rural and remote areas.
Delivery
A. Increasing the capacity and effectiveness of the health workforce and improving access to health services for rural Australians
Support distribution of the workforce in regional, rural and remote areas through training programs such as the Rural Health Multidisciplinary Training Program.
Provide training programs to develop a workforce that will provide high quality services and meet community need, through programs such as the Specialist Training Program and the Australian General Practice Training Program.
Continue to monitor participation in the Medical Rural Bonded Scholarship and Bonded Medical Places Schemes.
Continue to fund the Royal Flying Doctor Service and the Rural Health Outreach Fund to provide health services in regional, rural and remote Australia.
Performance criteria
A. Increasing the capacity and effectiveness of the health workforce and improving access to health services for rural Australians
Effective investment in long-term education and training initiatives assists to develop a health workforce that will provide safe, high quality services to meet community need. a. Maintain the number of medical and multidisciplinary rural placement weeks delivered
through the Rural Health Multidisciplinary Training Program. b. Establish and maintain the number of training posts for specialist registrars working in
expanded health care settings through the Specialist Training Program. c. Maintain the annual intake of general practice registrars in the Australian General
Practice Training Program. d. Work with Regional Training Organisations to help registrars gain fellowship from the
Royal Australian College of General Practitioners and/or the Australian College of Rural and Remote Medicine.14
2017 Estimated result
2018 Target
2019 Target
2020 Target
2021 Target
a. 70,000 75,000 75,000 75,000 75,000
b. 950 1,07715 1,057 1,057 1,057
c. 1,500 1,500 1,500 1,500 1,500
d. 900 920 940 950 950
14 Target assumes an ongoing intake of 1,500 registrars per year, and that fellowship requirements, which
are outside the scope of the Department, remain unchanged. 15 From 2018, the Specialist Training Program will be merged with the Emergency Medicine Program. The
target from 2018 includes transferred emergency medicine places.

Section 2 – Department Outcomes – 2: Health Access and Support Services
69
Ou
tco
me
2
Improve the distribution of the medical workforce through the delivery of major health workforce education and training initiatives. a. Increase the selection of students with a rural background accepted into medical
degree courses at universities participating in the Rural Health Multidisciplinary Training Program.
b. Expand the proportion of Specialist Training Program activity provided in rural areas to provide immediate services to rural communities and help attract the next generation of medical specialists to work in these areas.
c. Maintain the level of training for general practice registrars delivered in rural areas through the Australian General Practice Training Program.16
2017 Estimated result
2018 Target
2019 Target
2020 Target
2021 Target
a. 25% 26% 28% 30% 30%
b. 39% 40% 42% 45% 45%
c. 50% 50% 50% 50% 50%
Support access to health care services in rural communities through the Rural Health Outreach Fund. a. Number of communities receiving outreach services through the Rural Health Outreach
Fund. b. Number of patient contacts delivered through the Rural Health Outreach Fund.17
2016-17 Target
2017-18 Target
2018-19 Target
2019-20 Target
2020-21 Target
a. 375 450 450 475 475
b. 163,000 195,000 195,000 200,000 200,000
Estimated result
a. 480
b. 215,000
Material changes to Program 2.3 resulting from the following measures:
There are no material changes to Program 2.3 resulting from measures.
16 The national target is calculated using the Australian Standard Geographical Classification – Remoteness
Area system, as the proportion of all full-time equivalent training weeks delivered outside major cities (ASGC-RA1).
17 This represents the number of patient contacts, not the number of individual patients.

Budget Statements – Department of Health
70
Table 2.2.5: Performance Criteria for Program 2.4
Program 2.4: Preventive Health and Chronic Disease Support
The Australian Government aims to improve the health and wellbeing of Australians and to reduce preventable mortality and morbidity caused by chronic disease, substance misuse and other risk factors (such as tobacco use and dietary risks). This will be achieved through evidence-based promotion of healthy lifestyles and good nutrition, early detection of cancer and other lifestyle limiting conditions, and through the implementation of strategies to reduce illegal drug use, tobacco use, the misuse of other legal drugs and harmful levels of alcohol consumption. Ongoing tobacco interventions are critical to ensuring that the prevalence of smoking in Australia continues to decline. In 2017-18, the Government will provide $10 million to the Heart Foundation for the Prime Minister’s Walk for Life Challenge. This will improve community participation in, and raise community awareness of, the value of physical activity and its role in preventing chronic disease. The Challenge will increase access to walking and other programs run by the Heart Foundation, including for children in schools, and promote innovative uses of technology to support increased physical activity. In addition, the Government will provide $5 million over four years to the Royal Australian College of General Practitioners for general practitioners to support Australians to achieve a healthy lifestyle through increased physical activity and better nutrition. It is estimated that in 2017, breast cancer will become the most commonly diagnosed cancer. Funding of $64.3 million over four years will continue existing arrangements for women aged 70 to 74 years to participate in the BreastScreen Australia Program, which provides free mammograms to screen for the early detection of breast cancer. The measure complements the BreastScreen Australia services already provided under the National Healthcare Agreement targeting women aged 50 to 69. The Government will also provide an additional $41.6 million over four years to extend an agreement with the Victorian Government to continue research and quality services delivered by the Victorian Cytology Service for cervical cancer. Prostate cancer is the most common form of cancer affecting Australian men (excluding non-melanoma skin cancer). In 2017, it is estimated that over 16,000 men will be diagnosed with the disease. The Government will spend $5.9 million over three years to expand the current Prostate Cancer Nurse program to fund up to 14 additional prostate cancer nurses across Australia to support men with prostate cancer, bringing the total number from 14 up to 28.

Section 2 – Department Outcomes – 2: Health Access and Support Services
71
Ou
tco
me
2
Delivery
A. Improving public health and reducing the incidence of chronic disease and complications through promoting healthier lifestyles
Develop a reporting framework for the National Strategic Framework for Chronic Conditions (the Framework) which is the overarching policy for the prevention and management of chronic conditions in Australia. The Framework guides the development and implementation of policies, strategies, actions and services to address chronic conditions and improve health outcomes.
Operationalise the goals of the Australian National Diabetes Strategy 2016-2020 through the development of an Implementation Plan. The Plan will guide Commonwealth and State and Territory Government planning for diabetes prevention and management by identifying priority actions and initiatives to ensure consistency and reduce duplication of effort and investment.
B. Supporting the development of preventive health initiatives
Encourage and enable Australians to be physically active and consume a healthy diet through the Healthy Food Partnership (the Partnership), which aims to improve the nutrition of all Australians by making healthier food choices easier and more accessible and by raising awareness of better food choices and portion sizes through programs such as the Health Star Ratings system and the Australian Guide to Healthy Eating.
Encourage food reformulation in processed foods to enable consumers to have healthier food choices through the Reformulation Working Group.
Continue the physical activity media campaign for girls and young women, ‘Girls Make Your Move’, which is about inspiring, energising and empowering young women and girls aged 12–19 years, with a focus on those aged 15–18 years.
C. Improving early detection, treatment and survival outcomes for people with cancer and supporting access to palliative care services
Continue to actively invite Australians to participate in cancer screening programs such as the National Bowel Cancer Screening Program, the National Cervical Screening Program, and the BreastScreen Australia Program, which increases the chances of detecting cancer early and saving more lives.
Implement a single National Cancer Screening Register that will be fundamental in supporting the renewal of the National Cervical Screening Program, and the expansion of the National Bowel Cancer Screening Program. The transition to a National Cancer Screening Register will be a key step towards connecting the health system and deliver capability that can be used for future screening programs.
Continue to work with State and Territory Governments to implement the Medical Services Advisory Committee’s recommendation to replace the current two yearly pap test with a five yearly Human Papillomavirus test.
Support the provision of high quality palliative care in Australia through workforce development, quality improvement and data development activities and supporting advance care planning.
D. Reducing the harmful effects of tobacco use
Support the implementation of the National Tobacco Campaign to focus on high prevalence groups, including Aboriginal and Torres Strait Islander peoples, people from disadvantaged backgrounds and people in rural, regional and remote areas.
Evaluate the current mandated health warnings on tobacco products to inform the Government on the effectiveness of graphic health warnings on tobacco product packaging.

Budget Statements – Department of Health
72
E. Preventing and reducing harm to individuals and communities from alcohol, tobacco and other drugs
Finalise and implement the National Drug Strategy and the National Alcohol Strategy to provide national frameworks for building safe, healthy and resilient Australian communities through preventing and minimising alcohol, tobacco and other drug related health, social and economic harms among individuals, families and communities.
Ongoing implementation of activities under the National Ice Action Strategy, which provides education, prevention, treatment, support and community engagement.
Continue to implement the 2016-17 Budget measure Taking More Action to Prevent Fetal Alcohol Spectrum Disorders through delivery of projects to raise awareness, improve diagnosis, and support families and individuals impacted by Fetal Alcohol Spectrum Disorders.
Coordinate Australia’s engagement on international illicit drug issues, including our obligations under various international drug treaties.
Performance criteria
A. Improving public health and reducing the incidence of chronic disease and complications through promoting healthier lifestyles
Provide national guidance to States and Territories, and health professionals, on and through the development and implementation of initiatives to reduce the prevalence of chronic conditions and associated complications.
2016-17 Estimated result 2017-18 Target 2018-19 (& beyond) Target
Endorsement and release of the National Strategic Framework for Chronic Conditions. Development of the National Asthma Strategy. Development of the National Diabetes Strategy Implementation Plan. Development of the Australian National Breastfeeding Strategy (including a performance monitoring framework) in partnership with jurisdictions.
Release of the National Diabetes Strategy Implementation Plan. Development of a reporting framework for the National Strategic Framework for Chronic Conditions. Submission of the Australian National Breastfeeding Strategy for the Australian Health Ministers’ Advisory Council and Council of Australian Governments’ Health Council approval by the end of 2017.
Release of reporting framework for the National Strategic Framework for Chronic Conditions. Implement Commonwealth responsibilities under the National Diabetes Strategy Implementation Plan. Implement Commonwealth responsibilities under the Australian National Breastfeeding Strategy. Establish processes to implement a performance monitoring and review framework for the Australian National Breastfeeding Strategy.

Section 2 – Department Outcomes – 2: Health Access and Support Services
73
Ou
tco
me
2
B. Supporting the development of preventive health initiatives
Provide national leadership to support people to make informed decisions and healthy lifestyle choices.
2016-17 Estimated result 2017-18 Target 2018-19 (& beyond) Target
Continued industry uptake of the Health Star Rating System. 115 businesses displayed Health Star Ratings on 5,500 products. Encouraged collaboration between Government, food industry bodies and public health groups through the Healthy Food Partnership Working Groups.
Increase in the number of businesses adopting the Health Star Rating System and an increase in products displaying Health Star Ratings. Encourage collaboration between Government, food industry bodies and public health groups through the Healthy Food Partnership Working Groups, including the Portion Size and Reformulation Working Groups, to empower food manufacturers to make positive changes. Provide support to general practitioners to encourage their patients to achieve a healthy lifestyle through increased physical activity and better nutrition, through the Healthy Heart Initiative.
As per 2017-18. A five year review of the Health Star Rating System and adoption of recommendations to be completed in 2019-20.

Budget Statements – Department of Health
74
C. Improving early detection, treatment and survival outcomes for people with cancer and supporting access to palliative care services
Increase the percentage of people participating in the National Bowel Cancer Screening Program.18
Jan 2016 – Dec 2017 Estimated result19
Jan 2017 – Dec 2018 Target
Jan 2018 – Dec 2019 Target
Jan 2019 – Dec 2020 Target
Jan 2020 – Dec 2021 Target
38.9%20 48.1% 53.1% 56.6% 56.6%
Maintain the percentage of women 50–74 years of age participating in BreastScreen Australia.21
Jan 2016 – Dec 2017 Estimated result22
Jan 2017 – Dec 2018 Target
Jan 2018 – Dec 2019 Target
Jan 2019 – Dec 2020 Target
Jan 2020 – Dec 2021 Target
54% 54% 54% 54% 54%
Maintain the percentage of women in the target age group (20–69 years) participating in the National Cervical Screening Program.23,24
Jan 2016 – Dec 2017 Estimated result25
Jan 2017 – Dec 2018 Target
Jan 2018 – Dec 2019 Target
Jan 2019 – Dec 2020 Target
Jan 2020 – Dec 2021 Target
57% 57% 57% 57% 57%
18 Participation is defined as the percentage of people invited to screen through the National Bowel Cancer
Screening Program over a two year period (1 January to 31 December) who return a completed screening test within that period or by 30 June of the following year.
19 This measure is reported on a rolling two-calendar-year basis. 20 Further information available at: www.aihw.gov.au/cancer-data/cancer-screening/ 21 Participation in the BreastScreen Australia Program has remained stable over the past five years. The
ongoing participation trend is expected to remain stable over the forward years. 22 This measure is reported on a rolling two-calendar-year basis. 23 From 2017, the two yearly Pap test for women 18 to 69 years of age will change to a five yearly Human
Papillomavirus test for women 25 to 74 years of age. 24 Data is not yet available to forecast forward year targets. Targets will be updated following implementation
of the Renewal of the National Cervical Screening Program. 25 This measure is reported on a rolling two-calendar-year basis.

Section 2 – Department Outcomes – 2: Health Access and Support Services
75
Ou
tco
me
2
Build capability through national leadership to ensure that Australians are provided with high quality palliative care.
2016-17 Estimated result 2017-18 Target 2018-19 (& beyond) Target
Several national palliative care projects were delivered and an evaluation of the National Palliative Care Strategy was completed. These national projects support access to quality palliative care through workforce development, education and training about advance care planning, a national system of quality outcome measure reporting and quality improvement, and activities that raise awareness in the community about end-of-life care and palliative care.
Implement national projects that improve access to high quality palliative care and service delivery, and provide support for people who are dying, their families and carers. Release a draft updated National Palliative Care Strategy for consultation by end of July 2017. Finalise the revised National Palliative Care Strategy by 30 June 2018.
Implement national projects that improve access to high quality palliative care and service delivery and provide support for people who are dying, their families and carers.
D. Reducing the harmful effects of tobacco use
Reduce the percentage of the population 18 years of age and over who are daily smokers.26
2016-17 Estimated result
2017-18 Target
2018-19 Target
2019-20 Target
2020-21 Target
12% 11% 10% <10% <10%
26 This data is taken from the Australian Bureau of Statistics National Health Survey and refers to
age-standardised rates of daily smokers.

Budget Statements – Department of Health
76
E. Preventing and reducing harm to individuals and communities from alcohol, tobacco and other drugs
National direction supports a collaborative approach to preventing and reducing the harms from alcohol, tobacco and other drugs.
2016-17 Estimated result 207-18 Target 2018-19 (& beyond) Target
Worked with States and Territories, and other relevant agencies to:
Finalise the next iteration of the National Drug Strategy and continue development of the National Alcohol Strategy.
Implement activities under the National Ice Action Strategy.
Report to Council of Australian Governments on progress of activities being delivered under the National Ice Action Strategy.
Oversee and monitor the progress of the National Drug Strategy, and associated sub-strategies, through the National Drug Strategy Committee and the Ministerial Drug and Alcohol Forum.
Implementation of Commonwealth funded activities under the National Ice Action Strategy. Support the delivery of alcohol and other drug treatment services. Development and promotion of prevention activities to raise awareness of Fetal Alcohol Spectrum Disorders. Delivery of the next phase of the National Drugs Campaign. Continued engagement of non-governmental organisations and stakeholders to shape the Commonwealth priorities in preventing and reducing harms from alcohol and drugs. Work with States and Territories, and other relevant agencies to:
Establish reporting frameworks and implementation plans for the National Drug Strategy and the National Alcohol Strategy.
Continue reporting on activities under the National Ice Action Strategy.
Oversee and monitor the progress of the National Drug Strategy, and associated sub-strategies through the National Drug Strategy Committee and the Ministerial Drug and Alcohol Forum.
Continue investment in quality alcohol and drug treatment services. Continue to build the evidence base in relation to alcohol and drugs through high quality research. Work with States and Territories, and other relevant agencies to:
Undertake a mid-point review of the National Drug Strategy.
Continue reporting on the National Drug Strategy and associated sub-strategies.
Material changes to Program 2.4 resulting from the following measures:
Healthy Heart Initiative – targeted activities

Section 2 – Department Outcomes – 2: Health Access and Support Services
77
Ou
tco
me
2
Table 2.2.6: Performance Criteria for Program 2.5
Program 2.5: Primary Health Care Quality and Coordination
The Australian Government aims to strengthen primary care by focussing funding to frontline health services and improving the access, delivery, quality and coordination of primary health care services. This will help improve health outcomes for patients, focussing on those who are most in need, including those with chronic conditions or mental illness. It will also assist in reducing unnecessary visits or admissions to hospitals. In the 2017-18 Budget, the Government will provide $145.5 million to enable Primary Health Networks to continue their central role in ensuring their local communities can access after-hours primary health services. In addition, the Government will spend $8.3 million over three years to boost funding for palliative care coordination through Primary Health Networks to support people who have a known life-limiting condition by improving choice and quality of care and support. Working closely with GPs and other health professionals, the Government is progressing the implementation of the Health Care Homes trial with 20 practices to commence 1 October 2017 and the remaining 180 to commence 1 December 2017.
Delivery
A. Strengthening primary health care through improved quality and coordination
Support Primary Health Networks to increase the efficiency and effectiveness of medical services for patients, particularly those at risk of poor health outcomes, and improve care coordination and integration.27
Support measures that improve the coordination and integration of services for people living with chronic and complex conditions to help maintain good health, such as Health Care Homes.28
Support the delivery of health information, advice and services through interactive communication technology to better assist people in caring for themselves and their families.
Performance criteria
A. Strengthening primary health care through improved quality and coordination
Improve efficiency and effectiveness of health services and coordination of care at the local level.
2016-17 Estimated result 2017-18 Target 2018-19 (& beyond) Target
All Primary Health Networks commenced commissioning activities during 2016-17. All Primary Health Networks have updated baseline needs assessments and strategies for responding to identified service gaps.
All Primary Health Networks engage with their local health care providers, including Local Hospital Networks (or their equivalent) and other stakeholders to improve health services and care coordination for their communities.29
All Primary Health Networks evaluate their commissioned services to inform future commissioning and continuous improvement.
27 Further information available at: www.health.gov.au/internet/main/publishing.nsf/Content/PHN-Home 28 Further information available at: www.health.gov.au/internet/main/publishing.nsf/Content/health-care-
homes 29 Stakeholder engagement, including engagement with local health providers, is a performance indicator
under the Primary Health Network Performance Framework, and is being reported against through the six and twelve month Primary Health Network performance report process.

Budget Statements – Department of Health
78
Improve continuity of care and coordinated services for patients with chronic and complex illnesses.
2016-17 Estimated result 2017-18 Target 2018-19 (& beyond) Target
Assessment of applications for practices to participate in stage one of Health Care Homes were completed in March 2017. Commenced development of an evaluation framework.
Commencement of patient enrolment and service delivery through Health Care Homes. Deliver training modules successfully to selected practices. Ongoing support mechanisms are in place to support Health Care Homes. Implementation of evaluation framework across enrolled practices and patients.
Increase eligible patient enrolment. Ongoing support mechanisms effectively supporting Health Care Homes practices. Delivery of interim evaluation report to Government by 30 June 2019.30 Delivery of final evaluation report to Government by 30 June 2020.31
Improve access to health advice, information and support services for the Australian community.
2016-17 Estimated result 2017-18 Target 2018-19 (& beyond) Target
Collaborated with the States and Territories to achieve better health literacy in the Australian community through the delivery of health advice, information, counselling and support services via national health communication infrastructure.
Health information and advice is successfully provided to the community.32
As per 2017-18.
Material changes to Program 2.5 resulting from the following measures:
Greater Choice for at Home Palliative Care
Guaranteeing Medicare – development of the Health Care Homes trial
Primary Health Networks – supporting after-hours care
30 The evaluation of the stage one trial Health Care Homes will inform Government consideration of the
national rollout of the program. 31 Ibid. 32 Success is measured through appropriate information uptake and cost effectiveness. The Government will
ensure that regular randomised sample post surveys are undertaken to measure and determine the uptake of clinical advice and information from the public following use of the national health communication infrastructure.

Section 2 – Department Outcomes – 2: Health Access and Support Services
79
Ou
tco
me
2
Table 2.2.7: Performance Criteria for Program 2.6
Program 2.6: Primary Care Practice Incentives
The Australian Government provides incentive payments to general practices and general practitioners through the Practice Incentives Program (PIP) to support activities that encourage continuing improvements, increase quality of care, enhance capacity and improve access and health outcomes for patients.
Delivery
A. Supporting quality care, enhanced capacity and improved access through general practice incentives
Provide general practice incentive payments through the PIP, including the PIP After Hours Incentive, the PIP eHealth Incentive, the Rural Loading Incentive, and the Teaching Payment.
Performance criteria
A. Supporting quality care, enhanced capacity and improved access through general practice incentives
Improve access to quality accredited general practitioner care through maintaining the percentage of general practice patient care services provided by Practice Incentives Program practices.33
2016-17 Estimated result
2017-18 Target
2018-19 Target
2019-20 Target
2020-21 Target
84.1% ≥84.2% ≥84.2% ≥84.2% ≥84.2%
Material changes to Program 2.6 resulting from the following measures:
Quality Improvements in General Practice – implementation of the Practice Incentive Program
33 This is calculated as the proportion of total Medicare Benefit Schedule fees for non-referred attendances
provided by Practice Incentives Program practices, standardised for age and sex.

Budget Statements – Department of Health
80
Table 2.2.8: Performance Criteria for Program 2.7
Program 2.7: Hospital Services
The Australian Government aims to improve access to, and the efficiency of, public hospitals through the provision of funding to States and Territories. The Government will deliver an additional $2.8 billion to public hospitals in this Budget. Since the signing of the Council of Australian Governments Heads of Agreement in 2016, the Commonwealth has provided an extra $7.7 billion to support States and Territories to deliver public hospital services. The Government will provide $730.4 million upfront to transfer ownership of the Mersey Community Hospital back to the Tasmanian Government on 1 July 2017 and secure the funding for 10 years. This will provide certainty to the providers and consumers of Tasmania’s acute care services. In addition, the Government will also provide $6.2 million to the Tasmanian Government to support the continued operation of the Missiondale Recovery Centre and palliative care services in Tasmania.
Delivery
A. Supporting the States and Territories to deliver efficient public hospital services
Support the Government through the provision of timely and effective policy advice onpublic hospital funding matters.
Performance criteria
A. Supporting the States and Territories to deliver efficient public hospital services
Provide advice to the Minister and external stakeholders in relation to public hospital funding policy.
2016-17 Estimated result 2017-18 Target 2018-19 (& beyond) Target
The Department provided advice and analysis in relation to public hospital funding, including development of the National Health Reform Agreement Addendum.
Provide advice and analysis in relation to public hospital funding, including:
implementation of the National Health Reform Agreement Addendum; and
development of longer term public hospital funding arrangements.
Provide advice ahead of a new Agreement on longer term hospital funding arrangements.
Material changes to Program 2.7 resulting from the following measures:
Support for Health Services in Tasmania

Section 2 – Department Outcomes – 3: Sport and Recreation
81
Ou
tco
me
3
2.3 BUDGETED EXPENSES AND PERFORMANCE FOR OUTCOME 3
Outcome 3: Sport and Recreation
Improved opportunities for community participation in sport and recreation, excellence in high-performance athletes, and protecting the integrity of sport through investment in sport infrastructure, coordination of Commonwealth involvement in major sporting events, and research and international cooperation on sport issues
Program Contributing to Outcome 3
Program 3.1: Sport and Recreation
Linked Programs
Other Commonwealth entities that contribute to Outcome 3
Australian Sports Anti-Doping Authority1 Program 1.1: Engagement, Deterrence, Detection and Enforcement The Australian Sports Anti-Doping Authority (ASADA) contributes to the protection of the health of athletes and the integrity of sport, by conducting World Anti-Doping Code compliant activities domestically. ASADA also contributes to international efforts to combat doping in sport (3.1).
Australian Sports Commission2 Program 1.1: Australian Sports Commission The Australian Sports Commission works with the Department of Health to increase participation in sport (as well as improve population health outcomes through involvement in sport), by implementing initiatives including the Play.Sport.Australia. participation strategy (3.1).
The Treasury Program 1.9: National Partnership Payments to the States The Treasury makes National Partnership Payments to the State and Territory Governments as part of the Federal Financial Relations Framework.3 Activities funded for the Heffron Park Centre of Excellence contribute to the Government objectives within this Outcome (3.1).
1 Refer to the Australian Sports Anti-Doping Authority chapter in these Portfolio Budget Statements for
further information on the work of this entity. 2 Refer to the Australian Sports Commission chapter in these Portfolio Budget Statements for further
information on the work of this entity. 3 For Budget estimates relating to the National Partnership component of the program, refer to
Budget Paper No. 3 or Program 1.9 of the Treasury’s Portfolio Budget Statements.

Budget Statements – Department of Health
82
Table 2.3.1: Budgeted Expenses for Outcome 3
Table 2.3.1 shows how much the entity intends to spend (on an accrual basis) on achieving the outcome, broken down by program, as well as by administered and departmental funding sources.
2016-17 Estimated
actual $'000
2017-18 Budget
$'000
2018-19 Forward
Year 1 $'000
2019-20 Forward
Year 2 $'000
2020-21 Forward
Year 3 $'000
Program 3.1: Sport and Recreation (a)
Administered expenses
Ordinary annual services (b) 18,475 19,527 15,190 15,212 12,920
Special Accounts
Sport and Recreation 407 407 407 407 407
Departmental expenses
Departmental appropriation (c) 7,126 6,802 6,819 6,821 6,808
Expenses not requiring appropriation 145 181 153 153 in the Budget year (d) 715
Total for Program 3.1 26,723 26,881 22,597 22,593 20,288
Outcome 3 totals by appropriation type
Administered expenses
Ordinary annual services (b) 18,475 19,527 15,190 15,212 12,920
Special accounts 407 407 407 407 407
Departmental expenses
Departmental appropriation (c) 7,126 6,802 6,819 6,821 6,808
Expenses not requiring appropriation 145 181 153 153 in the Budget year (d) 715
Total expenses for Outcome 3 26,723 26,881 22,597 22,593 20,288
2016-17 2017-18
Average staffing level (number) 49 47
(a) Budget estimates for this program exclude National Partnership funding paid to State and Territory Governments by the Treasury as part of the Federal Financial Relations (FFR) Framework. National Partnerships are listed in this chapter under each program. For Budget estimates relating to the National Partnership component of this program, refer to Budget Paper No. 3 or Program 1.9 of the Treasury's Portfolio Budget Statements.
(b) Appropriation (Bill No. 1) 2017-18. (c) Departmental appropriation combines 'Ordinary annual services (Appropriation Bill No. 1)' and 'Revenue
from independent sources (s74)'. (d) Expenses not requiring appropriation in the Budget year are made up of depreciation expense,
amortisation expense, makegood expense and audit fees.
Movement of Funds
There were no movements of administered funds between years for Outcome 3.

Section 2 – Department Outcomes – 3: Sport and Recreation
83
Ou
tco
me
3
Planned Performance for Outcome 3
Table 2.3.2 below details the performance criteria for the program associated with Outcome 3. This table also summarises how the program is delivered and where 2017-18 Budget measures have materially changed the existing program.
Table 2.3.2: Performance Criteria for Program 3.1
Purpose
Lead and shape Australia’s health and aged care system and sporting outcomes through evidence-based policy, well targeted programs, and best practice regulation.
Outcome 3: Sport and Recreation
Improved opportunities for community participation in sport and recreation, excellence in high-performance athletes, and protecting the integrity of sport through investment in sport infrastructure, coordination of Commonwealth involvement in major sporting events, and research and international cooperation on sport issues
Program 3.1: Sport and Recreation
The Australian Government aims to increase participation in sport and recreation activities by all Australians, foster excellence in Australia’s high-performance athletes, protect the integrity of Australian sport and improve water and snow safety. In 2017-18, the Department, with relevant Government entities, will support preparations for, and hosting of, the 2017 Rugby League World Cup (men’s and women’s tournaments) and the 2018 Gold Coast Commonwealth Games. The Department, with the Australian Sports Commission, will work with the sport sector and community to develop a National Sports Plan which sets out Australia’s sporting agenda into the future. The Government will also continue to work with water and snow safety organisations to reduce drownings and near drownings, and respond to known sports integrity threats and new issues as they arise. For further information about sport initiatives refer to the Australian Sports Commission and Australian Sports Anti-doping Authority’s chapters within these Portfolio Budget Statements.
Delivery
A. Increasing participation in sport and recreation activities, fostering excellence in Australia's high-performance athletes and protecting the integrity of Australian sport
Support the Australian Sports Commission’s investment in sporting excellence, by assisting with policy development and engagement with States and Territories.
Coordinate across whole-of-government to support the development and implementation of strategies and policies to increase the participation in sport and physical activity.
Coordinate whole-of-government support for major sporting events.
Develop national policy on sports integrity and coordinate the Government’s response to emerging threats and issues.
Develop national policy on sport and education, and women and girls in sport.
Deliver water and snow safety programs.

Budget Statements – Department of Health
84
Performance criteria
A. Increasing participation in sport and recreation activities, fostering excellence in Australia's high-performance athletes and protecting the integrity of Australian sport
Support participation in sport through the development, implementation and promotion of national policies and strategies.
2016-17 Estimated result 2017-18 Target 2018-19 (& beyond) Target
The Department continued to work closely with stakeholders, including the Australian Sports Commission and States and Territories, to ensure a coordinated whole-of-government approach to the implementation of relevant policies and strategies, including the revised National Sport and Active Recreation Policy Framework.
Provide strategic, high quality policy advice to Government and ensure a coordinated, whole-of-government approach to the development and implementation of relevant policies and strategies, including the release of the National Sports Plan.
As per 2017-18.
Provide whole-of-government leadership and coordination of major international sporting events in Australia, including the development and implementation of related policies and strategies, to support each event.
2016-17 Estimated result 2017-18 Target 2018-19 (& beyond) Target
Strategies and policies have been implemented during 2016-17, in consultation with key stakeholders, which contribute to meeting the Australian Government’s obligations for upcoming major sporting events.
Strategies and policies are implemented to meet agreed Australian Government obligations to support the:
2017 Rugby League World Cup; and
2018 Gold Coast Commonwealth Games.
Strategies and policies are implemented to meet agreed Australian Government obligations to support the:
2020 International Cricket Council Twenty20.

Section 2 – Department Outcomes – 3: Sport and Recreation
85
Ou
tco
me
3
Protect the integrity of Australian sport from threats of match-fixing, doping, criminal infiltration and other forms of corruption.
2016-17 Estimated result 2017-18 Target 2018-19 (& beyond) Target
Integrity initiatives and stakeholder interactions in 2016-17 continued to build the resilience of Australia’s sports to integrity threats, including through ensuring internationally-compliant anti-doping arrangements, and supporting Australian sporting organisations to address sports integrity issues. Initiatives included direct support for national sporting organisations to build internal integrity policy frameworks; the hosting of sports integrity forums for national sporting organisations and State and Territory counterparts; a joint project with the Australian Criminal Intelligence Commission to determine the threat from illegal offshore wagering to Australian sport; and progressed regulation of the supply of performance enhancing substances through Therapeutic Goods Administration scheduling.
Australian anti-doping arrangements are compliant with the World Anti-Doping Code. Sports integrity efforts of national sporting organisations, and States and Territories are supported through ongoing assessment of the sports integrity threats and related briefings, education platforms and initiatives. As part of the National Sports Plan, review anti-doping and integrity structures.
As per 2017-18.
Material changes to Program 3.1 resulting from the following measures:
There are no material changes to Program 3.1 from measures.

Budget Statements – Department of Health
86

Section 2 – Department Outcomes – 4: Individual Health Benefits
87
Ou
tco
me
4
2.4 BUDGETED EXPENSES AND PERFORMANCE FOR OUTCOME 4
Outcome 4: Individual Health Benefits
Access to cost-effective medicines, medical, dental and hearing services, and improved choice in health services, including through the Pharmaceutical Benefits Scheme, Medicare, targeted assistance strategies and private health insurance
Programs Contributing to Outcome 4
Program 4.1: Medical Benefits
Program 4.2: Hearing Services
Program 4.3: Pharmaceutical Benefits
Program 4.4: Private Health Insurance
Program 4.5: Medical Indemnity
Program 4.6: Dental Services
Program 4.7: Health Benefit Compliance
Program 4.8: Targeted Assistance – Aids and Appliances
Linked Programs
Other Commonwealth entities that contribute to Outcome 4
Australian Taxation Office Program 1.1: Australian Taxation Office The Australian Taxation Office contributes to this Outcome through: - Collaborating with the Department of Health to construct an enduring linked data set as
part of the Multi-Agency Data Integration Project (4.1 and 4.4) - The administrative arrangements for the Government’s rebate on the private health
insurance rebate (4.4).
Department of Human Services Program 1.2: Services to the Community – Health The Department of Human Services administers payments to eligible recipients, under the following programs administered by the Department of Health, to contribute to the Government’s objectives within this Outcome: - Medicare services and benefit payments, and related Medicare Benefits Schedule (MBS)
items (4.1) - External breast prostheses reimbursements (4.1) - Ex-gratia payments for the Disaster Health Care Assistance Scheme (4.1) - Radiation Oncology Health Program Grants Scheme (4.1) - Health Care Homes Program (4.1) - Hearing Services Program payments for voucher services and devices (4.2) - The Pharmaceutical Benefits Scheme (PBS), including payment of script benefits,
authority approvals, and new and other PBS items (4.3) - Lifetime Health Cover mail out and the private health insurance rebate (4.4) - Medical indemnity activities including indemnity for eligible midwives (4.5) - The Child Dental Benefits Schedule (4.6) - Payment of claims from Stoma Associations for stoma-related appliances (4.8).

Budget Statements – Department of Health
88
Department of Veterans’ Affairs Program 2.3: Veterans’ Pharmaceuticals Benefits The Department of Veterans’ Affairs contributes to this Outcome by providing clients a comprehensive array of pharmaceuticals and wound dressings for the treatment of their healthcare needs (4.3).
Professional Services Review1 Program 1.1: Safeguarding the Integrity of the Medicare Program and Pharmaceutical Benefits Scheme The Professional Services Review contributes to the integrity of the Medicare Program and the PBS by investigating health practitioners suspected of inappropriate practice on request from the Chief Executive Medicare and determining any sanctions to be applied (4.1 and 4.7).
The Treasury Program 1.9: National Partnership payments to the States The Treasury makes National Partnership payments to the State and Territory Governments as part of the Federal Financial Relations Framework.2 Activities funded for adult public dental services contribute to the Government objectives within this Outcome (4.6).
1 Refer to the Professional Services Review chapter in these Portfolio Budget Statements for further
information on the work of this entity. 2 For Budget estimates relating to the National Partnership component of the program, refer to
Budget Paper No. 3 or Program 1.9 of the Treasury’s Portfolio Budget Statements.

Section 2 – Department Outcomes – 4: Individual Health Benefits
89
Ou
tco
me
4
Table 2.4.1: Budgeted Expenses for Outcome 4
Table 2.4.1 shows how much the entity intends to spend (on an accrual basis) on achieving the outcome, broken down by program, as well as by administered and departmental funding sources.
2016-17 Estimated
actual $'000
2017-18 Budget
$'000
2018-19 Forward
Year 1 $'000
2019-20 Forward
Year 2 $'000
2020-21 Forward
Year 3 $'000
Program 4.1: Medical Benefits
Administered expenses
Ordinary annual services (a) 104,881 85,327 86,682 85,521 82,807
Special appropriations
Health Insurance Act 1973 - medical benefits 22,092,457 22,897,861 24,056,034 25,729,692 27,182,709
Departmental expenses
Departmental appropriation (b) 27,814 33,868 33,758 32,380 25,303
Expenses not requiring appropriation 473 592 501 501in the Budget year (c) 2,914
Total for Program 4.1 22,228,066 23,017,529 24,177,066 25,848,094 27,291,320
Program 4.2: Hearing Services
Administered expenses
Ordinary annual services (a) 516,141 530,697 557,447 583,641 600,895
Departmental expenses
Departmental appropriation (b) 7,273 6,955 6,947 6,881 6,868
Expenses not requiring appropriation 1,185 1,482 1,254 1,254 in the Budget year (c) 1,840
Total for Program 4.2 525,254 538,837 565,876 591,776 609,017
Program 4.3: Pharmaceutical Benefits
Administered expenses
Ordinary annual services (a) 697,149 797,213 800,937 817,198 604,356
Special appropriations
National Health Act 1953 - pharmaceutical benefits 11,297,940 10,950,710 10,794,810 10,813,488 10,688,175
Departmental expenses
Departmental appropriation (b) 54,212 50,932 42,831 38,344 38,263
Expenses not requiring appropriation 2,010 2,514 2,127 2,127 in the Budget year (c) 7,710
Total for Program 4.3 12,057,011 11,800,865 11,641,092 11,671,157 11,332,921

Budget Statements – Department of Health
90
Table 2.4.1: Budgeted Expenses for Outcome 4 (continued)
2016-17 Estimated
actual $'000
2017-18 Budget
$'000
2018-19 Forward
Year 1 $'000
2019-20 Forward
Year 2 $'000
2020-21 Forward
Year 3 $'000
Program 4.4: Private Health Insurance
Administered expenses
Ordinary annual services (a) 3,768 3,114 2,561 2,461 2,461
Special appropriations
Private Health Insurance Act 2007 - incentive payments and rebate 6,054,635 6,175,728 6,311,594 6,456,760 6,618,180
Departmental expenses
Departmental appropriation (b) 10,392 10,048 10,039 9,968 9,955
Expenses not requiring appropriation 123 154 130 130in the Budget year (c) 1,074
Total for Program 4.4 6,069,869 6,189,013 6,324,348 6,469,319 6,630,726
Program 4.5: Medical Indemnity
Administered expenses
Ordinary annual services (a) 150 142 142 142 142
Special appropriations
Medical Indemnity Act 2002 91,800 96,900 82,300 86,200 90,500 Midwife Professional Indemnity (Commonwealth Contribution) Scheme Act 2010 6,870 4,061 4,704 5,446 6,281
Departmental expenses
Departmental appropriation (b) 998 958 957 948 947
Expenses not requiring appropriation 14 18 15 15in the Budget year (c) 108
Total for Program 4.5 99,926 102,075 88,121 92,751 97,885
Program 4.6: Dental Services (d)
Administered expenses
Ordinary annual services (a) - - - - -
Special appropriations
Dental Benefits Act 2008 331,860 346,039 358,500 369,608 387,250
Departmental expenses
Departmental appropriation (b) 2,511 2,411 3,142 3,122 3,117
Expenses not requiring appropriation 40 50 42 42in the Budget year (c) 170
Total for Program 4.6 334,541 348,490 361,692 372,772 390,409

Section 2 – Department Outcomes – 4: Individual Health Benefits
91
Ou
tco
me
4
Table 2.4.1: Budgeted Expenses for Outcome 4 (continued)
2016-17 Estimated
actual $'000
2017-18 Budget
$'000
2018-19 Forward
Year 1 $'000
2019-20 Forward
Year 2 $'000
2020-21 Forward
Year 3 $'000
Program 4.7: Health Benefit Compliance
Administered expenses
Ordinary annual services (a) 12,000 12,000 12,000 12,000 12,000
Departmental expenses
Departmental appropriation (b) 64,748 67,795 63,790 63,164 63,057
Expenses not requiring appropriation 1,165 1,457 1,233 1,233 in the Budget year (c) 2,050
Total for Program 4.7 78,798 80,960 77,247 76,397 76,290
Program 4.8: Targeted Assistance - Aids and Appliances
Administered expenses
Ordinary annual services (a) 4,442 11,394 12,480 13,646 14,862
Special appropriations
National Health Act 1953 - aids and appliances 354,493 353,784 356,263 371,567 377,145
Departmental expenses
Departmental appropriation (b) 4,245 4,062 4,057 4,019 4,012
Expenses not requiring appropriation 65 81 69 69in the Budget year (c) 499
Total for Program 4.8 363,679 369,305 372,881 389,301 396,088
Outcome 4 totals by appropriation type
Administered expenses
Ordinary annual services (a) 1,338,531 1,439,887 1,472,249 1,514,609 1,317,523
Special appropriations 40,230,055 40,825,083 41,964,205 43,832,761 45,350,240
Departmental expenses
Departmental appropriation (b) 172,193 177,029 165,521 158,826 151,522
Expenses not requiring appropriation 5,075 6,348 5,371 5,371 in the Budget year (c) 16,365
Total expenses for Outcome 4 41,757,144 42,447,074 43,608,323 45,511,567 46,824,656
2016-17 2017-18
Average staffing level (number) 999 934 (a) Appropriation Bill (No. 1) 2017-18. (b) Departmental appropriation combines 'Ordinary annual services (Appropriation Bill No. 1)' and 'Revenue
from independent sources (s74)'. (c) Expenses not requiring appropriation in the Budget year are made up of depreciation expense,
amortisation expense, makegood expense and audit fees. (d) The 2015-16 Budget estimates for this program exclude National Partnership funding paid to State and
Territory Governments by the Treasury as part of the Federal Financial Relations (FFR) Framework. National Partnerships are listed in this chapter under each program. For Budget estimates relating to the National Partnership component of this program, refer to Budget Paper No. 3 or Program 1.9 of the Treasury's Portfolio Budget Statements.
Movement of Funds
There were no movements of administered funds between years for Outcome 4.

Budget Statements – Department of Health
92
Planned Performance for Outcome 4
Tables 2.4.2 – 2.4.9 below detail the performance criteria for each program associated with Outcome 4. These tables also summarise how each program is delivered and where 2017-18 Budget measures have materially changed existing programs.
Table 2.4.2: Performance Criteria for Program 4.1
Purpose
Lead and shape Australia’s health and aged care system and sporting outcomes through evidence-based policy, well targeted programs, and best practice regulation.
Outcome 4: Individual Health Benefits
Access to cost-effective medicines, medical, dental and hearing services, and improved choice in health services, including through the Pharmaceutical Benefits Scheme, Medicare, targeted assistance strategies and private health insurance
Program 4.1: Medical Benefits
To deliver a modern Medicare program that is sustainable and supports all Australians to access high quality and cost-effective professional services, the Australian Government will continue to work with clinicians, other health professionals and consumers to progress the Long-Term National Health Plan. This will include the work of the Medical Services Advisory Committee and the Medicare Benefits Schedule Review to strengthen Medicare, and work with States and Territories, and private health insurers. The Government will continue to support quality and effective use of diagnostic imaging, pathology and radiation oncology services, and deliver the national External Breast Prostheses Reimbursement Program. Targeted assistance strategies will also continue access to health services for Australians who require life-saving treatment not available in Australia and the provision of medical assistance to eligible Australians following specific overseas disasters. In the 2017-18 Budget, the Government is guaranteeing its investment in Medicare so that all Australians can be certain they will continue to have access to the essential health care services they need. The Government will establish the Medicare Guarantee Fund from 1 July 2017 to ensure the ongoing funding of the Medicare Benefits Schedule (MBS) and the Pharmaceutical Benefits Scheme (PBS) into the future. The Fund will be credited with revenue raised from the Medicare levy (excluding amounts to meet the Government’s commitment to fund the National Disability Insurance Scheme) as well as a portion of personal income tax receipts sufficient to cover the estimated costs of essential health care provided under the MBS and PBS. These amounts will be held in the Fund for the sole purpose of meeting the cost of essential health care provided under the MBS and PBS. The Government will invest $2.4 billion in Medicare, including $1 billion to restore indexation of the Medicare rebate over the next four years – general practitioner bulk-billing incentives from 1 July 2017; standard general practitioner and specialist consultations from 1 July 2018; and specialist procedures and allied health services from 1 July 2019; and for targeted diagnostic imaging services from 2020. This brings the total expenditure invested in Medicare to $22.9 billion in 2017-18. In addition, the Government will maintain the bulk-billing incentives for pathology and diagnostic imaging services, at a cost of $936.7 million over five years. Furthermore, the Government will maintain the current Medicare safety net arrangements at a cost of $317.5 million.

Section 2 – Department Outcomes – 4: Individual Health Benefits
93
Ou
tco
me
4
The Government will provide $16.4 million for new listings on the Medicare Benefits Schedule (MBS). The Government will also invest $44.2 million over three years in continuing to fund the clinician-led review (the Review) of all 5,700 items on the MBS to ensure they represent best clinical practice. Alongside the Review, $44.5 million will enable the Medical Services Advisory Committee to continue its work of amending and adding to MBS listings to ensure Medicare remains contemporary and sustainable. In addition, funding of $9.1 million over four years will be provided to enable Australians who live in rural and regional Australia to access psychologists via telehealth.
Delivery
A. Ensuring continued access to a Medicare system that provides modern, high quality and cost-effective professional health services that are in line with current clinical evidence
Support a Medicare system that is modern, sustainable and aligned to currentclinical evidence.
B. Providing targeted medical assistance, including to Australians who require life-saving medical treatment not available in Australia, and access to breast prostheses for women who have had breast cancer
Assess applications for financial assistance for life-saving medical treatment required tobe performed overseas.
Continue the provision of an administratively simple and nationally accessiblereimbursement scheme for external breast prostheses.
C. Supporting safe and effective diagnostic imaging and pathology services
Provide consumers with a contemporary and best practice pathology accreditationprogram.
Work with the newly established Diagnostic Imaging Accreditation Scheme AdvisoryCommittee to review standards in diagnostic imaging.
D. Supporting the delivery of high quality radiation oncology services
Provide targeted financial contributions to the capital cost of radiation oncology linearaccelerators.
Performance criteria
A. Ensuring continued access to a Medicare system that provides modern, high quality and cost-effective professional health services that are in line with current clinical evidence
Continued review of Medicare Benefits Schedule items to maintain a Medicare system that provides high value care to the Australian public based on evidence and best clinical practice.
2016-17 Estimated result 2017-18 Target 2018-19 (& beyond) Target
Clinical Committees3 will have considered 50% of the Medicare Benefits Schedule items for the review.
Clinical Committees will have considered 70% of the Medicare Benefits Schedule items for the review.
Clinical Committees will have considered 85% or more of the Medicare Benefits Schedule items for the review.
3 Further information available at: www.health.gov.au/internet/main/publishing.nsf/content/MBSR-committees

Budget Statements – Department of Health
94
B. Providing targeted medical assistance, including to Australians who require life-saving medical treatment not available in Australia, and access to breast prostheses for women who have had breast cancer
To provide financial assistance to Australians for appropriate medical treatment not available in Australia or for out-of-pocket healthcare costs as a result of specific overseas disasters.
2016-17 Estimated result 2017-18 Target 2018-19 (& beyond) Target
Financial assistance was provided to eligible applicants through the Medical Treatment Overseas Program4 and the Disaster Health Care Assistance Scheme.5
Applications for financial assistance for medical treatment overseas are assessed in a timely manner in accordance with program guidelines. Ensure that the Reciprocal Health Care Agreements6 are supporting Australians that travel overseas.
As per 2017-18.
Improving the quality of life of women who have undergone a mastectomy as a result of breast cancer, through efficient processing of claims from eligible women under the National External Breast Prostheses Reimbursement Program.
2016-17 Estimated result
2017-18 Target
2018-19 Target
2019-20 Target
2020-21 Target
90% of claims processed within ten days of lodgement.
≥90% ≥90% ≥90% ≥90%
C. Supporting safe and effective diagnostic imaging and pathology services
Maintain a consistent and contemporary accreditation framework which underpins all Medicare eligible pathology services.
2016-17 Estimated result 2017-18 Target 2018-19 (& beyond) Target
There is continued improvement of the Australian Pathology Accreditation Framework with the publication of three new and/or revised accreditation standards in 2017.
Ensure consumers have continued access to up-to-date, quality pathology services through reviewing and updating the Australian Pathology Accreditation Framework, as required.
As per 2017-18.
4 Further information available at: www.health.gov.au/internet/main/publishing.nsf/content/ strategicpolicymto.htm
5 Further information available at: www.humanservices.gov.au/customer/services/medicare/disaster-health-care-assistance-scheme
6 Further information available at: www.humanservices.gov.au/customer/services/medicare/reciprocal-health-care-agreements

Section 2 – Department Outcomes – 4: Individual Health Benefits
95
Ou
tco
me
4
D. Supporting the delivery of high quality radiation oncology services
Ensure Australians have access to high quality radiotherapy services through the Radiation Oncology Health Program Grant Scheme.
2016-17 Estimated result 2017-18 Target 2018-19 (& beyond) Target
The review of the Radiation Oncology Health Program Grant Scheme was completed in August 2016 with Government agreeing to a new administrative scheme with greater involvement of the States and Territories.
Provide targeted financial contributions to the capital cost of radiation oncology linear accelerators7 located in priority areas as agreed between the Commonwealth and relevant States and Territories.
As per 2017-18.
Material changes to Program 4.1 resulting from the following measures:
Guaranteeing Medicare – aligning reciprocal health care
Guaranteeing Medicare – development of the Health Care Homes trial
Guaranteeing Medicare – Medicare Benefits Schedule – improved compliance
Guaranteeing Medicare – Medicare Benefits Schedule – indexation
Guaranteeing Medicare – Medical Benefits Schedule Review – continuation
Prioritising Mental Health – improving telehealth for psychological services in regional,rural and remote Australia
Unlegislated Budget Repair Measures – not proceeding
7 The device most commonly used for external beam radiation treatments for patients with cancer.

Budget Statements – Department of Health
96
Table 2.4.3: Performance Criteria for Program 4.2
Program 4.2: Hearing Services
The Australian Government will continue to provide a range of fully and partially subsidised hearing devices and services to eligible Australians to manage their hearing loss and improve their engagement with the community. This includes continued support to hearing research that focuses on ways to reduce the impact of hearing loss and the incidence and consequence of avoidable hearing loss in the Australian community.
Delivery
A. Supporting access to high quality hearing services and research into hearing loss prevention and management
Deliver the voucher component of the Hearing Services Program which enables eligibleclients to obtain hearing services and devices from a national network of service providers.
Deliver the Community Service Obligations component of the Hearing Services Programwhich provides specialist services to children and other eligible groups such as complex adult clients and some Aboriginal and Torres Strait Islander peoples. Services are delivered through Australian Hearing.
Provide research funding through the National Acoustics Laboratories and Hearing LossPrevention Program.
Performance criteria
A. Supporting access to high quality hearing services and research into hearing loss prevention and management
Support access to high quality hearing services by providing voucher services nationally.
2016-17 Estimated result
2017-18 Target
2018-19 Target
2019-20 Target
2020-21 Target
734,000 voucher clients
745,000 voucher clients
772,300 voucher clients
797,000 voucher clients
812,500 voucher clients
Material changes to Program 4.2 resulting from the following measures:
There are no material changes to Program 4.2 resulting from measures.

Section 2 – Department Outcomes – 4: Individual Health Benefits
97
Ou
tco
me
4
Table 2.4.4: Performance Criteria for Program 4.3
Program 4.3: Pharmaceutical Benefits
The Australian Government aims to provide reliable, timely and affordable access to cost-effective, high quality medicines and sustainable pharmaceutical services to all eligible Australians, through the subsidisation of the cost of medicines through the Pharmaceutical Benefits Scheme (PBS), Life Saving Drugs Program and community pharmacy programs through the Sixth Community Pharmacy Agreement. The 2017-18 Budget strengthens the Pharmaceutical Benefits Scheme (PBS) on several fronts, working closely with stakeholders to share responsibility for ensuring the PBS remains sustainable into the future. Existing arrangements for the Pharmaceutical Benefits Scheme co-payment and safety net threshold will remain at a cost of $955 million. The Government will work with Medicines Australia through a collaborative five-year compact that will give the industry greater planning certainty and reduce the costs of medicines by an estimated $1.8 billion. The compact commits to provide one-off price reductions for certain medicines that have been on the PBS for 10 and 15 years; lowering of more PBS drug prices over the longer period of the compact; and support for the uptake of lower-cost generic and biosimilar medicines. In a first for the PBS, savings generated by the formal compact with Medicines Australia will fund future, often highly expensive, new PBS listings. The Government has entered into a compact with the Pharmacy Guild to strengthen the PBS to deliver $210 million for community pharmacies, recognising a lower than anticipated increase in scripts filled by pharmacists. In addition, the Government will provide $15 million to wholesalers in recognition of reduced remuneration due to lower than expected prescription volumes. The Government will undertake further work to make electronic forms of PBS scripts a legal form of prescription. This will be developed in consultation with doctors and pharmacists and participation will be voluntary with doctors retaining complete control over all scripts. In addition, the Government will work with community pharmacies to improve medication management programs. This commitment of $600 million over three years will enable pharmacies to offer new or expanded services to consumers, including home visits by pharmacists, helping patients with their medication, and supporting Health Care Homes with medicine management. The Government will spend $1.2 billion on new and amended listings for the PBS. From 1 June 2017, the Government will list the combination medicine, sacubitril with valsartan (Entresto®), for a new treatment for hypertension and heart failure. More than 60,000 Australians with chronic heart failure will benefit from the listing of this new medicine. Without the PBS subsidy, patients would pay more than $1,970 a year for the treatment. Other new listings include medicine for children with cystic fibrosis, and medicine to treat idiopathic pulmonary fibrosis (a debilitating lung disease).

Budget Statements – Department of Health
98
Delivery
A. Providing access to new and existing medicines for patients with life threatening conditions
Assess patient applications against published eligibility criteria for Life Saving DrugsProgram medicines in a timely way.
Administer medicine orders to meet the needs of patients approved to the Life SavingDrugs Program, within agreed timeframes.
B. Ensuring access to cost-effective, innovative, clinically effective medicines through the Pharmaceutical Benefits Scheme
The Pharmaceutical Benefits Advisory Committee meets a minimum of three times peryear to consider medicines for listing on the Pharmaceutical Benefits Scheme to take into account each medicine’s clinical effectiveness, safety and cost-effectiveness (‘value for money’) compared with other treatments for each proposed medication condition as required by legislation.
C. Supporting timely access to medicines and pharmacy services
Support and monitor pharmaceutical wholesalers participating in the Community ServiceObligation funding pool to ensure timely access to Pharmaceutical Benefits Scheme medicines.
Support professional pharmacy programs and services for consumers through the SixthCommunity Pharmacy Agreement.
Support and monitor programs to improve access to Pharmaceutical Benefits Schememedicines by Aboriginal and Torres Strait Islander peoples.
D. Maintaining the effectiveness of the Pharmaceutical Benefits Scheme through monitoring and post-market surveillance
Undertake post-market reviews of Pharmaceutical Benefits Scheme listed medicines toensure their ongoing safe and cost-effective use for consumers.
Performance criteria
A. Providing access to new and existing medicines for patients with life threatening conditions
Ensure eligible patients have access to the Life Saving Drugs Program.
2016-17 Estimated result 2017-18 Target 2018-19 (& beyond) Target
Patient applications were processed within 30 calendar days of receipt and assessed against set eligibility criteria.
Patient applications are processed within 30 calendar days of receipt.
As per 2017-18.
Ensure continued access to eligible patients to medicines under the Life Saving Drugs Program.
2016-17 Estimated result 2017-18 Target 2018-19 (& beyond) Target
Eligible patients provided with ongoing access to life saving medicines through the Life Saving Drugs Program.
Facilitate continued eligible patient access to life saving medicines.
As per 2017-18.

Section 2 – Department Outcomes – 4: Individual Health Benefits
99
Ou
tco
me
4
B. Ensuring access to cost-effective, innovative, clinically effective medicines through the Pharmaceutical Benefits Scheme
Percentage of submissions for new medicines that are recommended for listing by Pharmaceutical Benefits Advisory Committee, that are listed on the Pharmaceutical Benefits Scheme within six months of agreement of budget impact and price.
2016-17 Estimated result
2017-18 Target
2018-19 Target
2019-20 Target
2020-21 Target
80% 80% 80% 80% 80%
C. Supporting timely access to medicines and pharmacy services
Deliver an increased suite of reporting and data related to pharmacy and Pharmaceutical Benefits Scheme funded medicine access and cost made available to Parliament, consumers and business.
2016-17 Estimated result 2017-18 Target 2018-19 (& beyond) Target
The Department is currently increasing the range of available data to include more data based on date of supply. The Department now has access to more detailed data on prescriptions that cost less than the general co-payment. The inclusion of this date improved the accuracy and utility of the Pharmaceutical Benefits Scheme utilisation data.
Periodically increase the volume and nature of data on the Department of Health website during the course of 2017-18.
As per 2017-18.
Percentage of Urban Centres8 in Australia with a population of 1,000 persons or more with an approved supplier9 of Pharmaceutical Benefits Scheme medicines.
2016-17 Estimated result
2017-18 Target
2018-19 Target
2019-20 Target
2020-21 Target
>90% >90% >90% >90% >90%
8 Further information available in the Urban Centres and Localities and Significant Urban Areas Fact Sheet, available at: www.abs.gov.au/websitedbs/D3310114.nsf/home/ASGS+Fact+Sheets
9 For this criterion, an approved supplier includes a pharmacy, a medical practitioner (in rural/remote locations where there is no access to a pharmacy) or an Aboriginal Health Service, approved to supply PBS medicines to the community. It does not include an approved hospital authority, approved to supply PBS medicines to its patients.

Budget Statements – Department of Health
100
Percentage of Urban Centres in Australia with a population of 1,000 persons or more with a resident service provider of, or recipient of, Medscheck, Home Medicines Review, Residential Medication Management Review or Clinical Intervention.
2016-17 Estimated result
2017-18 Target
2018-19 Target
2019-20 Target
2020-21 Target
>80% >80% >80% >80% >80%
Percentage of subsidised Pharmaceutical Benefits Scheme units delivered to community pharmacy within agreed requirements of the Community Service Obligation.
2016-17 Estimated result
2017-18 Target
2018-19 Target
2019-20 Target
2020-21 Target
>95% >95% >95% >95% >95%
Average cost per subsidised script funded by the Pharmaceutical Benefits Scheme.10
2016-17 Estimated result
2017-18 Target
2018-19 Target
2019-20 Target
2020-21 Target
$35.50 $35.46 $36.26 $36.76 $37.34
Average cost per script (subsidised and non-subsidised) paid by consumers for Pharmaceutical Benefits Scheme medicines.11
2016-17 Estimated result
2017-18 Target
2018-19 Target
2019-20 Target
2020-21 Target
$9.84 $10.41 $10.56 $10.69 $10.85
10 This is the projected average cost to Government for Section 85 Pharmaceutical Benefits Scheme subsidised prescriptions.
11 This is the projected average for Section 85 Pharmaceutical Benefits Scheme prescriptions, including under co-payment prescriptions.

Section 2 – Department Outcomes – 4: Individual Health Benefits
101
Ou
tco
me
4
D. Maintaining the effectiveness of the Pharmaceutical Benefits Scheme through monitoring and post-market surveillance
Post-market reviews deliver relevant and high quality advice to the Pharmaceutical Benefits Advisory Committee and Government.
2016-17 Estimated result 2017-18 Target 2018-19 (& beyond) Target
The following reference groups have been established and are providing advice to post-market reviews on Pharmaceutical Benefits Scheme medicines for: ezetimibe for
hypercholestorolaemia; Chronic Obstructive
Pulmonary Disease; and Chronic Plaque Psoriasis.
Reference groups established, and continue to engage constructively with professional and community stakeholders in the conduct of the reviews.
As per 2017-18.
Percentage of post-market reviews completed within scheduled timeframes.
2016-17 Estimated result
2017-18 Target
2018-19 Target
2019-20 Target
2020-21 Target
90% 90% 90% 90% 90%
Percentage of Government-accepted recommendations from post-market reviews that have been implemented within agreed timeframes.
2016-17 Estimated result
2017-18 Target
2018-19 Target
2019-20 Target
2020-21 Target
85% 80% 80% 80% 80%
Information regarding quality use of medicines is provided to health professionals and consumers to support use of therapeutics wisely, judiciously and safely to achieve better health and economic outcomes.
2016-17 Estimated result 2017-18 Target 2018-19 (& beyond) Target
The Department supported NPS MedicineWise to provide consumer information on its website, produce its scheduled publication, and conduct healthcare provider educational visits, which provide evidence-based information on new, existing and revised listings of medicines on the Pharmaceutical Benefits Scheme, for health professionals and consumers.
The Department will provide funding for the provision of quality use of medicines information to be available in a variety of formats throughout the year, designed to support health professionals and consumers.
As per 2017-18.

Budget Statements – Department of Health
102
Estimated savings to Government from price disclosure.
2016-17 Estimated result
2017-18 Target
2018-19 Target
2019-20 Target
2020-21 Target
$3,200m $3,600m $4,000m $4,400m $4,800m
Material changes to Program 4.3 resulting from the following measures:
Improving Access to Medicines – cheaper medicines
Improving Access to Medicines – support for community pharmacies
Unlegislated Budget Repair Measures – not proceeding

Section 2 – Department Outcomes – 4: Individual Health Benefits
103
Ou
tco
me
4
Table 2.4.5: Performance Criteria for Program 4.4
Program 4.4: Private Health Insurance
The Australian Government promotes affordable quality private health insurance, to provide greater choice for consumers. This will improve the sustainability of the health system as a whole.
Delivery
A. Supporting a viable, sustainable and cost-effective private health insurance sector, including through the private health insurance rebate
Work with private health insurers to provide cost-effective private health insuranceproducts to encourage increased membership and sustainability of the private health insurance industry.
Further encourage Australians to take up private health insurance by ensuring access toquality up-to-date information in relation to private health insurance.
Work with the Private Health Ministerial Advisory Committee to develop and implementprivate health insurance reforms.
Performance criteria
A. Supporting a viable, sustainable and cost-effective private health insurance sector, including through the private health insurance rebate
Robust policies and procedures are in place, including ensuring all private health insurers are compliant with relevant statutory and legislative requirements.
2016-17 Estimated result 2017-18 Target 2018-19 (& beyond) Target
Developed and implemented effective compliance and enforcement policies and procedures. Regular stakeholder communication activities conducted with insurers and other regulatory agencies.
Undertake effective compliance and enforcement through applying transparent and consistent procedures agreed with all industry stakeholders. Undertake regular stakeholder communications with insurers and other regulatory agencies to provide two way dissemination of information.
As per 2017-18.
Ensure privately insured patients have access to clinically and cost-effective prostheses under the Private Health Insurance Act 2007.
2016-17 Estimated result 2017-18 Target 2018-19 (& beyond) Target
Supported the Prostheses List Advisory Committee12 to reform the Prostheses List arrangements. Published the Prostheses List, enabling access to devices for privately insured patients.
Support the Prostheses List Advisory Committee to reform the Prostheses List arrangements. Publish the Prostheses List enabling access to devices for privately insured patients.
As per 2017-18.
Material changes to Program 4.4 resulting from the following measures:
There are no material changes to Program 4.4 resulting from measures.
12 Further information available at: www.health.gov.au/internet/main/publishing.nsf/Content/health-privatehealth-prostheseslist.htm

Budget Statements – Department of Health
104
Table 2.4.6: Performance Criteria for Program 4.5
Program 4.5: Medical Indemnity
The Australian Government seeks to ensure the stability of the medical insurance industry, and that medical indemnity insurance products are available and affordable.
Delivery
A. Ensuring the ongoing stability of the medical insurance industry and that insurance products are available and affordable
Administer schemes under the Indemnity Insurance Fund that promote stability,affordability and availability of insurance. Through these schemes, subsidise claims costs and the cost of insurance premiums of eligible medical practitioners and privately practising midwives.
Consult with stakeholders as the Department continues a First Principles Review of themedical indemnity schemes to determine whether the schemes are fit for purpose.
Performance criteria
A. Ensuring the ongoing stability of the medical insurance industry and that insurance products are available and affordable
Enable continued availability of professional indemnity insurance for eligible midwives.
2016-17 Estimated result 2017-18 Target 2018-19 (& beyond) Target
Maintained a contract with an indemnity provider for the provision of professional indemnity insurance to eligible midwives.
Maintain a contract with an indemnity provider for the provision of professional indemnity insurance to eligible midwives.
As per 2017-18.
Decrease the number of doctors that require support through the Premium Support Scheme.13
2016-17 Estimated result
2017-18 Target
2018-19 Target
2019-20 Target
2020-21 Target
1,237 <1,500 <1,400 <1,400 <1,400
Material changes to Program 4.5 resulting from the following measures:
There are no material changes to Program 4.5 resulting from measures.
13 A decline in doctors accessing the Premium Support Scheme is an indication of medical indemnity insurance being affordable.

Section 2 – Department Outcomes – 4: Individual Health Benefits
105
Ou
tco
me
4
Table 2.4.7: Performance Criteria for Program 4.6
Program 4.6: Dental Services
The Australian Government will improve access to public adult dental services through National Partnership Agreements with the States and Territories, and support eligible children to access essential dental health services through the Child Dental Benefits Schedule. The Government is committed to improving Australian children’s dental health and ensuring that children across the country have access to dentists when they need it. In the 2017-18 Budget, a further $163.6 million over five years will be provided to increase the two calendar year benefits cap from $700 to $1,000 for all children eligible for the Child Dental Benefits Schedule, retrospectively from 1 January 2017.
Delivery
A. Improving access to dental services
Funding the States and Territories for an additional 89,000 adult public dental patients,through the extension to the National Partnership Agreement (NPA) on Adult Public Dental Services.
Finalising negotiations with the States and Territories on a new NPA for additional adultpublic dental services.
Working with the Department of Human Services in monitoring access to dental healthservices for children through the Child Dental Benefits Schedule.
Performance criteria
A. Improving access to dental services
Support eligible children to access essential dental health services through the Child Dental Benefits Schedule.
2016-17 Estimated result
2017-18 Target
2018-19 Target
2019-20 Target
2020-21 Target
1.05 million children accessed the Child Dental Benefits Schedule.
1.11 million children access the Child Dental Benefits Schedule.
1.16 million children access the Child Dental Benefits Schedule.
1.22 million children access the Child Dental Benefits Schedule.
1.30 million children access the Child Dental Benefits Schedule.
Material changes to Program 4.6 resulting from the following measures:
There are no material changes to Program 4.6 resulting from measures.

Budget Statements – Department of Health
106
Table 2.4.8: Performance Criteria for Program 4.7
Program 4.7: Health Benefit Compliance
The Australian Government supports the integrity of health benefit claims through early intervention and identification, as well as detecting and investigating instances of fraud. This will be achieved through: assisting health providers meet their compliance obligations when claiming benefits; intervening and correcting claims when honest mistakes occur; and detecting and investigating fraud and inappropriate practice. In a further move to improve Medicare’s fiscal sustainability, in 2017-18, legislation will be introduced to strengthen compliance, including by increasing the Government’s debt recovery powers. Currently, only 20 per cent of Medicare debts through inappropriate claiming are recovered. This measure will generate estimated net savings of $103.8 million to be reinvested in Medicare services. The Government will enforce existing legislation which governs arrangements between doctors and pathology providers.
Delivery
A. Ensuring the integrity of health provider claiming
Utilise advanced data analytics to identify irregular claiming patterns and non-compliance.
Conduct appropriate interventions through: education; targeted campaigns; generalaudits; practitioner reviews; and criminal investigations.
Performance criteria
A. Ensuring the integrity of health provider claiming
Improve health provider compliance through a contemporary program that utilises advanced analytics and behavioural economics to identify irregular payments and behaviours, measured through: a. Value of debts recovered.b. Behavioural change from activities from prior years.14
2016-17 Estimated result
2017-18 Target
2018-19 Target
2019-20 Target
2020-21 Target
a. $13.0m $15.6m $18.2m $20.8m $20.7m
b. N/A15 $13.0m $15.6m $18.2m $18.2m
Material changes to Program 4.7 resulting from the following measures:
Pathology Approved Collection Centres – strengthening compliance
14 Estimated savings to Government from improved health provider compliance, achieved through positive behavioural change.
15 This is a new performance criterion for 2017-18, therefore there is no estimated result for 2016-17.

Section 2 – Department Outcomes – 4: Individual Health Benefits
107
Ou
tco
me
4
Table 2.4.9: Performance Criteria for Program 4.8
Program 4.8: Targeted Assistance – Aids and Appliances
The Australian Government is committed to improving health outcomes for the Australian community through the provision of targeted assistance for aids and appliances. Fulfilling its 2016 election commitment, from 1 April 2017 the Government is providing $54 million over five years to subsidise access to continuous glucose monitoring technology for children and young adults under 21 years of age with insulin-dependent type 1 diabetes, and who face additional challenges in managing their diabetes and blood glucose levels. In addition, the Government will simplify the subsidy and remove the co-payment for the Insulin Pump Program. The Government will also implement recommendations from the Stoma Product Assessment Panel for changes to the Stoma Appliance Scheme, and will provide five new product listings, amendments to 12 product listings and eight product deletions.
Delivery
A. Improving health outcomes through the provision of targeted assistance for aids and appliances
Through the National Diabetes Services Scheme, continue to ensure the provision oftimely, reliable and affordable access to products and services to help people effectively manage their condition.
Continue to support access to clinically appropriate dressings to improve the quality of lifefor people with Epidermolysis Bullosa.
Continue to assist people with stomas by ensuring access to stoma-related products witha greater choice of new products.
Performance criteria
A. Improving health outcomes through the provision of targeted assistance for aids and appliances
The National Diabetes Services Scheme meets the needs of registrants.16
2016-17 Estimated result 2017-18 Target 2018-19 (& beyond) Target
70% of registrants surveyed through the annual National Diabetes Services Scheme registrant survey felt that the National Diabetes Services Scheme was meeting their needs.
Annual National Diabetes Services Scheme registrant survey demonstrates that the needs of registrants are being met.
As per 2017-18.
Support children and young people under 21 years of age, with type 1 diabetes, through the National Diabetes Services Scheme.
2016-17 Estimated result 2017-18 Target 2018-19 (& beyond) Target
Subsidised continuous glucose monitoring products have been provided to eligible children and young people under 21 years of age through the National Diabetes Services Scheme from 1 April 2017.
Provide eligible children and young people under 21 years of age with subsidised continuous glucose monitoring products through the National Diabetes Services Scheme to assist in the management of their type 1 diabetes.
As per 2017-18.
16 Registrants are people with type 1 diabetes, type 2 diabetes, gestational diabetes or ‘other diabetes’ who are registered on the National Diabetes Services Scheme.

Budget Statements – Department of Health
108
Support Australians to assist in the management of specific chronic health conditions (diabetes, stoma and Epidermolysis Bullosa).
2016-17 Estimated result 2017-18 Target 2018-19 (& beyond) Target
Subsidised aids and appliances have been provided to eligible Australians.
Ensure provision of subsidised aids and appliances to assist eligible Australians in the management of their chronic health conditions.
As per 2017-18.
Material changes to Program 4.8 resulting from the following measures:
Helping Families with Diabetes – free glucose monitoring devices for young Australianswith type 1 diabetes
Helping Families with Diabetes – Insulin Pump Program – reducing patient contributions

Section 2 – Department Outcomes – 5: Regulation, Safety and Protection
109
Ou
tco
me
5
2.5 BUDGETED EXPENSES AND PERFORMANCE FOR OUTCOME 5
Outcome 5: Regulation, Safety and Protection
Protection of the health and safety of the Australian community and preparedness to respond to national health emergencies and risks, including through immunisation, initiatives, and regulation of therapeutic goods, chemicals, gene technology, and blood and organ products
Programs Contributing to Outcome 5
Program 5.1: Protect the Health and Safety of the Community Through Regulation
Program 5.2: Health Protection and Emergency Response
Program 5.3: Immunisation
Linked Programs
Other Commonwealth entities that contribute to Outcome 5
Australian Radiation Protection and Nuclear Safety Agency1 Program 1.1: Radiation Protection and Nuclear Safety The Australian Radiation Protection and Nuclear Safety Agency contributes to the health and safety of the community by protecting the Australian people and environment from the harmful effects of radiation (5.1).
Department of Agriculture and Water Resources Program 2.1: Biosecurity and Export Services The Department of Agriculture and Water Resources contributes to the protection of the health and safety of the Australian community through implementation of activities under the Biosecurity Act 2015, such as the ongoing monitoring of mosquito vectors at ports and airports (5.2).
Australian Competition and Consumer Commission Program 1.1: Australian Competition and Consumer Commission The Australian Competition and Consumer Commission contributes to the health and safety of the Australian community through the consideration and management of unacceptable safety risks posed by consumer goods (5.1).
Department of Education and Training Program 1.2: Child Care Benefit The Department of Education and Training contributes to increasing immunisation coverage rates by including childhood immunisation requirements as part of the eligibility criteria for the Child Care Benefit. Eligibility for benefits is linked to satisfying the requirements for immunisation (5.3).
1 Refer to the Australian Radiation Protection and Nuclear Safety Agency chapter in these Portfolio Budget Statements for further information on the work of this entity.

Budget Statements – Department of Health
110
Department of the Environment and Energy Program 1.6: Management of Hazardous Wastes, Substances and Pollutants The Department of the Environment and Energy contributes to this Outcome through the effective management of risks associated with industrial chemicals by undertaking environmental risk assessments for the National Industrial Chemicals Notification and Assessment Scheme (5.1).
Department of Immigration and Border Protection Program 1.2: Border Management The Department of Immigration and Border Protection facilitates access to health and support services of the Australian community through effective: - Management of the risks associated with industrial chemicals by maintaining records on
the importation of these products (5.1) - Management of the regulations for the import and export of controlled substances at the
border (5.1).
Department of Human Services Program 1.2: Services to the Community The Department of Human Services contributes to increasing immunisation coverage rates, which protect the health and safety of the Australian community, by administering the Australian Immunisation Register on behalf of the Department of Health (5.3).
Department of Social Services Program 1.1: Family Tax Benefit The Department of Social Services contributes to increasing immunisation coverage rates, which protect the health and safety of the Australian community, by administering the Family Tax Benefit A supplements to eligible parents. Eligibility for the supplements is linked to satisfying the requirements of age-related immunisation (5.3).
Safe Work Australia Program 1: Reform of and improvements to Australian work health and safety and workers’ compensation arrangements The Department of Employment contributes to the protection of the health and safety of the Australian community through effective management of risks arising from industrial chemicals through Australian work health and safety and workers’ compensation arrangements (5.1).
The Treasury Program 1.9: National Partnership Payments to the States The Treasury makes National Partnership Payments to the State and Territory Governments as part of the Federal Financial Relations Framework.2 Activities funded through the following National Partnership Agreements contribute to the Government’s objectives within this Outcome: - Royal Darwin Hospital – equipped, prepared and ready (5.2) - OzFoodNet Program (5.2) - Addressing Blood Borne Viruses (BBV) and Sexually Transmissible Infections (STI) in
the Torres Strait (5.2) - Mosquito Control and Cross Border Liaison in the Torres Strait (5.2) - Management of Torres Strait/Papua New Guinea Cross-Border Health Issues (5.2) - Vaccine-preventable diseases surveillance (5.2) - Essential vaccines (5.3).
2 For Budget estimates relating to the National Partnership component of the program, refer to Budget Paper No. 3 or Program 1.9 of the Treasury’s Portfolio Budget Statements.

Section 2 – Department Outcomes – 5: Regulation, Safety and Protection
111
Ou
tco
me
5
Table 2.5.1: Budgeted Expenses for Outcome 5
Table 2.5.1 shows how much the entity intends to spend (on an accrual basis) on achieving the outcome, broken down by program, as well as by administered and departmental funding sources.
2016-17 Estimated
actual $'000
2017-18 Budget
$'000
2018-19 Forward
Year 1 $'000
2019-20 Forward
Year 2 $'000
2020-21 Forward
Year 3 $'000
Program 5.1: Protect the Health and Safety of the Community Through Regulation
Administered expenses
Ordinary annual services (a) - - - - -
Departmental expenses
Departmental appropriation (b) 16,081 15,821 13,799 13,725 14,131
to Special Accounts (10,522) (10,254) (8,302) (8,312) (8,357)
Expenses not requiring appropriation 85 106 90 90in the Budget year (c) 88
Special Accounts
OGTR Special Accounts (d) 7,773 7,878 7,635 7,643 7,682
NICNAS Special Accounts (e) 19,676 19,710 14,456 14,356 14,418
TGA Special Accounts (f) 153,535 153,474 146,168 147,627 150,232
Expense adjustment (g) (8,566) (7,029) 4,197 5,007 4,578
Total for Program 5.1 178,065 179,685 178,059 180,136 182,774

Budget Statements – Department of Health
112
Table 2.5.1: Budgeted Expenses for Outcome 5 (continued)
2016-17 Estimated
actual $'000
2017-18 Budget
$'000
2018-19 Forward
Year 1 $'000
2019-20 Forward
Year 2 $'000
2020-21 Forward
Year 3 $'000
Program 5.2: Health Protection and Emergency Response (h)
Administered expenses
Ordinary annual services (a) 88,699 89,269 91,167 90,771 87,968
Non cash expenses (i) 21,515 29,926 24,661 12,788 2,525
Special Accounts
Human Pituitary Hormones Special Account 160 160 170 170 170
Departmental expenses
Departmental appropriation (b) 15,799 15,036 15,016 14,858 14,829
Expenses not requiring appropriation 379 474 401 401in the Budget year (c) 1,221
Total for Program 5.2 127,394 134,770 131,488 118,988 105,893
Program 5.3: Immunisation (h)
Administered expenses
Ordinary annual services (a) 36,352 30,714 26,194 26,157 24,966
to Australian Childhood Immunisation Special Account (5,913) (5,966) (5,966) (5,966) (5,966)
Special Accounts
Australian Immunisation Register Special Account 9,650 9,820 9,820 9,820 9,820
Special appropriations
National Health Act 1953 - essential vaccines 302,619 284,930 284,928 284,855 284,855
Departmental expenses
Departmental appropriation (b) 7,923 7,300 7,232 7,153 7,138
Expenses not requiring appropriation 137 171 145 145in the Budget year (c) 555
Total for Program 5.3 351,186 326,935 322,379 322,164 320,958

Section 2 – Department Outcomes – 5: Regulation, Safety and Protection
113
Ou
tco
me
5
Table 2.5.1: Budgeted Expenses for Outcome 5 (continued)
2016-17 Estimated
actual $'000
2017-18 Budget
$'000
2018-19 Forward
Year 1 $'000
2019-20 Forward
Year 2 $'000
2020-21 Forward
Year 3 $'000
Outcome 5 totals by appropriation type
Administered expenses
Ordinary annual services (a) 125,051 119,983 117,361 116,928 112,934
to Special accounts (5,913) (5,966) (5,966) (5,966) (5,966)
Non cash expenses (i) 21,515 29,926 24,661 12,788 2,525
Special Accounts 9,810 9,980 9,990 9,990 9,990
Special appropriations 302,619 284,930 284,928 284,855 284,855
Departmental expenses
Departmental appropriation (b) 39,803 38,157 36,047 35,736 36,098
to Special accounts (10,522) (10,254) (8,302) (8,312) (8,357)
Expenses not requiring appropriation 601 751 636 636in the Budget year (c) 1,864
Special Accounts 172,418 174,033 172,456 174,633 176,910
Total expenses for Outcome 5 656,645 641,390 631,926 621,288 609,625
2016-17 2017-18
Average staffing level (number) 895 882
(a) Appropriation (Bill No. 1) 2017-18. (b) Departmental appropriation combines 'Ordinary annual services (Appropriation Bill No. 1)' and 'Revenue
from independent sources (s74)'. (c) Expenses not requiring appropriation in the Budget year are made up of depreciation expense,
amortisation expense, makegood expense and audit fees. (d) Office of the Gene Technology Regulator Special Account. (e) National Industrial Chemicals Notification and Assessment Scheme Special Account. (f) Therapeutic Goods Administration (TGA) Special Account. (g) Special accounts are reported on a cash basis. This adjustment reflects the differences between expense
and cash, and eliminates inter-entity transactions between the core Department and TGA. (h) Budget estimates for this program exclude National Partnership funding paid to State and Territory
Governments by the Treasury as part of the Federal Financial Relations (FFR) Framework. National Partnerships are listed in this chapter under each program. For Budget estimates relating to the National Partnership component of this program, refer to Budget Paper No. 3 or Program 1.9 of the Treasury's Portfolio Budget Statements.
(i) 'Non cash expenses' relate to the write down of drug stockpile inventory due to expiration, consumption and distribution.
Movement of Funds
There were no movements of administered funds between years for Outcome 5.

Budget Statements – Department of Health
114
Planned Performance for Outcome 5
Tables 2.5.2 — 2.5.4 below detail the performance criteria for each program associated with Outcome 5. These tables also summarise how each program is delivered and where 2017-18 Budget measures have materially changed existing programs.
Table 2.5.2: Performance Criteria for Program 5.1
Purpose
Lead and shape Australia’s health and aged care system and sporting outcomes through evidence-based policy, well targeted programs, and best practice regulation.
Outcome 5: Regulation, Safety and Protection
Protection of the health and safety of the Australian community and preparedness to respond to national health emergencies and risks, including through immunisation initiatives, and regulation of therapeutic goods, chemicals, gene technology, and blood and organ products
Program 5.1: Protect the Health and Safety of the Community Through Regulation
The Government, through the Therapeutic Goods Administration (TGA), protects the health and safety of the community by regulating therapeutic goods for safety, effectiveness/performance and quality. The TGA aims to deliver efficient, best practice regulatory outcomes through international collaboration and reform. The TGA will continue to monitor therapeutic goods which are manufactured, used, imported into or exported from Australia, and undertake compliance and enforcement activities. Through the Office of Drug Control, the Department will continue to regulate and provide advice on the import, export, and manufacture of controlled drugs to support Australia’s obligations under the International Narcotic Drugs Conventions, and regulate the cultivation and manufacture of medicinal cannabis products in Australia. The Government aims to protect the health and safety of people and the environment by identifying and managing risks through regulating activities with genetically modified organisms (GMOs). In 2017-18, the Office of the Gene Technology Regulator will continue to ensure that all risk assessments of GMOs are based on current scientific evidence and represent international best practice by keeping pace with advances in scientific knowledge and regulatory practice. The Government also aims to protect human health and the environment by assessing the risks posed by the introduction and use of industrial chemicals. Consistent with the Government’s regulatory reform agenda, regulation by the Department will be proportionate to risk, and safeguard the health and wellbeing of the community and the environment. In the 2017-18 Budget, the Government will spend $2.1 million over two years to implement its 2016 election commitment to introduce a ban on cosmetic testing on animals from 1 July 2017.

Section 2 – Department Outcomes – 5: Regulation, Safety and Protection
115
Ou
tco
me
5
Delivery
A. Regulating therapeutic goods for safety, effectiveness/performance and quality while promoting best practice
Publish performance statistics reports and a key performance indicator report incompliance with the Regulator Performance Framework.
Participate in international engagement and work sharing activities with comparableinternational regulators.
Monitor regulatory compliance and take appropriate action.
Improve access to therapeutic goods for consumers and streamline regulatory processesfor industry by implementing the Australian Government’s reforms arising from theReview of Medicines and Medical Devices Regulation.
B. Regulating the import, export, and manufacture of controlled drugs, and cultivation of medicinal cannabis
Continue to administer the licensing and permit regime for import, export, andmanufacture of controlled drugs in line with Australian legislation and internationalconventions, to ensure access to essential medications while supporting Governmentpolicy on harm minimisation and harm reduction.
Provide timely and quality advice to meet Australia’s reporting obligations under theInternational Drug Conventions.
Administer the licensing and permit regime for the cultivation and production of medicinalcannabis, including supporting the development of a new industry while working with lawenforcement agencies to control diversion risks.3
C. Protecting people and the environment by assessing the risks of industrial chemicals and providing information to promote their safe use
Make recommendations to Commonwealth, State and Territory risk managementagencies on the safe use of industrial chemicals.
Make information on the safe use of industrial chemicals publicly available.
Implement reforms to the National Industrial Chemicals Notification and AssessmentScheme (NICNAS) to achieve an appropriate balance between regulatory effort and risksposed by industrial chemicals.
D. Protecting the health and safety of people and the environment by regulating activities with genetically modified organisms (GMOs)
Administer the national scheme for the regulation of gene technology to protect thehealth and safety of people and the environment through the Gene TechnologyRegulator.
Conduct cooperative compliance activity with regulated communities for managing anyrisk to people and the environment. These include routine inspection of certified facilitiesand licensed activities with GMOs in contained facilities and field trials.
E. Protecting the health of people and the environment through effective regulation
Amend the National Health and Medical Research Council (NHMRC), Australian code forthe care and use of animals for scientific purposes 8th edition (2013) to exclude the useof animals for testing cosmetic products and ingredients.
Undertake procurement to develop an Industry Code of Practice and a productinformation and communication package to ensure industry and the general public areaware of the details of the ban of the testing of cosmetics on animals.
3 Diversion refers to the transfer of legally prescribed substances from the person for whom it was intended to another person for illicit use.

Budget Statements – Department of Health
116
Performance criteria
A. Regulating therapeutic goods for safety, effectiveness/performance and quality while promoting best practice
Regulate therapeutic goods for safety, effectiveness/performance and quality.4 a. Percentage of applications lodged under prescription medicines registration
(Category 1 applications) processed within 255 working days.b. Percentage of quality related evaluations of prescription medicines (Category 3
applications) processed within 45 working days.c. Percentage of conformity assessments for medical devices processed within 255
working days.d. Percentage of licensing and surveillance inspections completed within target
timeframes.
2016-17 Estimated result
2017-18 Target
2018-19 Target
2019-20 Target
2020-21 Target
a. 100% 100% 100% 100% 100%
b. 100% 100% 100% 100% 100%
c. 100% 100% 100% 100% 100%
d. 85% 85% 85% 85% 85%
Contribute to the evolving international environment to help support the quality and safety of medicines and medical devices in Australia.5
2016-17 Estimated result 2017-18 Target 2018-19 (& beyond) Target
Engaged in activities to reduce duplication in pre and post-market regulation of therapeutic goods and enable consistent regulatory decision making about the safety, quality and effectiveness of therapeutic goods available in Australia. Engaged in international forums and collaboration with other national regulatory authorities to facilitate the harmonisation of requirements, strengthening of regulatory partnerships, and monitoring of global regulatory priorities.
Increase engagement with overseas regulators in comparable health systems, and with regional and international organisations, such as the World Health Organization, to improve public health and safety. Increase use of overseas assessments by comparable regulators, while maintaining sovereignty of regulatory decisions.
As per 2017-18.
4 Further information available at: www.tga.gov.au/half-yearly-performance-reports; www.tga.gov.au/tga-key-performance-indicators-july-2015-june-2016; www.tga.gov.au/performance-statistics-reports
5 Further information available at: www.tga.gov.au/publication/tga-international-engagement-strategy-2016-2020

Section 2 – Department Outcomes – 5: Regulation, Safety and Protection
117
Ou
tco
me
5
Improve intelligence, monitoring and compliance functions to ensure compliance with the Therapeutic Goods Act 1989.
2016-17 Estimated result 2017-18 Target 2018-19 (& beyond) Target
Developed a Compliance and Enforcement Plan to provide a targeted approach to investigation and compliance activities. Developed more effective inter-agency partnerships to enable greater monitoring and use intelligence to target non-compliance. Removed illegal and/or non-compliant products that pose an unacceptable risk from the Australian market.
Implement the Compliance and Enforcement Plan. Strengthen inter-agency partnerships to enable greater monitoring and use intelligence to target non-compliance. Remove illegal and/or non-compliant products that pose an unacceptable risk from the Australian market.
Review the Compliance and Enforcement Plan to ensure ongoing improvement in targeting compliance activities. Through effective inter-agency partnerships, monitor and use intelligence to target non-compliance. Remove illegal and/or non-compliant products that pose an unacceptable risk from the Australian market.
Improve access to therapeutic goods for consumers whilst maintaining the safety of therapeutic goods in Australia.
2016-17 Estimated result 2017-18 Target 2018-19 (& beyond) Target
Commenced implementation of the Australian Government’s reforms arising from the Review of Medicines and Medical Devices Regulation (the Review),6 including initial changes to the Therapeutic Goods Act 1989 through the Therapeutic Goods Amendment (2016 Measures No. 1) Bill 2016. Further review of the regulatory framework applying to low risk therapeutic goods as part of the Medicines and Medical Devices program of reforms.
Implementation of the Australian Government’s reforms arising from the Review progressed through:
Developing and implementing new regulatory pathways for prescription and complementary medicines and medical devices.
A risk-based approach to variations to registered medicines.
Improving patient-specific access to unapproved therapeutic goods.
More effective regulation of therapeutic goods advertising.
Full implementation of the Australian Government’s reforms arising from the Review.
Maintain the Poisons Standard in accordance with the requirements of the Therapeutic Goods Regulations 1990 to support protection of the community.
2016-17 Estimated result 2017-18 Target 2018-19 (& beyond) Target
Considered advice from the Advisory Committee on Medicines or Chemicals Scheduling to inform updates to the Poisons Standard. Further review of the Scheduling Policy Framework as part of the Medicines and Medical Devices program of reforms.
Consider advice from the Advisory Committee on Medicines or Chemicals Scheduling to inform updates to the Poisons Standard. Implement scheduling policy reforms.
Consider advice from the Advisory Committee on Medicines or Chemicals Scheduling to inform updates to the Poisons Standard.
6 Further information available at: www.tga.gov.au/mmdr

Budget Statements – Department of Health
118
B. Regulating the import, export, and manufacture of controlled drugs, and cultivation of medicinal cannabis
Applications for the import, export, and manufacture of controlled substances are assessed and processed within appropriate timeframes to support Australian industry to engage in international trade, and ensure that medicinal products are available to Australian patients.
2016-17 Estimated result 2017-18 Target 2018-19 (& beyond) Target
Applications have been processed within agreed timeframes.
Applications are processed within agreed timeframes.
As per 2017-18.
Ensure that licence applications for the cultivation and production of medicinal cannabis are subject to fit and proper person and security tests through engagement with law enforcement and State and Territory regulatory authorities.
2016-17 Estimated result 2017-18 Target 2018-19 (& beyond) Target
All applications received have been subject to the relevant tests and assessment of diversion risk.7 Response rates from States and Territories are improving.
Improve response rates from law enforcement agencies through the formalisation of Memoranda of Understanding. Build internal intelligence holdings supporting repeat and new applications.
As per 2017-18.
C. Protecting people and the environment by assessing the risks of industrial chemicals and providing information to promote their safe use
Increased proportion of NICNAS risk management recommendations considered by Commonwealth and State and Territory risk management agencies and accepted to promote safer use of industrial chemicals.
2016-17 Estimated result
2017-18 Target
2018-19 Target
2019-20 Target
2020-21 Target
80% ≥80% ≥80% ≥85% ≥85%
Increased proportion of known importers and manufacturers of industrial chemicals registered with NICNAS, to promote awareness among the regulated community of their legal obligations.
2016-17 Estimated result
2017-18 Target
2018-19 Target
2019-20 Target
2020-21 Target
90% ≥90% ≥90% ≥95% ≥95%
Maintain proportion of NICNAS risk assessments completed within statutory timeframes to minimise regulatory burden on businesses.
2016-17 Estimated result
2017-18 Target
2018-19 Target
2019-20 Target
2020-21 Target
95% ≥95% ≥95% ≥95% ≥95%
7 Diversion refers to the transfer of legally prescribed substances from the person for whom it was intended to another person for illicit use.

Section 2 – Department Outcomes – 5: Regulation, Safety and Protection
119
Ou
tco
me
5
D. Protecting the health and safety of people and the environment by regulating activities with genetically modified organisms (GMOs)
Protect people and the environment through open, effective and transparent regulation of genetically modified organisms (GMOs).
2016-17 Estimated result 2017-18 Target 2018-19 (& beyond) Target
Prepared risk assessments and risk management plans for 100% of licence applications for release of GMOs into the environment. Consulted stakeholders, including the public, on assessments of licence applications. The Regulator made all licence decisions within the statutory timeframes. The regulated communities maintained a high level of compliance with the gene technology legislation. No adverse effects on human health or the environment from authorised GMOs were found.
Risk assessments and risk management plans prepared for 100% of applications for licensed dealings. 100% of licence decisions made within statutory timeframes. High level of compliance with gene technology legislation and no adverse effect on human health or environment from authorised GMOs. Stakeholders, including the public, consulted on all assessments for proposed release of GMOs into the environment.
As per 2017-18.
Enhance harmonisation in the regulation of genetically modified organisms (GMOs) and genetically modified products.
2016-17 Estimated result 2017-18 Target 2018-19 (& beyond) Target
Engaged with international fora relevant to GMO regulation including the Organisation for Economic Co-operation and Development Working Group on the Harmonisation of Regulatory Oversight in Biotechnology. Continued cooperative arrangements with relevant national regulators to enhance coordinated decision making and avoid duplication in the regulation of GMOs and genetically modified products.
Maintained best practice regulation through participation in international harmonisation activities and collaboration with relevant national regulators.
As per 2017-18.

Budget Statements – Department of Health
120
E. Protecting the health of people and the environment through effective regulation
Strengthen existing frameworks to ban cosmetic testing on animals.
2016-17 Estimated result 2017-18 Target 2018-19 (& beyond) Target
Stakeholder consultation on the approach to the delivery of the ban on cosmetic testing on animals occurred in late 2016 and March 2017.
Amend the National Health and Medical Research Council (NHMRC) Australian Code for the care and use of animals for scientific purposes (Animal Ethics Code) to ban cosmetic testing on animals. Undertake procurement and commence work program to develop a voluntary Industry Code of Practice and a product information and communication package. Legislate Animal Cosmetic Testing Ban as part of the new Industrial Chemicals Bill 2017.
Work with States and Territories to incorporate a cosmetic testing ban through State and Territory legislation in line with the NHMRC Animal Ethics Code. Implement the Industry Code of Practice. The Animal Cosmetic Testing Ban in the Industrial Chemicals Bill takes effect from 1 July 2018.
Material changes to Program 5.1 resulting from the following measures:
There are no material changes to Program 5.1 resulting from measures.

Section 2 – Department Outcomes – 5: Regulation, Safety and Protection
121
Ou
tco
me
5
Table 2.5.3: Performance Criteria for Program 5.2
Program 5.2: Health Protection and Emergency Response
The Government aims to protect the health of the Australian community through effective national leadership and coordination, and through building appropriate capacity and capability to detect, prevent and respond to threats to public health and safety arising from communicable diseases, natural disasters, acts of terrorism, and other incidents that may lead to mass casualties. In the 2017-18 Budget, the Government will continue to fund the production and supply of Australian antivenoms, Q fever vaccine and test kits, and will maintain Australia’s ability to domestically manufacture priority pandemic vaccines to respond to an influenza pandemic. In addition, the Government will provide $85.4 million over three years to support the replenishment of the National Medical Stockpile.
Delivery
A. Reducing the incidence of blood borne viruses and sexually transmissible infections
Continue to provide national leadership and coordination of the implementation of the National Blood Borne Viruses (BBV) and Sexually Transmissible Infections (STI) Strategies 2014–2017.
Develop and implement a new National Strategy for BBV and STI 2018–2022 which provides a national framework for responding to HIV, hepatitis B, hepatitis C and STIs.
Continue to work with State and Territory Governments, and community and professional organisations, to encourage increased uptake of testing and treatment among priority populations, including Aboriginal and Torres Strait Islander peoples, and to implement the Australian Government priority actions to respond to HIV, hepatitis B, hepatitis C and STIs.
Continue to support activities through the Health Protection Program to ensure the quality and safety of the Australian blood supply.
B. Providing an effective response to national health emergencies, improving biosecurity and minimising the risks posed by communicable diseases
Continue to strengthen preparedness to respond to public health threats and health emergencies by reviewing key emergency response plans, the National Health Emergency Response Arrangements and ongoing monitoring of health threats through the National Focal Point.8
Continue to improve Australia’s ability to prevent, detect and rapidly respond to public health threats through improved compliance with the World Health Organization’s International Health Regulations (2005) core capacities.
Maintain Australia’s capacity to respond to health emergencies through ensuring that a strategic reserve of essential pharmaceuticals and protective equipment is available in the National Medical Stockpile.
8 National Focal Point is the area or areas within the Department of Health, designated under the National
Health Security Act 2007, as the International Health Regulations National Focal Point to liaise with and facilitate actions by national and international bodies to prevent, protect against, control and respond to a Public Health Event of National Significance or a Public Health Emergency of International Concern.

Budget Statements – Department of Health
122
Performance criteria
A. Reducing the incidence of blood borne viruses and sexually transmissible infections
National direction supports a coordinated response to reducing the spread of blood borne viruses (BBV) and sexually transmissible infections (STI).
2016-17 Estimated result 2017-18 Target 2018-19 (& beyond) Target
Reporting on progress of programs that support the National BBV and STI Strategies 2014–20179 was successfully undertaken in accordance with the Implementation Plan. States and Territories, clinicians, researchers and community and professional organisations were supported in addressing the rising rates of BBV and STI in the community.
All partners, including States and Territories, clinicians, researchers, and community and professional organisations are supported to address rising rates of BBV and STI in the community through development and publication of the new National BBV and STI Strategy 2018–2022, incorporating HIV, hepatitis B, hepatitis C, and STI, with a focus on Aboriginal and Torres Strait Islander BBV and STI.
All partners including States and Territories, clinicians, researchers and community and professional organisations are supported to address rising rates of BBV and STI in the community with a focus on Aboriginal and Torres Strait Islander BBV and STI through:
Monitoring progress against the programs that support the new National BBV and STI Strategy 2018–2022, in accordance with any implementation plans.
Surveillance and monitoring of progress against targets and goals including estimates of incidence and prevalence.
B. Providing an effective response to national health emergencies, improving biosecurity and minimising the risks posed by communicable diseases
Manage and respond to national health emergencies and emerging health protection issues through effective preparation and mitigation measures.
2016-17 Estimated result 2017-18 Target 2018-19 (& beyond) Target
National Notifiable Diseases Surveillance System data is publicly available. Data quality is monitored in accordance with the National Health Security Act 2007. The Department continued to manage the national response to the global Zika virus outbreak.
National responses to health emergencies are successfully managed through the timely engagement of national health coordination mechanisms and response plans. Collect and disseminate data in the National Notifiable Diseases Surveillance System, including publishing on the Department’s website.10 Complete World Health Organization International Health Regulations (2005) Joint External Evaluation of core capacities.
As per 2017-18. Maintain/improve compliance with the World Health Organization International Health Regulations (2005) core capacities.
9 Further information available at: www.health.gov.au/internet/main/publishing.nsf/Content/ohp-national-
strategies 10 Further information available at: www.health.gov.au/internet/main/publishing.nsf/content/cda-surveil-
nndss-nndssintro.htm

Section 2 – Department Outcomes – 5: Regulation, Safety and Protection
123
Ou
tco
me
5
Provide national direction to minimise the spread of antimicrobial resistance (AMR).
2016-17 Estimated result 2017-18 Target 2018-19 (& beyond) Target
The Implementation Plan to support the National AMR Strategy 2015–19 was signed by the Minister for Health and the Minister for Agriculture and Water Resources in November 2016. An AMR One Health website is under development with an anticipated completion date of 30 June 2017.
Action against the spread of AMR is supported by implementation of programs that support the National AMR Strategy 2015–2019.11
Action against the spread of AMR is supported through:
Implementation of programs that support the National AMR Strategy 2015–2019.
In 2019-20, development of National AMR Strategy 2019–2023 in partnership with the Department of Agriculture and Water Resources.
In 2020-21, action against the spread of AMR is supported by implementation of Department of Health programs that support the National AMR Strategy 2019–2023.
Support Australia’s defences against the potential spread of mosquito-borne diseases on mainland Australia and in the Torres Strait.
2016-17 Estimated result 2017-18 Target 2018-19 (& beyond) Target
A Public Library of Science Neglected Tropical Diseases Report published in February 201712 indicates the program has successfully reduced Aedes albopictus populations on Thursday Island and Horn Island to levels where it is undetectable in up to 90% of surveys, which has reduced the risk of mainland establishment via that route.
Undertake targeted vector surveillance and control programs in the Torres Strait.13 Work closely with the Department of Agriculture and Water Resources and States and Territories, on exotic vector surveillance and control at Australia’s international airports and seaports.
As per 2017-18.
Material changes to Program 5.2 resulting from the following measures:
There are no material changes to Program 5.2 resulting from measures.
11 Further information available at: www.health.gov.au/internet/main/publishing.nsf/Content/ohp-
amr.htm#tocstrategy 12 Public Library of Science Neglected Tropical Diseases; DOI:10.1371/journal.pntd.0005286
February 13, 2017 available at: www.journals.plos.org/plosntds/article?id=10.1371/journal.pntd.0005286 13 Vector control and surveillance aims to manage and eradicate disease carrying mosquito populations.

Budget Statements – Department of Health
124
Table 2.5.4: Performance Criteria for Program 5.3
Program 5.3: Immunisation
The Australian Government aims to reduce the incidence of vaccine preventable diseases to protect individuals and the Australian community through the National Immunisation Program and associated immunisation initiatives. Supporting No Jab, No Pay, the Government will commit $14.1 million over four years through the National Immunisation Program to provide ongoing Catch-Up vaccines for almost 375,000 Australians aged 10 to 19 years, and more than 8,000 adult refugees and humanitarian entrants. In addition, the Government will launch a $5.5 million awareness campaign over three years to improve awareness and uptake of immunisation for children less than five years of age.
Delivery
A. Increasing national immunisation coverage rates and improving the effectiveness of the National Immunisation Program
Promote the safety and effectiveness of the National Immunisation Program, including the need to remain vigilant against vaccine preventable diseases.
Address low vaccine uptake in at risk populations (for example, geographic areas of low coverage) through the Australian Immunisation Register and incentive payments to vaccination providers.
Partner with States and Territories, and other key stakeholders to deliver vaccine initiatives through the National Immunisation Program.
Performance criteria
A. Increasing national immunisation coverage rates and improving the effectiveness of the National Immunisation Program
Increase the immunisation coverage rates in children at 5 years of age.14
2016-17 Estimated result
2017-18 Target
2018-19 Target
2019-20 Target
2020-21 Target
92.2% ≥92.5% ≥93.0% ≥93.5% ≥94.0%
Increase the immunisation coverage rates among 12-15 months of age Aboriginal and Torres Strait Islander children.15
2016-17 Estimated result
2017-18 Target
2018-19 Target
2019-20 Target
2020-21 Target
89.8% ≥89.0% ≥90.0% ≥90.5% ≥91.0%
Material changes to Program 5.3 resulting from the following measures:
Supporting No Jab No Pay – National Immunisation Program – expansion
14 Further information available at: www.immunise.health.gov.au/internet/immunise/publishing.nsf/Content/
acir-curr-data.htm 15 Ibid.

Section 2 – Department Outcomes – 6: Ageing and Aged Care
125
Ou
tco
me
6
2.6 BUDGETED EXPENSES AND PERFORMANCE FOR OUTCOME 6
Outcome 6: Ageing and Aged Care
Improved wellbeing for older Australians through targeted support, access to quality care and related information services
Programs Contributing to Outcome 6
Program 6.1: Access and Information
Program 6.2: Home Support and Care
Program 6.3: Residential and Flexible Care
Program 6.4: Aged Care Quality
Linked Programs
Other Commonwealth entities that contribute to Outcome 6
Australian Aged Care Quality Agency1 Program 1.1: Quality Assessment, Compliance Monitoring and Promotion of High Quality Care in Australian Government Subsidised Aged Care Services The Australian Aged Care Quality Agency contributes to this Outcome through quality assurance across the aged care sector, supporting and promoting quality in aged care service delivery, and delivering a comprehensive industry accreditation and education program (6.4).
Department of Human Services Program 1.2: Services to the Community – Health The Department of Human Services contributes to this Outcome by: - Undertaking income testing for care recipients (6.2) - Making payments under the Continence Aids Payment Scheme (6.2) - Administering payments to aged care providers (6.2 and 6.3) - Means testing residents (6.3).
Department of Social Services Program 3.1: Disability Mental Health and Carers Program Program 3.2: National Disability Insurance Scheme The Department of Social Services contributes to this Outcome by providing assistance, support and services for people with a disability and their carers (all Outcome 6 programs).
Department of Veterans’ Affairs Program 2.4: Veterans’ Community Care and Support Alongside the ageing and aged care programs administered by the Department of Health for the broader community, the Department of Veterans’ Affairs contributes to the delivery of aged and community care for Australian veterans (6.3).
1 Refer to the Australian Aged Care Quality Agency chapter in these Portfolio Budget Statements for further
information on the work of this entity.

Budget Statements – Department of Health
126
The Treasury Program 1.9: National Partnership Payments to the States The Treasury makes National Partnership Payments to the State and Territory Governments for Home and Community Care as part of the Federal Financial Relations Framework. Activities funded for Home and Community Care contribute to the Government objectives within this outcome (6.2).2
Table 2.6.1: Budgeted Expenses for Outcome 6
Table 2.6.1 shows how much the entity intends to spend (on an accrual basis) on achieving the outcome, broken down by program, as well as by administered and departmental funding sources.
2016-17 Estimated
actual $'000
2017-18 Budget
$'000
2018-19 Forward
Year 1 $'000
2019-20 Forward
Year 2 $'000
2020-21 Forward
Year 3 $'000
Program 6.1: Access and Information
Administered expenses
Ordinary annual services (a) 195,875 209,190 210,132 218,601 220,878
Departmental expenses
Departmental appropriation (b) 43,457 42,077 42,645 42,275 42,196
Expenses not requiring appropriation 734 918 777 777 in the Budget year (c) 2,582
Total for Program 6.1 241,914 252,001 253,695 261,653 263,851
Program 6.2: Home Support and Care (d)
Administered expenses
Ordinary annual services (a) 2,269,276 2,549,718 3,086,111 3,237,406 3,343,528
Special appropriations
Aged Care Act 1997 - home care packages 1,726,419 1,967,122 2,293,311 2,656,893 2,971,024
National Health Act 1953 - continence aids payments 85,291 86,792 84,657 75,043 77,344
Departmental expenses
Departmental appropriation (b) 43,151 45,459 50,078 47,632 47,058
Expenses not requiring appropriation 722 903 764 764 in the Budget year (c) 2,858
Total for Program 6.2 4,126,995 4,649,813 5,515,060 6,017,738 6,439,718
2 For Budget estimates relating to the National Partnership component of the program, refer to
Budget Paper No. 3 or Program 1.9 of the Treasury’s Portfolio Budget Statements.

Section 2 – Department Outcomes – 6: Ageing and Aged Care
127
Ou
tco
me
6
Table 2.6.1: Budgeted Expenses for Outcome 6 (continued)
2016-17 Estimated
actual $'000
2017-18 Budget
$'000
2018-19 Forward
Year 1 $'000
2019-20 Forward
Year 2 $'000
2020-21 Forward
Year 3 $'000
Program 6.3: Residential and Flexible Care
Administered expenses
Ordinary annual services (a) (e) 107,546 100,929 102,901 114,201 132,477
Zero Real Interest Loans
- appropriation 67,040 34,200 17,960 - -
- expense adjustment (f) (47,451) (22,866) (11,936) - -
Special appropriations
Aged Care Act 1997 - residential care 10,885,981 11,429,323 12,058,575 12,871,183 13,554,026
Aged Care Act 1997 - flexible care 431,390 472,175 495,409 539,798 583,032
Aged Care (Accommodation Payment Security) Act 2006 801 - - - -
Departmental expenses
Departmental appropriation (b) 48,661 44,184 44,755 44,331 44,048
Expenses not requiring appropriation 802 1,003 849 849 in the Budget year (c) 2,983
Total for Program 6.3 11,496,951 12,058,747 12,708,667 13,570,362 14,314,432
Program 6.4: Aged Care Quality
Administered expenses
Ordinary annual services (a) 131,432 114,210 117,225 119,091 120,977
Departmental expenses
Departmental appropriation (b) 52,011 45,681 44,616 44,190 44,010
Expenses not requiring appropriation 799 999 845 845 in the Budget year (c) 2,684
Total for Program 6.4 186,127 160,690 162,840 164,126 165,832
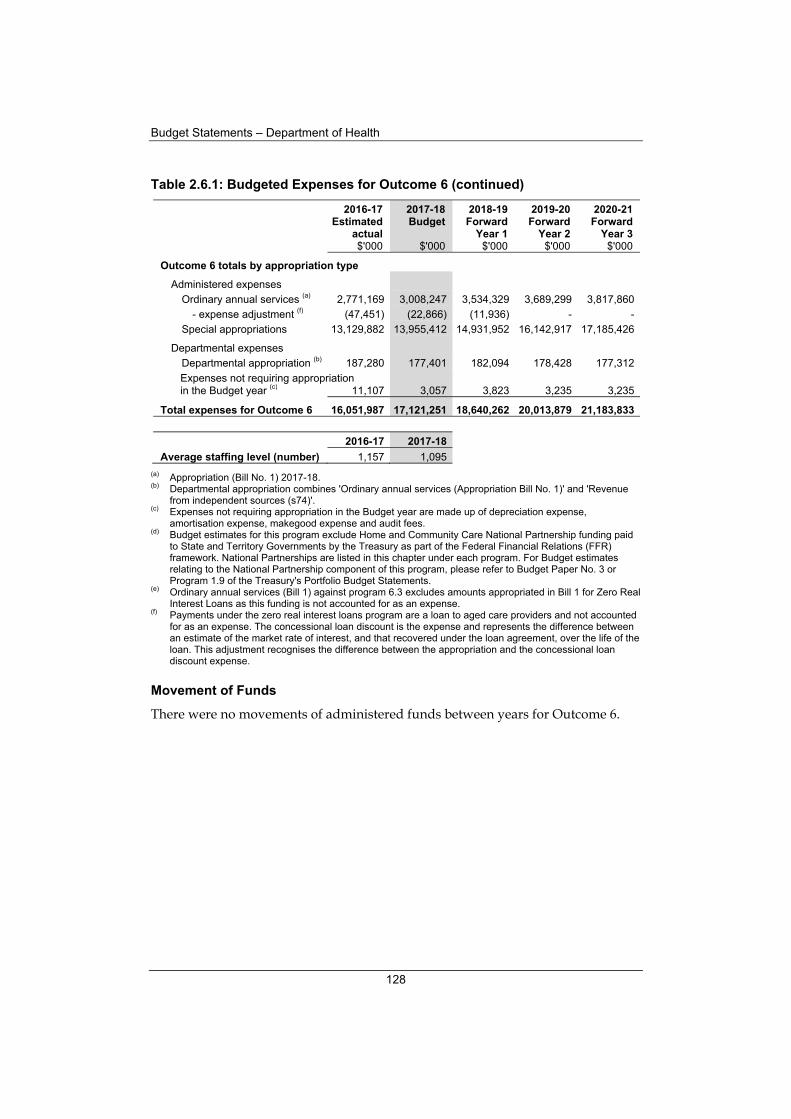
Budget Statements – Department of Health
128
Table 2.6.1: Budgeted Expenses for Outcome 6 (continued)
2016-17 Estimated
actual $'000
2017-18 Budget
$'000
2018-19 Forward
Year 1 $'000
2019-20 Forward
Year 2 $'000
2020-21 Forward
Year 3 $'000
Outcome 6 totals by appropriation type
Administered expenses
Ordinary annual services (a) 2,771,169 3,008,247 3,534,329 3,689,299 3,817,860
- expense adjustment (f) (47,451) (22,866) (11,936) - -
Special appropriations 13,129,882 13,955,412 14,931,952 16,142,917 17,185,426
Departmental expenses
Departmental appropriation (b) 187,280 177,401 182,094 178,428 177,312
Expenses not requiring appropriation 3,057 3,823 3,235 3,235 in the Budget year (c) 11,107
Total expenses for Outcome 6 16,051,987 17,121,251 18,640,262 20,013,879 21,183,833
2016-17 2017-18
Average staffing level (number) 1,157 1,095
(a) Appropriation (Bill No. 1) 2017-18. (b) Departmental appropriation combines 'Ordinary annual services (Appropriation Bill No. 1)' and 'Revenue
from independent sources (s74)'. (c) Expenses not requiring appropriation in the Budget year are made up of depreciation expense,
amortisation expense, makegood expense and audit fees. (d) Budget estimates for this program exclude Home and Community Care National Partnership funding paid
to State and Territory Governments by the Treasury as part of the Federal Financial Relations (FFR) framework. National Partnerships are listed in this chapter under each program. For Budget estimates relating to the National Partnership component of this program, please refer to Budget Paper No. 3 or Program 1.9 of the Treasury's Portfolio Budget Statements.
(e) Ordinary annual services (Bill 1) against program 6.3 excludes amounts appropriated in Bill 1 for Zero Real Interest Loans as this funding is not accounted for as an expense.
(f) Payments under the zero real interest loans program are a loan to aged care providers and not accounted for as an expense. The concessional loan discount is the expense and represents the difference between an estimate of the market rate of interest, and that recovered under the loan agreement, over the life of the loan. This adjustment recognises the difference between the appropriation and the concessional loan discount expense.
Movement of Funds
There were no movements of administered funds between years for Outcome 6.

Section 2 – Department Outcomes – 6: Ageing and Aged Care
129
Ou
tco
me
6
Planned Performance for Outcome 6
Tables 2.6.2 – 2.6.5 below detail the performance criteria for each program associated with Outcome 6. These tables also summarise how each program is delivered and where 2017-18 Budget measures have materially changed existing programs.
Table 2.6.2: Performance Criteria for Program 6.1
Purpose
Lead and shape Australia’s health and aged care system and sporting outcomes through evidence-based policy, well targeted programs, and best practice regulation.
Outcome 6: Ageing and Aged Care
Improved wellbeing for older Australians through targeted support, access to quality care and related information services
Program 6.1: Access and Information
The Australian Government through My Aged Care allows older people, their families, representatives and carers easier access to reliable and trusted information about aged care services. My Aged Care aims to enable people to maximise their independence, choice and quality of life. In addition, it aims to provide improved and more consistent client outcomes, responsive assessments of clients’ needs and goals, appropriate referrals and equitable access to aged care services. The 2017-18 Budget will provide additional funding of $3.1 million for ICT support for the My Aged Care platform. Critical improvements in system performance and efficiency will help ensure timely access to aged care for older people, and enable information technology infrastructure to keep pace with the increase in the number of people using My Aged Care.
Delivery
A. Supporting equitable and timely access to aged care services and information for older Australians, their families, representatives and carers
Provide a clear service and information resource with easily identifiable entry points, such as the My Aged Care website and contact centre.
Deliver high quality assessments and referrals to aged care services.
Improve user experience of the My Aged Care website to support access to timely, relevant and easy to use information.
Develop tailored information materials for people with diverse needs.
Provide support for vulnerable clients to access suitable services.
Implement the redesigned National Aged Care Advocacy Program to assist older people to understand their aged care options in order to make informed choices.
Implement a redesigned Community Visitors Scheme to support recipients of Commonwealth funded aged care services who are socially isolated or at risk of social isolation.

Budget Statements – Department of Health
130
Performance criteria
A. Supporting equitable and timely access to aged care services and information for older Australians, their families, representatives and carers
Demonstrated system efficiency of My Aged Care through: a. Maintaining the percentage of high priority comprehensive assessments with clinical
intervention completed within 48 hours of referral acceptance. b. Maintaining the percentage of high priority home support assessments completed
within 10 calendar days of referral acceptance.
2016-17 Estimated result
2017-18 Target
2018-19 Target
2019-20 Target
2020-21 Target
a. 69.5%3 >90% >90% >90% >90%
b. 81.3%4 >90% >90% >90% >90%
Percentage of surveyed users5 who are satisfied6 with the service provided by the: a. My Aged Care Contact Centre. b. My Aged Care website.
2016-17 Estimated result
2017-18 Target
2018-19 Target
2019-20 Target
2020-21 Target
a. 96% ≥95% ≥95% ≥95% ≥95%
b. 56% ≥65% ≥65% ≥65% ≥65%
Material changes to Program 6.1 resulting from the following measures:
National Disability Insurance Scheme – finalisation of transition arrangements
3 Data correct as at 31 March 2017. 4 Ibid. 5 ‘Users’ refers broadly to different types of callers to the My Aged Care Contact Centre and visitors to the
My Aged Care website, including people seeking information and/or services for themselves, or others, as well as aged care service providers seeking information or system help.
6 ’Satisfied’ callers to the My Aged Care Contact Centre and visitors to the My Aged Care website are those who respond ‘very satisfied’ or ‘satisfied’ to the My Aged Care Customer Satisfaction Survey question: “How satisfied were you overall with your experience?”

Section 2 – Department Outcomes – 6: Ageing and Aged Care
131
Ou
tco
me
6
Table 2.6.3 – Performance Criteria for Program 6.2
Program 6.2: Home Support and Care
The Australian Government aims to provide choice through a range of flexible options to support older people to remain living at home and connected to their communities for longer. These service options include the Commonwealth Home Support Program (CHSP) which provides entry-level support services for older people aged 65 years and older (or 50 years and older for Aboriginal and Torres Strait Islander peoples) who need assistance to keep living independently at home and in their community. This also includes home care packages, which help older Australians living at home to access a range of clinical care, personal care and support services, to assist with day-to-day activities. Recent changes to the Home Care Packages Program mean consumers now have more choice about their care and who delivers it. Consumers can choose a provider that best meets their goals and needs, and change providers more easily if they want to. The Government will also continue to provide assistance to eligible recipients through the Continence Aids Payments Scheme. In the 2017-18 Budget, the Government will extend funding arrangements for the CHSP of $5.5 billion for a further two years until 30 June 2020. This will benefit consumers receiving home support, and their carers, by providing continuity of essential services such as transport, Meals on Wheels, domestic assistance, personal care, nursing and allied health and respite services. This includes extending funding agreements with CHSP service providers and Regional Assessment Services from 1 July 2018 (1 July 2019 in Victoria), with new funding conditions to provide a greater focus on activities that support independence and wellness and provide more choice for consumers. Under this measure, two-year funding agreements will also be offered to eligible Home and Community Care service providers and assessment services in WA, which are moving to the CHSP from 1 July 2018.
Delivery
A. Providing home support for older people who need assistance to keep living independently
Provide older people access to a range of ongoing care services to enable them to keep living in their own homes.
Commence implementation of the Continuity of Support Program in accordance with the agreed schedule with State and Territory Governments. Implementation will be complete when all eligible older people are receiving Commonwealth administered continuity of support arrangements.
B. Providing older people access to a range of ongoing care services to keep living in their own homes
Assign Home Care Packages to consumers through a nationally consistent process via My Aged Care. This approach benefits consumers as assignment is based on how long they have been waiting for care, and their individual needs and circumstances, regardless of where they live.
C. Providing assistance to eligible recipients through the Continence Aids Payments Scheme
Continue to provide financial assistance to eligible people to assist with some of the costs associated with incontinence.

Budget Statements – Department of Health
132
Performance criteria
A. Providing home support for older people who need assistance to keep living independently
Commonwealth Home Support continues to assist older people to stay independent and live in their homes and communities for longer.
2016-17 Estimated result 2017-18 Target 2018-19 (& beyond) Target
Services continue to be provided through the Commonwealth Home Support Program, including growth funding to support the changing needs and growth in Australia’s ageing population.
Continue to provide services through the Commonwealth Home Support Program.
As per 2017-18.
The Commonwealth Continuity of Support Program7 continues to be implemented in a phased approach to support eligible older people with a disability.
2016-17 Estimated result
2017-18 Target
2018-19 Target
2019-20 Target
2020-21 Target
Commenced implementation of services in regions across Queensland, New South Wales and Tasmania.
Progressive regional implementation is ongoing.
Full implementation of all services for New South Wales, South Australia and the Australian Capital Territory.
Full implementation of all services for Victoria, Tasmania, Queensland and the Northern Territory.
Full implementation of all services for Western Australia.
B. Providing older people access to a range of ongoing care services to keep living in their own homes
Provide support to older people with complex care needs to keep them living independently in their own homes through the Home Care Packages Program. a. Number of allocated Home Care Packages.8
2016-17 Estimated result
2017-18 Target
2018-19 Target
2019-20 Target
2020-21 Target
a. 90,7639 100,436 112,733 124,443 134,545
7 The Continuity of Support (CoS) Program provides support to older people with a disability currently
receiving State and Territory-managed specialist disability services, who are not eligible for the National Disability Insurance Scheme (NDIS) at the time the NDIS is implemented in a region. The CoS Program is being implemented in line with the NDIS rollout.
8 Includes mainstream and flexible Home Care Packages. 9 Data correct as at 28 February 2017.

Section 2 – Department Outcomes – 6: Ageing and Aged Care
133
Ou
tco
me
6
C. Providing assistance to eligible recipients through the Continence Aids Payments Scheme
Assist people with permanent and severe incontinence to maintain a good quality of life enabling them to participate in the community.
2016-17 Estimated result 2017-18 Target 2018-19 (& beyond) Target
The Department has provided $83.9m10 in funding through the Continence Aids Payments Scheme to 139,50011 people to assist with meeting some of the costs associated with incontinence.
Provide financial assistance through the Continence Aids Payments Scheme to eligible people to support the purchase of continence products.
As per 2017-18.
Material changes to Program 6.2 resulting from the following measures:
National Disability Insurance Scheme – finalisation of transition arrangements
10 Data correct as at 31 March 2017. Total Continence Aids Payments Scheme funding may change as the
program is demand driven. 11 Ibid.

Budget Statements – Department of Health
134
Table 2.6.4 – Performance Criteria for Program 6.3
Program 6.3: Residential and Flexible Care
The Australian Government funds residential aged care facilities to provide a range of care options and accommodation for older people who are unable to continue living independently in their own homes, either on both a permanent and short-term basis. The Government also funds a number of flexible care options, either in a residential or home care setting, to cater to the needs of older people who may require a different care approach than that provided through mainstream residential or home care.
Delivery
A. Supporting people with different care needs through flexible care arrangements
Expand access to restorative care interventions to improve wellbeing for older people through the Short-Term Restorative Care Program.
Provide flexible care options to meet the aged care needs of older people living in regional and remote communities through the Multi-Purpose Services Program, which in 2017-18 will provide 3,712 places.
Fund the delivery of culturally appropriate aged care for older Aboriginal and Torres Strait Islander peoples close to home through the National Aboriginal and Torres Strait Islander Flexible Aged Care Program, which in 2017-18 is expected to provide 850 places.
B. Supporting people in residential aged care
Continue to subsidise residential aged care places to ensure residential aged care can continue to be provided to older people who can no longer live independently in their own homes. By 30 June 2018 it is expected around 209,700 mainstream residential aged care places will be provided.
Increase the number of residential aged care places available in the community by undertaking a competitive Aged Care Approvals Round.
C. Facilitating equitable access to residential aged care through capital grants
Support the development and refurbishment of aged care facilities by allocating capital grants through the Aged Care Approvals Round, to assist residential aged care providers that do not have the financial capacity to undertake necessary capital works.
D. Protecting the financial security of people in Commonwealth-subsidised residential aged care through the Accommodation Payment Guarantee Scheme
Administer the Accommodation Payment Guarantee Scheme, when Commonwealth-subsidised residential aged care service providers are deemed insolvent following the Secretary’s insolvency event declaration under the Aged Care (Accommodation Payment Security) Act 2006.

Section 2 – Department Outcomes – 6: Ageing and Aged Care
135
Ou
tco
me
6
Performance criteria
A. Supporting people with different care needs through flexible care arrangements
Increase in the number of older people who accessed restorative interventions through the Short-Term Restorative Care Program or the Transition Care Program.
2016-17 Estimated result
2017-18 Target
2018-19 Target
2019-20 Target
2020-21 Target
25,000 ≥27,000 ≥28,000 ≥31,000 ≥34,000
Number of places funded through Multi-Purpose Services.
2016-17 Estimated result
2017-18 Target
2018-19 Target
2019-20 Target
2020-21 Target
3,634 3,712 3,869 3,980 4,060
Number of places funded through the National Aboriginal and Torres Strait Islander Flexible Aged Care Program.
2016-17 Target
2017-18 Target
2018-19 Target
2019-20 Target
2020-21 Target
82012 85013 850 850 850
Estimated result
820
B. Supporting people in residential aged care
Provide residential care options and accommodation for older people who are unable to continue living independently in their own homes. a. Residential aged care places available as at 30 June.
2016-17 Estimated result
2017-18 Target
2018-19 Target
2019-20 Target
2020-21 Target
a. 202,800 209,700 216,900 224,600 232,300
Ensure that subsidies paid to residential aged care providers accurately reflect the assessed care needs of residents.
2016-17 Estimated result 2017-18 Target 2018-19 (& beyond) Target
Based on the high-risk Aged Care Funding Instrument14 claims reviewed up until 31 March 2017, it is estimated that by 30 June 2017, 2,38115 claims will result in adjustments to the amount of subsidies paid.
Aged Care Funding Instrument reviews are undertaken for all residential aged care services that are determined to be at high-risk of inaccurate claiming.
As per 2017-18.
12 This target has been revised to reflect the expansion of existing services (National Aboriginal and Torres
Strait Islander Flexible Aged Care Program and Multi-Purpose Services). 13 The National Aboriginal and Torres Strait Islander Flexible Aged Care Program is a grant based program
with a capped appropriation. Future year targets reflect the current estimates for the program. 14 Approved providers receive Government funding for aged care service provision based on the Aged Care
Funding Instrument appraisals of their care recipients’ level of need. 15 Data correct as at 3 April 2017.

Budget Statements – Department of Health
136
C. Facilitating equitable access to residential aged care through capital grants
Provide assistance for essential capital improvements to support access to residential aged care.
2016-17 Estimated result 2017-18 Target 2018-19 (& beyond) Target
The Department allocated $67m in funding through the Rural, Regional and Other Special Needs Building Fund16 to support 22 projects.
Where access is impeded, the Rural, Regional and Other Special Needs Building Fund provides limited funding to support ongoing improvements for essential construction, maintenance and upgrades where eligible aged care providers are unable to meet the whole cost of capital works.
As per 2017-18.
D. Protecting the financial security of people in Commonwealth-subsidised residential aged care through the Accommodation Payment Guarantee Scheme
Lump sum refunds made to eligible aged care recipients within 14 days following the Secretary’s insolvency event declaration under the Aged Care (Accommodation Payment Security) Act 2006.17
2016-17 Estimated result 2017-18 Target 2018-19 (& beyond) Target
In 2016-17, there have been no instances where the scheme has been triggered.18
100% of lump sum refunds are made within 14 days.
As per 2017-18.
Material changes to Program 6.3 resulting from the following measures:
National Disability Insurance Scheme – finalisation of transition arrangements
16 Further information available at: www.agedcare.health.gov.au/aged-care-funding/capital-funding 17 The administering of the Accommodation Payment Guarantee Scheme is a demand driven process. In
accordance with the Aged Care (Accommodation Payment Security) Act 2006, where the scheme is triggered the Department will make 100% of payments under the scheme for residents who are owed a refundable lump sum balance. The Commonwealth has discretion to levy all approved residential aged care providers to recover the cost of each trigger of the scheme. Further information available at: www.myagedcare.gov.au/financial-and-legal/protecting-consumer-rights
18 Data correct as at 31 March 2017.

Section 2 – Department Outcomes – 6: Ageing and Aged Care
137
Ou
tco
me
6
Table 2.6.5 – Performance Criteria for Program 6.4
Program 6.4: Aged Care Quality
The Australian Government supports the provision of quality care for older Australians. The Government is working with the aged care sector and consumers to develop a single aged care quality framework that is intended to reduce the regulatory burden for providers, and focus more on quality outcomes for consumers. To ensure quality care is provided to people with dementia the Government provides funding to strengthen the capacity of the aged care sector to deliver quality care and services to support people with dementia, their carers and their families. To better meet the needs of those from diverse backgrounds, the Department has also implemented a National Lesbian, Gay, Bisexual, Transgender and Intersex Ageing and Aged Care Strategy, and the National Ageing and Aged Care Strategy for People from Culturally and Linguistically Diverse backgrounds. The Department applies the regulatory framework through a proportional risk-based approach when taking action to protect the health, welfare, and interests of care recipients.
Delivery
A. Ensuring the provision of quality aged care, including equitable care for people from diverse backgrounds, and support for people with dementia
Continue to protect the health, welfare, and interests of consumers of aged care services by taking appropriate regulatory action.
Aged care providers receive support for providing quality care to people living with dementia through the Dementia Training Program, the Dementia Behaviour Management Advisory Service and the Severe Behaviour Response Teams.
Support the delivery of quality aged care services to older people by developing a single aged care quality framework to be delivered from 1 July 2018. This will include new aged care standards, a streamlined way of assessing provider performance against the standards, and the availability of improved information on the quality of aged care services.
Monitoring the aged care system and supporting improvements in the system’s ability to provide sustainable quality care for older people.
Performance criteria
A. Ensuring the provision of quality aged care, including equitable care for people from diverse backgrounds, and support for people with dementia
Protect the safety, wellbeing, and interests of Commonwealth-subsidised care recipients through regulatory activities.
2016-17 Estimated result 2017-18 Target 2018-19 (& beyond) Target
The Department has taken compliance action in relation to those providers found to be non-compliant with their obligations under the Aged Care Act 1997.19
Identify, respond to, and take appropriate action to address approved provider non-compliance under the Aged Care Act 1997.
As per 2017-18.
19 Further information available at: www.agedcare.health.gov.au/ensuring-quality/residential-aged-care-
sanctions/aged-care-sanctions-and-notices-of-non-compliance

Budget Statements – Department of Health
138
Respond to existing and emerging challenges in the provision of aged care for older Australians.
2016-17 Estimated result 2017-18 Target 2018-19 (& beyond) Target
$91.391m provided through the Dementia and Aged Care Services Fund.
Provide $76.138m20 through the Dementia and Aged Care Services Fund for support activities including dementia care, services targeting Lesbian, Gay, Bisexual, Transgender and Intersex people and people from Culturally and Linguistically Diverse backgrounds; and special measures for Aboriginal and Torres Strait Islander peoples.
In 2018-19, provide $76.148m through the Dementia and Aged Care Services Fund. In 2019-20, provide $77.378m through the Dementia and Aged Care Services Fund.
Improve the quality of care for people with dementia by the provision of vocational-level training to aged care workers or continuing professional development training to health professionals.
2016-17 Estimated result 2017-18 Target 2018-19 (& beyond) Target
N/A21 At least 70% of people surveyed22 think that the quality of care they are receiving has improved since their associated aged care worker/health professional has undertaken training through the national Dementia Training Program.
As per 2017-18.
Increase the confidence of aged care providers in managing behavioural and psychological symptoms of dementia.
2016-17 Estimated result 2017-18 Target 2018-19 (& beyond) Target
N/A23 At least 75% of sampled care givers24 report an improvement in confidence when managing behavioural and psychological symptoms of dementia, following an intervention from the Dementia Behaviour Management Advisory Services.
As per 2017-18.
Material changes to Program 6.4 resulting from the following measures:
There are no material changes to Program 6.4 resulting from measures.
20 The reduction in funding from 2017-18 and beyond is due to the following 2012-13 Budget measures
ceasing: Living Longer. Living Better - Better Health Care Connections and Living Longer. Living Better - Tackling Dementia. In addition, funding for this program was redirected by the 2015-16 MYEFO measure Streamlining Health and Aged Care Workforce Programme Funding.
21 This is a new performance criterion for 2017-18, therefore there is no estimated result for 2016-17. 22 People surveyed include providers of care for, and the families of, people living with dementia. 23 This is a new performance criterion for 2017-18, therefore there is no estimated result for 2016-17. 24 Sampled care givers include family carers, acute care staff and aged care staff/providers.
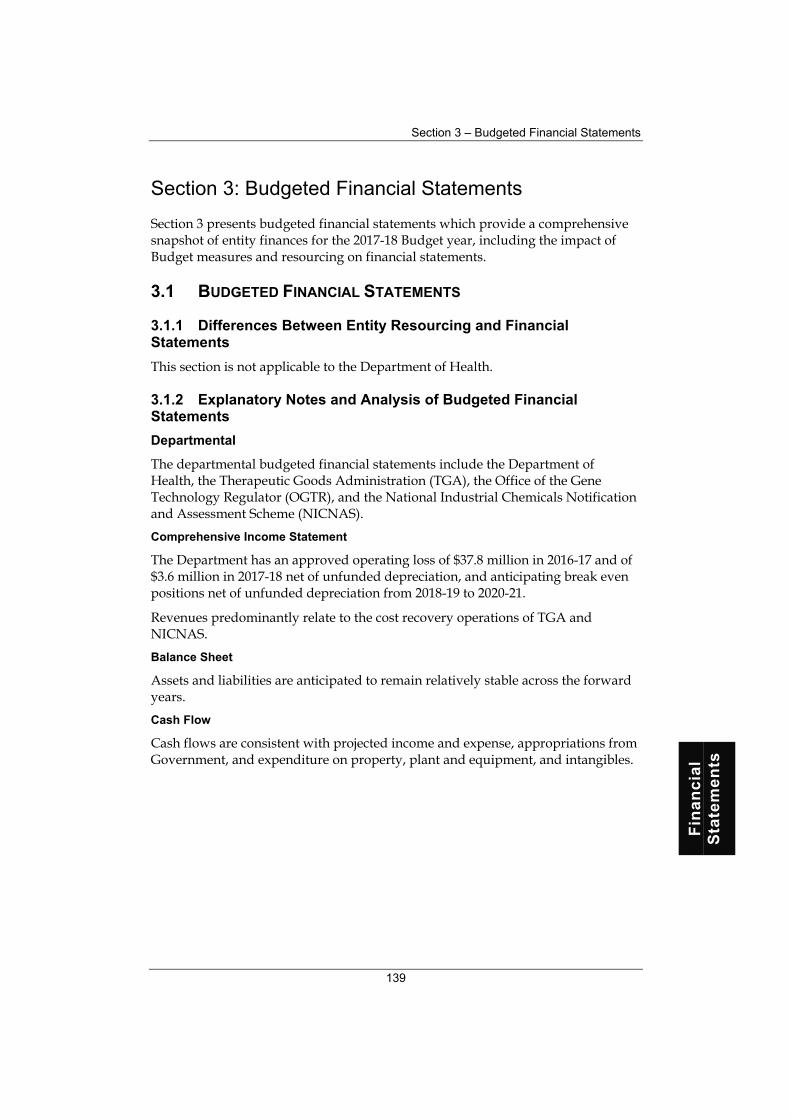
Section 3 – Budgeted Financial Statements
139
Fin
an
cia
l S
tate
me
nts
Section 3: Budgeted Financial Statements
Section 3 presents budgeted financial statements which provide a comprehensive snapshot of entity finances for the 2017-18 Budget year, including the impact of Budget measures and resourcing on financial statements.
3.1 BUDGETED FINANCIAL STATEMENTS
3.1.1 Differences Between Entity Resourcing and Financial Statements
This section is not applicable to the Department of Health.
3.1.2 Explanatory Notes and Analysis of Budgeted Financial Statements
Departmental
The departmental budgeted financial statements include the Department of Health, the Therapeutic Goods Administration (TGA), the Office of the Gene Technology Regulator (OGTR), and the National Industrial Chemicals Notification and Assessment Scheme (NICNAS).
Comprehensive Income Statement
The Department has an approved operating loss of $37.8 million in 2016-17 and of $3.6 million in 2017-18 net of unfunded depreciation, and anticipating break even positions net of unfunded depreciation from 2018-19 to 2020-21.
Revenues predominantly relate to the cost recovery operations of TGA and NICNAS.
Balance Sheet
Assets and liabilities are anticipated to remain relatively stable across the forward years.
Cash Flow
Cash flows are consistent with projected income and expense, appropriations from Government, and expenditure on property, plant and equipment, and intangibles.

Budget Statements – Department of Health
140
Administered
Schedule of Budgeted Income and Expenses
Revenue estimates include levies for medical indemnity and recoveries for pharmaceutical, aged care and Medicare recoveries.
Personal benefits include pharmaceutical and medical benefits and the Private Health Insurance rebate.
Subsidies mainly include payments for the ageing and aged care functions.
Write-down and impairment of assets provides for the obsolescence and expiry of the drug stockpile inventory and the concessional loan discount relates to the recognition of the expenses up-front when making concessional interest loans to aged care providers.
Schedule of Budgeted Assets and Liabilities
The administered Schedule of Budgeted Assets and Liabilities primarily reports movements in liabilities, including estimates for accrued liabilities for unpaid amounts relating to medical benefits, pharmaceutical benefits, and the private health insurance rebate.
The administered Schedule of Budgeted Assets and Liabilities also includes estimates for the value of the National Medical Stockpile inventories, provisions for medical indemnity and investments for the Biomedical Translation Fund.
Schedule of Administered Capital Budget
Capital funding of $25 million has been provided in 2017-18 to provide for replenishment of the National Medical Stockpile.
Cash Flows
Cash flows are consistent with projected income and expenses, capital injections from Government and investments in inventory and the Biomedical Translation Fund.

Section 3 – Budgeted Financial Statements
141
Fin
an
cia
l S
tate
me
nts
3.2 BUDGETED FINANCIAL STATEMENTS TABLES
Table 3.1: Comprehensive Income Statement (showing net cost of services for the period ended 30 June)
2016-17Estimated
actual$'000
2017-18Budget
$'000
2018-19Forward estimate
$'000
2019-20 Forward estimate
$'000
2020-21 Forward estimate
$'000
EXPENSES
Employee benefits 557,886 522,171 522,388 532,611 534,357
Supplier expenses 292,894 287,923 274,382 250,753 241,319
Depreciation and amortisation 27,553 28,302 31,335 28,765 28,743
Write-down and impairment of assets 27 - - - -
Other expenses 11,900 4,000 4,000 4,000 4,000
Total expenses 890,260 842,396 832,105 816,129 808,419
LESS:
OWN-SOURCE INCOME
Revenue
Sale of goods and rendering of services 173,752 176,292 181,717 184,252 186,484
Interest - - 1,917 1,917 1,917
Other revenue 1,358 1,380 1,403 1,428 1,428
Total revenue 175,110 177,672 185,037 187,597 189,829
Gains
Other 870 870 870 870 870
Total gains 870 870 870 870 870
Total own-source income 175,980 178,542 185,907 188,467 190,699
Net cost of (contribution by) services 714,280 663,854 646,198 627,662 617,720
Revenue from Government 655,162 639,683 624,187 608,654 598,855
Surplus (Deficit) (59,118) (24,171) (22,011) (19,008) (18,865)
Surplus (Deficit) attributable to the Australian Government (59,118) (24,171) (22,011) (19,008) (18,865)
OTHER COMPREHENSIVE INCOME
Changes in asset revaluation reserves - - - - -
Total other comprehensive income (loss) - - - - -
Total comprehensive income (loss) attributable to the Australian Government (59,118) (24,171) (22,011) (19,008) (18,865)

Budget Statements – Department of Health
142
Table 3.1: Comprehensive Income Statement (showing net cost of services for the period ended 30 June) (continued)
Note: Reconciliation of comprehensive income attributable to the entity
2016-17$'000
2017-18$'000
2018-19$'000
2019-20 $'000
2020-21 $'000
Total comprehensive income (loss) attributable to the Australian Government (59,118) (24,171) (22,011) (19,008) (18,865)
plus non-appropriated expenses including depreciation and amortisation expenses 21,349 20,567 22,011 19,008 18,865
Total comprehensive income (loss) attributable to the agency (37,769) (3,604) - - -

Section 3 – Budgeted Financial Statements
143
Fin
an
cia
l S
tate
me
nts
Table 3.2: Budgeted Departmental Balance Sheet (as at 30 June)
2016-17Estimated
actual$'000
2017-18Budget
$'000
2018-19Forward estimate
$'000
2019-20 Forward estimate
$'000
2020-21 Forward estimate
$'000
ASSETS
Financial assets
Cash and cash equivalents 78,630 64,997 69,194 74,201 78,779
Receivables 71,067 70,251 68,570 66,106 64,980
Other 10,565 10,565 10,565 10,565 10,565
Total financial assets 160,262 145,813 148,329 150,872 154,324
Non-financial assets
Land and buildings 49,453 46,245 40,719 35,127 31,725
Property, plant and equipment 5,819 6,034 6,230 6,383 7,308
Intangibles 117,484 120,847 111,033 107,819 102,811
Other 15,283 15,283 15,283 15,283 15,283
Total non-financial assets 188,039 188,409 173,265 164,612 157,127
Total assets 348,301 334,222 321,594 315,484 311,451
LIABILITIES
Payables
Suppliers 41,617 42,596 43,604 44,643 45,713
Other payables 38,168 34,631 31,094 27,616 25,554
Total payables 79,785 77,227 74,698 72,259 71,267
Provisions
Employees 166,805 169,551 172,352 175,210 178,124
Other provisions 28,714 28,446 26,793 23,910 20,862
Total provisions 195,519 197,997 199,145 199,120 198,986
Total liabilities 275,304 275,224 273,843 271,379 270,253
Net assets 72,997 58,998 47,751 44,105 41,198
EQUITY
Contributed equity 252,649 262,821 273,585 288,947 304,905
Reserves 30,436 30,436 30,436 30,436 30,436
Accumulated deficits (210,088) (234,259) (256,270) (275,278) (294,143)
Total equity 72,997 58,998 47,751 44,105 41,198
Table 3.3: Departmental Statement of Changes in Equity – Summary of Movement (Budget year 2017-18)
Retained earnings
$'000
Asset revaluation
reserve$'000
Contributed equity/capital
$'000
Total equity
$'000
Opening balance as at 1 July 2017
Balance carried forward from previous period (210,088) 30,436 252,649 72,997
Surplus (deficit) for the period (24,171) - - (24,171)
Equity injection - appropriations - - 2,366 2,366
Departmental capital budget - - 7,806 7,806
Restructuring - - - -
Estimated closing balance as at 30 June 2018 (234,259) 30,436 262,821 58,998

Budget Statements – Department of Health
144
Table 3.4: Budgeted Departmental Statement of Cash Flows (for the period ended 30 June)
2016-17Estimated
actual$'000
2017-18Budget
$'000
2018-19Forward estimate
$'000
2019-20 Forward estimate
$'000
2020-21 Forward estimate
$'000
OPERATING ACTIVITIES
Cash received
Goods and services 227,997 218,016 222,435 223,965 228,191
Appropriations 688,192 638,786 624,761 610,204 600,274
Interest - - 1,917 1,917 1,917
Net GST received 26,620 24,010 20,570 20,000 20,000
Other cash received - 1,380 1,403 1,428 1,428
Total cash received 942,809 882,192 871,086 857,514 851,810
Cash used
Employees 448,670 431,848 439,891 437,539 531,443
Suppliers 410,452 374,237 352,352 342,971 239,379
Net GST paid 4,347 4,355 - - -
Cash to the Official Public Account 65,147 64,980 64,192 62,000 62,000
Other 8,145 1,905 5,036 5,261 9,110
Total cash used 936,761 877,325 861,471 847,771 841,932
Net cash from (or used by) operating activities 6,048 4,867 9,615 9,743 9,878
INVESTING ACTIVITIES
Cash received
Proceeds from sales of property, plant and equipment - - - - -
Total cash received - - - - -
Cash used
Purchase of property, plant and equipment 34,569 28,672 16,191 20,112 21,258
Total cash used 34,569 28,672 16,191 20,112 21,258
Net cash from (or used by) investing activities (34,569) (28,672) (16,191) (20,112) (21,258)
FINANCING ACTIVITIES
Cash received
Appropriations - contributed equity 16,479 10,172 10,773 15,376 15,958
Total cash received 16,479 10,172 10,773 15,376 15,958
Net cash from (or used by) financing activities 16,479 10,172 10,773 15,376 15,958
Net increase (or decrease) in cash held (12,042) (13,633) 4,197 5,007 4,578
Cash and cash equivalents at the beginning of the reporting period 90,672 78,630 64,997 69,194 74,201
Cash and cash equivalents at the end of the reporting period 78,630 64,997 69,194 74,201 78,779

Section 3 – Budgeted Financial Statements
145
Fin
an
cia
l S
tate
me
nts
Table 3.5: Departmental Capital Budget Statement (for the period ended 30 June)
2016-17Estimated
actual$'000
2017-18Budget
$'000
2018-19Forward estimate
$'000
2019-20 Forward estimate
$'000
2020-21 Forward estimate
$'000
CAPITAL APPROPRIATIONS
Equity injections - Bill 2 6,651 2,366 1,866 1,866 1,866
Capital budget - Bill 1 (DCB) 9,828 7,806 8,898 13,496 14,092
Total capital appropriations 16,479 10,172 10,764 15,362 15,958
Total new capital appropriations represented by:
Purchase of non-financial assets 16,479 10,172 10,764 15,362 15,958
Total items 16,479 10,172 10,764 15,362 15,958
PURCHASE OF NON-FINANCIAL ASSETS
Funded by capital appropriations - equity injection (a) 6,759 5,904 2,166 1,866 1,866
Funded by capital appropriation - DCB (b) 9,828 7,806 8,898 13,496 14,092
Funded internally from departmental resources 17,982 14,962 5,127 4,750 5,300
Funded by finance leases - - - - -
Total acquisitions of non-financial assets 34,569 28,672 16,191 20,112 21,258
RECONCILIATION OF CASH USED TO ACQUIRE ASSETS TO ASSET MOVEMENT TABLE
Total purchases 34,569 28,672 16,191 20,112 21,258
less additions by finance lease - - - - -
Total cash used to acquire assets 34,569 28,672 16,191 20,112 21,258
(a) Includes both current Appropriation Bill No. 2 and prior Act 2/4/6 appropriations. (b) Includes purchases from current and previous years' Departmental Capital Budget (DCB).

Budget Statements – Department of Health
146
Table 3.6: Statement of Asset Movements (Budget year 2017-18)
Buildings
$'000
Other property, plant and
equipment$'000
Intangibles
$'000
Total
$'000
As at 1 July 2017
Gross book value 64,676 10,023 254,980 329,679
Accumulated depreciation/ amortisation and impairment (15,223) (4,204) (137,496) (156,923)
Opening net book balance 49,453 5,819 117,484 172,756
CAPITAL ASSET ADDITIONS
Estimated expenditure on new or replacement assets
By purchase - appropriation equity - - 5,904 5,904
By purchase - appropriation ordinary annual services 2,840 259 4,707 7,806
By purchase - other 700 2,000 12,262 14,962
Total additions 3,540 2,259 22,873 28,672
Other movements
Depreciation/amortisation expense (6,748) (2,044) (19,510) (28,302)
Transfer due to restructuring - - - -
Total other movements (6,748) (2,044) (19,510) (28,302)
As at 30 June 2018
Gross book value 68,216 12,282 277,853 358,351
Accumulated depreciation/ amortisation and impairment (21,971) (6,248) (157,006) (185,225)
Closing net book balance 46,245 6,034 120,847 173,126

Section 3 – Budgeted Financial Statements
147
Fin
an
cia
l S
tate
me
nts
Table 3.7: Schedule of Budgeted Income and Expenses Administered on Behalf of Government (for the period ended 30 June)
2016-17Estimated
actual$'000
2017-18Budget
$'000
2018-19Forward estimate
$'000
2019-20 Forward estimate
$'000
2020-21 Forward estimate
$'000
EXPENSES ADMINISTERED ON BEHALF OF GOVERNMENT
Suppliers 638,656 607,110 585,699 592,681 588,792
Subsidies 12,536,368 12,023,300 12,662,233 13,524,084 14,255,597
Personal benefits 42,072,228 43,975,150 45,825,405 48,146,173 50,038,065
Grants 7,546,559 8,201,849 8,525,917 8,516,287 8,759,269
Depreciation and amortisation 963 - - - -
Write-down and impairment of assets 21,515 29,926 24,661 12,788 2,525
Payments to corporate Commonwealth entities 405,060 560,425 524,606 251,890 252,462
Other expenses 32,234 - - - -
Total expenses administered on behalf of Government 63,253,583 65,397,760 68,148,521 71,043,903 73,896,710
INCOME ADMINISTERED ON BEHALF OF GOVERNMENT
Revenue
Taxation revenue
Other taxes 15,700 16,100 16,400 16,800 17,200
Total taxation revenue 15,700 16,100 16,400 16,800 17,200
Non-taxation revenue
Interest 7,108 8,465 9,563 8,835 7,924
Medical Research Future Fund 60,876 121,565 214,913 386,373 642,886
Recoveries 2,817,897 2,577,235 2,318,183 1,986,139 1,978,462
Total non-taxation revenue 2,885,881 2,707,265 2,542,659 2,381,347 2,629,272
Total own-source revenue administered on behalf of Government 2,901,581 2,723,365 2,559,059 2,398,147 2,646,472
Gains
Other gains - - - - -
Total gains administered on behalf of Government - - - - -
Total revenue administered on behalf of Government 2,901,581 2,723,365 2,559,059 2,398,147 2,646,472

Budget Statements – Department of Health
148
Table 3.8: Schedule of Budgeted Assets and Liabilities Administered on Behalf of Government (as at 30 June)
2016-17Estimated
actual$'000
2017-18Budget
$'000
2018-19Forward estimate
$'000
2019-20 Forward estimate
$'000
2020-21 Forward estimate
$'000
ASSETS ADMINISTERED ON BEHALF OF GOVERNMENT
Financial assets
Cash and cash equivalents 171,578 171,578 171,578 171,578 171,578
Receivables 1,606,337 1,475,440 1,459,841 1,389,764 1,282,192
Investments 684,107 714,050 751,592 751,592 751,592
Total financial assets 2,462,022 2,361,068 2,383,011 2,312,934 2,205,362
Non-financial assets
Inventories 115,287 110,361 110,700 122,912 120,387
Total non-financial assets 115,287 110,361 110,700 122,912 120,387
Total assets administered on behalf of Government 2,577,309 2,471,429 2,493,711 2,435,846 2,325,749
LIABILITIES ADMINISTERED ON BEHALF OF GOVERNMENT
Payables
Suppliers 9,762 9,685 9,685 9,685 9,685
Subsidies 13,726 13,726 13,726 13,726 13,726
Personal benefits payable 1,354,086 1,358,912 1,399,285 1,437,803 1,464,589
Grants 349,453 346,689 346,819 346,687 346,701
Total payables 1,727,027 1,729,012 1,769,515 1,807,901 1,834,701
Provisions
Personal Benefits 1,280,045 1,280,045 1,280,045 1,280,045 1,280,045
Subsidies 441,765 464,268 470,254 478,975 491,038
Total payables 1,721,810 1,744,313 1,750,299 1,759,020 1,771,083
Total liabilities administered on behalf of Government 3,448,837 3,473,325 3,519,814 3,566,921 3,605,784

Section 3 – Budgeted Financial Statements
149
Fin
an
cia
l S
tate
me
nts
Table 3.9: Schedule of Budgeted Administered Cash Flows (for the period ended 30 June)
2016-17Estimated
actual$'000
2017-18Budget
$'000
2018-19Forward estimate
$'000
2019-20 Forward estimate
$'000
2020-21 Forward estimate
$'000
OPERATING ACTIVITIES
Cash received
Interest 7,108 8,465 9,563 8,835 7,924
Taxes 15,700 16,100 16,400 16,800 17,200
GST received 485,529 489,514 501,335 494,536 507,578
Medical Research Future Fund 60,876 121,565 214,913 386,373 642,886
Recoveries 2,613,439 2,704,542 2,316,469 2,023,134 2,053,705
Total cash received 3,182,652 3,340,186 3,058,680 2,929,678 3,229,293
Cash used
Grants 7,568,974 8,196,464 8,519,334 8,514,472 8,759,255
Subsidies 12,522,256 11,994,839 12,654,442 13,517,401 14,243,534
Personal benefits 41,852,537 43,971,377 45,785,080 48,107,403 50,011,274
Suppliers 664,321 632,187 610,699 617,681 588,792 Payments to corporate entities 405,060 560,425 524,606 251,890 252,462
GST paid 485,529 489,514 501,335 494,536 507,578
Total cash used 63,498,677 65,844,806 68,595,496 71,503,383 74,362,895
Net cash from (or used by) operating activities (60,316,025) (62,504,620) (65,536,816) (68,573,705) (71,133,602)
INVESTING ACTIVITIES
Cash received
Repayment of advances 18,953 26,318 29,116 33,082 32,329
Total cash used 18,953 26,318 29,116 33,082 32,329
Cash used
Advances made 67,040 34,200 17,960 - -
Purchase of investment 250,000 - - - -
Total cash used 317,040 34,200 17,960 - -
Net cash from (or used by) investing activities (298,087) (7,882) 11,156 33,082 32,329
Net increase (or decrease) in cash held (60,614,112) (62,512,502) (65,525,660) (68,540,623) (71,101,273)
Cash at beginning of reporting period 171,578 171,578 171,578 171,578 171,578
Cash from Official Public Account for:
- appropriations 63,118,368 65,242,520 67,871,801 70,597,067 73,212,024
- capital injections 150,537 25,000 25,000 25,000 -
- GST appropriations 485,529 489,514 501,335 494,536 507,578
Cash to the Official Public Account
- return of GST (485,529) (489,514) (501,335) (494,536) (507,578)
- other (2,654,793) (2,755,018) (2,371,141) (2,081,444) (2,110,751)
Cash at end of reporting period 171,578 171,578 171,578 171,578 171,578
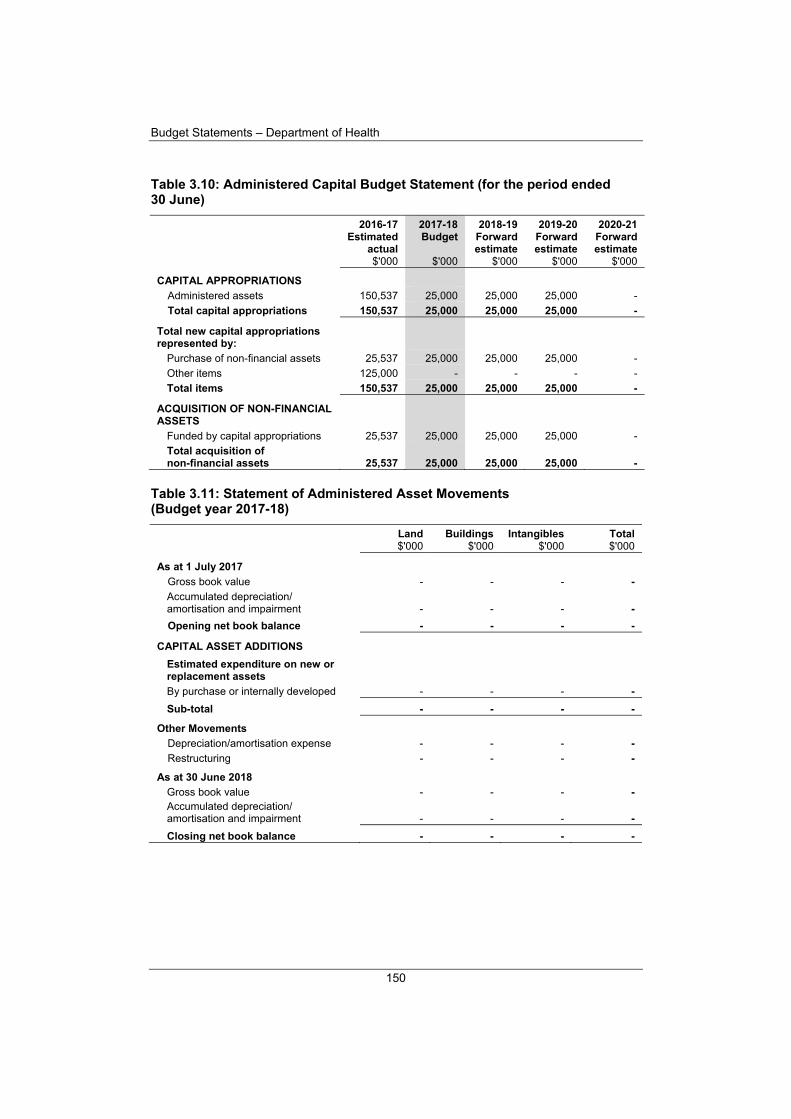
Budget Statements – Department of Health
150
Table 3.10: Administered Capital Budget Statement (for the period ended 30 June)
2016-17Estimated
actual$'000
2017-18Budget
$'000
2018-19Forward estimate
$'000
2019-20 Forward estimate
$'000
2020-21 Forward estimate
$'000
CAPITAL APPROPRIATIONS
Administered assets 150,537 25,000 25,000 25,000 -
Total capital appropriations 150,537 25,000 25,000 25,000 -
Total new capital appropriations represented by:
Purchase of non-financial assets 25,537 25,000 25,000 25,000 -
Other items 125,000 - - - -
Total items 150,537 25,000 25,000 25,000 -
ACQUISITION OF NON-FINANCIAL ASSETS
Funded by capital appropriations 25,537 25,000 25,000 25,000 -
Total acquisition of non-financial assets 25,537 25,000 25,000 25,000 -
Table 3.11: Statement of Administered Asset Movements (Budget year 2017-18)
Land$'000
Buildings$'000
Intangibles $'000
Total $'000
As at 1 July 2017
Gross book value - - - -
Accumulated depreciation/ amortisation and impairment - - - -
Opening net book balance - - - -
CAPITAL ASSET ADDITIONS
Estimated expenditure on new or replacement assets
By purchase or internally developed - - - -
Sub-total - - - -
Other Movements
Depreciation/amortisation expense - - - -
Restructuring - - - -
As at 30 June 2018
Gross book value - - - - Accumulated depreciation/ amortisation and impairment - - - -
Closing net book balance - - - -

151
Qu
ali
ty
Ag
en
cy
AUSTRALIAN AGED CARE
QUALITY AGENCY
Entity Resources and Planned Performance

152

153
Qu
ali
ty
Ag
en
cy
AUSTRALIAN AGED CARE QUALITY AGENCY
Section 1: Entity Overview and Resources ...................................................... 154
1.1 Strategic Direction Statement ................................................................... 154
1.2 Entity Resource Statement ....................................................................... 155
1.3 Budget Measures ...................................................................................... 156
Section 2: Outcomes and Planned Performance ............................................. 157
2.1 Budgeted Expenses and Performance ..................................................... 157
Section 3: Budgeted Financial Statements ...................................................... 161
3.1 Budgeted Financial Statements ................................................................ 161
3.2 Budgeted Financial Statements Tables .................................................... 162

Quality Agency – Entity Budget Statements – Entity Overview and Resources
154
Section 1: Entity Overview and Resources
1.1 STRATEGIC DIRECTION STATEMENT1
The Australian Aged Care Quality Agency (Quality Agency) is a statutory agency authorised by the Australian Aged Care Quality Agency Act 2013.
The Quality Agency is responsible for holding providers to account for the quality of care and services against the applicable standards to ensure high quality care for people accessing Australian Government subsidised aged care.
In accordance with the applicable standards and the Quality Agency Principles 2013, the Quality Agency accredits residential aged care services2 and quality reviews aged care services provided in the home and community.3 The Quality Agency is supporting the Government’s aged care reform through the development of guidance and sector support for transition and implementation of the new aged care standards under a single quality framework for aged care.
From July 2017, the Quality Agency will publish a new consumer interview report to provide information on how, in each residential aged care facility, residents and their representatives experience the quality of care.
The Quality Agency monitors compliance of service providers against the standards and applies a case management model based on relevant information and compliance history. The Quality Agency is enhancing its regulatory intelligence and risk-based approaches to monitoring compliance.
The Quality Agency provides feedback to the provider on areas for improvement to ensure that standards are complied with, and the timetable for making these improvements. The Quality Agency also advises the Secretary of the Department of Health about aged care services that do not meet the standards. The Quality Agency is implementing full cost recovery arrangements for its accreditation services.
The Quality Agency provides information, education and training, and feedback to aged care providers on performance, and publishes performance information to support older people in their choice of aged care service. In addition, the Quality Agency promotes public confidence in accreditation and the quality review systems for aged care through consistent and meaningful assessments and reporting of compliance with the standards.
The Quality Agency is a Non-corporate Commonwealth Entity under the Public Governance, Performance and Accountability Act 2013 (PGPA Act). The functions of the Quality Agency are set out in the Australian Aged Care Quality Agency Act 2013 (the Quality Agency Act) and the Aged Care Act 1997.
1 For more information about the strategic direction of the Quality Agency, refer to the current corporate
plan, available at: www.aacqa.gov.au/publications/publications#corporate 2 Residential aged care is regulated by the Australian Government, which provides subsidies to accredited
approved providers for the care and services they provide. 3 ‘Aged care services provided in the home and community’ includes Home Care, Commonwealth Home
Support and National Aboriginal and Torres Strait Islander Flexible Aged Care Program services.

Quality Agency – Entity Budget Statements – Entity Overview and Resources
155
Qu
ali
ty
Ag
en
cy
1.2 ENTITY RESOURCE STATEMENT
Table 1.1 shows the total funding from all sources available to the entity for its operations and to deliver programs and services on behalf of the Government.
The table summarises how resources will be applied by outcome (Government strategic policy objectives) and by administered (on behalf of the Government or the public) and departmental (for the entity’s operations) classification.
For more detailed information on special accounts and special appropriations, please refer to Budget Paper No. 4 – Agency Resourcing.
Information in this table is presented on a resourcing (i.e. appropriations/cash available) basis, whilst the ‘Budgeted expenses by outcome’ tables in Section 2 and the financial statements in Section 3 are presented on an accrual basis.
Table 1.1: Quality Agency Resource Statement – Budget Estimates for 2017-18 as at Budget May 2017
2016-17Estimated
actual$'000
2017-18 Estimate
$'000
DEPARTMENTAL
Prior year appropriation available 2,651 21,909
Annual appropriations
Ordinary annual services (a)
Departmental appropriation 28,317 27,285
s74 retained revenue receipts (b) 6,580 22,457
Departmental capital budget (c) 1,195 1,173
Other services (d)
Equity injection 18,496 -
Total departmental annual appropriations 54,588 50,915
Total departmental resourcing 57,239 72,824
Total resourcing for the Quality Agency 57,239 72,824
2016-17 2017-18
Average staffing level (number) 214 255
All figures are GST exclusive. (a) Appropriation Bill (No. 1) 2017-18. (b) Estimated retained revenue receipts under section 74 of the PGPA Act 2013. (c) Departmental Capital Budgets are not separately identified in Appropriation Bill (No. 1) and form part of
ordinary annual services items. Refer to Table 3.5 for further details. For accounting purposes, this amount has been designated as a 'contribution by owner'.
(d) Appropriation Bill (No. 2) 2017-18.

Quality Agency – Entity Budget Statements – Entity Overview and Resources
156
1.3 BUDGET MEASURES
Budget measures in Part 1 relating to the Quality Agency are detailed in Budget Paper No. 2 and are summarised below.
Table 1.2: Quality Agency 2017-18 Budget Measures
Program 2016-17 $'000
2017-18 $'000
2018-19 $'000
2019-20 $'000
2020-21 $'000
National Disability Insurance Scheme – finalisation of transition arrangements(a)
Australian Aged Care Quality Agency
Departmental expenses 1.1 - - 205 205 207
Total expenses - - 205 205 207
(a) The Quality Agency is not the lead entity for this measure. Only Quality Agency impacts are shown in this table.

Quality Agency – Entity Budget Statements – Outcomes and Planned Performance
157
Qu
ali
ty
Ag
en
cy
Section 2: Outcomes and Planned Performance
Government outcomes are the intended results, impacts or consequences of actions by the Government on the Australian community. Commonwealth programs are the primary vehicle by which Government entities achieve the intended results of their outcome statements. Entities are required to identify the programs which contribute to Government outcomes over the Budget and forward years.
Each outcome is described below together with its related programs. The following provides detailed information on expenses for each outcome and program, further broken down by funding source.
Note:
Performance reporting requirements in the Portfolio Budget Statements are part of the Enhanced Commonwealth Performance Framework established by the Public Governance, Performance and Accountability Act 2013. It is anticipated that the performance criteria described in Portfolio Budget Statements will be read with broader information provided in an entity’s corporate plans and annual performance statements – included in Annual Reports – to provide an entity’s complete performance story.
The Quality Agency’s most recent corporate plan is available at: www.aacqa.gov.au/about-us/corporate-publications
The Quality Agency’s most recent annual performance statement is available at: www.aacqa.gov.au/about-us/annual-reports
2.1 BUDGETED EXPENSES AND PERFORMANCE
Outcome 1
High-quality care for persons receiving Australian Government subsidised aged care through the accreditation of aged care services in residential settings, the quality review of aged care services provided in the community and the provision of quality information to consumers, as well as the provision of information, education and training to aged care providers
Program Contributing to Outcome 1
Program 1.1: Quality Assessment, Compliance Monitoring and Promotion of High Quality Care in Australian Government Subsidised Aged Care Services
Linked Programs
Other Commonwealth entities that contribute to Outcome 1
Department of Health Program 6.4: Aged Care Quality The Department of Health has policy responsibility for ageing and aged care, including the regulatory framework and regulatory action taken to address non-compliance.

Quality Agency – Entity Budget Statements – Outcomes and Planned Performance
158
Budgeted Expenses for the Quality Agency
Table 2.1.1 shows how much the entity intends to spend (on an accrual basis) on achieving the outcome, broken down by program, as well as by administered and departmental funding sources.
Table 2.1.1: Budgeted Expenses for the Quality Agency
2016-17 Estimated
actual$'000
2017-18 Budget
$'000
2018-19 Forward
Year 1$'000
2019-20 Forward
Year 2 $'000
2020-21 Forward
Year 3 $'000
Program 1.1: Quality Assessment, Compliance Monitoring and Promotion of High Quality Care in Australian Government Subsidised Aged Care Services
Departmental expenses
Departmental appropriation (a) 35,210 45,857 39,903 37,246 48,695
Expenses not requiring appropriation 1,370 1,625 1,775 1,525 in the Budget year (b) 1,196
Operating deficit (surplus) - - - - -
Total for Program 1.1 36,406 47,227 41,528 39,021 50,220
Total expenses for Outcome 1 36,406 47,227 41,528 39,021 50,220
2016-17 2017-18
Average staffing level (number) 214 255
(a) Departmental appropriation combines 'Ordinary annual services (Appropriation Bill No. 1)' and 'Revenue from independent sources (s74)'.
(b) Expenses not requiring appropriation in the Budget year are made up of depreciation expense, amortisation expense, makegood expense and audit fees.

Quality Agency – Entity Budget Statements – Outcomes and Planned Performance
159
Qu
ali
ty
Ag
en
cy
Planned Performance for the Quality Agency
Table 2.1.2 below details the performance criteria for the program associated with Outcome 1.4 It also summarises how the program is delivered and where 2017-18 Budget measures have materially changed the program.
Table 2.1.2: Performance Criteria for the Quality Agency
Purpose
The Quality Agency is responsible for holding aged care service providers accountable for their performance against the Accreditation Standards for residential aged care, Home Care Standards for Home Care services, National Aboriginal and Torres Strait Islander Flexible Aged Care Services and also promoting high quality care and service provider performance through education, training and compliance assistance.
Outcome 1
High-quality care for persons receiving Australian Government subsidised aged care through the accreditation of aged care services in residential settings, the quality review of aged care services provided in the community and the provision of quality information to consumers, as well as the provision of information, education and training to aged care providers
Program 1.1: Quality Assessment, Compliance Monitoring and Promotion of High Quality Care in Australian Government Subsidised Aged Care Services
The Quality Agency contributes to high quality aged care through the residential aged care accreditation and quality review of Australian Government subsidised aged care services. The Quality Agency monitors compliance with the relevant standards to ensure care recipients receive a high standard of care. The Quality Agency promotes high quality care and service provider performance through education, training and compliance assistance.
Delivery
A. Ensuring high quality care for persons receiving Australian Government subsidised aged care through the efficient and effective delivery of services under the Australian Aged Care Quality Agency Act 2013 and in accordance with the Quality Agency Principles 2013
Accredit residential aged care services.
Quality review aged care services provided in the home and community.
Monitor compliance with the applicable standards.
Promote high quality care and innovation through sector engagement, information and training.
Publish performance information on the quality of care and services.
Maintain a register of Quality Assessors.
4 Progress against the performance criteria published in the 2016-17 Portfolio Budget Statements will be
reported in the 2016-17 Quality Agency Annual Report.

Quality Agency – Entity Budget Statements – Outcomes and Planned Performance
160
Performance criteria
A. Ensuring high quality care for persons receiving Australian Government subsidised aged care through the efficient and effective delivery of services under the Australian Aged Care Quality Agency Act 2013 and in accordance with the Quality Agency Principles 2013
Percentage of service providers who maintain compliance with the standards for the twelve months following a time table for improvement decision.
2016-17 Estimated result
2017-18 Target
2018-19 Target
2019-20 Target
2020-21 Target
83% ≥85% ≥87% ≥87% ≥87%
Percentage of applications for re-accreditation completed within the statutory timeframes.
2016-17 Estimated result
2017-18 Target
2018-19 Target
2019-20 Target
2020-21 Target
≥98% ≥92% ≥95% ≥95% ≥95%
Percentage of services providing care in the home and community receiving a quality review within the legislated timeframes.
2016-17 Estimated result
2017-18 Target
2018-19 Target
2019-20 Target
2020-21 Target
≥85% ≥90% ≥92% ≥92% ≥92%
Percentage of service providers who are satisfied with Quality Agency information, engagement and education.
2016-17 Estimated result
2017-18 Target
2018-19 Target
2019-20 Target
2020-21 Target
≥85% ≥80% ≥80% ≥92% ≥92%
Material changes to Program 1.1 resulting from the following measures: There are no material changes to Program 1.1 resulting from measures.

Quality Agency – Entity Budget Statements – Budgeted Financial Statements
161
Qu
ali
ty
Ag
en
cy
Section 3: Budgeted Financial Statements
Section 3 presents budgeted financial statements which provide a comprehensive snapshot of entity finances for the 2017-18 Budget year, including the impact of Budget measures and resourcing on financial statements.
3.1 BUDGETED FINANCIAL STATEMENTS
3.1.1 Differences Between Entity Resourcing and Financial Statements
This section is not applicable to the Quality Agency.
3.1.2 Explanatory Notes and Analysis of Budgeted Financial Statements
Departmental Resources
Income and Expenses
The Quality Agency is budgeting for a break even position in 2017-18 and the forward years after adjusting for depreciation and amortisation expenses.
Total own-source revenue for 2017-18 is expected to be $18.6 million. Revenue from Government is expected to be $27.3 million.
Total expenses for 2017-18 are expected to be $47.2 million including $1.3 million of depreciation and amortisation, compared to $36.4 million for 2016-17.
Balance Sheet
The Quality Agency has a budgeted net asset position of $18.3 million in 2017-18.
Total assets for 2017-18 are estimated to be $31.8 million, comprising $26.0 million of financial assets and $5.8 million in non-financial assets.
Total liabilities for 2017-18 are estimated to be $13.5 million made up of accrued employee entitlements $7.4 million, suppliers payables $0.5 million, other payables $5.3 million and other provisions of $0.3 million.

Quality Agency – Entity Budget Statements – Budgeted Financial Statements
162
3.2 BUDGETED FINANCIAL STATEMENTS TABLES
Table 3.1: Comprehensive Income Statement (showing net cost of services for the period ended 30 June)
2016-17Estimated
actual$'000
2017-18Budget
$'000
2018-19Forward estimate
$'000
2019-20 Forward estimate
$'000
2020-21 Forward estimate
$'000
EXPENSES
Employee benefits 24,747 34,862 29,072 26,257 36,377
Supplier expenses 10,463 10,979 10,815 10,973 12,302
Depreciation and amortisation 1,196 1,370 1,625 1,775 1,525
Other expenses - 16 16 16 16
Total expenses 36,406 47,227 41,528 39,021 50,220
LESS:
OWN-SOURCE INCOME
Revenue
Sale of goods and rendering of services 6,893 18,572 21,576 18,885 30,242
Other revenue - - - - -
Total revenue 6,893 18,572 21,576 18,885 30,242 Gains
Other - - - - -
Total gains - - - - -
Total own-source income 6,893 18,572 21,576 18,885 30,242
Net cost of (contribution by) services 29,513 28,655 19,952 20,136 19,978
Revenue from Government 28,317 27,285 18,327 18,361 18,453
Surplus (Deficit) (1,196) (1,370) (1,625) (1,775) (1,525)
Surplus (Deficit) attributable to the Australian Government (1,196) (1,370) (1,625) (1,775) (1,525)
OTHER COMPREHENSIVE INCOME
Changes in asset revaluation reserves - - - - -
Total other comprehensive income (loss) - - - - -
Total comprehensive income (loss) attributable to the Australian Government (1,196) (1,370) (1,625) (1,775) (1,525)
Note: Reconciliation of comprehensive income attributable to the agency
2016-17 $'000
2017-18 $'000
2018-19 $'000
2019-20 $'000
2020-21 $'000
Total comprehensive income (loss) attributable to the Australian Government (1,196) (1,370) (1,625) (1,775) (1,525)
plus non-appropriated expenses depreciation and amortisation expenses 1,196 1,370 1,625 1,775 1,525
Total comprehensive income (loss) attributable to the agency - - - - -

Quality Agency – Entity Budget Statements – Budgeted Financial Statements
163
Qu
ali
ty
Ag
en
cy
Table 3.2: Budgeted Departmental Balance Sheet (as at 30 June)
2016-17Estimated
actual$'000
2017-18Budget
$'000
2018-19Forward estimate
$'000
2019-20 Forward estimate
$'000
2020-21 Forward estimate
$'000
ASSETS
Financial assets
Cash and cash equivalents 2,275 603 689 523 545
Receivables 23,997 25,412 19,561 19,527 23,276
Other financial assets - - - - -
Total financial assets 26,272 26,015 20,250 20,050 23,821
Non-financial assets
Land and buildings - - - - -
Property, plant and equipment 1,428 3,136 3,942 4,402 5,017
Intangibles 681 2,003 3,126 3,760 4,549
Inventories - - - - -
Other 630 685 685 635 710
Total non-financial assets 2,739 5,824 7,753 8,797 10,276
Total assets 29,011 31,839 28,003 28,847 34,097
LIABILITIES
Payables
Suppliers 812 514 933 946 1,716
Other payables 1,867 5,294 761 1,406 5,214
Total payables 2,679 5,808 1,694 2,352 6,930
Provisions
Employees 6,670 7,404 8,129 8,911 9,878
Other provisions 280 311 327 343 359
Total provisions 6,950 7,715 8,456 9,254 10,237
Total liabilities 9,629 13,523 10,150 11,606 17,167
Net assets 19,382 18,316 17,853 17,241 16,930
EQUITY
Contributed equity 18,084 19,281 20,443 21,606 22,820
Reserves - - - - -
Retained surpluses (accumulated deficits) 1,298 (965) (2,590) (4,365) (5,890)
Total equity 19,382 18,316 17,853 17,241 16,930
Table 3.3: Departmental Statement of Changes in Equity – Summary of Movement (Budget year 2017-18)
Retained earnings
$'000
Asset revaluation
reserve $'000
Contributed equity/capital
$'000
Total equity
$'000
Opening balance as at 1 July 2017
Balance carried forward from previous period 405 - 18,108 18,513
Surplus (deficit) for the period (1,370) - - (1,370)
Capital budget - Bill 1 (DCB) - - 1,173 1,173
Estimated closing balance as at 30 June 2018 (965) - 19,281 18,316
DCB = Departmental Capital Budget.

Quality Agency – Entity Budget Statements – Budgeted Financial Statements
164
Table 3.4: Budgeted Departmental Statement of Cash Flows (for the period ended 30 June)
2016-17Estimated
actual$'000
2017-18Budget
$'000
2018-19Forward estimate
$'000
2019-20 Forward estimate
$'000
2020-21 Forward estimate
$'000
OPERATING ACTIVITIES
Cash received
Appropriations 27,179 21,586 22,205 16,705 13,707
Goods and services 6,580 22,457 17,181 19,673 34,197
Net GST received - 1,014 994 987 1,121
Other cash received - - - - -
Total cash received 33,759 45,057 40,380 37,365 49,025
Cash used
Employees 24,747 33,509 27,842 25,039 34,799
Suppliers 9,325 13,220 12,452 12,492 14,204
Net GST paid - - - - -
Other cash used - - - - -
Total cash used 34,072 46,729 40,294 37,531 49,003
Net cash from (or used by) operating activities (313) (1,672) 86 (166) 22
INVESTING ACTIVITIES
Cash used Purchase of property, plant and equipment 1,258 3,164 1,699 1,707 1,714
Total cash used 1,258 3,164 1,699 1,707 1,714
Net cash from (or used by) investing activities (1,258) (3,164) (1,699) (1,707) (1,714)
FINANCING ACTIVITIES
Cash received
Appropriations - contributed equity 1,195 3,164 1,699 1,707 1,714
Total cash received 1,195 3,164 1,699 1,707 1,714
Cash used
Other financing activity (a) 18,496 - - - -
Total cash used 18,496 - - - -
Net cash from (or used by) financing activities (17,301) 3,164 1,699 1,707 1,714
Net increase (or decrease) in cash held (18,872) (1,672) 86 (166) 22
Cash and cash equivalents at the beginning of the reporting period 21,147 2,275 603 689 523
Cash and cash equivalents at the end of the reporting period 2,275 603 689 523 545
(a) Amount returned to the Official Public Account. This amount was re-appropriated through Appropriation Act (No. 4) 2016-17.

Quality Agency – Entity Budget Statements – Budgeted Financial Statements
165
Qu
ali
ty
Ag
en
cy
Table 3.5: Departmental Capital Budget Statement (for the period ended 30 June)
2016-17Estimated
actual$'000
2017-18Budget
$'000
2018-19Forward estimate
$'000
2019-20 Forward estimate
$'000
2020-21 Forward estimate
$'000
CAPITAL APPROPRIATIONS
Capital budget - Bill 1 (DCB) 1,195 1,173 1,162 1,163 1,214
Equity injections - Bill 2 18,496 - - - -
Total capital appropriations 19,691 1,173 1,162 1,163 1,214
Total new capital appropriations represented by:
Purchase of non-financial assets 1,195 1,173 1,162 1,163 1,214
Other items 18,496 - - - -
Total items 19,691 1,173 1,162 1,163 1,214
PURCHASE OF NON-FINANCIAL ASSETS
Funded by capital appropriations - equity injection (a) - - - - -
Funded by capital appropriation - DCB (b) 1,195 1,173 1,162 1,163 1,214
Funded internally from departmental resources 63 1,991 537 544 500
Total acquisitions of non-financial assets 1,258 3,164 1,699 1,707 1,714
RECONCILIATION OF CASH USED TO ACQUIRE ASSETS TO ASSET MOVEMENT TABLE
Total purchases 1,258 3,164 1,699 1,707 1,714
Total cash used to acquire assets 1,258 3,164 1,699 1,707 1,714
(a) Includes both current Bill 2, prior Act 2/4/6 appropriations and special capital appropriations. (b) Does not include annual finance lease costs. Includes purchases from current and previous years'
Departmental Capital Budgets (DCB).

Quality Agency – Entity Budget Statements – Budgeted Financial Statements
166
Table 3.6: Statement of Asset Movements (Budget year 2017-18)
Buildings
$'000
Other property, plant and
equipment $'000
Intangibles
$'000
Total
$'000
As at 1 July 2017
Gross book value - 4,202 4,590 8,792
Accumulated depreciation amortisation and impairment - (2,774) (3,909) (6,683)
Opening net book balance - 1,428 681 2,109
CAPITAL ASSET ADDITIONS
Estimated expenditure on new or replacement assets
By purchase - internally funded - 1,991 - 1,991
By purchase - appropriation ordinary annual services - 206 967 1,173
Total additions - 2,197 967 3,164
Other movements
Depreciation/amortisation expense - (925) (445) (1,370)
Other movements - 436 800 1,236
Total other movements - (489) 355 (134)
As at 30 June 2018
Gross book value - 6,399 5,557 11,956
Accumulated depreciation/ amortisation and impairment - (3,263) (3,554) (6,817)
Closing net book balance - 3,136 2,003 5,139

167
AC
SQ
HC
AUSTRALIAN COMMISSION ON
SAFETY AND QUALITY IN HEALTH
CARE
Entity Resources and Planned Performance

168

169
AC
SQ
HC
AUSTRALIAN COMMISSION ON
SAFETY AND QUALITY IN HEALTH
CARE
Section 1: Entity Overview and Resources ...................................................... 170
1.1 Strategic Direction Statement ................................................................... 170
1.2 Entity Resource Statement ....................................................................... 172
1.3 Budget Measures ...................................................................................... 173
Section 2: Outcomes and Planned Performance ............................................. 174
2.1 Budgeted Expenses and Performance ..................................................... 174
Section 3: Budgeted Financial Statements ...................................................... 179
3.1 Budgeted Financial Statements ................................................................ 179
3.2 Budgeted Financial Statements Tables .................................................... 180

ACSQHC – Entity Budget Statements – Entity Overview and Resources
170
Section 1: Entity Overview and Resources
1.1 STRATEGIC DIRECTION STATEMENT1
The Australian Government aims to improve the long-term capacity and the quality and safety of Australia’s health care system. This will be achieved in part through the work of the Australian Commission on Safety and Quality in Health Care (ACSQHC).
Lapses in safety and quality of health care have enormous costs, both in terms of the impact on people’s lives and financially: health care associated injury and ill health adds to the cost of health care provision.2,3,4 Underuse and/or overuse of health care services identified through observed variation in practice raises questions about the overall productivity, safety and quality of health care delivery.
The ACSQHC was established by the Council of Australian Governments’ to lead and coordinate national improvements in safety and quality in health care based on best available evidence. This includes providing strategic advice to Health Ministers on best practice to drive safety and quality improvements. The ACSQHC works in partnership with patients, consumers, clinicians, managers, policy makers and health care organisations to achieve a sustainable, safe and high-quality health system.
The ACSQHC has four priority areas of work. The aims of these priority areas are:
Patient safety: to have a safe health system that is designed to ensure that patients and consumers are kept safe from preventable harm.
Partnering with patients, consumers and committees: to have a health system where patients, consumers and members of the community participate with health professionals as partners in all aspects of health care.
Quality, cost and value: to have a health system that provides the right care, minimises waste and optimises value and productivity.
Supporting health professionals to provide safe and high-quality care: to have a health system that supports safe clinical practice by having robust and sustainable improvement systems.
1 For more information about the strategic direction of the ACSQHC, refer to the current corporate plan,
available at: www.safetyandquality.gov.au/about-us/corporate-plan/ 2 Health Policy Analysis 2013, Analysis of hospital-acquired diagnosis and their effect on case complexity
and resource use – Final report, ACSQHC, Sydney. 3 Trantino K M, Swain S G, Burrows S A, Sprivulis P C, Daly F F S 2013, ‘Measuring the incidence of
hospital acquired complications and their effect on length of stay using CHADx’, Medical Journal of Australia, Vol. 199, No.8, pp.543-547.
4 Ehsani J P, Jackson T, Duckett S J 2006, ‘The incidence and cost of adverse events in Victorian Hospitals 2003-2004’, Medical Journal of Australia, Vol. 184, No. 11, pp. 551-555.

ACSQHC – Entity Budget Statements – Entity Overview and Resources
171
AC
SQ
HC
During 2017-18, the ACSQHC will continue to focus its efforts on improvements in safety and quality that can be advanced through national action. This will include a strong focus on the piloting and implementation of Version 2 of the National Safety and Quality Health Service (NSQHS) Standards. It will also include continued examination of variation in health care and opportunities to advance patient outcomes by highlighting unwarranted variation and improving the quality, value and appropriateness of care.
The National Health Reform Act 2011 specifies the roles and responsibilities of the ACSQHC. The ACSQHC is a Corporate Commonwealth Entity under the Public Governance, Performance and Accountability Act 2013.

ACSQHC – Entity Budget Statements – Entity Overview and Resources
172
1.2 ENTITY RESOURCE STATEMENT
Table 1.1 shows the total funding from all sources available to the entity for its operations and to deliver programs and services on behalf of the Government.
The table summarises how resources will be applied by outcome (Government strategic policy objectives) and by administered (on behalf of the Government or the public) and departmental (for the entity’s operations) classification.
For more detailed information on special accounts and special appropriations, please refer to Budget Paper No. 4 – Agency Resourcing.
Information in this table is presented on a resourcing (i.e. appropriations/cash available) basis, whilst the ‘Budgeted expenses by outcome’ tables in Section 2 and the financial statements in Section 3 are presented on an accrual basis.
Table 1.1: ACSQHC Resource Statement – Budget Estimates for 2017-18 as at Budget May 2017
2016-17Estimated
actual$'000
2017-18 Estimate
$'000
Opening balance/cash reserves at 1 July 10,851 8,851
Funds from Government
Annual appropriations
Ordinary annual services (a)
Outcome 1 - -
Other services (b)
Equity injection - -
Total annual appropriations - -
Amounts received from related entities (c)
Amounts from the Portfolio Department 14,422 11,176
Amounts from other entities 3,300 2,493
Total amounts received from related entities 17,722 13,669
Total funds from Government 17,722 13,669
Funds from other sources
Goods and services - -
State Government contributions 7,406 7,628
Interest 200 200
Total funds from other sources 7,606 7,828
Total net resourcing for the ACSQHC 36,179 30,348
2016-17 2017-18
Average staffing level (number) 86 86
All figures are GST exclusive. (a) Appropriation Bill (No. 1) 2017-18. (b) Appropriation Bill (No. 2) 2017-18. (c) Funding provided by a Government entity that is not specified within the annual appropriation bills as a
payment to the corporate entity.

ACSQHC – Entity Budget Statements – Entity Overview and Resources
173
AC
SQ
HC
1.3 BUDGET MEASURES
This section is not applicable to the ACSQHC.

ACSQHC – Entity Budget Statements – Outcomes and Planned Performance
174
Section 2: Outcomes and Planned Performance
Government outcomes are the intended results, impacts or consequences of actions by the Government on the Australian community. Commonwealth programs are the primary vehicle by which Government entities achieve the intended results of their outcome statements. Entities are required to identify the programs which contribute to Government outcomes over the Budget and forward years.
Each outcome is described below together with its related programs. The following provides detailed information on expenses for each outcome and program, further broken down by funding source.
Note:
Performance reporting requirements in the Portfolio Budget Statements are part of the Enhanced Commonwealth Performance Framework established by the Public Governance, Performance and Accountability Act 2013. It is anticipated that the performance criteria described in Portfolio Budget Statements will be read with broader information provided in an entity’s corporate plans and annual performance statements – included in Annual Reports – to provide an entity’s complete performance story.
The ACSQHC’s most recent corporate plan is available at: www.safetyandquality.gov.au/about-us/corporate-plan
The ACSQHC’s most recent annual performance statement is available at: www.safetyandquality.gov.au/publications-resources/annual-reports
2.1 BUDGETED EXPENSES AND PERFORMANCE
Outcome 1
Improved safety and quality in health care across the health system, including through the development, support for implementation, and monitoring of national clinical safety and quality guidelines and standards
Program Contributing to Outcome 1
Program 1.1: Safety and Quality in Health Care

ACSQHC – Entity Budget Statements – Outcomes and Planned Performance
175
AC
SQ
HC
Linked Programs
Other Commonwealth entities that contribute to Outcome 1
Department of Health Program 1.1: Health Policy Research and Analysis The Department of Health has policy responsibility for the improvement of the long-term capacity, quality and safety of Australia’s health care system.
Independent Hospital Pricing Authority Program 1.1: Public Health Pricing Determinations The Independent Hospital Pricing Authority works with the ACSQHC to ensure that pricing and performance measures for public hospitals are complementary and facilitate a strong national framework for the delivery of public hospital services.
National Blood Authority Program 1.1: National Blood Agreement Management The National Blood Authority works closely with the ACSQHC in relation to the National Safety and Quality Health Service Standard 7: Blood and Blood Products.
Budgeted Expenses for the ACSQHC
Table 2.1.1 shows how much the entity intends to spend (on an accrual basis) on achieving the outcome, broken down by program, as well as by administered and departmental funding sources.
Table 2.1.1: Budgeted Expenses for the ACSQHC
2016-17 Estimated
actual$'000
2017-18 Budget
$'000
2018-19 Forward
Year 1$'000
2019-20 Forward
Year 2 $'000
2020-21 Forward
Year 3 $'000
Program 1.1: Safety and Quality in Health Care
Revenue from Government Amounts from the Portfolio Department 19,321 11,326 11,578 11,803 11,988 Amounts from other Government entities 3,436 2,493 - - -
Revenues from independent sources 7,971 7,828 8,057 8,293 8,536
Operating deficit (surplus) - - - - -
Total for Program 1.1 30,728 21,647 19,635 20,096 20,524
Total expenses for Outcome 1 30,728 21,647 19,635 20,096 20,524
2016-17 2017-18
Average staffing level (number) 86 86

ACSQHC – Entity Budget Statements – Outcomes and Planned Performance
176
Planned Performance for the ACSQHC
Table 2.1.2 below details the performance criteria for the program associated with Outcome 1.5 It also summarises how the program is delivered and where 2017-18 Budget measures have materially changed the program.
Table 2.1.2: Performance Criteria for the ACSQHC
Purpose
To contribute to better health outcomes and experiences for patients and improved productivity and sustainability of the health system by leading and coordinating national improvements in safety and quality in health care.6
Outcome 1
Improved safety and quality in health care across the health system, including through the development, support for implementation, and monitoring of national clinical safety and quality guidelines and standards
Program 1.1: Safety and Quality in Health Care
The ACSQHC examines health care variation in Australia and develops solutions to reduce unwarranted variation. These tools include standards that describe the clinical care that a patient should be offered for a specific clinical condition. The ACSQHC provides guidance and tools to health professionals and health care organisations that support safe clinical practice and local improvement in the safety and quality of health care.
Delivery
A. Improving patient safety
Revise the National Safety and Quality Health Service (NSQHS) Standards.
Agree methodology for identifying and monitoring Hospital Acquired Complications.
Refine tools to enable local monitoring of safety and quality.
Develop standardised questions to measure patient experience (PEx) and Patient Reported Outcome Measures (PROMs).
B. Partnering with patients, consumers and the community
Support health services to meet the requirements of the NSQHS Standards that relate to partnerships, and further embed partnerships in Version 2 of the NSQHS Standards.
Continue to provide information about safety and quality that is relevant to the general public, as well as health professionals.
C. Encouraging safety, quality, and value
Release the 2nd Australian Atlas of Healthcare Variation that will include a range of clinical topics agreed with the Department of Health and the States and Territories.
Examine and work to reduce health care variation where it is unwarranted through the development of tools such as patient decision aides and clinical care standards.
Continue to work with expert clinicians, clinical and consumer groups to develop clinical care standards and other tools focussing on areas of high volume, and high cost where there is known variation from well-established models of care.
5 Progress against the performance criteria published in the 2016-17 Portfolio Budget Statements will be
reported in the 2016-17 ACSQHC Annual Report. 6 This purpose will be reflected in the 2017-18 ACSQHC Corporate Plan.

ACSQHC – Entity Budget Statements – Outcomes and Planned Performance
177
AC
SQ
HC
D. Supporting health professionals to provide safe and high-quality care
Identify and specify clinical measures and safety and quality indicators to assist health professions to improve the safety and quality of health care at a local level. This work is undertaken in partnership with health professionals, health services and technical experts.
Performance criteria
A. Improving patient safety
Successful implementation of the National Safety and Quality Health Service (NSQHS) Standards and ongoing monitoring of safety and quality performance of hospitals and day procedure services.7
2016-17 Estimated result 2017-18 Target 2018-19 (& beyond) Target
Revised NSQHS Standards developed. Hospital Acquired Complications (HACs) methodology finalised. Refinement of tools to enable local monitoring of safety and quality completed. Standardised questions to measure patient experience (PEx) completed and Patient Reported Outcome Measures (PROMs) developed.
Launch of the revised NSQHS standards by the end of November 2017. Monitoring HACs for safety and quality. Tools in use for local monitoring. Implementation of PEx and pilot testing of PROMs.
Implementation of Version 2 of the NSQHS Standards. Review and refinement of the HACs. Review and refinement of tools. Review and refinement of PEx and PROMs.
Percentage of hospitals and day procedure services assessed to the NSQHS Standards.
2016-17 Estimated result
2017-18 Target
2018-19 Target
2019-20 Target
2020-21 Target
100% 100% 100% 100% 100%
Percentage of public hospitals meeting the benchmark for hand hygiene compliance.
2016-17 Estimated result
2017-18 Target
2018-19 Target
2019-20 Target
2020-21 Target
≥75% ≥80% ≥80% ≥80% ≥80%
Number of clinicians completing the health care associated infection online education modules.
2016-17 Estimated result
2017-18 Target
2018-19 Target
2019-20 Target
2020-21 Target
≥13,000 ≥14,000 ≥15,000 ≥16,000 ≥16,000
7 This performance criterion has been revised to include the ongoing monitoring of safety and quality
performance of hospitals and day procedure services. Target reported in the 2016-17 Portfolio Budget Statements has been achieved.

ACSQHC – Entity Budget Statements – Outcomes and Planned Performance
178
B. Partnering with patients, consumers and the community
Provide safety and quality information to the general public.
2016-17 Estimated result 2017-18 Target 2018-19 (& beyond) Target
ACSQHC’s 2015-16 Annual Report was released on 18 October 2016. Vital Signs 2016 was released on 2 November 2016. Regular newsletters and website publications were released throughout 2016-17.
Reporting in the Annual Report on the state of safety and quality in health care for release by the end of October 2017. Reporting for the general public Vital Signs 2017 to be released by the end of November 2017. Reporting to the general public through regular ACSQHC newsletters and website publications.
Reporting in the Annual Report on the state of safety and quality in health care, and in a report for the general public Vital Signs 2018 and future years. Reporting to the general public through regular ACSQHC newsletters and website publications.
C. Encouraging safety, quality, and value
Monitor quality, cost and value through mapping of health care variation and action to reduce unwarranted variation.
2016-17 Estimated result 2017-18 Target 2018-19 (& beyond) Target
Disseminated maps of health care variations in Australia for a set of topic areas. Produced clinical resources focussing on high impact, high burden and high variation areas of clinical care. Developed Clinical Care Standards for consultation, informed by outcomes from the work on health care variation.
Disseminate maps of health care variations in Australia for a set of topic areas. Production of clinical resources focussing on high impact, high burden and high variation areas of clinical care. Develop Clinical Care Standards for consultation, informed by outcomes from the work on health care variation.
As per 2017-18.
D. Supporting health professionals to provide safe and high-quality care
Provide safety and quality information and resources to health professionals.
2016-17 Estimated result 2017-18 Target 2018-19 (& beyond) Target
Provided safety and quality information and resources to health professionals such as: clinical care standards; medication charts; antimicrobial use and resistance data; and audit tools.
Provide safety and quality information and resources to health professionals such as: clinical care standards; medication charts; antimicrobial use and resistance data; and audit tools.
As per 2017-18.
Condition specific clinical indicator sets developed.
2016-17 Estimated result
2017-18 Target
2018-19 Target
2019-20 Target
2020-21 Target
2 2 3 3 3
Material changes to Program 1.1 resulting from the following measures: There are no material changes to Program 1.1 resulting from measures.

ACSQHC – Entity Budget Statements – Budgeted Financial Statements
179
AC
SQ
HC
Section 3: Budgeted Financial Statements
Section 3 presents budgeted financial statements which provide a comprehensive snapshot of entity finances for the 2017-18 Budget year, including the impact of Budget measures and resourcing on financial statements.
3.1 BUDGETED FINANCIAL STATEMENTS
3.1.1 Differences Between Entity Resourcing and Financial Statements
This section is not applicable to the ACSQHC.
3.1.2 Explanatory Notes and Analysis of Budgeted Financial Statements
Departmental Resources
Comprehensive Income Statement
The ACSQHC Workplan operational costs are funded jointly by the Australian Government and State and Territory Governments on a 50:50 basis through annual contributions.
The ACSQHC’s total resourcing available for 2017-18 is estimated at $30.3 million, including Commonwealth and State Workplan funding of $15.3 million and other carry forward and funding receipts of $15.0 million. The 2017-18 estimated resourcing includes the full year of funding for the delivery of The ACSQHC’s programs and projects, as well as the associated agency management costs. This is consistent into the forward year estimates.
Balance Sheet
The ACSQHC’s total asset and liabilities are expected to remain stable over the forward years. The assets are budgeted to comprise predominantly of cash and non-financial assets. The liabilities are budgeted to comprise of suppliers payable, employee entitlements and deferred revenue.

ACSQHC – Entity Budget Statements – Budgeted Financial Statements
180
3.2 BUDGETED FINANCIAL STATEMENTS TABLES
Table 3.1: Comprehensive Income Statement (showing net cost of services for the period ended 30 June)
2016-17 Estimated
actual$'000
2017-18Budget
$'000
2018-19 Forward estimate
$'000
2019-20 Forward estimate
$'000
2020-21 Forward estimate
$'000
EXPENSES
Employee benefits 12,750 12,941 13,200 13,464 13,733
Supplier expenses 17,718 8,606 6,435 6,632 6,791
Depreciation and amortisation 260 100 - - -
Total expenses 30,728 21,647 19,635 20,096 20,524
LESS:
OWN-SOURCE INCOME
Revenue Sale of goods and rendering of services 12,192 2,643 150 140 80
Interest 200 200 200 200 200
Grants received 10,930 11,176 11,428 11,663 11,908
Other revenue 7,406 7,628 7,857 8,093 8,336
Total revenue 30,728 21,647 19,635 20,096 20,524
Gains
Other - - - - -
Total gains - - - - -
Total own-source income 30,728 21,647 19,635 20,096 20,524
Net cost of (contribution by) services - - - - -
Revenue from Government - - - - -
Surplus (deficit) - - - - -
Surplus (deficit) attributable to the Australian Government - - - - -
OTHER COMPREHENSIVE INCOME
Changes in asset revaluation reserves - - - - -
Total other comprehensive income (loss) - - - - -
Total comprehensive income (loss) attributable to the Australian Government - - - - -

ACSQHC – Entity Budget Statements – Budgeted Financial Statements
181
AC
SQ
HC
Table 3.2: Budgeted Departmental Balance Sheet (as at 30 June)
2016-17 Estimated
actual$'000
2017-18Budget
$'000
2018-19 Forward estimate
$'000
2019-20 Forward estimate
$'000
2020-21 Forward estimate
$'000
ASSETS
Financial assets
Cash and cash equivalents 8,851 6,851 5,851 4,851 3,851
Receivables 2,182 2,182 2,182 2,182 2,182
Total financial assets 11,033 9,033 8,033 7,033 6,033
Non-financial assets
Land and buildings 100 - - - -
Property, plant and equipment 38 38 38 38 38
Prepayments 391 391 391 391 391
Total non-financial assets 529 429 429 429 429
Total assets 11,562 9,462 8,462 7,462 6,462
LIABILITIES
Payables
Suppliers 3,123 3,023 2,978 2,634 1,289
Other payables 3,818 1,789 759 57 355
Total payables 6,941 4,812 3,737 2,691 1,644
Provisions
Employees 2,195 2,224 2,299 2,345 2,392
Total provisions 2,195 2,224 2,299 2,345 2,392
Total liabilities 9,136 7,036 6,036 5,036 4,036
Net Assets 2,426 2,426 2,426 2,426 2,426
EQUITY
Contributed equity 1,836 1,836 1,836 1,836 1,836
Reserves 484 484 484 484 484
Retained surpluses (accumulated deficits) 106 106 106 106 106
Total equity 2,426 2,426 2,426 2,426 2,426
Table 3.3: Departmental Statement of Changes in Equity – Summary of Movement (Budget year 2017-18)
Retained earnings
$'000
Asset revaluation
reserve $'000
Contributed equity/capital
$'000
Total equity
$'000
Opening balance as at 1 July 2017
Balance carried forward from previous period 106 484 1,836 2,426
Surplus (deficit) for the period - - - -
Contribution by Government - - - -
Estimated closing balance as at 30 June 2018 106 484 1,836 2,426
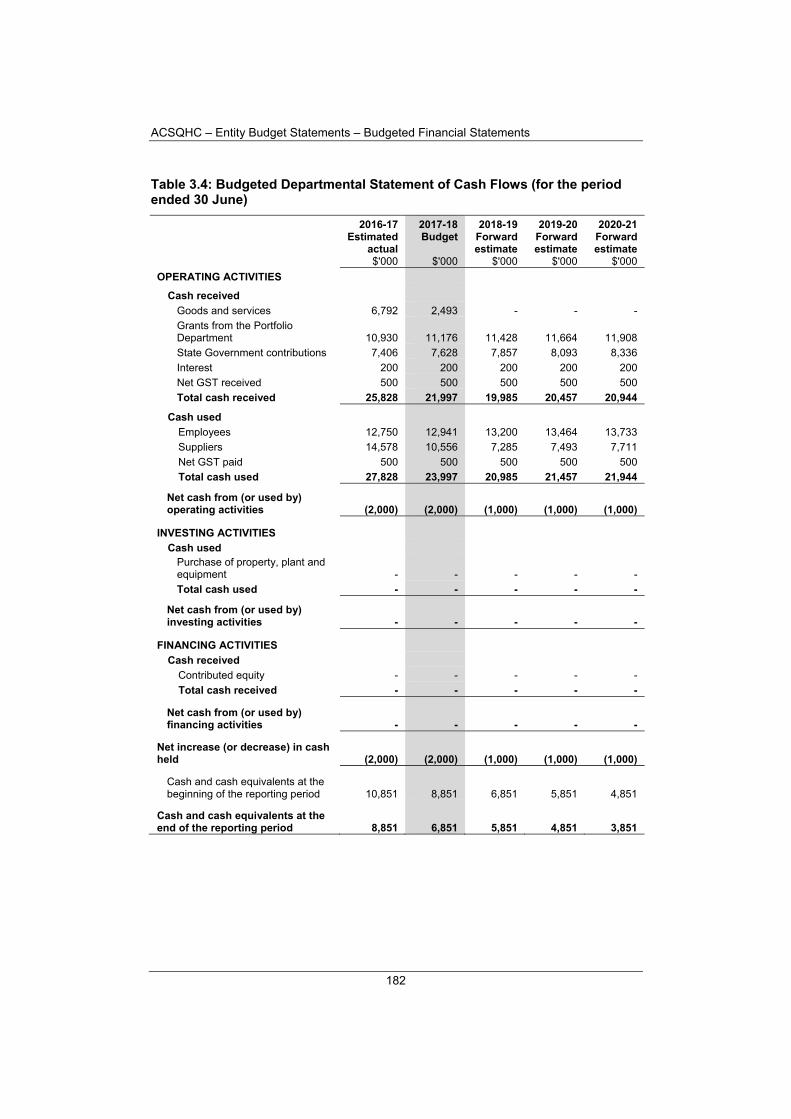
ACSQHC – Entity Budget Statements – Budgeted Financial Statements
182
Table 3.4: Budgeted Departmental Statement of Cash Flows (for the period ended 30 June)
2016-17 Estimated
actual$'000
2017-18Budget
$'000
2018-19 Forward estimate
$'000
2019-20 Forward estimate
$'000
2020-21 Forward estimate
$'000
OPERATING ACTIVITIES
Cash received
Goods and services 6,792 2,493 - - -
Grants from the Portfolio Department 10,930 11,176 11,428 11,664 11,908
State Government contributions 7,406 7,628 7,857 8,093 8,336
Interest 200 200 200 200 200
Net GST received 500 500 500 500 500
Total cash received 25,828 21,997 19,985 20,457 20,944
Cash used
Employees 12,750 12,941 13,200 13,464 13,733
Suppliers 14,578 10,556 7,285 7,493 7,711
Net GST paid 500 500 500 500 500
Total cash used 27,828 23,997 20,985 21,457 21,944
Net cash from (or used by) operating activities (2,000) (2,000) (1,000) (1,000) (1,000)
INVESTING ACTIVITIES
Cash used Purchase of property, plant and equipment - - - - -
Total cash used - - - - -
Net cash from (or used by) investing activities - - - - -
FINANCING ACTIVITIES
Cash received
Contributed equity - - - - -
Total cash received - - - - -
Net cash from (or used by) financing activities - - - - -
Net increase (or decrease) in cash held (2,000) (2,000) (1,000) (1,000) (1,000)
Cash and cash equivalents at the beginning of the reporting period 10,851 8,851 6,851 5,851 4,851
Cash and cash equivalents at the end of the reporting period 8,851 6,851 5,851 4,851 3,851

ACSQHC – Entity Budget Statements – Budgeted Financial Statements
183
AC
SQ
HC
Table 3.5: Departmental Capital Budget Statement (for the period ended 30 June)
2016-17 Estimated
actual$'000
2017-18Budget
$'000
2018-19 Forward estimate
$'000
2019-20 Forward estimate
$'000
2020-21 Forward estimate
$'000
CAPITAL APPROPRIATIONS
Equity injections - Bill 2 - - - - -
Total capital appropriations - - - - -
Total new capital appropriations represented by:
Purchase of non-financial assets - - - - -
Total items - - - - -
PURCHASE OF NON-FINANCIAL ASSETS
Funded by capital appropriations - equity injection (a) - - - - - Funded internally from departmental resources - - - - - Total acquisitions of non-financial assets - - - - -
RECONCILIATION OF CASH USED TO ACQUIRE ASSETS TO ASSET MOVEMENT TABLE
Total purchases - - - - -
Total cash used to acquire assets - - - - -
(a) Includes both current Bill 2, prior Act 2/4/6 appropriations and special capital appropriations.

ACSQHC – Entity Budget Statements – Budgeted Financial Statements
184
Table 3.6: Statement of Asset Movements (Budget year 2017-18)
Buildings
$'000
Other property, plant and
equipment $'000
Intangibles
$'000
Total
$'000
As at 1 July 2017
Gross book value 479 103 - 582
Accumulated depreciation/ amortisation and impairment (379) (65) - (444)
Opening net book balance 100 38 - 138
CAPITAL ASSET ADDITIONS
Estimated expenditure on new or replacement assets
By purchase - funded internally - - - -
Total additions - - - -
Other movements
Depreciation/amortisation expense (100) - - (100)
Total other movements (100) - - (100)
As at 30 June 2018
Gross book value 479 103 - 582 Accumulated depreciation/ amortisation and impairment (479) (65) - (544)
Closing net book balance - 38 - 38

185
Dig
ita
l H
ea
lth
AUSTRALIAN DIGITAL HEALTH
AGENCY
Entity Resources and Planned Performance
.

186

187
Dig
ita
l H
ea
lth
AUSTRALIAN DIGITAL HEALTH
AGENCY
Section 1: Entity Overview and Resources ...................................................... 188
1.1 Strategic Direction Statement ................................................................... 188
1.2 Entity Resource Statement ....................................................................... 190
1.3 Budget Measures ...................................................................................... 191
Section 2: Outcomes and Planned Performance ............................................. 192
2.1 Budgeted Expenses and Performance ..................................................... 192
Section 3: Budgeted Financial Statements ...................................................... 198
3.1 Budgeted Financial Statements ................................................................ 198
3.2 Budgeted Financial Statements Tables .................................................... 199

Digital Health – Entity Budget Statements – Entity Overview and Resources
188
Section 1: Entity Overview and Resources
1.1 STRATEGIC DIRECTION STATEMENT1
The Australian Government is committed to the delivery of a world leading national digital health capability, which will advance the efficiency, quality and delivery of healthcare provision to improve the health outcomes of all Australians.
Following unanimous support by the Council of Australian Governments (COAG), the Government will invest $374.2 million over two years to ensure every Australian has a My Health Record, unless they prefer not to. This will support the expanded rollout of the opt-out model to all Australians, and will continue and improve operations of My Health Record, while making it easier for health providers to register for the system. Opt-out is the fastest way to realise the significant health and economic benefits of My Health Record for all Australians, including through avoided hospital admissions, fewer adverse drug events, reduced duplication in diagnostic tests, better coordination of care for people seeing multiple healthcare providers, and better informed treatment decisions.
The Digital Health Agency has responsibility for the strategic management and governance for the national digital health strategy and the design, delivery and operations of the national digital healthcare system including the My Health Record system.
The Digital Health Agency provides the leadership, coordination and delivery of a collaborative and innovative approach to utilising technology to support and enhance a clinically safe and connected national health system. This will give individuals more control of their health and their health information, and support healthcare professionals to provide informed healthcare through access to current clinical and treatment information.
The Digital Health Agency performs the following functions:
Coordinates and provides input into the ongoing development of the National Digital Health Strategy.
Implements those aspects of the National Digital Health Strategy that are agreed or directed by COAG.
Responsibility for all national digital health functions including the role of the My Health Record System Operator and for protecting the security, privacy and confidentiality of people’s digital health records.
Develops, implements, manages, operates, and continuously improves specifications, standards, systems and services in relation to digital health, consistent with the national digital health work program.
Develops, implements and operates comprehensive and effective clinical governance, using a whole of system approach, to ensure clinical safety in the delivery of the national digital health work program.
1 For more information about the strategic direction of the Digital Health Agency, refer to the current
corporate plan, available at: www.digitalhealth.gov.au/about-the-agency/corporate-plan-2016-17

Digital Health – Entity Budget Statements – Entity Overview and Resources
189
Dig
ita
l H
ea
lth
Develops, monitors and manages specifications and standards to maximise effective operation between public and private sector digital healthcare systems.
Develops and implements compliance approaches in relation to the adoption of agreed specifications and standards relating to digital health.
Liaises and cooperates with international bodies on matters relating to digital health to ensure international lessons are captured and incorporated into Australian digital health design and strategy.
In 2017-18, the Digital Health Agency will target enhancements to the My Health Record system with programs to build connections from clinical information systems in the public and private health sectors to increase the number of pathology and diagnostic imaging reports in the My Health Record system and to improve the accuracy, timeliness, visibility and accessibility of medicines information in the system.
This will enable clinicians to experience the benefits of access to relevant clinical and treatment information, and improve the quality and delivery of healthcare services for individuals. To deliver on this important work, the Agency will negotiate a new Intergovernmental Agreement as part of delivering the next National Digital Health Strategy.
The Agency is a Corporate Commonwealth Entity which was established under the Public Governance, Performance and Accountability (Establishing the Australian Digital Health Agency) Rule 2016 to be the single accountable organisation for digital health at a national level in Australia.

Digital Health – Entity Budget Statements – Entity Overview and Resources
190
1.2 ENTITY RESOURCE STATEMENT
Table 1.1 shows the total funding from all sources available to the entity for its operations and to deliver programs and services on behalf of the Government.
The table summarises how resources will be applied by outcome (Government strategic policy objectives) and by administered (on behalf of the Government or the public) and departmental (for the entity’s operations) classification.
For more detailed information on special accounts and special appropriations, please refer to Budget Paper No. 4 – Agency Resourcing.
Information in this table is presented on a resourcing (i.e. appropriations/cash available) basis, whilst the ‘Budgeted expenses by outcome’ tables in Section 2 and the financial statements in Section 3 are presented on an accrual basis.
Table 1.1: Digital Health Agency Resource Statement – Budget Estimates for 2017-18 as at Budget May 2017
2016-17Estimated
actual$'000
2017-18 Estimate
$'000
Opening balance/cash reserves at 1 July - 20,619
Funds from Government
Annual appropriations (a)
Ordinary annual services (a)
Outcome 1 110,303 197,062
Other services (b)
Equity injection 10,589 53,464
Total annual appropriations 120,892 250,526
Amounts received from related entities (c)
Amounts from the Portfolio Department - -
Amounts from other entities - -
Total amounts received from related entities - -
Total funds from Government 120,892 250,526
Funds from other sources
Interest 1,750 1,800
Sale of goods and services - -
Other 32,250 32,250
Total funds from other sources 35,600 35,600
Total net resourcing for the Digital Health Agency 156,492 306,745
2016-17 2017-18
Average staffing level (number) 219 250
All figures are GST exclusive. (a) Appropriation Bill (No. 1) 2017-18. (b) Appropriation Bill (No. 2) 2017-18. (c) Funding provided by a Government entity that is not specified within the annual appropriation bills as a
payment to the corporate entity.

Digital Health – Entity Budget Statements – Entity Overview and Resources
191
Dig
ita
l H
ea
lth
1.3 BUDGET MEASURES
Budget measures in Part 1 relating to the Digital Health Agency are detailed in Budget Paper No. 2 and are summarised below.
Table 1.2: Digital Health Agency 2017-18 Budget Measures
Program 2016-17 $'000
2017-18 $'000
2018-19 $'000
2019-20 $'000
2020-21 $'000
My Health Record - continuation and expansion (a)
Australian Digital Health Agency
Departmental expenses 1.1 - 84,496 211,327 - -
Departmental capital 1.1 - 53,464 37,542 - -
Total - 137,960 248,869 - -
(a) The Australian Digital Health Agency is not the lead entity for this measure. Only the Australian Digital Health Agency impacts are shown in this table.

Digital Health – Entity Budget Statements – Outcomes and Planned Performance
192
Section 2: Outcomes and Planned Performance
Government outcomes are the intended results, impacts or consequences of actions by the Government on the Australian community. Commonwealth programs are the primary vehicle by which Government entities achieve the intended results of their outcome statements. Entities are required to identify the programs which contribute to Government outcomes over the Budget and forward years.
Each outcome is described below together with its related programs. The following provides detailed information on expenses for each outcome and program, further broken down by funding source.
Note:
Performance reporting requirements in the Portfolio Budget Statements are part of the Enhanced Commonwealth Performance Framework established by the Public Governance, Performance and Accountability Act 2013. It is anticipated that the performance criteria described in Portfolio Budget Statements will be read with broader information provided in an entity’s corporate plans and annual performance statements – included in Annual Reports – to provide an entity’s complete performance story.
The Digital Health Agency’s most recent corporate plan is available at: www.digitalhealth.gov.au/about-the-agency/corporate-plan-2016-17
The Digital Health Agency’s most recent annual performance statement is available at: www.health.gov.au/internet/main/publishing.nsf/Content/annual-report2015-16
2.1 BUDGETED EXPENSES AND PERFORMANCE
Outcome 1
To deliver national digital healthcare systems to enable and support improvement in health outcomes for Australians
Program Contributing to Outcome 1
Program 1.1: Digital Health
Linked Programs
Other Commonwealth entities that contribute to Outcome 1
Department of Health Program 1.2: Health Innovation and Technology The Department of Health has policy responsibility for improving health outcomes for Australians through digital healthcare systems.

Digital Health – Entity Budget Statements – Outcomes and Planned Performance
193
Dig
ita
l H
ea
lth
Budgeted Expenses for the Digital Health Agency
Table 2.1.1 shows how much the entity intends to spend (on an accrual basis) on achieving the outcome, broken down by program, as well as by administered and departmental funding sources.
Table 2.1.1: Budgeted Expenses for the Digital Health Agency
2016-17 Estimated
actual$'000
2017-18 Budget
$'000
2018-19 Forward
Year 1$'000
2019-20 Forward
Year 2 $'000
2020-21 Forward
Year 3 $'000
Program 1.1: Digital Health
Revenue from Government
Ordinary annual services 110,303 197,062 215,358 - -
Amounts from related entities - - - - -
Revenues from independent sources 34,000 34,050 - - -
Expenses not requiring appropriation - - - - in the Budget year (a) 52,355
Operating deficit (surplus) (11,818) - - - -
Total for Program 1.1 184,840 231,112 215,358 - -
Total expenses for Outcome 1 184,840 231,112 215,358 - -
2016-17 2017-18
Average staffing level (number) 219 250
(a) Expenses not requiring appropriation in the Budget year are made up of net assets received free of charge.

Digital Health – Entity Budget Statements – Outcomes and Planned Performance
194
Planned Performance for the Digital Health Agency
Table 2.1.2 below details the performance criteria for the program associated with Outcome 1.2 It also summarises how the program is delivered and where 2017-18 Budget measures have materially changed the program.
Table 2.1.2: Performance Criteria for the Digital Health Agency
Purpose
To improve health outcomes for Australians through the delivery of digital health services and systems, and to support digital innovation across Australia to give people more control of their health and healthcare.
Outcome 1
To deliver national digital healthcare systems to enable and support improvement in health outcomes for Australians
Program 1.1: Digital Health
In collaboration with consumers, healthcare providers and the health industry,3 the Digital Health Agency will deliver an effective national digital health capability that will achieve significant improvements in the quality and delivery of healthcare, and increased efficiency of the Australian health system. Following unanimous support by COAG for a national rollout of the My Health Record, the Government will invest $374.2 million over two years to ensure every Australian has a My Health Record, unless they prefer not to. This will support the expanded rollout of the opt-out model to all Australians, and will continue and improve operations of My Health Record, while making it easier for health providers to register for the system.
Delivery
A. Delivering core clinical programs (medicines safety, pathology, diagnostic imaging)
Work with the community on co-designing core clinical programs.
Improve medicines management use and capability in the My Health Record system.
Enhance clinical management and care by making pathology and diagnostic imaging results available in a single location and accessible by all healthcare providers.
B. Improving the My Health Record system
Increase the breadth of content available within the My Health Record system so that an individual's record offers a more complete picture of their health status.
Take a proactive approach to drive increased adoption and improve the usability of the My Health Record by partnering with innovators.
Ensure digital health solutions are fit for purpose, usable and useful. C. Achieving secure messaging and interoperability
Prioritise secure messaging as a core foundational capability required to enable interoperability between two or more messaging suppliers and seamless, secure, and confidential information sharing across all healthcare providers and consumers.
Provide leadership and guidance around standards to enable technical innovators and industry to achieve interoperability across their products and services at the lowest cost and effort.
2 Progress against the performance criteria published in the 2016-17 Portfolio Budget Statements will be
reported in the 2016-17 Digital Health Agency Annual Report. 3 Health industry includes entities such as peak health organisations, health software vendors, and
consumer health organisations (including insurers).

Digital Health – Entity Budget Statements – Outcomes and Planned Performance
195
Dig
ita
l H
ea
lth
D. Conducting strategy research and driving development of digital health
Negotiate an Intergovernmental Agreement (IGA) with Jurisdictions to deliver the next National Digital Health Strategy, including funding via the IGA for this work program.
Communicate the national digital health strategy to clinical, consumer and industry stakeholders, including findings from the national consultation process and the priority initiatives identified for digital health reform.
Establish a National Children’s Collaboration Network to bring together centres of excellence in children’s health innovation.
Design My Health Record enhancements to support delivery of the Health Care Homes strategy to improve the care of patients with chronic and complex conditions.
Implement two projects to embed telehealth in clinical consultations to prevent disease and provide convenient and accessible healthcare.
E. Delivering national opt-out for My Health Record
Implement national opt-out with Jurisdictions.
Communicate with the community to maximise their awareness of the My Health Record so individuals can choose to have a record and apply access settings, or choose to opt-out.
Co-produce and deliver communication and education activities for healthcare providers.
Performance criteria
A. Delivering core clinical programs (medicines safety, pathology, diagnostic imaging)
Better medicines safety through improved accuracy, timeliness, visibility and accessibility of medicines information in the My Health Record system.
2016-17 Estimated result 2017-18 Target 2018-19 Target
Design of an improved view of medicines information available in the My Health Record to be completed by 30 June 2017.
Commence public pharmacy dispense records upload to the My Health Record from two jurisdictions and upload a minimum of 60% of dispensed pharmacy prescriptions supplied to consumers registered with the My Health Record by 30 June 2018.
Upload 90% of dispensed pharmacy prescriptions supplied to consumers registered with the My Health Record by 30 June 2019.4
Establish foundation sources of pathology and diagnostic imaging reports in the My Health Record with key implementation partners from public hospital networks and the private sector.
2016-17 Estimated result 2017-18 Target 2018-19 Target
Two public jurisdiction diagnostic imaging providers and two public jurisdiction pathology providers have commenced sharing reports with the My Health Record.
All States and Territories, two private diagnostic imaging providers and two private pathology providers are sharing diagnostic imaging and pathology reports with the My Health Record.
Uploading of more than 60% of reports by private pathology and diagnostic imaging providers for consumers with a My Health Record.5
4 The Australian Government has agreed to continue and improve the operation of digital health to
30 June 2019. 5 Ibid.

Digital Health – Entity Budget Statements – Outcomes and Planned Performance
196
B. Improving the My Health Record system
Enhance the My Health Record system to improve participation, usage, content and engagement with the service.
2016-17 Estimated result 2017-18 Target 2018-19 Target
Design of an application allowing consumers to connect to the My Health Record system using mobile devices, and connection of more than 200 (out of a total of 1,1246) public hospitals and more than 95 (out of a total of 2047) private hospitals to the My Health Record system is expected to occur between 1 July 2016 and 30 June 2017.
Release an upgrade to the My Health Record system to improve the medicines view, end user experience and mobile access, complete public hospital connections, and connect an additional 20 private hospitals to the My Health Record system between 1 July 2017 and 30 June 2018.
Connect an additional 20 private hospitals to the My Health Record system between 1 July 2018 and 30 June 2019.8
Availability of the My Health Record system.
2016-17 Estimated result
2017-18 Target
2018-19 Target
2019-20 Target
2020-21 Target
99% of the time (excluding planned outages)
99% of the time (excluding planned outages)
99% of the time (excluding planned outages)
N/A9 N/A
C. Achieving secure messaging and interoperability
Establish secure message interoperability by developing and deploying a process for a message to flow securely from one health service provider to another.
2016-17 Estimated result 2017-18 Target 2018-19 Target
Develop a strategy to drive the implementation plans to deliver usable point-to-point secure messaging by 30 June 2017.
Finalise industry specification and guidelines for secure messaging and implement messaging in three jurisdictions.
Implement a national rollout of secure messaging by 30 June 2019.
D. Conducting strategy research and driving development of digital health
Development and delivery of the National Digital Health Strategy.
2016-17 Estimated result 2017-18 Target 2018-19 Target
Develop the National Digital Health Strategy and finalise it with the Australian Health Ministers' Advisory Council (AHMAC) by 30 June 2017.
Finalise National Digital Health Strategy with the Council of Australian Governments’ Health Council.
First year of implementation of the National Digital Health Strategy.10
6 Total number of public hospital and health services reported by State and Territory jurisdictions in
March 2017, with 529 hospitals and health services connected to the My Health Record system prior to 1 July 2016.
7 Total number of private hospitals and clinics contracted with the Agency for connection to the My Health Record system in March 2017, with 66 private hospitals and clinics connected prior to 1 July 2016.
8 The Australian Government has agreed to continue and improve the operation of digital health to 30 June 2019.
9 Ibid. 10 Ibid.

Digital Health – Entity Budget Statements – Outcomes and Planned Performance
197
Dig
ita
l H
ea
lth
E. Delivering national opt-out for My Health Record
Deliver national opt-out participation for My Health Record.
2016-17 Estimated result 2017-18 Target 2018-19 Target
N/A11 Finalise a program delivery, outline key milestones and decision points for successful implementation.
Deliver national opt-out by 31 December 2018.
Material changes to Program 1.1 resulting from the following measures: My Health Record – continuation and expansion
11 There is no estimated result for 2016-17 as this performance criterion relates to the 2017-18 Budget measure My Health Record – continuation and expansion.

Digital Health – Entity Budget Statements – Budgeted Financial Statements
198
Section 3: Budgeted Financial Statements
Section 3 presents budgeted financial statements which provide a comprehensive snapshot of entity finances for the 2017-18 Budget year, including the impact of Budget measures and resourcing on financial statements.
3.1 BUDGETED FINANCIAL STATEMENTS
3.1.1 Differences Between Entity Resourcing and Financial Statements
This section is not applicable to the Digital Health Agency.
3.1.2 Explanatory Notes and Analysis of Budgeted Financial Statements
The Digital Health Agency became operational on 1 July 2016. Relevant financial statement balances have transferred from the National e-Health Transition Authority and the Department of Health. The Australian Government has agreed to continue and improve the operation of digital health to 30 June 2019.
Departmental Resources
Comprehensive Income Statement
Resourcing includes funding for the delivery of the Digital Health Agency’s program, as well as the associated agency management costs. The Digital health Agency is jointly funded by the Australian, State and Territory Governments.
Balance Sheet
My Health Record increases in value through Government contributions and from internal resources.

Digital Health – Entity Budget Statements – Budgeted Financial Statements
199
Dig
ita
l H
ea
lth
3.2 BUDGETED FINANCIAL STATEMENTS TABLES
Table 3.1: Comprehensive Income Statement (showing net cost of services for the period ended 30 June)
2016-17 Estimated
actual$'000
2017-18Budget
$'000
2018-19 Forward estimate
$'000
2019-20 Forward estimate
$'000
2020-21 Forward estimate
$'000
EXPENSES
Employee benefits 46,321 40,414 - - -
Supplier expenses 128,387 180,333 215,358 - -
Depreciation and amortisation 10,132 10,365 - - -
Total expenses 184,840 231,112 215,358 - -
LESS:
OWN-SOURCE INCOME
Revenue
Interest 1,750 1,800 - - -
Other revenue 32,250 32,250 - - -
Total revenue 34,000 34,050 - - -
Gains
Other 52,355 - - - -
Total gains 52,355 - - - -
Total own-source income 86,355 34,050 - - -
Net cost of (contribution by) services 98,485 197,062 215,358 - -
Revenue from Government 110,303 197,062 215,358 - -
Surplus (deficit) 11,818 - - - -
Surplus (deficit) attributable to the Australian Government 11,818 - - - -
OTHER COMPREHENSIVE INCOME Changes in asset revaluation reserves - - - - -
Total other comprehensive income (loss) - - - - -
Total comprehensive income (loss) attributable to the Australian Government 11,818 - - - -
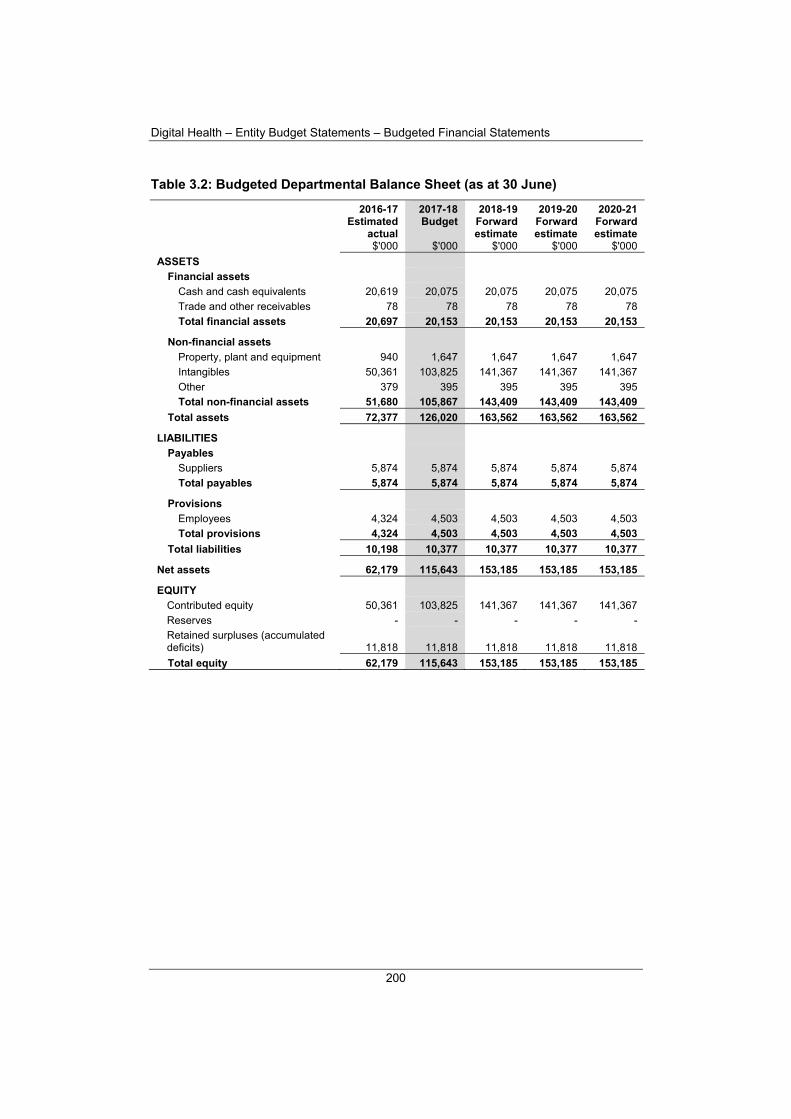
Digital Health – Entity Budget Statements – Budgeted Financial Statements
200
Table 3.2: Budgeted Departmental Balance Sheet (as at 30 June)
2016-17 Estimated
actual$'000
2017-18Budget
$'000
2018-19 Forward estimate
$'000
2019-20 Forward estimate
$'000
2020-21 Forward estimate
$'000
ASSETS
Financial assets
Cash and cash equivalents 20,619 20,075 20,075 20,075 20,075
Trade and other receivables 78 78 78 78 78
Total financial assets 20,697 20,153 20,153 20,153 20,153
Non-financial assets
Property, plant and equipment 940 1,647 1,647 1,647 1,647
Intangibles 50,361 103,825 141,367 141,367 141,367
Other 379 395 395 395 395
Total non-financial assets 51,680 105,867 143,409 143,409 143,409
Total assets 72,377 126,020 163,562 163,562 163,562
LIABILITIES
Payables
Suppliers 5,874 5,874 5,874 5,874 5,874
Total payables 5,874 5,874 5,874 5,874 5,874
Provisions
Employees 4,324 4,503 4,503 4,503 4,503
Total provisions 4,324 4,503 4,503 4,503 4,503
Total liabilities 10,198 10,377 10,377 10,377 10,377
Net assets 62,179 115,643 153,185 153,185 153,185
EQUITY
Contributed equity 50,361 103,825 141,367 141,367 141,367
Reserves - - - - -
Retained surpluses (accumulated deficits) 11,818 11,818 11,818 11,818 11,818
Total equity 62,179 115,643 153,185 153,185 153,185

Digital Health – Entity Budget Statements – Budgeted Financial Statements
201
Dig
ita
l H
ea
lth
Table 3.3: Departmental Statement of Changes in Equity – Summary of Movement (Budget year 2017-18)
Retained earnings
$'000
Asset revaluation
reserve $'000
Contributed equity/capital
$'000
Total equity
$'000
Opening balance as at 1 July 2017
Balance carried forward from previous period 11,818 - 50,361 62,179
Surplus (deficit) for the period - - - -
Appropriation (equity injection) - - 53,464 53,464
Estimated closing balance as at 30 June 2018 11,818 - 103,825 115,643

Digital Health – Entity Budget Statements – Budgeted Financial Statements
202
Table 3.4: Budgeted Departmental Statement of Cash Flows (for the period ended 30 June)
2016-17 Estimated
actual$'000
2017-18Budget
$'000
2018-19 Forward estimate
$'000
2019-20 Forward estimate
$'000
2020-21 Forward estimate
$'000
OPERATING ACTIVITIES
Cash received
Appropriations 110,303 197,062 215,358 - -
Interest 1,835 1,800 - - -
Net GST received 11,000 9,500 - - -
Other cash received 82,240 32,250 - - -
Total cash received 205,378 240,612 215,358 - -
Cash used
Employees 46,215 40,235 - - -
Suppliers 116,472 180,349 215,358 - -
Net GST paid 11,000 9,500 - - -
Total cash used 173,687 230,084 215,358 - -
Net cash from (or used by) operating activities 31,691 10,528 - - -
INVESTING ACTIVITIES
Cash used
Purchase of property, plant and equipment 21,661 64,536 37,542 - -
Total cash used 21,661 64,536 37,542 - -
Net cash from (or used by) investing activities (21,661) (64,536) (37,542) - -
FINANCING ACTIVITIES
Cash received
Contributed equity 10,589 53,464 37,542 - -
Total cash received 10,589 53,464 37,542 - -
Net cash from (or used by) financing activities 10,589 53,464 37,542 - -
Net increase (or decrease) in cash held 20,619 (544) - - -
Cash and cash equivalents at the beginning of the reporting period - 20,619 20,075 20,075 20,075
Cash and cash equivalents at the end of the reporting period 20,619 20,075 20,075 20,075 20,075

Digital Health – Entity Budget Statements – Budgeted Financial Statements
203
Dig
ita
l H
ea
lth
Table 3.5: Departmental Capital Budget Statement (for the period ended 30 June)
2016-17 Estimated
actual$'000
2017-18Budget
$'000
2018-19 Forward estimate
$'000
2019-20 Forward estimate
$'000
2020-21 Forward estimate
$'000
CAPITAL APPROPRIATIONS
Equity injections - Bill 2 10,589 53,464 37,542 - -
Total capital appropriations 10,589 53,464 37,542 - -
Total new capital appropriations represented by:
Purchase of non-financial assets 10,589 53,464 37,542 - -
Total items 10,589 53,464 37,542 - -
PURCHASE OF NON-FINANCIAL ASSETS
Funded by capital appropriations - equity injection (a) 10,589 53,464 37,542 - -
Funded internally from departmental resources 11,072 11,072 - - -
Total acquisitions of non-financial assets 21,661 64,536 37,542 - -
RECONCILIATION OF CASH USED TO ACQUIRE ASSETS TO ASSET MOVEMENT TABLE
Total purchases 21,661 64,536 37,542 - -
Total cash used to acquire assets 21,661 64,536 37,542 - -
(a) Includes both current Bill 2, prior Act 2/4/6 appropriations and special capital appropriations.

Digital Health – Entity Budget Statements – Budgeted Financial Statements
204
Table 3.6: Statement of Asset Movements (Budget year 2017-18)
Buildings
$'000
Other property, plant and
equipment $'000
Intangibles
$'000
Total
$'000
As at 1 July 2017
Gross book value - 1,000 137,022 138,022 Accumulated depreciation/ amortisation and impairment - (60) (86,661) (86,721)
Opening net book balance - 940 50,361 51,301
CAPITAL ASSET ADDITIONS
Estimated expenditure on new or replacement assets
By purchase - appropriation equity - - 53,464 53,464
By purchase - internal resources - 1,000 10,072 11,072
Total additions - 1,000 63,536 64,536
Other movements
Depreciation/amortisation expense - (293) (10,072) (10,365)
Total other movements - (293) (10,072) (10,365)
As at 30 June 2018
Gross book value - 2,000 200,558 202,558 Accumulated depreciation/ amortisation and impairment - (353) (96,733) (97,086)
Closing net book balance - 1,647 103,825 105,472

205
AIH
W AUSTRALIAN INSTITUTE OF
HEALTH AND WELFARE
Entity Resources and Planned Performance

206

207
AIH
W
AUSTRALIAN INSTITUTE OF HEALTH AND WELFARE
Section 1: Entity Overview and Resources ...................................................... 208
1.1 Strategic Direction Statement ................................................................... 208
1.2 Entity Resource Statement ....................................................................... 209
1.3 Budget Measures ...................................................................................... 210
Section 2: Outcomes and Planned Performance ............................................. 211
2.1 Budgeted Expenses and Performance ..................................................... 211
Section 3: Budgeted Financial Statements ...................................................... 218
3.1 Budgeted Financial Statements ................................................................ 218
3.2 Budgeted Financial Statements Tables .................................................... 219

AIHW – Entity Budget Statements – Entity Overview and Resources
208
Section 1: Entity Overview and Resources
1.1 STRATEGIC DIRECTION STATEMENT1
The Australian Government, through the Australian Institute of Health and Welfare (AIHW), is committed to providing high quality national health and welfare-related data and analysis across all relevant sectors, presented in meaningful and relevant ways and delivered in a timely manner. Accurate statistical information, comprehensive data development and high quality analyses support an increased understanding of health and welfare issues. This evidence base is critical to good policy making and effective service delivery, leading to better health and welfare outcomes for Australians. The independence of the AIHW is central to maintaining the ready acceptance of the accuracy and relevance of the evidence-base developed by the AIHW.
The AIHW develops, collects, analyses and reports information drawn from the national data collections of which it has custody, and from other credible data sources. It produces many public reports and actively promotes its work to Governments, other organisations and the community as open and accessible data and information. As a trusted strategic partner, the AIHW maintains close engagement with data providers and users of the information that it produces. A key element of this central role is understanding the range of data that is available and also identifying where there may be gaps in that data. As one of the leading entities managing people-centred data, the AIHW has a key role in raising awareness of data gaps and opportunities.
Following an independent review of the role of the AIHW, the AIHW Board has approved a new Strategic Directions document for the AIHW. Central to this strategy are five new strategic goals. These five goals are for the AIHW to be:
leaders in health and welfare data; drivers of data improvement; expert sources of value-added analysis; champions of open and accessible data and information; and trusted strategic partners.
Together with revised vision and purpose statements, these goals will be pursued by the AIHW during 2017-18 and beyond.
In the 2017-18 Budget, the Government will provide $3.4 million over three years, to the AIHW from the transformation and innovation stream of the Public Service Modernisation Fund.
The role and functions of the AIHW are set out in the Australian Institute of Health and Welfare Act 1987. The AIHW is a Corporate Commonwealth Entity under the Public Governance, Performance and Accountability Act 2013 (PGPA Act).
1 For more information about the strategic direction of the AIHW, refer to the current corporate plan,
available at: www.aihw.gov.au/publication-detail/?id=60129556354

AIHW – Entity Budget Statements – Entity Overview and Resources
209
AIH
W
1.2 ENTITY RESOURCE STATEMENT
Table 1.1 shows the total funding from all sources available to the entity for its operations and to deliver programs and services on behalf of the Government.
The table summarises how resources will be applied by outcome (Government strategic policy objectives) and by administered (on behalf of the Government or the public) and departmental (for the entity’s operations) classification.
For more detailed information on special accounts and special appropriations, please refer to Budget Paper No. 4 – Agency Resourcing.
Information in this table is presented on a resourcing (i.e. appropriations/cash available) basis, whilst the ‘Budgeted expenses by outcome’ tables in Section 2 and the financial statements in Section 3 are presented on an accrual basis.
Table 1.1: AIHW Resource Statement – Budget Estimates for 2017-18 as at Budget May 2017
2016-17Estimated
actual$'000
2017-18 Estimate
$'000
Opening balance/cash reserves at 1 July 27,220 52,393
Funds from Government Annual appropriations
Ordinary annual services (a)
Outcome 1 26,911 28,078
Other services (b)
Equity injection - -
Total annual appropriations 26,911 28,078
Amounts received from related entities (c)
Amounts from the Portfolio Department 21,000 21,000
Amounts from other entities - -
Total amounts received from related entities 21,000 21,000
Total funds from Government 47,911 49,078
Funds from other sources
Interest 1,000 1,000
Sale of goods and services 11,000 11,000
Other 30 30
Total funds from other sources 12,030 12,030
Total net resourcing for AIHW 87,161 113,501
2016-17 2017-18
Average staffing level (number) 311 308
All figures are GST exclusive. (a) Appropriation Bill (No. 1) 2017-18. (b) Appropriation Bill (No. 2) 2017-18. (c) Funding provided by a Government entity that is not specified within the annual appropriation bills as a
payment to the corporate entity.

AIHW – Entity Budget Statements – Entity Overview and Resources
210
1.3 BUDGET MEASURES
Budget measures in Part 1 relating to the AIHW are detailed in Budget Paper No. 2 and are summarised below.
Table 1.2: AIHW 2017-18 Budget Measures
Program 2016-17
$'000 2017-18
$'000 2018-19
$'000 2019-20
$'000 2020-21
$'000
Whole of Government Measures
Public Service Modernisation Fund - transformation and innovation stream
Australian Institute of Health and Welfare
Departmental expenses 1.1 - - - - -
Total expenses - - - - -

AIHW – Entity Budget Statements – Outcomes and Planned Performance
211
AIH
W
Section 2: Outcomes and Planned Performance
Government outcomes are the intended results, impacts or consequences of actions by the Government on the Australian community. Commonwealth programs are the primary vehicle by which Government entities achieve the intended results of their outcome statements. Entities are required to identify the programs which contribute to Government outcomes over the Budget and forward years.
Each outcome is described below together with its related programs. The following provides detailed information on expenses for each outcome and program, further broken down by funding source.
Note:
Performance reporting requirements in the Portfolio Budget Statements are part of the Enhanced Commonwealth Performance Framework established by the Public Governance, Performance and Accountability Act 2013. It is anticipated that the performance criteria described in Portfolio Budget Statements will be read with broader information provided in an entity’s corporate plans and annual performance statements – included in Annual Reports – to provide an entity’s complete performance story.
The AIHW’s most recent corporate plan is available at: www.aihw.gov.au/publication-detail/?id=60129556354
The AIHW’s most recent annual performance statement is available at: www.aihw.gov.au/publications/aihw-annual-reports
2.1 BUDGETED EXPENSES AND PERFORMANCE
Outcome 1
A robust evidence-base for the health, housing and community sectors, including through developing and disseminating comparable health and welfare information and statistics
Program Contributing to Outcome 1
Program 1.1: Develop, Collect, Analyse and Report High Quality National Health and Welfare Information and Statistics for Governments and the Community
Linked Programs
Other Commonwealth entities that contribute to Outcome 1
Department of Health Program 1.1: Health Policy, Research and Analysis The Department of Health invests in knowledge and information to support its responsibilities in developing health policy and legislation. This includes working with the AIHW in the development and publication of health statistics and information.

AIHW – Entity Budget Statements – Outcomes and Planned Performance
212
Budgeted Expenses for the AIHW
Table 2.1.1 shows how much the entity intends to spend (on an accrual basis) on achieving the outcome, broken down by program, as well as by administered and departmental funding sources.
Table 2.1.1: Budgeted Expenses for the AIHW
2016-17 Estimated
actual$'000
2017-18Budget
$'000
2018-19 Forward estimate
$'000
2019-20 Forward estimate
$'000
2020-21 Forward estimate
$'000
Program 1.1: Develop, Collect, Analyse and Report High Quality National Health and Welfare Information and Statistics for Governments and the Community
Revenue from Government
Ordinary annual services (a) 26,911 28,078 27,669 27,058 26,406
Amounts from related entities 21,000 21,000 21,000 21,000 21,000 Revenues from independent sources 12,030 12,030 12,030 12,030 12,030
Operating deficit (surplus) 445 366 - - -
Total for Program 1.1 60,386 61,474 60,699 60,088 59,436
Total expenses for Outcome 1 60,386 61,474 60,699 60,088 59,436
2016-17 2017-18
Average staffing level (number) 311 308
(a) Appropriation Bill (No. 1) 2017-18.

AIHW – Entity Budget Statements – Outcomes and Planned Performance
213
AIH
W
Planned Performance for the AIHW
Table 2.1.2 below details the performance criteria for the program associated with Outcome 1.2 It also summarises how the program is delivered and where 2017-18 Budget measures have materially changed the program.
Table 2.1.2: Performance Criteria for the AIHW
Purpose
To create authoritative and accessible information and statistics that, inform decisions and improve the health and welfare of all Australians.
Outcome 1
A robust evidence-base for the health, housing and community sectors, including through developing and disseminating comparable health and welfare information and statistics
Program 1.1: Develop, Collect, Analyse and Report High Quality National Health and Welfare Information and Statistics for Governments and the Community
The AIHW publishes extensive policy-relevant health and welfare information to assist consumers, health care, housing and community service providers, researchers, and all levels of government. The AIHW develops, maintains and promotes statistical information standards for the health, community services and housing assistance sectors, and publishes comprehensive biennial reports on Australia’s health and Australia’s welfare. Accurate statistical information, comprehensive data development and high quality analyses support an increased understanding of health and welfare issues. This creates an evidence-base that can drive changes in policy and service delivery which have a direct impact on the lives of Australians. In the 2017-18 Budget, the Government will provide $3.4 million over three years, to the AIHW from the transformation and innovation stream of the Public Service Modernisation Fund.
Delivery
A. Providing health and welfare information and analysis
Release a range of data and information products relevant to key policy areas.
Provide access to data and information in an environment that supports stringent governance, capability, data management and privacy requirements.
Assist reporting of, or report on, nationally-agreed performance indicators. B. Providing leadership and improvements in health and welfare data and information
Work with AIHW trusted partners to identify and fill priority data gaps.
Modernise presentation of national health and welfare-related data and analysis.
Enhance data analysis capabilities.
2 Progress against the performance criteria published in the 2016-17 Portfolio Budget Statements will be
reported in the 2016-17 AIHW Annual Report.

AIHW – Entity Budget Statements – Outcomes and Planned Performance
214
Performance criteria
A. Providing health and welfare information and analysis
Release a range of data and information products relevant to key policy areas, measured by the number or proportion of:3, 4, 5 a. products released;b. statistical products released that include data in a manipulatable format;c. completed requests for customised data analysis;d. sessions on the AIHW’s websites;6
e. references to the AIHW and its products in the media; andf. statistical products relating to annual national collections7 for which data are reported
less than one year after the end of their data collection period.
2016-17 Estimated result
2017-18 Target
2018-19 Target
2019-20 Target
2020-21 Target
a. 165 176 181 183 183
b. 70% ≥56% ≥61% ≥66% ≥66%
c. 200 160 160 160 160
d. 2,900,000 3,300,000 3,600,000 3,900,000 4,200,000
e. 4,600 4,300 4,300 4,300 4,300
f. 60% ≥70% ≥75% ≥77% ≥77%
Provide access to data and information in an environment that supports stringent governance, capability, data management and privacy requirements, measured by the number of completed data linkage project requests as agreed under the National Collaborative Research Infrastructure Strategy 2013.
2016-17 Estimated result
2017-18 Target
2018-19 Target
2019-20 Target
2020-21 Target
50 40 40 40 40
3 Two measures of this performance criterion used previously (that is, downloads of PDF versions of Australia’s health and Australia’s welfare) have been removed. They are no longer comprehensive measures of information provision because HTML as well as PDF versions are now provided.
4 The 2016-17 results provided for these measures were estimated at the end of March 2017. When comparing these results to 2016-17 targets, results include contributions related to the NHPA functions transferred to the AIHW from 1 July 2016 that were not possible to estimate when 2016-17 targets were made available in the 2016-17 PBS. 2017-18 and later targets have since been revised.
5 Targets for measures a, b, d and e of this performance criteria have been revised to encompass NHPA functions transferred to the AIHW from 1 July 2016.
6 Figures for website sessions exclude the Metadata Online Registry (METeOR) and Specialist Homelessness Services websites managed by the AIHW.
7 Products that fully report or publicly release an annual national data collection collated by the AIHW.

AIHW – Entity Budget Statements – Outcomes and Planned Performance
215
AIH
W
Release a range of data and information products relevant to key policy areas.
2016-17 Estimated result8 2017-18 Target 2018-19 (& beyond) Target
Five targeted products have been released. Three remaining products will be released by 30 June 2017.
Australia’s welfare 2017 to be presented to the Minister for Health by 31 December 2017. Australia’s health 2018 to be presented to the Minister for Health by 30 June 2018. Release of products by 30 June 2018 relating to:
health expenditure in 2015-16;
admitted hospital patient care in 2016-17;
detailed findings from the 2016 National Drug Strategy Household Survey;
residential and community mental health services in 2015-16; and
pathways in aged care and cause of death.
New editions of Australia’s health and Australia’s welfare to be presented to the Minister for Health biennially from 2019-20. Release of products by 30 June each year relating to products to be defined.
Assist reporting of, or report on, nationally-agreed performance indicators.
2016-17 Estimated result9 2017-18 Target 2018-19 (& beyond) Target
Activities completed relating to the development, coordination and supply of data for governments, including a range of performance indicators in the Council of Australian Governments (COAG) national agreements on health, affordable housing, disability and Indigenous reform. Seven products were released relating to performance indicators in the Performance and Accountability Framework agreed by COAG.
Supply data required for performance indicators in COAG national agreements on healthcare and Indigenous reform by 30 June 2018. Supply data to timetables required for the Steering Committee for the Review of Government Service Provision's Report on Government Services 2018 Volumes on health, housing and homelessness, and community services. Release products by 30 June 2018 relating to local level health performance indicators.10
Supply data required for nationally agreed performance indicators annually, as determined collectively by governments.
8 Estimated as at 31 March 2017. 9 Ibid. 10 Includes MyHospitals and MyHealthyCommunities websites.

AIHW – Entity Budget Statements – Outcomes and Planned Performance
216
B. Providing leadership and improvements in health and welfare data and information
Work with trusted partners to identify and fill priority data gaps.
2016-17 Estimated result 2017-18 Target 2018-19 (& beyond) Target
N/A11 Complete work toward the Coordination of Health Care Study, linking data from participants in the ABS Survey of Health Care with other data sets to find out about their use of primary care, hospital and emergency department services, and pharmaceuticals for periods before and after the survey. Release of products by 30 June 2018 relating to under-identification of Indigenous people in key data sets. Improve data in at least one subject area where there is a demonstrable data gap, for example, family and domestic violence, primary health care or disability.
Release of products by 30 June each year relating to information products relevant to key policy areas to be defined. Continue improving data in targeted subject areas.
Modernise presentation of national health and welfare – related data and analysis.
2016-17 Estimated result 2017-18 Target 2018-19 (& beyond) Target
N/A12 Release a redeveloped AIHW website, including links to content from the former National Health Performance Authority.
Activities to be defined during implementation of a revised communications and engagement strategy.
11 This performance criterion is new in 2017-18, therefore there is no estimated result for 2016-17. 12 Ibid.

AIHW – Entity Budget Statements – Outcomes and Planned Performance
217
AIH
W
Enhance data analysis capabilities.
2016-17 Estimated result 2017-18 Target 2018-19 (& beyond) Target
N/A13 Complete analysis of linked data from three national cancer screening programs by 30 June 2018. Complete the second of three work phases to improve storage, accessibility and analysis of locational data in AIHW data holdings, enabling better information on, for example, patterns and trends of service use. Demonstrate, as case studies, AIHW contributions shown externally in 2017-18 of improved reporting of population- or service-related health and welfare outcomes.
Release products presenting the results of linked data from three national cancer screening programs by 30 June 2019. Release a replacement to Metadata Online Registry by 30 June 2019. Other activities to be defined.
Material changes to Program 1.1 resulting from the following measures: There are no material changes to Program 1.1 resulting from measures.
13 This performance criterion is new in 2017-18, therefore there is no estimated result for 2016-17.

AIHW – Entity Budget Statements – Budgeted Financial Statements
218
Section 3: Budgeted Financial Statements
Section 3 presents budgeted financial statements which provide a comprehensive snapshot of entity finances for the 2017-18 Budget year, including the impact of Budget measures and resourcing on financial statements.
3.1 BUDGETED FINANCIAL STATEMENTS
3.1.1 Differences Between Entity Resourcing and Financial Statements
This section is not applicable to the AIHW.
3.1.2 Explanatory Notes and Analysis of Budgeted Financial Statements
Departmental Resources
Comprehensive Income Statement
Appropriation revenue from Government will be $1.2 million higher in 2017-18 than in 2016-17 consistent with the 2017-18 Budget measure Public Service Modernisation Fund - transformation and innovation stream.
The AIHW has budgeted to break even in 2017-18 prior to an accrual of $0.4 million required by accounting standards in relation to the AIHW’s new office lease. This accrual will have no effect on cash balances and will reverse over the lifetime of the lease.
Balance Sheet
The AIHW’s cash balance and equity will remain stable over the forward estimates.

AIHW – Entity Budget Statements – Budgeted Financial Statements
219
AIH
W
3.2 BUDGETED FINANCIAL STATEMENTS TABLES
Table 3.1: Comprehensive Income Statement (showing net cost of services for the period ended 30 June)
2016-17 Estimated
actual$'000
2017-18Budget
$'000
2018-19 Forward estimate
$'000
2019-20 Forward estimate
$'000
2020-21 Forward estimate
$'000
EXPENSES
Employee benefits 37,678 38,432 38,816 39,592 40,384
Supplier expenses 21,708 22,042 20,883 19,496 18,052
Depreciation and amortisation 1,000 1,000 1,000 1,000 1,000
Total expenses 60,386 61,474 60,699 60,088 59,436
LESS:
OWN-SOURCE INCOME
Revenue
Sale of goods and rendering of services 32,000 32,000 32,000 32,000 32,000
Interest 1,000 1,000 1,000 1,000 1,000
Other revenue 30 30 30 30 30
Total revenue 33,030 33,030 33,030 33,030 33,030
Gains
Other - - - - -
Total gains - - - - -
Total own-source income 33,030 33,030 33,030 33,030 33,030
Net cost of (contribution by) services 27,356 28,444 27,669 27,058 26,406
Revenue from Government 26,911 28,078 27,669 27,058 26,406
Surplus (deficit) (445) (366) - - -
Surplus (deficit) attributable to the Australian Government (445) (366) - - -
OTHER COMPREHENSIVE INCOME
Changes in asset revaluation reserves - - - - -
Total other comprehensive income (loss) - - - - -
Total comprehensive income (loss) attributable to the Australian Government (445) (366) - - -

AIHW – Entity Budget Statements – Budgeted Financial Statements
220
Table 3.2: Budgeted Departmental Balance Sheet (as at 30 June)
2016-17 Estimated
actual$'000
2017-18Budget
$'000
2018-19 Forward estimate
$'000
2019-20 Forward estimate
$'000
2020-21 Forward estimate
$'000
ASSETS
Financial assets
Cash and cash equivalents 27,920 28,402 28,830 28,830 28,830
Trade and other receivables 30,908 30,582 30,310 30,038 30,038
Total financial assets 58,828 58,984 59,140 58,868 58,868
Non-financial assets
Land and buildings 4,445 4,362 4,279 4,004 4,004
Property, plant and equipment 3,008 2,935 2,862 2,709 2,709
Other 1,076 1,076 1,076 1,076 1,076
Total non-financial assets 8,529 8,373 8,217 7,789 7,789
Total assets 67,357 67,357 67,357 66,657 66,657
LIABILITIES
Payables
Suppliers 2,733 2,983 3,233 2,783 2,783
Other payables 18,970 18,970 18,970 18,970 18,970
Total payables 21,703 21,953 22,203 21,753 21,753
Provisions
Employees 11,817 11,817 11,817 11,817 11,817
Other provisions 3,872 3,988 3,738 3,488 3,488
Total provisions 15,689 15,805 15,555 15,305 15,305
Total liabilities 37,392 37,758 37,758 37,058 37,058
Net assets 29,965 29,599 29,599 29,599 29,599
EQUITY
Contributed equity 27,501 27,501 27,501 27,501 27,501
Reserves 2,410 2,410 2,410 2,410 2,410 Retained surpluses (accumulated deficits) 54 (312) (312) (312) (312)
Total equity 29,965 29,599 29,599 29,599 29,599

AIHW – Entity Budget Statements – Budgeted Financial Statements
221
AIH
W
Table 3.3: Departmental Statement of Changes in Equity – Summary of Movement (Budget year 2017-18)
Retained earnings
$'000
Asset revaluation
reserve $'000
Contributed equity/capital
$'000
Total equity
$'000
Opening balance as at 1 July 2017
Balance carried forward from previous period 54 2,410 27,501 29,965
Surplus (deficit) for the period (366) - - (366)
Appropriation (equity injection) - - - -
Estimated closing balance as at 30 June 2018 (312) 2,410 27,501 29,599

AIHW – Entity Budget Statements – Budgeted Financial Statements
222
Table 3.4: Budgeted Departmental Statement of Cash Flows (for the period ended 30 June)
2016-17 Estimated
actual$'000
2017-18Budget
$'000
2018-19 Forward estimate
$'000
2019-20 Forward estimate
$'000
2020-21 Forward estimate
$'000
OPERATING ACTIVITIES
Cash received
Goods and services 32,000 32,000 32,000 32,000 32,000
Appropriations 26,911 28,078 27,669 27,058 26,406
Interest 1,000 1,000 1,000 1,000 1,000
Net GST received 1,000 1,000 1,000 1,000 1,000
Other cash received 30 30 30 30 30
Total cash received 60,941 62,108 61,699 61,088 60,436
Cash used
Employees 37,678 37,527 38,076 39,592 40,384
Suppliers 20,991 22,527 21,623 19,924 18,752
Net GST paid 1,000 1,000 1,000 1,000 1,000
Total cash used 59,669 61,054 60,699 60,516 60,136
Net cash from (or used by) operating activities 1,272 1,054 1,000 572 300
INVESTING ACTIVITIES
Cash used
Purchase of property, plant and equipment and intangibles 572 572 572 572 300
Total cash used 572 572 572 572 300
Net cash from (or used by) investing activities (572) (572) (572) (572) (300)
FINANCING ACTIVITIES
Cash received
Contributed equity - - - - -
Total cash received - - - - -
Net cash from (or used by) financing activities - - - - -
Net increase (or decrease) in cash held 700 482 428 - -
Cash and cash equivalents at the beginning of the reporting period 27,220 27,920 28,402 28,830 28,830
Cash and cash equivalents at the end of the reporting period 27,920 28,402 28,830 28,830 28,830

AIHW – Entity Budget Statements – Budgeted Financial Statements
223
AIH
W
Table 3.5: Departmental Capital Budget Statement (for the period ended 30 June)
2016-17 Estimated
actual$'000
2017-18Budget
$'000
2018-19 Forward estimate
$'000
2019-20 Forward estimate
$'000
2020-21 Forward estimate
$'000
CAPITAL APPROPRIATIONS
Equity injections - Bill 2 - - - - -
Total capital appropriations - - - - -
Total new capital appropriations represented by:
Purchase of non-financial assets - - - - -
Total items - - - - -
PURCHASE OF NON-FINANCIAL ASSETS
Funded by capital appropriations - equity injection (a) -
- - - -
Funded internally from departmental resources 572 572 572 572 300
Total acquisitions of non-financial assets 572 572 572 572 300
RECONCILIATION OF CASH USED TO ACQUIRE ASSETS TO ASSET MOVEMENT TABLE
Total purchases 572 572 572 572 300
Total cash used to acquire asset 572 572 572 572 300
(a) Includes both current Bill 2, prior Act 2/4/6 appropriations and special capital appropriations.

AIHW – Entity Budget Statements – Budgeted Financial Statements
224
Table 3.6: Statement of Asset Movements (Budget year 2017-18)
Buildings
$'000
Other property, plant and
equipment $'000
Intangibles
$'000
Total
$'000
As at 1 July 2017
Gross book value 6,466 4,539 1,086 12,091
Accumulated depreciation/ amortisation and impairment (1,829) (1,451) (1,086) (4,366)
Opening net book balance 4,637 3,088 - 7,725
CAPITAL ASSET ADDITIONS
Estimated expenditure on new or replacement assets
By purchase - appropriation equity - - - -
By purchase - internal resources 180 392 - 572
Total additions 180 392 - 572
Other movements
Depreciation/amortisation expense (455) (545) - (1,000)
Total other movements (455) (545) - (1,000)
As at 30 June 2018 Gross book value 6,646 4,931 1,086 12,663
Accumulated depreciation/ amortisation and impairment (2,284) (1,996) (1,086) (5,366)
Closing net book balance 4,362 2,935 - 7,297

225
AR
PA
NS
A
AUSTRALIAN RADIATION
PROTECTION AND NUCLEAR
SAFETY AGENCY
Entity Resources and Planned Performance

226

227
AR
PA
NS
A
AUSTRALIAN RADIATION
PROTECTION AND NUCLEAR
SAFETY AGENCY
Section 1: Entity Overview and Resources ...................................................... 228
1.1 Strategic Direction Statement ................................................................... 228
1.2 Entity Resource Statement ....................................................................... 229
1.3 Budget Measures ...................................................................................... 230
Section 2: Outcomes and Planned Performance ............................................. 231
2.1 Budgeted Expenses and Performance ..................................................... 231
Section 3: Budgeted Financial Statements ...................................................... 237
3.1 Budgeted Financial Statements ................................................................ 237
3.2 Budgeted Financial Statements Tables .................................................... 238

ARPANSA – Entity Budget Statements – Entity Overview and Resources
228
Section 1: Entity Overview and Resources
1.1 STRATEGIC DIRECTION STATEMENT1
The Australian Radiation Protection and Nuclear Safety Agency (ARPANSA), on behalf of the Australian Government, aims to protect the Australian people and the environment from the harmful effects of radiation.
ARPANSA provides advice and services to the Australian community on radiation protection, nuclear safety, security, and medical exposures to radiation, including related research. It promotes national uniformity of radiation protection and nuclear safety policy and practices across the Commonwealth and States and Territories. It also independently regulates the radiation sources, radiation facilities and nuclear installations of Commonwealth entities and contractors.
ARPANSA’s regulatory and advisory frameworks are based on evidence regarding levels of ionising and non-ionising2 radiation in the environment and the effect on human and environmental health and wellbeing.
In 2017-18, ARPANSA will continue to refine its risk-informed approach to effective regulation of radiation and nuclear facilities and practices, while striving to reduce the regulatory burden, through activities such as benchmarking Australia’s radiation and nuclear safety framework against the International Atomic Energy Agency safety standards.
ARPANSA will also assess exposure to the public, workers and the environment to ionising and non-ionising radiation through monitoring and publishing UV data and radiation doses to exposed workers.
For the purpose of radiation protection of patients, ARPANSA will expand the audit service for linear accelerators used in radiation therapy and continue the establishment of diagnostic reference levels for medical imaging.
The role and functions of ARPANSA are set out in the Australian Radiation Protection and Nuclear Safety Act 1998. ARPANSA is a Non-corporate Commonwealth Entity under the Public Governance, Performance and Accountability Act 2013.
1 For more information about the strategic direction of ARPANSA, refer to the current corporate plan,
available at: www.arpansa.gov.au/AboutUs/Corporate/corplan.cfm 2 Ionising radiation from radioactive substances or X-ray equipment can produce ionisation in matter. It has
sufficient energy to damage the heredity material in cells (DNA). Non-ionising radiation such as UV radiation from the sun or from emitters of radiofrequency radiation does not produce ionisation, but may still cause health effects.

ARPANSA – Entity Budget Statements – Entity Overview and Resources
229
AR
PA
NS
A
1.2 ENTITY RESOURCE STATEMENT
Table 1.1 shows the total funding from all sources available to the entity for its operations and to deliver programs and services on behalf of the Government.
The table summarises how resources will be applied by outcome (Government strategic policy objectives) and by administered (on behalf of the Government or the public) and departmental (for the entity’s operations) classification.
For more detailed information on special accounts and special appropriations, please refer to Budget Paper No. 4 – Agency Resourcing.
Information in this table is presented on a resourcing (i.e. appropriations/cash available) basis, whilst the ‘Budgeted expenses by outcome’ tables in Section 2 and the financial statements in Section 3 are presented on an accrual basis.

ARPANSA – Entity Budget Statements – Entity Overview and Resources
230
Table 1.1: ARPANSA Resource Statement – Budget Estimates for 2017-18 as at Budget May 2017
2016-17Estimated
actual$'000
2017-18 Estimate
$'000
DEPARTMENTAL
Prior year appropriation available 1,210 1,210
Annual appropriations
Ordinary annual services (a)
Departmental appropriation 13,049 12,839
s74 retained revenue receipts (b) 10,654 9,712
Departmental capital budget (c) 2,124 1,955
Other services (d)
Equity injection - 5,000
Total departmental annual appropriations 25,827 29,506
Special Accounts (e)
Appropriation receipts 15,173 19,794
Non-appropriation receipts 10,654 9,712
Total special account 25,827 29,506
Less appropriations drawn from annual or special appropriations above and credited to Special Accounts (f) (25,827) (29,506)
Total departmental resourcing 27,037 30,716
Total resourcing for ARPANSA 27,037 30,716
2016-17 2017-18
Average staffing level (number) 131 130
All figures are GST exclusive. (a) Appropriation Bill (No. 1) 2017-18. (b) Estimated retained revenue receipts under section 74 of the PGPA Act 2013. (c) Departmental Capital Budgets (DCB) are not separately identified in Appropriation Bill (No. 1) and form
part of ordinary annual services items. Refer to Table 3.5 for further details. For accounting purposes, this amount has been designated as a 'contribution by owner'.
(d) Appropriation Bill (No. 2) 2017-18. (e) For further information on special appropriations and special accounts, please refer to Budget Paper No. 4
- Agency Resourcing. Also see Table 2.1.1 for further information on outcome and program expenses broken down by various funding sources, e.g. annual appropriations, special appropriations and special accounts.
(f) Appropriation receipts included above.
1.3 BUDGET MEASURES
This section is not applicable to ARPANSA

ARPANSA – Entity Budget Statements – Outcomes and Planned Performance
231
AR
PA
NS
A
Section 2: Outcomes and Planned Performance
Government outcomes are the intended results, impacts or consequences of actions by the Government on the Australian community. Commonwealth programs are the primary vehicle by which Government entities achieve the intended results of their outcome statements. Entities are required to identify the programs which contribute to Government outcomes over the Budget and forward years.
Each outcome is described below together with its related programs. The following provides detailed information on expenses for each outcome and program, further broken down by funding source.
Note:
Performance reporting requirements in the Portfolio Budget Statements are part of the Enhanced Commonwealth Performance Framework established by the Public Governance, Performance and Accountability Act 2013. It is anticipated that the performance criteria described in Portfolio Budget Statements will be read with broader information provided in an entity’s corporate plans and annual performance statements – included in Annual Reports – to provide an entity’s complete performance story.
ARPANSA’s most recent corporate plan is available at: www.arpansa.gov.au/AboutUs/Corporate/corplan2016-20.cfm
ARPANSA’s most recent annual performance statement is available at: www.arpansa.gov.au/AboutUs/corporate/ar1516/1516home.cfm
2.1 BUDGETED EXPENSES AND PERFORMANCE
Outcome 1
Protection of people and the environment through radiation protection and nuclear safety research, policy, advice, codes, standards, services and regulation
Program Contributing to Outcome 1
Program 1.1: Radiation Protection and Nuclear Safety
Linked Programs
Other Commonwealth entities that contribute to Outcome 1
Department of Health Program 5.1: Protect the Health and Safety of the Community Through Regulation The Department of Health has strategic regulatory policy and national leadership responsibility for radiation protection and nuclear safety with particular regard to the regulatory framework. This includes best practice for health technologies related to radiation and nuclear safety.
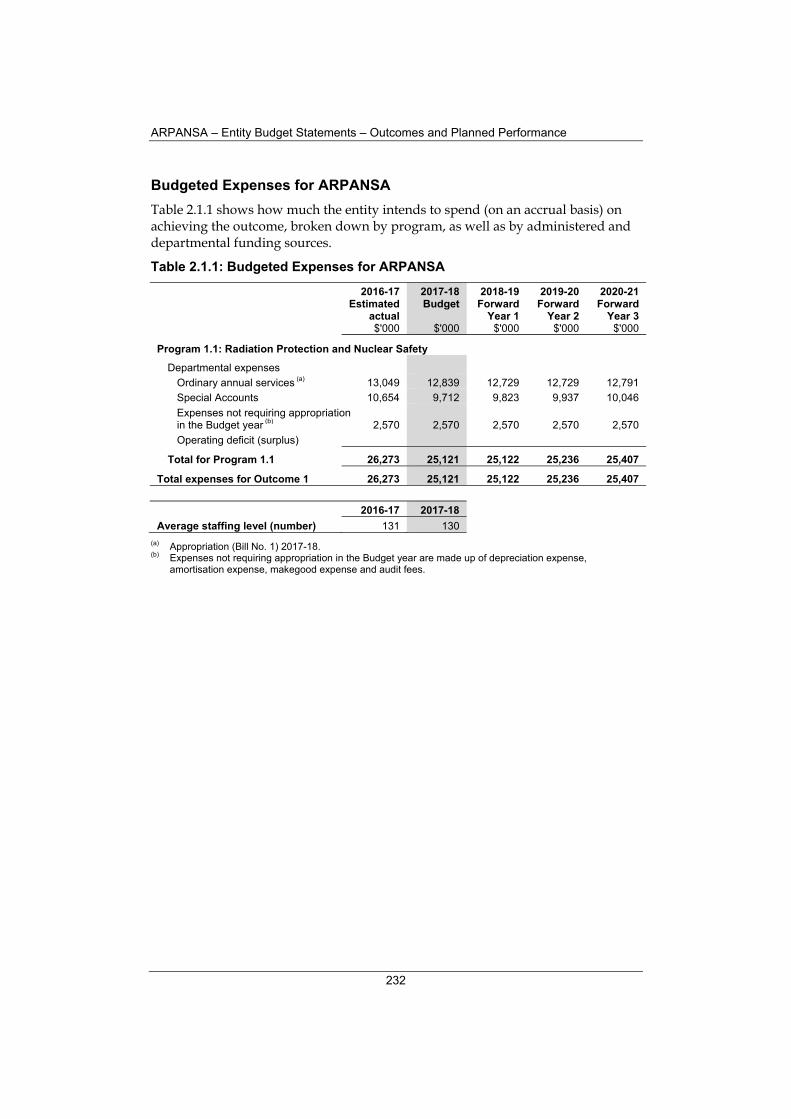
ARPANSA – Entity Budget Statements – Outcomes and Planned Performance
232
Budgeted Expenses for ARPANSA
Table 2.1.1 shows how much the entity intends to spend (on an accrual basis) on achieving the outcome, broken down by program, as well as by administered and departmental funding sources.
Table 2.1.1: Budgeted Expenses for ARPANSA
2016-17 Estimated
actual$'000
2017-18 Budget
$'000
2018-19 Forward
Year 1$'000
2019-20 Forward
Year 2 $'000
2020-21 Forward
Year 3 $'000
Program 1.1: Radiation Protection and Nuclear Safety
Departmental expenses
Ordinary annual services (a) 13,049 12,839 12,729 12,729 12,791
Special Accounts 10,654 9,712 9,823 9,937 10,046
Expenses not requiring appropriation 2,570 2,570 2,570 2,570 in the Budget year (b) 2,570
Operating deficit (surplus)
Total for Program 1.1 26,273 25,121 25,122 25,236 25,407
Total expenses for Outcome 1 26,273 25,121 25,122 25,236 25,407
2016-17 2017-18
Average staffing level (number) 131 130
(a) Appropriation (Bill No. 1) 2017-18. (b) Expenses not requiring appropriation in the Budget year are made up of depreciation expense,
amortisation expense, makegood expense and audit fees.
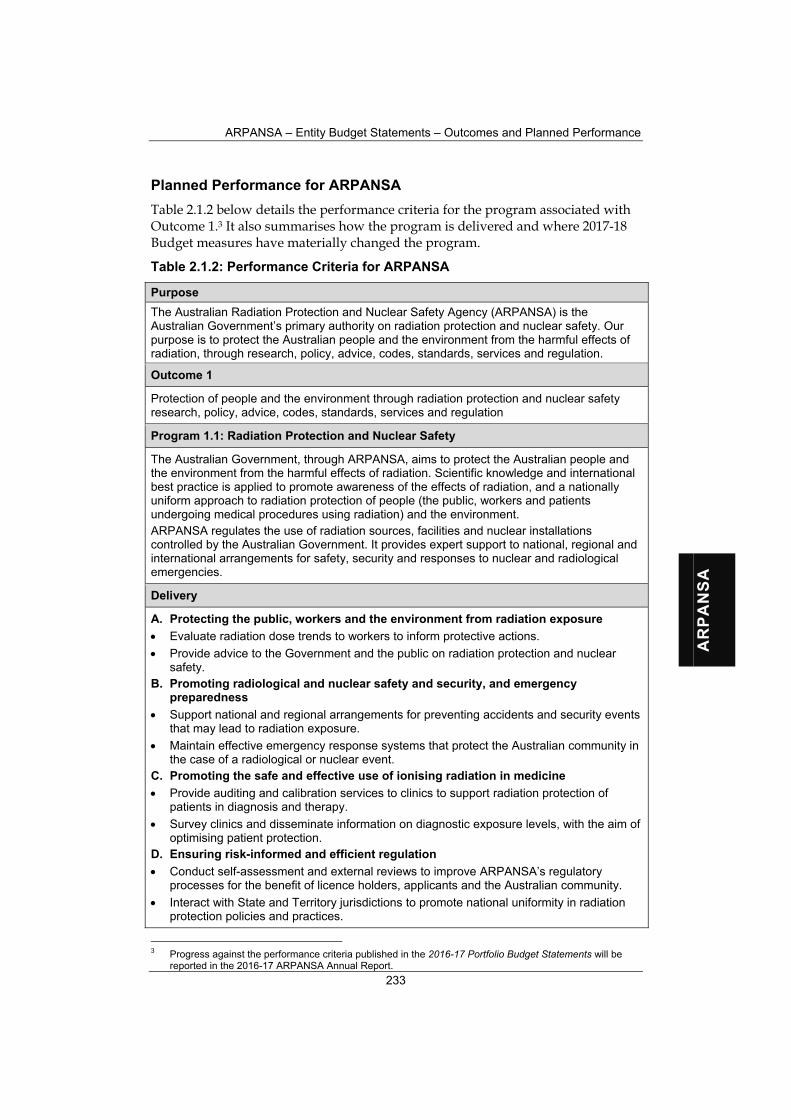
ARPANSA – Entity Budget Statements – Outcomes and Planned Performance
233
AR
PA
NS
A
Planned Performance for ARPANSA
Table 2.1.2 below details the performance criteria for the program associated with Outcome 1.3 It also summarises how the program is delivered and where 2017-18 Budget measures have materially changed the program.
Table 2.1.2: Performance Criteria for ARPANSA
Purpose
The Australian Radiation Protection and Nuclear Safety Agency (ARPANSA) is the Australian Government’s primary authority on radiation protection and nuclear safety. Our purpose is to protect the Australian people and the environment from the harmful effects of radiation, through research, policy, advice, codes, standards, services and regulation.
Outcome 1
Protection of people and the environment through radiation protection and nuclear safety research, policy, advice, codes, standards, services and regulation
Program 1.1: Radiation Protection and Nuclear Safety
The Australian Government, through ARPANSA, aims to protect the Australian people and the environment from the harmful effects of radiation. Scientific knowledge and international best practice is applied to promote awareness of the effects of radiation, and a nationally uniform approach to radiation protection of people (the public, workers and patients undergoing medical procedures using radiation) and the environment. ARPANSA regulates the use of radiation sources, facilities and nuclear installations controlled by the Australian Government. It provides expert support to national, regional and international arrangements for safety, security and responses to nuclear and radiological emergencies.
Delivery
A. Protecting the public, workers and the environment from radiation exposure
Evaluate radiation dose trends to workers to inform protective actions.
Provide advice to the Government and the public on radiation protection and nuclear safety.
B. Promoting radiological and nuclear safety and security, and emergency preparedness
Support national and regional arrangements for preventing accidents and security events that may lead to radiation exposure.
Maintain effective emergency response systems that protect the Australian community in the case of a radiological or nuclear event.
C. Promoting the safe and effective use of ionising radiation in medicine
Provide auditing and calibration services to clinics to support radiation protection of patients in diagnosis and therapy.
Survey clinics and disseminate information on diagnostic exposure levels, with the aim of optimising patient protection.
D. Ensuring risk-informed and efficient regulation
Conduct self-assessment and external reviews to improve ARPANSA’s regulatory processes for the benefit of licence holders, applicants and the Australian community.
Interact with State and Territory jurisdictions to promote national uniformity in radiation protection policies and practices.
3 Progress against the performance criteria published in the 2016-17 Portfolio Budget Statements will be
reported in the 2016-17 ARPANSA Annual Report.

ARPANSA – Entity Budget Statements – Outcomes and Planned Performance
234
Performance criteria
A. Protecting the public, workers and the environment from radiation exposure
Monitor radiation doses to occupationally exposed workers.4
2016-17 Estimated result 2017-18 Target 2018-19 (& beyond) Target
Achieved. Australian National Radiation Dose Register Annual Newsletter published September 2016.5
Annual reporting of trend in radiation doses received by workers, determined from quantitative dose measurement, provides evidence of optimisation of radiation protection.
As per 2017-18.
UV monitoring network data available to the public.6
2016-17 Estimated result
2017-18 Target
2018-19 Target
2019-20 Target
2020-21 Target
N/A7 >95% >95% >95% >95%
B. Promoting radiological and nuclear safety and security, and emergency preparedness
ARPANSA is prepared for a radiological or nuclear incident or emergency.
2016-17 Estimated result 2017-18 Target 2018-19 (& beyond) Target
Target on track to be met. Emergency preparedness and response systems for field, network and laboratory measurements, and information management and decision support systems are available, calibrated, tested and aligned with national planning.
As per 2017-18.
4 This measure refers to dose records captured in the Australian National Radiation Dose Register. 5 Australian National Radiation Dose Register Annual Newsletter can be found at:
www.arpansa.gov.au/pubs/Services/ANRDR/ANRDR_in_Review_Sep16.pdf 6 ARPANSA has a network of UV detectors in cities around Australia. The UV data is collected continuously
by detectors that respond to UV in a manner similar to human skin. Data is used to provide real-time and historical UV levels to inform the public when protective measures should be taken outdoors. Data is available at: www.arpansa.gov.au/uvindex/index.cfm
7 This is a new performance criterion for 2017-18, therefore there is no estimated result for 2016-17.

ARPANSA – Entity Budget Statements – Outcomes and Planned Performance
235
AR
PA
NS
A
C. Promoting the safe and effective use of ionising radiation in medicine
Number of Diagnostic Reference Level surveys per annual survey period.8
2016-17 Estimated result
2017-18 Target
2018-19 Target
2019-20 Target
2020-21 Target
1,507 >1,200 >1,400 >1,600 >1,600
Percentage of Australian radiotherapy providers subscribing to the national dosimetric auditing program provided by the Australian Clinical Dosimetry Service.
2016-17 Estimated result
2017-18 Target
2018-19 Target
2019-20 Target
2020-21 Target
>50% >50% >60% >70% >70%
Percentage of Australian radiotherapy providers covered by ARPANSA dose calibration services.
2016-17 Estimated result
2017-18 Target
2018-19 Target
2019-20 Target
2020-21 Target
>70% >70% >70% >70% >80%
8 The Australian National Diagnostic Reference Level Service provides individual facilities with a tool for
comparing their representative medical imaging patient dose metrics with the National Diagnostic Reference Levels (DRLs). The data from DRL surveys, collected over a calendar year from individual facilities, is collated and used to establish and update National DRLs for common diagnostic imaging procedures.

ARPANSA – Entity Budget Statements – Outcomes and Planned Performance
236
D. Ensuring risk-informed and efficient regulation
Monitor doses to radiation workers at licensed Commonwealth facilities and influence the doses in a downward manner.
2016-17 Estimated result 2017-18 Target 2018-19 (& beyond) Target
N/A9 The radiation doses of the 100 most exposed workers at licensed Commonwealth facilities trend downwards over time.
As per 2017-18.
Benchmark Australia’s radiation and nuclear safety framework against the International Atomic Energy Agency (IAEA) safety requirements, by means of an Integrated Regulatory Review Service (IRRS) mission to Australia.
2016-17 Estimated result 2017-18 Target 2018-19 (& beyond) Target
N/A10 Complete self-assessment of ARPANSA’s and participating States’ and Territories’ framework for radiation and nuclear safety, prepare draft action plan.
Receive Integrated Regulatory Review Service mission coordinated by International Atomic Energy Agency, finalise action plan and commence implementation.
Inspections are conducted in accordance with established inspection schedule.
2016-17 Estimated result
2017-18 Target
2018-19 Target
2019-20 Target
2020-21 Target
>85% >85% >85% >85% >85%
Material changes to Program 1.1 resulting from the following measures: There are no material changes to Program 1.1 resulting from measures.
9 This is a new performance criterion for 2017-18, therefore there is no estimated result for 2016-17. 10 Ibid.

ARPANSA – Entity Budget Statements – Budgeted Financial Statements
237
AR
PA
NS
A
Section 3: Budgeted Financial Statements
Section 3 presents budgeted financial statements which provide a comprehensive snapshot of entity finances for the 2017-18 Budget year, including the impact of Budget measures and resourcing on financial statements.
3.1 BUDGETED FINANCIAL STATEMENTS
3.1.1 Differences Between Entity Resourcing and Financial Statements
This section is not applicable to ARPANSA.
3.1.2 Explanatory Notes and Analysis of Budgeted Financial Statements
Departmental Resources
Comprehensive Income Statement
ARPANSA’s own sourced income is derived from the sale of scientific services such as the Personal Radiation Monitoring Service, the Comprehensive Nuclear-Test-Ban Treaty (CTBT) Organisation contracts to operate and maintain monitoring stations, and licence application fees and annual charges associated with ARPANSA’s regulatory activities.
For the 2017-18 and forward years ARPANSA is budgeting for a break even result after adjustment for unfunded depreciation and amortisation expenses.
Balance Sheet
ARPANSA’s total asset and liabilities are expected to remain stable over the forward years.
Cash Flow
Cash flows are consistent with projected income and expense, capital injections from Government and investments in property, plant and equipment.
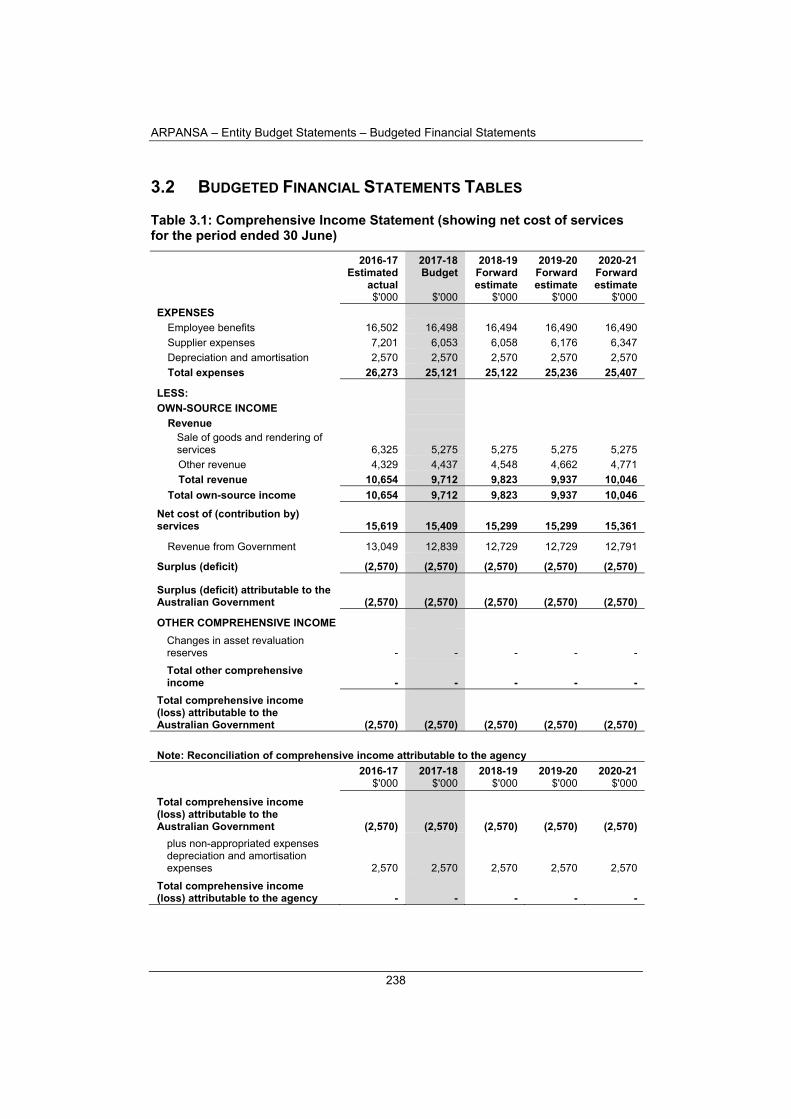
ARPANSA – Entity Budget Statements – Budgeted Financial Statements
238
3.2 BUDGETED FINANCIAL STATEMENTS TABLES
Table 3.1: Comprehensive Income Statement (showing net cost of services for the period ended 30 June)
2016-17Estimated
actual$'000
2017-18Budget
$'000
2018-19Forward estimate
$'000
2019-20 Forward estimate
$'000
2020-21 Forward estimate
$'000
EXPENSES
Employee benefits 16,502 16,498 16,494 16,490 16,490
Supplier expenses 7,201 6,053 6,058 6,176 6,347
Depreciation and amortisation 2,570 2,570 2,570 2,570 2,570
Total expenses 26,273 25,121 25,122 25,236 25,407
LESS:
OWN-SOURCE INCOME
Revenue Sale of goods and rendering of services 6,325 5,275 5,275 5,275 5,275
Other revenue 4,329 4,437 4,548 4,662 4,771
Total revenue 10,654 9,712 9,823 9,937 10,046
Total own-source income 10,654 9,712 9,823 9,937 10,046
Net cost of (contribution by) services 15,619 15,409 15,299 15,299 15,361
Revenue from Government 13,049 12,839 12,729 12,729 12,791
Surplus (deficit) (2,570) (2,570) (2,570) (2,570) (2,570)
Surplus (deficit) attributable to the Australian Government (2,570) (2,570) (2,570) (2,570) (2,570)
OTHER COMPREHENSIVE INCOME
Changes in asset revaluation reserves - - - - -
Total other comprehensive income - - - - -
Total comprehensive income (loss) attributable to the Australian Government (2,570) (2,570) (2,570) (2,570) (2,570)
Note: Reconciliation of comprehensive income attributable to the agency
2016-17 $'000
2017-18 $'000
2018-19 $'000
2019-20 $'000
2020-21 $'000
Total comprehensive income (loss) attributable to the Australian Government (2,570) (2,570) (2,570) (2,570) (2,570)
plus non-appropriated expenses depreciation and amortisation expenses 2,570 2,570 2,570 2,570 2,570
Total comprehensive income (loss) attributable to the agency - - - - -

ARPANSA – Entity Budget Statements – Budgeted Financial Statements
239
AR
PA
NS
A
Table 3.2: Budgeted Departmental Balance Sheet (as at 30 June)
2016-17Estimated
actual$'000
2017-18Budget
$'000
2018-19Forward estimate
$'000
2019-20 Forward estimate
$'000
2020-21 Forward estimate
$'000
ASSETS
Financial assets Cash and cash equivalents 1,210 1,210 1,210 1,210 1,210
Receivables 933 933 933 933 933
Accrued revenue 83 83 83 83 83
Total financial assets 2,226 2,226 2,226 2,226 2,226
Non-financial assets
Land and buildings 24,441 24,223 24,005 23,787 23,442
Property, plant and equipment 6,526 10,894 10,250 9,612 9,434
Inventories 1,533 1,533 1,533 1,533 1,533
Intangibles 1,248 1,483 1,718 1,953 1,941
Other 436 436 436 436 436
Total non-financial assets 34,184 38,569 37,942 37,321 36,786
Total assets 36,410 40,795 40,168 39,547 39,012
LIABILITIES
Payables
Suppliers - - - - -
Other payables 1,159 1,159 1,159 1,159 1,159
Total payables 1,159 1,159 1,159 1,159 1,159
Provisions
Employees 4,545 4,545 4,545 4,545 4,545
Total provisions 4,545 4,545 4,545 4,545 4,545
Total liabilities 5,704 5,704 5,704 5,704 5,704
Net assets 30,706 35,091 34,464 33,843 33,308
EQUITY
Contributed equity 21,606 28,561 30,504 32,453 34,488
Reserves 14,609 14,609 14,609 14,609 14,609 Retained surpluses (accumulated deficits) (5,509) (8,079) (10,649) (13,219) (15,789)
Total equity 30,706 35,091 34,464 33,843 33,308
Table 3.3: Departmental Statement of Changes in Equity – Summary of Movement (Budget year 2017-18)
Retained earnings
$'000
Asset revaluation
reserve $'000
Contributed equity/capital
$'000
Total equity
$'000
Opening balance as at 1 July 2017
Balance carried forward from previous period (5,509) 14,609 21,606 30,706
Surplus (deficit) for the period (2,570) - - (2,570)
Capital budget - Bill 1 (DCB) - - 1,955 1,955
Equity injection - appropriation - - 5,000 5,000
Estimated closing balance as at 30 June 2018 (8,079) 14,609 28,561 35,091
DCB = Departmental Capital Budget.
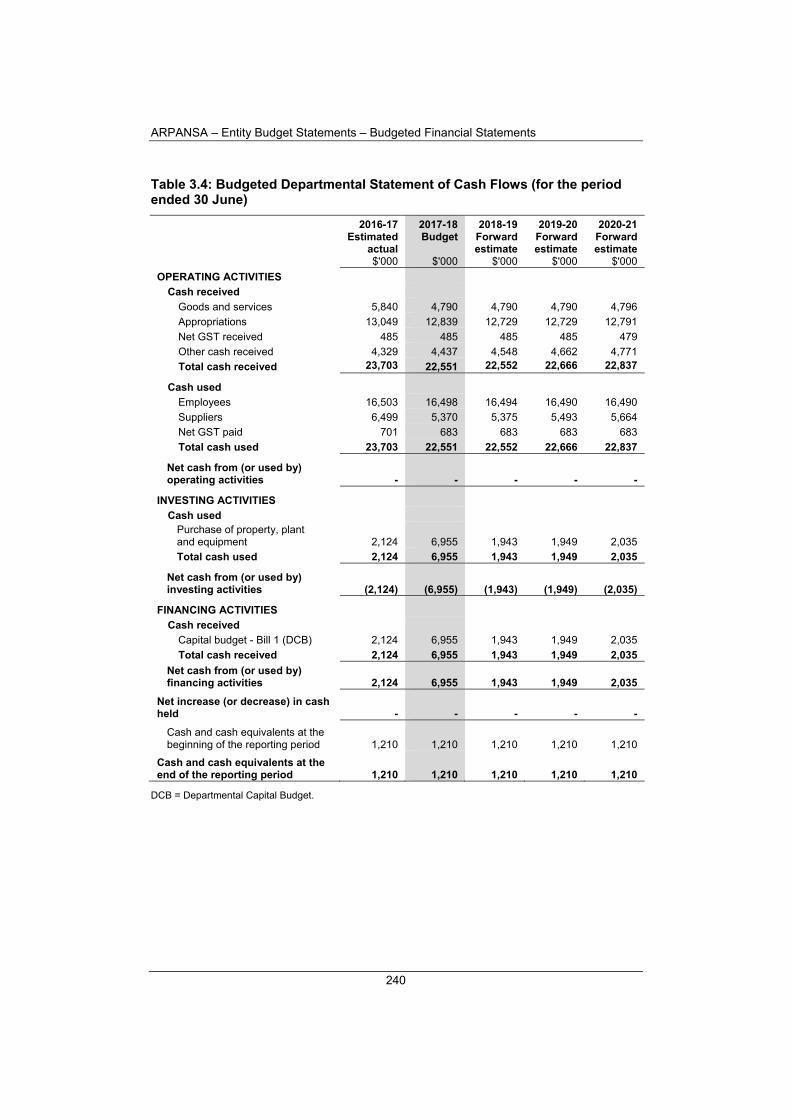
ARPANSA – Entity Budget Statements – Budgeted Financial Statements
240
Table 3.4: Budgeted Departmental Statement of Cash Flows (for the period ended 30 June)
2016-17Estimated
actual$'000
2017-18Budget
$'000
2018-19Forward estimate
$'000
2019-20 Forward estimate
$'000
2020-21 Forward estimate
$'000
OPERATING ACTIVITIES
Cash received
Goods and services 5,840 4,790 4,790 4,790 4,796
Appropriations 13,049 12,839 12,729 12,729 12,791
Net GST received 485 485 485 485 479
Other cash received 4,329 4,437 4,548 4,662 4,771
Total cash received 23,703 22,551 22,552 22,666 22,837
Cash used
Employees 16,503 16,498 16,494 16,490 16,490
Suppliers 6,499 5,370 5,375 5,493 5,664
Net GST paid 701 683 683 683 683
Total cash used 23,703 22,551 22,552 22,666 22,837
Net cash from (or used by) operating activities - - - - -
INVESTING ACTIVITIES
Cash used Purchase of property, plant and equipment 2,124 6,955 1,943 1,949 2,035
Total cash used 2,124 6,955 1,943 1,949 2,035
Net cash from (or used by) investing activities (2,124) (6,955) (1,943) (1,949) (2,035)
FINANCING ACTIVITIES
Cash received
Capital budget - Bill 1 (DCB) 2,124 6,955 1,943 1,949 2,035
Total cash received 2,124 6,955 1,943 1,949 2,035
Net cash from (or used by) financing activities 2,124 6,955 1,943 1,949 2,035
Net increase (or decrease) in cash held - - - - -
Cash and cash equivalents at the beginning of the reporting period 1,210 1,210 1,210 1,210 1,210
Cash and cash equivalents at the end of the reporting period 1,210 1,210 1,210 1,210 1,210
DCB = Departmental Capital Budget.

ARPANSA – Entity Budget Statements – Budgeted Financial Statements
241
AR
PA
NS
A
Table 3.5: Departmental Capital Budget Statement (for the period ended 30 June)
2016-17Estimated
actual$'000
2017-18Budget
$'000
2018-19Forward estimate
$'000
2019-20 Forward estimate
$'000
2020-21 Forward estimate
$'000
CAPITAL APPROPRIATIONS
Capital budget - Bill 1 (DCB) 2,124 1,955 1,943 1,949 2,035
Equity injections - Bill 2 - 5,000 - - -
Total capital appropriations 2,124 6,955 1,943 1,949 2,035
Total new capital appropriations represented by:
Purchase of non-financial assets 2,124 6,955 1,943 1,949 2,035
Total items 2,124 6,955 1,943 1,949 2,035
PURCHASE OF NON-FINANCIAL ASSETS
Funded by capital appropriation - 5,000 - - - Funded by capital appropriation - DCB (a) 2,124 1,955 1,943 1,949 2,035
Total acquisitions of non-financial assets 2,124 6,955 1,943 1,949 2,035
RECONCILIATION OF CASH USED TO ACQUIRE ASSETS TO ASSET MOVEMENT TABLE
Total purchases 2,124 6,955 1,943 1,949 2,035
Total cash used to acquire assets 2,124 6,955 1,943 1,949 2,035
(a) Does not include annual finance lease costs. Includes purchases from current and previous years' Departmental Capital Budget (DCB).

ARPANSA – Entity Budget Statements – Budgeted Financial Statements
242
Table 3.6: Statement of Asset Movements (Budget year 2017-18)
Land
$'000
Buildings
$'000
Other property, plant and
equipment $'000
Intangibles
$'000
Total
$'000
As at 1 July 2017
Gross book value 7,500 24,333 18,884 4,133 54,850
Accumulated depreciation/ amortisation and impairment - (7,392) (12,358) (2,885) (22,635)
Opening net book balance 7,500 16,941 6,526 1,248 32,215
CAPITAL ASSET ADDITIONS
Estimated expenditure on new or replacement assets
By purchase - appropriation ordinary annual services - 727 5,781 447 6,955
Total additions - 727 5,781 447 6,955
Other movements
Depreciation/amortisation expense - (945) (1,413) (212) (2,570)
Total other movements - (945) (1,413) (212) (2,570)
As at 30 June 2018
Gross book value 7,500 25,060 24,665 4,580 61,805
Accumulated depreciation/ amortisation and impairment - (8,337) (13,771) (3,097) (25,205)
Closing net book balance 7,500 16,723 10,894 1,483 36,600

243
AS
AD
A
AUSTRALIAN SPORTS ANTI-DOPING AUTHORITY
Entity Resources and Planned Performance

244

245
AS
AD
A
AUSTRALIAN SPORTS ANTI-DOPING AUTHORITY
Section 1: Entity Overview and Resources ...................................................... 246
1.1 Strategic Direction Statement ................................................................... 246
1.2 Entity Resource Statement ....................................................................... 247
1.3 Budget Measures ...................................................................................... 248
Section 2: Outcomes and Planned Performance ............................................. 249
2.1 Budgeted Expenses and Performance ..................................................... 249
Section 3: Budgeted Financial Statements ...................................................... 256
3.1 Budgeted Financial Statements ................................................................ 256
3.2 Budgeted Financial Statements Tables .................................................... 257
ASADA – Entity Budget Statements – Entity Overview and Resources
246
Section 1: Entity Overview and Resources
1.1 STRATEGIC DIRECTION STATEMENT1
The Australian Government, as a signatory to the United Nations Educational, Scientific and Cultural Organization (UNESCO) International Convention against Doping in Sport (the Convention), implements anti-doping arrangements that are consistent with the principles of the World Anti-Doping Code (the Code).
The Australian Sports Anti-Doping Authority (ASADA) is Australia’s national anti-doping agency.
ASADA provides a comprehensive anti-doping program for the Australian sports community, encompassing engagement, deterrence, detection and enforcement activities. ASADA does this by working with sports, athletes, support personnel and Government entities.
In 2017-18, ASADA will:
engage with sports to ensure compliance with their anti-doping obligations and support them to assist their athletes and support personnel to comply with their anti-doping responsibilities;
use technology to enhance its intelligence capabilities, risk methodologies and processes;
work collaboratively with partners to ensure athletes competing at major events, including the 2018 Gold Coast Commonwealth Games, are subject to the best anti-doping program available;
continue to improve its knowledge around the risk of doping in sport and better customise its responses to those risks, including more targeted education and awareness-raising; and
partner with stakeholders to maximise anti-doping interventions.
In the 2017-18 Budget, the Government will provide $0.8 million to ASADA from the agency sustainability stream of the Public Service Modernisation Fund.
The role and functions of ASADA are set out in the Australian Sports Anti-Doping Authority Act 2006, the Australian Sports Anti-Doping Authority Regulations 2006 and the National Anti-Doping scheme. ASADA is a Non-corporate Commonwealth Entity under the Public Governance, Performance and Accountability Act 2013.
1 For more information about the strategic direction of ASADA, refer to the current corporate plan, available
at: www.asada.gov.au/about-asada/corporate-information/corporate-plan-2016-17

ASADA – Entity Budget Statements – Entity Overview and Resources
247
AS
AD
A
1.2 ENTITY RESOURCE STATEMENT
Table 1.1 shows the total funding from all sources available to the entity for its operations and to deliver programs and services on behalf of the Government.
The table summarises how resources will be applied by outcome (Government strategic policy objectives) and by administered (on behalf of the Government or the public) and departmental (for the entity’s operations) classification.
For more detailed information on special accounts and special appropriations, please refer to Budget Paper No. 4 – Agency Resourcing.
Information in this table is presented on a resourcing (i.e. appropriations/cash available) basis, whilst the ‘Budgeted expenses by outcome’ tables in Section 2 and the financial statements in Section 3 are presented on an accrual basis.
Table 1.1: ASADA Resource Statement – Budget Estimates for 2017-18 as at Budget May 2017
2016-17 Estimated
actual $'000
2017-18 Estimate
$'000
DEPARTMENTAL
Prior year appropriation available (a) 5,789 6,289
Annual appropriations
Ordinary annual services
Departmental appropriation (b) 11,929 12,615 s74 retained revenue receipts (c) 2,483 4,269 Departmental capital budget (d) 371 372
Other services (e)
Equity injection - 826
Total departmental annual appropriations 14,783 18,082
Total departmental resourcing 20,572 24,371
Total resourcing for ASADA 20,572 24,371
2016-17 2017-18 Average staffing level (number) 49 50
All figures are GST exclusive. (a) Estimated adjusted balance carried forward from previous year. (b) Appropriation Bill (No. 1) 2017-18. (c) Estimated retained revenue receipts under section 74 of the PGPA Act 2013. (d) Departmental Capital Budgets (DCB) are not separately identified in Appropriation Bill (No. 1) and form
part of ordinary annual services items. Refer to Table 3.5 for further details. For accounting purposes, this amount has been designated as a 'contribution by owner'. (e) Appropriation Bill (No. 2) 2017-18.

ASADA – Entity Budget Statements – Entity Overview and Resources
248
1.3 BUDGET MEASURES
Budget measures in Part 1 relating to ASADA are detailed in Budget Paper No. 2 and are summarised below.
Table 1.2: ASADA 2017-18 Budget Measures
Program 2016-17 $'000
2017-18 $'000
2018-19 $'000
2019-20 $'000
2020-21 $'000
Gold Coast 2018 Commonwealth Games - additional Australian Government support (a)
Australian Sports Anti-Doping Authority
Departmental expenses 1.1 nfp nfp - - -
Departmental revenues 1.1 nfp nfp - - -
Total nfp nfp - - -
Whole of Government Measures
Public Service Modernisation Fund - agency sustainability
Australian Sports Anti-Doping Authority
Departmental capital 1.1 - - - - -
Total - - - - -
(a) ASADA is not the lead entity for this measure. Only ASADA impacts are shown in the table.

ASADA – Entity Budget Statements – Outcomes and Planned Performance
249
AS
AD
A
Section 2: Outcomes and Planned Performance
Government outcomes are the intended results, impacts or consequences of actions by the Government on the Australian community. Commonwealth programs are the primary vehicle by which Government entities achieve the intended results of their outcome statements. Entities are required to identify the programs which contribute to Government outcomes over the Budget and forward years.
Each outcome is described below together with its related programs. The following provides detailed information on expenses for each outcome and program, further broken down by funding source.
Note:
Performance reporting requirements in the Portfolio Budget Statements are part of the Enhanced Commonwealth Performance Framework established by the Public Governance, Performance and Accountability Act 2013. It is anticipated that the performance criteria described in Portfolio Budget Statements will be read with broader information provided in an entity’s corporate plans and annual performance statements – included in Annual Reports – to provide an entity’s complete performance story.
ASADA’s most recent corporate plan is available at: www.asada.gov.au/about-asada/corporate-information/corporate-plan-2016-17
ASADA’s most recent annual performance statement is available at: www.asada.gov.au/about-asada/corporate-information/annual-reports
2.1 BUDGETED EXPENSES AND PERFORMANCE
Outcome 1
Protection of the health of athletes and the integrity of Australian sport including through engagement, deterrence, detection and enforcement to minimise the risk of doping
Program Contributing to Outcome 1
Program 1.1: Engagement, Deterrence, Detection and Enforcement

ASADA – Entity Budget Statements – Outcomes and Planned Performance
250
Linked Programs
Other Commonwealth entities that contribute to Outcome 1
Department of Health Program 3.1: Sport and Recreation The Department of Health contributes to the collaborative effort to protect the integrity of Australian and international sport. The Department provides strategic leadership, policy oversight and program support on national and international anti-doping matters, working closely with ASADA, World Anti-Doping Agency (WADA), UNESCO and other stakeholders.
Australian Sports Commission Program 1.1: Australian Sports Commission The Australian Sports Commission (ASC) contributes to the collaborative effort to protect the integrity of Australian sport. The ASC provides targeted support and advice to sporting organisations in a range of areas, including governance and sports integrity.

ASADA – Entity Budget Statements – Outcomes and Planned Performance
251
AS
AD
A
Budgeted Expenses for ASADA
Table 2.1.1 shows how much the entity intends to spend (on an accrual basis) on achieving the outcome, broken down by program, as well as by administered and departmental funding sources.
Table 2.1.1: Budgeted Expenses for ASADA
2016-17 Estimated
actual$'000
2017-18 Budget
$'000
2018-19 Forward
Year 1$'000
2019-20 Forward
Year 2 $'000
2020-21 Forward
Year 3 $'000
Program 1.1: Engagement, Deterrence, Detection and Enforcement
Departmental expenses
Departmental appropriation (a) 14,202 16,707 13,314 13,364 13,419
Expenses not requiring appropriation 522 439 339 339 in the Budget year (b) 477
Operating deficit (surplus) (500) - - - -
Total for Program 1.1 14,179 17,229 13,753 13,703 13,758
Total expenses for Outcome 1 14,179 17,229 13,753 13,703 13,758
2016-17 2017-18
Average staffing level (number) 49 50
(a) Departmental appropriation combines 'Ordinary annual services (Appropriation Bill No. 1)' and 'Revenue from independent sources (s74)'.
(b) Expenses not requiring appropriation in the Budget year are made up of depreciation expense, amortisation expense, makegood expense and audit fees.

ASADA – Entity Budget Statements – Outcomes and Planned Performance
252
Planned Performance for ASADA
Table 2.1.2 below details the performance criteria for the program associated with Outcome 1.2 It also summarises how the program is delivered and where 2017-18 Budget measures have materially changed the program.
Table 2.1.2: Performance Criteria for ASADA
Purpose
To protect the health of athletes and the integrity of Australian sport through engagement, deterrence, detection and enforcement activities aimed at minimising the risk of doping.
Outcome 1
Protection of the health of athletes and the integrity of Australian sport including through engagement, deterrence, detection and enforcement to minimise the risk of doping
Program 1.1: Engagement, Deterrence, Detection and Enforcement
The Australian Government, through ASADA, aims to achieve clean sport through a balanced mix of prevention, detection and enforcement activities. In the 2017-18 Budget, the Government will provide $0.8 million to ASADA from the agency sustainability stream of the Public Service Modernisation Fund.
Delivery
A. Engagement Strengthening relationships internally and externally to build anti-doping capabilities and hardening the environment against doping in sport
Support athletes and athlete support personnel to meet their anti-doping obligations.
Work with national sporting organisations to help them minimise the threat of doping in sport.
Contribute to the reform of the global anti-doping framework and share expertise at international anti-doping forums.
B. Deterrence Minimising the risk of doping in Australian sport through education, communications and testing activities
Design and deliver education and communications programs.
Work with sporting organisations to help them develop and implement education programs relevant to the needs of their sport.
Conduct no-advance notice testing of athletes.
C. Detection Gathering intelligence and investigating possible breaches of the anti-doping rules by athletes and support personnel
Conduct intelligence risk assessment functions to detect the highest doping threats through enhanced relationships and collaborations with sports, law enforcement agencies and regulators within Australia and anti-doping organisations internationally.
Monitor and report on sports’ compliance with anti-doping policies.
D. Enforcement Managing possible anti-doping violations by athletes and athlete support personnel
Manage the presentation of cases of possible anti-doping rule violations at sport tribunal hearings.
2 Progress against the performance criteria published in the 2016-17 Portfolio Budget Statements will be
reported in the 2016-17 ASADA Annual Report.

ASADA – Entity Budget Statements – Outcomes and Planned Performance
253
AS
AD
A
Performance criteria
A. Engagement Strengthening relationships internally and externally to build anti-doping capabilities and hardening the environment against doping in sport
Achievement of ASADA legislation and Code awareness amongst sporting organisations, athletes and support personnel. a. Percentage of sporting organisations, athletes and support personnel aware of ASADA
legislation and the Code. b. Percentage of sporting organisations, athletes and support personnel aware of their
rights and responsibilities in relation to anti-doping.
2016-17 Estimated result
2017-18 Target
2018-19 Target
2019-20 Target
2020-21 Target
a. 97% level of awareness
80% level of awareness
80% level of awareness
80% level of awareness
80% level of awareness
b. 90% level of awareness
80% level of awareness
80% level of awareness
80% level of awareness
80% level of awareness
Achievement in working with stakeholders to reduce the risk of doping in sport.
2016-17 Estimated result 2017-18 Target 2018-19 (& beyond) Target
Engaged with a range of stakeholders to develop anti-doping programs aimed at reducing the risk of doping in sport, including (but not limited to) targeted or co-authored anti-doping education programs and the development of testing programs based on risk and intelligence assessments.
Engage with a range of stakeholders to develop anti-doping programs aimed at reducing the risk of doping in sport.
As per 2017-18.

ASADA – Entity Budget Statements – Outcomes and Planned Performance
254
B. Deterrence Minimising the risk of doping in Australian sport through education, communications and testing activities.
Achievement of satisfaction with anti-doping education and awareness raising activities in the sporting community. a. Percentage of national sporting organisations, athletes and support personnel who are
satisfied with anti-doping education and awareness raising programs. b. Percentage of athletes agreeing that ASADA’s education and information services had
minimised their risk of an accidental breach of the anti-doping regulations. c. Percentage of stakeholders who rate ASADA’s testing activities as an effective way to
deter athletes and support personnel from doping.
2016-17 Estimated result
2017-18 Target
2018-19 Target
2019-20 Target
2020-21 Target
a. 88% level of satisfaction
80% level of satisfaction
80% level of satisfaction
80% level of satisfaction
80% level of satisfaction
b. 88% level of agreement
80% level of agreement
80% level of agreement
80% level of agreement
80% level of agreement
c. 80% level of agreement
80% level of agreement
80% level of agreement
80% level of agreement
80% level of agreement
C. Detection Gathering intelligence and investigating possible breaches of the anti-doping rules by athletes and support personnel
Achievement in maintaining relevant intelligence flows to and from third parties.
2016-17 Estimated result 2017-18 Target 2018-19 Target
Enhanced intelligence and detection capabilities, and collaboration with stakeholders from sport, Government agencies and law enforcement that assist to minimise the risk of doping in sport.
Enhance intelligence and detection capabilities, and collaboration with stakeholders to minimise the risk of doping in sport.
As per 2017-18.

ASADA – Entity Budget Statements – Outcomes and Planned Performance
255
AS
AD
A
D. Enforcement Managing possible anti-doping violations by athletes and athlete support personnel
Achievement of anti-doping rule violation findings in tribunals. a. Percentage of cases conducted by ASADA in tribunals that result in a finding of an
anti-doping rule violation.
2016-17 Estimated result
2017-18 Target
2018-19 Target
2019-20 Target
2020-21 Target
a. 100% of tribunal findings result in an anti-doping rule violation.
80% of tribunal findings result in an anti-doping rule violation.
80% of tribunal findings result in an anti-doping rule violation.
80% of tribunal findings result in an anti-doping rule violation.
80% of tribunal findings result in an anti-doping rule violation.
Material changes to Program 1.1 resulting from the following measures: There are no material changes to Program 1.1 resulting from measures.
ASADA – Entity Budget Statements – Budgeted Financial Statements
256
Section 3: Budgeted Financial Statements
Section 3 presents budgeted financial statements which provide a comprehensive snapshot of entity finances for the 2017-18 Budget year, including the impact of Budget measures and resourcing on financial statements.
3.1 BUDGETED FINANCIAL STATEMENTS
3.1.1 Differences Between Entity Resourcing and Financial Statements
This section is not applicable to ASADA.
3.1.2 Explanatory Notes and Analysis of Budgeted Financial Statements
Departmental Resources
Comprehensive Income Statement
ASADA is budgeting for comprehensive income result attributable to the agency of $0.5 million in 2016-17 after adjustment for unfunded depreciation and amortisation expenses. The comprehensive income result is primarily attributable to higher than anticipated revenue from rendering of services.
For the 2017-18 Budget year and the forward estimates, ASADA is budgeting for a break even comprehensive income result attributable to the agency after adjustment for unfunded depreciation and amortisation expenses.
Total operating revenue for 2017-18 is estimated at $16.7 million and comprises appropriation funding for ordinary annual services of $12.6 million and revenue from independent sources of $4.1 million, primarily comprised of revenue from contracted testing services.
Total expenses in 2017-18 are anticipated to be $17.2 million including $0.5 million in unfunded depreciation and amortisation costs.
Balance Sheet
No significant movements are expected in assets or liabilities over the forward estimates period.

ASADA – Entity Budget Statements – Budgeted Financial Statements
257
AS
AD
A
3.2 BUDGETED FINANCIAL STATEMENTS TABLES
Table 3.1: Comprehensive Income Statement (showing net cost of services for the period ended 30 June)
2016-17 Estimated
actual$'000
2017-18Budget
$'000
2018-19 Forward estimate
$'000
2019-20 Forward estimate
$'000
2020-21 Forward estimate
$'000
EXPENSES
Employee benefits 6,748 7,838 6,820 7,034 7,034
Supplier expenses 6,958 8,873 6,498 6,334 6,389
Depreciation and amortisation 443 488 405 305 305
Other expenses 30 30 30 30 30
Total expenses 14,179 17,229 13,753 13,703 13,758
LESS:
OWN-SOURCE INCOME
Revenue
Sale of goods and rendering of services 2,273 4,092 1,822 1,876 1,876
Total revenue 2,273 4,092 1,822 1,876 1,876
Gains
Other 34 34 34 34 34
Total gains 34 34 34 34 34
Total own-source income 2,307 4,126 1,856 1,910 1,910
Net cost of (contribution by) services 11,872 13,103 11,897 11,793 11,848
Revenue from Government 11,929 12,615 11,492 11,488 11,543
Surplus (deficit) 57 (488) (405) (305) (305)
Surplus (deficit) attributable to the Australian Government 57 (488) (405) (305) (305)
OTHER COMPREHENSIVE INCOME
Changes in asset revaluation reserves - - - - -
Total other comprehensive income - - - - -
Total comprehensive income attributable to the Australian Government 57 (488) (405) (305) (305)
Note: Reconciliation of comprehensive income attributable to the agency
2016-17 $'000
2017-18 $'000
2018-19 $'000
2019-20 $'000
2020-21 $'000
Total comprehensive income (loss) attributable to the Australian Government 57 (488) (405) (305) (305)
plus non-appropriated expenses depreciation and amortisation expenses 443 488 405 305 305
Total comprehensive income (loss) attributable to the agency 500 - - - -

ASADA – Entity Budget Statements – Budgeted Financial Statements
258
Table 3.2: Budgeted Departmental Balance Sheet (as at 30 June)
2016-17 Estimated
actual$'000
2017-18Budget
$'000
2018-19 Forward estimate
$'000
2019-20 Forward estimate
$'000
2020-21 Forward estimate
$'000
ASSETS
Financial assets
Cash and cash equivalents 93 93 93 93 93
Receivables 7,529 6,879 6,879 6,879 6,879
Total financial assets 7,622 6,972 6,972 6,972 6,972
Non-financial assets
Land and buildings 53 1,229 1,114 999 884
Property, plant and equipment 525 719 709 801 909
Intangibles 163 153 243 333 423
Inventories 114 114 114 114 114
Other 112 112 112 112 112
Total non-financial assets 967 2,327 2,292 2,359 2,442
Total assets 8,589 9,299 9,264 9,331 9,414
LIABILITIES
Payables
Suppliers 1,119 1,119 1,119 1,119 1,119
Other payables 679 679 679 679 679
Total payables 1,798 1,798 1,798 1,798 1,798
Provisions
Employees 2,449 2,449 2,449 2,449 2,449
Other provisions 101 101 101 101 101
Total provisions 2,550 2,550 2,550 2,550 2,550
Total liabilities 4,348 4,348 4,348 4,348 4,348
Net assets 4,241 4,951 4,916 4,983 5,066
EQUITY
Contributed equity 3,460 4,658 5,028 5,400 5,788
Reserves 253 253 253 253 253
Retained surpluses (accumulated deficits) 528 40 (365) (670) (975)
Total equity 4,241 4,951 4,916 4,983 5,066

ASADA – Entity Budget Statements – Budgeted Financial Statements
259
AS
AD
A
Table 3.3: Departmental Statement of Changes in Equity – Summary of Movement (Budget year 2017-18)
Retained earnings
$'000
Asset revaluation
reserve $'000
Contributed equity/capital
$'000
Total equity
$'000
Opening balance as at 1 July 2017
Balance carried forward from previous period 528 253 3,460 4,241
Surplus (deficit) for the period (488) - - (488)
Equity injection - appropriations 826 826
Departmental capital budget - - 372 372
Estimated closing balance as at 30 June 2018 40 253 4,658 4,951

ASADA – Entity Budget Statements – Budgeted Financial Statements
260
Table 3.4: Budgeted Departmental Statement of Cash Flows (for the period ended 30 June)
2016-17 Estimated
actual$'000
2017-18Budget
$'000
2018-19 Forward estimate
$'000
2019-20 Forward estimate
$'000
2020-21 Forward estimate
$'000
OPERATING ACTIVITIES
Cash received
Appropriations 11,429 13,265 11,492 11,488 11,543
Goods and services 2,483 4,269 2,004 2,064 2,064
Net GST received 481 589 468 445 451
Total cash received 14,393 18,123 13,964 13,997 14,058
Cash used
Employees 6,748 7,838 6,820 7,034 7,034
Suppliers 6,924 8,839 6,464 6,300 6,355
Net GST paid 691 766 650 633 639
Other cash used 30 30 30 30 30
Total cash used 14,393 17,473 13,964 13,997 14,058
Net cash from (or used by) operating activities - 650 - - -
INVESTING ACTIVITIES
Cash used
Purchase of property, plant and equipment 371 1,848 370 372 388
Total cash used 371 1,848 370 372 388
Net cash from (or used by) investing activities (371) (1,848) (370) (372) (388)
FINANCING ACTIVITIES
Cash received
Capital injections 371 1,198 370 372 388
Total cash received 371 1,198 370 372 388
Net cash from (or used by) financing activities 371 1,198 370 372 388
Net increase (or decrease) in cash held - - - - -
Cash and cash equivalents at the beginning of the reporting period 93 93 93 93 93
Cash and cash equivalents at the end of the reporting period 93 93 93 93 93

ASADA – Entity Budget Statements – Budgeted Financial Statements
261
AS
AD
A
Table 3.5: Departmental Capital Budget Statement (for the period ended 30 June)
2016-17 Estimated
actual$'000
2017-18Budget
$'000
2018-19 Forward estimate
$'000
2019-20 Forward estimate
$'000
2020-21 Forward estimate
$'000
CAPITAL APPROPRIATIONS
Equity injections - Bill 2 - 826 - - -
Capital budget - Bill 1 (DCB) 371 372 370 372 388
Total capital appropriations 371 1,198 370 372 388
Total new capital appropriations represented by:
Purchase of non-financial assets 371 1,198 370 372 388
Total items 371 1,198 370 372 388
PURCHASE OF NON-FINANCIAL ASSETS
Funded by capital appropriations - equity injection (a) - 826 - - -
Funded internally from departmental resources - 650 - - -
Funded by capital appropriation - DCB (b) 371 372 370 372 388
Total acquisitions of non-financial assets 371 1,848 370 372 388
RECONCILIATION OF CASH USED TO ACQUIRE ASSETS TO ASSET MOVEMENT TABLE
Total purchases 371 1,848 370 372 388
Total cash used to acquire assets 371 1,848 370 372 388
(a) Includes both current Bill 2, prior Act 2/4/6 appropriations and special capital appropriations. (b) Does not include annual finance lease costs. Includes purchases from current and previous years'
Departmental Capital Budget (DCB).

ASADA – Entity Budget Statements – Budgeted Financial Statements
262
Table 3.6: Statement of Asset Movements (Budget year 2017-18)
Buildings
$'000
Other property,plant and
equipment $'000
Intangibles
$'000
Total
$'000
As at 1 July 2017
Gross book value 293 618 2,573 3,484
Accumulated depreciation/ amortisation and impairment (240) (93) (2,410) (2,743)
Opening net book balance 53 525 163 741
CAPITAL ASSET ADDITIONS
Estimated expenditure on new or replacement assets
By purchase - appropriation equity 426 350 50 826
By purchase - appropriation ordinary annual services 250 72 50 372
By purchase - other 650 - - 650
Total additions 1,326 422 100 1,848
Other movements
Depreciation/amortisation expense (150) (228) (110) (488)
Total other movements (150) (228) (110) (488)
As at 30 June 2018
Gross book value 1,619 1,040 2,673 5,332
Accumulated depreciation/ amortisation and impairment (390) (321) (2,520) (3,231)
Closing net book balance 1,229 719 153 2,101

263
AS
C
AUSTRALIAN SPORTS
COMMISSION
Entity Resources and Planned Performance

264

265
AS
C
AUSTRALIAN SPORTS
COMMISSION
Section 1: Entity Overview and Resources ...................................................... 266
1.1 Strategic Direction Statement ................................................................... 266
1.2 Entity Resource Statement ....................................................................... 268
1.3 Budget Measures ...................................................................................... 269
Section 2: Outcomes and Planned Performance ............................................. 270
2.1 Budgeted Expenses and Performance ..................................................... 270
Section 3: Budgeted Financial Statements ...................................................... 276
3.1 Budgeted Financial Statements ................................................................ 276
3.2 Budgeted Financial Statements Tables .................................................... 277

ASC – Entity Budget Statements – Entity Overview and Resources
266
Section 1: Entity Overview and Resources
1.1 STRATEGIC DIRECTION STATEMENT1
The Australian Sports Commission (ASC) is committed to making Australian sport stronger – to get more people playing sport and to help athletes realise international success. The ASC promotes and supports the development of a cohesive and effective national sport sector that creates opportunities for all Australians to participate and excel in sport.
Two broad strategic documents Australia’s Winning Edge 2012-2022 and Play.Sport.Australia. provide the framework for the ASC’s operations, and a context for the strategic pillars of the ASC’s corporate plan. The pillars of win, play and thrive define the ASC’s approach to delivering international success, more participation and sustainable sporting organisations.
Australia’s Winning Edge 2012-2022 is the national high performance strategy; it is the blueprint for Australia’s high performance success and provides the high performance sport sector with clear performance targets and a framework for collaboration.
The Australian Institute of Sport (AIS), a division of the ASC, is Australia’s strategic high performance sport agency, responsible for leading the delivery of Australia’s international sporting success. The AIS works in partnership with national sporting organisations (NSOs), state institutes and academies of sport, and peak bodies such as the Australian Olympic Committee, Australian Paralympic Committee and the Australian Commonwealth Games Association.
In the lead up to the 2018 Gold Coast Commonwealth Games, the Government will commit an additional $15.5 million in the 2017-18 Budget to maintain sporting grants and services for more than 2,000 aspiring and high performing athletes.
Play.Sport.Australia. articulates priority action areas to address the challenges of keeping sports relevant and viable and keeping Australians active and healthy through sport.
Grass roots sport is fundamental to the Australian way of life with tens of thousands of sporting organisations across Australia and thousands of private-sector providers. The ASC aims to use its unique position of influence as well as its leadership role to inform, support and create alignment through the sport sector to achieve the collective national goal of participation growth.
A key focus in 2017-18 will be the continued delivery and expansion of the Sporting Schools program, with funding and support for schools and partnerships with national sporting organisations to deliver free quality sporting experiences to students. The expanded program will include an increased focus on secondary schools, particularly students in years seven and eight.
1 For more information about the strategic direction of the ASC, refer to the current corporate plan, available
at: www.ausport.gov.au/about

ASC – Entity Budget Statements – Entity Overview and Resources
267
AS
C
In addition, the Government will provide $0.4 million, to the ASC from the agency sustainability stream of the Public Service Modernisation Fund.
The role and functions of the ASC are set out in the Australian Sports Commission Act 1989. The ASC is a Corporate Commonwealth Entity under the Public Governance, Performance and Accountability Act 2013.

ASC – Entity Budget Statements – Entity Overview and Resources
268
1.2 ENTITY RESOURCE STATEMENT
Table 1.1 shows the total funding from all sources available to the entity for its operations and to deliver programs and services on behalf of the Government.
The table summarises how resources will be applied by outcome (Government strategic policy objectives) and by administered (on behalf of the Government or the public) and departmental (for the entity’s operations) classification.
For more detailed information on special accounts and special appropriations, please refer to Budget Paper No. 4 – Agency Resourcing.
Information in this table is presented on a resourcing (i.e. appropriations/cash available) basis, whilst the ‘Budgeted expenses by outcome’ tables in Section 2 and the financial statements in Section 3 are presented on an accrual basis.
Table 1.1: ASC Resource Statement – Budget Estimates for 2017-18 as at Budget May 2017
2016-17Estimated
actual$'000
2017-18 Estimate
$'000
Opening balance/cash reserves at 1 July (a) 75,842 72,127
Funds from Government
Annual appropriations
Ordinary annual services (b)
Outcome 1 250,669 264,595
Other services (c)
Equity injection - 1,069
Total annual appropriations 250,669 265,664
Funds from other sources
Interest 2,500 2,250
Sale of goods and services 34,612 21,422
Other 276 1,129
Total funds from other sources 37,388 24,801
Total net resourcing for ASC 363,899 362,592
2016-17 2017-18
Average staffing level (number) 570 570
All figures are GST exclusive. The ASC is not directly appropriated as it is a corporate Commonwealth entity. Appropriations are made to the Department of Health, which are then paid to the ASC and are considered 'departmental' for all purposes. (a) Includes cash and investments. (b) Appropriation Bill (No. 1) 2017-18. (c) Appropriation Bill (No. 2) 2017-18.

ASC – Entity Budget Statements – Entity Overview and Resources
269
AS
C
1.3 BUDGET MEASURES
Budget measures in Part 1 relating to the ASC are detailed in Budget Paper No. 2 and are summarised below.
Table 1.2: ASC 2017-18 Budget Measures
Program 2016-17 $'000
2017-18 $'000
2018-19 $'000
2019-20 $'000
2020-21 $'000
Gold Coast 2018 Commonwealth Games - support for athletes
Australian Sports Commission
Departmental expenses 1.1 - 15,500 - - -
Total expenses - 15,500 - - -
Sporting Schools Program - extension (a)
Australian Sports Commission
Departmental expenses 1.1 - 39,008 19,490 - -
Departmental capital 1.1 - 1,069 - - -
Total - 40,077 19,490 - -
Whole of Government Measures
Public Service Modernisation Fund - agency sustainability
Australian Sports Commission
Departmental expenses 1.1 - - - - -
Total expenses - - - - -
(a) This measure was announced in the 2016-17 MYEFO.

ASC – Entity Budget Statements – Outcomes and Planned Performance
270
Section 2: Outcomes and Planned Performance
Government outcomes are the intended results, impacts or consequences of actions by the Government on the Australian community. Commonwealth programs are the primary vehicle by which Government entities achieve the intended results of their outcome statements. Entities are required to identify the programs which contribute to Government outcomes over the Budget and forward years.
Each outcome is described below together with its related programs. The following provides detailed information on expenses for each outcome and program, further broken down by funding source.
Note:
Performance reporting requirements in the Portfolio Budget Statements are part of the Enhanced Commonwealth Performance Framework established by the Public Governance, Performance and Accountability Act 2013. It is anticipated that the performance criteria described in Portfolio Budget Statements will be read with broader information provided in an entity’s corporate plans and annual performance statements – included in Annual Reports – to provide an entity’s complete performance story.
The ASC’s most recent corporate plan is available at: www.ausport.gov.au/__data/assets/pdf_file/0004/651784/Australian_Sports_Commission_Corporate_Plan_2016-20.pdf
The ASC’s most recent annual performance statement is available at: www.ausport.gov.au/annual_report
2.1 BUDGETED EXPENSES AND PERFORMANCE
Outcome 1
Increased participation in organised sport and continued international sporting success including through leadership and development of a cohesive and effective sports sector, provision of targeted financial support, and the operation of the Australian Institute of Sport
Program Contributing to Outcome 1
Program 1.1: Australian Sports Commission

ASC – Entity Budget Statements – Outcomes and Planned Performance
271
AS
C
Linked Programs
Other Commonwealth entities that contribute to Outcome 1
Australian Sports Anti-Doping Authority Program 1.1: Engagement, Deterrence, Detection and Enforcement The Australian Sports Anti-Doping Authority (ASADA) contributes to the protection of the health of athletes, and the integrity of sport, by conducting World Anti-Doping Code compliant activities domestically. ASADA also contributes to international efforts to combat doping in sport.
Department of Health Program 3.1: Sport and Recreation The Department of Health aims to increase participation in sport and recreation activities, support major international sporting events, improve water and snow safety, and protect the integrity of sport.
Department of the Prime Minister and Cabinet Program 1.1: Prime Minister and Cabinet The Department of the Prime Minister and Cabinet contributes to improving the diversity of sporting organisations by working to increase female representation in sport leadership roles.

ASC – Entity Budget Statements – Outcomes and Planned Performance
272
Budgeted Expenses for the ASC
Table 2.1.1 shows how much the entity intends to spend (on an accrual basis) on achieving the outcome, broken down by program, as well as by administered and departmental funding sources.
Table 2.1.1: Budgeted Expenses for the ASC
2016-17 Estimated
actual$'000
2017-18Budget
$'000
2018-19 Forward
Year 1$'000
2019-20 Forward
Year 2 $'000
2020-21 Forward
Year 3 $'000
Program 1.1: Australian Sports Commission
Revenue from Government
Ordinary annual services (a) 250,669 264,595 227,557 207,942 209,083 Revenues from independent sources 37,260 23,806 22,898 22,438 22,312
Operating deficit (surplus) 7,858 8,386 8,857 8,958 8,958
Total for Program 1.1 295,787 296,787 259,312 239,338 240,353
Total expenses for Outcome 1 295,787 296,787 259,312 239,338 240,353
2016-17 2017-18
Average staffing level (number) 570 570
(a) Appropriation Bill (No. 1) 2017-18.

ASC – Entity Budget Statements – Outcomes and Planned Performance
273
AS
C
Planned Performance for the ASC
Table 2.1.2 below details the performance criteria for the program associated with Outcome 1.2 It also summarises how the program is delivered and where 2017-18 Budget measures have materially changed the program.
Table 2.1.2: Performance Criteria for the ASC
Purpose
To strengthen Australian sport – to enable more people to play sport and Australian athletes and teams to succeed on the world stage.
Outcome 1
Increased participation in organised sport and continued international sporting success including through leadership and development of a cohesive and effective sports sector, provision of targeted financial support, and the operation of the Australian Institute of Sport
Program 1.1: Australian Sports Commission
The ASC aims to increase participation in sport, improve the sustainability of sporting organisations, and deliver continued success for Australian athletes and teams on the world stage. In the lead up to the 2018 Gold Coast Commonwealth Games, the Government will commit an additional $15.5 million in the 2017-18 Budget to maintain sporting grants and services for more than 2,000 aspiring and high performing athletes. In addition, the Government will provide $0.4 million, to the ASC from the agency sustainability stream of the Public Service Modernisation Fund.
Delivery
A. Delivering international sporting success
Provide targeted investment to National Sporting Organisations (NSOs) and athletes that demonstrate the greatest chance of short, medium and long-term success.
Provide support and advice to assist NSOs with high performance strategy, planning and program delivery.
Develop and deliver customised athlete, coach and leader talent initiatives to optimise high performance outcomes.
Plan, coordinate and deliver sport science and sports medicine expertise to ensure Australia’s athletes get the right support at the right time.
Support innovative solutions to enhance Australia’s competitive advantage for prioritised sports and promote the growth of new knowledge and expertise for high performance sport.
B. Increasing participation in sport
Provide targeted investment to NSOs to help them grow their participation base.
Provide services and support that assists NSOs with participation strategies, planning and operations.
Develop and share high quality information, research and data to better understand what is happening in sport.
Drive demand for lifelong participation in sport by focussing on younger Australians through the Sporting Schools program.
2 Progress against the performance criteria published in the 2016-17 Portfolio Budget Statements will be
reported in the 2016-17 ASC Annual Report.

ASC – Entity Budget Statements – Outcomes and Planned Performance
274
C. Improving the sustainability of sports
Provide support to sporting bodies to improve their governance and enhance alignment of systems and behaviours through national, state and territory levels.
Develop and deliver sector initiatives to optimise coach, official and leader talent.
Assist sports to develop relevant products and identify commercial opportunities to improve their financial sustainability.
Assist sports to develop their digital capacity to ensure they are connecting with their customers and utilising technology to support growth and innovation.
Support sports to build their capability and strengthen integrity frameworks to deliver safe, fair and inclusive sporting environments.
Performance criteria
A. Delivering international sporting success
Improved capability of national sporting organisations to deliver effective high performance programs.
2016-17 Estimated result 2017-18 Target 2018-19 (& beyond) Target
On track to be achieved. The Annual Sports Performance Review shows improvement in the high performance capability of national sporting organisations, compared to previous year’s results.
As per 2017-18.
B. Increasing participation in sport
Increase in the percentage of Australians participating in organised sport (traditional or social).
2016-17 Estimated result 2017-18 Target 2018-19 (& beyond) Target
Sport participation baseline established through AusPlay survey.
AusPlay survey results show an increase in sport participation compared to previous year.
As per 2017-18.
Number of student attendances in the Sporting Schools program.
2016-17 Estimated result
2017-18 Target
2018-19 Target
2019-20 Target
2020-21 Target
On track to be achieved.
≥750,0003 ≥1,100,0004 N/A5 N/A
3 The Sporting Schools program has been extended for an 18 month period from 1 July 2017–31 December
2018. The program will expand to include secondary schools with a focus on females and inactive children.
4 Target represents the cumulative total for the extended program 1 July 2017–31 December 2018. 5 Funding for this program ceases as at 31 December 2018.

ASC – Entity Budget Statements – Outcomes and Planned Performance
275
AS
C
C. Improving the sustainability of sports
Improved organisational capability of national sporting organisations.
2016-17 Estimated result 2017-18 Target 2018-19 (& beyond) Target
Baseline of organisational capability established.
The organisational development assessment shows improvement in the organisational capability of targeted national sporting organisations, compared to the previous year.
As per 2017-18.
Material changes to Program 1.1 resulting from the following measures: There are no material changes to Program 1.1 resulting from measures.

ASC – Entity Budget Statements – Budgeted Financial Statements
276
Section 3: Budgeted Financial Statements
Section 3 presents budgeted financial statements which provide a comprehensive snapshot of entity finances for the 2017-18 Budget year, including the impact of Budget measures and resourcing on financial statements.
3.1 BUDGETED FINANCIAL STATEMENTS
3.1.1 Differences Between Entity Resourcing and Financial Statements
The agency resource statement (Table 1.1) provides a consolidated view of all the resources available in 2017-18. This includes operating appropriation, funds from other sources and cash and investments to cover payables and provisions on the balance sheet. Operating appropriation is shown as Revenue from Government in the comprehensive income statement (Table 3.1).
3.1.2 Explanatory Notes and Analysis of Budgeted Financial Statements
Departmental Resources
Comprehensive Income Statement
The ASC is budgeting for an operating loss of $7.9 million in 2016-17 mainly arising from: (i) additional and unfunded depreciation expense reflecting revaluations of assets; and (ii) timing differences across financial years as to when revenue is received and when expenditure for certain activities occurs.
The ASC is budgeting for an operating loss for the 2017-18 Budget year and three forward estimates arising from additional and unfunded depreciation expense reflecting the revaluations of assets.
Since the 2016-17 PB Statements were published, the 2017-18 revenue from Government estimate (and associated costs) has increased by $51.6 million primarily reflecting the measures shown in Table 1.2 including: Sporting Schools Program – extension ($39.0 million), Gold Coast 2018 Commonwealth Games – support for athletes ($15.5 million) and the Public Service Modernisation Fund – agency sustainability ($0.4 million).
Balance Sheet
Total assets at 30 June 2018 are anticipated to be $312.9 million, $235.5 million (75 per cent) of which represents investment in non-financial assets. Liabilities are expected to remain stable over the budget and forward estimates period and comprise mainly of supplier payables and employee entitlements.
Total equity is estimated at $294.2 million at 30 June 2018. The reduction in equity over the forward estimates reflects the impact of the unfunded loss for increased depreciation expense arising from revaluations of assets.

ASC – Entity Budget Statements – Budgeted Financial Statements
277
AS
C
3.2 BUDGETED FINANCIAL STATEMENTS TABLES
Table 3.1: Comprehensive Income Statement (showing net cost of services for the period ended 30 June)
2016-17 Estimated
actual$'000
2017-18Budget
$'000
2018-19 Forward estimate
$'000
2019-20 Forward estimate
$'000
2020-21 Forward estimate
$'000
EXPENSES
Employee benefits 64,083 64,510 62,187 59,896 61,717
Suppliers 39,787 37,757 33,452 30,075 28,383
Grants 167,777 168,920 138,004 123,999 124,885
Depreciation and amortisation 24,140 25,600 25,669 25,368 25,368
Total expenses 295,787 296,787 259,312 239,338 240,353
LESS:
OWN-SOURCE INCOME
Revenue
Sale of goods and rendering of services 34,612 21,422 20,776 20,574 20,730
Interest 2,648 2,384 2,122 1,864 1,582
Total revenue 37,260 23,806 22,898 22,438 22,312
Net cost of (contribution by) services 258,527 272,981 236,414 216,900 218,041
Revenue from Government 250,669 264,595 227,557 207,942 209,083
Surplus (deficit) attributable to the Australian Government (7,858) (8,386) (8,857) (8,958) (8,958)
OTHER COMPREHENSIVE INCOME
Changes in asset revaluation reserves - - - - -
Total other comprehensive income (loss) - - - - -
Total comprehensive income (loss) attributable to the Australian Government (7,858) (8,386) (8,857) (8,958) (8,958)

ASC – Entity Budget Statements – Budgeted Financial Statements
278
Table 3.2: Budgeted Departmental Balance Sheet (as at 30 June)
2016-17 Estimated
actual$'000
2017-18Budget
$'000
2018-19 Forward estimate
$'000
2019-20 Forward estimate
$'000
2020-21 Forward estimate
$'000
ASSETS
Financial assets
Cash and cash equivalents 22,127 20,566 18,665 15,724 11,056
Trade and other receivables 5,007 5,007 5,007 5,007 4,980
Loans 2,859 1,864 869 41 -
Investments 50,000 50,000 40,000 25,000 25,000
Total financial assets 79,993 77,437 64,541 45,772 41,036
Non-financial assets
Land and buildings 221,256 215,012 217,429 225,801 221,740
Property, plant and equipment 12,609 13,527 14,948 14,182 14,647
Intangibles 3,292 4,170 3,620 6,153 5,863
Inventories 419 419 419 419 419
Other 2,368 2,368 2,368 2,368 2,368
Total non-financial assets 239,944 235,496 238,784 248,923 245,037
Total assets 319,937 312,933 303,325 294,695 286,073
LIABILITIES
Payables
Suppliers 2,354 2,354 2,354 2,354 2,354
Grants 86 86 86 86 86
Other payables 1,481 1,481 1,481 1,481 1,481
Total payables 3,921 3,921 3,921 3,921 3,921
Provisions
Employees 14,444 14,757 14,006 14,334 14,670
Other provisions 72 72 72 72 72
Total provisions 14,516 14,829 14,078 14,406 14,742
Total liabilities 18,437 18,750 17,999 18,327 18,663
Net assets 301,500 294,183 285,326 276,368 267,410
EQUITY
Contributed equity 150,210 151,279 151,279 151,279 151,279
Reserves 193,835 193,835 193,835 193,835 193,835
Retained surpluses (accumulated deficits) (42,545) (50,931) (59,788) (68,746) (77,704)
Total equity 301,500 294,183 285,326 276,368 267,410

ASC – Entity Budget Statements – Budgeted Financial Statements
279
AS
C
Table 3.3: Departmental Statement of Changes in Equity – Summary of Movement (Budget year 2017-18)
Retained earnings
(accumulated deficit)
$'000
Asset revaluation
reserve
$'000
Contributed equity/capital
$'000
Total equity
$'000
Opening balance as at 1 July 2017
Balance carried forward from previous period (42,545) 193,835 150,210 301,500
Surplus (deficit) for the period (8,386) - - (8,386)
Appropriation (equity injection) - - 1,069 1,069
Estimated closing balance as at 30 June 2018 (50,931) 193,835 151,279 294,183

ASC – Entity Budget Statements – Budgeted Financial Statements
280
Table 3.4: Budgeted Departmental Statement of Cash Flows (for the period ended 30 June)
2016-17 Estimated
actual$'000
2017-18Budget
$'000
2018-19 Forward estimate
$'000
2019-20 Forward estimate
$'000
2020-21 Forward estimate
$'000
OPERATING ACTIVITIES
Cash received
Goods and services 34,612 21,422 20,776 20,574 20,730
Appropriations 250,669 264,595 227,557 207,942 209,083
Interest 2,500 2,250 2,000 1,750 1,500
Total cash received 287,781 288,267 250,333 230,266 231,313
Cash used
Employees 63,746 64,197 62,938 59,568 61,381
Suppliers 39,787 37,757 33,452 30,075 28,383
Grants 167,777 168,920 138,004 123,999 124,885
Total cash used 271,310 270,874 234,394 213,642 214,649
Net cash from (or used by) operating activities 16,471 17,393 15,939 16,624 16,664
INVESTING ACTIVITIES
Cash received
Repayment of loans and interest 276 1,129 1,117 942 150
Total cash received 276 1,129 1,117 942 150
Cash used
Purchase of property, plant and equipment and intangibles 20,462 21,152 28,957 35,507 21,482
Total cash used 20,462 21,152 28,957 35,507 21,482
Net cash from (or used by) investing activities (20,186) (20,023) (27,840) (34,565) (21,332)
FINANCING ACTIVITIES
Cash received
Contributed equity - 1,069 - - -
Total cash received - 1,069 - - -
Net cash from (or used by) financing activities - 1,069 - - -
Net increase (or decrease) in cash held (3,715) (1,561) (11,901) (17,941) (4,668)
Cash and cash equivalents at the beginning of the reporting period 75,842 72,127 70,566 58,665 40,724
Cash and cash equivalents at the end of the reporting period 72,127 70,566 58,665 40,724 36,056

ASC – Entity Budget Statements – Budgeted Financial Statements
281
AS
C
Table 3.5: Departmental Capital Budget Statement (for the period ended 30 June)
2016-17 Estimated
actual$'000
2017-18Budget
$'000
2018-19 Forward estimate
$'000
2019-20 Forward estimate
$'000
2020-21 Forward estimate
$'000
CAPITAL APPROPRIATIONS
Equity injections - Bill 2 - 1,069 - - -
Total capital appropriations - 1,069 - - -
Total new capital appropriations represented by:
Purchase of non-financial assets - 1,069 - - -
Total items - 1,069 - - -
PURCHASE OF NON-FINANCIAL ASSETS
Funded by capital appropriations - equity injection (a) - 1,069 - - -
Funded internally from departmental resources 20,462 20,083 28,957 35,507 21,482
Total acquisitions of non-financial assets 20,462 21,152 28,957 35,507 21,482
RECONCILIATION OF CASH USED TO ACQUIRE ASSETS TO ASSET MOVEMENT TABLE
Total purchases 20,462 21,152 28,957 35,507 21,482
Total cash used to acquire assets 20,462 21,152 28,957 35,507 21,482
(a) Includes both current Bill 2 and prior Act 2/4/6 appropriations and special capital appropriations.

ASC – Entity Budget Statements – Budgeted Financial Statements
282
Table 3.6: Statement of Asset Movements (Budget year 2017-18)
Land
$'000
Buildings
$'000
Other property, plant and
equipment $'000
Intangibles
$'000
Total
$'000
As at 1 July 2017
Gross book value 10,000 546,340 34,643 11,615 602,598
Accumulated depreciation/ amortisation and impairment - (335,084) (22,034) (8,323) (365,441)
Opening net book balance 10,000 211,256 12,609 3,292 237,157
CAPITAL ASSET ADDITIONS
Estimated expenditure on new or replacement assets
By purchase - internal resources - 12,492 5,914 2,746 21,152
Total additions - 12,492 5,914 2,746 21,152
Other movements
Depreciation/amortisation expense - (18,736) (4,996) (1,868) (25,600)
Total other movements - (18,736) (4,996) (1,868) (25,600)
As at 30 June 2018
Gross book value 10,000 558,832 40,557 14,361 623,750
Accumulated depreciation/ amortisation and impairment - (353,820) (27,030) (10,191) (391,041)
Closing net book balance 10,000 205,012 13,527 4,170 232,709

283
Ca
nc
er
Au
str
ali
a
CANCER AUSTRALIA
Entity Resources and Planned Performance

284

285
Ca
nc
er
Au
str
ali
a
CANCER AUSTRALIA
Section 1: Entity Overview and Resources ...................................................... 286
1.1 Strategic Direction Statement ................................................................... 286
1.2 Entity Resource Statement ....................................................................... 287
1.3 Budget Measures ...................................................................................... 289
Section 2: Outcomes and Planned Performance ............................................. 290
2.1 Budgeted Expenses and Performance ..................................................... 290
Section 3: Budgeted Financial Statements ...................................................... 295
3.1 Budgeted Financial Statements ................................................................ 295
3.2 Budgeted Financial Statements Tables .................................................... 296

Cancer Australia – Entity Budget Statements – Entity Overview and Resources
286
Section 1: Entity Overview and Resources
1.1 STRATEGIC DIRECTION STATEMENT1
As the Australian Government’s national cancer control agency, Cancer Australia provides leadership in cancer control across all cancers, with reference to burden of disease, cancer incidence, survival, and mortality. Cancer Australia also has a focus on populations which experience poorer health outcomes, including Aboriginal and Torres Strait Islander peoples and people living in rural and remote Australia.
The Australian Government, through Cancer Australia, aims to: provide national leadership in cancer control to improve cancer outcomes; coordinate evidence-based interventions with a range of health care providers and groups across the continuum of cancer care; lead the development of sustainable and effective models of cancer care; and provide advice on appropriate cancer care. Cancer Australia also oversees a dedicated budget for cancer research and strengthening national data capacity.
In order to minimise the impact of cancer, Cancer Australia will, in 2017-18:
implement the 2017-18 Budget measure Invest in Medical Research – fighting childhood cancer, which will provide $4.4 million aimed at increasing Australia’s research capacity to advance diagnosis, treatment, management, analysis, and improve data and awareness of childhood cancer, as well as $1.4 million to fast track international research collaborations of paediatric brain cancer in Australia;
translate evidence to inform the development and implementation of policies and programs in cancer control;
promote best practice cancer care to health professionals across Australia including the updating and dissemination of evidence-based information on ovarian cancer;
lead the development of innovative, sustainable, and evidence-based models of cancer care;
strengthen national data capacity through reporting on cancer stage and treatment for selected cancers;
fund research in priority areas, including a focus on low survival cancers common among children (0-14 years of age), through the Priority-driven Collaborative Cancer Research Scheme;
provide information for people affected by cancer about their diagnosis and treatment; and
promote cancer awareness to the community.
The role and functions of Cancer Australia are set out in the Cancer Australia Act 2006. Cancer Australia is subject to the Public Service Act 1999 and the
1 For more information about the strategic direction of Cancer Australia, refer to the current corporate plan,
available at: www.canceraustralia.gov.au/about-us/accountability-and-reporting#corporate

Cancer Australia – Entity Budget Statements – Entity Overview and Resources
287
Ca
nc
er
Au
str
ali
a
Auditor-General Act 1997, and is a Non-corporate Commonwealth Entity under the Public Governance, Performance and Accountability Act 2013.
1.2 ENTITY RESOURCE STATEMENT
Table 1.1 shows the total funding from all sources available to the entity for its operations and to deliver programs and services on behalf of the Government.
The table summarises how resources will be applied by outcome (Government strategic policy objectives) and by administered (on behalf of the Government or the public) and departmental (for the entity’s operations) classification.
For more detailed information on special accounts and special appropriations, please refer to Budget Paper No. 4 – Agency Resourcing.
Information in this table is presented on a resourcing (i.e. appropriations/cash available) basis, whilst the ‘Budgeted expenses by Outcome’ tables in Section 2 and the financial statements in Section 3 are presented on an accrual basis.

Cancer Australia – Entity Budget Statements – Entity Overview and Resources
288
Table 1.1: Cancer Australia Resource Statement – Budget Estimates for 2017-18 as at Budget May 2017
2016-17Estimated
actual$'000
2017-18 Estimate
$'000
DEPARTMENTAL
Prior year appropriation available 4,749 4,585
Annual appropriations
Ordinary annual services (a)
Departmental appropriation 11,270 11,110
s74 retained revenue receipts (b) 1,130 127
Departmental capital budget (c) 82 81
Other services (d)
Equity injection - -
Total departmental annual appropriations 12,482 11,318
Total departmental resourcing 17,231 15,903
ADMINISTERED
Prior year appropriation available 30 30
Annual appropriations
Ordinary annual services (a)
Outcome 1 17,150 18,679
Other services (d)
Administered assets and liabilities - -
Total administered annual appropriations 17,150 18,679
Total administered resourcing 17,180 18,709
Total resourcing for Cancer Australia 34,411 34,612
2016-17 2017-18
Average staffing level (number) 69 69
All figures are GST exclusive. (a) Appropriation Bill (No. 1) 2017-18. (b) Estimated retained revenue receipts under section 74 of the PGPA Act 2013. (c) Departmental Capital Budget (DCB) are not separately identified in Appropriation Bill (No. 1) and form part
of ordinary annual services items. Refer to Table 3.5 for further details. For accounting purposes, this amount has been designated as a 'contribution by owner'. (d) Appropriation Bill (No. 2) 2017-18.

Cancer Australia – Entity Budget Statements – Entity Overview and Resources
289
Ca
nc
er
Au
str
ali
a
1.3 BUDGET MEASURES
Budget measures in Part 1 relating to Cancer Australia are detailed in Budget Paper No. 2 and are summarised below.
Table 1.2: Cancer Australia 2017-18 Budget Measures
Program 2016-17$'000
2017-18$'000
2018-19$'000
2019-20 $'000
2020-21 $'000
Investing in Medical Research - fighting childhood cancer
Cancer Australia
Administered expenses 1.1 - 1,307 2,186 2,086 250
Total expenses - 1,307 2,186 2,086 250

Cancer Australia – Entity Budget Statements – Outcomes and Planned Performance
290
Section 2: Outcomes and Planned Performance
Government outcomes are the intended results, impacts or consequences of actions by the Government on the Australian community. Commonwealth programs are the primary vehicle by which Government entities achieve the intended results of their outcome statements. Entities are required to identify the programs which contribute to Government outcomes over the Budget and forward years.
Each outcome is described below together with its related programs. The following provides detailed information on expenses for each outcome and program, further broken down by funding source.
Note:
Performance reporting requirements in the Portfolio Budget Statements are part of the Enhanced Commonwealth Performance Framework established by the Public Governance, Performance and Accountability Act 2013. It is anticipated that the performance criteria described in Portfolio Budget Statements will be read with broader information provided in an entity’s corporate plans and annual performance statements – included in Annual Reports – to provide an entity’s complete performance story.
Cancer Australia’s most recent corporate plan is available at: www.canceraustralia.gov.au/about-us/accountability-and-reporting
Cancer Australia’s most recent annual performance statement is available at: www.canceraustralia.gov.au/about-us/accountability-and-reporting/annual-reports
2.1 BUDGETED EXPENSES AND PERFORMANCE
Outcome 1
Minimised impacts of cancer, including through national leadership in cancer control with targeted research, cancer service development, education and consumer support
Program Contributing to Outcome 1
Program 1.1: Improved Cancer Control
Linked Programs
Other Commonwealth entities that contribute to Outcome 1
Department of Health Program 2.4: Preventive Health and Chronic Disease Support The Department of Health has policy responsibility for improving the detection, treatment and survival outcomes for people with cancer. This includes oversight of cancer screening programs, such as the National Bowel Cancer Screening Program and the National Cervical Screening Program.

Cancer Australia – Entity Budget Statements – Outcomes and Planned Performance
291
Ca
nc
er
Au
str
ali
a
Budgeted Expenses for Cancer Australia
Table 2.1.1 shows how much the entity intends to spend (on an accrual basis) on achieving the outcome, broken down by program, as well as by administered and departmental funding sources.
Table 2.1.1: Budgeted Expenses for Cancer Australia
2016-17 Estimated
actual$'000
2017-18 Budget
$'000
2018-19 Forward
Year 1$'000
2019-20 Forward
Year 2 $'000
2020-21 Forward
Year 3 $'000
Program 1.1: Improved Cancer Control
Administered expenses
Ordinary annual services (a) 17,150 18,679 19,802 19,966 18,381
Departmental expenses
Departmental appropriation (b) 12,400 11,237 11,206 11,214 11,269
Expenses not requiring appropriation 437 457 436 339 in the Budget year (c) 443
Operating deficit (surplus) - - - - -
Total for Program 1.1 29,993 30,353 31,465 31,616 29,989
Total expenses for Outcome 1 29,993 30,353 31,465 31,616 29,989
2016-17 2017-18
Average staffing level (number) 69 69
(a) Appropriation (Bill No. 1) 2017-18. (b) Departmental appropriation combines 'Ordinary annual services (Appropriation Bill No. 1)' and 'Revenue
from independent sources (s74)'. (c) Expenses not requiring appropriation in the Budget year are made up of depreciation expense,
amortisation expense, makegood expenses and audit fees.
Movement of Funds
There were no movements of administered funds between years.

Cancer Australia – Entity Budget Statements – Outcomes and Planned Performance
292
Planned Performance for Cancer Australia
Table 2.1.2 below details the performance criteria for the program associated with Outcome 1.2 It also summarises how the program is delivered and where 2017-18 Budget measures have materially changed the program.
Table 2.1.2: Performance Criteria for Cancer Australia
Purpose
To minimise the impact of cancer, address disparities, and improve the health outcomes of people affected by cancer in Australia by providing national leadership in cancer control.
Outcome 1
Minimised impacts of cancer, including through national leadership in cancer control with targeted research, cancer service development, education and consumer support
Program 1.1: Improved Cancer Control
Cancer Australia is a specialist agency providing national leadership in cancer control across the cancer continuum of care. Cancer Australia guides scientific improvements in cancer prevention, treatment and care; coordinates and liaises between the wide range of groups and health care providers with an interest in cancer; makes recommendations to the Australian Government about cancer policies and priorities; assists with the implementation of policies and programs in cancer control; and oversees a dedicated budget for research into cancer. In 2017-18, the Government will provide $5.8 million for childhood cancer research, including $1.4 million for paediatric brain cancer clinical trials and $4.4 million aimed at increasing Australia’s research capacity to advance diagnosis, treatment, management, analysis, and improve data and awareness of childhood cancer.
Delivery
A. Providing leadership in national cancer control and promoting appropriate cancer care
Promote evidence-based practice for identified cancers and population groups.
Lead a shared agenda for improvements in cancer outcomes for Aboriginal and Torres Strait Islander peoples in agreed priority areas across the cancer continuum.
Monitor and report national trends in cancer control. B. Funding priority research and strengthening national data capacity
Partner with non-government organisations to maximise Government investment in priority areas of cancer research through the Priority-driven Collaborative Cancer Research Scheme.
Provide funding to support the development of industry independent cancer clinical trials.
Report on cancer stage and treatments for selected cancers. C. Promoting cancer awareness and providing information about cancer to the
community
Engage consumers to inform Cancer Australia’s work.
Provide evidence-based cancer information, resources and data for consumers, health professionals and the community through the Cancer Australia websites, including the Children’s cancer website, and social media platforms.
2 Progress against the performance criteria published in the 2016-17 Portfolio Budget Statements will be
reported in the 2016-17 Cancer Australia Annual Report.

Cancer Australia – Entity Budget Statements – Outcomes and Planned Performance
293
Ca
nc
er
Au
str
ali
a
Performance criteria
A. Providing leadership in national cancer control and promoting appropriate cancer care
Research is translated into evidence-based information, policy and clinical practice.
2016-17 Estimated result 2017-18 Target 2018-19 (& beyond) Target
The release of the Cancer Australia Statement –influencing best practice in breast cancer, has been achieved and the Statement is available on the Cancer Australia website.3
Evidence is advanced about the most appropriate interventions across the continuum of cancer care through the publication of research and guidance in specific cancers.
As per 2017-18.
B. Funding priority research and strengthening national data capacity
Minimum number of cancer research grants funded by Cancer Australia through the Priority-driven Collaborative Cancer Research Scheme.
2016-17 Estimated result
2017-18 Target
2018-19 Target
2019-20 Target
2020-21 Target
Target of 7 is on track to be achieved by 30 June 2017.
7 7 7 7
Percentage of funding for applied research through the Priority-driven Collaborative Cancer Research Scheme.
2016-17 Estimated result
2017-18 Target
2018-19 Target
2019-20 Target
2020-21 Target
Target of ≥70% is on track to be achieved by 30 June 2017.
≥70% ≥70% ≥70% ≥70%
3 Further information is available at: thestatement.canceraustralia.gov.au/

Cancer Australia – Entity Budget Statements – Outcomes and Planned Performance
294
C. Promoting cancer awareness and providing information about cancer to the community
Total number of Cancer Australia resources available to inform the community.
2016-17 Estimated result
2017-18 Target
2018-19 Target
2019-20 Target
2020-21 Target
Target of 280 is on track to be achieved by 30 June 2017.
285 290 290 290
Number of consumers involved in Cancer Australia advisory and project activities.
2016-17 Estimated result
2017-18 Target
2018-19 Target
2019-20 Target
2020-21 Target
Target of 60 is on track to be achieved by 30 June 2017.
70 70 80 80
Material changes to Program 1.1 resulting from the following measures: There are no material changes to Program 1.1 resulting from measures.

Cancer Australia – Entity Budget Statements – Budgeted Financial Statements
295
Ca
nc
er
Au
str
ali
a
Section 3: Budgeted Financial Statements
Section 3 presents budgeted financial statements which provide a comprehensive snapshot of entity finances for the 2017-18 Budget year, including the impact of Budget measures and resourcing on financial statements.
3.1 BUDGETED FINANCIAL STATEMENTS
3.1.1 Differences Between Entity Resourcing and Financial Statements
This section is not applicable to Cancer Australia.
3.1.2 Explanatory Notes and Analysis of Budgeted Financial Statements
Departmental Resources
Comprehensive Income Statement
This statement details budgeted financial results for Cancer Australia in 2017-18.
Cancer Australia anticipates a break even position for the Budget year 2017-18 and all forward years.
Total expenses for 2017-18 are consistent with former years. The income statement deficit in the Budget year 2017-18 and forward years is as a result of depreciation being unfunded.
Balance Sheet
There are no significant movements expected in the assets or liabilities of Cancer Australia.
Cash Flow
Cash flows are consistent with income, expenses and asset movements.
Administered Resources
Administered funding for Cancer Australia programs will continue in 2017-18. The level of administered funding across forward years represents Government expenditure on programs delivered to all Australians through Cancer Australia.
In the 2017-18 Budget, the Government will provide $5.8 million over four years to improve outcomes for childhood cancer, including $1.4 million for paediatric brain cancer clinical trials and $4.4 million aimed at increasing Australia’s research capacity to advance diagnosis, treatment, management, analysis, and improve data and awareness of childhood cancer.

Cancer Australia – Entity Budget Statements – Budgeted Financial Statements
296
3.2 BUDGETED FINANCIAL STATEMENTS TABLES
Table 3.1: Comprehensive Income Statement (showing net cost of services for the period ended 30 June)
2016-17Estimated
actual$'000
2017-18Budget
$'000
2018-19Forward estimate
$'000
2019-20 Forward estimate
$'000
2020-21 Forward estimate
$'000
EXPENSES
Employee benefits 8,451 8,559 8,928 8,934 8,987
Supplier expenses 3,145 2,873 2,475 2,474 2,479
Grants expenses 1,000 - - - -
Depreciation and amortisation 247 242 260 242 142
Total expenses 12,843 11,674 11,663 11,650 11,608
LESS:
OWN-SOURCE INCOME
Revenue
Other revenue 1,130 127 129 128 129
Total revenue 1,130 127 129 128 129
Gains
Other 196 195 197 194 197
Total gains 196 195 197 194 197
Total own-source income 1,326 322 326 322 326
Net cost of (contribution by) services 11,517 11,352 11,337 11,328 11,282
Revenue from Government 11,270 11,110 11,077 11,086 11,140
Surplus (deficit) (247) (242) (260) (242) (142)
Surplus (deficit) attributable to the Australian Government (247) (242) (260) (242) (142)
OTHER COMPREHENSIVE INCOME
Changes in asset revaluation reserves - - - - -
Total other comprehensive income - - - - -
Total comprehensive income (loss) attributable to the Australian Government (247) (242) (260) (242) (142)
Note: Reconciliation of comprehensive income attributable to the agency
2016-17 $'000
2017-18 $'000
2018-19 $'000
2019-20 $'000
2020-21 $'000
Total comprehensive income (loss) attributable to the Australian Government (247) (242) (260) (242) (142)
plus non-appropriated expenses depreciation and amortisation expenses 247 242 260 242 142
Total comprehensive income (loss) attributable to the agency - - - - -

Cancer Australia – Entity Budget Statements – Budgeted Financial Statements
297
Ca
nc
er
Au
str
ali
a
Table 3.2: Budgeted Departmental Balance Sheet (as at 30 June)
2016-17Estimated
actual$'000
2017-18Budget
$'000
2018-19Forward estimate
$'000
2019-20 Forward estimate
$'000
2020-21 Forward estimate
$'000
ASSETS
Financial assets
Cash and cash equivalents 214 214 214 214 214
Receivables 4,562 4,512 4,429 4,339 4,337
Total financial assets 4,776 4,726 4,643 4,553 4,551
Non-financial assets
Buildings - - - - -
Property, plant and equipment 414 312 243 188 132
Intangibles 69 60 33 17 17
Other 66 66 66 66 66
Total non-financial assets 549 438 342 271 215
Total assets 5,325 5,164 4,985 4,824 4,766
LIABILITIES
Payables
Suppliers 649 649 649 649 649
Other payables 545 545 545 545 545
Total payables 1,194 1,194 1,194 1,194 1,194
Provisions
Employees 1,834 1,834 1,834 1,834 1,834
Other provisions 180 180 180 180 180
Total provisions 2,014 2,014 2,014 2,014 2,014
Total liabilities 3,208 3,208 3,208 3,208 3,208
Net Assets 2,117 1,956 1,777 1,616 1,558
EQUITY
Contributed equity 164 245 326 407 491
Reserves - - - - -
Retained surpluses (accumulated deficits) 1,953 1,711 1,451 1,209 1,067
Total equity 2,117 1,956 1,777 1,616 1,558
Table 3.3: Departmental Statement of Changes in Equity – Summary of Movement (Budget year 2017-18)
Retained earnings
$'000
Asset revaluation
reserve $'000
Contributed equity/capital
$'000
Total equity
$'000
Opening balance as at 1 July 2017
Balance carried forward from previous period 1,953 - 164 2,117
Surplus (deficit) for the period (242) - - (242)
Capital budget - Bill 1 (DCB) - - 81 81
Other movements - - - -
Estimated closing balance as at 30 June 2018 1,711 - 245 1,956
DCB = Departmental Capital Budget.

Cancer Australia – Entity Budget Statements – Budgeted Financial Statements
298
Table 3.4: Budgeted Departmental Statement of Cash Flows (for the period ended 30 June)
2016-17Estimated
actual$'000
2017-18Budget
$'000
2018-19Forward estimate
$'000
2019-20 Forward estimate
$'000
2020-21 Forward estimate
$'000
OPERATING ACTIVITIES
Cash received
Appropriations 11,294 11,020 11,022 11,035 11,002
GST 221 223 238 232 232
Other cash received 1,130 127 129 128 129
Total cash received 12,645 11,370 11,389 11,395 11,363
Cash used
Employees 8,251 8,559 8,928 8,934 8,988
Suppliers 3,009 2,538 2,140 2,139 2,141
Grants 1,000 - - - -
GST 221 223 238 232 232
Total cash used 12,481 11,320 11,306 11,305 11,361
Net cash from (or used by) operating activities 164 50 83 90 2
INVESTING ACTIVITIES
Cash used
Purchase of property, plant and equipment 246 131 164 171 86
Total cash used 246 131 164 171 86
Net cash from (or used by) investing activities (246) (131) (164) (171) (86)
FINANCING ACTIVITIES
Cash received
Capital budget - Bill 1 (DCB) 82 81 81 81 84
Total cash received 82 81 81 81 84
Net cash from (or used by) financing activities 82 81 81 81 84
Net increase (or decrease) in cash held - - - - -
Cash and cash equivalents at the beginning of the reporting period 214 214 214 214 214
Cash and cash equivalents at the end of the reporting period 214 214 214 214 214
DCB = Departmental Capital Budget.

Cancer Australia – Entity Budget Statements – Budgeted Financial Statements
299
Ca
nc
er
Au
str
ali
a
Table 3.5: Departmental Capital Budget Statement (for the period ended 30 June)
2016-17Estimated
actual$'000
2017-18Budget
$'000
2018-19Forward estimate
$'000
2019-20 Forward estimate
$'000
2020-21 Forward estimate
$'000
CAPITAL APPROPRIATIONS
Capital budget - Bill 1 (DCB) 82 81 81 81 84
Total capital appropriations 82 81 81 81 84
Total new capital appropriations represented by:
Purchase of non-financial assets 82 81 81 81 84
Total represented by 82 81 81 81 84
PURCHASE OF NON-FINANCIAL ASSETS
Funded by capital appropriation - DCB (a) 82 81 81 81 84
Funded internally from departmental resources 164 50 83 90 2
Total acquisitions of non-financial assets 246 131 164 171 86
RECONCILIATION OF CASH USED TO ACQUIRE ASSETS TO ASSET MOVEMENT TABLE
Total purchases 246 131 164 171 86
Total cash used to acquire assets 246 131 164 171 86
(a) Does not include annual finance lease costs. Includes purchases from current and previous years' Departmental Capital Budget (DCB).

Cancer Australia – Entity Budget Statements – Budgeted Financial Statements
300
Table 3.6: Statement of Asset Movements (Budget year 2017-18)
Buildings
$'000
Other property, plant and
equipment $'000
Intangibles
$'000
Total
$'000
As at 1 July 2017
Gross book value - 1,186 582 1,768
Accumulated depreciation/ amortisation and impairment - (772) (513) (1,285)
Opening net book balance - 414 69 483
CAPITAL ASSET ADDITIONS
Estimated expenditure on new or replacement assets
By purchase - appropriation ordinary annual services - 111 20 131
Total additions - 111 20 131
Other movements
Depreciation/amortisation expense - (213) (29) (242)
Total other movements - (213) (29) (242)
As at 30 June 2018
Gross book value - 1,297 602 1,899
Accumulated depreciation/ amortisation and impairment - (985) (542) (1,527)
Closing net book balance - 312 60 372
Table 3.7: Schedule of Budgeted Income and Expenses Administered on Behalf of Government (for the period ended 30 June)
2016-17Estimated
actual$'000
2017-18Budget
$'000
2018-19Forward estimate
$'000
2019-20 Forward estimate
$'000
2020-21 Forward estimate
$'000
EXPENSES ADMINISTERED ON BEHALF OF GOVERNMENT
Grants 15,794 16,382 16,737 16,881 17,013
Suppliers 1,356 2,297 3,065 3,085 1,368
Total expenses administered on behalf of Government 17,150 18,679 19,802 19,966 18,381

Cancer Australia – Entity Budget Statements – Budgeted Financial Statements
301
Ca
nc
er
Au
str
ali
a
Table 3.8: Schedule of Budgeted Assets and Liabilities Administered on Behalf of Government (as at 30 June)
2016-17Estimated
actual$'000
2017-18Budget
$'000
2018-19Forward estimate
$'000
2019-20 Forward estimate
$'000
2020-21 Forward estimate
$'000
ASSETS ADMINISTERED ON BEHALF OF GOVERNMENT
Financial assets
Cash and cash equivalents 30 30 30 30 30
Receivables 39 39 39 39 39
Other financial assets 387 387 387 387 387
Total financial assets 456 456 456 456 456
Total assets administered on behalf of Government 456 456 456 456 456
LIABILITIES ADMINISTERED ON BEHALF OF GOVERNMENT
Payables
Suppliers 242 242 242 242 242
Grants 60 60 60 60 60
Other payables 154 154 154 154 154
Total payables 456 456 456 456 456
Total liabilities administered on behalf of Government 456 456 456 456 456

Cancer Australia – Entity Budget Statements – Budgeted Financial Statements
302
Table 3.9: Schedule of Budgeted Administered Cash Flows (for the period ended 30 June)
2016-17Estimated
actual$'000
2017-18Budget
$'000
2018-19Forward estimate
$'000
2019-20 Forward estimate
$'000
2020-21 Forward estimate
$'000
OPERATING ACTIVITIES
Cash received
GST 695 707 707 707 707
Total cash received 695 707 707 707 707
Cash used
Grant payments 15,177 16,382 16,737 16,881 17,013
Suppliers 1,973 2,297 3,065 3,085 1,368
GST 695 707 707 707 707
Total cash used 17,845 19,386 20,509 20,673 19,088
Net cash from (or used by) operating activities 17,150 18,679 19,802 19,966 18,381
Net increase (or decrease) in cash held 17,150 18,679 19,802 19,966 18,381
Cash at beginning of reporting period 30 30 30 30 30
Cash from Official Public Account for:
- appropriations 17,150 18,679 19,802 19,966 18,381
Cash at end of reporting period 30 30 30 30 30

303
FS
AN
Z
FOOD STANDARDS AUSTRALIA
NEW ZEALAND
Entity Resources and Planned Performance

304

305
FS
AN
Z FOOD STANDARDS AUSTRALIA
NEW ZEALAND
Section 1: Entity Overview and Resources ...................................................... 306
1.1 Strategic Direction Statement ................................................................... 306
1.2 Entity Resource Statement ....................................................................... 308
1.3 Budget Measures ...................................................................................... 308
Section 2: Outcomes and Planned Performance ............................................. 309
2.1 Budgeted Expenses and Performance ..................................................... 309
Section 3: Budgeted Financial Statements ...................................................... 314
3.1 Budgeted Financial Statements ................................................................ 314
3.2 Budgeted Financial Statements Tables .................................................... 315

FSANZ – Entity Budget Statements – Entity Overview and Resources
306
Section 1: Entity Overview and Resources
1.1 STRATEGIC DIRECTION STATEMENT1
The Australian Government aims to ensure that Australia’s food supply is safe and well managed in order to minimise the risk of adverse health events.
Food Standards Australia New Zealand (FSANZ) was established to achieve the goals of: a high degree of consumer confidence in the quality and safety of food that is available in Australia and New Zealand; an effective, transparent and accountable regulatory framework within which industry can work efficiently; the provision of adequate information about food to support informed food choices; and the harmonisation of food standards in Australia and New Zealand, and internationally.
Regulation is a critical component of the cooperative framework established to deliver safe food in Australia. Food standards developed by FSANZ are based on risk analysis using the best available scientific and other relevant evidence.
FSANZ supports the Australian Government to build consumer confidence in food regulation by improving communication with technical and non-technical audiences. FSANZ will expand the use of the internet and other electronic communication tools to enhance its consultation on standards development and the provision of information about food safety and food regulation.
Through the operation of treaty arrangements, some food standards developed by FSANZ are implemented as food standards in New Zealand.
Food standards are implemented through multi-jurisdictional arrangements with the Australian, New Zealand and State and Territory Governments that are overseen by the Australia and New Zealand Ministerial Forum on Food Regulation.
FSANZ also coordinates national food surveillance and food recall activities, maintains national food composition and food consumption databases, and provides advice to the Department of Agriculture and Water Resources to assist that Department to control imported foods.
In 2017-18, FSANZ will continue work on revision of standards for novel foods and nutritive substances, and commence reviews of Chapters 3 and 4 of the Food Standards Code (food safety requirements and primary production and processing standards) and of the standard for food produced using gene technology.
1 For more information about the strategic direction of FSANZ, refer to the current corporate plan, available
at: www.foodstandards.gov.au/publications/Pages/Corporate-Plan-201617.aspx

FSANZ – Entity Budget Statements – Entity Overview and Resources
307
FS
AN
Z
FSANZ will also work with food regulators to develop policies to reduce the levels of foodborne illness and to better explain the role of food labelling. FSANZ will also develop an enhanced evidence-based framework to assess risks from imported foods. In addition, FSANZ will also undertake work to engage industry and the community more effectively in response activities.
The role and functions of FSANZ are set out in the Food Standards Australia New Zealand Act 1991 (FSANZ Act). FSANZ is a Corporate Commonwealth Entity under the Public Governance, Performance and Accountability Act 2013.

FSANZ – Entity Budget Statements – Entity Overview and Resources
308
1.2 ENTITY RESOURCE STATEMENT
Table 1.1 shows the total funding from all sources available to the entity for its operations and to deliver programs and services on behalf of the Government.
The table summarises how resources will be applied by outcome (Government strategic policy objectives) and by administered (on behalf of the Government or the public) and departmental (for the entity’s operations) classification.
For more detailed information on special accounts and special appropriations, please refer to Budget Paper No. 4 – Agency Resourcing.
Information in this table is presented on a resourcing (i.e. appropriations/cash available) basis, whilst the ‘Budgeted expenses by outcome’ tables in Section 2 and the financial statements in Section 3 are presented on an accrual basis.
Table 1.1: FSANZ Resource Statement – Budget Estimates for 2017-18 as at Budget May 2017
2016-17Estimated
actual$'000
2017-18 Estimate
$'000
Opening balance/cash reserves at 1 July 10,802 11,126
Funds from Government
Annual appropriations
Ordinary annual services (a)
Outcome 1 17,177 16,961
Other services (b)
Equity injection - -
Total annual appropriations 17,177 16,961
Amounts received from related entities (c)
Amounts from the Portfolio Department - -
Amounts from other entities - -
Total amounts received from related entities - -
Total funds from Government 17,177 16,961
Funds from other sources
Interest 320 320
Sale of goods and services 100 100
Other 1,749 1,749
Total funds from other sources 2,169 2,169
Total net resourcing for FSANZ 30,148 30,256
2016-17 2017-18
Average staffing level (number) 108 107
All figures are GST exclusive. (a) Appropriation Bill (No. 1) 2017-18. (b) Appropriation Bill (No. 2) 2017-18. (c) Funding provided by a Government entity that is not specified within the annual appropriation bills as a
payment to the corporate entity.
1.3 BUDGET MEASURES This section is not applicable to FSANZ.
FSANZ – Entity Budget Statements – Outcomes and Planned Performance
309
FS
AN
Z
Section 2: Outcomes and Planned Performance
Government outcomes are the intended results, impacts or consequences of actions by the Government on the Australian community. Commonwealth programs are the primary vehicle by which Government entities achieve the intended results of their outcome statements. Entities are required to identify the programs which contribute to Government outcomes over the Budget and forward years.
Each outcome is described below together with its related programs. The following provides detailed information on expenses for each outcome and program, further broken down by funding source.
Note:
Performance reporting requirements in the Portfolio Budget Statements are part of the Enhanced Commonwealth Performance Framework established by the Public Governance, Performance and Accountability Act 2013. It is anticipated that the performance criteria described in Portfolio Budget Statements will be read with broader information provided in an entity’s corporate plans and annual performance statements – included in Annual Reports – to provide an entity’s complete performance story.
FSANZ’s most recent corporate plan is available at: www.foodstandards.gov.au/publications/Pages/Corporate-Plan-201617.aspx
FSANZ’s most recent annual performance statement is available at: www.foodstandards.gov.au/publications/annualreport201516/Pages/Annual%20Report%202015-2016.aspx
2.1 BUDGETED EXPENSES AND PERFORMANCE
Outcome 1
A safe food supply and well-informed consumers in Australia and New Zealand, including through the development of food regulatory measures and the promotion of their consistent implementation, coordination of food recall activities and the monitoring of consumer and industry food practices
Program Contributing to Outcome 1
Program 1.1: Food Regulatory Activity and Services to the Minister and Parliament

FSANZ – Entity Budget Statements – Outcomes and Planned Performance
310
Linked Programs
Other Commonwealth entities that contribute to Outcome 1
Department of Health Program 2.4: Preventive Health and Chronic Disease Support The Department of Health has strategic responsibility for the development of policies that ensure Australia’s food supply is safe and that Australians have access to information to make informed choices about the food they consume.
Department of Agriculture and Water Resources Program 2.1: Biosecurity and Export Services The Department of Agriculture and Water Resources administers the Imported Food Program, which includes managing the risks to human health and regulating imported food for compliance with Australian food standards. This program contributes to the effectiveness of the Australian food regulatory system which provides confidence to the community that the food supply is safe.
Budgeted Expenses for FSANZ
Table 2.1.1 shows how much the entity intends to spend (on an accrual basis) on achieving the outcome, broken down by program, as well as by administered and departmental funding sources.
Table 2.1.1: Budgeted Expenses for FSANZ
2016-17 Estimated
actual$'000
2017-18 Budget
$'000
2018-19Forward
Year 1$'000
2019-20 Forward
Year 2 $'000
2020-21 Forward
Year 3 $'000
Program 1.1: Food Regulatory Activity and Services to the Minister and Parliament
Revenue from Government
Ordinary annual services (a) 17,177 16,961 16,882 16,890 16,973 Revenues from independent sources 2,169 2,169 2,350 2,350 2,375
Operating deficit (surplus) - - - - -
Total for Program 1.1 19,346 19,130 19,232 19,240 19,348
Total expenses for Outcome 1 19,346 19,130 19,232 19,240 19,348
2016-17 2017-18
Average staffing level (number) 108 107
(a) Appropriation Bill (No. 1) 2017-18.

FSANZ – Entity Budget Statements – Outcomes and Planned Performance
311
FS
AN
Z
Planned Performance for FSANZ
Table 2.1.2 below details the performance criteria for the program associated with Outcome 1.2 It also summarises how the program is delivered and where 2017-18 Budget measures have materially changed the program.
Table 2.1.2: Performance Criteria for FSANZ
Purpose
To contribute to the cooperative food regulatory system by developing evidence-based standards, providing evidence-based advice, coordinating regulatory responses and providing information about food standards.
Outcome 1
A safe food supply and well-informed consumers in Australia and New Zealand, including through the development of food regulatory measures and the promotion of their consistent implementation, coordination of food recall activities and the monitoring of consumer and industry food practices
Program 1.1: Food Regulatory Activity and Services to the Minister and Parliament
The Australian Government aims to ensure that all Australians have access to a safe food supply and adequate, accurate information to make informed choices about the food they consume. FSANZ develops evidence-based food regulatory measures, coordinates trans-jurisdictional food regulatory activities, and provides information about food regulation in order to enhance confidence in food for sale.
Delivery
A. Ensuring effective, evidence-based food standards
Develop standards in response to applications and proposals to amend the Food Standards Code.
B. Coordinating food regulation to protect public health and safety
Coordinate food incident response and food recalls.
Undertake monitoring and surveillance activities to ensure that regulatory and non-regulatory activities achieve their objectives.
C. Providing food-related information
Provide authoritative evidence-based information about food composition and consumption to stakeholders and consumers.
2 Progress against the performance criteria published in the 2016-17 Portfolio Budget Statements will be
reported in the 2016-17 FSANZ Annual Report.

FSANZ – Entity Budget Statements – Outcomes and Planned Performance
312
Performance Criteria
A. Ensuring effective, evidence-based food standards
Food regulatory measures are considered in a timely manner.
2016-17 Estimated result 2017-18 Target 2018-19 (& beyond) Target
100% of applications assessed in statutory deadlines.
Applications are assessed within 12 months or less as required by the FSANZ Act.
As per 2017-18.
B. Coordinating food regulation to protect public health and safety
Manage the operation of the Bi-National Food Safety Network and coordinate major food incidents under the National Food Incident Response Protocol.
2016-17 Estimated result 2017-18 Target 2018-19 (& beyond) Target
Response and management of salmonella and rockmelon national food incident effectively coordinated. Effective coordination of information exchange on more than ten food issues.
Deliver efficient and effective food incident management through the Bi-National Food Safety Network and, when appropriate, the National Food Incident Response Protocol.
As per 2017-18.
Make a valuable contribution to ensuring that the food regulatory system is implemented consistently.
2016-17 Estimated result 2017-18 Target 2018-19 (& beyond) Target
64 food recalls relating to foods that were not safe or suitable for consumption were coordinated effectively.
FSANZ’s coordination role is effectively demonstrated in the annual report on recall activities (including evaluation outcomes) to States and Territories, through the Implementation Subcommittee for Food Regulation (ISFR).3
As per 2017-18.
Deliver efficient and effective food recall coordination.4
2016-17 Estimated result
2017-18 Target
2018-19 Target
2019-20 Target
2020-21 Target
Industry satisfaction with food recall coordination was ≥95%.
Industry satisfaction with food recall coordination is ≥95%.
Industry satisfaction with food recall coordination is ≥95%.
Industry satisfaction with food recall coordination is ≥95%.
Industry satisfaction with food recall coordination is ≥95%.
3 ISFR was set up by the Food Regulation Standing Committee to foster a consistent approach across
jurisdictions to implementing and enforcing food regulation. More information about the ISFR is available at: foodregulation.gov.au/internet/fr/publishing.nsf/Content/ISFR
4 Industry satisfaction with food recall coordination is measured by surveying industry recall participants.

FSANZ – Entity Budget Statements – Outcomes and Planned Performance
313
FS
AN
Z
C. Providing food-related information
FSANZ is recognised as the primary source of information about food standards and food regulation in Australia and New Zealand.
2016-17 Estimated result 2017-18 Target 2018-19 (& beyond) Target
Stakeholder survey to be completed by 31 May 2017.
Stakeholders consistently report a high level of satisfaction with FSANZ and the information it provides.
As per 2017-18.
Improved understanding of community food safety and public health issues through the Consumer and Public Health Dialogue (CPHD).
2016-17 Estimated result 2017-18 Target 2018-19 (& beyond) Target
The effectiveness of FSANZ’s regulatory response to food safety and public health nutrition issues was improved through engagement with the CPHD.
Food policy is informed by Public Health and Consumer evidence-base.
As per 2017-18.
Encourage stakeholder engagement through up-to-date information on FSANZ’s website and social media interactions. a. Website unique visitors. b. Social media interactions.
2016-17 Estimated result
2017-18 Target
2018-19 Target
2019-20 Target
2020-21 Target
a. 1,100,000 visits
>850,000 >850,000 >850,000 >850,000
b. 200,000 engaged users on Facebook.
>200,000 >200,000 >200,000 >200,000
Material changes to Program 1.1 resulting from the following measures: There are no material changes to Program 1.1 resulting from measures.

FSANZ – Entity Budget Statements – Budgeted Financial Statements
314
Section 3: Budgeted Financial Statements
Section 3 presents budgeted financial statements which provide a comprehensive snapshot of entity finances for the 2017-18 Budget year, including the impact of Budget measures and resourcing on financial statements.
3.1 BUDGETED FINANCIAL STATEMENTS
3.1.1 Differences Between Entity Resourcing and Financial Statements
This section is not applicable to FSANZ.
3.1.2 Explanatory Notes and Analysis of Budgeted Financial Statements
Departmental Resources
Comprehensive Income Statement
FSANZ has projected a break even budget in 2017-18 and the forward years.
Revenues
Appropriation revenue in 2017-18 has decreased from 2016-17 largely reflecting the impact of previous increased efficiency dividends on the agency.
Revenue from other sources of $2.2 million in 2017-18 is expected to remain stable next year then increase slightly over the forward years. The revenue from other sources is received primarily from the New Zealand Government, cost recovery arrangements for the processing of paid applications to amend the food standards code, and interest.
Expenses
Expenditure in 2017-18 is anticipated to be $19.1 million which is lower than the prior year and in line with the reduction in departmental appropriation.
Employee expenses are anticipated to remain in line with 2016-17 actuals with a relatively stable workforce and a slight increase in salaries. Supplier expenses will decrease in line with the reduction in appropriation.
Balance Sheet
Non-financial assets are reducing across future years as assets are depreciated over their useful life.
Employee provisions are expected to remain stable.

FSANZ – Entity Budget Statements – Budgeted Financial Statements
315
FS
AN
Z
3.2 BUDGETED FINANCIAL STATEMENTS TABLES
Table 3.1: Comprehensive Income Statement (showing net cost of services for the period ended 30 June)
2016-17Estimated
actual$'000
2017-18Budget
$'000
2018-19Forward estimate
$'000
2019-20 Forward estimate
$'000
2020-21 Forward estimate
$'000
EXPENSES
Employee benefits 14,437 14,434 14,432 14,429 14,382
Supplier expenses 3,804 3,591 3,695 3,706 3,861
Depreciation and amortisation 1,105 1,105 1,105 1,105 1,105
Total expenses 19,346 19,130 19,232 19,240 19,348
LESS:
OWN-SOURCE INCOME
Revenue Sale of goods and rendering of services 100 100 100 100 200
Interest 320 320 320 320 200
Other revenue 1,749 1,749 1,930 1,930 1,975
Total revenue 2,169 2,169 2,350 2,350 2,375
Gains
Other - - - - -
Total gains - - - - -
Total own-source income 2,169 2,169 2,350 2,350 2,375
Net cost of (contribution by) services 17,177 16,961 16,882 16,890 16,973
Revenue from Government 17,177 16,961 16,882 16,890 16,973
Surplus (deficit) - - - - -
Surplus (deficit) attributable to the Australian Government - - - - -
OTHER COMPREHENSIVE INCOME Changes in asset revaluation reserves - - - - -
Total other comprehensive income (loss) - - - - -
Total comprehensive income (loss) attributable to the Australian Government - - - - -

FSANZ – Entity Budget Statements – Budgeted Financial Statements
316
Table 3.2: Budgeted Departmental Balance Sheet (as at 30 June)
2016-17Estimated
actual$'000
2017-18Budget
$'000
2018-19Forward estimate
$'000
2019-20 Forward estimate
$'000
2020-21 Forward estimate
$'000
ASSETS
Financial assets
Cash and cash equivalents 11,126 11,626 12,126 12,126 12,126
Trade and other receivables 375 375 375 375 375
Total financial assets 11,501 12,001 12,501 12,501 12,501
Non-financial assets
Land and buildings 571 591 611 611 611
Property, plant and equipment 319 269 219 219 219
Intangibles 1,703 1,233 763 763 763
Other 282 282 282 282 282
Total non-financial assets 2,875 2,375 1,875 1,875 1,875
Total assets 14,376 14,376 14,376 14,376 14,376
LIABILITIES
Payables
Suppliers 211 211 211 211 211
Other payables 1,222 1,222 1,222 1,222 1,222
Total payables 1,433 1,433 1,433 1,433 1,433
Interest bearing liabilities
Leases 228 228 228 228 228
Total interest bearing liabilities 228 228 228 228 228
Provisions
Employees 4,625 4,625 4,625 4,625 4,625
Other provisions 345 345 345 345 345
Total provisions 4,970 4,970 4,970 4,970 4,970
Total liabilities 6,631 6,631 6,631 6,631 6,631
Net assets 7,745 7,745 7,745 7,745 7,745
EQUITY
Contributed equity 1,823 1,823 1,823 1,823 1,823
Reserves 2,254 2,254 2,254 2,254 2,254 Retained surpluses (accumulated deficits) 3,668 3,668 3,668 3,668 3,668
Total equity 7,745 7,745 7,745 7,745 7,745

FSANZ – Entity Budget Statements – Budgeted Financial Statements
317
FS
AN
Z
Table 3.3: Departmental Statement of Changes in Equity – Summary of Movement (Budget year 2017-18)
Retained earnings
$'000
Asset revaluation
reserve $'000
Contributed equity/capital
$'000
Total equity
$'000
Opening balance as at 1 July 2017
Balance carried forward from previous period 3,668 2,254 1,823 7,745
Surplus (deficit) for the period - - - -
Appropriation (equity injection) - - - -
Estimated closing balance as at 30 June 2018 3,668 2,254 1,823 7,745

FSANZ – Entity Budget Statements – Budgeted Financial Statements
318
Table 3.4: Budgeted Departmental Statement of Cash Flows (for the period ended 30 June)
2016-17Estimated
actual$'000
2017-18Budget
$'000
2018-19Forward estimate
$'000
2019-20 Forward estimate
$'000
2020-21 Forward estimate
$'000
OPERATING ACTIVITIES
Cash received
Goods and services 100 100 100 100 200
Appropriations 17,177 16,961 16,882 16,890 16,973
Interest 320 320 320 320 200
Net GST received 519 519 519 519 519
Other cash received 1,573 1,749 1,930 1,930 1,975
Total cash received 19,689 19,649 19,751 19,759 19,867
Cash used
Employees 14,437 14,434 14,432 14,429 14,382
Suppliers 3,804 3,591 3,695 3,706 3,861
Net GST paid 519 519 519 519 519
Total cash used 18,760 18,544 18,646 18,654 18,762
Net cash from (or used by) operating activities 929 1,105 1,105 1,105 1,105
INVESTING ACTIVITIES
Cash used Purchase of property, plant and equipment 605 605 605 1,105 1,105
Total cash used 605 605 605 1,105 1,105
Net cash from (or used by) investing activities (605) (605) (605) (1,105) (1,105)
FINANCING ACTIVITIES
Cash received
Contributed equity - - - - -
Total cash received - - - - -
Net cash from (or used by) financing activities - - - - -
Net increase (or decrease) in cash held 324 500 500 - -
Cash and cash equivalents at the beginning of the reporting period 10,802 11,126 11,626 12,126 12,126
Cash and cash equivalents at the end of the reporting period 11,126 11,626 12,126 12,126 12,126

FSANZ – Entity Budget Statements – Budgeted Financial Statements
319
FS
AN
Z
Table 3.5: Departmental Capital Budget Statement (for the period ended 30 June)
2016-17Estimated
actual$'000
2017-18Budget
$'000
2018-19Forward estimate
$'000
2019-20 Forward estimate
$'000
2020-21 Forward estimate
$'000
CAPITAL APPROPRIATIONS
Equity injections - Bill 2 - - - - -
Total capital appropriations - - - - -
Total new capital appropriations represented by:
Purchase of non-financial assets - - - - -
Total items - - - - -
PURCHASE OF NON-FINANCIAL ASSETS
Funded by capital appropriations - equity injection (a) - - - - -
Funded internally from departmental resources 605 605 605 1,105 1,105
Total acquisitions of non-financial assets 605 605 605 1,105 1,105
RECONCILIATION OF CASH USED TO ACQUIRE ASSETS TO ASSET MOVEMENT TABLE
Total purchases 605 605 605 1,105 1,105
Total cash used to acquire assets 605 605 605 1,105 1,105
(a) Includes both current Bill 2, prior Act 2/4/6 appropriations and special capital appropriations.

FSANZ – Entity Budget Statements – Budgeted Financial Statements
320
Table 3.6: Statement of Asset Movements (Budget year 2017-18)
Buildings
$'000
Other property, plant and
equipment $'000
Intangibles
$'000
Total
$'000
As at 1 July 2017
Gross book value 1,111 1,709 4,806 7,626
Accumulated depreciation/ amortisation and impairment (540) (1,390) (3,103) (5,033)
Opening net book balance 571 319 1,703 2,593
CAPITAL ASSET ADDITIONS
Estimated expenditure on new or replacement assets
By purchase - appropriation equity - - - -
By purchase - internal resources 200 100 305 605
Total additions 200 100 305 605
Other movements
Depreciation/amortisation expense (180) (150) (775) (1,105)
Total other movements (180) (150) (775) (1,105)
As at 30 June 2018
Gross book value 1,311 1,809 5,111 8,231
Accumulated depreciation/ amortisation and impairment (720) (1,540) (3,878) (6,138)
Closing net book balance 591 269 1,233 2,093

321
IHP
A
INDEPENDENT HOSPITAL PRICING
AUTHORITY
Entity Resources and Planned Performance

322

323
IHP
A
INDEPENDENT HOSPITAL
PRICING AUTHORITY
Section 1: Entity Overview and Resources ...................................................... 324
1.1 Strategic Direction Statement ................................................................... 324
1.2 Entity Resource Statement ....................................................................... 325
1.3 Budget Measures ...................................................................................... 325
Section 2: Outcomes and Planned Performance ............................................. 326
2.1 Budgeted Expenses and Performance ..................................................... 326
Section 3: Budgeted Financial Statements ...................................................... 332
3.1 Budgeted Financial Statements ................................................................ 332
3.2 Budgeted Financial Statements Tables .................................................... 333

IHPA – Entity Budget Statements – Entity Overview and Resources
324
Section 1: Entity Overview and Resources
1.1 STRATEGIC DIRECTION STATEMENT1
The Australian Government is working with State and Territory Governments to implement reforms to the health system to improve health outcomes for all Australians and ensure the sustainability of the health system.
The Independent Hospital Pricing Authority (IHPA) is responsible for determining a National Efficient Price (NEP) for public hospital services through the analysis of data on the actual activities and costs of public hospitals services. IHPA also determines a National Efficient Cost (NEC) which is used when Activity Based Funding is not suitable for funding such as in the case of small rural public hospitals.
Following the Heads of Agreement between the Commonwealth and States and Territories on Public Hospital Funding, signed on 1 April 2016, and subsequent Direction issued to IHPA by the Minister for Health on 16 February 2017, IHPA began work to implement pricing for safety and quality into funding of public hospital services.
IHPA is responsible for developing national classifications for health care and other services delivered by public hospitals and, as required, resolving disputes on cost-shifting and cross-border issues, and providing advice and reports to the Australian Government and the public.
IHPA publishes an annual Pricing Framework for Australian Public Hospital Services that outlines the principles, criteria and methodology used by IHPA to determine the NEP for services provided by hospitals on an activity basis and the NEC for services that are block funded.
As prescribed in the National Health Reform Act 2011, the Clinical Advisory Committee, the Jurisdictional Advisory Committee and other advisory committees, advise on matters relating to the functions of IHPA. These committees ensure that the underlying principles applied to setting the NEP and NEC are both clinically relevant and technically appropriate.
IHPA is independent of the Australian Government and State and Territory Governments.
IHPA is a Corporate Commonwealth Entity under the Public Governance, Performance and Accountability Act 2013, and its role and functions are set out in the National Health Reform Act 2011.
1 For more information about the strategic direction of the IHPA, refer to the current corporate plan, available
at: www.ihpa.gov.au/who-we-are/corporate-plan

IHPA – Entity Budget Statements – Entity Overview and Resources
325
IHP
A
1.2 ENTITY RESOURCE STATEMENT
Table 1.1 shows the total funding from all sources available to the entity for its operations and to deliver programs and services on behalf of the Government.
The table summarises how resources will be applied by outcome (Government strategic policy objectives) and by administered (on behalf of the Government or the public) and departmental (for the entity’s operations) classification.
For more detailed information on special accounts and special appropriations, please refer to Budget Paper No. 4 – Agency Resourcing.
Information in this table is presented on a resourcing (i.e. appropriations/cash available) basis, whilst the ‘Budgeted expenses by outcome’ tables in Section 2 and the financial statements in Section 3 are presented on an accrual basis.
Table 1.1: IHPA Resource Statement – Budget Estimates for 2017-18 as at Budget May 2017
2016-17Estimated
actual$'000
2017-18 Estimate
$'000
Opening balance/cash reserves at 1 July 26,576 24,913
Funds from Government
Annual appropriations
Ordinary annual services (a)
Outcome 1 - -
Other services (b)
Equity injection - -
Total annual appropriations - -
Amounts received from related entities (c)
Amounts from the Portfolio Department 15,538 15,476
Amounts from other entities - -
Total amounts received from related entities 15,538 15,476
Total funds from Government 15,538 15,476
Funds from other sources
Interest 96 96
Sale of goods and services 845 850
Other - -
Total funds from other sources 941 946
Total net resourcing for IHPA 43,055 41,335
2016-17 2017-18
Average staffing level (number) 1 1
All figures are GST exclusive. (a) Appropriation Bill (No. 1) 2017-18. (b) Appropriation Bill (No. 2) 2017-18. (c) Funding provided by a Government entity that is not specified within the annual appropriation bills as a
payment to the corporate entity.
1.3 BUDGET MEASURES This section is not applicable to IHPA.

IHPA – Entity Budget Statements – Outcomes and Planned Performance
326
Section 2: Outcomes and Planned Performance
Government outcomes are the intended results, impacts or consequences of actions by the Government on the Australian community. Commonwealth programs are the primary vehicle by which Government entities achieve the intended results of their outcome statements. Entities are required to identify the programs which contribute to Government outcomes over the Budget and forward years.
Each outcome is described below together with its related programs. The following provides detailed information on expenses for each outcome and program, further broken down by funding source.
Note:
Performance reporting requirements in the Portfolio Budget Statements are part of the Enhanced Commonwealth Performance Framework established by the Public Governance, Performance and Accountability Act 2013. It is anticipated that the performance criteria described in Portfolio Budget Statements will be read with broader information provided in an entity’s corporate plans and annual performance statements – included in Annual Reports – to provide an entity’s complete performance story.
IHPA’s most recent corporate plan is available at: www.ihpa.gov.au/who-we-are/corporate-plan
IHPA’s most recent annual performance statement is available at: www.ihpa.gov.au/publications/annual-report-2016
2.1 BUDGETED EXPENSES AND PERFORMANCE
Outcome 1
Promote improved efficiency in, and access to, public hospital services primarily through setting efficient national prices and levels of block funding for hospital activities
Program Contributing to Outcome 1
Program 1.1: Public Hospital Price Determinations

IHPA – Entity Budget Statements – Outcomes and Planned Performance
327
IHP
A
Linked Programs
Other Commonwealth entities that contribute to Outcome 1
Department of Health Program 2.7: Hospital Services The Department of Health has policy responsibility for public and private hospital services, including the Commonwealth Government funding contribution for public hospital services. This includes policy responsibility for the implementation of Activity Based Funding under the National Health Reform Agreement.
Australian Commission on Safety and Quality in Health Care Program 1.1: Safety and Quality in Health Care The Australian Commission on Safety and Quality in Health Care works together with IHPA, through a joint working party, to consider options for their respective governing bodies on possible approaches to ensuring safety and quality in the provision of health care services to fulfil the relevant requirements of the National Health Reform Agreement.
Budgeted Expenses for IHPA
Table 2.1.1 shows how much the entity intends to spend (on an accrual basis) on achieving the outcome, broken down by program, as well as by administered and departmental funding sources.
Table 2.1.1: Budgeted Expenses for IHPA
2016-17Estimated
actual$'000
2017-18Budget
$'000
2018-19Forward
Year 1$'000
2019-20 Forward
Year 2 $'000
2020-21 Forward
Year 3 $'000
Program 1.1: Public Hospital Price Determinations
Revenue from Government
Ordinary annual services - - - - -
Amounts from related entities 15,538 15,476 15,876 16,118 16,102 Revenues from independent sources 941 946 1,351 951 951
Expenses not requiring appropriation 6,811 6,924 7,046 7,039 in the Budget year (a) 6,698
Operating deficit (surplus) - - - - -
Total for Program 1.1 23,177 23,233 24,151 24,115 24,092
Total expenses for Outcome 1 23,177 23,233 24,151 24,115 24,092
2016-17 2017-18
Average staffing level (number) 1 1
(a) Expenses not requiring appropriation in the Budget year are made up of staff salary and shared services received free of charge from Department of Health.

IHPA – Entity Budget Statements – Outcomes and Planned Performance
328
Planned Performance for IHPA
Table 2.1.2 below details the performance criteria for the program associated with Outcome 1.2 It also summarises how the program is delivered and where 2017-18 Budget measures have materially changed the program.
Table 2.1.2: Performance Criteria for IHPA
Purpose
To determine the National Efficient Price and the National Efficient Cost for public hospital services.
Outcome 1
Promote improved efficiency in, and access to, public hospital services primarily through setting efficient national prices and levels of block funding for hospital activities
Program 1.1: Public Hospital Price Determinations
IHPA promotes improved efficiency in, and access to, public hospital services by providing independent advice to the Australian Government and State and Territory Governments regarding the efficient price of health care services, and by developing and implementing robust systems to support Activity Based Funding for those services. In 2017-18 this will include work to implement pricing for safety and quality into funding of public hospital services, consistent with the Heads of Agreement between the Commonwealth and States and Territories on Public Hospital Funding signed on 1 April 2016.
Delivery
A. Determining the National Efficient Price (NEP) and National Efficient Cost (NEC) for public hospital services
Continue to develop and refine the pricing models which will ensure accurate NEP and NEC Determinations.
Develop safety and quality measures for inclusion in the NEP in future years. B. Developing infrastructure to support a national Activity Based Funding system
Continue to develop and refine new and existing hospital activity classifications through specialist input from clinicians.
Ensure clinical acceptance of classification systems through consultation and collaboration with specialist committees including IHPA’s Clinical Advisory Committee.
Establish and maintain national costing standards.
Ensure effective collection and processing of costing information from public and private hospitals.
Develop and maintain standards for activity data collections, including the annual publication of the Three Year Data Plan.
Publish a six-monthly report outlining jurisdictional compliance with the data requirements and data standards as set out in the Three Year Data Plan.
C. Resolving disputes on cost-shifting and cross-border issues
Investigate and make recommendations concerning cross-border disputes and cost-shifting disputes between States and Territories.
2 Progress against the performance criteria published in the 2016-17 Portfolio Budget Statements will be
reported in the 2016-17 IHPA Annual Report.

IHPA – Entity Budget Statements – Outcomes and Planned Performance
329
IHP
A
Performance criteria
A. Determining the National Efficient Price (NEP) and National Efficient Cost (NEC) for public hospital services
Publish the Pricing Framework for Australian Public Hospital Services (Pricing Framework) outlining the principles, scope and methodology to be adopted in the determination of the National Efficient Price and National Efficient Cost.
2016-17 Estimated result 2017-18 Target 2018-19 (& beyond) Target
Pricing Framework for Australian Public Hospital Services 2017-18 published in March 2017.3
Publish the Pricing Framework 2018-19 by 31 December 2017.
Publish the Pricing Framework annually by 31 December.
Publish an annual determination of the National Efficient Price and National Efficient Cost for the coming financial year along with other information supporting the efficient funding of public hospital services.
2016-17 Estimated result 2017-18 Target 2018-19 (& beyond) Target
The National Efficient Price (NEP) and National Efficient Cost (NEC) Determinations for 2017-18 were published in March 2017.
Publish the NEP and NEC Determinations for 2018-19 by 31 March 2018.
Publish the NEP and NEC Determinations annually by 31 March.
3 The Pricing Framework for Australian Public Hospital Services for 2017-18 was published in March 2017.
This allowed for time to consult with stakeholders following the Direction issued to IHPA by the former Minister for Health and Aged Care following from the Heads of Agreement signed at the Council of Australian Governments meeting in April 2016 for IHPA to develop options for incorporating safety and quality into the pricing and funding of public hospital services.

IHPA – Entity Budget Statements – Outcomes and Planned Performance
330
B. Developing infrastructure to support a national Activity Based Funding system
Develop new Activity Based Funding classifications.
2016-17 Estimated result 2017-18 Target 2018-19 (& beyond) Target
Australian Mental Health Care Classification Version 1.0 implemented.
Complete work on the new classification system for emergency care services by December 2017. Development of the Australian Mental Health Care Classification Version 2.0. Continue to develop a new classification for teaching and training. Development of the Australian non-admitted care classification system.
Complete work on the Australian non-admitted care classification system by December 2018. Complete work on the teaching and training classification by June 2018.
Revise existing Activity Based Funding classifications.
2016-17 Estimated result 2017-18 Target 2018-19 (& beyond) Target
Australian Refined Diagnosis Related Groups Version 9.0 approved by the Pricing Authority in November 2016.
Continue work on the Australian Modification of the International Statistical Classification of Diseases 11th edition. Continue work on the new classification for Australian national sub-acute and non-acute patient care. Continue work on Australian Refined Diagnosis Related Group Version 10.
Complete work on the Australian Modification of the International Statistical Classification of Diseases 11th edition by 2019. Complete work on Australian Refined Diagnosis Related Group Version 10 by 2019.
Maintain up-to-date national costing standards.
2016-17 Estimated result 2017-18 Target 2018-19 (& beyond) Target
In progress. Release of the Australian Hospital Patient Costing Standards Version 4.
Continued development of the Australian Hospital Patient Costing Standards Version 4.
Ensure effective collection and processing of costing information to support ABF outcomes.
2016-17 Estimated result 2017-18 Target 2018-19 (& beyond) Target
The National Hospital Cost Data Collection (Round 19) was published in November 2016. The National Hospital Cost Data Collection (Round 19) Independent Financial Review was published in February 2017.
Completion of the annual National Hospital Cost Data Collection Round by 30 December of that year. Completion of the annual National Hospital Cost Data Collection Round, Independent Financial Review by 30 December of that year. Release of the annual cost weights for public and private hospitals by June of that year.
As per 2017-18.

IHPA – Entity Budget Statements – Outcomes and Planned Performance
331
IHP
A
C. Resolving disputes on cost-shifting and cross-border issues
Review of IHPA’s Cost-Shifting and Cross-Border Dispute Resolution Framework.
2016-17 Estimated result 2017-18 Target 2018-19 (& beyond) Target
The Cost-Shifting and Cross-Border and Dispute Resolution Framework was reviewed and published on 1 March 2016.
Complete review and publish updated Cost-Shifting and Cross-Border and Dispute Resolution Framework annually by June.
As per 2017-18.
Timely investigation and provision of recommendations to Health Ministers to resolve cost-shifting and cross-border disputes.
2016-17 Estimated result 2017-18 Target 2018-19 (& beyond) Target
No disputes were received. IHPA investigation of cost-shifting or cross-border disputes and provision of recommendations or assessment within six months of receipt of request.
As per 2017-18.
Material changes to Program 1.1 resulting from the following measures: There are no material changes to Program 1.1 resulting from measures.

IHPA – Entity Budget Statements – Budgeted Financial Statements
332
Section 3: Budgeted Financial Statements
Section 3 presents budgeted financial statements which provide a comprehensive snapshot of entity finances for the 2017-18 Budget year, including the impact of Budget measures and resourcing on financial statements.
3.1 BUDGETED FINANCIAL STATEMENTS
3.1.1 Differences Between Entity Resourcing and Financial Statements
This section is not applicable to IHPA.
3.1.2 Explanatory Notes and Analysis of Budgeted Financial Statements
Departmental Resources
Comprehensive Income Statement
The operational functions of the Independent Hospital Pricing Authority (IHPA) were transferred to the Department of Health (the Department) on 1 July 2016, with the Board, Chief Executive Officer (CEO) and functions retained.
Under a memorandum of understanding (MOU) arrangement executed in June 2016, the Department’s staff are seconded to IHPA under the direct control of IHPA’s CEO to support its functions. The cost of these services are provided to IHPA as resources received free of charge.
In the 2017-18 financial year IHPA’s total budget expenditure estimate is $23.2 million. IHPA is funded through both payments from the Department and funds from own source income.
Balance Sheet
IHPA’s receivables are planned to reduce from $18.5 million in 2016-17 to $0.3 million in 2017-18, as a result of the extinguishing of the unspent $18.2 million from the 2014-15 appropriation by the automatic operation of the three year repeal that will occur at the end of 2016-17.
Cash Flow
Cash flows are consistent with income, expenses and asset movements.

IHPA – Entity Budget Statements – Budgeted Financial Statements
333
IHP
A
3.2 BUDGETED FINANCIAL STATEMENTS TABLES
Table 3.1: Comprehensive Income Statement (showing net cost of services for the period ended 30 June)
2016-17Estimated
actual$'000
2017-18Budget
$'000
2018-19Forward estimate
$'000
2019-20 Forward estimate
$'000
2020-21 Forward estimate
$'000
EXPENSES
Employee benefits 6,134 6,201 6,326 6,454 6,454
Supplier expenses 16,311 16,315 17,262 17,098 17,075
Depreciation and amortisation 732 717 563 563 563
Total expenses 23,177 23,233 24,151 24,115 24,092
LESS:
OWN-SOURCE INCOME
Revenue
Sale of goods and rendering of services (a) 16,383 16,326 17,131 16,973 16,957
Interest 96 96 96 96 96
Total revenue 16,479 16,422 17,227 17,069 17,053
Gains
Other (b) 6,698 6,811 6,924 7,046 7,039
Total gains 6,698 6,811 6,924 7,046 7,039
Total own-source income 23,177 23,233 24,151 24,115 24,092
Net cost of (contribution by) services - - - - -
Revenue from Government - - - - -
Surplus (deficit) - - - - -
Surplus (deficit) attributable to the Australian Government - - - - -
OTHER COMPREHENSIVE INCOME
Changes in asset revaluation reserves - - - - -
Total other comprehensive income (loss) - - - - -
Total comprehensive income (loss) attributable to the Australian Government - - - - -
(a) Payments from Department of Health and funds from own sources. (b) Staff salary and shared services received free of charge from Department of Health.

IHPA – Entity Budget Statements – Budgeted Financial Statements
334
Table 3.2: Budgeted Departmental Balance Sheet (as at 30 June)
2016-17Estimated
actual$'000
2017-18Budget
$'000
2018-19Forward estimate
$'000
2019-20 Forward estimate
$'000
2020-21 Forward estimate
$'000
ASSETS
Financial assets
Cash and cash equivalents 6,737 6,633 6,824 7,015 7,106
Receivables 18,515 339 339 339 339
Total financial assets 25,252 6,972 7,163 7,354 7,445
Non-financial assets
Land and buildings 203 383 318 253 188
Property, plant and equipment 290 314 290 209 183
Intangibles 303 247 190 190 190
Prepayments 49 49 49 49 49
Total non-financial assets 845 993 847 701 610
Total assets 26,097 7,965 8,010 8,055 8,055
LIABILITIES
Payables
Suppliers 1,350 1,384 1,419 1,454 1,454
Other payables 355 355 355 355 355
Total payables 1,705 1,739 1,774 1,809 1,809
Provisions
Employees 120 130 140 150 150
Other provisions 165 165 165 165 165
Total provisions 285 295 305 315 315
Total liabilities 1,990 2,034 2,079 2,124 2,124
Net Assets 24,107 5,931 5,931 5,931 5,931
EQUITY
Contributed equity 400 400 400 400 400
Reserves 16 16 16 16 16
Retained surpluses (accumulated deficits) 23,691 5,515 5,515 5,515 5,515
Total equity 24,107 5,931 5,931 5,931 5,931

IHPA – Entity Budget Statements – Budgeted Financial Statements
335
IHP
A
Table 3.3: Departmental Statement of Changes in Equity – Summary of Movement (Budget year 2017-18)
Retained earnings
$'000
Asset revaluation
reserve $'000
Contributed equity/capital
$'000
Total equity
$'000
Opening balance as at 1 July 2017
Balance carried forward from previous period 23,691 16 400 24,107
Surplus (deficit) for the period - - - -
Appropriation (equity injection) (18,176) - - (18,176)
Estimated closing balance as at 30 June 2018 5,515 16 400 5,931

IHPA – Entity Budget Statements – Budgeted Financial Statements
336
Table 3.4: Budgeted Departmental Statement of Cash Flows (for the period ended 30 June)
2016-17Estimated
actual$'000
2017-18Budget
$'000
2018-19Forward estimate
$'000
2019-20 Forward estimate
$'000
2020-21 Forward estimate
$'000
OPERATING ACTIVITIES
Cash received
Goods and services 846 866 1,273 887 871
Interest 96 96 96 96 96
Appropriations - - - - -
Net GST received 1,304 1,303 1,379 1,364 1,364
Other 15,538 15,460 15,859 16,085 16,085
Total cash received 17,784 17,725 18,607 18,432 18,416
Cash used
Employees 7,105 6,197 6,322 6,450 6,450
Suppliers 11,408 10,682 11,551 11,289 11,318
Net GST paid 85 85 126 85 85
Others 432 - - - -
Total cash used 19,030 16,964 17,999 17,824 17,853
Net cash from (or used by) operating activities (1,246) 761 608 608 563
INVESTING ACTIVITIES
Cash used
Purchase of property, plant and equipment 417 865 417 417 472
Total cash used 417 865 417 417 472
Net cash from (or used by) investing activities (417) (865) (417) (417) (472)
FINANCING ACTIVITIES
Cash received
Contributed equity - - - - -
Total cash received - - - - -
Cash used Cash used for other financing activities - - - - -
Total cash used - - - - -
Net cash from (or used by) financing activities - - - - -
Net increase (or decrease) in cash held (1,663) (104) 191 191 91
Cash and cash equivalents at the beginning of the reporting period 8,400 6,737 6,633 6,824 7,015
Cash and cash equivalents at the end of the reporting period 6,737 6,633 6,824 7,015 7,106

IHPA – Entity Budget Statements – Budgeted Financial Statements
337
IHP
A
Table 3.5: Departmental Capital Budget Statement (for the period ended 30 June)
2016-17Estimated
actual$'000
2017-18Budget
$'000
2018-19Forward estimate
$'000
2019-20 Forward estimate
$'000
2020-21 Forward estimate
$'000
CAPITAL APPROPRIATIONS
Equity injections - Bill 2 - - - - -
Total capital appropriations - - - - -
Total new capital appropriations represented by:
Purchase of non-financial assets - - - - -
Total items - - - - -
PURCHASE OF NON-FINANCIAL ASSETS
Funded by capital appropriations - equity injection (a) - - - - -
Funded internally from departmental resources 417 865 417 417 472
Total acquisitions of non-financial assets 417 865 417 417 472
RECONCILIATION OF CASH USED TO ACQUIRE ASSETS TO ASSET MOVEMENT TABLE
Total purchases 417 865 417 417 472
Total cash used to acquire assets 417 865 417 417 472
(a) Includes both current Bill 2, prior Act 2/4/6 appropriations and special capital appropriations.
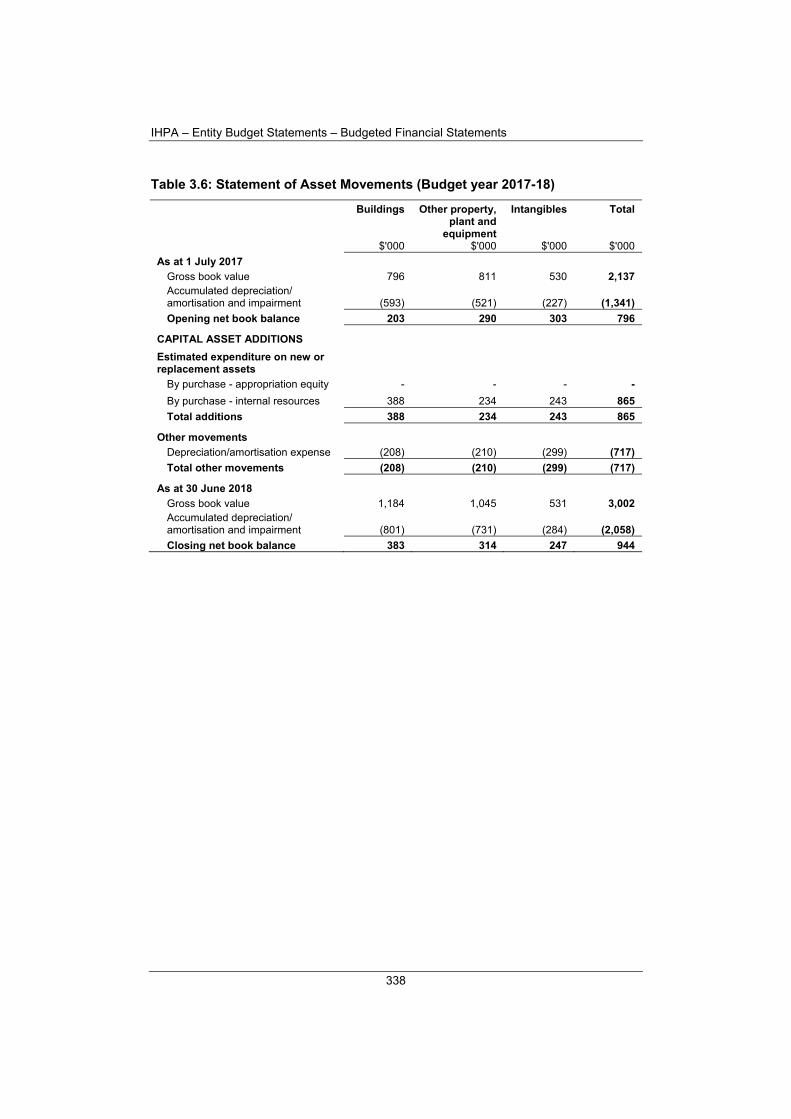
IHPA – Entity Budget Statements – Budgeted Financial Statements
338
Table 3.6: Statement of Asset Movements (Budget year 2017-18)
Buildings
$'000
Other property, plant and
equipment $'000
Intangibles
$'000
Total
$'000
As at 1 July 2017
Gross book value 796 811 530 2,137 Accumulated depreciation/ amortisation and impairment (593) (521) (227) (1,341)
Opening net book balance 203 290 303 796
CAPITAL ASSET ADDITIONS
Estimated expenditure on new or replacement assets
By purchase - appropriation equity - - - -
By purchase - internal resources 388 234 243 865
Total additions 388 234 243 865
Other movements
Depreciation/amortisation expense (208) (210) (299) (717)
Total other movements (208) (210) (299) (717)
As at 30 June 2018
Gross book value 1,184 1,045 531 3,002 Accumulated depreciation/ amortisation and impairment (801) (731) (284) (2,058)
Closing net book balance 383 314 247 944

339
NB
A
NATIONAL BLOOD AUTHORITY
Entity Resources and Planned Performance

340

341
NB
A
NATIONAL BLOOD AUTHORITY
Section 1: Entity Overview and Resources ...................................................... 342
1.1 Strategic Direction Statement ................................................................... 342
1.2 Entity Resource Statement ....................................................................... 343
1.3 Budget Measures ...................................................................................... 344
Section 2: Outcomes and Planned Performance ............................................. 345
2.1 Budgeted Expenses and Performance ..................................................... 345
Section 3: Budgeted Financial Statements ...................................................... 351
3.1 Budgeted Financial Statements ................................................................ 351
3.2 Budgeted Financial Statements Tables .................................................... 353

NBA – Entity Budget Statements – Entity Overview and Resources
342
Section 1: Entity Overview and Resources
1.1 STRATEGIC DIRECTION STATEMENT1
The Australian Government, through the National Blood Authority (NBA), aims to ensure that Australia has an adequate, safe, secure and well managed blood supply. The NBA was established by the Australian Government, and State and Territory Governments, to coordinate policy, governance, funding and management of the blood and blood product sector in Australia.
The NBA manages national contracts to secure the supply of safe and affordable blood products in Australia in accordance with the National Blood Agreement.
The NBA works with governments and stakeholders to implement an efficient, demand-driven blood supply system that is highly responsive to clinical needs and based upon evidence and good clinical practice. The purchasing and supply arrangements for fresh, fractionated and recombinant blood products2 will continue to be improved, including the further strengthening of risk mitigation arrangements.
The NBA will continue to undertake a range of activities aimed at improving the clinical use of blood and blood products in recognition of the growing cost of blood products and the growing evidence of risk associated with unnecessary transfusions. Specifically, the NBA aims to improve the sustainability and performance of the sector through enhanced data capture and analysis; improved governance of access to immunoglobulin products to ensure the most cost-effective use of scarce and high cost products; and facilitate development and publication of evidence-based national clinical practice guidelines, informed by close engagement with clinicians.
The role and functions of the NBA are set out in the National Blood Authority Act 2003. The NBA is a non-corporate Commonwealth Entity under the Public Governance, Performance and Accountability Act 2013.
1 For more information about the strategic direction of the NBA, refer to the current corporate plan, available
at: www.blood.gov.au/system/files/documents/2016-19Corporate-Plan-v5webversion.pdf 2 Fractionated products are those derived from human plasma whereas recombinant products are those
manufactured through commercial scale expression of proteins from cell lines modified using recombinant gene technology.

NBA – Entity Budget Statements – Entity Overview and Resources
343
NB
A
1.2 ENTITY RESOURCE STATEMENT
Table 1.1 shows the total funding from all sources available to the entity for its operations and to deliver programs and services on behalf of the Government.
The table summarises how resources will be applied by outcome (Government strategic policy objectives) and by administered (on behalf of the Government or the public) and departmental (for the entity’s operations) classification.
For more detailed information on special accounts and special appropriations, please refer to Budget Paper No. 4 – Agency Resourcing.
Information in this table is presented on a resourcing (i.e. appropriations/cash available) basis, whilst the ‘Budgeted expenses by outcome’ tables in Section 2 and the financial statements in Section 3 are presented on an accrual basis.
Table 1.1: NBA Resource Statement – Budget Estimates for 2017-18 as at Budget May 2017
2016-17Estimated
actual$'000
2017-18 Estimate
$'000
DEPARTMENTAL
Prior year appropriation available 9,068 9,050
Annual appropriations
Ordinary annual services (a)
Departmental appropriation 5,636 5,537
s74 retained revenue receipts (b) - -
Departmental capital budget (c) 631 621
Other services (d)
Equity injection - -
Total departmental annual appropriations 6,267 6,158
Special Accounts (e)
Appropriation receipts 6,267 6,158
Non-appropriation receipts 3,681 3,617
Total special account 9,948 9,775
Less appropriations drawn from annual or special appropriations above and credited to Special Accounts (f) (6,267) (6,158)
Total departmental resourcing 19,016 18,825

NBA – Entity Budget Statements – Entity Overview and Resources
344
Table 1.1: NBA Resource Statement – Budget Estimates for 2017-18 as at Budget May 2017 (continued)
2016-17Estimated
actual$'000
2017-18 Estimate
$'000
ADMINISTERED
Prior year appropriation available 174,005 95,657
Annual appropriations
Ordinary annual services (a)
Outcome 1 5,190 3,860
Other services (d)
Administered assets and liabilities - -
Total administered annual appropriations 5,190 3,860
Special Accounts (e)
Appropriation receipts 5,190 3,860
Appropriation receipts - other entities (g) 664,802 748,914
Non-appropriation receipts 389,743 449,457
Total Special Accounts 1,059,735 1,202,231 Less appropriations drawn from annual or special appropriations above and credited to Special Accounts (f) (5,190) (3,860)
Total administered resourcing 1,233,740 1,297,888
Total resourcing for NBA 1,252,756 1,316,713
2016-17 2017-18
Average staffing level (number) 53 52
All figures are GST exclusive. (a) Appropriation Bill (No. 1) 2017-18. (b) Estimated retained revenue receipts under section 74 of the PGPA Act 2013. (c) Departmental Capital Budgets (DCB) are not separately identified in Appropriation Bill (No. 1) and form
part of ordinary annual services items. Refer to Table 3.5 for further details. For accounting purposes, this amount has been designated as a 'contribution by owner'.
(d) Appropriation Bill (No. 2) 2017-18. (e) For further information on special appropriations and special accounts, please refer to Budget Paper No. 4
- Agency Resourcing. Also see Table 2.1.1 for further information on outcome and program expenses broken down by various funding sources, e.g. annual appropriations, special appropriations and special accounts.
(f) Appropriation receipts included above. (g) Appropriation receipts from the Department of Health.
1.3 BUDGET MEASURES
This section is not applicable to the NBA.

NBA – Entity Budget Statements – Entity Overview and Resources
345
NB
A
Section 2: Outcomes and Planned Performance
Government outcomes are the intended results, impacts or consequences of actions by the Government on the Australian community. Commonwealth programs are the primary vehicle by which Government entities achieve the intended results of their outcome statements. Entities are required to identify the programs which contribute to Government outcomes over the Budget and forward years.
Each outcome is described below together with its related programs. The following provides detailed information on expenses for each outcome and program, further broken down by funding source.
Note:
Performance reporting requirements in the Portfolio Budget Statements are part of the Enhanced Commonwealth Performance Framework established by the Public Governance, Performance and Accountability Act 2013. It is anticipated that the performance criteria described in Portfolio Budget Statements will be read with broader information provided in an entity’s corporate plans and annual performance statements – included in Annual Reports – to provide an entity’s complete performance story.
The NBA’s most recent corporate plan is available at: www.blood.gov.au/about-nba
The NBA’s most recent annual performance statement is available at: www.blood.gov.au/pubs/1516report/index.html
2.1 BUDGETED EXPENSES AND PERFORMANCE
Outcome 1
Access to a secure supply of safe and affordable blood products, including through national supply arrangements and coordination of best practice standards within agreed funding policies under the national blood arrangements
Program Contributing to Outcome 1
Program 1.1: National Blood Agreement Management

NBA – Entity Budget Statements – Entity Overview and Resources
346
Linked Programs
Other Commonwealth entities that contribute to Outcome 1
Australian Commission on Safety and Quality in Health Care Program 1.1: Safety and Quality in Health Care The Australian Commission on Safety and Quality in Health Care works closely with the National Blood Authority in relation to the National Safety and Quality Health Service Standard 7: Blood and Blood Products. This supports the National Blood Authority in administering the National Blood Agreement.
Department of Health Program 1.1: Health Policy Research and Analysis The Department of Health, in collaboration with State and Territory health departments, has policy responsibility for ensuring Australians have access to an adequate, safe, secure and affordable blood supply. This includes supporting the National Blood Authority to administer the national blood arrangements.

NBA – Entity Budget Statements – Entity Overview and Resources
347
NB
A
Budgeted Expenses for the NBA
Table 2.1.1 shows how much the entity intends to spend (on an accrual basis) on achieving the outcome, broken down by program, as well as by administered and departmental funding sources.
Table 2.1.1: Budgeted Expenses for the NBA
2016-17 Estimated
actual$'000
2017-18 Budget
$'000
2018-19 Forward
Year 1$'000
2019-20 Forward
Year 2 $'000
2020-21 Forward
Year 3 $'000
Program 1.1: National Blood Agreement Management
Administered expenses
Ordinary annual services (a) 5,190 3,860 - - - to National Blood Authority Account (5,190) (3,860) - - -
to National Managed Fund (Blood and Blood Products) Special Account - - - - -
Special Accounts National Blood Authority Account 1,135,072 1,198,731 1,279,759 1,363,891 1,484,042
National Managed Fund (Blood and Blood Products) Special Account - - - - -
Departmental expenses
Departmental appropriation (b) 6,267 6,158 6,103 6,108 6,160 to National Blood Authority Account (6,267) (6,158) (6,103) (6,108) (6,160)
Special Accounts National Blood Authority Account 9,716 9,398 9,115 9,121 9,176
Expenses not requiring appropriation in the Budget year (c) 433 575 575 576 566
Operating deficit (surplus) - - - - -
Total for Program 1.1 1,145,221 1,208,704 1,289,449 1,373,588 1,493,784
Total expenses for Outcome 1 1,145,221 1,208,704 1,289,449 1,373,588 1,493,784
2016-17 2017-18
Average staffing level (number) 53 52
(a) Appropriation (Bill No. 1) 2017-18. (b) Departmental appropriation combines 'Ordinary annual services (Appropriation Bill No. 1)' and 'Revenue
from independent sources (s74)'. (c) Expenses not requiring appropriation in the Budget year are made up of depreciation expense,
amortisation expense, makegood expense and audit fees.
Movement of Funds
There were no movements of administered funds between years.

NBA – Entity Budget Statements – Entity Overview and Resources
348
Planned Performance for the NBA
Table 2.1.2 below details the performance criteria for the program associated with Outcome 1.3 It also summarises how the program is delivered and where 2017-18 Budget measures have materially changed the program.
Table 2.1.2: Performance Criteria for the NBA
Purpose
To save and improve Australian lives through a world-class blood supply.
Outcome 1
Access to a secure supply of safe and affordable blood products, including through national supply arrangements and coordination of best practice standards within agreed funding policies under the national blood arrangements
Program 1.1: National Blood Agreement Management
The NBA, on behalf of the Australian Government and State and Territory governments, manages and coordinates national contracts to secure the supply of safe and affordable blood products in Australia in accordance with the National Blood Agreement.
Delivery
A. Providing a safe, secure and affordable supply of blood and blood-related products and services to ensure access best meets clinical need in Australia
Finalise and implement national plasma fractionation contract arrangements for supply from 1 January 2018.
Continue implementation of the Immunoglobulin Governance Program.
Finalise and implement the revised National Blood Supply Contingency Plan.
Implement the National Wastage Reduction Strategy. B. Driving performance improvement in the Australian blood sector through a
national information management and data analysis capability
Implement the revised National ICT Strategy.
Implement the revised National Data Strategy.
Finalise the implementation of BloodNet interfaces with hospital laboratory information systems.
Establish immunoglobulin governance performance indicators and reporting. C. Promoting a best practice model of management and use of blood and
blood-related products and services in Australia
Develop and promote an expanded suite of tools to support health providers to implement the National Safety Quality Health Services Blood Standard.
Implement the revised Patient Blood Management (PBM) Implementation Strategy.
Continue the review and revision of criteria for access to immunoglobulin products under the national blood arrangements.
Revise and publish updated editions of the PBM Guidelines.
3 Progress against the performance criteria published in the 2016-17 Portfolio Budget Statements will be
reported in the 2016-17 NBA Annual Report.

NBA – Entity Budget Statements – Entity Overview and Resources
349
NB
A
Performance criteria
A. Providing a safe, secure and affordable supply of blood and blood-related products and services to ensure access best meets clinical need in Australia
Provision of an adequate, affordable and secure supply of blood and blood products.
2016-17 Estimated result 2017-18 Target 2018-19 (& beyond) Target
Supply has been met within the requirements of the approved National Supply Plan and Budget. There have been no contingency events and no product shortages reported.
Blood products are available to meet clinical need.
As per 2017-18.
Variance between actual and NBA estimated demand for supply of products.
2016-17 Estimated result
2017-18 Target
2018-19 Target
2019-20 Target
2020-21 Target
<5% <5% <5% <5% <5%
Discards as a percentage of total issues of red blood cells.
2016-17 Estimated result
2017-18 Target
2018-19 Target
2019-20 Target
2020-21 Target
<3.5% <3% <3% <3% <3%
B. Driving performance improvement in the Australian blood sector through a national information management and data analysis capability
National data and ICT strategy and National Patient Blood Management Guidelines Implementation Strategy are progressed.
2016-17 Estimated result 2017-18 Target 2018-19 (& beyond) Target
Work continues to be progressed leading to improved management of products, and reduced wastage of fresh blood and costs.4
Performance scorecard and comparator benchmark data is published by 31 December each year.
As per 2017-18.
Percentage of national blood supply processed by laboratories interfaced to BloodNet.
2016-17 Estimated result
2017-18 Target
2018-19 Target
2019-20 Target
2020-21 Target
≥40% ≥50% ≥60% ≥80% ≥85%
4 Further information available at: www.blood.gov.au/wastage

NBA – Entity Budget Statements – Entity Overview and Resources
350
C. Promoting a best practice model of management and use of blood and blood-related products and services in Australia
There is a robust framework supporting best practice management and use of blood and blood products.
2016-17 Estimated result 2017-18 Target 2018-19 (& beyond) Target
Best practice management and use of blood and blood products has been supported, resulting in reduced wastage of fresh blood supplies.5
Sustain improvements in the management and use of blood products by:
Improving inventory management practices as part of the National Inventory Management Framework rollout.
Reduction in wastage in comparison to the 2016-17 result.
Improving the delivery schedule for fresh products by a reduction in the number of orders by health providers.
As per 2017-18.
Support clinicians to use best practice models for the management and use of blood and blood products.
2016-17 Estimated result 2017-18 Target 2018-19 (& beyond) Target
On track to publish 5 clinical practice tools.
Develop and promote a number of clinical guidelines, clinical practice tools and resources for use within the sector.
As per 2017-18.
Material changes to Program 1.1 resulting from the following measures: There are no material changes to Program 1.1 resulting from measures.
5 Further information available at: www.blood.gov.au/wastage

NBA – Entity Budget Statements – Budgeted Financial Statements
351
NB
A
Section 3: Budgeted Financial Statements
Section 3 presents budgeted financial statements which provide a comprehensive snapshot of entity finances for the 2017-18 Budget year, including the impact of Budget measures and resourcing on financial statements.
3.1 BUDGETED FINANCIAL STATEMENTS
3.1.1 Differences Between Entity Resourcing and Financial Statements
This section is not applicable to the NBA.
3.1.2 Explanatory Notes and Analysis of Budgeted Financial Statements
Departmental Resources
Comprehensive Income Statement
This statement illustrates the expected financial results for the NBA by identifying accrual expenses and revenues showing the net cost of services.
The NBA’s operational costs are funded jointly by the Australian Government and State and Territory Governments, on a 63 per cent: 37 per cent basis via annual contributions. All NBA receipts and payments are accounted for through special accounts.
The NBA expects a break even position for the Budget year and all forward years.
The income statement deficit in the Budget year and forward years is as a result of the Government’s decision to no longer fund for depreciation via an operating appropriation.
Balance Sheet
Special account accumulated funds are held within the Official Public Account and included as Receivables in the Balance Sheet. The NBA always maintains sufficient accumulated funds to cover employee entitlements and other liabilities.
The value of intangible assets increases from 2017-18 onwards due to the development of replacement systems. Other non-financial assets and liabilities will remain broadly stable over the period.
Administered Resources
Schedule of Budgeted Income and Expenses Administered on Behalf of Government
The NBA’s administered accounts include contributions from all States and Territories and the Australian Government for the supply of blood and blood related products for 2017-18. Each year the Council of Australian Governments’ (COAG) Health Council approves an Annual National Supply Plan and Budget which is formulated by the NBA, derived from demand estimates provided by the States and Territories.
NBA – Entity Budget Statements – Budgeted Financial Statements
352
Schedule of Budgeted Assets and Liabilities Administered on Behalf of Government
The schedule of budgeted assets and liabilities administered on behalf of Government illustrates normal movements in non-financial assets and liabilities. The balance of Receivables represents GST payments made to suppliers which are recoverable from the Australian Taxation Office. Other non-financial assets represent a prepayment to the Australian Red Cross Blood Service under the Output Based Funding Model agreement.
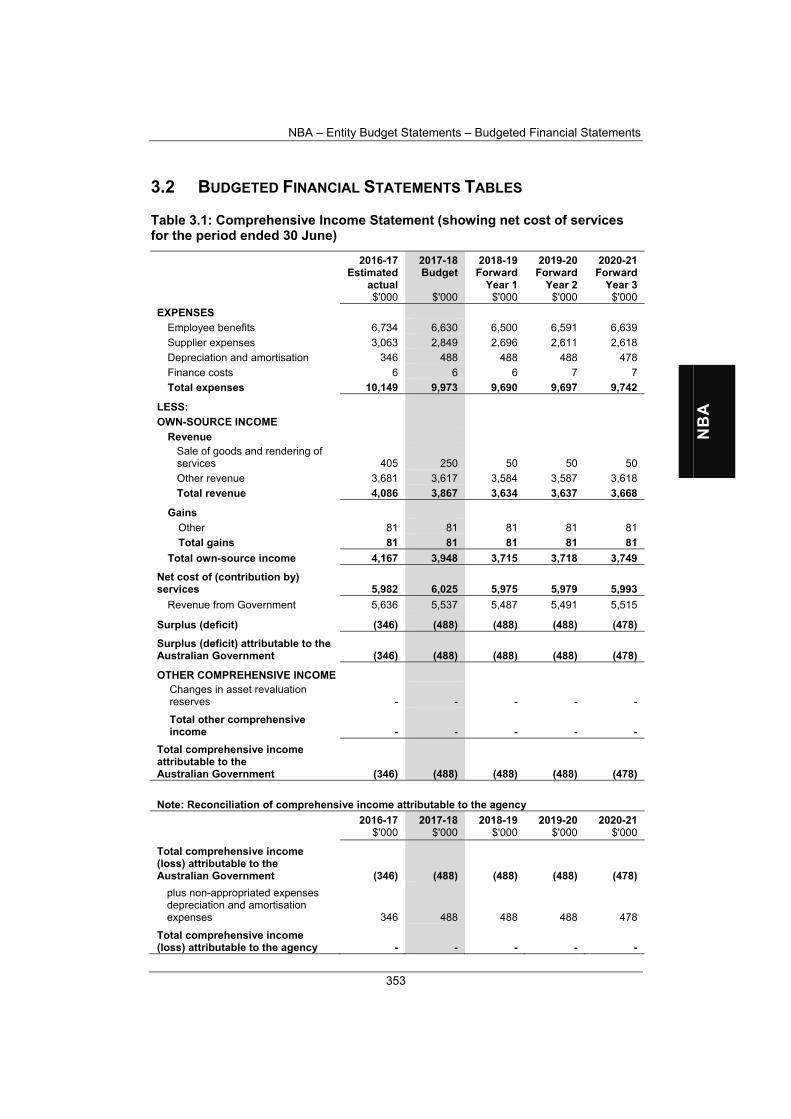
NBA – Entity Budget Statements – Budgeted Financial Statements
353
NB
A
3.2 BUDGETED FINANCIAL STATEMENTS TABLES
Table 3.1: Comprehensive Income Statement (showing net cost of services for the period ended 30 June)
2016-17 Estimated
actual$'000
2017-18 Budget
$'000
2018-19 Forward
Year 1$'000
2019-20 Forward
Year 2 $'000
2020-21 Forward
Year 3 $'000
EXPENSES
Employee benefits 6,734 6,630 6,500 6,591 6,639
Supplier expenses 3,063 2,849 2,696 2,611 2,618
Depreciation and amortisation 346 488 488 488 478
Finance costs 6 6 6 7 7
Total expenses 10,149 9,973 9,690 9,697 9,742
LESS:
OWN-SOURCE INCOME
Revenue Sale of goods and rendering of services 405 250 50 50 50
Other revenue 3,681 3,617 3,584 3,587 3,618
Total revenue 4,086 3,867 3,634 3,637 3,668
Gains
Other 81 81 81 81 81
Total gains 81 81 81 81 81
Total own-source income 4,167 3,948 3,715 3,718 3,749
Net cost of (contribution by) services 5,982 6,025 5,975 5,979 5,993
Revenue from Government 5,636 5,537 5,487 5,491 5,515
Surplus (deficit) (346) (488) (488) (488) (478)
Surplus (deficit) attributable to the Australian Government (346) (488) (488) (488) (478)
OTHER COMPREHENSIVE INCOME Changes in asset revaluation reserves - - - - -
Total other comprehensive income - - - - -
Total comprehensive income attributable to the Australian Government (346) (488) (488) (488) (478)
Note: Reconciliation of comprehensive income attributable to the agency 2016-17
$'000 2017-18
$'000 2018-19
$'000 2019-20
$'000 2020-21
$'000
Total comprehensive income (loss) attributable to the Australian Government (346) (488) (488) (488) (478)
plus non-appropriated expenses depreciation and amortisation expenses 346 488 488 488 478
Total comprehensive income (loss) attributable to the agency - - - - -

NBA – Entity Budget Statements – Budgeted Financial Statements
354
Table 3.2: Budgeted Departmental Balance Sheet (as at 30 June)
2016-17 Estimated
actual$'000
2017-18 Budget
$'000
2018-19 Forward
Year 1$'000
2019-20 Forward
Year 2 $'000
2020-21 Forward
Year 3 $'000
ASSETS
Financial assets
Cash and cash equivalents 30 30 30 30 30
Receivables 9,141 9,147 9,153 9,159 9,159
Total financial assets 9,171 9,177 9,183 9,189 9,189
Non-financial assets
Land and buildings 879 870 761 652 553
Property, plant and equipment 442 373 304 185 66
Intangibles 481 692 998 1,355 1,740
Other 149 149 149 149 149
Total non-financial assets 1,951 2,084 2,212 2,341 2,508
Total assets 11,122 11,261 11,395 11,530 11,697
LIABILITIES
Payables
Suppliers 397 397 397 397 397
Other payables 561 561 561 561 561
Total payables 958 958 958 958 958
Provisions
Employees 1,734 1,734 1,734 1,734 1,734
Other provisions 147 153 159 165 165
Total provisions 1,881 1,887 1,893 1,899 1,899
Total liabilities 2,839 2,845 2,851 2,857 2,857
Net Assets 8,283 8,416 8,544 8,673 8,840
EQUITY
Contributed equity 3,944 4,565 5,181 5,798 6,443
Reserves 359 359 359 359 359
Retained surpluses (accumulated deficits) 3,980 3,492 3,004 2,516 2,038
Total equity 8,283 8,416 8,544 8,673 8,840
Table 3.3: Departmental Statement of Changes in Equity – Summary of Movement (Budget year 2017-18)
Retained earnings
$'000
Asset revaluation
reserve $'000
Contributed equity/capital
$'000
Total equity
$'000
Opening balance as at 1 July 2017
Balance carried forward from previous period 3,980 359 3,944 8,283
Surplus (deficit) for the period (488) - - (488)
Appropriation (equity injection) - - - -
Capital budget - Bill 1 (DCB) - - 621 621
Estimated closing balance as at 30 June 2018 3,492 359 4,565 8,416
DCB = Departmental Capital Budget.

NBA – Entity Budget Statements – Budgeted Financial Statements
355
NB
A
Table 3.4: Budgeted Departmental Statement of Cash Flows (for the period ended 30 June)
2016-17 Estimated
actual$'000
2017-18 Budget
$'000
2018-19 Forward estimate
$'000
2019-20 Forward estimate
$'000
2020-21 Forward estimate
$'000
OPERATING ACTIVITIES
Cash received
Appropriations 5,636 5,537 5,487 5,491 5,515
Net GST received 253 253 253 253 253
Other cash received 4,086 3,867 3,634 3,637 3,668 Cash from the Official Public Account (159) (137) (139) (146) (146)
Total cash received 9,816 9,520 9,235 9,235 9,290
Cash used
Employees 6,734 6,630 6,500 6,591 6,639
Suppliers 3,075 2,861 2,708 2,618 2,625
Net GST paid 31 29 27 26 26 Cash to the Official Public Account - - - - -
Total cash used 9,840 9,520 9,235 9,235 9,290
Net cash from (or used by) operating activities (24) - - - -
INVESTING ACTIVITIES
Cash used
Purchase of property, plant and equipment 631 621 616 617 645
Total cash used 631 621 616 617 645
Net cash from (or used by) investing activities (631) (621) (616) (617) (645)
FINANCING ACTIVITIES
Cash received
Capital budget - Bill 1 (DCB) 631 621 616 617 645
Total cash received 631 621 616 617 645
Net cash from (or used by) financing activities 631 621 616 617 645
Net increase (or decrease) in cash held (24) - - - -
Cash and cash equivalents at the beginning of the reporting period 54 30 30 30 30
Cash and cash equivalents at the end of the reporting period 30 30 30 30 30
DCB = Departmental Capital Budget.

NBA – Entity Budget Statements – Budgeted Financial Statements
356
Table 3.5: Departmental Capital Budget Statement (for the period ended 30 June)
2016-17 Estimated
actual$'000
2017-18 Budget
$'000
2018-19 Forward estimate
$'000
2019-20 Forward estimate
$'000
2020-21 Forward estimate
$'000
CAPITAL APPROPRIATIONS
Capital budget - Bill 1 (DCB) 631 621 616 617 645
Total capital appropriations 631 621 616 617 645
Total new capital appropriations represented by:
Purchase of non-financial assets 631 621 616 617 645
Total items 631 621 616 617 645
PURCHASE OF NON-FINANCIAL ASSETS
Funded by capital appropriation - DCB (a) 631 621 616 617 645
Funded internally from departmental resources - - - - -
Total acquisitions of non-financial assets 631 621 616 617 645
RECONCILIATION OF CASH USED TO ACQUIRE ASSETS TO ASSET MOVEMENT TABLE
Total purchases 631 621 616 617 645
Total cash used to acquire assets 631 621 616 617 645
DCB = Departmental Capital Budget.
(a) Does not include annual finance lease costs. Includes purchases from current and previous years' Departmental Capital Budgets (DCB).

NBA – Entity Budget Statements – Budgeted Financial Statements
357
NB
A
Table 3.6: Statement of Asset Movements (Budget year 2017-18)
Buildings
$'000
Other property, plant and
equipment $'000
Intangibles
$'000
Total
$'000
As at 1 July 2017
Gross book value 1,242 952 3,965 6,159
Accumulated depreciation/ amortisation and impairment (363) (510) (3,484) (4,357)
Opening net book balance 879 442 481 1,802
CAPITAL ASSET ADDITIONS
Estimated expenditure on new or replacement assets
By purchase - appropriation equity - - - -
By purchase - appropriation ordinary annual services 100 50 471 621
By purchase - internal resources - - - -
Total additions 100 50 471 621
Other movements
Depreciation/amortisation expense (109) (119) (260) (488)
Total other movements (109) (119) (260) (488)
As at 30 June 2018
Gross book value 1,342 1,002 4,436 6,780 Accumulated depreciation/ amortisation and impairment (472) (629) (3,744) (4,845)
Closing net book balance 870 373 692 1,935

NBA – Entity Budget Statements – Budgeted Financial Statements
358
Table 3.7: Schedule of Budgeted Income and Expenses Administered on Behalf of Government (for the period ended 30 June)
2016-17 Estimated
actual$'000
2017-18 Budget
$'000
2018-19 Forward estimate
$'000
2019-20 Forward estimate
$'000
2020-21 Forward estimate
$'000
EXPENSES ADMINISTERED ON BEHALF OF GOVERNMENT
Employee benefits 362 634 - - -
Suppliers 1,133,949 1,197,422 1,279,759 1,363,891 1,484,042
Grants - - - - -
Depreciation and amortisation 761 675 - - -
Total expenses administered on behalf of Government 1,135,072 1,198,731 1,279,759 1,363,891 1,484,042
INCOME ADMINISTERED ON BEHALF OF GOVERNMENT
Revenue
Non-taxation
Other sources of non-taxation revenues 1,058,691 1,203,441 1,283,905 1,368,037 1,488,188
Total non-taxation revenue 1,058,691 1,203,441 1,283,905 1,368,037 1,488,188
Total revenues administered on behalf of Government 1,058,691 1,203,441 1,283,905 1,368,037 1,488,188
Total income administered on behalf of Government 1,058,691 1,203,441 1,283,905 1,368,037 1,488,188

NBA – Entity Budget Statements – Budgeted Financial Statements
359
NB
A
Table 3.8: Schedule of Budgeted Assets and Liabilities Administered on Behalf of Government (as at 30 June)
2016-17 Estimated
actual$'000
2017-18 Budget
$'000
2018-19 Forward estimate
$'000
2019-20 Forward estimate
$'000
2020-21 Forward estimate
$'000
ASSETS ADMINISTERED ON BEHALF OF GOVERNMENT
Financial assets
Cash and cash equivalent 337 337 337 337 337
Receivables 23,635 24,469 24,469 24,469 24,469
Investments 123,746 128,816 132,962 137,108 141,254
Total financial assets 147,718 153,622 157,768 161,914 166,060
Non-financial assets
Property, plant and equipment 125 115 115 115 115
Intangibles 2,534 2,819 2,819 2,819 2,819
Inventories 105,598 105,598 105,598 105,598 105,598
Other 76,055 76,055 76,055 76,055 76,055
Total non-financial assets 184,312 184,587 184,587 184,587 184,587
Total assets administered on behalf of Government 332,030 338,209 342,355 346,501 350,647
LIABILITIES ADMINISTERED ON BEHALF OF GOVERNMENT
Interest bearing liabilities Payables
Suppliers 51,489 51,489 51,489 51,489 51,489
Total payables 51,489 51,489 51,489 51,489 51,489
Total liabilities administered on behalf of Government 51,489 51,489 51,489 51,489 51,489

NBA – Entity Budget Statements – Budgeted Financial Statements
360
Table 3.9: Schedule of Budgeted Administered Cash Flows (for the period ended 30 June)
2016-17 Estimated
actual$'000
2017-18 Budget
$'000
2018-19 Forward estimate
$'000
2019-20 Forward estimate
$'000
2020-21 Forward estimate
$'000
OPERATING ACTIVITIES
Cash received
Commonwealth contributions 664,802 748,914 800,066 852,943 928,507
State and Territory contributions 387,743 449,457 479,693 510,948 555,535
Interest 4,146 5,070 4,146 4,146 4,146
Net GST received 100,500 100,500 100,500 100,500 100,500
Other 90,898 14,300 29,441 37,854 49,870
Total cash received 1,248,089 1,318,241 1,413,846 1,506,391 1,638,558
Cash used
Employees 362 634 - - -
Suppliers 1,129,803 1,192,352 1,275,613 1,359,745 1,479,896
Grant payments - - - - -
Net GST paid 112,980 119,235 127,561 135,974 147,990
Total cash used 1,243,145 1,312,221 1,403,174 1,495,719 1,627,886
Net cash from (or used by) operating activities 4,944 6,020 10,672 10,672 10,672
INVESTING ACTIVITIES
Cash received Proceeds from sale of investments 58,200 63,500 - - -
Total cash received 58,200 63,500 - - -
Cash used
Purchase of investments 63,296 69,520 10,672 10,672 10,672
Total cash used 63,296 69,520 10,672 10,672 10,672
Net cash from (or used by) investing activities (5,096) (6,020) (10,672) (10,672) (10,672)
Net increase (or decrease) in cash held (152) - - - -
Cash at beginning of reporting period 489 337 337 337 337
Cash from Official Public Account for:
- special accounts 1,301,251 1,377,881 1,413,846 1,506,391 1,638,558
- appropriations 5,190 3,860 - - -
Cash to Official Public Account for:
- special accounts 1,306,441 1,381,741 1,413,846 1,506,391 1,638,558
- appropriations - - - - -
Cash at end of reporting period 337 337 337 337 337

361
NH
FB
NATIONAL HEALTH FUNDING
BODY
Entity Resources and Planned Performance

362

363
NH
FB
NATIONAL HEALTH FUNDING
BODY
Section 1: Entity Overview and Resources ...................................................... 364
1.1 Strategic Direction Statement ................................................................... 364
1.2 Entity Resource Statement ....................................................................... 366
1.3 Budget Measures ...................................................................................... 367
Section 2: Outcomes and Planned Performance ............................................. 368
2.1 Budgeted Expenses and Performance ..................................................... 368
Section 3: Budgeted Financial Statements ...................................................... 375
3.1 Budgeted Financial Statements ................................................................ 375
3.2 Budgeted Financial Statements Tables .................................................... 376

NHFB – Entity Budget Statements – Entity Overview and Resources
364
Section 1: Entity Overview and Resources
1.1 STRATEGIC DIRECTION STATEMENT1
The role of the National Health Funding Body (NHFB) is to support the obligations and responsibilities of the Administrator of the National Health Funding Pool (the Administrator) by providing transparent and efficient administration of the Commonwealth, State and Territory funding of the Australian public hospital system. The Administrator and the NHFB were created through the Council of Australian Governments’ National Health Reform Agreement of August 2011. The functions of the Administrator are set out in the National Health Reform Act 2011 and common provisions in relevant State and Territory legislation.
The functions of the NHFB are to assist the Administrator in:
calculating and advising the Commonwealth Treasurer of the National Health Reform Agreement funding to be paid by the Commonwealth to each State and Territory for public hospital services, including advice on any reconciliation of amounts paid against actual services provided;
managing the National Health Funding Pool, comprised of a Reserve Bank of Australia account for each State and Territory (State Pool Accounts), which receive all Commonwealth and State activity-based hospital funding, and make payments to Local Hospital Networks and other parties;
overseeing transactions through the National Health Funding Pool using the National Payments System (Payments System);
reporting publicly on National Health Reform Agreement funding and payments made from each State Pool Account and each State Managed Fund;
developing the Administrator’s rolling Three Year Data Plan which details the Administrator’s data requirements, standards, and timelines to the Commonwealth, and States and Territories; and
undertaking Commonwealth funding integrity analysis through data matching by linking hospital activity, Medicare Benefits Schedule and Pharmaceutical Benefits Scheme data.
Following the signing of the Addendum to the National Health Reform Agreement (Addendum) by the Prime Minister and First Ministers in 2017, the Administrator and NHFB are required to implement a cap on the Commonwealth National Health Reform funding; administer pricing and funding for safety and quality; and introduce data conditional payments to improve submission timeliness of hospital activity data.
To support its existing role and new functions, the Government will increase funding to the National Health Funding Body (NHFB) by $4.1 million over three years.
1 For more information about the strategic direction of the NHFB, refer to the current corporate plan,
available at: www.nhfb.gov.au/publications/

NHFB – Entity Budget Statements – Entity Overview and Resources
365
NH
FB
In addition, to manage the challenges associated with achieving the policy requirements of the Addendum, the NHFB will:
transition the calculation of the Commonwealth National Health Reform Agreement funding to a more flexible and robust platform to better meet the needs of stakeholders;
improve transparency and assurance over the funding calculations through enhanced reporting, data integrity and quality controls; and
enhance the National Payments System to facilitate and improve the funding and payments to Local Hospital Networks for delivering public hospital services.

NHFB – Entity Budget Statements – Entity Overview and Resources
366
1.2 ENTITY RESOURCE STATEMENT
Table 1.1 shows the total funding from all sources available to the entity for its operations and to deliver programs and services on behalf of the Government.
The table summarises how resources will be applied by outcome (Government strategic policy objectives) and by administered (on behalf of the Government or the public) and departmental (for the entity’s operations) classification.
For more detailed information on special accounts and special appropriations, please refer to Budget Paper No. 4 – Agency Resourcing.
Information in this table is presented on a resourcing (i.e. appropriations/cash available) basis, whilst the ‘Budgeted expenses by outcome’ tables in Section 2 and the financial statements in Section 3 are presented on an accrual basis.
Table 1.1: NHFB Resource Statement – Budget Estimates for 2017-18 as at Budget May 2017
2016-17Estimated
actual$'000
2017-18 Estimate
$'000
DEPARTMENTAL
Prior year appropriation available 1,989 1,489
Annual appropriations
Ordinary annual services (a)
Departmental appropriation 4,307 5,844
s74 retained revenue receipts (b) - -
Departmental capital budget (c) - -
Other services(d)
Equity injection - -
Total departmental annual appropriations 4,307 5,844
Total departmental resourcing 6,296 7,333
Total resourcing for NHFB 6,296 7,333
2016-17 2017-18
Average staffing level (number) 19 21
All figures are GST exclusive. Prepared on resourcing (i.e. appropriation available) basis. (a) Appropriation Bill (No. 1) 2017-18. (b) Estimated retained revenue receipts under section 74 of the PGPA Act 2013. (c) Departmental Capital Budget (DCB) are not separately identified in Appropriation Bill (No. 1) and form part
of ordinary annual services items. Please refer to Table 3.5 for further details. For accounting purposes, this amount has been designated as a 'contribution by owner'.
(d) Appropriation Bill (No. 2) 2017-18.

NHFB – Entity Budget Statements – Entity Overview and Resources
367
NH
FB
1.3 BUDGET MEASURES
Budget measures in Part 1 relating to the NHFB are detailed in Budget Paper No. 2 and are summarised below.
Table 1.2: NHFB 2017-18 Budget Measures
Program 2016-17$'000
2017-18 $'000
2018-19$'000
2019-20 $'000
2020-21 $'000
National Health Funding Body - funding requirements
National Health Funding Body
Departmental expenses 1.1 - 1,597 1,154 1,343 -
Total expenses - 1,597 1,154 1,343 -

NHFB – Entity Budget Statements – Outcomes and Planned Performance
368
Section 2: Outcomes and Planned Performance
Government outcomes are the intended results, impacts or consequences of actions by the Government on the Australian community. Commonwealth programs are the primary vehicle by which Government entities achieve the intended results of their outcome statements. Entities are required to identify the programs which contribute to Government outcomes over the Budget and forward years.
Each outcome is described below together with its related programs. The following provides detailed information on expenses for each outcome and program, further broken down by funding source.
Note:
Performance reporting requirements in the Portfolio Budget Statements are part of the Enhanced Commonwealth Performance Framework established by the Public Governance, Performance and Accountability Act 2013. It is anticipated that the performance criteria described in Portfolio Budget Statements will be read with broader information provided in an entity’s corporate plans and annual performance statements – included in Annual Reports – to provide an entity’s complete performance story.
The NHFB’s most recent corporate plan is available at: www.nhfb.gov.au/publications
The NHFB’s most recent annual performance statement is available at: www.nhfb.gov.au/publications
2.1 BUDGETED EXPENSES AND PERFORMANCE
Outcome 1
Provide transparent and efficient administration of Commonwealth, State and Territory funding of the Australian public hospital system, and support the obligations and responsibilities of the Administrator of the National Health Funding Pool
Program Contributing to Outcome 1
Program 1.1: National Health Funding Pool Administration

NHFB – Entity Budget Statements – Outcomes and Planned Performance
369
NH
FB
Linked Programs
Other Commonwealth entities that contribute to Outcome 1
Department of Health Program 2.7: Hospital Services The Department of Health has policy responsibility for public and private hospital services, including the Commonwealth Government funding contribution for public hospital services. This includes policy responsibility for the Administrator and the National Health Funding Body.
The Treasury Program 1.5: Assistance to the States for Healthcare Services The Commonwealth Treasury transfers to the National Health Funding Pool the amount of Commonwealth funding to which each State and Territory (including Local Hospital Networks in each jurisdiction) is entitled, and makes the payments on the dates specified in the Intergovernmental Agreement on Federal Financial Relations.
Budgeted Expenses for the NHFB
Table 2.1.1 shows how much the entity intends to spend (on an accrual basis) on achieving the outcome, broken down by program, as well as by administered and departmental funding sources.
Table 2.1.1: Budgeted Expenses for the NHFB
2016-17 Estimated
actual$'000
2017-18 Budget
$'000
2018-19 Forward
Year 1$'000
2019-20 Forward
Year 2 $'000
2020-21 Forward
Year 3 $'000
Program 1.1: National Health Funding Pool Administration
Departmental expenses
Departmental appropriation (a) 4,307 5,844 5,373 5,570 4,248
Expenses not requiring appropriation 53 55 57 57 in the Budget year (b) 51
Operating deficit (surplus) 500 - - - -
Total for Program 1.1 4,858 5,897 5,428 5,627 4,305
Total expenses for Outcome 1 4,858 5,897 5,428 5,627 4,305
2016-17 2017-18
Average staffing level (number) 19 21
(a) Departmental appropriation combines ‘Ordinary annual services (Appropriation Bill No. 1)’ and ‘Revenue from independent sources (s74)’.
(b) Expenses not requiring appropriation in the Budget year are made up of depreciation expense, amortisation expense, makegood expense and audit fees.

NHFB – Entity Budget Statements – Outcomes and Planned Performance
370
Planned Performance for the NHFB
Table 2.1.2 below details the performance criteria for the program associated with Outcome 1.2 It also summarises how the program is delivered and where 2017-18 Budget measures have materially changed the program.
Table 2.1.2: Performance Criteria for the NHFB
Purpose
To support the obligations and responsibilities of the Administrator by providing transparent and efficient administration of Commonwealth, State and Territory funding of the Australian public hospital system.
Outcome 1
Provide transparent and efficient administration of Commonwealth, State and Territory funding of the Australian public hospital system, and support the obligations and responsibilities of the Administrator of the National Health Funding Pool
Program 1.1: National Health Funding Pool Administration
The NHFB supports the Administrator of the National Health Funding Pool (the Funding Pool) in paying and distributing Commonwealth and State and Territory funding for public hospitals – responsible for around $40 billion a year. The NHFB ensures that payments from the Funding Pool are made in accordance with directions from the responsible State or Territory Minister, and in line with the National Health Reform Agreement (NHR Agreement) and Addendum. The Government will increase funding by $4.1 million over three years to the NHFB to support its existing role and new functions arising from the Council of Australian Governments’ agreement on public hospital funding.
Delivery
A. Accountability through assisting the Administrator in implementing and overseeing a nationally consistent public hospital funding arrangement through the National Health Funding Pool
Develop and publish documents that will provide expert NHR Agreement policy advice to the Administrator and stakeholders.
Develop and implement efficient and robust processes to oversee NHR Agreement funding and payments through the Funding Pool.
Assist the Administrator to ensure the Funding Pool operations are in accordance with directions from the responsible State or Territory Minister, and in line with the NHR Agreement.
B. Increasing transparency and effective reporting of the funding to Local Hospital Networks for services delivered
Develop and publish the National Health Funding Pool Annual Report and Financial Statements for each financial year.
Ensure monthly reporting requirements under the National Health Reform Act 2011 are satisfied.
2 Progress against the performance criteria published in the 2016-17 Portfolio Budget Statements will be
reported in the 2016-17 NHFB Annual Report.

NHFB – Entity Budget Statements – Outcomes and Planned Performance
371
NH
FB
C. Producing accurate Commonwealth funding contribution calculations by using nationally consistent pricing and costing standards
Calculate the Commonwealth funding contribution accurately (assessed by acceptance of the calculation by the Commonwealth, States and Territories).
Reconcile estimated and actual volume of service delivery for calculation of Commonwealth funding contributions.
The calculation forms the Administrator’s advice to the Commonwealth Treasurer. D. Operating as a fully functional and compliant agency, meeting statutory and
legislative obligations, and developing productive and effective partnerships with stakeholders
Robust policies and procedures are in place, including ensuring all NHFB values are reflected and compliant with relevant statutory and legislative requirements.
Maintain and continually strengthen productive partnerships and collaboration with all stakeholders, adhering to good governance principles.
Performance criteria
A. Accountability through assisting the Administrator in implementing and overseeing a nationally consistent public hospital funding arrangement through the National Health Funding Pool (the Funding Pool)
Develop and publish documents that will provide expert NHR Agreement policy advice to the Administrator and stakeholders.
2016-17 Estimated result 2017-18 Target 2018-19 (& beyond) Target
Key policy documents will be published to a satisfactory standard, and are on track to be accepted by the Administrator and all jurisdictions. This includes the rolling Three Year Data Plan, accepted by the Council of Australian Governments’ (COAG) Health Council, and associated documents that enabled States and Territories to submit all required data.
Timely production of key policy documents to a satisfactory standard to enable acceptance by the Administrator and all jurisdictions. Develop and release policies to provide expert advice on the implementation of the Addendum.
As per 2017-18.

NHFB – Entity Budget Statements – Outcomes and Planned Performance
372
Develop and implement efficient and robust processes to oversee NHR Agreement funding and payments through the Funding Pool.
2016-17 Estimated result 2017-18 Target 2018-19 (& beyond) Target
The NHFB and State and Territory Payments System Procedures Manuals, which cover the procedures for the Funding Pool, have been reviewed and published. An independent third-party review was completed on the Payments System Internal Control Framework, on behalf of all Auditors-General. The review did not identify any material, systemic control or process weaknesses.
Ensure all payments made in accordance with the authorised Payments System Procedures Manuals. The independent third-party review of the Payments System Internal Control Framework does not find any material weaknesses and is satisfactory to all Auditors-General. Engage with jurisdictions to enhance data integrity and assurance processes, in line with the Addendum.
As per 2017-18.
National Health Funding Pool operations and payments are in accordance with directions from the responsible State or Territory Minister.
2016-17 Estimated result
2017-18 Target
2018-19 Target
2019-20 Target
2020-21 Target
100% 100% 100% 100% TBC3
B. Increasing transparency and effective reporting of the funding to Local Hospital Networks for services delivered
The Annual Report on the operations of the Administrator of the Funding Pool is submitted to each Health Minister for tabling as per the National Health Reform Act 2011.
2016-17 Estimated result 2017-18 Target 2018-19 (& beyond)Target
A single 2015-16 annual report and accompanying financial statements on the operation of the Funding Pool was tabled in the Commonwealth Parliament and each State and Territory Parliament on 31 October 2016. The annual report included a combined financial statement for the Funding Pool, and financial statements for each State and Territory Pool Account audited by the respective Auditor-General.
Release a single annual report and accompanying financial statements on the operation of the Funding Pool and table in the Commonwealth Parliament, and each State and Territory Parliament. The annual report will include a combined financial statement for the Funding Pool, and financial statements for each State and Territory State Pool Account audited by the respective Auditor-General.
As per 2017-18.
3 The National Health Reform Agreement (2011) and Addendum (2017) secure public hospital funding
arrangements until 30 June 2020. The Commonwealth and States and Territories will begin discussions regarding funding arrangements for 1 July 2020 onward in 2018.

NHFB – Entity Budget Statements – Outcomes and Planned Performance
373
NH
FB
Financial statements were prepared for each State Pool Account and received an unqualified audit by the relevant Auditor-General.
2016-17 Estimated result
2017-18 Target
2018-19 Target
2019-20 Target
2020-21 Target
100% 100% 100% 100% TBC4
Monthly reports of the funding and payments through the Funding Pool and State Managed Funds are produced and published to support the transparency of public hospital funding.5
2016-17 Estimated result
2017-18 Target
2018-19 Target
2019-20 Target
2020-21 Target
100% (1,780 reports published)
100% 100% 100% TBC6
C. Producing accurate Commonwealth funding contribution calculations by using nationally consistent pricing and costing standards
The Commonwealth funding contribution is accurately calculated and is accepted by the Administrator and informs the basis of advice to the Commonwealth Treasurer.
2016-17 Estimated result 2017-18 Target 2018-19 (& beyond) Target
The 2016-17 and 2017-18 Commonwealth Contribution Models have been developed and accepted by the Administrator to calculate the Commonwealth NHR funding for each State and Territory.
Current and future year Commonwealth Contribution Models are developed and accepted by the Administrator to calculate the Commonwealth NHR funding for each State and Territory.
As per 2017-18.
4 The National Health Reform Agreement (2011) and Addendum (2017) secure public hospital funding
arrangements until 30 June 2020. The Commonwealth and States and Territories will begin discussions regarding funding arrangements for 1 July 2020 onward in 2018.
5 This includes a national report, a report for each State and Territory, and a report for each Local Hospital Network.
6 The National Health Reform Agreement (2011) and Addendum (2017) secure public hospital funding arrangements until 30 June 2020. The Commonwealth and States and Territories will begin discussions regarding funding arrangements for 1 July 2020 onward in 2018.

NHFB – Entity Budget Statements – Outcomes and Planned Performance
374
D. Operating as a fully functional and compliant agency, meeting statutory and legislative obligations, and developing productive and effective partnerships with stakeholders
Robust policies and procedures are in place, including ensuring all NHFB values are reflected, and compliant with relevant statutory and legislative requirements.
2016-17 Estimated result 2017-18 Target 2018-19 (& beyond) Target
Policies and procedures are in place, supporting the integrity of the NHFB and the health and wellbeing of staff. These cover governance, performance, controls, risk management, fraud and human resources. In 2016-17 the NHFB negotiated an Enterprise Agreement, and developed a Workforce Capability Framework and a Health and Wellbeing Strategy. All compliance reporting requirements for the NHFB as a non-corporate entity have been met. The 2015-16 NHFB Annual Report was provided to all Health Ministers and the financial statements received an unqualified audit opinion.
Policies and procedures are in place to support the integrity of the NHFB and the health and wellbeing of staff. All compliance reporting requirements for the NHFB as a non-corporate entity are met. The NHFB Annual Report is provided to all Health Ministers and the financial statements receive an unqualified audit opinion.
As per 2017-18.
Maintain and continually strengthen productive partnerships and collaboration with all stakeholders to ensure support the obligations and responsibilities of the Administrator.
2016-17 Estimated result 2017-18 Target 2018-19 (& beyond) Target
Effective partnerships were maintained through national and bi-lateral collaboration with the Commonwealth, States and Territories, and other national bodies and stakeholder groups. This has been achieved through national workshops and meetings in 2016-17, and consultation with the Commonwealth, States and Territories in the development of NHR Agreement policy advice to COAG.
Effective partnerships are maintained through national and bi-lateral collaboration with the Commonwealth, States and Territories, and other national bodies and stakeholder groups.
As per 2017-18.
Material changes to Program 1.1 resulting from the following measures: National Health Funding Body – funding requirements

NHFB – Entity Budget Statements – Budgeted Financial Statements
375
NH
FB
Section 3: Budgeted Financial Statements
Section 3 presents budgeted financial statements which provide a comprehensive snapshot of entity finances for the 2017-18 Budget year, including the impact of Budget measures and resourcing on financial statements.
3.1 BUDGETED FINANCIAL STATEMENTS
3.1.1 Differences Between Entity Resourcing and Financial Statements
This section is not applicable to the NHFB.
3.1.2 Explanatory Notes and Analysis of Budgeted Financial Statements
Departmental Resources
Comprehensive Income Statement
The NHFB's appropriation revenue is largely in line with its statutory functions and the National Health Reform Agreement (the Agreement) agreed by the Council of Australian Governments.
The NHFB's departmental appropriation is allocated to fund employees to assist the Administrator of the National Health Funding Pool and to carry out the NHFB's functions. The remaining departmental appropriation is allocated to fund supplier expenses to support the Administrator's obligations under the Agreement. These expenses support the delivery of monthly and annual statutory reporting, operation of the national payments system, and determination of the Commonwealth health funding as required under the National Health Reform Act 2011. The appropriation is also allocated to the review and assurance of data application, and controls over the processes and systems managed by the NHFB.
The NHFB will receive additional funding in 2017-18 of $1.597 million for work associated with the requirements of the Addendum to the Agreement. This includes additional components of the Commonwealth Contribution Model, development of a supporting policy framework, improvements to integrity and assurance processes and enhancement of the national payments system.
Balance Sheet
The NHFB equity position reflects an approved loss of $0.5 million anticipated for 2016-17.
The NHFB does not anticipate the purchase of any major assets with the balance sheet largely reflecting the appropriation held to meet employee and supplier provisions and payables.
Cash Flows
Cash flows are consistent with projected income and expenses.

NHFB – Entity Budget Statements – Budgeted Financial Statements
376
3.2 BUDGETED FINANCIAL STATEMENTS TABLES
Table 3.1: Comprehensive Income Statement (showing net cost of services for the period ended 30 June)
2016-17 Estimated
actual$'000
2017-18 Budget
$'000
2018-19 Forward
Year 1$'000
2019-20 Forward
Year 2 $'000
2020-21 Forward
Year 3 $'000
EXPENSES
Employee benefits 2,322 2,349 2,451 2,455 2,187
Supplier expenses 2,536 3,548 2,977 3,172 2,118
Depreciation and amortisation - - - - -
Total expenses 4,858 5,897 5,428 5,627 4,305
LESS:
OWN-SOURCE INCOME
Own-source revenue
Sale of goods and rendering of services - - - - -
Total revenue - - - - -
Gains
Other 51 53 55 57 57
Total gains 51 53 55 57 57
Total own-source revenue 51 53 55 57 57
Net cost of (contribution by) services 4,807 5,844 5,373 5,570 4,248
Revenue from Government 4,307 5,844 5,373 5,570 4,248
Surplus (Deficit) (500) - - - -
Surplus (Deficit) attributable to the Australian Government (500) - - - -
OTHER COMPREHENSIVE INCOME
Changes in asset revaluation reserves - - - - -
Total other comprehensive income - - - - -
Total comprehensive income attributable to the Australian Government (500) - - - -
Note: Reconciliation of comprehensive income attributable to the agency 2016-17
$'000 2017-18
$'000 2018-19
$'000 2019-20
$'000 2020-21
$'000
Total comprehensive income (loss) attributable to the Australian Government (500) - - - -
plus non-appropriated expenses depreciation and amortisation expenses - - - - -
Total comprehensive income (loss) attributable to the agency (500) - - - -

NHFB – Entity Budget Statements – Budgeted Financial Statements
377
NH
FB
Table 3.2: Budgeted Departmental Balance Sheet (as at 30 June)
2016-17 Estimated
actual$'000
2017-18 Budget
$'000
2018-19 Forward
Year 1$'000
2019-20 Forward
Year 2 $'000
2020-21 Forward
Year 3 $'000
ASSETS
Financial assets
Cash and cash equivalents 25 25 25 25 25
Trade and other receivables 1,489 1,501 1,513 1,513 1,513
Total financial assets 1,514 1,526 1,538 1,538 1,538
Non-financial assets
Other non-financial asset - - - - -
Total non-financial assets - - - - -
Total assets 1,514 1,526 1,538 1,538 1,538
LIABILITIES
Payables
Suppliers 510 510 510 510 510
Other payables 54 54 54 54 54
Total payables 564 564 564 564 564
Provisions
Employees 397 409 421 421 421
Total provisions 397 409 421 421 421
Total liabilities 961 973 985 985 985
Net Assets 553 553 553 553 553
EQUITY
Contributed equity - - - - -
Reserves - - - - - Retained surpluses (accumulated deficits) 553 553 553 553 553
Total equity 553 553 553 553 553
Table 3.3: Departmental Statement of Changes in Equity – Summary of Movement (Budget year 2017-18)
Retained earnings
$'000
Asset revaluation
reserve $'000
Contributed equity/capital
$'000
Total equity
$'000
Opening balance as at 1 July 2017
Balance carried forward from previous period 553 - - 553
Surplus (deficit) for the period - - - -
Capital budget - Bill 1 (DCB) - - - -
Estimated closing balance as at 30 June 2018 553 - - 553
DCB = Departmental Capital Budget.

NHFB – Entity Budget Statements – Budgeted Financial Statements
378
Table 3.4: Budgeted Departmental Statement of Cash Flows (for the period ended 30 June)
2016-17 Estimated
actual$'000
2017-18 Budget
$'000
2018-19 Forward estimate
$'000
2019-20 Forward estimate
$'000
2020-21 Forward estimate
$'000
OPERATING ACTIVITIES
Cash received
Appropriations 4,807 5,844 5,373 5,570 4,248
Net GST received 152 152 155 155 155
Total cash received 4,959 5,996 5,528 5,725 4,403
Cash used
Employees 2,362 2,337 2,439 2,455 2,187
Suppliers 2,445 3,507 2,934 3,115 2,061
Net GST paid 152 152 155 155 155
Total cash used 4,959 5,996 5,528 5,725 4,403
Net cash from (or used by) operating activities - - - - -
INVESTING ACTIVITIES
Cash used
Purchase of property, plant and equipment - - - - -
Total cash used - - - - - Net cash from (or used by) investing activities - - - - -
FINANCING ACTIVITIES
Cash received
Capital budget - Bill 1 (DCB) - - - - -
Total cash received - - - - -
Net cash from (or used by) financing activities
Net increase (or decrease) in cash held - - - - -
Cash and cash equivalents at the beginning of the reporting period 25 25 25 25 25
Cash and cash equivalents at the end of the reporting period 25 25 25 25 25

NHFB – Entity Budget Statements – Budgeted Financial Statements
379
NH
FB
Table 3.5: Departmental Capital Budget Statement (for the period ended 30 June)
2016-17 Estimated
actual$'000
2017-18 Budget
$'000
2018-19 Forward estimate
$'000
2019-20 Forward estimate
$'000
2020-21 Forward estimate
$'000
CAPITAL APPROPRIATIONS
Capital budget - Bill 1 (DCB) - - - - -
Equity injections - Bill 2 - - - - -
Total capital appropriations - - - - -
Total new capital appropriations represented by:
Purchase of non-financial assets - - - - -
Total items - - - - -
PURCHASE OF NON-FINANCIAL ASSETS
Funded by capital appropriations - equity injection (a) - - - - -
Funded by capital appropriation - DCB (b) - - - - -
Funded internally from departmental resources - - - - -
Total acquisitions of non-financial assets - - - - -
RECONCILIATION OF CASH USED TO ACQUIRE ASSETS TO ASSET MOVEMENT TABLE
Total purchases - - - - -
Total cash used to acquire assets - - - - -
(a) Includes both current Bill 2 and prior Act 2/4/6 appropriations and special capital appropriations. (b) Does not include annual finance lease costs. Includes purchases from current and previous years'
Departmental Capital Budgets (DCB).

NHFB – Entity Budget Statements – Budgeted Financial Statements
380
Table 3.6: Statement of Asset Movements (Budget year 2017-18)
Buildings
$'000
Other property, plant and
equipment $'000
Intangibles
$'000
Total
$'000
As at 1 July 2017
Gross book value - - - -
Accumulated depreciation/ amortisation and impairment - - - -
Opening net book balance - - - -
CAPITAL ASSET ADDITIONS
Estimated expenditure on new or replacement assets
By purchase - appropriation equity - - - -
By purchase - appropriation ordinary annual services - - - -
Total additions - - - -
Other movements
Depreciation/amortisation expense - - - -
Total other movements - - - -
As at 30 June 2018
Gross book value - - - - Accumulated depreciation/ amortisation and impairment - - - -
Closing net book balance - - - -

381
NH
MR
C
NATIONAL HEALTH AND MEDICAL
RESEARCH COUNCIL
Entity Resources and Planned Performance

382

383
NH
MR
C
NATIONAL HEALTH AND MEDICAL
RESEARCH COUNCIL
Section 1: Entity Overview and Resources ...................................................... 384
1.1 Strategic Direction Statement ................................................................... 384
1.2 Entity Resource Statement ....................................................................... 385
1.3 Budget Measures ...................................................................................... 387
Section 2: Outcomes and Planned Performance ............................................. 388
2.1 Budgeted Expenses and Performance ..................................................... 388
Section 3: Budgeted Financial Statements ...................................................... 393
3.1 Budgeted Financial Statements ................................................................ 393
3.2 Budgeted Financial Statements Tables .................................................... 394

NHMRC – Entity Budget Statements – Entity Overview and Resources
384
Section 1: Entity Overview and Resources
1.1 STRATEGIC DIRECTION STATEMENT1
The National Health and Medical Research Council (NHMRC) is the Australian Government’s key entity for managing investment in, and integrity of, health and medical research. NHMRC is also responsible for developing evidence-based health advice for the Australian community, health professionals and governments, and for providing advice on ethical practice in health care and in the conduct of health and medical research.
NHMRC’s 2016-20 Corporate Plan outlines major health issues for the period covered by the plan, including how NHMRC will deal with these issues and a national strategy for medical research and public health research. It also sets out NHMRC’s purposes, planned activities and performance for the period, and addresses NHMRC’s capability, environment, and risk oversight and management. The Corporate Plan is tabled annually in Parliament after the Minister’s approval.2
In 2017-18, NHMRC will finalise the outcomes of the Structural Review of NHMRC’s Grant Program (the Review). The Review, which was initiated in 2016 and involved an extensive public consultation process, considered whether the research grants program could be restructured in order to optimise the Australian Government’s investment in health and medical research. The three key aims of the Review were to encourage greater creativity and innovation, reduce the burden on researchers of application and peer review, and provide opportunities for talented researchers at all career stages.
In the 2017-18 Budget, the Government will provide $8.5 million to NHMRC from the agency sustainability stream of the Public Service Modernisation Fund to develop two prototype applications that automate resource intensive and repetitive tasks within the grants administration process. NHMRC will also continue to improve its application and assessment processes for research grants and look for further efficiencies and reductions in red tape for the research community.
NHMRC’s work will also facilitate and promote the translation of evidence derived from health and medical research into practices and systems designed to prevent illness and improve public health. NHMRC’s guidelines and advice will also support the States and Territories in achieving consistent standards in public and environmental health in the detection and prevention of illness.
The role and functions of NHMRC are set out in the National Health and Medical Research Council Act 1992. NHMRC also has statutory obligations under the Prohibition of Human Cloning for Reproduction Act 2002 and the Research Involving Human Embryos Act 2002. NHMRC is a Non-corporate Commonwealth Entity under the Public Governance, Performance and Accountability Act 2013.
1 For more information about the strategic direction of NHMRC, refer to the current corporate plan, available
at: www.nhmrc.gov.au/guidelines-publications/nh171 2 The NHMRC Corporate Plan is developed in accordance with Division 3 of the National Health and
Medical Research Council Act 1992.

NHMRC – Entity Budget Statements – Entity Overview and Resources
385
NH
MR
C
Section s32D(3) of the Medical Research Future Fund Act 2015 (MRFF Act) requires the Australian Medical Research Advisory Board to take into account NHMRC’s strategy for medical research and public health research for the purpose of determining the Australian Medical Research and Innovation Strategy. NHMRC is working closely with the Department of Health to provide effective and efficient support for relevant MRFF investments that leverage NHMRC’s existing capability, including the advanced Research Grants Management System (RGMS).
1.2 ENTITY RESOURCE STATEMENT
Table 1.1 shows the total funding from all sources available to the entity for its operations and to deliver programs and services on behalf of the Government.
The table summarises how resources will be applied by outcome (Government strategic policy objectives) and by administered (on behalf of the Government or the public) and departmental (for the entity’s operations) classification.
For more detailed information on special accounts and special appropriations, please refer to Budget Paper No. 4 – Agency Resourcing.
Information in this table is presented on a resourcing (i.e. appropriations/cash available) basis, whilst the ‘Budgeted expenses by outcome’ tables in Section 2 and the financial statements in Section 3 are presented on an accrual basis.
Table 1.1: NHMRC Resource Statement – Budget Estimates for 2017-18 as at Budget May 2017
2016-17Estimated
actual$'000
2017-18 Estimate
$'000
DEPARTMENTAL
Prior year appropriation available 16,400 15,035
Annual appropriations
Ordinary annual services (a)
Departmental appropriation 37,442 39,005
s74 retained revenue receipts (b) 1,500 1,500
Departmental capital budget (c) 173 171
Other services (d)
Equity injection - 3,879
Total departmental annual appropriations 39,115 44,555
Total departmental resourcing for NHMRC 55,515 59,590

NHMRC – Entity Budget Statements – Entity Overview and Resources
386
Table 1.1: NHMRC Resource Statement – Budget Estimates for 2017-18 as at Budget May 2017 (continued)
2016-17Estimated
actual$'000
2017-18 Estimate
$'000
ADMINISTERED
Prior year appropriation available 151,660 137,350
Annual appropriations
Ordinary annual services (a)
Outcome 1 852,458 871,932
Other services (d)
Administered assets and liabilities - -
Total administered annual appropriations 852,458 871,932
Special Accounts (e)
Appropriation receipts 807,383 817,990
Appropriation receipts - other entities (f) - -
Non-appropriation receipts 20,000 11,000
Total Special Accounts 827,383 828,990
Total administered resourcing 1,831,501 1,838,272
Less appropriations drawn from annual or special appropriations above and credited to Special Accounts (g) (807,383) (817,990)
Total administered resourcing 1,024,118 1,020,282
Total resourcing for NHMRC 1,079,633 1,079,872
2016-17 2017-18
Average staffing level (number) 179 177
All figures are GST exclusive. (a) Appropriation Bill (No. 1) 2017-18. (b) Estimated retained revenue receipts under section 74 of the PGPA Act 2013. (c) Departmental Capital Budget (DCB) are not separately identified in Appropriation Bill (No. 1) and form part
of ordinary annual services items. Refer to Table 3.5 for further details. For accounting purposes, this amount has been designated as a 'contribution by owner'. (d) Appropriation Bill (No. 2) 2017-18. (e) For further information on special appropriations and special accounts, please refer to Budget Paper No. 4
- Agency Resourcing. Also see Table 2.1.1 for further information on outcome and program expenses broken down by various funding sources, e.g. annual appropriations, special appropriations and special accounts.
(f) Appropriation receipts from the Department of Health. (g) Appropriation receipts included above.

NHMRC – Entity Budget Statements – Entity Overview and Resources
387
NH
MR
C
1.3 BUDGET MEASURES
Budget measures in Part 1 relating to NHMRC are detailed in Budget Paper No. 2 and are summarised below.
Table 1.2: NHMRC 2017-18 Budget Measures
Program 2016-17$'000
2017-18$'000
2018-19 $'000
2019-20 $'000
2020-21 $'000
Whole of Government Measures
Public Service Modernisation Fund - agency sustainability
National Health and Medical Research Council
Departmental expenses 1.1 - - - - -
Departmental capital 1.1 - - - - -
Total - - - - -

NHMRC – Entity Budget Statements – Outcomes and Planned Performance
388
Section 2: Outcomes and Planned Performance
Government outcomes are the intended results, impacts or consequences of actions by the Government on the Australian community. Commonwealth programs are the primary vehicle by which Government entities achieve the intended results of their outcome statements. Entities are required to identify the programs which contribute to Government outcomes over the Budget and forward years.
Each outcome is described below together with its related programs. The following provides detailed information on expenses for each outcome and program, further broken down by funding source.
Note:
Performance reporting requirements in the Portfolio Budget Statements are part of the Enhanced Commonwealth Performance Framework established by the Public Governance, Performance and Accountability Act 2013. It is anticipated that the performance criteria described in Portfolio Budget Statements will be read with broader information provided in an entity’s corporate plans and annual performance statements – included in Annual Reports – to provide an entity’s complete performance story.
NHMRC’s most recent corporate plan is available at: www.nhmrc.gov.au/guidelines-publications/nh171
NHMRC’s most recent annual performance statement is available at: www.nhmrc.gov.au/guidelines-publications/nh172
2.1 BUDGETED EXPENSES AND PERFORMANCE
Outcome 1
Improved health and medical knowledge, including through funding research, translating research findings into evidence-based clinical practice, administering legislation governing research, issuing guidelines and advice for ethics in health and the promotion of public health
Program Contributing to Outcome 1
Program 1.1: Health and Medical Research
Linked Programs
Other Commonwealth entities that contribute to Outcome 1
Department of Health Program 1.1: Health Policy Research and Analysis The Department of Health has policy responsibility for health and medical research through the Medical Research Future Fund, which will support the sustainability of the health system into the future, and drive further medical innovation.

NHMRC – Entity Budget Statements – Outcomes and Planned Performance
389
NH
MR
C
Budgeted Expenses for NHMRC
Table 2.1.1 shows how much the entity intends to spend (on an accrual basis) on achieving the outcome, broken down by program, as well as by administered and departmental funding sources.
Table 2.1.1: Budgeted Expenses for NHMRC
2016-17 Estimated
actual$'000
2017-18 Budget
$'000
2018-19 Forward
Year 1$'000
2019-20 Forward
Year 2 $'000
2020-21 Forward
Year 3 $'000
Program 1.1: Health and Medical Research
Administered expenses
Ordinary annual services (a) 852,458 871,932 882,753 855,555 867,532 to Medical Research Endowment Account (807,383) (817,990) (829,324) (843,598) (855,407)
Special Accounts Medical Research Endowment Account 840,503 841,391 844,199 845,575 863,136
Departmental expenses
Departmental appropriation (b) 38,942 40,505 39,175 39,264 38,390
Expenses not requiring appropriation 2,300 2,300 2,300 2,300 in the Budget year (c) 2,300
Operating deficit (surplus) - - - - -
Total for Program 1.1 926,820 938,138 939,103 899,096 915,951
Total expenses for Outcome 1 926,820 938,138 939,103 899,096 915,951
2016-17 2017-18
Average staffing level (number) 179 177
(a) Appropriation (Bill No. 1) 2017-18. (b) Departmental appropriation combines 'Ordinary annual services (Appropriation Bill No. 1)' and 'Revenue
from independent sources (s74)'. (c) Expenses not requiring appropriation in the Budget year are made up of depreciation expense,
amortisation expense, makegood expense and audit fees.
Movement of Funds
There were no movements of administered funds between years.

NHMRC – Entity Budget Statements – Outcomes and Planned Performance
390
Planned Performance for NHMRC
Table 2.1.2 below details the performance criteria for the program associated with Outcome 1.3 It also summarises how the program is delivered and where 2017-18 Budget measures have materially changed the program.
Table 2.1.2: Performance Criteria for NHMRC
Purpose
To fund high quality health and medical research and build research capability;
To support the translation of health and medical research into better health outcomes; and
To promote the highest ethical standards in health and medical research.
Outcome 1
Improved health and medical knowledge, including through funding research, translating research findings into evidence-based clinical practice, administering legislation governing research, issuing guidelines and advice for ethics in health and the promotion of public health
Program 1.1: Health and Medical Research
The Australian Government, through NHMRC, will continue to invest in innovative health and medical research that is undertaken within a framework that promotes quality, integrity and ethics. The knowledge created will contribute to addressing the national health priorities with the aim of improving health care and the health status of all Australians. In the 2017-18 Budget, the Government will provide $8.5 million to NHMRC from the agency sustainability stream of the Public Service Modernisation Fund to facilitate implementation of two prototype software applications (apps) that automate resource intensive and repetitive tasks within the grants administration process. The Research Impact and Grant Application Assignment prototype apps complete administrative tasks more quickly and accurately freeing researchers and NHMRC to focus on more complex tasks such as quality assurance, application assessments, and evaluation of the outcomes of research.
Delivery
A. Supporting high quality health and medical research
Support research across the four pillars of health research: biomedical, clinical, public health and health services research; fund both individuals and teams and the highest quality research and researchers.
Continue funding of research and capacity building to support better health outcomes for Aboriginal and Torres Strait Islander peoples.
Boost Australia’s dementia research capacity and fund priority research and translation into prevention, better diagnosis, treatment and care for people with dementia. During 2017-18 the NHMRC National Institute for Dementia Research will focus on strengthening coordination of Australia’s dementia research effort, implementing research findings into policy and practice and evaluating impacts.
Integration with external data sources to facilitate automated publication discovery, and automated capture of research impact to prefill impact surveys and identification of case studies that demonstrate return on investment.
3 Progress against the performance criteria published in the 2016-17 Portfolio Budget Statements will be
reported in the 2016-17 NHMRC Annual Report.

NHMRC – Entity Budget Statements – Outcomes and Planned Performance
391
NH
MR
C
B. Supporting the translation of health and medical research
Support leadership in research and evidence-based health care through the designation and promotion of Advanced Health Research and Translation Centres and Centres for Innovation in Regional Health.
Facilitate and promote the translation of evidence derived from health and medical research into practices and systems designed to prevent illness and improve public health.
Establishment of the ongoing capability to report on patents and commercialisation. C. Promoting the highest standards in health and medical research
In partnership with the Australian Research Council and Universities Australia, review guidelines, such as the Australian Code for the Responsible Conduct of Research (2007), to ensure they are up-to-date and reflect best practice in ethics and integrity.
Administer the Research Involving Human Embryos Act 2002 and the Prohibition of Human Cloning for Reproduction Act 2002, which prohibit certain practices, including human cloning for reproduction, and restrict other practices relating to reproductive technology and research.
Performance criteria
A. Supporting high quality health and medical research
Citation rate of journal articles resulting from NHMRC funded research, triennial measure.4
2016-17 Estimated result 2019-20 Target 2022-3 (& beyond) Target
168% of the average citation rate of all journal articles published worldwide.
>150% of the average citation rate of all journal articles published worldwide.
>150% of the average citation rate of all journal articles published worldwide.
Support research that will provide better health outcomes for Aboriginal and Torres Strait Islander peoples, through percentage of annual research budget awarded to Indigenous health research.
2016-17 Estimated result
2017-18 Target
2018-19 Target
2019-20 Target
2020-21 Target
On track to achieve >5%
>5% >5% >5% >5%
Enhance research on dementia and its translation into policy and practice.
2016-17 Estimated result 2017-18 Target 2018-19 (& beyond) Target
Three additional grant rounds were opened between November 2016 and March 2017 to support priority research projects.
Undertake two additional grant rounds to support priority research projects.
Synthesise outcomes from dementia research to inform improved treatments and care for people with dementia.
4 Bibliographic citations are the referencing of a journal article in a subsequent journal article, indicating
some scientific impact of the original work. The citation rate of journal articles resulting from NHMRC funded research (above) is shown as a proportion of the world citation average, which is determined by dividing the total number of citations by the total number of journal articles published in the world in the same time period. In this measure, the world average, based on publications and citation data available in the Web of Science database, is set to 100%, which means publications are achieving citations as would be expected for that subject area during the specified time period. Therefore, a value of 150%, for example, indicates a citation impact of 50% higher than the world average for similar research worldwide.

NHMRC – Entity Budget Statements – Outcomes and Planned Performance
392
B. Supporting the translation of health and medical research
Approve high quality clinical, public and/or environmental health guidelines prepared by NHMRC or third parties.
2016-17 Estimated result 2017-18 Target 2018-19 (& beyond) Target
Guidelines submitted to the Council and approved by the CEO of NHMRC have met quality standards.
Guidelines submitted to the Council and approved by the CEO of NHMRC meet quality standards, as articulated in the Procedures and requirements for meeting the 2011 NHMRC standard for clinical practice guidelines.
As per 2017-18.
Recognise and promote leading collaborations between health care organisations, academia and research institutions.
2016-17 Estimated result 2017-18 Target 2018-19 (& beyond) Target
Recognise second tranche of collaborations through the Advanced Health Research and Translation Centres program.
Showcase initiatives on the NHMRC website that demonstrate the translation of research into better clinical practices.
As per 2017-18.
C. Promoting the highest standards in health and medical research
Release the revised Australian Code for the Responsible Conduct of Research (2007) and monitor implementation.
2016-17 Estimated result 2017-18 Target 2018-19 (& beyond) Target
Development of revised Australian Code for the Responsible Conduct of Research (2007) (the Code).
Release the revised Code. At least 80% of Administering Institutions report implementation of the Code.
Material changes to Program 1.1 resulting from the following measures: There are no material changes to Program 1.1 resulting from measures.

NHMRC – Entity Budget Statements – Budgeted Financial Statements
393
NH
MR
C
Section 3: Budgeted Financial Statements
Section 3 presents budgeted financial statements which provide a comprehensive snapshot of entity finances for the 2017-18 Budget year, including the impact of Budget measures and resourcing on financial statements.
3.1 BUDGETED FINANCIAL STATEMENTS
3.1.1 Differences Between Entity Resourcing and Financial Statements
This section is not applicable to NHMRC.
3.1.2 Explanatory Notes and Analysis of Budgeted Financial Statements
Departmental Resources
Comprehensive Income Statement (showing net cost of services)
Revenue and expenditure for 2017-18 is expected to be in line with Government forecasts, with Employee expenses to be 52 per cent of total expenditure.
Balance Sheet
Capital expenditure relating to an Enhanced Reporting System, Cloud Computing solution, and Digital Transition project are expected to progress in 2017-18. In 2017-18, an additional $3.9 million in capital will be provided through the 2017-18 Budget measure Public Service Modernisation Fund – agency sustainability.
Administered Resources
The Administered accounts are used as a mechanism to transfer the majority of funds to NHMRC’s Special Account (Medical Research Endowment Account). In 2017-18 the transfer to the Special Account is expected to be $818.0 million.

NHMRC – Entity Budget Statements – Budgeted Financial Statements
394
3.2 BUDGETED FINANCIAL STATEMENTS TABLES
Table 3.1: Comprehensive Income Statement (showing net cost of services for the period ended 30 June)
2016-17 Estimated
actual$'000
2017-18 Budget
$'000
2018-19 Forward estimate
$'000
2019-20 Forward estimate
$'000
2020-21 Forward estimate
$'000
EXPENSES
Employee benefits 22,972 22,231 22,253 22,446 22,308
Supplier expenses 16,050 18,354 17,002 16,898 16,162
Depreciation and amortisation 2,200 2,200 2,200 2,200 2,200
Finance costs 20 20 20 20 20
Total expenses 41,242 42,805 41,475 41,564 40,690
LESS:
OWN-SOURCE INCOME
Revenue
Sale of goods and rendering of services 1,500 1,500 1,500 1,500 1,500
Total revenue 1,500 1,500 1,500 1,500 1,500
Gains
Other 100 100 100 100 100
Total gains 100 100 100 100 100
Total own-source income 1,600 1,600 1,600 1,600 1,600
Net cost of (contribution by) services 39,642 41,205 39,875 39,964 39,090
Revenue from Government 37,442 39,005 37,675 37,764 36,890
Surplus (deficit) (2,200) (2,200) (2,200) (2,200) (2,200)
Surplus (deficit) attributable to the Australian Government (2,200) (2,200) (2,200) (2,200) (2,200)
OTHER COMPREHENSIVE INCOME
Changes in asset revaluation reserves - - - - -
Total other comprehensive income (loss) - - - - -
Total comprehensive income (loss) attributable to the Australian Government (2,200) (2,200) (2,200) (2,200) (2,200)
Note: Reconciliation of comprehensive income attributable to the agency
2016-17 $'000
2017-18 $'000
2018-19 $'000
2019-20 $'000
2020-21 $'000
Total comprehensive income (loss) attributable to the Australian Government (2,200) (2,200) (2,200) (2,200) (2,200)
plus non-appropriated expenses depreciation and amortisation expenses 2,200 2,200 2,200 2,200 2,200
Total comprehensive income (loss) attributable to the agency - - - - -

NHMRC – Entity Budget Statements – Budgeted Financial Statements
395
NH
MR
C
Table 3.2: Budgeted Departmental Balance Sheet (as at 30 June)
2016-17 Estimated
actual$'000
2017-18 Budget
$'000
2018-19 Forward
Year 1$'000
2019-20 Forward
Year 2 $'000
2020-21 Forward
Year 3 $'000
ASSETS
Financial assets
Cash and cash equivalents 409 409 409 409 409
Receivables 15,706 12,547 11,488 10,138 10,138
Total financial assets 16,115 12,956 11,897 10,547 10,547
Non-financial assets
Property, plant and equipment 4,259 3,684 2,455 2,576 1,354
Inventories 200 200 200 200 200
Intangibles 4,008 8,862 9,242 8,692 7,892
Other 984 984 984 984 984
Total non-financial assets 9,451 13,730 12,881 12,452 10,430
Total assets 25,566 26,686 24,778 22,999 20,977
LIABILITIES
Payables
Suppliers 3,351 3,300 3,290 3,290 3,290
Other payables 2,000 2,000 2,000 2,000 2,000
Total payables 5,351 5,300 5,290 5,290 5,290
Provisions
Employees 5,756 5,070 4,945 4,945 4,945
Other provisions 920 927 933 933 933
Total provisions 6,676 5,997 5,878 5,878 5,878
Total liabilities 12,027 11,297 11,168 11,168 11,168
Net assets 13,539 15,389 13,610 11,831 9,809
EQUITY
Contributed equity 11,775 15,825 16,246 16,667 16,845
Reserves 124 124 124 124 124 Retained surpluses (accumulated deficits) 1,640 (560) (2,760) (4,960) (7,160)
Total equity 13,539 15,389 13,610 11,831 9,809
Table 3.3: Departmental Statement of Changes in Equity – Summary of Movement (Budget year 2017-18)
Retained earnings
$'000
Asset revaluation
reserve $'000
Contributed equity/capital
$'000
Total equity
$'000
Opening balance as at 1 July 2017
Balance carried forward from previous period 1,640 124 11,775 13,539
Surplus (deficit) for the period (2,200) - - (2,200)
Appropriation (equity injection) - - 3,879 3,879
Capital budget - Bill 1 (DCB) - - 171 171
Other movements - - - - Estimated closing balance as at 30 June 2018 (560) 124 15,825 15,389
DCB = Departmental Capital Budget.

NHMRC – Entity Budget Statements – Budgeted Financial Statements
396
Table 3.4: Budgeted Departmental Statement of Cash Flows (for the period ended 30 June)
2016-17 Estimated
actual$'000
2017-18 Budget
$'000
2018-19 Forward estimate
$'000
2019-20 Forward estimate
$'000
2020-21 Forward estimate
$'000
OPERATING ACTIVITIES
Cash received
Goods and services 1,500 1,500 1,500 1,500 1,500
Appropriations 38,490 42,191 38,764 37,764 36,890
Net GST received 1,500 1,500 1,500 1,500 1,500
Total cash received 41,490 45,191 41,764 40,764 39,890
Cash used
Employees 23,321 23,757 24,548 23,946 23,808
Suppliers 16,261 19,005 16,286 16,818 16,082
Total cash used 39,582 42,762 40,834 40,764 39,890
Net cash from (or used by) operating activities 1,908 2,429 930 - -
INVESTING ACTIVITIES
Cash used
Purchase of property, plant and equipment 2,081 6,479 1,351 421 178
Total cash used 2,081 6,479 1,351 421 178
Net cash from (or used by) investing activities (2,081) (6,479) (1,351) (421) (178)
FINANCING ACTIVITIES
Cash received
Capital budget - Bill 1 (DCB) 173 171 171 171 178
Equity injections - Bill 2 - 3,879 250 250 -
Total cash received 173 4,050 421 421 178
Net cash from (or used by) financing activities 173 4,050 421 421 178
Net increase (or decrease) in cash held - - - - -
Cash and cash equivalents at the beginning of the reporting period 409 409 409 409 409
Cash and cash equivalents at the end of the reporting period 409 409 409 409 409
DCB = Departmental Capital Budget.

NHMRC – Entity Budget Statements – Budgeted Financial Statements
397
NH
MR
C
Table 3.5: Departmental Capital Budget Statement (for the period ended 30 June)
2016-17 Estimated
actual$'000
2017-18 Budget
$'000
2018-19 Forward estimate
$'000
2019-20 Forward estimate
$'000
2020-21 Forward estimate
$'000
CAPITAL APPROPRIATIONS
Capital budget - Bill 1 (DCB) 173 171 171 171 178
Equity injections - Bill 2 - 3,879 250 250 -
Total capital appropriations 173 4,050 421 421 178
Total new capital appropriations represented by:
Purchase of non-financial assets 173 4,050 421 421 178
Total items 173 4,050 421 421 178
PURCHASE OF NON-FINANCIAL ASSETS
Funded by capital appropriations - equity injection (a) - 3,879 250 250 -
Funded by capital appropriation - DCB (b) 173 171 171 171 178
Funded internally from departmental resources 1,908 2,429 930 - -
Total acquisitions of non-financial assets 2,081 6,479 1,351 421 178
RECONCILIATION OF CASH USED TO ACQUIRE ASSETS TO ASSET MOVEMENT TABLE
Total purchases 2,081 6,479 1,351 421 178 Total cash used to acquire assets 2,081 6,479 1,351 421 178
(a) Includes both current Bill 2, prior Act 2/4/6 appropriations and special capital appropriations. (b) Does not include annual finance lease costs. Includes purchases from current and previous years'
Departmental Capital Budget (DCB).

NHMRC – Entity Budget Statements – Budgeted Financial Statements
398
Table 3.6: Statement of Asset Movements (Budget year 2017-18)
Buildings
$'000
Other property, plant and
equipment $'000
Intangibles
$'000
Total
$'000
As at 1 July 2017
Gross book value - 6,131 11,182 17,313
Accumulated depreciation/ amortisation and impairment - (1,872) (7,174) (9,046)
Opening net book balance - 4,259 4,008 8,267
CAPITAL ASSET ADDITIONS
Estimated expenditure on new or replacement assets
By purchase - appropriation ordinary annual services - 825 5,654 6,479
Total additions - 825 5,654 6,479
Other movements
Depreciation/amortisation expense - (1,400) (800) (2,200)
Total other movements - (1,400) (800) (2,200)
As at 30 June 2018
Gross book value - 6,956 16,836 23,792
Accumulated depreciation/ amortisation and impairment - (3,272) (7,974) (11,246)
Closing net book balance - 3,684 8,862 12,546
Table 3.7: Schedule of Budgeted Income and Expenses Administered on Behalf of Government (for the period ended 30 June)
2016-17 Estimated
actual$'000
2017-18 Budget
$'000
2018-19 Forward estimate
$'000
2019-20 Forward estimate
$'000
2020-21 Forward estimate
$'000
EXPENSES ADMINISTERED ON BEHALF OF GOVERNMENT
Grants - MREA 840,503 841,391 844,199 845,575 863,136
Grants - dementia 31,000 40,000 40,000 - -
Suppliers 14,075 13,942 13,429 11,957 12,125
Total expenses administered on behalf of Government 885,578 895,333 897,628 857,532 875,261
Recoveries 5,000 5,000 5,000 5,000 5,000
Other non-tax revenue 15,000 6,000 6,000 6,000 6,000
Total income administered on behalf of Government 20,000 11,000 11,000 11,000 11,000
MREA = Medical Research Endowment Account.

NHMRC – Entity Budget Statements – Budgeted Financial Statements
399
NH
MR
C
Table 3.8: Schedule of Budgeted Assets and Liabilities Administered on Behalf of Government (as at 30 June)
2016-17 Estimated
actual$'000
2017-18 Budget
$'000
2018-19 Forward estimate
$'000
2019-20 Forward estimate
$'000
2020-21 Forward estimate
$'000
ASSETS ADMINISTERED ON BEHALF OF GOVERNMENT
Financial assets
Cash and cash equivalents - - - - -
Receivables 648 648 648 648 648
Total financial assets 648 648 648 648 648
Total assets administered on behalf of Government 648 648 648 648 648
LIABILITIES ADMINISTERED ON BEHALF OF GOVERNMENT
Payables
Grants 5,000 5,000 5,000 5,000 5,000
Other 190 190 190 190 190
Total payables 5,190 5,190 5,190 5,190 5,190
Total liabilities administered on behalf of Government 5,190 5,190 5,190 5,190 5,190

NHMRC – Entity Budget Statements – Budgeted Financial Statements
400
Table 3.9: Schedule of Budgeted Administered Cash Flows (for the period ended 30 June)
2016-17 Estimated
actual$'000
2017-18 Budget
$'000
2018-19 Forward estimate
$'000
2019-20 Forward estimate
$'000
2020-21 Forward estimate
$'000
OPERATING ACTIVITIES
Cash received
Cash received - other 20,000 11,000 11,000 11,000 11,000
Net GST received 26,000 26,000 26,000 26,000 26,000
Total cash received 46,000 37,000 37,000 37,000 37,000
Cash used
Grant payments - MREA 840,503 841,391 857,436 845,575 863,136
Grant payments - dementia 31,000 40,000 40,000 - -
Suppliers 14,075 13,942 13,429 11,957 12,125
Net GST paid 26,000 26,000 26,000 26,000 26,000
Total cash used 911,578 921,333 936,865 883,532 901,261
Net cash from (or used by) operating activities (865,578) (884,333) (899,865) (846,532) (864,261)
Net increase (or decrease) in cash held (865,578) (884,333) (899,865) (846,532) (864,261)
Cash at beginning of reporting period - - - - -
Cash from Official Public Account for:
- appropriations 865,578 884,333 899,865 846,532 864,261
Cash at end of reporting period - - - - -
MREA = Medical Research Endowment Account.

401
NM
HC
NATIONAL MENTAL HEALTH COMMISSION
Entity Resources and Planned Performance

402

403
NM
HC
NATIONAL MENTAL HEALTH COMMISSION
Section 1: Entity Overview and Resources ...................................................... 404
1.1 Strategic Direction Statement ................................................................... 404
1.2 Entity Resource Statement ....................................................................... 405
1.3 Budget Measures ...................................................................................... 406
Section 2: Outcomes and Planned Performance ............................................. 407
2.1 Budgeted Expenses and Performance ..................................................... 407
Section 3: Budgeted Financial Statements ...................................................... 411
3.1 Budgeted Financial Statements ................................................................ 411
3.2 Budgeted Financial Statements Tables .................................................... 412

NMHC – Entity Budget Statements – Entity Overview and Resources
404
Section 1: Entity Overview and Resources
1.1 STRATEGIC DIRECTION STATEMENT1
The Australian Government is committed to delivering an efficient, integrated and sustainable mental health system to improve mental health outcomes for Australians and help prevent suicide.
The National Mental Health Commission (NMHC) supports the Australian Government through the provision of insight, advice and evidence on ways to continuously improve Australia’s mental health and suicide prevention systems, and acts as a catalyst for change to achieve those improvements. This includes increasing accountability and transparency in mental health through the provision of independent reports and advice to the Australian Government and the community. The NMHC provides cross-sectoral leadership on the policy, programs, services and systems that support better mental health and social and emotional wellbeing in Australia.
The NMHC works with stakeholders particularly with people with lived experience of mental health, their families and other support people; to ensure reforms are collectively owned and actioned, and to enable participation in government process. People with a lived experience of mental health, including carers and other support people, are actively engaged in all areas of the NMHC’s work.
The NMHC recognises Aboriginal and Torres Strait Islander mental health and social and emotional wellbeing as an overarching strategic priority which sits across all of our work.
The NMHC will advise on national suicide prevention including approaches to delivering a systematic and planned regional approach to community based suicide prevention, refocussing efforts to prevent Indigenous suicide and ensuring effective post discharge follow up and support for people who have attempted suicide.
Ensuring that mental health and suicide prevention is embedded across government reform is key to driving system improvement and better accountability. To achieve this, the NMHC works across all sectors that have a role in mental health and preventing mental illness and suicide; not just government and not just health but the broader system including education, housing, employment, human services, justice and social support.
The NMHC is an executive agency established on 1 January 2012 under the Public Service Act 1999 and is a Non-corporate Commonwealth Entity under the Public Governance, Performance and Accountability Act 2013.
1 For more information about the strategic direction of the NMHC, refer to the current corporate plan,
available at: www.mentalhealthcommission.gov.au/about-us/our-documents.aspx

NMHC – Entity Budget Statements – Entity Overview and Resources
405
NM
HC
1.2 ENTITY RESOURCE STATEMENT
Table 1.1 shows the total funding from all sources available to the entity for its operations and to deliver programs and services on behalf of the Government.
The table summarises how resources will be applied by outcome (Government strategic policy objectives) and by administered (on behalf of the Government or the public) and departmental (for the entity’s operations) classification.
For more detailed information on special accounts and special appropriations, please refer to Budget Paper No. 4 – Agency Resourcing.
Information in this table is presented on a resourcing (i.e. appropriations/cash available) basis, whilst the ‘Budgeted expenses by outcome’ tables in Section 2 and the financial statements in Section 3 are presented on an accrual basis.

NMHC – Entity Budget Statements – Entity Overview and Resources
406
Table 1.1: NMHC Resource Statement – Budget Estimates for 2017-18 as at Budget May 2017
2016-17Estimated
actual$'000
2017-18 Estimate
$'000
DEPARTMENTAL
Prior year appropriation available 621 680
Annual appropriations
Ordinary annual services (a)
Departmental appropriation 2,755 2,712
s74 retained revenue receipts (b) - -
Departmental capital budget (c) 23 24
Other services (d)
Equity injection 150 -
Total departmental annual appropriations 2,928 2,736
Total departmental resourcing 3,549 3,416
ADMINISTERED
Prior year appropriation available 3 3
Annual appropriations
Ordinary annual services (a)
Outcome 1 3,685 3,726
Other services (d)
Administered assets and liabilities - -
Total administered annual appropriations 3,685 3,726
Total administered resourcing 3,685 3,726
Total resourcing for the NHMC 7,234 7,142
2016-17 2017-18
Average staffing level (number) 14 14
All figures are GST exclusive. (a) Appropriation Bill (No. 1) 2017-18. (b) Estimated retained revenue receipts under section 74 of the PGPA Act 2013. (c) Departmental Capital Budget (DCB) are not separately identified in Appropriation Bill (No. 1) and form part
of ordinary annual services items. Refer to Table 3.5 for further details. For accounting purposes, this amount has been designated as a 'contribution by owner'.
(d) Appropriation Bill (No. 2) 2017-18.
1.3 BUDGET MEASURES
This section is not applicable to the NMHC.

NMHC – Entity Budget Statements – Outcomes and Planned Performance
407
NM
HC
Section 2: Outcomes and Planned Performance
Government outcomes are the intended results, impacts or consequences of actions by the Government on the Australian community. Commonwealth programs are the primary vehicle by which Government entities achieve the intended results of their outcome statements. Entities are required to identify the programs which contribute to Government outcomes over the Budget and forward years.
Each outcome is described below together with its related programs. The following provides detailed information on expenses for each outcome and program, further broken down by funding source.
Note:
Performance reporting requirements in the Portfolio Budget Statements are part of the Enhanced Commonwealth Performance Framework established by the Public Governance, Performance and Accountability Act 2013. It is anticipated that the performance criteria described in Portfolio Budget Statements will be read with broader information provided in an entity’s corporate plans and annual performance statements – included in Annual Reports – to provide an entity’s complete performance story.
The NMHC’s most recent corporate plan is available at: www.mentalhealthcommission.gov.au/about-us/our-documents.aspx
The NMHC’s most recent annual performance statement is available at: www.mentalhealthcommission.gov.au/about-us/our-documents.aspx
2.1 BUDGETED EXPENSES AND PERFORMANCE
Outcome 1
Provide expert advice to the Australian Government and cross-sectoral leadership on the policy, programs, services and systems that support mental health in Australia, including through administering the Annual National Report Card on Mental Health and Suicide Prevention, undertaking performance monitoring and reporting, and engaging consumers and carers
Program Contributing to Outcome 1
Program 1.1: National Mental Health Commission
Linked Programs
Other Commonwealth entities that contribute to Outcome 1
Department of Health Program 2.1: Mental Health The Department of Health has strategic policy responsibility for developing a more efficient, integrated and sustainable mental health system.

NMHC – Entity Budget Statements – Outcomes and Planned Performance
408
Budgeted Expenses for the NMHC
Table 2.1.1 shows how much the entity intends to spend (on an accrual basis) on achieving the outcome, broken down by program, as well as by administered and departmental funding sources.
Table 2.1.1: Budgeted Expenses for the NMHC
2016-17 Estimated
actual$'000
2017-18 Budget
$'000
2018-19 Forward
Year 1$'000
2019-20 Forward
Year 2 $'000
2020-21 Forward
Year 3 $'000
Program 1.1: National Mental Health Commission
Administered expenses
Ordinary annual services (a) 3,685 3,726 3,785 3,853 3,918
Departmental expenses
Departmental appropriation (b) 2,755 2,712 2,690 2,689 2,697
Expenses not requiring appropriation in the Budget year (c) 38 38 38 38 38
Operating deficit (surplus) - - - - -
Total for Program 1.1 6,478 6,476 6,513 6,580 6,653
Total expenses for Outcome 1 6,478 6,476 6,513 6,580 6,653
2016-17 2017-18
Average staffing level (number) 14 14
(a) Appropriation (Bill No. 1) 2017-18. (b) Departmental appropriation combines 'Ordinary annual services (Appropriation Bill No. 1)' and 'Revenue
from independent sources (s74)'. (c) Expenses not requiring appropriation in the Budget year are made up of depreciation expense,
amortisation expense, makegood expense and audit fees.
Movement of Funds
There were no movements of administered funds between years.

NMHC – Entity Budget Statements – Outcomes and Planned Performance
409
NM
HC
Planned Performance for the NMHC
Table 2.1.2 below details the performance criteria for the program associated with Outcome 1.2 It also summarises how the program is delivered and where 2017-18 Budget measures have materially changed the program.
Table 2.1.2: Performance Criteria for the NMHC
Purpose
To provide insight, advice and evidence on ways to continuously improve Australia’s mental health and suicide prevention systems and act as a catalyst for change to achieve those improvements.
Outcome 1
Provide expert advice to the Australian Government and cross-sectoral leadership on the policy, programs, services and systems that support mental health in Australia, including through administering the Annual National Report Card on Mental Health and Suicide Prevention, undertaking performance monitoring and reporting, and engaging consumers and carers
Program 1.1: National Mental Health Commission
The NMHC continues to increase accountability and transparency in mental health and suicide prevention through independent reporting and the provision of advice to the Australian Government and the community. The NMHC continues to lead projects that improve the policy, programs, services and systems that support mental wellbeing and suicide prevention in Australia.
Delivery
A. Reporting on national progress to improve mental health and prevent suicide
Publically release an annual report on mental health and suicide prevention outcomes, ensuring a cross-sectoral perspective is taken where possible.
Monitor performance on mental health reform across Australia, with benchmarking against agreed indicators and targets, where possible.
B. Improving system accountability, evidence and results
Provide mental health and suicide prevention policy advice to the Australian Government, developed in collaboration with consumers and carers and in consultation with stakeholders.
Initiate research reports, discussion and policy papers to inform key policy or service delivery issues.
Promote consumer and career engagement and participation in the mental health system.
2 Progress against the performance criteria published in the 2016-17 Portfolio Budget Statements will be
reported in the 2016-17 NMHC Annual Report.

NMHC – Entity Budget Statements – Outcomes and Planned Performance
410
Performance criteria
A. Reporting on national progress to improve mental health and prevent suicide
Prepare and disseminate the national report on mental health and suicide prevention.
2016-17 Estimated result 2017-18 Target 2018-19 (& beyond) Target
The publishing date of the Annual National Report on Mental Health and Suicide Prevention has been revised from 30 June 2017 to 31 December 2017, to enable the report to cover a complete calendar year.
Annual National Report on Mental Health and Suicide Prevention, published annually by 31 December.
As per 2017-18.
B. Improving system accountability, evidence and results
Undertake research, analysis and evaluation on key national mental health priorities.
2016-17 Estimated result 2017-18 Target 2018-19 (& beyond) Target
Evidence-based advice continues to be developed and is available to inform improvements in policy, programs, services and systems that support mental health and suicide prevention.
Timely evidence-based advice is available to inform improvements in policy, programs, services and systems that support mental health and suicide prevention.
As per 2017-18.
Promote consumer and carer engagement and participation in the mental health system.
2016-17 Estimated result 2017-18 Target 2018-19 (& beyond) Target
Promotion of opportunities for consumer and carer engagement and participation in the mental health system has been, and continues to be, undertaken.
Opportunities for engagement and participation by consumers and carers in all levels of the mental health system have increased.
As per 2017-18.
Percentage of NMHC projects that have governance and advisory arrangements that include people with lived experience of mental health issues.
2016-17 Estimated result
2017-18 Target
2018-19 Target
2019-20 Target
2020-21 Target
80% 100% 100% 100% 100%
Material changes to Program 1.1 resulting from the following measures: There are no material changes to Program 1.1 resulting from measures.

NMHC – Entity Budget Statements – Budgeted Financial Statements
411
NM
HC
Section 3: Budgeted Financial Statements
Section 3 presents budgeted financial statements which provide a comprehensive snapshot of entity finances for the 2017-18 Budget year, including the impact of Budget measures and resourcing on financial statements.
3.1 BUDGETED FINANCIAL STATEMENTS
3.1.1 Differences Between Entity Resourcing and Financial Statements
This section is not applicable to the NMHC.
3.1.2 Explanatory Notes and Analysis of Budgeted Financial Statements
Departmental Resources
Comprehensive Income Statement
Revenue from Government will remain stable from 2016-17 to 2017-18 at around $2.6 million per annum.
Balance Sheet
The NMHC does not expect any significant movements in assets and liabilities.
Administered Resources
Schedule of budgeted income and expense administered on behalf of Government
Expenses administered on behalf of Government will remain stable from 2016-17 to 2017-18 at around $3.7 million per annum with a slight increase over forward years.

NMHC – Entity Budget Statements – Budgeted Financial Statements
412
3.2 BUDGETED FINANCIAL STATEMENTS TABLES
Table 3.1: Comprehensive Income Statement (showing net cost of services for the period ended 30 June)
2016-17 Estimated
actual$'000
2017-18 Budget
$'000
2018-19 Forward estimate
$'000
2019-20 Forward estimate
$'000
2020-21 Forward estimate
$'000
EXPENSES
Employee benefits 1,972 1,972 1,972 1,972 1,972
Supplier expenses 808 765 743 742 750
Depreciation and amortisation 13 13 13 13 13
Total expenses 2,793 2,750 2,728 2,727 2,735
LESS:
OWN-SOURCE INCOME
Revenue
Sale of goods and rendering of services - - - - -
Total revenue - - - - -
Gains
Other 25 25 25 25 25
Total gains 25 25 25 25 25
Total own-source income 25 25 25 25 25
Net cost of (contribution by)
services 2,768 2,725 2,703 2,702 2,710
Revenue from Government 2,755 2,712 2,690 2,689 2,697
Surplus (deficit) (13) (13) (13) (13) (13)
Surplus (deficit) attributable to the Australian Government (13) (13) (13) (13) (13)
OTHER COMPREHENSIVE INCOME
Changes in asset revaluation reserves - - - - -
Total other comprehensive income - - - - -
Total comprehensive income attributable to the Australian Government (13) (13) (13) (13) (13)
Note: Reconciliation of comprehensive income attributable to the agency
2016-17$'000
2017-18 $'000
2018-19 $'000
2019-20 $'000
2020-21 $'000
Total comprehensive income (loss) attributable to the Australian Government (13) (13) (13) (13) (13)
plus non-appropriated expenses depreciation and amortisation expenses 13 13 13 13 13
Total comprehensive income (loss) attributable to the agency - - - - -

NMHC – Entity Budget Statements – Budgeted Financial Statements
413
NM
HC
Table 3.2: Budgeted Departmental Balance Sheet (as at 30 June)
2016-17 Estimated
actual$'000
2017-18 Budget
$'000
2018-19 Forward
Year 1$'000
2019-20 Forward
Year 2 $'000
2020-21 Forward
Year 3 $'000
ASSETS
Financial assets
Cash and cash equivalents 45 45 45 45 45
Receivables 923 922 922 922 922
Total financial assets 968 967 967 967 967
Non-financial assets
Land and buildings 9 9 9 9 9
Property, plant and equipment 21 33 44 55 66
Intangibles 150 150 150 150 150
Total non-financial assets 180 192 203 214 225
Total assets 1,148 1,159 1,170 1,181 1,192
LIABILITIES
Payables
Suppliers 179 179 179 179 179
Total payables 179 179 179 179 179
Provisions
Employees 365 365 365 365 365
Other provisions 58 58 58 58 58
Total provisions 423 423 423 423 423
Total liabilities 602 602 602 602 602
Net assets 546 557 568 579 590
EQUITY
Contributed equity 257 281 305 329 353
Reserves - - - - -
Retained surpluses (accumulated deficits) 289 276 263 250 237
Total equity 546 557 568 579 590
Table 3.3: Departmental Statement of Changes in Equity – Summary of Movement (Budget year 2017-18)
Retained earnings
$'000
Asset revaluation
reserve $'000
Contributed equity/capital
$'000
Total equity
$'000
Opening balance as at 1 July 2017
Balance carried forward from previous period 289 - 257 546
Surplus (deficit) for the period (13) - - (13)
Capital budget - Bill 1 (DCB) - - 24 24
Equity injections - Bill 2 - - - -
Estimated closing balance as at 30 June 2018 276 - 281 557
DCB = Departmental Capital Budget.

NMHC – Entity Budget Statements – Budgeted Financial Statements
414
Table 3.4: Budgeted Departmental Statement of Cash Flows (for the period ended 30 June)
2016-17 Estimated
actual$'000
2017-18 Budget
$'000
2018-19 Forward estimate
$'000
2019-20 Forward estimate
$'000
2020-21 Forward estimate
$'000
OPERATING ACTIVITIES
Cash received
Appropriations 2,692 2,693 2,690 2,689 2,697
GST received 79 84 84 84 84
Total cash received 2,771 2,777 2,774 2,773 2,781
Cash used
Employees 1,968 1,972 1,972 1,972 1,972
Suppliers 724 721 718 717 725
GST paid 79 84 84 84 84
Total cash used 2,771 2,777 2,774 2,773 2,781
Net cash from (or used by) operating activities - - - - -
INVESTING ACTIVITIES
Cash used
Purchase of property, plant and equipment 173 24 24 24 24
Total cash used 173 24 24 24 24
Net cash from (or used by) investing activities (173) (24) (24) (24) (24)
FINANCING ACTIVITIES
Cash received
Capital budget - Bill 1 (DCB) 23 24 24 24 24
Equity injections - Bill 2 150 - - - -
Total cash received 173 24 24 24 24
Net cash from (or used by) financing activities 173 24 24 24 24
Net increase (or decrease) in cash held - - - - -
Cash and cash equivalents at the beginning of the reporting period 45 45 45 45 45
Cash and cash equivalents at the end of the reporting period 45 45 45 45 45
DCB = Departmental Capital Budget.

NMHC – Entity Budget Statements – Budgeted Financial Statements
415
NM
HC
Table 3.5: Departmental Capital Budget Statement (for the period ended 30 June)
2016-17 Estimated
actual$'000
2017-18 Budget
$'000
2018-19 Forward
Year 1$'000
2019-20 Forward
Year 2 $'000
2020-21 Forward
Year 3 $'000
CAPITAL APPROPRIATIONS
Capital budget - Bill 1 (DCB) 23 24 24 24 24
Equity injections - Bill 2 150 - - - -
Total capital appropriations 173 24 24 24 24
Total new capital appropriations represented by:
Purchase of non-financial assets 173 24 24 24 24
Total items 173 24 24 24 24
PURCHASE OF NON-FINANCIAL ASSETS
Funded by capital appropriations - equity injection (a) 150 - - - -
Funded by capital appropriation - DCB (b) 23 24 24 24 24
Funded internally from departmental resources - - - - -
Total acquisitions of non-financial assets 173 24 24 24 24
RECONCILIATION OF CASH USED TO ACQUIRE ASSETS TO ASSET MOVEMENT TABLE
Total purchases 173 24 24 24 24
Total cash used to acquire assets 173 24 24 24 24
(a) Includes both current Bill 2, prior Act 2/4/6 appropriations and special capital appropriations. (b) Does not include annual finance lease costs. Includes purchases from current and previous years'
Departmental Capital Budget (DCB).

NMHC – Entity Budget Statements – Budgeted Financial Statements
416
Table 3.6: Statement of Asset Movements (Budget year 2017-18)
Buildings
$'000
Other property, plant and
equipment$'000
Intangibles
$'000
Total
$'000
As at 1 July 2017
Gross book value 13 42 174 229
Accumulated depreciation/ amortisation and impairment (4) (20) (24) (48)
Opening net book balance 9 22 150 181
CAPITAL ASSET ADDITIONS
Estimated expenditure on new or replacement assets
By purchase - appropriation ordinary annual services - 24 - 24
Total additions - 24 - 24
Other movements
Depreciation/amortisation expense - (13) - (13)
Total other movements - (13) - (13)
As at 30 June 2018
Gross book value 13 66 174 253
Accumulated depreciation/ amortisation and impairment (4) (33) (24) (61)
Closing net book balance 9 33 150 192
Table 3.7: Schedule of Budgeted Income and Expenses Administered on Behalf of Government (for the period ended 30 June)
2016-17 Estimated
actual$'000
2017-18 Budget
$'000
2018-19 Forward estimate
$'000
2019-20 Forward estimate
$'000
2020-21 Forward estimate
$'000
EXPENSES ADMINISTERED ON BEHALF OF GOVERNMENT
Supplier expenses 3,685 3,726 3,785 3,853 3,918
Total expenses administered on behalf of Government 3,685 3,726 3,785 3,853 3,918

NMHC – Entity Budget Statements – Budgeted Financial Statements
417
NM
HC
Table 3.8: Schedule of Budgeted Assets and Liabilities Administered on Behalf of Government (as at 30 June)
2016-17 Estimated
actual$'000
2017-18 Budget
$'000
2018-19 Forward estimate
$'000
2019-20 Forward estimate
$'000
2020-21 Forward estimate
$'000
ASSETS ADMINISTERED ON BEHALF OF GOVERNMENT
Financial assets
Cash and cash equivalents 3 3 3 3 3
Receivables 131 131 131 131 131
Total financial assets 134 134 134 134 134
Total assets administered on behalf of Government 134 134 134 134 134
LIABILITIES ADMINISTERED ON BEHALF OF GOVERNMENT
Payables
Suppliers 558 558 558 558 558
Total payables 558 558 558 558 558
Total liabilities administered on behalf of Government 558 558 558 558 558

NMHC – Entity Budget Statements – Budgeted Financial Statements
418
Table 3.9: Schedule of Budgeted Administered Cash Flows (for the period ended 30 June)
2016-17 Estimated
actual$'000
2017-18 Budget
$'000
2018-19 Forward estimate
$'000
2019-20 Forward estimate
$'000
2020-21 Forward estimate
$'000
OPERATING ACTIVITIES
Cash received
GST received 140 142 142 142 142
Total cash received 140 142 142 142 142
Cash used
Grant payments - - - - -
Suppliers 3,685 3,726 3,785 3,853 3,918
GST paid 140 142 142 142 142
Total cash used 3,825 3,868 3,927 3,995 4,060
Net cash from (or used by) operating activities (3,685) (3,726) (3,785) (3,853) (3,918)
Net increase (or decrease) in cash held (3,685) (3,726) (3,785) (3,853) (3,918)
Cash at beginning of reporting period 3 3 3 3 3
Cash from Official Public Account for: - appropriations 3,685 3,726 3,785 3,853 3,918
Cash to the Official Public Account - - - - -
Cash at end of reporting period 3 3 3 3 3

419
OT
A
ORGAN AND TISSUE AUTHORITY
Entity Resources and Planned Performance

420
421
OT
A
ORGAN AND TISSUE AUTHORITY
Section 1: Entity Overview and Resources ...................................................... 422
1.1 Strategic Direction Statement ................................................................... 422
1.2 Entity Resource Statement ....................................................................... 424
1.3 Budget Measures ...................................................................................... 425
Section 2: Outcomes and Planned Performance ............................................. 426
2.1 Budgeted Expenses and Performance ..................................................... 426
Section 3: Budgeted Financial Statements ...................................................... 430
3.1 Budgeted Financial Statements ................................................................ 430
3.2 Budgeted Financial Statements Tables .................................................... 431

OTA – Entity Budget Statements – Entity Overview and Resources
422
Section 1: Entity Overview and Resources
1.1 STRATEGIC DIRECTION STATEMENT1
The Australian Government’s national reform program for improving opportunities for transplantation through increased organ and tissue donation was endorsed by the Council of Australian Governments (COAG) on 3 July 2008.
The Australian Organ and Tissue Donation and Transplantation Authority, also known as the Organ and Tissue Authority (OTA), works in partnership with the DonateLife Network (DLN), States and Territories, the donation and transplantation clinical sectors, eye and tissue banks and the community to implement the national reform program.
Australia’s national reform program is implemented within the context of clear international commitments and statements by the World Health Organization relating to the obligation of governments to be accountable and responsible for implementing safe, ethical and effective organ and tissue donation and transplantation systems.
All State and Territory health ministers are committed to increasing Australia’s organ and tissue rates by proactively promoting organ and tissue donations and committing to effectively managing retrieval, tissue typing and transplantation services. National organ donation targets and projected donation growth trajectories have been agreed to 2018.
To inform trajectories post-2018, work has commenced to model the donation potential and growth and consequential demand on the retrieval and transplant workforce and services. This work is critical to ensure that all transplant opportunities presented by increased donation rates are realised.
The OTA will focus on the following three key areas to ensure organ and tissue donation is delivered on a collaborative basis throughout Australia with a view to increasing organ donation outcomes to 25 donors per million population by 2018:
increasing the number of potential organ and tissue donors; improving organ and tissue donor consent rates; and enhancing systems to support organ and tissue donation and transplantation.
The OTA is a statutory authority established by the Australian Organ and Tissue Donation and Transplantation Authority Act 2008. This Act sets out the primary responsibilities for the OTA and the Chief Executive Officer (CEO).
1 For more information about the strategic direction of the OTA, refer to the current corporate plan, available
at: www.donatelife.gov.au/corporate-plan

OTA – Entity Budget Statements – Entity Overview and Resources
423
OT
A
The Australian Organ and Tissue Donation and Transplantation Authority Amendment (New Governance Arrangements) Bill 2016 received Royal Assent on 1 December 2016. This Bill establishes the Australian Organ and Tissue Donation and Transplantation Authority Board (the Board) and will transfer responsibilities previously invested in the CEO to the Board from 1 July 2017.
The OTA is a Non-corporate Commonwealth Entity under the Public Governance, Performance and Accountability Act 2013.

OTA – Entity Budget Statements – Entity Overview and Resources
424
1.2 ENTITY RESOURCE STATEMENT
Table 1.1 shows the total funding from all sources available to the entity for its operations and to deliver programs and services on behalf of the Government.
The table summarises how resources will be applied by outcome (Government strategic policy objectives) and by administered (on behalf of the Government or the public) and departmental (for the entity’s operations) classification.
For more detailed information on special accounts and special appropriations, please refer to Budget Paper No. 4 – Agency Resourcing.
Information in this table is presented on a resourcing (i.e. appropriations/cash available) basis, whilst the ‘Budgeted expenses by outcome’ tables in Section 2 and the financial statements in Section 3 are presented on an accrual basis.
Table 1.1: OTA Resource Statement – Budget Estimates for 2017-18 as at Budget May 2017
2016-17Estimated
actual$'000
2017-18 Estimate
$'000
DEPARTMENTAL
Prior year appropriation available 1,889 1,889
Annual appropriations
Ordinary annual services (a)
Departmental appropriation 5,530 5,453
s74 retained revenue receipts (b) - -
Departmental capital budget (c) 254 251
Other services (d)
Equity injection - -
Total departmental annual appropriations 5,784 5,704
Total departmental resourcing 7,673 7,593
ADMINISTERED
Prior year appropriation available 80 80
Annual appropriations
Ordinary annual services (a)
Outcome 1 43,766 42,116
Total administered annual appropriations 43,766 42,116
Total administered resourcing 43,846 42,196
Total resourcing for OTA 51,519 49,789
2016-17 2017-18
Average staffing level (number) 27 28
All figures are GST exclusive. (a) Appropriation Bill (No. 1) 2017-18. (b) Estimated retained revenue receipts under section 74 of the PGPA Act 2013. (c) Departmental capital budgets are not separately identified in Appropriation Bill (No. 1) and form part of
ordinary annual services items. Refer to Table 3.5 for further details. For accounting purposes, this amount has been designated as a 'contribution by owner'.
(d) Appropriation Bill (No. 2) 2017-18.

OTA – Entity Budget Statements – Entity Overview and Resources
425
OT
A
1.3 BUDGET MEASURES
This section is not applicable to the OTA.

OTA – Entity Budget Statements – Outcomes and Planned Performance
426
Section 2: Outcomes and Planned Performance
Government outcomes are the intended results, impacts or consequences of actions by the Government on the Australian community. Commonwealth programs are the primary vehicle by which Government entities achieve the intended results of their outcome statements. Entities are required to identify the programs which contribute to Government outcomes over the Budget and forward years.
Each outcome is described below together with its related programs. The following provides detailed information on expenses for each outcome and program, further broken down by funding source.
Note:
Performance reporting requirements in the Portfolio Budget Statements are part of the Enhanced Commonwealth Performance Framework established by the Public Governance, Performance and Accountability Act 2013. It is anticipated that the performance criteria described in Portfolio Budget Statements will be read with broader information provided in an entity’s corporate plans and annual performance statements – included in Annual Reports – to provide an entity’s complete performance story.
The OTA’s most recent corporate plan is available at: www.donatelife.gov.au/corporate-plan
The OTA’s most recent annual performance statement is available at: www.donatelife.gov.au/annual-reports
2.1 BUDGETED EXPENSES AND PERFORMANCE
Outcome 1
Improved access to organ and tissue transplants, including through a nationally coordinated and consistent approach and system
Program Contributing to Outcome 1
Program 1.1: A Nationally Coordinated System for Organ and Tissue Donation for Transplantation

OTA – Entity Budget Statements – Outcomes and Planned Performance
427
OT
A
Linked Programs
Other Commonwealth entities that contribute to Outcome 1
Department of Health Program 1.1: Health Policy Research and Analysis The Department of Health has policy responsibility for organ and tissue donation for transplantation, including the Australian Organ Donor Register, administration of the Supporting Leave for Living Organ Donors Program, national approaches around access to organ donation and transplantation services and emerging national and international issues.
Department of Human Services Program 1.2: Services to the Community – Health The Department of Human Services administers the Australian Organ Donor Register on behalf of the Department of Health.
Budgeted Expenses for the OTA
Table 2.1.1 shows how much the entity intends to spend (on an accrual basis) on achieving the outcome, broken down by program, as well as by administered and departmental funding sources.
Table 2.1.1: Budgeted Expenses for the OTA
2016-17 Estimated
actual$'000
2017-18 Budget
$'000
2018-19 Forward
Year 1$'000
2019-20 Forward
Year 2 $'000
2020-21 Forward
Year 3 $'000
Program 1.1: A Nationally Coordinated System for Organ and Tissue Donation for Transplantation
Administered expenses
Ordinary annual services (a) 43,766 42,116 42,706 43,389 44,041
Departmental expenses
Departmental appropriation(b) 5,530 5,453 5,456 5,461 5,487
Expenses not requiring appropriation 405 399 551 556 in the Budget year (c) 405
Operating loss - - - - -
Total for Program 1.1 49,701 47,974 48,561 49,401 50,084
Total expenses for Outcome 1 49,701 47,974 48,561 49,401 50,084
2016-17 2017-18
Average staffing level (number) 27 28
(a) Appropriation Bill (No. 1) 2017-18. (b) Departmental appropriation combines 'Ordinary annual services (Appropriation Bill No. 1)' and 'Revenue
from independent sources (s74)'. (c) Expenses not requiring appropriation in the Budget year are made up of depreciation expense,
amortisation expense, makegood expense and audit fees.
Movement of Funds
There were no movements of administered funds between years.

OTA – Entity Budget Statements – Outcomes and Planned Performance
428
Planned Performance for the OTA
Table 2.1.2 below details the performance criteria for the program associated with Outcome 1.2 It also summarises how the program is delivered and where 2017-18 Budget measures have materially changed the program.
Table 2.1.2: Performance Criteria for the OTA
Purpose
To save and improve the lives of more Australians through optimising every potential organ and tissue donation for transplantation.
Outcome 1
Improved access to organ and tissue transplants, including through a nationally coordinated and consistent approach and system
Program 1.1: A Nationally Coordinated System for Organ and Tissue Donation for Transplantation
The Australian Government aims to deliver a nationally coordinated leading practice approach to organ and tissue donation for transplantation, in collaboration with the States and Territories, clinicians and the community.
Delivery
A. Increasing the capability and capacity within the health system to maximise donation and transplantation rates
In collaboration with the DonateLife Network (DLN), strengthen accountability and performance of DLN hospitals through an updated performance measurement framework to promote the uptake of best practice consent and request models.
Implement the Australian Organ Matching System by 30 June 2018 to maximise equity of access and clinical outcomes for transplants in Australia, to be delivered in partnership with the Australian Red Cross Blood Service.
Deliver an additional simplified registration channel by 30 December 2017, to encourage more Australians to register their donation decision on the Australian Organ Donor Record.
B. Raising community awareness and stakeholder engagement across Australia to promote organ and tissue donation
Continue to educate the Australian community about the need for family discussion, knowledge, and the normalisation of organ and tissue donation in end of life care.
2 Progress against the performance criteria published in the 2016-17 Portfolio Budget Statements will be
reported in the 2016-17 OTA Annual Report.

OTA – Entity Budget Statements – Outcomes and Planned Performance
429
OT
A
Performance criteria3
A. Increasing the capability and capacity within the health system to maximise donation and transplantation rates
Organ transplant recipients (from deceased donors) per million population (trpmp).
2016 Result 2017 Target 2018 Target 2019 Target 2020 Target
60 trpmp ≥65 trpmp ≥70 trpmp N/A4 N/A5
Deceased organ donors per million population (dpmp).
2016 Result 2017 Target 2018 Target 2019 Target 2020 Target
21 dpmp ≥23 dpmp ≥25 dpmp N/A N/A
Rate of consent to organ donation.
2016 Result 2017 Target 2018 Target 2019 Target 2020 Target
60%6 ≥65% ≥70% ≥75% ≥75%
B. Raising community awareness and stakeholder engagement across Australia to promote organ and tissue donation
Through community education and awareness, increase the number of registrations on the Australian Organ Donor Register.
2016 Target 2017 Target 2018 (& beyond) Target
150,000 new annual registrations.
10% increase on the number of new annual registrations on the Australian Organ Donor Register from the prior year.
10% increase on the number of new annual registrations on the Australian Organ Donor Register from the prior year.
Material changes to Program 1.1 resulting from the following measures: There are no material changes to Program 1.1 resulting from measures.
3 Performance criteria are reported by calendar year to align with Australian and international donation and
performance reporting practice. 4 Targets are COAG endorsed to 2018 only. 5 Ibid. 6 Target is inclusive of Donation by Circulatory Death and Donation by Brain Death.

OTA – Entity Budget Statements – Budgeted Financial Statements
430
Section 3: Budgeted Financial Statements
Section 3 presents budgeted financial statements which provide a comprehensive snapshot of entity finances for the 2017-18 Budget year, including the impact of Budget measures and resourcing on financial statements.
3.1 BUDGETED FINANCIAL STATEMENTS
3.1.1 Differences Between Entity Resourcing and Financial Statements
This section is not applicable to the OTA.
3.1.2 Explanatory Notes and Analysis of Budgeted Financial Statements
Departmental Resources
For the budget and forward years the OTA is expected to achieve a break even position net of unfunded depreciation. Employee and supplier expenses are expected to remain consistent with 2016-17 actuals.
Administered Resources
The OTA administers funds associated with the delivery of the Australian Government’s national reform program to implement a world’s best practice approach to organ and tissue donation for transplantation.
In 2017-18, the OTA has forecast Administered expenses of $42.116 million. The slight reduction in 2017-18 reflects the allocation received in 2016-17 for the OTA Budget measure Accelerating Growth in Organ and Tissue Donation for Transplantation.

OTA – Entity Budget Statements – Budgeted Financial Statements
431
OT
A
3.2 BUDGETED FINANCIAL STATEMENTS TABLES
Table 3.1: Comprehensive Income Statement (showing net cost of services for the period ended 30 June)
2016-17 Estimated
actual$'000
2017-18 Budget
$'000
2018-19 Forward estimate
$'000
2019-20 Forward estimate
$'000
2020-21 Forward estimate
$'000
EXPENSES
Employee benefits 3,759 3,666 3,706 3,772 3,819
Supplier expenses 1,841 1,857 1,820 1,759 1,743
Depreciation and amortisation 335 335 329 481 481
Total expenses 5,935 5,858 5,855 6,012 6,043
LESS:
OWN-SOURCE INCOME
Revenue
Sale of goods and rendering of services - - - - -
Other - - - - -
Total revenue - - - - -
Gains
Other 70 70 70 70 75
Total gains 70 70 70 70 75
Total own-source income 70 70 70 70 75
Net cost of (contribution by) services 5,865 5,788 5,785 5,942 5,968
Revenue from Government 5,530 5,453 5,456 5,461 5,487
Surplus (deficit) (335) (335) (329) (481) (481)
Surplus (deficit) attributable to the Australian Government (335) (335) (329) (481) (481)
OTHER COMPREHENSIVE INCOME
Changes in asset revaluation reserves - - - - -
Total other comprehensive income - - - - -
Total comprehensive income (loss) attributable to the Australian Government (335) (335) (329) (481) (481)
Note: Reconciliation of comprehensive income attributable to the agency
2016-17 $'000
2017-18 $'000
2018-19 $'000
2019-20 $'000
2020-21 $'000
Total comprehensive income (loss) attributable to the Australian Government (335) (335) (329) (481) (481)
plus non-appropriated expenses depreciation and amortisation expenses 335 335 329 481 481
Total comprehensive income (loss) attributable to the agency - - - - -

OTA – Entity Budget Statements – Budgeted Financial Statements
432
Table 3.2: Budgeted Departmental Balance Sheet (as at 30 June)
2016-17 Estimated
actual$'000
2017-18 Budget
$'000
2018-19 Forward estimate
$'000
2019-20 Forward estimate
$'000
2020-21 Forward estimate
$'000
ASSETS
Financial assets
Cash and cash equivalents 91 91 91 91 91
Receivables 2,204 2,204 2,204 2,204 2,204
Total financial assets 2,295 2,295 2,295 2,295 2,295
Non-financial assets
Land and buildings 331 322 280 167 54
Property, plant and equipment 173 196 192 254 258
Intangibles 1,028 930 896 716 606
Other 44 44 44 44 44
Total non-financial assets 1,576 1,492 1,412 1,181 962
Total assets 3,871 3,787 3,707 3,476 3,257
LIABILITIES
Payables
Suppliers 90 90 90 90 90
Other payables 562 562 562 562 562
Total payables 652 652 652 652 652
Provisions
Employees 1,081 1,081 1,081 1,081 1,081
Total provisions 1,081 1,081 1,081 1,081 1,081
Total liabilities 1,733 1,733 1,733 1,733 1,733
Net assets 2,138 2,054 1,974 1,743 1,524
EQUITY
Contributed equity 2,668 2,919 3,168 3,418 3,680
Reserves 678 678 678 678 678 Retained surpluses (accumulated deficits) (1,208) (1,543) (1,872) (2,353) (2,834)
Total equity 2,138 2,054 1,974 1,743 1,524
Table 3.3: Departmental Statement of Changes in Equity – Summary of Movement (Budget year 2017-18)
Retained earnings
$'000
Asset revaluation
reserve $'000
Contributed equity/capital
$'000
Total equity
$'000
Opening balance as at 1 July 2017
Balance carried forward from previous period (1,208) 678 2,668 2,138
Surplus (deficit) for the period (335) - - (335)
Capital budget - Bill 1 (DCB) - - 251 251
Estimated closing balance as at 30 June 2018 (1,543) 678 2,919 2,054
DCB = Departmental Capital Budget.

OTA – Entity Budget Statements – Budgeted Financial Statements
433
OT
A
Table 3.4: Budgeted Departmental Statement of Cash Flows (for the period ended 30 June)
2016-17 Estimated
actual$'000
2017-18 Budget
$'000
2018-19 Forward estimate
$'000
2019-20 Forward estimate
$'000
2020-21 Forward estimate
$'000
OPERATING ACTIVITIES
Cash received
Appropriations 5,577 5,475 5,512 5,461 5,487
GST received 203 752 752 752 165
Total cash received 5,780 6,227 6,264 6,213 5,652
Cash used
Employees 3,762 3,669 3,709 3,775 3,819
Suppliers 1,815 1,806 1,803 1,686 1,668
GST paid 203 752 752 752 165
Total cash used 5,780 6,227 6,264 6,213 5,652
Net cash from (or used by) operating activities - - - - -
INVESTING ACTIVITIES
Cash used
Purchase of property, plant and equipment 254 251 249 250 262
Total cash used 254 251 249 250 262
Net cash from (or used by) investing activities (254) (251) (249) (250) (262)
FINANCING ACTIVITIES
Cash received
Capital budget - Bill 1 (DCB) 254 251 249 250 262
Total cash received 254 251 249 250 262
Net cash from (or used by) financing activities 254 251 249 250 262
Net increase (or decrease) in cash held - - - - -
Cash and cash equivalents at the beginning of the reporting period 91 91 91 91 91
Cash and cash equivalents at the end of the reporting period 91 91 91 91 91
DCB = Departmental Capital Budget.

OTA – Entity Budget Statements – Budgeted Financial Statements
434
Table 3.5: Departmental Capital Budget Statement (for the period ended 30 June)
2016-17 Estimated
actual$'000
2017-18 Budget
$'000
2018-19 Forward estimate
$'000
2019-20 Forward estimate
$'000
2020-21 Forward estimate
$'000
CAPITAL APPROPRIATIONS
Capital budget - Bill 1 (DCB) 254 251 249 250 262
Equity injections - Bill 2 - - - - -
Total capital appropriations 254 251 249 250 262
Total new capital appropriations represented by:
Purchase of non-financial assets 254 251 249 250 262
Other - - - - -
Total items 254 251 249 250 262
PURCHASE OF NON-FINANCIAL ASSETS
Funded by capital appropriations - equity injection (a) - - - - -
Funded by capital appropriation - DCB (b) 254 251 249 250 262
Funded internally from departmental resources - - - - -
Total acquisitions of non-financial assets 254 251 249 250 262
RECONCILIATION OF CASH USED TO ACQUIRE ASSETS TO ASSET MOVEMENT TABLE
Total purchases 254 251 249 250 262
Total cash used to acquire assets 254 251 249 250 262
(a) Includes both current Bill 2, prior Act 2/4/6 appropriations and special capital appropriations. (b) Does not include annual finance lease costs. Includes purchases from current and previous years'
Departmental Capital Budget (DCB).

OTA – Entity Budget Statements – Budgeted Financial Statements
435
OT
A
Table 3.6: Statement of Asset Movements (Budget year 2017-18)
Buildings
$'000
Other property,plant and
equipment $'000
Intangibles
$'000
Total
$'000
As at 1 July 2017
Gross book value 795 410 2,114 3,319
Accumulated depreciation/ amortisation and impairment (464) (237) (1,086) (1,787)
Opening net book balance 331 173 1,028 1,532
CAPITAL ASSET ADDITIONS
Estimated expenditure on new or replacement assets
By purchase - appropriation ordinary annual services - 63 188 251
Total additions - 63 188 251
Other movements
Depreciation/amortisation expense (9) (40) (286) (335)
Disposals (a) - - - -
Other - - - -
Total other movements (9) (40) (286) (335)
As at 30 June 2018
Gross book value 795 473 2,302 3,570
Accumulated depreciation/ amortisation and impairment (473) (277) (1,372) (2,122)
Closing net book balance 322 196 930 1,448
(a) Net proceeds may be returned to the Official Public Account.
Table 3.7: Schedule of Budgeted Income and Expenses Administered on Behalf of Government (for the period ended 30 June)
2016-17 Estimated
actual$'000
2017-18 Budget
$'000
2018-19 Forward estimate
$'000
2019-20 Forward estimate
$'000
2020-21 Forward estimate
$'000
EXPENSES ADMINISTERED ON BEHALF OF GOVERNMENT
Grants 38,126 39,106 40,106 42,118 42,541
Supplier expenses 5,640 3,010 2,600 1,271 1,500
Total expenses administered on behalf of Government 43,766 42,116 42,706 43,389 44,041

OTA – Entity Budget Statements – Budgeted Financial Statements
436
Table 3.8: Schedule of Budgeted Assets and Liabilities Administered on Behalf of Government (as at 30 June)
2016-17 Estimated
actual$'000
2017-18 Budget
$'000
2018-19 Forward estimate
$'000
2019-20 Forward estimate
$'000
2020-21 Forward estimate
$'000
ASSETS ADMINISTERED ON BEHALF OF GOVERNMENT
Financial assets
Cash and cash equivalents 80 80 80 80 80
Receivables 119 119 119 119 119
Total financial assets 199 199 199 199 199
Non-financial assets
Other 142 142 142 142 142
Total non-financial assets 142 142 142 142 142
Total assets administered on behalf of Government 341 341 341 341 341
LIABILITIES ADMINISTERED ON BEHALF OF GOVERNMENT
Payables
Grants 10,855 10,855 10,855 10,855 10,855
Suppliers 99 99 99 99 99
Other payables 46 46 46 46 46
Total payables 11,000 11,000 11,000 11,000 11,000
Total liabilities administered on behalf of Government 11,000 11,000 11,000 11,000 11,000
Table 3.9: Schedule of Budgeted Administered Cash Flows (for the period ended 30 June)
2016-17 Estimated
actual$'000
2017-18 Budget
$'000
2018-19 Forward estimate
$'000
2019-20 Forward estimate
$'000
2020-21 Forward estimate
$'000
OPERATING ACTIVITIES
Cash received
GST received 752 752 752 752 752
Total cash received 752 752 752 752 752
Cash used
Grant payments 38,126 39,106 40,106 42,118 41,847
Suppliers 5,801 3,010 2,600 1,271 1,500
GST paid 752 752 752 752 752
Total cash used 44,679 42,868 43,458 44,141 44,099
Net cash from (or used by) operating activities (43,927) (42,116) (42,706) (43,389) (43,347)
Net increase (or decrease) in cash held (43,927) (42,116) (42,706) (43,389) (43,347)
Cash at beginning of reporting period 80 80 80 80 80
Cash from Official Public Account for: - appropriations 43,927 42,116 42,706 43,389 43,347
Cash to the Official Public Account - - - - -
Cash at end of reporting period 80 80 80 80 80

437
PS
R
PROFESSIONAL SERVICES
REVIEW
Entity Resources and Planned Performance

438

439
PS
R
PROFESSIONAL SERVICES
REVIEW
Section 1: Entity Overview and Resources ...................................................... 440
1.1 Strategic Direction Statement ................................................................... 440
1.2 Entity Resource Statement ....................................................................... 441
1.3 Budget Measures ...................................................................................... 441
Section 2: Outcomes and Planned Performance ............................................. 442
2.1 Budgeted Expenses and Performance ..................................................... 442
Section 3: Budgeted Financial Statements ...................................................... 447
3.1 Budgeted Financial Statements ................................................................ 447
3.2 Budgeted Financial Statements Tables .................................................... 448

PSR – Entity Budget Statements – Entity Overview and Resources
440
Section 1: Entity Overview and Resources
1.1 STRATEGIC DIRECTION STATEMENT1
The Australian Government, through the Professional Services Review (PSR), aims to protect the integrity of Commonwealth Medicare benefits, dental benefits and pharmaceutical benefits programs. In undertaking this role PSR safeguards the public against the risks and costs of inappropriate practice by health practitioners.
PSR reviews and investigates health practitioners who are suspected of inappropriate practice, on request from the Chief Executive Medicare. ‛Inappropriate practice’ includes inappropriately rendering or initiating health services that attract a Medicare Benefits Schedule (MBS) payment, or inappropriately prescribing under the Pharmaceutical Benefits Scheme (PBS).
The PSR Scheme is part of a strong regulatory regime designed to ensure that appropriate and cost-effective clinical services are delivered. The Scheme covers medical practitioners, dentists, optometrists, midwives, nurse practitioners, chiropractors, physiotherapists, podiatrists, osteopaths, audiologists, diabetes educators, dieticians, exercise physiologists, mental health nurses, occupational therapists, psychologists, social workers, speech pathologists, Aboriginal and Torres Strait Islander health practitioners, Aboriginal health workers and orthoptists.
Reviews are conducted by the Director of PSR who can take further action by entering into a negotiated agreement with the health practitioner or referring them to a committee of peers constituted by appointed PSR Panel members and Deputy Directors. This review could be undertaken in relation to the MBS and/or the PBS, both of which are administered by the Department of Human Services. The PSR Scheme also applies sanctions, if required, through the PSR Determining Authority.2
PSR seeks to change behaviour across the health professions by deterring inappropriate practice and raising awareness of the Australian Government’s expectation of high quality health service delivery. The role and functions of PSR are set out in Part VAA of the Health Insurance Act 1973. PSR is a Non-corporate Commonwealth Entity under the Public Governance, Performance and Accountability Act 2013.
1 For more information about the strategic direction of the PSR, refer to the current corporate plan, available
at: www.psr.gov.au/publications-and-resources/governance-and-corporate-documents 2 The Determining Authority is the body established by section 106Q of the Health Insurance Act 1973 that
determines the sanctions that should be applied in cases where PSR committees have found inappropriate practice, and decides whether or not to ratify negotiated agreements.

PSR – Entity Budget Statements – Entity Overview and Resources
441
PS
R
1.2 ENTITY RESOURCE STATEMENT
Table 1.1 shows the total funding from all sources available to the entity for its operations and to deliver programs and services on behalf of the Government.
The table summarises how resources will be applied by outcome (Government strategic policy objectives) and by administered (on behalf of the Government or the public) and departmental (for the entity’s operations) classification.
For more detailed information on special accounts and special appropriations, please refer to Budget Paper No. 4 – Agency Resourcing.
Information in this table is presented on a resourcing (i.e. appropriations/cash available) basis, whilst the ‘Budgeted expenses by outcome’ tables in Section 2 and the financial statements in Section 3 are presented on an accrual basis.
Table 1.1: PSR Resource Statement – Budget Estimates for 2017-18 as at Budget May 2017
2016-17Estimated
actual$'000
2017-18 Estimate
$'000
DEPARTMENTAL
Prior year appropriation available 2,450 2,665
Annual appropriations
Ordinary annual services (a)
Departmental appropriation 5,131 5,042
s74 retained revenue receipts (b) 40 -
Departmental capital budget (c) 143 649
Other services (d)
Equity injection - -
Total departmental annual appropriations 5,314 5,691
Total departmental resourcing 7,764 8,356
Total resourcing for PSR 7,764 8,356
2016-17 2017-18
Average staffing level (number) 18 18
All figures are GST exclusive. (a) Appropriation Bill (No. 1) 2017-18. (b) Estimated retained revenue receipts under section 74 of the PGPA Act 2013. (c) Departmental capital budgets (DCB) are not separately identified in Appropriation Bill (No. 1) and form part
of ordinary annual services items. Refer to Table 3.5 for further details. For accounting purposes, this amount has been designated as a 'contribution by owner'.
(d) Appropriation Bill (No. 2) 2017-18.
1.3 BUDGET MEASURES
This section is not applicable to PSR.

PSR – Entity Budget Statements – Outcomes and Planned Performance
442
Section 2: Outcomes and Planned Performance
Government outcomes are the intended results, impacts or consequences of actions by the Government on the Australian community. Commonwealth programs are the primary vehicle by which Government entities achieve the intended results of their outcome statements. Entities are required to identify the programs which contribute to Government outcomes over the Budget and forward years.
Each outcome is described below together with its related programs. The following provides detailed information on expenses for each outcome and program, further broken down by funding source.
Note:
Performance reporting requirements in the Portfolio Budget Statements are part of the Enhanced Commonwealth Performance Framework established by the Public Governance, Performance and Accountability Act 2013. It is anticipated that the performance criteria described in Portfolio Budget Statements will be read with broader information provided in an entity’s corporate plans and annual performance statements – included in Annual Reports – to provide an entity’s complete performance story.
PSR’s most recent corporate plan is available at: www.psr.gov.au/publications-and-resources/governance-and-corporate-documents
PSR’s most recent annual performance statement is available at: www.psr.gov.au/publications-and-resources/annual-reports
2.1 BUDGETED EXPENSES AND PERFORMANCE
Outcome 1
A reduction of the risks to patients and costs to the Australian Government of inappropriate clinical practice, including through investigating health services claimed under the Medicare and Pharmaceutical benefits schemes
Program Contributing to Outcome 1
Program 1.1: Safeguarding the Integrity of the Medicare Program and Pharmaceutical Benefits Scheme

PSR – Entity Budget Statements – Outcomes and Planned Performance
443
PS
R
Linked Programs
Other Commonwealth entities that contribute to Outcome 1
Department of Health Program 4.1: Medical Benefits The Department of Health has policy responsibility for Medicare and the Pharmaceutical Benefits Scheme (PBS). Program 4.7: Health Benefit Compliance Under the National Compliance Program, the Chief Executive Medicare refers suspected cases of inappropriate practice by health care service providers to the PSR for investigation.
Department of Human Services Program 1.2: Services to the Community – Health The Department of Human Services administers the PBS, Repatriation PBS, Indigenous access to PBS, and Medicare services and benefit payments.
Budgeted Expenses for PSR
Table 2.1.1 shows how much the entity intends to spend (on an accrual basis) on achieving the outcome, broken down by program, as well as by administered and departmental funding sources.
Table 2.1.1: Budgeted Expenses for PSR
2016-17 Estimated
actual$'000
2017-18 Budget
$'000
2018-19 Forward
Year 1$'000
2019-20 Forward
Year 2 $'000
2020-21 Forward
Year 3 $'000
Program 1.1: Safeguarding the Integrity of the Medicare Program and Pharmaceutical Benefits Scheme
Departmental expenses
Departmental appropriation (a) 5,171 5,042 5,010 5,015 5,039
Expenses not requiring appropriation 206 220 215 212 in the Budget year (b) 234
Operating deficit (surplus) (253) - (185) (100) -
Total for Program 1.1 5,152 5,248 5,045 5,130 5,251
Total expenses for Outcome 1 5,152 5,248 5,045 5,130 5,251
2016-17 2017-18
Average staffing level (number) 18 18
(a) Departmental appropriation combines 'Ordinary annual services (Appropriation Bill No. 1)' and 'Revenue from independent sources (s74)'.
(b) Expenses not requiring appropriation in the Budget year are made up of depreciation expense, amortisation expense, makegood expense and audit fees.

PSR – Entity Budget Statements – Outcomes and Planned Performance
444
Planned Performance for PSR
Table 2.1.2 below details the performance criteria for the program associated with Outcome 1.3 It also summarises how the program is delivered and where 2017-18 Budget measures have materially changed the program.
Table 2.1.2: Performance Criteria for PSR
Purpose
To protect the integrity of the Commonwealth Medicare Benefits and Pharmaceutical Benefits programs and in doing so safeguard the Australian public from the cost and risk of inappropriate practice.
Outcome 1
A reduction of the risks to patients and costs to the Australian Government of inappropriate clinical practice, including through investigating health services claimed under the Medicare and Pharmaceutical benefits schemes
Program 1.1: Safeguarding the Integrity of the Medicare Program and Pharmaceutical Benefits Scheme
The Australian Government, through PSR, aims to safeguard the public against the risks and costs of inappropriate practice by health practitioners. PSR works with Governments, medical and health care regulatory bodies, and professional organisations to protect the integrity of the Medicare Benefits Scheme (MBS) and the Pharmaceutical Benefits Schedule (PBS).
Delivery
A. Protecting against inappropriate health care practice
Where warranted the Director will review provision of services by engaging expert consultants to advise on the conduct of practitioners and the Director interviewing persons under review.
The Director enters into agreements, where appropriate, with persons under review who have acknowledged engaging in inappropriate practice.
If an agreement is not made, PSR Committees are established to conduct hearings and obtain information to investigate possible inappropriate practice of persons under review.
PSR’s Determining Authority takes into account the circumstances of each case and makes appropriate sanction decisions: ratifying agreements that are fair and fitting to the inappropriate practice acknowledged by the person under review, and making determinations fitting to the inappropriate practice found by PSR Committees.
3 Progress against the performance criteria published in the 2016-17 Portfolio Budget Statements will be
reported in the 2016-17 PSR Annual Report.

PSR – Entity Budget Statements – Outcomes and Planned Performance
445
PS
R
Performance criteria
A. Protecting against inappropriate health care practice
Investigate whether practitioners have engaged in inappropriate practice through a staged review process. a. The Director of PSR will review the provision of services by practitioners referred by
Medicare and, where appropriate, enter into an agreement with the practitioner. b. Where appropriate, the Director of PSR will refer the practitioner to a PSR Peer Review
Committee. c. The Determining Authority will consider ratification of agreements and make
appropriate determinations.
2016-17 Estimated result 2017-18 Target 2018-19 (& beyond) Target
a. The Director conducted reviews of practitioners referred by the Chief Executive Medicare and in appropriate cases entered into agreements.
The Director will conduct reviews of practitioners referred by the Chief Executive Medicare and in appropriate cases enter into agreements.
As per 2017-18.
b. PSR Committees were convened and conducted hearings in a timely manner ensuring that practitioners being reviewed by their peers were afforded procedural fairness in each stage of the process.
PSR Committees will be convened and will conduct hearings in a timely manner ensuring that practitioners being reviewed by their peers are afforded procedural fairness in each stage of the process.
As per 2017-18.
c. The Determining Authority ratifies agreements and makes appropriate determinations of sanctions.
The Determining Authority will ratify agreements and make appropriate determinations of sanctions.
As per 2017-18.
Professional bodies actively engaged in consultation.
2016-17 Estimated result 2017-18 Target 2018-19 (& beyond) Target
Professional bodies were actively engaged in the process for appointments to the PSR Panel, and PSR received the required number of nominees to ensure broad professional representation on the PSR Panel.
Professional bodies actively engaged in the process for appointments to the PSR Panel, and PSR receives the required number of nominees to ensure broad professional representation on the PSR Panel.
As per 2017-18.
Percentage of reviews by the Director of PSR finalised within 12 months.
2016-17 Estimated result
2017-18 Target
2018-19 Target
2019-20 Target
2020-21 Target
100% 100% 100% 100% 100%

PSR – Entity Budget Statements – Outcomes and Planned Performance
446
Total number of matters for review finalised.4
2016-17 Estimated result
2017-18 Target
2018-19 Target
2019-20 Target
2020-21 Target
70 80 80 80 80
Percentage of court cases where PSR’s application of the law upheld.
2016-17 Estimated result
2017-18 Target
2018-19 Target
2019-20 Target
2020-21 Target
100% 100% 100% 100% 100%
Material changes to Program 1.1 resulting from the following measures: There are no material changes to Program 1.1 resulting from measures.
4 Reviews are requested by the Chief Executive Medicare to the Director of PSR.

PSR – Entity Budget Statements – Budgeted Financial Statements
447
PS
R
Section 3: Budgeted Financial Statements
Section 3 presents budgeted financial statements which provide a comprehensive snapshot of entity finances for the 2017-18 Budget year, including the impact of Budget measures and resourcing on financial statements.
3.1 BUDGETED FINANCIAL STATEMENTS
3.1.1 Differences Between Entity Resourcing and Financial Statements
This section is not applicable to PSR.
3.1.2 Explanatory Notes and Analysis of Budgeted Financial Statements
Departmental Resources
Comprehensive Income Statement
PSR is anticipating a break even position for the Budget and forward years. The Budget year and forward year three have been adjusted for unfunded depreciation and amortisation expenses.
Balance Sheet
PSR’s total assets and liabilities are expected to remain stable over the forward years.

PSR – Entity Budget Statements – Budgeted Financial Statements
448
3.2 BUDGETED FINANCIAL STATEMENTS TABLES
Table 3.1: Comprehensive Income Statement (showing net cost of services for the period ended 30 June)
2016-17 Estimated
actual$'000
2017-18 Budget
$'000
2018-19 Forward estimate
$'000
2019-20 Forward estimate
$'000
2020-21 Forward estimate
$'000
EXPENSES
Employee benefits 2,757 2,649 2,883 3,140 3,276
Supplier expenses 2,192 2,426 1,977 1,812 1,802
Depreciation and amortisation 203 173 185 178 173
Total expenses 5,152 5,248 5,045 5,130 5,251
LESS:
OWN-SOURCE INCOME
Revenue
Sale of goods and rendering of services - - - - -
Other revenue 40 - - - -
Total revenue 40 - - - -
Gains
Other 31 33 35 37 39
Total gains 31 33 35 37 39
Total own-source income 71 33 35 37 39
Net cost of (contribution by) services 5,081 5,215 5,010 5,093 5,212
Revenue from Government 5,131 5,042 5,010 5,015 5,039
Surplus (deficit) 50 (173) - (78) (173)
Surplus (deficit) attributable to the Australian Government 50 (173) - (78) (173)
OTHER COMPREHENSIVE INCOME
Changes in asset revaluation reserves - - - - -
Total other comprehensive income - - - - -
Total other comprehensive income attributable to the Australian Government 50 (173) - (78) (173)
Note: Reconciliation of comprehensive income attributable to the agency
2016-17 $'000
2017-18 $'000
2018-19 $'000
2019-20 $'000
2020-21 $'000
Total comprehensive income (loss) attributable to the Australian Government 50 (173) - (78) (173)
plus non-appropriated expenses depreciation and amortisation expenses 203 173 185 178 173
Total comprehensive income (loss) attributable to the agency 253 - 185 100 -

PSR – Entity Budget Statements – Budgeted Financial Statements
449
PS
R
Table 3.2: Budgeted Departmental Balance Sheet (as at 30 June)
2016-17 Estimated
actual$'000
2017-18 Budget
$'000
2018-19 Forward
Year 1$'000
2019-20 Forward
Year 2 $'000
2020-21 Forward
Year 3 $'000
ASSETS
Financial assets
Cash and cash equivalents 79 79 79 79 79
Receivables 2,617 2,502 2,716 2,787 2,717
Total financial assets 2,696 2,581 2,795 2,866 2,796
Non-financial assets
Land and buildings 7 261 221 181 141
Property, plant and equipment 69 346 285 228 346
Intangibles 352 297 275 223 191
Other 38 38 38 38 38
Total non-financial assets 466 942 819 670 716
Total assets 3,162 3,523 3,614 3,536 3,512
LIABILITIES
Payables
Suppliers 352 339 339 339 339
Other payables - - - - -
Total payables 352 339 339 339 339
Provisions
Employees 723 610 610 610 610
Other provisions 89 100 100 100 100
Total provisions 812 710 710 710 710
Total liabilities 1,164 1,049 1,049 1,049 1,049
Net assets 1,998 2,474 2,565 2,487 2,463
EQUITY
Contributed equity 997 1,646 1,737 1,737 1,886
Reserves 498 498 498 498 498
Retained surpluses (accumulated deficits) 503 330 330 252 79
Total equity 1,998 2,474 2,565 2,487 2,463
Table 3.3: Departmental Statement of Changes in Equity – Summary of Movement (Budget year 2017-18)
Retained earnings
$'000
Asset revaluation
reserve $'000
Contributed equity/capital
$'000
Total equity
$'000
Opening balance as at 1 July 2017
Balance carried forward from previous period 503 498 997 1,998
Surplus (deficit) for the period (173) - - (173)
Capital budget - Bill 1 (DCB) - - 649 649
Estimated closing balance as at 30 June 2018 330 498 1,646 2,474
DCB = Departmental Capital Budget.

PSR – Entity Budget Statements – Budgeted Financial Statements
450
Table 3.4: Budgeted Departmental Statement of Cash Flows (for the period ended 30 June)
2016-17 Estimated
actual$'000
2017-18 Budget
$'000
2018-19 Forward estimate
$'000
2019-20 Forward estimate
$'000
2020-21 Forward estimate
$'000
OPERATING ACTIVITIES
Cash received
Appropriations 4,715 5,038 4,657 4,745 5,109
Net GST received 233 272 243 248 250
Other cash received 40 - - - -
Total cash received 4,988 5,310 4,900 4,993 5,359
Cash used
Employees 2,757 2,989 2,928 3,113 3,036
Suppliers 2,199 2,321 2,001 1,851 2,253
Total cash used 4,956 5,310 4,929 4,964 5,289
Net cash from (or used by) operating activities 32 - (29) 29 70
INVESTING ACTIVITIES
Cash used
Purchase of property, plant and equipment 192 649 62 29 219
Total cash used 192 649 62 29 219
Net cash from (or used by) investing activities (192) (649) (62) (29) (219)
FINANCING ACTIVITIES
Cash received
Capital budget - Bill 1 (DCB) 143 649 91 - 149
Total cash received 143 649 91 - 149
Net cash from (or used by) financing activities 143 649 91 - 149
Net increase (or decrease) in cash held (17) - - - -
Cash and cash equivalents at the beginning of the reporting period 96 79 79 79 79
Cash and cash equivalents at the end of the reporting period 79 79 79 79 79
DCB = Departmental Capital Budget.

PSR – Entity Budget Statements – Budgeted Financial Statements
451
PS
R
Table 3.5: Departmental Capital Budget Statement (for the period ended 30 June)
2016-17 Estimated
actual$'000
2017-18 Budget
$'000
2018-19 Forward estimate
$'000
2019-20 Forward estimate
$'000
2020-21 Forward estimate
$'000
CAPITAL APPROPRIATIONS
Capital budget - Bill 1 (DCB) 143 649 91 - 149
Total capital appropriations 143 649 91 - 149
Total new capital appropriations represented by:
Purchase of non-financial assets 143 649 91 - 149
Total items 143 649 91 - 149
PURCHASE OF NON-FINANCIAL ASSETS
Funded by capital appropriation - DCB (a)
- current year appropriation 143 649 62 - 149
- prior year appropriation 49 - - 29 70
Total acquisitions of non-financial assets 192 649 62 29 219
RECONCILIATION OF CASH USED TO ACQUIRE ASSETS TO ASSET MOVEMENT TABLE
Total purchases 192 649 62 29 219
Total cash used to acquire assets 192 649 62 29 219
(a) Does not include annual finance lease costs. Includes purchases from current and previous years' Departmental Capital Budget (DCB).

PSR – Entity Budget Statements – Budgeted Financial Statements
452
Table 3.6: Statement of Asset Movements (Budget year 2017-18)
Buildings
$'000
Other property, plant and
equipment $'000
Intangibles
$'000
Total
$'000
As at 1 July 2017
Gross book value 261 301 793 1,355 Accumulated depreciation/ amortisation and impairment (254) (232) (441) (927)
Opening net book balance 7 69 352 428
CAPITAL ASSET ADDITIONS
Estimated expenditure on new or replacement assets
By purchase - appropriation ordinary annual services 300 349 - 649
Total additions 300 349 - 649
Other movements Depreciation/amortisation expense (46) (72) (55) (173)
Total other movements (46) (72) (55) (173)
As at 30 June 2018 Gross book value 561 650 793 2,004
Accumulated depreciation/ amortisation and impairment (300) (304) (496) (1,100)
Closing net book balance 261 346 297 904

Portfolio Glossary
453
PORTFOLIO GLOSSARY Accrual accounting
System of accounting where items are brought to account and included in the financial statements as they are earned or incurred, rather than as they are received or paid.
Accumulated depreciation
The aggregate depreciation recorded for a particular depreciating asset.
Additional Estimates
The Additional Estimates process updates estimates from the previous Budget update.
Additional Estimates Bills or Acts
Where amounts appropriated in the annual appropriation acts at Budget time are insufficient, Parliament may appropriate more funds to Portfolios through the Additional Estimates Acts. These are Appropriation Bills No. 3 and No. 4, and a separate Bill for Parliamentary Departments (Appropriations (Parliamentary Departments) Bill (No.2)). These Bills are introduced into the Parliament sometime after the Budget Bills.
Administered items
Expenses, revenues, assets or liabilities managed by entities on behalf of the Australian Government. Entities do not control administered items. Administered items include grants, subsidies and benefits (for example, funding for the Pharmaceutical Benefits Scheme).
Annotated appropriation
A form of appropriation which allows an entity access to certain money it receives in payment of services. The nature and extent of the amount to be appropriated are specified in Rules under s74 of the Public Governance, Performance and Accountability Act 2013.
Annual appropriation
Two appropriation Bills are introduced into Parliament in May and comprise the Budget. Further Bills are introduced later in the financial year as part of the Additional Estimates process. Parliamentary Departments have their own appropriations.
Appropriation The amount of public moneys authorised by Parliament for expenditure from Consolidated Revenue Fund (CRF). Appropriations authorise expenditure by the Australian Government for particular purposes.
ASL (Average Staffing Levels)
The average number of employees receiving salary/wages (or compensation in lieu of salary/wages) over a financial year, with adjustments for casual and part-time employees to show the full-time equivalent.
Assets Future economic benefits controlled by an entity as a result of past transactions or past events.

Portfolio Glossary
454
Available appropriation
Available appropriation is used to allow a comparison of the current year’s appropriation with what was made available for use in the previous year. Available appropriation is the amount available to be drawn down, and is equal to: Budget appropriation + Additional Estimates appropriation + Advance to the Finance Minister (AFM) -Savings - Rephasings - Other Reductions +/- Section 74.
Budget measure A decision by Cabinet or Ministers in the Budget process that has resulted in a change in expenditure in the current year and/or the forward years. See also cross-Portfolio Budget measure.
Capital expenditure
Expenditure by an entity on non-financial assets, for example purchasing a building.
Cross-Portfolio Budget measure
This is a Budget measure which affects outcomes administered in a number of Portfolios.
Capital Budget Statement
A statement of the entity’s estimated capital funding, through Appropriation Act No. 1 Departmental Capital Budget funding or Appropriation Act No. 2 equity injection funding and the entity’s estimated expenditures on non-financial assets.
Departmental items
Assets, liabilities, revenues and expenses which are controlled by the entity in providing its outputs. Departmental items would generally include computers, plant and equipment assets used by entities in providing goods and services and most employee expenses, supplier costs and other administrative expenses incurred.
Departmental Capital Budget (DCB)
Departmental Capital Budget funding appropriated to non-corporate PGPA Act entities through their Appropriation Act 1 Departmental appropriation, for the ongoing replacement of Departmental assets which cost less than $10 million.
Depreciation An expense recognised systematically for the purpose of allocating the depreciable amount of a depreciable asset over its useful life.
Efficiency dividend
An annual deduction of a percentage of running costs from an entity's budget, which acts as both an incentive to efficiency and a quantification of some of the efficiency gains made by an entity in the previous year.
Equity or net assets
Residual interest in the assets of an entity after deduction of its liabilities.
Expense The value of resources consumed or lost during the reporting period.
Fair value Fair values are prices in arm’s length transactions between willing buyers and sellers in an active market.

Portfolio Glossary
455
Forward estimates
A system of rolling three year financial estimates. After the Budget is passed, the first year of the forward estimates becomes the base for next year's Budget bid, and another out year is added to the forward estimates.
Historical cost The original cost of acquisition of an asset, including any costs associated with acquisition. Under AASB 116 Property, Plant and Equipment are required to be reported initially at the cost of acquisition (historical cost). The Australian Government’s financial reporting requirements issued under the Finance Minister's Orders require the revaluation of noncurrent assets with sufficient regularity to ensure that the carrying amount of assets does not differ materially from fair value as at reporting date.
Liabilities Future sacrifices of economic benefits that an entity is presently obliged to make to other entities as a result of past transactions or other past events.
MYEFO Mid-Year Economic and Fiscal Outlook.
Operating result Equals income less expenses.
Outcomes Outcomes are the results of events, actions or circumstances including in particular, the impact of the Australian Government on the Australian community. Outcomes may be linked with both the outputs of entities using the departmental expenses under their control, and with the administered expenses which entities manage on behalf of the Australian Government. Planned outcomes represent the changes desired by Government. The achievement of actual outcomes is assessed and reported in the Annual Report.
PGPA Act Public Governance, Performance and Accountability Act 2013
An Act about the governance, performance and accountability of, and the use and management of public resources by the Commonwealth, Commonwealth entities and Commonwealth companies, and for related purposes.
Performance criteria
A concise list of criteria, which are used to measure entity effectiveness in achieving the Government’s outcomes. Criteria must be measurable, but may be qualitative or quantitative. Criteria in the Portfolio Budget Statements are reported in the annual performance statements, in the Annual Report, for the same year. Outcomes are generally measured by performance criteria relating to effectiveness and equity, but may include efficiency and access criteria.

Portfolio Glossary
456
Portfolio Budget Statements
Statements prepared by Portfolios to explain the Budget appropriations in terms of outcomes and programs.
Price parameter adjustment
Expenses are indexed by a price parameter for anticipated increases in costs over the estimates period. Changes in indexation are annotated to each outcome as ‘Price parameter adjustment’ or ‘Application of indexation parameters’.
Program Commonwealth programs deliver benefits, services or transfer payments to individuals, industry/business or the community as a whole, and are the primary vehicles for Government entities to achieve the intended results of their outcome statements. Commencing from the 2009-10 Budget, entities are required to report to Parliament by program.
Quality Relates to the characteristics by which customers or stakeholders judge a product or service. Assessment of quality involves the use of information gathered from a range of sources including customers and stakeholders.
Quantity A measure of how many, or how much, of a product or service is produced. Quantities specified in the Portfolio Budget Statements are usually estimates based on the best available evidence. Entities report on actual quantities in their annual reports.
Revenue Total value of resources earned or received during the reporting period.
Special account A special account is an appropriation mechanism that notionally sets aside an amount within the Consolidated Revenue Fund (CRF) to be expended for specific purposes. The amount of appropriation that may be drawn from the CRF by means of a special account is limited to the balance of each special account. Special accounts are not bank accounts. However, amounts forming the balance of a special account may be held in the Official Public Account, an entity official bank account or by an outsider authorised in a manner consistent with the PGPA Act.
Special appropriation
Special appropriations are provisions within an Act, other than the annual appropriation Acts, that authorise expenditure for particular purposes. Special appropriations may state a maximum amount that is appropriated for the particular purpose or may specify the legislative criteria that will determine the amount to be paid.
Strategic Direction Statement
The Strategic Direction Statement explains the year ahead for the entity, focussing on the items of most importance, recognising the major Budget decisions affecting the entity, the major ongoing functions, new function and significant partnership arrangements, as well as upcoming challenges in the years ahead.


