Embed Size (px)
Citation preview

Portfolio Analytics & Reporting
© 2000 - 2016 Investment Metrics. All rights reserved.
Get a Free Needs Assessment TODAY! +1 (888) 828-9759 | [email protected] | invmetrics.com
The best-in-class portfolio analytics and reporting platform
Produce reports that
communicate plan
results
Consolidate multiple
reports using the Book
Wizard
Calculate performance
from total plan down
to composite
Quickly generate
detailed manager
profiles
Generate reports on-
demand or schedule
batch reporting
Flexible, Custom Portfolio Reporting
But you’re not on your own.
Get started with over 150 pre-built report
templates*. Or, you can build your own
using exhibits from our extensive library
of reusable charts and tables.
Either way, bring your own unique look
and feel to your reports:
Your ColorsYour Fonts
Your Branding* see samples on following pages
PARis Reporting Overview

Asset Allocation Reports
1

Initial
Investment
Amount
Net
Contributions/
Withdrawals
Net
Invested
Capital
Market
Value
Allocation
%
1
Year
3
Years
Since
Inception
Inception
Date
Total Plan - 472,747 472,747 499,497 100.0 -4,483 92,984 26,749 07/01/2006
Domestic Equity Composite - 212,539 212,539 243,987 48.8 -6,354 76,941 31,448 03/01/1999
TD Bank 10,731 52,165 62,895 52,518 10.5 -1,726 12,051 -10,378 03/01/1999
BlackRock Equity Index Fund 30,000 27,017 57,017 53,639 10.7 733 19,381 -3,378 09/01/2008
Eaton Vance AC SMID-Cap Fund 15,485 23,280 38,766 64,027 12.8 -1,669 21,930 -13,875 03/01/2011
T. Rowe Price Large Cap Growth 6,414 49,833 56,247 44,250 8.9 1,459 16,203 -11,997 05/01/2010
T. Rowe Price Large Cap Value 20,987 7,461 28,448 29,555 5.9 -5,151 7,376 -9,648 05/01/2010
Fixed Income Composite 20,000 276,700 296,700 213,285 42.7 1,379 9,316 -83,415 03/01/1999
Dodge and Cox Income Fund 12,000 28,283 40,283 40,294 8.1 1,358 4,650 -23,191 09/01/2008
PIMCO Total Return 20,000 187,867 207,867 135,489 27.1 985 4,847 -72,378 03/01/1999
PIMCO:Short-Term;Inst (PTSHX) 2,500 68,977 71,477 37,503 7.5 -964 -181 -33,974 02/01/2011
International Composite 5,000 44,447 49,447 42,224 8.5 492 6,727 -7,223 03/01/1999
Dodge and Cox International Stock Fund 10,000 57,383 67,383 42,224 8.5 492 6,727 -25,575 04/01/2006
Allocation and $ Performance
($000)
As of December 31, 2015
1.1

US Equity Intl Equity Domestic Fixed Income Real Estate Private Equity Cash Equivalent Total Fund
$ % $ % $ % $ % $ % $ % $ %
Total Fund Composite 236,318 45.07 42,224 8.05 213,285 40.68 13,561 2.59 11,289 2.15 7,670 1.46 524,347 100.00
Domestic Equity Composite 236,318 96.86 - - - - - - - - 7,670 3.14 243,987 46.53
TD Bank 49,849 94.92 - - - - - - - - 2,668 5.08 52,518 10.02
BlackRock Equity Index Fund 53,639 100.00 - - - - - - - - - - 53,639 10.23
Eaton Vance AC SMID-Cap Fund 59,557 93.02 - - - - - - - - 4,470 6.98 64,027 12.21
T. Rowe Price Large Cap Growth 43,718 98.80 - - - - - - - - 532 1.20 44,250 8.44
T. Rowe Price Large Cap Value 29,555 100.00 - - - - - - - - - - 29,555 5.64
Fixed Income Composite - - - - 213,285 100.00 - - - - - - 213,285 40.68
Dodge and Cox Income Fund - - - - 40,294 100.00 - - - - - - 40,294 7.68
PIMCO Total Return - - - - 135,489 100.00 - - - - - - 135,489 25.84
PIMCO:Short-Term;Inst (PTSHX) - - - - 37,503 100.00 - - - - - - 37,503 7.15
International Composite - - 42,224 100.00 - - - - - - - - 42,224 8.05
Dodge and Cox International Stock Fund - - 42,224 100.00 - - - - - - - - 42,224 8.05
Private Equity Composite - - - - - - 13,561 54.57 11,289 45.43 - - 24,850 4.74
BlackRock Vesey Street III, LP - - - - - - 1,893 100.00 - - - - 1,893 0.36
BlackRock Vesey Street IV, LP - - - - - - 11,668 100.00 - - - - 11,668 2.23
Columbia Partners - - - - - - - - 11,289 100.00 - - 11,289 2.15
DCM VI, LP - - - - - - - - - - - - - 0.00
Asset Allocation
($000)
As of December 31, 2015
1.2

Dec-2015 : 524,346,828 Sep-2015 : 523,315,978
SegmentsMarket Value
$
Allocation
(%)
US Equity 236,317,736 45.1¢
Intl Equity 42,223,893 8.1¢
Domestic Fixed Income 213,285,164 40.7¢
Real Estate 13,560,892 2.6¢
Private Equity 11,289,387 2.2¢
Cash Equivalent 7,669,756 1.5¢
SegmentsMarket Value
$
Allocation
(%)
US Equity 240,588,232 46.0¢
Intl Equity 39,891,169 7.6¢
Domestic Fixed Income 214,078,973 40.9¢
Real Estate 12,240,908 2.3¢
Private Equity 11,289,387 2.2¢
Cash Equivalent 5,227,309 1.0¢
Asset Allocation by Segment
Total Fund Composite
As of December 31, 2015
1.3

Style
Value
29,554,654.0
Growth
44,249,624.8
Core
170,183,212.5
Size-Style
Large/Core106,156,635.0
SMID/Core64,026,577.6
Large/Value29,554,654.0
Large/Growth44,249,624.8
Size
SMID
64,026,577.6
Large179,960,913.8
Asset Allocation by Style
Domestic Equity Composite
As of December 31, 2015
1.4

Dec-2015 : 524,346,828
Market Value
$
Allocation
(%)
PIMCO Total Return 135,488,973 25.8¢
TD Bank 52,517,814 10.0¢
Dodge and Cox International Stock Fund 42,223,893 8.1¢
BlackRock Equity Index Fund 53,638,821 10.2¢
Dodge and Cox Income Fund 40,293,690 7.7¢
T. Rowe Price Large Cap Growth 44,249,625 8.4¢
T. Rowe Price Large Cap Value 29,554,654 5.6¢
PIMCO:Short-Term;Inst (PTSHX) 37,502,501 7.2¢
Eaton Vance AC SMID-Cap Fund 64,026,578 12.2¢
BlackRock Vesey Street III, LP 1,892,762 0.4¢
BlackRock Vesey Street IV, LP 11,668,130 2.2¢
Columbia Partners 11,289,387 2.2¢
Asset Allocation Chart By Manager As of December 31, 2015
1.5

Dec-2015 : 524,346,828
46.5%
4.7%
8.1%
40.7%
Sep-2015 : 523,315,978
47.0%
4.5%
7.6%
40.9%
Market Value
$
Allocation
(%)
US Equity 243,987,491 46.5¢
US Fixed Income 213,285,164 40.7¢
International Equity 42,223,893 8.1¢
US Private Equity 24,850,279 4.7¢
Market Value
$
Allocation
(%)
US Equity 245,815,541 47.0¢
US Fixed Income 214,078,973 40.9¢
International Equity 39,891,169 7.6¢
US Private Equity 23,530,295 4.5¢
Asset Allocation Chart By Asset Class As of December 31, 2015
1.6

December 31, 2015
Target Allocation
Actual Allocation
Allocation Differences
0.0% 50.0% 100.0%-50.0 %-100.0 %
Private Equity Composite
24,850,279
Fixed Income Composite
213,285,164
International Composite
42,223,893
Domestic Equity Composite
243,987,491
40.0%
25.0%
10.0%
25.0%
4.7%
40.7%
8.1%
46.5%
-35.3 %
15.7%
-1.9 %
21.5%
September 30, 2015
Target Allocation
Actual Allocation
Allocation Differences
0.0% 50.0% 100.0%-50.0 %-100.0 %
Private Equity Composite
23,530,295
Fixed Income Composite
214,078,973
International Composite
39,891,169
Domestic Equity Composite
245,815,541
40.0%
25.0%
10.0%
25.0%
4.5%
40.9%
7.6%
47.0%
-35.5 %
15.9%
-2.4 %
22.0%
Asset Allocation vs. Target Allocation
Total Fund Composite vs. Total Fund Benchmark
As of December 31, 2015
1.7

December 31, 2015
Allocation Differences
0.0% 50.0%-50.0 %
Private Equity Composite
Fixed Income Composite
International Composite
Domestic Equity Composite
-35.3 %
15.7%
-1.9 %
21.5%
September 30, 2015
Allocation Differences
0.0% 50.0%-50.0 %
Private Equity Composite
Fixed Income Composite
International Composite
Domestic Equity Composite
-35.5 %
15.9%
-2.4 %
22.0%
December 31, 2015
Market Value
$
Allocation
(%)
Target
(%)
Domestic Equity Composite 243,987,491 46.5 25.0
International Composite 42,223,893 8.1 10.0
Fixed Income Composite 213,285,164 40.7 25.0
Private Equity Composite 24,850,279 4.7 40.0
Total Fund 524,346,828 100.0 100.0
September 30, 2015
Market Value
$
Allocation
(%)
Target
(%)
Domestic Equity Composite 245,815,541 47.0 25.0
International Composite 39,891,169 7.6 10.0
Fixed Income Composite 214,078,973 40.9 25.0
Private Equity Composite 23,530,295 4.5 40.0
Total Fund 523,315,978 100.0 100.0
Asset Allocation vs. Target Allocation
Total Fund Composite vs. Total Fund Benchmark
As of December 31, 2015
1.8
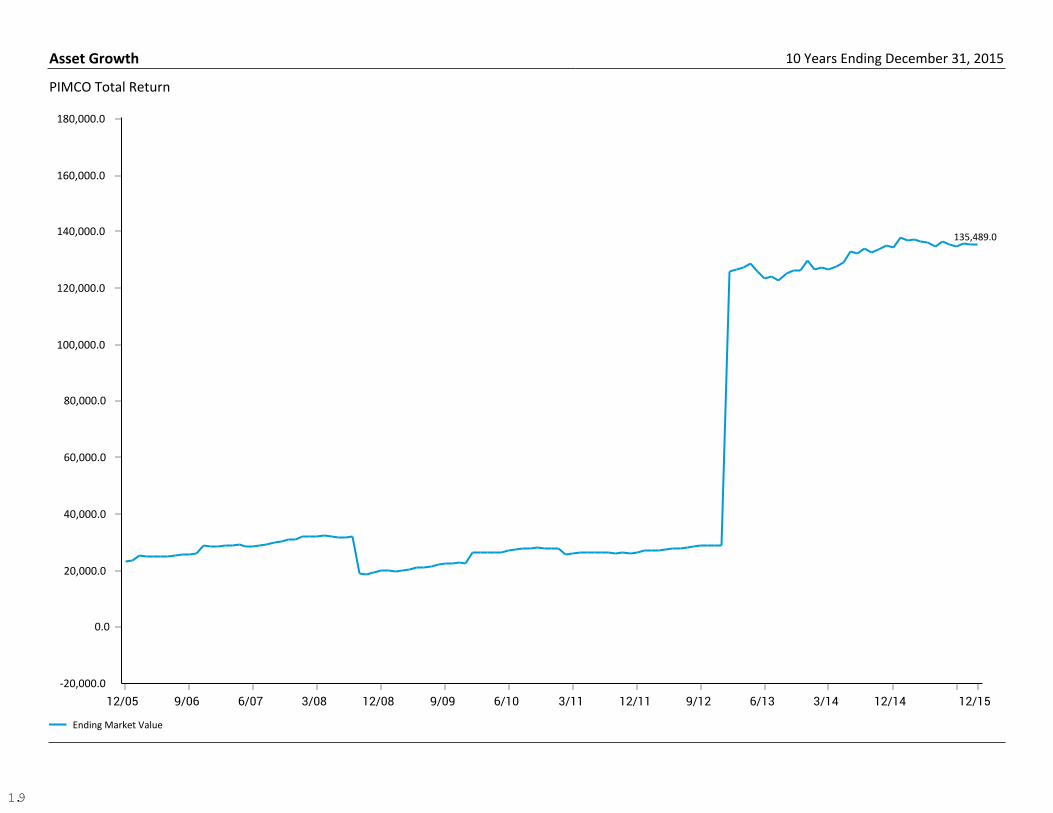
Ending Market Value
-20,000.0
0.0
20,000.0
40,000.0
60,000.0
80,000.0
100,000.0
120,000.0
140,000.0
160,000.0
180,000.0
12/05 9/06 6/07 3/08 12/08 9/09 6/10 3/11 12/11 9/12 6/13 3/14 12/14 12/15
135,489.0
Asset Growth
PIMCO Total Return
10 Years Ending December 31, 2015
1.9

Fee Schedule
Market Value
As of
12/31/2015
% of PortfolioEstimated
Annual Fee
Estimated
Annual Fee
(%)
Domestic Equity Composite 243,987,491 100.0 1,002,265 0.4
TD Bank 0.7 % of Assets 52,517,814 21.5 341,366 0.7
BlackRock Equity Index Fund 0.4 % of First $10 M
0.2 % of Next $40 M
0.1 % Thereafter
Minimum Fee: $1,000
53,638,821 22.0 119,367 0.2
Eaton Vance AC SMID-Cap Fund 0.7 % of First $10 M
0.6 % of Next $3 M
0.4 % of Next $3 M
0.4 % Thereafter
64,026,578 26.2 261,093 0.4
T. Rowe Price Large Cap Growth 0.4 % of Assets 44,249,625 18.1 176,999 0.4
T. Rowe Price Large Cap Value 0.4 % of Assets 29,554,654 12.1 103,441 0.4
Fee Schedule As of December 31, 2015
1.10

Market Value
As of
01/01/2015
Net
TransfersContributions Distributions Fees Expenses Income
Capital
Apprec./
Deprec.
Market Value
As of
12/31/2015
Total Fund Composite 551,372 -12,029 3,746 -15,546 -1,782 -4 2,505 -3,916 524,347
Domestic Equity Composite 264,011 -12,500 - - -1,170 - 2,505 -8,859 243,987
TD Bank 57,109 -2,500 - - -365 - 977 -2,702 52,518
BlackRock Equity Index Fund 55,424 -2,500 - - -18 - - 733 53,639
Eaton Vance AC SMID-Cap Fund 68,666 -2,500 - - -470 - 598 -2,267 64,027
T. Rowe Price Large Cap Growth 45,570 -2,500 - - -279 - 446 1,013 44,250
T. Rowe Price Large Cap Value 37,242 -2,500 - - -37 - 484 -5,634 29,555
Fixed Income Composite 212,175 - - - -269 - - 1,379 213,285
Dodge and Cox Income Fund 39,205 - - - -269 - - 1,358 40,294
PIMCO Total Return 134,504 - - - - - - 985 135,489
PIMCO:Short-Term;Inst (PTSHX) 38,467 - - - - - - -964 37,503
International Composite 41,964 - - - -233 - - 492 42,224
Dodge and Cox International Stock Fund 41,964 - - - -233 - - 492 42,224
Private Equity Composite 33,221 471 3,746 -15,546 -111 -4 - 3,072 24,850
BlackRock Vesey Street III, LP 13,167 - 160 -10,883 - - - -551 1,893
BlackRock Vesey Street IV, LP 9,096 471 1,970 -3,127 -104 -4 - 3,365 11,668
Columbia Partners 10,958 - 1,616 -1,535 -7 - - 258 11,289
DCM VI, LP - - - - - - - - -
Financial Reconciliation
($000)
1 Year Ending December 31, 2015
1.11

1
Year
3
Years
5
Years
7
Years
10
Years
Since
Inception
Inception
Date
Total Fund Composite 04/01/1998
Beginning Market Value 551,372 277,206 250,124 169,945 105,916 78,694
Net Contributions -23,828 191,307 253,455 404,567 536,024 619,509
Fees/Expenses -1,786 -5,473 -9,179 -13,930 -18,217 -19,811
Income 2,505 7,436 14,855 20,719 26,667 45,098
Gain/Loss -3,916 53,871 15,092 -56,953 -126,044 -199,143
Ending Market Value 524,347 524,347 524,347 524,347 524,347 524,347
Domestic Equity Composite 03/01/1999
Beginning Market Value 264,011 72,997 67,180 46,019 60,904 -
Net Contributions -12,500 97,435 106,238 140,270 165,612 219,211
Fees/Expenses -1,170 -3,385 -4,528 -4,937 -5,480 -6,671
Income 2,505 6,903 9,722 10,746 11,403 14,533
Gain/Loss -8,859 70,037 65,376 51,889 11,548 16,915
Ending Market Value 243,987 243,987 243,987 243,987 243,987 243,987
International Composite 03/01/1999
Beginning Market Value 41,964 22,340 21,966 17,632 17,457 5,000
Net Contributions - 13,848 15,848 19,074 39,676 46,416
Fees/Expenses -233 -691 -1,146 -1,473 -1,946 -1,969
Income - - 467 1,118 1,118 1,932
Gain/Loss 492 6,727 5,089 5,874 -14,081 -9,154
Ending Market Value 42,224 42,224 42,224 42,224 42,224 42,224
Fixed Income Composite 03/01/1999
Beginning Market Value 212,175 68,326 55,504 38,864 27,555 20,000
Net Contributions - 136,422 176,286 275,285 280,985 278,600
Fees/Expenses -269 -779 -1,258 -1,786 -1,900 -1,900
Income - - 3,791 7,979 13,191 24,830
Gain/Loss 1,379 9,316 -21,038 -107,057 -106,546 -108,244
Ending Market Value 213,285 213,285 213,285 213,285 213,285 213,285
Gain/Loss Summary
($000)
As of December 31, 2015
1.12

10 Years
$0.0
$120,000.0
$240,000.0
$360,000.0
$480,000.0
$600,000.0
$720,000.0
$840,000.0
($120,000.0)
($240,000.0)
($360,000.0)
Beginning Market Value Net Contributions Fees/Expenses Income Gain/Loss Ending Market Value
$105,916.2
$536,023.8
($18,216.8)
$26,667.4
($126,043.7)
$524,346.8
Gain/Loss Summary Chart 10 Years Ending December 31, 2015
1.13

US Equity International Equity US Fixed Income US Private Equity Private Equity
0.0
15.0
30.0
45.0
60.0
75.0
90.0
All
oc
ati
on
(%)
12/10 6/11 12/11 6/12 12/12 6/13 12/13 6/14 12/14 6/15 12/15
Historical Asset Allocation By Asset Class 5 Years Ending December 31, 2015
1.14

BlackRock Equity Index Fund BlackRock Vesey Street III, LP BlackRock Vesey Street IV, LP Columbia Partners
DCM VI, LP Dodge and Cox Income Fund Dodge and Cox International Stock Fund Eaton Vance AC SMID-Cap Fund
PIMCO Total Return PIMCO:Short-Term;Inst (PTSHX) T. Rowe Price Large Cap Growth T. Rowe Price Large Cap Value
TD Bank
0.0
15.0
30.0
45.0
60.0
75.0
90.0
All
oc
ati
on
(%)
12/12 3/13 6/13 9/13 12/13 3/14 6/14 9/14 12/14 3/15 6/15 9/15 12/15
Historical Asset Allocation by Manager
Total Fund
3 Years Ending December 31, 2015
1.15

US Equity Intl Equity Domestic Fixed Income Real Estate Private Equity Cash
0.0
15.0
30.0
45.0
60.0
75.0
90.0
All
oc
ati
on
(%)
12/12 3/13 6/13 9/13 12/13 3/14 6/14 9/14 12/14 3/15 6/15 9/15 12/15
Historical Asset Allocation by Segment
Total Fund Composite
3 Years Ending December 31, 2015
1.16

Market
Value%
1
Year
3
Years
5
Years
7
Years
10
Years
Total Fund Composite 524,347 100.0 2,505 7,436 14,855 20,719 26,667
Total Plan without PE 499,497 95.3 2,505 6,903 13,980 19,844 24,993
Domestic Equity Composite 243,987 46.5 2,505 6,903 9,722 10,746 11,403
TD Bank 52,518 10.0 977 2,930 3,952 4,382 5,039
BlackRock Equity Index Fund 53,639 10.2 - - - - -
Eaton Vance AC SMID-Cap Fund 64,027 12.2 598 1,383 2,018 2,666 4,244
T. Rowe Price Large Cap Growth 44,250 8.4 446 1,049 1,132 1,132 1,132
T. Rowe Price Large Cap Value 29,555 5.6 484 1,541 2,635 3,645 5,689
Fixed Income Composite 213,285 40.7 - - 3,791 7,979 13,191
Dodge and Cox Income Fund 40,294 7.7 - - 1,822 3,663 3,931
PIMCO Total Return 135,489 25.8 - - 1,852 4,200 8,661
PIMCO:Short-Term;Inst (PTSHX) 37,503 7.2 - - 117 117 117
International Composite 42,224 8.1 - - 467 1,118 1,118
Dodge and Cox International Stock Fund 42,224 8.1 - - 467 1,118 1,118
Private Equity Composite 24,850 4.7 - 533 875 875 955
BlackRock Vesey Street III, LP 1,893 0.4 - 187 307 307 387
BlackRock Vesey Street IV, LP 11,668 2.2 - - - - -
Columbia Partners 11,289 2.2 - 347 568 568 568
DCM VI, LP - 0.0 - - - - -
Historical Transactions - Income
($000)
As of December 31, 2015
1.17

Liquidity Schedule
Investments Inception Subscriptions Redemptions Market Value Daily Semi-Monthly Monthly Quarterly
BlackRock Equity Index Fund 09/01/2008 Daily Daily 53,639 53,639 - - -
BlackRock Vesey Street III, LP 07/01/2006 Monthly Quarterly 1,893 - - - 1,893
BlackRock Vesey Street IV, LP 11/01/2008 11,668 - - - -
Columbia Partners 10/01/2006 11,289 - - - -
Correlation Ventures, LP 10/01/2011 - - - - -
DCM VI, LP 01/01/2011 - - - - -
Dodge and Cox Income Fund 09/01/2008 Daily Daily 40,294 40,294 - - -
Dodge and Cox International Stock Fund 04/01/2006 Semi-Monthly Quarterly 42,224 - - - 42,224
Dodge and Cox Intl Fund 01/01/2012 - - - - -
Eaton Vance AC SMID-Cap Fund 03/01/2011 Daily Daily 64,027 64,027 - - -
Grosvenor GELS 01/01/2000 Daily Daily - - - - -
PIMCO Total Return 03/01/1999 Daily Daily 135,489 135,489 - - -
PIMCO:Short-Term;Inst (PTSHX) 02/01/2011 Daily Monthly 37,503 - - 37,503 -
T. Rowe Price Large Cap Growth 05/01/2010 Daily Daily 44,250 44,250 - - -
T. Rowe Price Large Cap Value 05/01/2010 29,555 - - - -
TD Bank 03/01/1999 Daily Semi-Monthly 52,518 - 52,518 - -
Total ($) 524,347 337,698 52,518 37,503 44,117
Total (%) 100.0 64.4 10.0 7.2 8.4
Redemption Terms
Redemptions Market Value %
Daily 337,698 64.4
Semi-Monthly 52,518 10.0
Monthly 37,503 7.2
Quarterly 44,117 8.4
Total 524,347 100.0
Unfunded Commitments
Market Value %
BlackRock Vesey Street III, LP -1,940 -0.4
BlackRock Vesey Street IV, LP -4,930 -0.9
Columbia Partners -12,105 -2.3
Correlation Ventures, LP 22,000 4.2
DCM VI, LP 5,000 1.0
Total 8,025 1.5
Liquidity Schedule As of December 31, 2015
1.18

Asset Class Investment Manager
Plan A Domestic Equity Composite
Market Value
$
Allocation
(%)
Plan B Domestic Equity Composite
Market Value
$
Allocation
(%)
US Equity TD Bank 52,517,814 21.5 -
US Equity BlackRock Equity Index Fund 53,638,821 22.0 -
US Equity T. Rowe Price Large Cap Growth 44,249,625 18.1 52,947,205 32.6
US Equity Eaton Vance AC SMID-Cap Fund 64,026,578 26.2 -
US Equity T. Rowe Price Large Cap Value 29,554,654 12.1 26,404,522 16.3
US Equity SPDR S&P Dividend - 33257 - 25,054,554 15.4
US Equity Wedge Large Cap Value - CP43 - 45,854,545 28.2
US Equity Renaissance Institutional Equity Fd A - I0143I - 12,145,422 7.5
Total 243,987,491 100.0 162,406,248 100.0
Plan Comparison As of December 31, 2015
1.19

Periods Ending
Beginning
Market Value
$000
Net
Cash Flow
$000
Gain/Loss
$000
Ending
Market Value
$000
%Return Unit ValueIncome
$000
Income % of
Beginning
Market Value
Dec-2010 - - - 250,124 N/A 100.0 - 0.0
Mar-2011 250,124 5,386 7,187 262,697 3.9 103.9 683 0.3
Jun-2011 262,697 24,556 -16,858 270,396 2.2 106.2 730 0.3
Sep-2011 270,396 1,899 -23,896 248,399 -8.0 97.7 715 0.3
Dec-2011 248,399 652 10,828 259,880 4.3 101.9 1,623 0.7
Mar-2012 259,880 2,474 14,464 276,818 6.5 108.5 933 0.4
Jun-2012 276,818 -2,627 -2,436 271,755 -1.0 107.5 1,133 0.4
Sep-2012 271,755 32,470 -18,102 286,122 5.2 113.1 829 0.3
Dec-2012 286,122 -6,368 -2,548 277,206 1.2 114.4 769 0.3
Mar-2013 277,206 198,699 -16,051 459,855 -3.8 110.1 586 0.2
Jun-2013 459,855 3,013 -932 461,936 -0.2 109.9 798 0.2
Sep-2013 461,936 -1,467 22,593 483,062 4.9 115.3 576 0.1
Dec-2013 483,062 1,144 34,374 518,580 7.1 123.5 585 0.1
Mar-2014 518,580 4,220 -6,108 516,692 1.5 125.4 306 0.1
Jun-2014 516,692 5,009 16,904 538,605 3.2 129.5 818 0.2
Sep-2014 538,605 510 -5,399 533,717 -1.0 128.2 735 0.1
Dec-2014 533,717 319 17,336 551,372 3.3 132.4 395 0.1
Mar-2015 551,372 -5,327 12,354 558,399 2.3 135.4 702 0.1
Jun-2015 558,399 -5,629 -1,537 551,233 -0.3 135.1 627 0.1
Sep-2015 551,233 -420 -27,497 523,316 -5.0 128.4 650 0.1
Dec-2015 523,316 -14,239 15,270 524,347 2.9 132.2 587 0.1
250,124 244,276 29,947 524,347 5.7 132.2 14,779 5.9
Schedule of Investable Assets
Total Fund Composite
5 Years Ending December 31, 2015
1.20

Domestic Equity Composite Domestic Equity Benchmark Net Cash Flow
-45,000.0
0.0
45,000.0
90,000.0
135,000.0
180,000.0
225,000.0
270,000.0
315,000.0
360,000.0
Ma
rke
t
Va
lue
In T
ho
us
an
ds
12/10 6/11 12/11 6/12 12/12 6/13 12/13 6/14 12/14 6/15 12/15
168,889.4
262,170.2
243,987.5
Periods Ending
Beginning
Market Value
$000
Net
Cash Flow
$000
Gain/Loss
$000
Ending
Market Value
$000
%Return Unit ValueIncome
$000
Income % of
Beginning
Market Value
5 Years 67,180 101,710 75,098 243,987 12.8 182.5 9,645 14.4
Schedule of Investable Assets
Domestic Equity Composite vs. Domestic Equity Benchmark
5 Years Ending December 31, 2015
1.21

Purchases SalesAverage
Market Value
Turnover
(%)
Total Plan 506,579 461,746 353,793 26.1
Domestic Equity Composite 471,253 420,104 172,265 48.8
TD Bank 140,652 142,579 35,592 79.0
BlackRock Equity Index Fund 21,621 19,823 38,390 10.3
Eaton Vance AC SMID-Cap Fund 137,907 109,453 43,683 50.1
T. Rowe Price Large Cap Growth 88,148 54,036 29,773 36.3
T. Rowe Price Large Cap Value 82,916 80,584 24,402 66.0
Fixed Income Composite 18,731 40,218 147,692 2.5
Dodge and Cox Income Fund 1,822 3,694 33,817 1.1
PIMCO Total Return 6,297 36,500 88,588 1.4
PIMCO:Short-Term;Inst (PTSHX) 10,612 23 25,287 0.0
International Composite 16,594 1,425 33,836 0.8
Dodge and Cox International Stock Fund 16,594 1,425 33,836 0.8
Turnover
($000)
5 Years Ending December 31, 2015
1.22

Compliance Reports
2

Target Allocation Actual Allocation Allocation Differences
0.0% 20.0% 40.0% 60.0%-20.0 %-40.0 %-60.0 %
Private Equity Composite
24,850.3
Fixed Income Composite
213,285.2
International Composite
42,223.9
US Mid Cap Composite
93,581.2
US Large Cap Composite
150,406.3
40.0%
25.0%
10.0%
7.0%
18.0%
4.7%
40.7%
8.1%
17.8%
28.7%
-35.3 %
15.7%
-1.9 %
10.8%
10.7%
Asset
Allocation
$000
Asset
Allocation
(%)
Minimum
Allocation
(%)
Maximum
Allocation
(%)
Target
Allocation
(%)
Minimum
Rebalance
$000
Maximum
Rebalance
$000
Total Fund Composite 524,347 100.0 100.0
US Large Cap Composite 150,406 28.7 15.0 25.0 18.0 -71,754 -19,320
US Mid Cap Composite 93,581 17.8 5.0 10.0 7.0 -67,364 -41,147
International Composite 42,224 8.1 5.0 15.0 10.0 -16,007 36,428
Fixed Income Composite 213,285 40.7 20.0 30.0 25.0 -108,416 -55,981
Private Equity Composite 24,850 4.7 35.0 45.0 40.0 158,671 211,106
Asset Allocation Compliance As of December 31, 2015
2.1

Passive Portfolios Weight (%) Target Portfolio Style Description
Mar-1999
Russell 3000 Index 60.00 Domestic Equity Composite Domestic Equity Composite
MSCI EAFE Index 30.00 Int'l Equity Composite Int'l Equity Composite
Blmbg. Barc. U.S. Aggregate 10.00 Fixed Income Composite Fixed Income Composite
Jun-1999
Blmbg. Barc. U.S. Aggregate 38.00 Fixed Income Composite Fixed Income Composite
MSCI EAFE Index 12.00 Int'l Equity Composite Int'l Equity Composite
Russell 2000 Index 20.00 Small/Mid Cap Composite Small/Mid Cap Composite
S&P 500 30.00 Large Cap Composite Large Cap Composite
Jul-1999
Russell 3000 Index 50.00 Domestic Equity Composite Domestic Equity Composite
MSCI EAFE Index 15.00 Int'l Equity Composite Int'l Equity Composite
Blmbg. Barc. U.S. Aggregate 20.00 Fixed Income Composite Fixed Income Composite
S&P 500 14.00 Test
Janus Capital Management LLC-Janus Classic Growth 1.00
Historical Hybrid Composition
Total Fund Hybrid Benchmark
As of December 31, 2015
2.2

Fund Reports
3

Fund Information
Fund Name : Dodge & Cox Funds: Dodge & Cox Global Stock Fund Portfolio Assets : $6,398 Million
Fund Family : Dodge & Cox Portfolio Manager : Team Managed
Ticker : DODWX PM Tenure :
Inception Date : 05/01/2008 Fund Style : IM Global Large Cap Core Equity (MF)
Fund Assets : $6,398 Million Style Benchmark : MSCI World Index
Portfolio Turnover : 20%
Fund Investment Policy
The Fund seeks long-term growth of principal and income. The Fund seeks to invest at least 80% of its total assets in common stocks, preferred stocks, securities convertible
into common stocks and securities that carry the right to buy common stocks, including American, European and Global Depositary Receipts.
Asset Allocation As of 12/31/2015
0.0% 100.0% 200.0%-100.0 %
Other
Convertibles
Cash
Fixed Income
Equities
-0.5 %
0.0%
0.3%
2.4%
97.8%
Top Ten Securities As of 12/31/2015
Alphabet Inc ORD 3.4 %
Time Warner Cable Inc ORD 3.1 %
Bank of America Corp ORD 2.6 %
Naspers Ltd ORD 2.5 %
Roche Holding AG Par 2.4 %
Sanofi SA ORD 2.3 %
Time Warner Inc ORD 2.2 %
Standard Chartered PLC ORD 2.1 %
Charles Schwab Corp ORD 2.1 %
Microsoft Corp ORD 2.1 %
Top 5 Countries As of 12/31/2015
United States 50.6 %
Switzerland 8.2 %
United Kingdom 6.2 %
France 3.9 %
Japan 3.4 %
Fund Characteristics As of 12/31/2015
Total Securities 92
Avg. Market Cap $79,532 Million
P/E 21.9
P/B 3.1
Div. Yield 2.4%
Annual EPS 5.3
5Yr EPS 12.6
3Yr EPS Growth 12.7
Sector/Quality Allocation As of 12/31/2015
0.0% 8.0% 16.0% 24.0% 32.0%
Non Classified EquityTelecommunication Services
MaterialsIndustrials
EnergyConsumer Staples
Health CareInformation TechnologyConsumer Discretionary
Financials
1.8%2.6%
3.3%6.3%6.4%
8.4%14.0%14.6%
16.8%23.6%
Regiona Allocation As of 12/31/2015
0.0% 20.0% 40.0% 60.0% 80.0%
Emerging Latin America
Other
Emg. MidEast, Africa, Europe
Pacific Basin
Emerging Asia
Europe
North America
2.5%
3.2%
4.4%
4.8%
6.3%
25.0%
54.5%
Mutual Fund Attributes
Dodge & Cox Global Stock (DODWX)
As of December 31, 2015
3.1

Fund Information
Product Name : Dodge & Cox Stock (DODGX)
Fund Family : Dodge & Cox
Ticker : DODGX
Peer Group : IM U.S. Large Cap Value Equity (MF)
Benchmark : Russell 1000 Value Index
Fund Inception : 01/04/1965
Portfolio Manager : Team Managed
Total Assets : 56,553 Million
Total Assets Date : 08/31/2016
Gross Expense : 0.5%
Net Expense : 0.5%
Turnover : 15%
Mutual Fund Detail
Dodge & Cox Stock (DODGX)
As of December 31, 2015
3.2

Sector Weights As of 12/31/2015
Dodge & Cox Intl Stock (DODFX)
MSCI EAFE Index
0.0 10.0 20.0 30.0 40.0
Utilities
Telecommunication Services
Materials
Information Technology
Industrials
Health Care
Financials
Energy
Consumer Staples
Consumer Discretionary
Other
Portfolio Characteristics As of 12/31/2015
Portfolio Benchmark
Total Securities 89 926
Avg. Market Cap $K 62,679,605 9,004,460
Price/Earnings (P/E) 23.7 16.4
Price/Book (P/B) 2.9 2.3
Dividend Yield 2.9 3.2
Annual EPS 11.2 N/A
5 Yr EPS 12.4 6.8
3 Yr EPS Growth 9.7 N/A
Beta (5 Years, Monthly) 1.0 1.0
Region Weights As of 12/31/2015
Dodge & Cox Intl Stock (DODFX) MSCI EAFE Index
0.0 6.0 12.0 18.0 24.0 30.0 36.0 42.0 48.0 54.0 60.0
Other
Frontier Markets
Middle East
United Kingdom
Europe ex UK
Japan
Pacific ex Japan
EM Mid East+Africa
North America
EM Latin America
EM Europe
EM Asia
Mutual Fund Portfolio Combo As of December 31, 2015
3.3

Peer Group Reports
4

-40.0
-25.0
-10.0
5.0
20.0
35.0
50.0
Re
turn
1
Quarter
1
Year
3
Years
5
Years
7
Years
10
Years2014 2013 2012
Capital Guardian Non-US Equity 4.7 (42) -3.5 (60) 4.3 (55) 3.7 (56) 8.2 (75) 3.3 (82) -4.8 (72) 23.6 (38) 21.0 (41)¢
MSCI EAFE Index 4.7 (42) -0.4 (46) 5.5 (47) 4.1 (51) 8.3 (72) 3.5 (78) -4.5 (69) 23.3 (39) 17.9 (66)�
5th Percentile 9.3 15.0 14.9 10.1 16.6 9.4 9.3 37.0 30.0
1st Quartile 5.9 3.6 8.6 6.5 12.2 6.6 1.0 26.6 22.9
Median 4.2 -1.3 5.1 4.1 9.9 4.8 -2.7 20.1 19.8
3rd Quartile 2.0 -9.1 -0.5 0.8 8.1 3.6 -5.1 5.6 16.7
95th Percentile -1.5 -16.9 -7.3 -4.9 5.9 1.9 -9.8 -3.9 8.3
Population 1,118 1,099 1,014 883 798 606 1,131 1,143 1,140
Peer Group Analysis
IM International Equity (SA+CF)
As of December 31, 2015
Parentheses contain percentile rankings.
Calculation based on quarterly periodicity.
4.1

5.0
8.0
11.0
14.0
17.0
20.0
23.0
Standard
Deviation
-1.0
2.0
5.0
8.0
11.0
14.0
Tracking
Error
-2.0
-1.5
-1.0
-0.5
0.0
0.5
1.0
1.5
Information
Ratio
0.0
0.4
0.8
1.2
1.6
2.0
2.4
Sharpe
Ratio
3
Years
5
Years
3
Years
5
Years
3
Years
5
Years
3
Years
5
Years
Fidelity Magellan Fund 9.5 (26) 15.2 (51) 1.8 (97) 3.8 (72) 0.3 (22) -0.5 (83) 1.7 (23) 0.8 (66)¢
Alpha Tilts Fund A 9.0 (14) 13.0 (17) 2.1 (93) 2.1 (97) -0.5 (75) 0.3 (14) 1.7 (27) 1.1 (13)�
5th Percentile 8.3 11.7 11.0 10.6 1.0 0.6 2.0 1.2
1st Quartile 9.4 13.4 7.3 7.6 0.2 0.1 1.7 1.0
Median 10.8 15.0 4.8 5.3 -0.2 -0.1 1.4 0.8
3rd Quartile 13.3 17.5 3.2 3.5 -0.5 -0.4 1.1 0.7
95th Percentile 15.9 20.3 1.9 2.2 -1.1 -0.8 0.8 0.5
Population 720 689 720 689 720 689 720 689
Peer Group Analysis - Multi Statistics
IM U.S. Growth Equity (SA+CF) vs. Russell 3000 Growth Index
As of December 31, 2015
Parentheses contain percentile rankings.
Calculation based on quarterly periodicity.
4.2

-28.0
-20.0
-12.0
-4.0
4.0
12.0
20.0
Re
turn
IM U
.S.
L
arg
e C
ap
Co
re E
qu
ity
(SA
+C
F)
IM U
.S.
M
id C
ap
Co
re E
qu
ity
(SA
+C
F)
IM U
.S.
S
ma
ll
Ca
p C
ore
Eq
uit
y (S
A+
CF
)
IM U
.S.
L
arg
e C
ap
Gro
wth
Eq
uit
y (S
A+
CF
)
IM U
.S.
M
id C
ap
Gro
wth
Eq
uit
y (S
A+
CF
)
IM U
.S.
S
ma
ll
Ca
p G
row
th E
qu
ity
(SA
+C
F)
IM U
.S.
L
arg
e C
ap
Va
lue
Eq
uit
y (S
A+
CF
)
IM U
.S.
M
id C
ap
Va
lue
Eq
uit
y (S
A+
CF
)
IM U
.S.
S
ma
ll
Ca
p V
alu
e E
qu
ity
(SA
+C
F)
-5.6
-1.0
1.3
3.2
6.6
-5.7
-2.2-0.8
2.4
4.9
-7.4
-3.3
-1.4
0.6
5.4
-2.6
2.1
5.1
8.1
13.0
-6.4
-1.7
0.8
2.9
7.5
-8.6
-3.6
-0.7
2.3
7.0
-9.9
-4.8
-2.3
0.1
4.4
-11.0
-5.9
-3.6
-1.7
1.8
-15.2
-7.1
-4.3
-1.9
1.4
Peer Group Comparison 1 Year Ending December 31, 2015
4.3

-50.0
0.0
50.0
100.0
150.0
200.0
IM U
.S.
S
ma
ll
Ca
p G
row
th E
qu
ity
(SA
+C
F)
IM U
.S.
S
ma
ll
Ca
p V
alu
e E
qu
ity
(SA
+C
F)
IM U
.S.
S
ma
ll
Ca
p C
ore
Eq
uit
y (S
A+
CF
)
IM U
.S.
M
id C
ap
Gro
wth
Eq
uit
y (S
A+
CF
)
IM U
.S.
M
id C
ap
Va
lue
Eq
uit
y (S
A+
CF
)
IM U
.S.
M
id C
ap
Co
re E
qu
ity
(SA
+C
F)
IM U
.S.
L
arg
e C
ap
Gro
wth
Eq
uit
y (S
A+
CF
)
IM U
.S.
L
arg
e C
ap
Va
lue
Eq
uit
y (S
A+
CF
)
IM U
.S.
L
arg
e C
ap
Co
re E
qu
ity
(SA
+C
F)
Peer Group Fee Distribution For Assets Less than Five Million Dollars As of December 31, 2015
4.4

1
Quarter
Year
To
Date
1
Year
3
Years
5
Years
7
Years
10
Years2014 2013 2012 2011 2010
1st Percentile 9.1 8.9 8.9 21.1 14.8 21.6 11.9 16.2 50.2 24.5 12.2 38.8
5th Percentile 7.6 7.5 7.5 18.8 14.2 20.4 11.1 15.2 47.5 21.9 6.3 33.8
1st Decile 6.0 6.2 6.2 17.5 13.7 19.5 10.6 14.1 44.5 20.9 5.6 32.9
2nd Decile 5.1 3.4 3.4 16.3 13.0 18.7 10.0 12.2 40.6 18.6 3.2 30.7
1st Quartile 5.0 2.9 2.9 16.0 12.6 18.4 9.8 11.1 39.3 17.8 1.9 29.8
3rd Decile 4.7 2.5 2.5 15.4 12.3 18.1 9.6 9.9 39.0 17.4 1.2 29.2
4th Decile 3.9 1.9 1.9 14.8 11.7 17.5 9.2 9.1 37.8 16.5 0.1 27.8
Median 3.3 0.8 0.8 14.0 11.4 17.0 8.9 8.5 36.4 15.1 -1.0 26.7
6th Decile 2.9 -0.3 -0.3 13.6 11.1 16.7 8.6 7.6 35.1 13.9 -3.2 25.2
7th Decile 2.2 -1.4 -1.4 12.8 10.5 16.4 8.3 6.4 33.3 12.6 -5.4 23.0
3rd Quartile 1.9 -1.7 -1.7 12.2 10.2 16.0 8.1 5.8 32.7 11.9 -5.8 22.5
8th Decile 1.5 -3.1 -3.1 11.9 9.8 15.7 7.7 5.2 31.9 10.8 -6.2 21.7
9th Decile 0.5 -5.1 -5.1 11.1 7.8 14.7 6.9 3.7 30.2 7.7 -9.2 19.3
95th Percentile -0.3 -6.4 -6.4 9.9 7.2 13.2 6.6 1.8 27.6 5.9 -11.4 15.9
10th Decile -2.7 -11.7 -11.7 5.3 2.4 11.4 3.4 -3.3 18.1 -10.2 -19.5 2.2
Population 119 118 118 113 107 99 87 122 131 134 141 147
Peer Group Percentile Breakdown
IM U.S. Mid Cap Growth Equity (SA+CF)
As of December 31, 2015
Calculation based on quarterly periodicity.
4.5

1.5
2.0
2.5
3.0
3.5
4.0
4.5
5.0
Re
turn
(%)
1.6 1.8 2.0 2.2 2.4 2.6 2.8 3.0 3.2 3.4 3.6 3.8 4.0
Risk (Standard Deviation %)
ReturnStandard
Deviation
PIMCO:Tot Rtn;Inst 3.5 3.6��
Barclays Capital Aggregate 3.2 2.7pr
Median 3.1 2.8¾
Peer Group Scattergram
IM U.S. Broad Market Core Fixed Income (MF)
5 Years Ending December 31, 2015
Calculation based on monthly periodicity.
4.6

-22.0
-20.0
-18.0
-16.0
-14.0
-12.0
-10.0
-8.0
-6.0
-4.0
Ma
xim
um
Dra
wd
ow
n
9.0 9.9 10.8 11.7 12.6 13.5 14.4 15.3 16.2 17.1 18.0 18.9
Standard Deviation
Maximum
Drawdown
Standard
Deviation
Dodge & Cox Stock (DODGX) -11.1 14.8�
Median -10.5 13.5¾
Population 512 512
Peer Group Scattergram - XY Statistics Selection
Peer Group Scattergram - XY Statistics Selection
1 Year Ending December 31, 2015
4.7

-12.0
-4.0
4.0
12.0
20.0
28.0
36.0
Re
turn
1
Quarter
1
Year
3
Years
5
Years
7
Years
10
Years2014 2013 2012 2011
Total Fund Composite 2.9 (28) -0.2 (28) 4.9 (78) 5.7 (80) 9.0 (65) 5.2 (73) 7.2 (48) 7.9 (82) 12.4 (61) 1.9 (42)¢
Total Fund Benchmark 5.2 (1) 3.0 (1) 12.8 (1) 11.6 (1) 13.9 (1) 8.1 (2) 11.8 (12) 24.8 (2) 15.7 (8) 4.1 (27)�
5th Percentile 3.8 1.3 9.7 9.3 11.9 7.5 13.5 21.4 15.9 10.3
1st Quartile 3.0 0.0 7.6 7.9 10.5 6.4 9.5 17.4 14.3 4.6
Median 2.2 -1.0 6.6 6.9 9.6 5.7 6.9 13.8 13.0 0.9
3rd Quartile 1.3 -2.2 5.1 5.9 8.6 5.1 5.1 9.6 11.4 -0.8
95th Percentile -0.1 -3.7 3.1 3.9 6.8 4.1 2.9 2.7 8.0 -3.0
Population 487 464 406 370 318 267 420 391 361 361
Plan Sponsor Peer Group Analysis
All Corporate Plans-Total Fund
As of December 31, 2015
Parentheses contain percentile rankings.
Calculation based on monthly periodicity.
4.8

-8.0
-4.0
0.0
4.0
8.0
12.0
16.0
20.0 Return
2.0
4.0
6.0
8.0
10.0
12.0
Standard
Deviation
-1.0
-0.5
0.0
0.5
1.0
1.5
2.0
Sharpe
Ratio
1
Year
2
Years
3
Years
1
Year
2
Years
3
Years
1
Year
2
Years
3
Years
Total Fund Composite -0.2 (28) 3.4 (45) 4.9 (78) 7.5 (64) 6.6 (55) 7.6 (86) 0.0 (28) 0.5 (52) 0.7 (89)¢
Total Fund Benchmark 3.0 (1) 7.3 (2) 12.8 (1) 9.6 (97) 8.2 (94) 7.9 (93) 0.3 (4) 0.9 (15) 1.6 (3)�
5th Percentile 1.3 6.2 9.7 4.0 3.8 4.2 0.3 1.1 1.4
1st Quartile 0.0 4.4 7.6 5.9 5.6 5.8 0.0 0.8 1.2
Median -1.0 3.2 6.6 7.0 6.5 6.5 -0.1 0.5 1.0
3rd Quartile -2.2 2.1 5.1 8.0 7.2 7.2 -0.3 0.4 0.8
95th Percentile -3.7 0.4 3.1 9.2 8.2 8.1 -0.5 0.1 0.6
Population 464 442 406 464 442 406 464 442 406
Plan Sponsor Peer Group Analysis-Multi Statistics
All Corporate Plans-Total Fund vs. 90 Day U.S. Treasury Bill
As of December 31, 2015
Parentheses contain percentile rankings.
Calculation based on monthly periodicity.
4.9

-2.0
0.0
2.0
4.0
6.0
8.0
10.0
12.0
14.0
Re
turn
(%)
1.8 2.7 3.6 4.5 5.4 6.3 7.2 8.1 9.0 9.9 10.8 11.7
Risk (Standard Deviation %)
ReturnStandard
Deviation
Total Fund Composite 5.7 7.2��
Total Fund without PE 7.8 8.1pr
Total Fund Benchmark 11.6 8.9¿̄
Median 6.8 7.0¾
Plan Sponsor Scattergram
All Corporate Plans ($250M to $1B)-Total Fund
5 Years Ending December 31, 2015
Calculation based on monthly periodicity.
4.10

-25.0
-10.0
5.0
20.0
35.0
50.0
65.0
80.0
95.0
All
oc
ati
on
(%)
US Equity Intl. Equity US Fixed Income Intl. Fixed Income Alternative Inv. Real Estate Cash
Total Fund Composite 46.5 (14) 8.1 (88) 40.7 (42) 0.0 4.7 (81) 0.0 0.0¢
5th Percentile 55.0 29.2 68.4 18.2 41.0 13.4 5.3
1st Quartile 39.0 22.1 48.9 9.0 21.3 7.8 3.2
Median 24.4 16.1 35.5 3.9 10.9 5.3 1.7
3rd Quartile 16.7 10.4 25.7 2.4 6.1 3.2 0.8
95th Percentile 9.9 5.0 10.0 0.1 0.4 1.3 0.2
Population 98 97 101 24 66 30 67
Plan Sponsor TF Asset Allocation
All Corporate Plans ($250M to $1B)-Total Fund
As of December 31, 2015
Parentheses contain percentile rankings.
4.11

Number of
Observations>=Median Top Quartile Bottom Quartile >Intl Alpha Tilts >Non-US Equity >Intl Equity Select >MSCI EAFE Index
Intl Alpha Tilts 12 11 4 0 N/A 11 6 12
Non-US Equity 12 10 0 0 1 N/A 1 9
Intl Equity Select 12 12 4 0 6 11 N/A 12
MSCI EAFE Index 12 9 0 0 0 3 0 N/A
Relative Ranking vs. Peer
IM International Equity (SA+CF)
12 Quarters Rolling Periods From January 1, 2013 To December 31, 2015
Calculation based on quarterly periodicity.
4.12

-25.0
-10.0
5.0
20.0
35.0
Re
turn
3
Years
3
Years
3
Years
3
Years
3
Years
3
Years
International Alpha Tilts -6.4 (76) 8.1 (75) 4.6 (66) 10.1 (29) 14.3 (26) 9.1 (23)¢£
Non-US Equity Composite -5.5 (69) 8.1 (76) 5.8 (53) 9.3 (38) 12.5 (40) 4.3 (55)��
International Equity Select -5.3 (67) 6.7 (85) 7.5 (32) 12.5 (13) 12.1 (43) 6.9 (34)pr
MSCI EAFE Index -6.5 (77) 8.2 (75) 4.0 (73) 8.7 (44) 11.6 (51) 5.5 (47)¿̄
5th Percentile 6.8 26.9 12.6 14.5 20.0 14.9
1st Quartile 0.2 18.8 8.2 10.5 14.3 8.6
Median -3.1 12.2 6.0 8.0 11.6 5.1
3rd Quartile -6.3 8.1 3.9 3.0 8.6 -0.5
95th Percentile -10.4 3.6 0.3 -2.8 3.1 -7.3
Population 1,006 1,023 996 995 1,012 1,014
Rolling Peer Group Analysis
IM International Equity (SA+CF)
12 Quarters Rolling Periods From January 1, 2010 To December 31, 2015
Calculation based on quarterly periodicity.
4.13

Average Excess Return For Total Period:1.88% Manager Excess Returns
0.0
2.0
4.0
6.0
8.0
10.0
12.0
-2.0
-4.0
-6.0
Ex
ce
ss
Re
turn
(%)
3/96 3/97 3/98 3/99 3/00 3/01 3/02 3/03 3/04 3/05 3/06 3/07 3/08 3/09 3/10 3/11 3/12 3/13 3/14 12/15
Rolling Peer Group Excess Return
IM U.S. Growth Equity (SA+CF) vs. S&P 500 Index
12 Quarters Rolling Periods From January 1, 1996 To December 31, 2015
Calculation based on quarterly periodicity.
4.14

5th Percentile 1st Quartile Median 3rd Quartile 95th Percentile
-40.0
-30.0
-20.0
-10.0
0.0
10.0
20.0
30.0
40.0
50.0
Re
turn
(%)
3/06 9/06 3/07 9/07 3/08 9/08 3/09 9/09 3/10 9/10 3/11 9/11 3/12 9/12 3/13 9/13 3/14 9/14 3/15 12/15
Rolling Peer Group Percentile Breakdown
IM U.S. Growth Equity (SA+CF)
12 Quarters Rolling Periods From January 1, 2006 To December 31, 2015
Calculation based on quarterly periodicity.
4.15

Median
First Period 2nd Last Period Last Period
-5.0
0.0
5.0
10.0
15.0
20.0
25.0
30.0
35.0
Re
turn
(%)
3.0 6.0 9.0 12.0 15.0 18.0 21.0 24.0 27.0 30.0
Risk (Standard Deviation %)
ReturnStandard
Deviation
Jun-2011 (First Period) 6.7 25.5��
Sep-2015 (2nd Last Period) 13.5 10.9pr
Dec-2015 (Last Period) 15.4 10.8¿̄
Rolling Peer Group Scattergram
IM U.S. Growth Equity (SA+CF)
12 Quarters Rolling Periods From January 1, 2011 To December 31, 2015
Calculation based on quarterly periodicity.
4.16

0.0
25.0
50.0
75.0
100.0
Re
turn
Pe
rce
nti
le R
an
k
3/11 6/11 9/11 12/11 3/12 6/12 9/12 12/12 3/13 6/13 9/13 12/13 3/14 6/14 9/14 12/14 3/15 6/15 9/15 12/15
Total Period5-25
Count
25-Median
Count
Median-75
Count
75-95
Count
Dodge & Cox Stock 20 11 (55%) 3 (15%) 6 (30%) 0 (0%)¾
Russell 3000 Value Index 20 1 (5%) 15 (75%) 4 (20%) 0 (0%)¾
Rolling Percentile Ranking
IM U.S. Multi-Cap Value Equity(MF)
12 Quarters Rolling Periods From January 1, 2011 To December 31, 2015
4.17

Portfolio Holdings Based Reports
5

Buy-and-Hold Portfolio 3.4
Portfolio Trading 0.0
Actual Return 3.5
Benchmark Return 5.6
Actual Active Return -2.1
Stock Selection -2.0
Region Selection -0.5
Interaction 0.2
Total Selection -2.2
Portfolio Trading 0.0
Benchmark Trading 0.0
Active Trading Impact 0.0
Buy & Hold Active Return -2.2
Allocation-10/01/2015
Portfolio Benchmark
Performance-1 Quarter Ending
December 31, 2015
Portfolio Benchmark
Attribution
Stock Region Interaction Total
EM Asia 8.4 0.0 10.1 0.0 0.0 0.4 0.0 0.4
EM Europe 1.1 0.0 -4.8 0.0 0.0 -0.1 0.0 -0.1
EM Latin America 3.1 0.0 -2.4 0.0 0.0 -0.3 0.0 -0.3
EM Mid East+Africa 3.4 0.0 -2.8 0.0 0.0 -0.3 0.0 -0.3
Europe ex UK 17.0 17.3 -0.8 3.3 -0.7 0.0 0.0 -0.7
Japan 3.5 8.7 13.2 9.3 0.3 -0.2 -0.2 -0.1
Middle East 0.0 0.2 0.0 9.8 0.0 0.0 0.0 0.0
North America 56.3 61.9 5.0 6.1 -0.7 0.0 0.1 -0.7
Other 0.8 0.0 -2.6 -2.6 0.0 -0.1 0.0 -0.1
Pacific ex Japan 1.5 4.1 0.6 8.5 -0.3 -0.1 0.2 -0.2
United Kingdom 4.8 7.7 -6.3 0.8 -0.6 0.2 0.2 -0.2
Total 100.0 100.0 3.4 5.6 -2.0 -0.5 0.2 -2.2
Buy and Hold Region Attribution
Dodge & Cox Global Stock (DODWX) vs. MSCI World Index
1 Quarter Ending December 31, 2015
5.1

Allocation
Dodge & Cox Global Stock (DODWX)
MSCI World Index
0.0 20.0 40.0 60.0 80.0
United Kingdom
Pacific ex Japan
Other
North America
Middle East
Japan
Europe ex UK
EM Mid East+Africa
EM Latin America
EM Europe
EM Asia
Performance
Dodge & Cox Global Stock (DODWX)
MSCI World Index
0.0 8.0 16.0 24.0-8.0-16.0
United Kingdom
Pacific ex Japan
Other
North America
Middle East
Japan
Europe ex UK
EM Mid East+Africa
EM Latin America
EM Europe
EM Asia
Total Attribution
0.0 0.2 0.4 0.6 0.8-0.2-0.4-0.6-0.8-1.0-1.2
United Kingdom
Pacific ex Japan
Other
North America
Middle East
Japan
Europe ex UK
EM Mid East+Africa
EM Latin America
EM Europe
EM Asia
Buy and Hold Region Attribution Graph
Dodge & Cox Global Stock (DODWX) vs. MSCI World Index
1 Quarter Ending December 31, 2015
5.2

Buy-and-Hold Portfolio 5.9
Portfolio Trading 0.3
Actual Return 6.1
Benchmark Return 7.3
Actual Active Return -1.2
Stock Selection -1.2
Sector Selection -0.1
Interaction -0.2
Total Selection -1.5
Portfolio Trading 0.3
Benchmark Trading 0.0
Active Trading Impact 0.3
Buy & Hold Active Return -1.2
Allocation-10/01/2015
Portfolio Benchmark
Performance-1 Quarter Ending
December 31, 2015
Portfolio Benchmark
Attribution
Stock Sector Interaction Total
Consumer Discretionary 24.9 21.5 2.9 5.9 -0.6 0.0 -0.1 -0.8
Consumer Staples 5.3 11.2 11.2 8.1 0.4 0.0 -0.2 0.1
Energy 1.4 0.7 -4.2 -17.3 0.1 -0.2 0.1 0.0
Financials 3.5 5.4 8.4 7.6 0.0 0.0 0.0 0.0
Health Care 20.6 16.8 8.8 9.3 -0.1 0.1 0.0 0.0
Industrials 9.4 11.1 -1.8 4.3 -0.7 0.0 0.1 -0.5
Information Technology 32.6 27.7 7.5 8.4 -0.3 0.1 0.0 -0.2
Materials 2.2 3.5 10.0 9.3 0.0 0.0 0.0 0.0
Telecommunication Services 0.0 2.1 0.0 7.4 0.0 0.0 0.0 0.0
Utilities 0.0 0.0 0.0 6.0 0.0 0.0 0.0 0.0
Total 100.0 100.0 5.9 7.3 -1.2 -0.1 -0.2 -1.5
Buy and Hold Sector Attribution
T. Rowe Price Large Cap Growth vs. Russell 1000 Growth Index
1 Quarter Ending December 31, 2015
5.3

Allocation
Eaton Vance AC SMID-Cap Fund
Russell 2500 Index
0.0 6.0 12.0 18.0 24.0 30.0 36.0
Utilities
Telecommunication Services
Materials
Information Technology
Industrials
Health Care
Financials
Energy
Consumer Staples
Consumer Discretionary
Performance
Eaton Vance AC SMID-Cap Fund
Russell 2500 Index
0.0 10.0 20.0 30.0-10.0-20.0
Utilities
Telecommunication Services
Materials
Information Technology
Industrials
Health Care
Financials
Energy
Consumer Staples
Consumer Discretionary
Total Attribution
0.0 0.4 0.8 1.2 1.6 2.0 2.4 2.8 3.2 3.6-0.4-0.8-1.2-1.6
Utilities
Telecommunication Services
Materials
Information Technology
Industrials
Health Care
Financials
Energy
Consumer Staples
Consumer Discretionary
Buy and Hold Sector Attribution Graph
Eaton Vance AC SMID-Cap Fund vs. Russell 2500 Index
1 Quarter Ending December 31, 2015
5.4

Buy-and-Hold Portfolio -0.9
Portfolio Trading -0.1
Actual Return -1.0
Benchmark Return -3.0
Actual Active Return 2.0
Stock Selection 1.4
Style Selection 0.4
Interaction 0.3
Total Selection 2.1
Portfolio Trading -0.1
Benchmark Trading 0.0
Active Trading Impact -0.1
Buy & Hold Active Return 2.0
Allocation-04/01/2012
Portfolio Benchmark
Performance-1 Quarter Ending June 30,
2012
Portfolio Benchmark
Attribution
Stock Style Interaction Total
Mid Growth 11.9 0.5 -5.5 -15.7 0.1 -1.4 1.2 -0.2
Mid Neutral 25.0 4.2 11.3 -4.5 0.7 -0.3 3.3 3.6
Mid Value 18.9 7.8 -1.5 -2.7 0.1 0.0 0.1 0.3
Small Growth 15.3 2.5 -13.3 11.8 -0.6 1.9 -3.2 -1.9
Small Neutral 6.9 13.4 -11.9 -3.4 -1.1 0.0 0.6 -0.6
Small Value 22.0 69.1 0.3 -3.1 2.3 0.0 -1.6 0.8
Unclassified 0.0 2.5 0.0 -9.9 0.0 0.2 0.0 0.2
Total 100.0 100.0 -0.9 -3.1 1.4 0.4 0.3 2.1
Buy and Hold Style Attribution
Burgundy Smaller Companies vs. Russell 2000 Value Index
1 Quarter Ending June 30, 2012
5.5

Allocation
Burgundy Smaller Co Russell 2000 Value Index
0.0 15.0 30.0 45.0 60.0 75.0 90.0
Unclassified
Small Value
Small Neutral
Small Growth
Mid Value
Mid Neutral
Mid Growth
0.0
22.0
6.9
15.3
18.9
25.0
11.9
2.5
69.1
13.4
2.5
7.8
4.2
0.5
Performance
Burgundy Smaller Co Russell 2000 Value Index
0.0 8.0 16.0 24.0-8.0-16.0-24.0
Unclassified
Small Value
Small Neutral
Small Growth
Mid Value
Mid Neutral
Mid Growth
0.0
0.3
-11.9
-13.3
-1.5
11.3
-5.5
-9.9
-3.1
-3.4
11.8
-2.7
-4.5
-15.7
Total Attribution
0.0 0.6 1.2 1.8 2.4 3.0 3.6 4.2 4.8 5.4-0.6-1.2-1.8-2.4-3.0-3.6
Unclassified
Small Value
Small Neutral
Small Growth
Mid Value
Mid Neutral
Mid Growth
0.2
0.8
-0.6
-1.9
0.3
3.6
-0.2
Buy and Hold Style Attribution Graph
Burgundy Smaller Co vs. Russell 2000 Value Index
1 Quarter Ending June 30, 2012
5.6

Dodge & Cox
Intl Stock (DODFX)MSCI EAFE Index
Canada 0.0 0.0
United States 0.0 0.1
Australia 0.0 6.8
Hong Kong 0.0 3.1
New Zealand 0.0 0.2
Singapore 0.0 1.2
Pacific ex Japan 0.0 11.3
Japan 0.0 23.4
Austria 0.0 0.2
Belgium 0.0 1.4
Bermuda 0.0 0.0
Denmark 0.0 1.9
Finland 0.0 0.9
France 0.0 9.7
Germany 0.0 9.0
Ireland 0.0 0.5
Italy 0.0 2.4
Netherlands 0.0 2.9
Norway 0.0 0.6
Portugal 0.0 0.1
Spain 0.0 3.2
Sweden 0.0 2.9
Switzerland 0.0 9.4
Europe ex UK 0.0 45.0
United Kingdom 0.0 19.3
Israel 0.0 0.8
Middle East 0.0 0.8
Developed Markets 0.0 100.0
Dodge & Cox
Intl Stock (DODFX)MSCI EAFE Index
China 0.0 0.0
India 0.0 0.0
Indonesia 0.0 0.0
Korea 0.0 0.0
Malaysia 0.0 0.0
Philippines 0.0 0.0
Taiwan 0.0 0.0
Thailand 0.0 0.0
EM Asia 0.0 0.0
Czech Republic 0.0 0.0
Greece 0.0 0.0
Hungary 0.0 0.0
Poland 0.0 0.0
Russia 0.0 0.0
Turkey 0.0 0.0
EM Europe 0.0 0.0
Brazil 0.0 0.0
Cayman Islands 0.0 0.0
Chile 0.0 0.0
Colombia 0.0 0.0
Mexico 0.0 0.0
Peru 0.0 0.0
Virgin Islands 0.0 0.0
EM Latin America 0.0 0.0
Egypt 0.0 0.0
Qatar 0.0 0.0
South Africa 0.0 0.0
United Arab Emirates 0.0 0.0
EM Mid East+Africa 0.0 0.0
Emerging Markets 0.0 0.0
Frontier Markets 0.0 0.0
Cash 0.0 0.0
Other 0.0 0.0
Total 0.0 100.0
Country/Region Allocation As of December 31, 2015
5.7

Allocation
Dodge & Cox Stock (DODGX)
Russell 1000 Value Index
0.0 25.0 50.0 75.0 100.0
Other
Cash
Less than 200M
200M To 500M
500M To 1000M
1000M To 3000M
3000M To 5000M
5000M To 8000M
8000M To 12000M
12000M To 16000M
16000M To 25000M
Greater than 25000M
0.0
0.0
0.0
0.0
0.0
0.1
0.0
3.5
4.2
6.5
7.4
78.3
0.0
0.0
0.0
0.0
0.0
2.0
3.7
6.1
5.9
5.5
8.8
68.0
Performance
Dodge & Cox Stock (DODGX)
Russell 1000 Value Index
-150.0 -100.0 -50.0 0.0
Other
Cash
Less than 200M
200M To 500M
500M To 1000M
1000M To 3000M
3000M To 5000M
5000M To 8000M
8000M To 12000M
12000M To 16000M
16000M To 25000M
Greater than 25000M
0.0
0.0
0.0
0.0
0.0
-0.8
0.0
-39.4
-19.5
-9.6
-53.6
-121.4
0.0
0.0
0.0
0.0
-0.9
-15.7
-15.0
-19.3
-20.0
-17.6
-13.6
-73.6
Distribution of Assets & Performance
Dodge & Cox Stock (DODGX) vs. Russell 1000 Value Index
As of December 31, 2015
5.8

Return Summary
Cumulative Return Annualized Return
Portfolio 8.3 8.3
Benchmark 7.0 7.0
Active 1.3 1.3
Stock Specific 3.0 3.0
Factor Model -1.7 -1.7
Beta 0.5 0.5
The Fundamentals -2.0 -2.0
The Industries -0.2 -0.2
Risk Summary
Risk % of Active Var % of Factor Var
Portfolio 4.4
Benchmark 4.3
Active 0.5
Stock Specific 0.7 26.8
Factor Model 1.2 73.2
Beta 0.4 8.7
The Fundamentals 1.4 89.8
The Industries 0.2 1.5
Active Risk Contribution
Stock Specific
26.8%
Factor Model
73.2%
Factor Model Risk Contribution
Beta
8.7%
The Industries
1.5%
The Fundamentals
89.8%
Factor Performance Attribution
BGI Alpha Tilts vs. S&P 500
Periods: 10/01/2015 - 12/31/2015
Risk Model: Northfield US Equity Model
5.9

Style Exposures
Portfolio Benchmark ActiveRaw
Portfolio
Raw
Benchmark
Beta 1.1 1.0 0.1 1.1 1.0
Price/Earnings -0.2 -0.4 0.1 22.8 20.4
Price/Book 0.2 0.4 -0.1 2.2 2.6
Dividend Yield 0.0 0.2 -0.2 1.6 2.1
Trading Activity 0.2 -0.2 0.4 0.2 0.1
Relative Strength 0.2 0.1 0.1 1.1 1.1
Log Of Market Cap ($M) 0.5 2.3 -1.8 5,005 127,315
Earnings Variability -0.5 -0.4 -0.1 0.4 0.5
Eps Growth Rate 0.0 0.0 0.0 12.7 11.7
Price/Revenue 0.1 0.3 -0.2 1.2 1.6
Debt/Equity 0.1 0.2 -0.2 0.7 0.8
Price Volatility -0.5 -0.6 0.1 0.2 0.2
Style Contribution
Portfolio Benchmark ActiveFactor
Return
Beta 4.3 3.9 0.5 3.8
Price/Earnings 0.1 0.1 0.0 -0.3
Price/Book 0.5 0.9 -0.3 2.3
Dividend Yield 0.0 0.0 0.0 -0.1
Trading Activity 0.2 -0.1 0.2 0.5
Relative Strength 0.1 0.2 -0.1 0.9
Log Of Market Cap 0.4 2.0 -1.6 0.9
Earnings Variability -0.3 -0.2 -0.1 0.6
Eps Growth Rate 0.0 0.0 0.0 0.6
Price/Revenue 0.1 0.3 -0.2 0.9
Debt/Equity 0.0 -0.2 0.1 -0.8
Price Volatility 0.8 0.9 -0.1 -1.5
Style Exposures
Portfolio Benchmark Active
0.0 2.0 4.0-2.0-4.0
Price Volatility
Debt/Equity
Price/Revenue
Eps Growth Rate
Earnings Variability
Log Of Market Cap
Relative Strength
Trading Activity
Dividend Yield
Price/Book
Price/Earnings
Beta
Style Contribution
Portfolio Benchmark Active
0.0 2.0 4.0 6.0-2.0-4.0
Price Volatility
Debt/Equity
Price/Revenue
Eps Growth Rate
Earnings Variability
Log Of Market Cap
Relative Strength
Trading Activity
Dividend Yield
Price/Book
Price/Earnings
Beta
Factor Performance Attribution
BGI Alpha Tilts vs. S&P 500
Periods: 10/01/2015 - 12/31/2015
Risk Model: Northfield US Equity Model
5.10

Sector Weights
SectorPortfolio
Weight
Benchmark
Weight
Active
Weight
Materials 6.4 2.4 4.0
Industrials 8.8 7.8 1.0
Telecom 0.8 3.2 -2.4
Consumer Discretionary 16.4 12.0 4.4
Consumer Staples 6.0 11.9 -5.9
Energy 5.4 8.9 -3.5
Financials 27.0 17.5 9.5
Health Care 7.7 13.8 -6.2
Information Tech 15.8 19.2 -3.4
Utilities 5.7 3.3 2.4
Unclassified 0.0 0.0 0.0
Total 100.0 100.0 0.0
Sector Contribution
Sector Portfolio Benchmark ActiveFactor
Return
Materials 0.1 0.0 0.1 4.8
Industrials 0.1 0.2 -0.1 10.6
Telecom 0.0 0.0 0.0 1.2
Consumer Discretionary -0.5 -0.6 0.1 -36.8
Consumer Staples -0.1 0.1 -0.2 8.0
Energy -0.1 -0.3 0.1 -22.9
Financials 0.5 0.2 0.3 7.4
Health Care 0.3 0.7 -0.4 9.7
Information Tech 0.3 0.2 0.1 4.2
Utilities -0.1 0.1 -0.1 -0.9
Unclassified 0.0 0.0 0.0 0.0
Total 0.4 0.6 -0.2 -14.6
Sector Weights
Portfolio Benchmark Active
0.0 15.0 30.0 45.0-15.0
Unclassified
Utilities
Information Tech
Health Care
Financials
Energy
Consumer Staples
Consumer Discretionary
Telecom
Industrials
Materials
Sector Contribution
Portfolio Benchmark Active
0.0 0.5 1.0-0.5-1.0-1.5
Unclassified
Utilities
Information Tech
Health Care
Financials
Energy
Consumer Staples
Consumer Discretionary
Telecom
Industrials
Materials
Factor Performance Attribution
BGI Alpha Tilts vs. S&P 500
Periods: 10/01/2015 - 12/31/2015
Risk Model: Northfield US Equity Model
5.11

Return Contribution Over Time
Stock Specific Beta The Fundamentals The Industries
0.0
0.7
1.4
2.1
2.8
-0.7
-1.4
-2.1
-2.8
-3.5
10/15 11/15 12/15
1.1
0.7
-1.6
0.1
0.00.0
1.3
-0.3
1.8
-0.3
-1.7
0.0
Factor Performance Attribution
BGI Alpha Tilts vs. S&P 500
Periods: 10/01/2015 - 12/31/2015
Risk Model: Northfield US Equity Model
5.12

Return Summary
Cumulative Return Annualized Return
Portfolio 3.9 3.9
Benchmark 5.0 5.0
Active -1.1 -1.1
Stock Specific -1.1 -1.1
Factor Model 0.0 0.0
Market 0.3 0.3
Region 0.0 0.0
Sector -0.1 -0.1
Economic -0.1 -0.1
Style -0.1 -0.1
Statistical -0.5 -0.5
Currency 0.5 0.5
Risk Summary
Risk % of Active Var % of Factor Var
Portfolio 3.9
Benchmark 4.1
Active 0.5
Stock Specific 0.6 92.5
Factor Model 0.2 7.5
Market 0.1 9.0
Region 0.1 4.9
Sector 0.0 0.2
Economic 0.0 1.7
Style 0.0 0.3
Statistical 0.2 27.7
Currency 0.3 56.2
Active Risk Contribution
Factor Model
7.5%
Stock Specific
92.5%
Factor Model Risk Contribution
Market
9.0%
Region
4.9%
Sector
0.2%
Economic
1.7%
Style
0.3%
Statistical
27.7%
Currency
56.2%
Factor Performance Attribution
Vanguard Dev Mkt;Inst (VTMNX) vs. MSCI EAFE IMI
Periods: 10/01/2015 - 12/31/2015
Risk Model: Northfield Global Equity Model
5.13
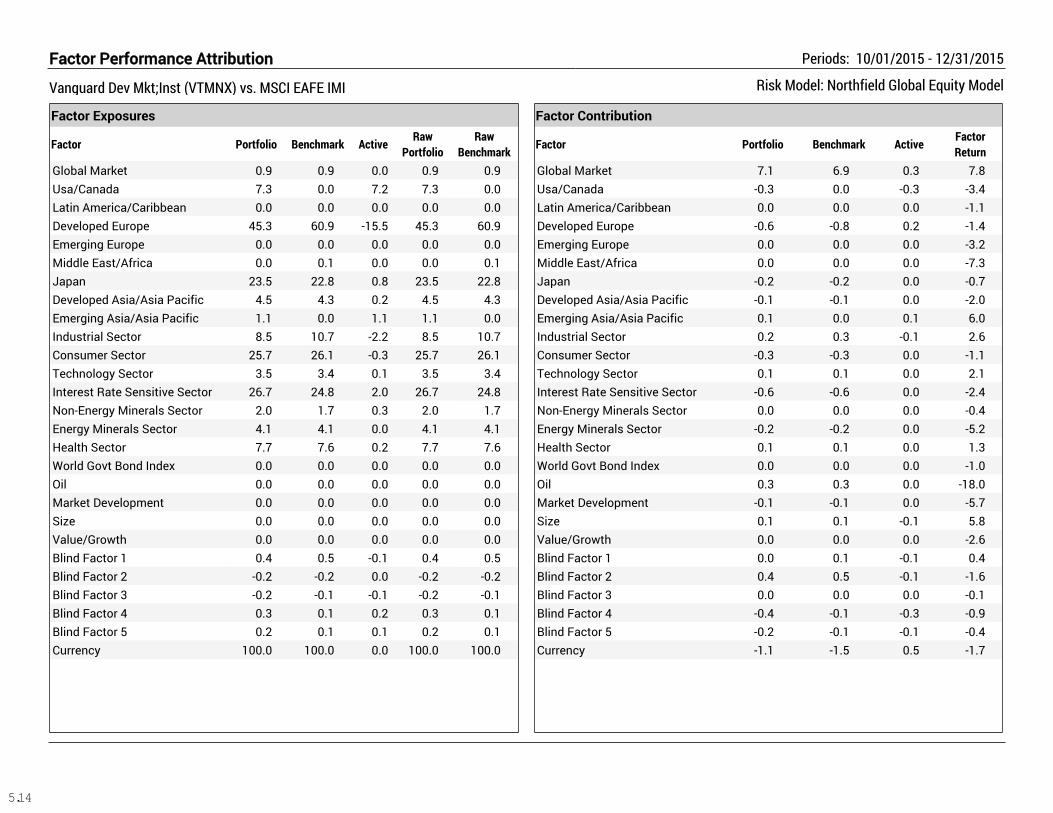
Factor Exposures
Factor Portfolio Benchmark ActiveRaw
Portfolio
Raw
Benchmark
Global Market 0.9 0.9 0.0 0.9 0.9
Usa/Canada 7.3 0.0 7.2 7.3 0.0
Latin America/Caribbean 0.0 0.0 0.0 0.0 0.0
Developed Europe 45.3 60.9 -15.5 45.3 60.9
Emerging Europe 0.0 0.0 0.0 0.0 0.0
Middle East/Africa 0.0 0.1 0.0 0.0 0.1
Japan 23.5 22.8 0.8 23.5 22.8
Developed Asia/Asia Pacific 4.5 4.3 0.2 4.5 4.3
Emerging Asia/Asia Pacific 1.1 0.0 1.1 1.1 0.0
Industrial Sector 8.5 10.7 -2.2 8.5 10.7
Consumer Sector 25.7 26.1 -0.3 25.7 26.1
Technology Sector 3.5 3.4 0.1 3.5 3.4
Interest Rate Sensitive Sector 26.7 24.8 2.0 26.7 24.8
Non-Energy Minerals Sector 2.0 1.7 0.3 2.0 1.7
Energy Minerals Sector 4.1 4.1 0.0 4.1 4.1
Health Sector 7.7 7.6 0.2 7.7 7.6
World Govt Bond Index 0.0 0.0 0.0 0.0 0.0
Oil 0.0 0.0 0.0 0.0 0.0
Market Development 0.0 0.0 0.0 0.0 0.0
Size 0.0 0.0 0.0 0.0 0.0
Value/Growth 0.0 0.0 0.0 0.0 0.0
Blind Factor 1 0.4 0.5 -0.1 0.4 0.5
Blind Factor 2 -0.2 -0.2 0.0 -0.2 -0.2
Blind Factor 3 -0.2 -0.1 -0.1 -0.2 -0.1
Blind Factor 4 0.3 0.1 0.2 0.3 0.1
Blind Factor 5 0.2 0.1 0.1 0.2 0.1
Currency 100.0 100.0 0.0 100.0 100.0
Factor Contribution
Factor Portfolio Benchmark ActiveFactor
Return
Global Market 7.1 6.9 0.3 7.8
Usa/Canada -0.3 0.0 -0.3 -3.4
Latin America/Caribbean 0.0 0.0 0.0 -1.1
Developed Europe -0.6 -0.8 0.2 -1.4
Emerging Europe 0.0 0.0 0.0 -3.2
Middle East/Africa 0.0 0.0 0.0 -7.3
Japan -0.2 -0.2 0.0 -0.7
Developed Asia/Asia Pacific -0.1 -0.1 0.0 -2.0
Emerging Asia/Asia Pacific 0.1 0.0 0.1 6.0
Industrial Sector 0.2 0.3 -0.1 2.6
Consumer Sector -0.3 -0.3 0.0 -1.1
Technology Sector 0.1 0.1 0.0 2.1
Interest Rate Sensitive Sector -0.6 -0.6 0.0 -2.4
Non-Energy Minerals Sector 0.0 0.0 0.0 -0.4
Energy Minerals Sector -0.2 -0.2 0.0 -5.2
Health Sector 0.1 0.1 0.0 1.3
World Govt Bond Index 0.0 0.0 0.0 -1.0
Oil 0.3 0.3 0.0 -18.0
Market Development -0.1 -0.1 0.0 -5.7
Size 0.1 0.1 -0.1 5.8
Value/Growth 0.0 0.0 0.0 -2.6
Blind Factor 1 0.0 0.1 -0.1 0.4
Blind Factor 2 0.4 0.5 -0.1 -1.6
Blind Factor 3 0.0 0.0 0.0 -0.1
Blind Factor 4 -0.4 -0.1 -0.3 -0.9
Blind Factor 5 -0.2 -0.1 -0.1 -0.4
Currency -1.1 -1.5 0.5 -1.7
Factor Performance Attribution
Vanguard Dev Mkt;Inst (VTMNX) vs. MSCI EAFE IMI
Periods: 10/01/2015 - 12/31/2015
Risk Model: Northfield Global Equity Model
5.14

Factor Contribution
Portfolio Benchmark Active
0.0
3.0
6.0
9.0
12.0
15.0
18.0
-3.0
-6.0
Glo
bal
Mark
et
Usa/Canada
Latin Am
erica /C
aribbean
Developed
Eu rope
Emerg
ing
Eu rope
Mid
d le East/
Af ric
a
Japan
Developed
Asia/A
sia Pacifi
c
Emerg
ing
Asia/A
sia Pacifi
c
Industr i
al
Sector
Consumer
Sector
Techno logy
Sector
Inte
rest
R
ate Sensiti
ve
Sector
Non -E
nergy
Min
erals
Sector
Energy
Min
erals
Sector
Health
Sector
World
Govt Bond
In
dexO
il
Mark
et D
evelopm
entSiz
e
Value/G
row
th
Blind Facto
r 1
Blind Facto
r 2
Blind Facto
r 3
Blind Facto
r 4
Blind Facto
r 5
Currency
Factor Performance Attribution
Vanguard Dev Mkt;Inst (VTMNX) vs. MSCI EAFE IMI
Periods: 10/01/2015 - 12/31/2015
Risk Model: Northfield Global Equity Model
5.15

Return Contribution Over Time
Stock Specific Market Region Sector Economic Style Statistical Currency
0.0
0.4
0.8
1.2
1.6
-0.4
-0.8
-1.2
-1.6
-2.0
10/15 11/15 12/15
-0.9
0.20.1
0.00.00.0
-0.1
0.1 0.50.1
-0.1-0.1-0.1
0.0
-0.4
0.5
-0.60.0
0.0
0.0
0.0
0.0
0.1
-0.2
Factor Performance Attribution
Vanguard Dev Mkt;Inst (VTMNX) vs. MSCI EAFE IMI
Periods: 10/01/2015 - 12/31/2015
Risk Model: Northfield Global Equity Model
5.16

Risk Analysis
Total
Portfolio Risk 15.1
Benchmark Risk 14.7
Tracking Error 5.3
RSquared 0.9
Portfolio Beta 1.1
Benchmark Beta 1.0
Portfolio Beta to Benchmark 1.0
Risk Decomposition
Variance
Contribution
% of
Active Var
% of
Factor Var
Factor Tracking Variance 24.0 84.8
Stock Specific Variance 4.3 15.2
Total Tracking Variance 28.4
Tracking Error 5.3
Beta 1.7 7.1
The Fundamentals 21.1 87.5
The Industries 1.3 5.3
Active Variance Contribution
Stock Specific
15.2%
Factor Model
84.8%
Factor Variance Contribution
Beta
7.1%
The Industries
5.3%
The Fundamentals
87.5%
Factor Risk Forecast
BGI Alpha Tilts vs. S&P 500
As of: 12/31/2015
Risk Model: Northfield US Equity Model
5.17

Style Exposures
Factor Portfolio Benchmark Active
Beta 1.1 1.0 0.1
Price/Earnings -0.2 -0.3 0.1
Price/Book 0.3 0.4 -0.1
Dividend Yield 0.0 0.2 -0.2
Trading Activity 0.2 -0.2 0.4
Relative Strength 0.2 0.3 -0.1
Log Of Market Cap 0.5 2.3 -1.8
Earnings Variability -0.5 -0.4 -0.1
Eps Growth Rate 0.1 0.0 0.1
Price/Revenue 0.1 0.3 -0.2
Debt/Equity 0.1 0.3 -0.2
Price Volatility -0.5 -0.6 0.1
Style Contribution to Active Var
Factor Variance Contribution
Beta 1.7
Price/Earnings -0.2
Price/Book -0.2
Dividend Yield 1.0
Trading Activity 1.4
Relative Strength -0.2
Log Of Market Cap 19.6
Earnings Variability 0.2
Eps Growth Rate -0.2
Price/Revenue -0.1
Debt/Equity 0.3
Price Volatility -0.4
Style Exposures
Portfolio Benchmark Active
0.0 2.0 4.0-2.0-4.0
Price Volatility
Debt/Equity
Price/Revenue
Eps Growth Rate
Earnings Variability
Log Of Market Cap
Relative Strength
Trading Activity
Dividend Yield
Price/Book
Price/Earnings
Beta
Style Contribution to Active Var
0.0 8.0 16.0 24.0 32.0-8.0
Price Volatility
Debt/Equity
Price/Revenue
Eps Growth Rate
Earnings Variability
Log Of Market Cap
Relative Strength
Trading Activity
Dividend Yield
Price/Book
Price/Earnings
Beta
Factor Risk Forecast
BGI Alpha Tilts vs. S&P 500
As of: 12/31/2015
Risk Model: Northfield US Equity Model
5.18

Sector Weights
SectorPortfolio
Weight
Benchmark
Weight
Active
Weight
Materials 6.0 2.3 3.7
Industrials 8.9 7.8 1.1
Telecom 0.8 3.2 -2.5
Consumer Discretionary 16.2 11.9 4.3
Consumer Staples 5.3 12.1 -6.9
Energy 4.9 8.4 -3.5
Financials 27.4 17.6 9.8
Health Care 8.1 14.3 -6.2
Information Tech 16.7 19.1 -2.4
Utilities 5.8 3.2 2.5
Total 100.0 100.0 0.0
Sector Contribution to Active Var
SectorVariance
Contribution
Materials 2.0
Industrials 2.6
Telecom 0.7
Consumer Discretionary 5.4
Consumer Staples 5.1
Energy 4.1
Financials 24.2
Health Care 43.4
Information Tech 8.7
Utilities 3.8
Total 100.0
Sector Weights
Portfolio Weight Benchmark Weight Active Weight
0.0 15.0 30.0 45.0-15.0
Utilities
Information Tech
Health Care
Financials
Energy
Consumer Staples
Consumer Discretionary
Telecom
Industrials
Materials
Sector Contribution to Active Var
0.0 15.0 30.0 45.0 60.0
Utilities
Information Tech
Health Care
Financials
Energy
Consumer Staples
Consumer Discretionary
Telecom
Industrials
Materials
Factor Risk Forecast
BGI Alpha Tilts vs. S&P 500
As of: 12/31/2015
Risk Model: Northfield US Equity Model
5.19

Risk Analysis
Total
Portfolio Risk 13.8
Benchmark Risk 11.2
Tracking Error 4.3
RSquared 0.9
Portfolio Beta 1.1
Benchmark Beta 0.9
Portfolio Beta to Benchmark 1.2
Risk Decomposition
Variance
Contribution
% of
Active Var
% of
Factor Var
Factor Tracking Variance 11.1 59.4
Stock Specific Variance 7.6 40.6
Total Tracking Variance 18.7
Tracking Error 4.3
Market 5.1 46.0
Region 0.7 6.4
Sector 1.1 9.6
Economic 0.6 5.3
Style 0.2 1.9
Statistical 3.1 27.8
Currency 0.3 2.9
Active Variance Contribution
Stock Specific
40.6%
Factor Model
59.4%
Factor Variance Contribution
Market
46.0%
Currency
2.9%
Statistical
27.8%
Style
1.9%
Economic
5.3%
Sector
9.6% Region
6.4%
Factor Risk Forecast Global
Dodge & Cox Global Stock (DODWX) vs. MSCI World Index
As of: 12/31/2015
Risk Model: Northfield Global Equity Model
5.20

Factor Exposures
Factor Portfolio Benchmark Active
Global Market 1.1 0.9 0.2
Usa/Canada 0.5 0.4 0.1
Latin America/Caribbean 0.0 0.0 0.0
Developed Europe 0.2 0.2 -0.1
Emerging Europe 0.0 0.0 0.0
Middle East/Africa 0.0 0.0 0.0
Japan 0.0 0.1 -0.1
Developed Asia/Asia Pacific 0.0 0.0 0.0
Emerging Asia/Asia Pacific 0.0 0.0 0.0
Industrial Sector 0.1 0.1 0.0
Consumer Sector 0.2 0.3 -0.1
Technology Sector 0.1 0.1 0.0
Interest Rate Sensitive Sector 0.3 0.2 0.0
Non-Energy Minerals Sector 0.0 0.0 0.0
Energy Minerals Sector 0.1 0.1 0.1
Health Sector 0.1 0.1 0.0
World Govt Bond Index 0.0 0.0 -0.1
Oil 0.0 0.0 0.0
Market Development 0.0 0.0 0.0
Size 0.0 0.0 0.0
Value/Growth 0.1 0.0 0.1
Blind Factor 1 0.1 0.5 -0.4
Blind Factor 2 -0.5 -0.6 0.1
Blind Factor 3 0.4 -0.1 0.5
Blind Factor 4 0.2 -0.1 0.2
Blind Factor 5 0.8 0.4 0.5
Currency 1.0 1.0 0.0
Factor Exposures
Portfolio Benchmark Active
0.0 0.6 1.2 1.8-0.6-1.2
Currency
Blind Factor 5
Blind Factor 4
Blind Factor 3
Blind Factor 2
Blind Factor 1
Value/Growth
Size
Market Development
Oil
World Govt Bond Index
Health Sector
Energy Minerals Sector
Non-Energy Minerals Sector
Interest Rate Sensitive Sector
Technology Sector
Consumer Sector
Industrial Sector
Emerging Asia/Asia Pacific
Developed Asia/Asia Pacific
Japan
Middle East/Africa
Emerging Europe
Developed Europe
Latin America/Caribbean
Usa/Canada
Global Market
Factor Risk Forecast Global
Dodge & Cox Global Stock (DODWX) vs. MSCI World Index
As of: 12/31/2015
Risk Model: Northfield Global Equity Model
5.21

Factor Contribution to Active Var
Factor Variance Contribution
Global Market 5.1
Usa/Canada 0.2
Latin America/Caribbean 0.1
Developed Europe 0.0
Emerging Europe 0.0
Middle East/Africa 0.0
Japan 0.3
Developed Asia/Asia Pacific 0.0
Emerging Asia/Asia Pacific 0.0
Industrial Sector 0.0
Consumer Sector 0.3
Technology Sector 0.0
Interest Rate Sensitive Sector 0.0
Non-Energy Minerals Sector 0.0
Energy Minerals Sector 0.5
Health Sector 0.3
World Govt Bond Index 0.0
Oil 0.5
Market Development 0.0
Size 0.0
Value/Growth 0.2
Blind Factor 1 0.8
Blind Factor 2 0.1
Blind Factor 3 1.1
Blind Factor 4 0.2
Blind Factor 5 0.9
Currency 0.3
Factor Contribution to Active Var
0.0 2.0 4.0 6.0 8.0-2.0
Currency
Blind Factor 5
Blind Factor 4
Blind Factor 3
Blind Factor 2
Blind Factor 1
Value/Growth
Size
Market Development
Oil
World Govt Bond Index
Health Sector
Energy Minerals Sector
Non-Energy Minerals Sector
Interest Rate Sensitive Sector
Technology Sector
Consumer Sector
Industrial Sector
Emerging Asia/Asia Pacific
Developed Asia/Asia Pacific
Japan
Middle East/Africa
Emerging Europe
Developed Europe
Latin America/Caribbean
Usa/Canada
Global Market
Factor Risk Forecast Global
Dodge & Cox Global Stock (DODWX) vs. MSCI World Index
As of: 12/31/2015
Risk Model: Northfield Global Equity Model
5.22

Sector Allocation History
Energy Materials Industrials Consumer Discretionary Consumer Staples
Health Care Financials Information Technology Telecommunication Services
0.0
25.0
50.0
75.0
100.0
All
oc
ati
on
(%)
1/15 2/15 3/15 4/15 5/15 6/15 7/15 8/15 9/15 10/15 11/15 12/15
Style Allocation History
Large Value Large Neutral Large Growth Mid Value Mid Neutral Mid Growth Small Value Unclassified
0.0
25.0
50.0
75.0
100.0
All
oc
ati
on
(%)
1/15 2/15 3/15 4/15 5/15 6/15 7/15 8/15 9/15 10/15 11/15 12/15
Historical Portfolio Allocation (Holdings)
Dodge & Cox Stock (DODGX)
1 Year Ending December 31, 2015
5.23

BGI Alpha Tilts S&P 500 Value S&P 500 Growth
Count Percentage Count Percentage Count Percentage
BGI Alpha Tilts
S&P 500 Value 172 35.8
S&P 500 Growth 172 33.5
BGI Alpha Tilts S&P 500 Value S&P 500 Growth
3M Co - 0.4 0.6
Abbott Laboratories - 0.4 0.3
AbbVie Inc - 0.5 0.6
ADT Corp (The) - 0.0 0.0
Affiliated Managers Group Inc. - 0.0 0.1
Agilent Technologies Inc - 0.1 0.1
Air Products and Chemicals Inc. - 0.2 0.1
Airgas Inc. - 0.0 0.1
Ameriprise Financial Inc - 0.1 0.1
Amgen Inc - 0.4 0.9
Anadarko Petroleum Corp - 0.2 0.1
Aon PLC - 0.1 0.2
Apache Corp - 0.1 0.1
Apartment Investment and Management Co - 0.0 0.0
Assurant Inc. - 0.0 0.0
Autodesk Inc. - 0.1 0.1
Automatic Data Processing Inc. - 0.2 0.3
Ball Corp - 0.1 0.1
Baxalta Inc - 0.1 0.1
Blackrock Inc - 0.2 0.3
Block (H&R) Inc - 0.0 0.1
Boston Properties Inc - 0.1 0.1
Bristol-Myers Squibb Co - 0.5 0.8
C.H. Robinson Worldwide Inc. - 0.1 0.0
Cabot Oil & Gas Corp - 0.0 0.0
CarMax Inc - 0.1 0.1
Holdings Correlation As of December 31, 2015
5.24

Holdings Correlation As of December 31, 2015
BGI Alpha Tilts S&P 500 Value S&P 500 Growth
CBS Corp - 0.1 0.1
Chubb Corp - 0.1 0.2
Cimarex Energy Co. - 0.0 0.1
Cincinnati Financial Corp - 0.0 0.1
Cisco Systems Inc - 0.9 0.6
CME Group Inc - 0.2 0.2
Coca-Cola Co (The) - 0.9 1.0
Coca-Cola European Partners Plc - 0.0 0.1
Colgate-Palmolive Co - 0.3 0.4
Comcast Corp - 0.6 0.9
ConAgra Foods Inc. - 0.1 0.1
Costco Wholesale Corp - 0.5 0.3
CSRA Inc - 0.0 0.0
CVS Health Corp - 0.7 0.5
Danaher Corp - 0.2 0.4
DaVita Inc - 0.0 0.1
DENTSPLY SIRONA Inc - 0.0 0.1
Devon Energy Corp - 0.1 0.1
Dollar General Corp - 0.1 0.1
Dominion Resources Inc. - 0.3 0.2
Dun & Bradstreet Corp (The) - 0.0 0.0
E. I. du Pont de Nemours and Co - 0.4 0.3
Eli Lilly and Co - 0.4 0.6
Endo International plc - 0.1 0.0
EOG Resources Inc. - 0.2 0.2
Expeditors International of Washington Inc. - 0.0 0.1
F5 Networks Inc - 0.0 0.0
Fastenal Co - 0.1 0.1
Fidelity National Information Services Inc - 0.1 0.1
FLIR Systems Inc - 0.0 0.0
General Dynamics Corp - 0.3 0.2
General Electric Co - 1.5 1.8
5.25

Holdings Correlation As of December 31, 2015
BGI Alpha Tilts S&P 500 Value S&P 500 Growth
General Growth Properties Inc - 0.1 0.1
General Mills Inc. - 0.1 0.2
Goodyear Tire & Rubber Co - 0.1 0.0
Grainger (W W) Inc. - 0.1 0.1
Harman International Industries Inc. - 0.0 0.0
Harris Corp - 0.1 0.1
HCA Holdings Inc - 0.1 0.1
Henry Schein Inc - 0.0 0.1
Hershey Co (The) - 0.1 0.1
Hewlett Packard Enterprise Co - 0.1 0.2
Honeywell International Inc - 0.4 0.5
Host Hotels & Resorts Inc - 0.1 0.1
Humana Inc. - 0.2 0.1
Huntington Bancshares Inc - 0.1 0.0
Illinois Tool Works Inc. - 0.2 0.2
Intel Corp - 1.1 0.7
International Business Machines Corp - 0.9 0.5
Interpublic Group of Companies Inc. (The) - 0.0 0.1
Intuitive Surgical Inc - 0.1 0.1
Iron Mountain Inc - 0.0 0.0
J.B. Hunt Transport Services Inc. - 0.0 0.0
J.M. Smucker Co (The) - 0.1 0.1
Johnson & Johnson - 1.7 1.5
Kellogg Co - 0.1 0.1
Kimberly-Clark Corp - 0.2 0.3
KLA-Tencor Corp - 0.1 0.1
Kroger Co. (The) - 0.3 0.2
Leggett & Platt Inc - 0.0 0.0
Level 3 Communications Inc - 0.1 0.1
Linear Technology Corp - 0.0 0.1
Lockheed Martin Corp - 0.3 0.4
LyondellBasell Industries NV - 0.2 0.2
5.26

Holdings Correlation As of December 31, 2015
BGI Alpha Tilts S&P 500 Value S&P 500 Growth
Macerich Co (The) - 0.1 0.1
Marriott International Inc. - 0.1 0.1
Marsh & McLennan Companies Inc. - 0.2 0.2
McCormick & Co Inc - 0.0 0.1
McDonald's Corp - 0.4 0.8
Mead Johnson Nutrition Co - 0.1 0.1
Medtronic PLC - 0.5 0.7
Michael Kors Holdings Ltd - 0.0 0.1
Micron Technology Inc. - 0.1 0.1
Molson Coors Brewing Co - 0.1 0.1
Monsanto Co - 0.2 0.2
Morgan Stanley - 0.3 0.2
Motorola Solutions Inc - 0.1 0.1
Mylan NV - 0.1 0.1
Nasdaq Inc - 0.0 0.0
Newfield Exploration Co - 0.0 0.0
Nielsen Holdings NV - 0.1 0.1
Northern Trust Corp - 0.1 0.1
Occidental Petroleum Corp - 0.3 0.2
Omnicom Group Inc. - 0.1 0.1
Oracle Corp - 0.7 0.6
Patterson Companies Inc - 0.0 0.0
Pentair plc - 0.0 0.1
PepsiCo Inc - 0.7 0.9
Perrigo Co Plc - 0.1 0.1
Pfizer Inc - 1.1 1.1
Philip Morris International Inc - 0.7 0.8
PPG Industries Inc. - 0.1 0.2
Praxair Inc. - 0.2 0.2
Precision Castparts Corp. - 0.1 0.2
Progressive Corp (The) - 0.1 0.1
Raytheon Co. - 0.2 0.2
5.27

Holdings Correlation As of December 31, 2015
BGI Alpha Tilts S&P 500 Value S&P 500 Growth
Realty Income Corp. - 0.0 0.1
Republic Services Inc. - 0.1 0.1
Robert Half International Inc. - 0.0 0.0
Rockwell Automation Inc. - 0.1 0.1
Royal Caribbean Cruises Ltd - 0.1 0.1
SanDisk Corp - 0.1 0.1
Scripps Networks Interactive Inc - 0.0 0.0
Sealed Air Corp - 0.0 0.1
Simon Property Group Inc. - 0.3 0.4
SL Green Realty Corp. - 0.1 0.1
Southern Gas Co - 0.0 0.0
St. Jude Medical Inc. - 0.1 0.1
Starwood Hotels & Resorts Worldwide Inc. - 0.1 0.1
Stryker Corp - 0.1 0.2
Synchrony Financial - 0.2 0.1
T. Rowe Price Group Inc - 0.1 0.1
TE Connectivity Ltd - 0.2 0.1
TECO Energy Inc. - 0.0 0.0
TEGNA Inc - 0.0 0.0
Teradata Corp - 0.0 0.0
Tesoro Corp - 0.1 0.1
Texas Instruments Inc - 0.2 0.4
Thermo Fisher Scientific Inc - 0.2 0.4
Torchmark Corp - 0.0 0.0
Twenty-First Century Fox Inc - 0.1 0.1
Twenty-First Century Fox Inc - 0.2 0.2
Tyco International Plc - 0.1 0.1
Union Pacific Corp - 0.5 0.3
United Parcel Service Inc - 0.4 0.4
United Rentals Inc. - 0.0 0.0
Unitedhealth Group Inc - 0.6 0.7
Universal Health Services Inc. - 0.0 0.1
5.28

Holdings Correlation As of December 31, 2015
BGI Alpha Tilts S&P 500 Value S&P 500 Growth
V.F. Corp - 0.1 0.1
Varian Medical Systems Inc - 0.0 0.0
Ventas Inc. - 0.1 0.1
Verizon Communications Inc - 1.3 0.8
Vertex Pharmaceuticals Inc - 0.2 0.2
Vornado Realty Trust - 0.1 0.1
Walgreens Boots Alliance Inc - 0.4 0.5
Waste Management Inc. - 0.1 0.1
Welltower Inc - 0.1 0.2
Western Union Co - 0.0 0.1
Weyerhaeuser Co - 0.1 0.1
Williams Cos Inc. (The) - 0.1 0.1
Wynn Resorts Ltd - 0.0 0.0
Xilinx Inc. - 0.1 0.1
Xylem Inc - 0.0 0.0
YUM! Brands Inc. - 0.2 0.2
Zimmer Biomet Holdings Inc - 0.1 0.1
Zoetis Inc - 0.1 0.2
5.29

Portfolio Characteristics
Portfolio Benchmark
Wtd. Avg. Mkt. Cap $000 90,104,214 98,313,567
Median Mkt. Cap $000 31,892,932 10,833,618
Price/Earnings ratio 16.3 18.1
Price/Book ratio 2.5 2.7
5 Yr. EPS Growth Rate (%) 4.6 7.6
Current Yield (%) 1.9 2.6
Beta (5 Years, Monthly) 1.1 1.0
Number of Stocks 86 1,653
Sector Weights (%)
Dodge & Cox Global Stock (DODWX)
MSCI World Index
0.0 5.0 10.0 15.0 20.0 25.0 30.0
Utilities
Telecommunication Services
Materials
Information Technology
Industrials
Health Care
Financials
Energy
Consumer Staples
Consumer Discretionary
0.0
2.7
3.1
20.9
3.8
15.2
24.1
6.6
1.9
21.8
3.2
3.4
4.4
14.3
10.7
13.5
20.8
6.1
10.4
13.3
Distribution of Market Capitalization (%)
Dodge & Cox Global Stock (DODWX)
MSCI World Index
0.0
15.0
30.0
45.0
60.0
>100 Bil 75 Bil -
100 Bil
25 Bil -
75 Bil
15 Bil -
25 Bil
2 Bil -
15 Bil
0 -
2 Bil
30.3
8.2
30.1
11.5
19.8
0.0
27.2
2.7
45.3
7.8
16.3
0.6
Top Ten Equity Holdings
Portfolio
Weight
(%)
Benchmark
Weight
(%)
Active
Weight
(%)
Quarterly
Return
(%)
Alphabet Inc 3.4 0.7 2.7 24.7
Time Warner Cable Inc 3.2 0.2 3.0 3.9
Bank of America Corp 2.7 0.5 2.2 8.3
Naspers Ltd 2.6 0.0 2.6 9.3
Roche Holding AG 2.5 0.6 1.9 5.0
Sanofi 2.4 0.3 2.1 -9.9
Time Warner Inc 2.3 0.2 2.1 -5.5
Schwab (Charles) Corp 2.2 0.1 2.1 15.5
Standard Chartered PLC 2.2 0.1 2.1 -14.7
Microsoft Corp 2.1 1.3 0.8 26.2
% of Portfolio 25.6 4.0
Portfolio Characteristics
Dodge & Cox Global Stock (DODWX) vs. MSCI World Index
As of December 31, 2015
5.30

Ten Best Performers
Portfolio
Weight
(%)
Benchma
rk
Weight
(%)
Active
Weight
(%)
Quarterly
Return
(%)
New Oriental Education & Technology Group Inc 0.5 0.0 0.5 55.2
Baidu Inc 1.5 0.0 1.5 37.6
Microsoft Corp 2.1 1.3 0.8 26.2
Liberty Global Plc LiLAC Group 0.0 0.0 0.0 25.6
Alphabet Inc 3.4 0.7 2.7 24.7
Television Broadcasts Ltd 0.2 0.0 0.2 23.8
JD.com Inc 1.0 0.0 1.0 23.8
Samsung Electronics Co Ltd 1.5 0.0 1.5 22.2
Alphabet Inc 0.3 0.7 -0.4 21.9
Bayerische Motoren Werke AG 1.2 0.1 1.1 19.9
% of Portfolio 11.7 2.8
Region
Dodge & Cox Global Stock (DODWX)
MSCI World Index
0.0 15.0 30.0 45.0 60.0 75.0
Middle East
United Kingdom
Europe ex UK
Japan
Pacific ex Japan
EM Mid East+Africa
North America
EM Latin America
EM Europe
EM Asia
0.0
5.1
16.7
3.5
1.4
3.5
56.0
3.4
1.0
9.3
0.3
7.5
17.3
9.0
4.3
0.0
61.7
0.0
0.0
0.0
Ten Worst Performers
Portfolio
Weight
(%)
Benchmark
Weight
(%)
Active
Weight
(%)
Quarterly
Return
(%)
MTN Group Ltd 0.9 0.0 0.9 -33.4
Teck Resources Ltd 0.6 0.0 0.6 -18.3
Standard Chartered PLC 2.2 0.1 2.1 -14.7
America Movil SA De CV, Mexico 0.2 0.0 0.2 -12.7
Barclays PLC 1.9 0.2 1.7 -12.4
Baker Hughes Inc 1.2 0.1 1.1 -11.0
Linde AG 0.9 0.1 0.8 -10.1
National Oilwell Varco Inc 0.6 0.0 0.6 -9.9
Sanofi 2.4 0.3 2.1 -9.9
NetApp Inc 0.4 0.0 0.4 -9.9
% of Portfolio 11.3 0.8
Portfolio Characteristics
Dodge & Cox Global Stock (DODWX) vs. MSCI World Index
As of December 31, 2015
5.31

Top Ten Contributors
Portfolio
Weight
(%)
Benchmark
Weight
(%)
Active
Weight
(%)
Quarterly
Return
(%)
Contribution
to
Return
(%)
Alphabet Inc 2.8 0.6 2.2 24.7 0.7
Baidu Inc 1.6 0.0 1.6 37.6 0.6
Microsoft Corp 2.1 1.1 1.0 26.2 0.6
Schwab (Charles) Corp 1.9 0.1 1.8 15.5 0.3
Samsung Electronics Co Ltd 1.3 0.0 1.3 22.2 0.3
New Oriental Education & Technology Group Inc 0.4 0.0 0.4 55.2 0.2
Naspers Ltd 2.4 0.0 2.4 9.3 0.2
Bank of America Corp 2.6 0.5 2.1 8.3 0.2
Honda Motor Co Ltd 1.7 0.2 1.5 10.6 0.2
Express Scripts Holding Co 2.3 0.2 2.1 8.0 0.2
% of Portfolio 19.1 2.7Top Ten Detractors
Portfolio
Weight
(%)
Benchmark
Weight
(%)
Active
Weight
(%)
Quarterly
Return
(%)
Contribution
to
Return
(%)
MTN Group Ltd 1.0 0.0 1.0 -33.4 -0.3
Sanofi 2.6 0.4 2.2 -9.9 -0.3
Standard Chartered PLC 1.5 0.1 1.4 -14.7 -0.2
Barclays PLC 1.8 0.2 1.6 -12.4 -0.2
Baker Hughes Inc 1.4 0.1 1.3 -11.0 -0.2
Time Warner Inc 2.2 0.2 2.0 -5.5 -0.1
Credit Suisse Group 1.6 0.1 1.5 -7.0 -0.1
Linde AG 0.9 0.1 0.8 -10.1 -0.1
HP Inc 3.1 0.2 2.9 -2.7 -0.1
Teck Resources Ltd 0.5 0.0 0.5 -18.3 -0.1
Portfolio Characteristics
Dodge & Cox Global Stock (DODWX) vs. MSCI World Index
As of December 31, 2015
5.32

Cumulative Performance Attribution By Sector
Stock Selection Return Sector Selection Return Interaction Return Active Contribution Return
Cum. Stock Selection Return Cum. Sector Selection Return Cum. Interaction Return Cum. Active Contribution Return
0.0
0.5
1.0
1.5
2.0
2.5
-0.5
-1.0
-1.5
-2.0
-2.5
-3.0
-3.5
Ret
urn
(%)
2/15 3/15 4/15 5/15 6/15 7/15 8/15 9/15 10/15 11/15 12/15
Performance Attribution by Sector
Vanguard PRIMECAP;Adm (VPMAX) vs. S&P 500
1 Year Ending December 31, 2015
5.33

Sector Active Exposure
1 Year 2 Years 3 Years
0.0
15.0
30.0
45.0
-15.0
-30.0
-45.0
-60.0
Ac
tiv
e E
xp
os
ure
(%)
Te
lec
om
mu
nic
ati
on
Se
rvic
es
Ma
teri
als
Info
rma
tio
n T
ec
hn
olo
gy
Ind
us
tria
ls
He
alt
h C
are
Fin
an
cia
ls
En
erg
y
Co
ns
um
er
S
tap
les
Co
ns
um
er
D
isc
reti
on
ary
-4.2-5.2
12.9
-14.4
-3.0
-32.1
-18.4
-12.2
7.6
-5.7-6.8
17.6
-18.5
-3.1
-39.5
-21.7
-15.6
11.8
-1.6 -2.0
13.1
-4.3
5.2
-5.0-4.0 -4.6
9.4
Portfolio Active Exposure
Dodge & Cox Stock (DODGX) vs. Russell 1000 Value Index
As of December 31, 2015
5.34

T. Rowe Price Large Cap Growth T. Rowe Price Large Cap Value Eaton Vance AC SMID-Cap Fund
Composition
# of Holdings 83 60 41
% Top 15 Holdings 39.52 48.63 51.65
% Top 25 Holdings 54.65 65.25 76.63
Characteristics
Wtd. Avg. Mkt. Cap 101,507,333 118,287,875 1,531,425
Median Mkt. Cap 29,168,230 25,107,537 924,123
Price/Earnings ratio 29.86 18.40 20.86
Price/Book ratio 5.69 3.22 1.78
5 Yr. EPS Growth Rate 9.31 7.21 11.83
Current Yield 0.89 1.79 0.95
Beta 1.10 1.06 1.12
Number of Stocks 83 60 41
Debt to Equity 3.90 1.11 0.76
GICS Sectors (%)
Energy 1.20 5.85 0.00
Materials 2.40 1.74 10.25
Industrials 8.73 10.82 10.23
Consumer Discretionary 23.42 13.07 14.08
Consumer Staples 5.01 10.14 12.87
Health Care 19.78 16.12 3.31
Financials 3.18 17.59 26.03
Information Technology 36.27 24.67 20.67
Utilities 0.00 0.00 2.57
Market Capitalization (%)
Large ($15.0B-Above) 80.77 76.49 0.00
Mid/Large ($7.0-15.0B) 15.20 12.15 0.00
Mid ($1.0-7.0B) 4.03 11.36 47.78
Small/Mid ($0.5-1.0B) 0.00 0.00 28.80
Small ($0.0-0.5B) 0.00 0.00 23.42
Portfolio Comparison As of December 31, 2015
5.35

Portfolio Comparison As of December 31, 2015
T. Rowe Price Large Cap Growth T. Rowe Price Large Cap Value Eaton Vance AC SMID-Cap Fund
Industry (%)
Oil & Gas Equipment & Services 0.00 1.85 0.00
Integrated Oil & Gas 0.00 1.62 0.00
Oil & Gas Exploration & Production 1.20 2.37 0.00
Fertilizers & Agricultural Chemicals 0.00 0.57 0.00
Industrial Gases 1.11 0.00 0.00
Specialty Chemicals 1.29 0.00 0.00
Diversified Metals & Mining 0.00 0.00 2.37
Forest Products 0.00 0.00 3.48
Paper Products 0.00 1.17 4.39
Aerospace & Defense 0.81 4.43 1.69
Electrical Components & Equipment 0.00 1.18 2.86
Industrial Conglomerates 0.77 0.00 0.00
Industrial Machinery 0.00 1.06 1.74
Diversified Support Services 0.00 0.61 0.00
Security & Alarm Services 0.00 1.23 0.00
Human Resource & Employment Services 0.00 0.00 1.51
Air Freight & Logistics 1.40 0.00 0.00
Airlines 1.53 1.33 0.00
Railroads 4.21 0.97 0.00
Trucking 0.00 0.00 2.43
Auto Parts & Equipment 0.97 1.10 3.57
Home Furnishings 0.00 0.00 3.11
Homebuilding 0.00 0.00 5.31
Apparel, Accessories & Luxury Goods 1.38 0.00 0.00
Footwear 1.23 0.61 0.00
Hotels, Resorts & Cruise Lines 1.07 2.13 0.00
Restaurants 2.26 0.00 0.00
Education Services 0.00 1.18 0.00
Cable & Satellite 0.49 0.71 0.00
Movies & Entertainment 1.21 3.19 0.00
Distributors 1.35 0.00 0.00
Internet & Direct Marketing Retail 3.56 0.00 0.00
Department Stores 0.00 0.83 0.00
General Merchandise Stores 4.49 0.00 2.09
5.36

Portfolio Comparison As of December 31, 2015
T. Rowe Price Large Cap Growth T. Rowe Price Large Cap Value Eaton Vance AC SMID-Cap Fund
Apparel Retail 0.99 0.00 0.00
Home Improvement Retail 1.19 0.00 0.00
Specialty Stores 1.72 0.00 0.00
Automotive Retail 1.52 3.32 0.00
Drug Retail 1.00 1.69 0.00
Food Retail 0.79 0.00 0.00
Hypermarkets & Super Centers 0.98 0.00 0.00
Brewers 0.00 1.25 0.00
Soft Drinks 0.97 0.00 0.00
Packaged Foods & Meats 0.00 3.56 9.16
Household Products 0.42 3.65 0.00
Personal Products 0.86 0.00 3.71
Health Care Equipment 2.00 0.00 3.31
Health Care Distributors 2.08 0.00 0.00
Managed Health Care 0.00 1.41 0.00
Health Care Technology 0.51 0.00 0.00
Biotechnology 11.99 1.49 0.00
Pharmaceuticals 2.11 13.22 0.00
Life Sciences Tools & Services 1.10 0.00 0.00
Diversified Banks 0.00 6.59 0.00
Regional Banks 0.00 0.00 16.14
Thrifts & Mortgage Finance 0.00 0.00 1.60
Other Diversified Financial Services 0.00 0.72 0.00
Specialized Finance 0.00 2.89 0.00
Consumer Finance 0.81 1.41 0.00
Investment Banking & Brokerage 1.51 0.00 0.00
Insurance Brokers 0.00 1.81 0.00
Multi-line Insurance 0.00 1.66 0.00
Hotel & Resort REITs 0.00 0.72 0.00
Office REITs 0.00 0.00 2.91
Retail REITs 0.00 0.00 2.79
Specialized REITs 0.86 1.79 0.00
Real Estate Development 0.00 0.00 2.58
Internet Software & Services 8.75 6.89 0.00
IT Consulting & Other Services 2.32 0.00 0.00
5.37

Portfolio Comparison As of December 31, 2015
T. Rowe Price Large Cap Growth T. Rowe Price Large Cap Value Eaton Vance AC SMID-Cap Fund
Data Processing & Outsourced Services 6.97 3.39 0.91
Application Software 3.08 0.00 0.00
Systems Software 5.76 1.37 0.00
Communications Equipment 0.43 3.44 3.61
Technology Hardware, Storage & Peripherals 2.84 5.83 0.00
Electronic Equipment & Instruments 0.00 0.00 7.74
Electronic Manufacturing Services 0.00 0.00 0.53
Semiconductor Equipment 0.00 2.46 2.48
Semiconductors 6.13 1.29 5.40
Gas Utilities 0.00 0.00 2.57
5.38

Security NameShares
Jan-2015
Shares
Dec-2015Difference Position Status
Apache Corp N/A 13,606 13,606 New
Bank of America Corp N/A 82,750 82,750 New
Broadcom Ltd N/A 7,366 7,366 New
Chevron Corp N/A 12,005 12,005 New
Chipotle Mexican Grill Inc N/A 737 737 New
Cigna Corp N/A 5,770 5,770 New
Citigroup Inc N/A 24,302 24,302 New
Cognizant Technology Solutions Corp N/A 23,770 23,770 New
Delta Air Lines Inc N/A 21,565 21,565 New
Extended Stay America Inc N/A 28,255 28,255 New
Exxon Mobil Corp N/A 13,331 13,331 New
Gilead Sciences Inc N/A 9,965 9,965 New
Glaxosmithkline PLC N/A 26,467 26,467 New
JPMorgan Chase & Co N/A 29,590 29,590 New
Lennar Corp N/A 23,190 23,190 New
Morgan Stanley N/A 36,465 36,465 New
Oracle Corp N/A 31,595 31,595 New
Oshkosh Corp N/A 19,250 19,250 New
Perrigo Co Plc N/A 7,068 7,068 New
QUALCOMM Inc. N/A 16,423 16,423 New
Republic Services Inc. N/A 30,664 30,664 New
Ross Stores Inc N/A 27,275 27,275 New
Synchrony Financial N/A 33,313 33,313 New
Thermo Fisher Scientific Inc N/A 8,545 8,545 New
Walt Disney Co (The) N/A 13,850 13,850 New
Alphabet Inc 2,950 3,198 248 Increased
Anadarko Petroleum Corp 7,350 9,341 1,991 Increased
Apple Inc 16,355 17,330 975 Increased
Big Lots Inc 14,000 18,900 4,900 Increased
Portfolio Position Change
TD Bank
1 Year Ending December 31, 2015
5.39

Portfolio Position Change
TD Bank
1 Year Ending December 31, 2015
Security NameShares
Jan-2015
Shares
Dec-2015Difference Position Status
Masco Corp 34,950 36,894 1,944 Increased
Metlife Inc. 19,550 24,010 4,460 Increased
AOL Inc 27,800 N/A -27,800 Closed
AbbVie Inc 24,700 N/A -24,700 Closed
American Express Co 17,050 N/A -17,050 Closed
Aramark 19,850 N/A -19,850 Closed
Arrow Electronics Inc 14,400 N/A -14,400 Closed
Celgene Corp 6,250 N/A -6,250 Closed
Comcast Corp 9,950 N/A -9,950 Closed
Consolidated Edison Inc. 14,500 N/A -14,500 Closed
Covanta Holding Corp 64,750 N/A -64,750 Closed
D.R. Horton Inc. 45,850 N/A -45,850 Closed
EMC Corp 44,950 N/A -44,950 Closed
General Electric Co 50,200 N/A -50,200 Closed
International Paper Co 19,700 N/A -19,700 Closed
Interpublic Group of Companies Inc. (The) 41,150 N/A -41,150 Closed
Kohl's Corp 13,700 N/A -13,700 Closed
Lincoln National Corp 20,800 N/A -20,800 Closed
Macy's Inc 26,550 N/A -26,550 Closed
Merck & Co Inc. 13,450 N/A -13,450 Closed
NCI Building Systems Inc. 31,400 N/A -31,400 Closed
NorthStar Asset Management Group Inc 58,900 N/A -58,900 Closed
Pfizer Inc 47,468 N/A -47,468 Closed
Pinnacle West Capital Corp 9,100 N/A -9,100 Closed
Primoris Services Corp 8,850 N/A -8,850 Closed
Prudential Financial Inc 13,250 N/A -13,250 Closed
Quanta Services Inc. 26,800 N/A -26,800 Closed
Robert Half International Inc. 12,300 N/A -12,300 Closed
Tesoro Corp 28,200 N/A -28,200 Closed
5.40

Portfolio Position Change
TD Bank
1 Year Ending December 31, 2015
Security NameShares
Jan-2015
Shares
Dec-2015Difference Position Status
Verizon Communications Inc 20,900 N/A -20,900 Closed
Viacom Inc 13,450 N/A -13,450 Closed
American International Group Inc 19,400 18,520 -880 Decreased
Boston Scientific Corp 82,000 58,092 -23,908 Decreased
CIT Group Inc 17,150 16,370 -780 Decreased
CSX Corp 23,450 22,385 -1,065 Decreased
CVS Health Corp 15,500 12,760 -2,740 Decreased
Casey's General Stores Inc. 7,750 7,400 -350 Decreased
Costco Wholesale Corp 12,350 7,910 -4,440 Decreased
E. I. du Pont de Nemours and Co 16,300 15,560 -740 Decreased
Graphic Packaging Holding Co 54,300 51,835 -2,465 Decreased
HCA Holdings Inc 22,800 16,072 -6,728 Decreased
Microsoft Corp 26,750 17,890 -8,860 Decreased
PepsiCo Inc 17,150 16,370 -780 Decreased
Schlumberger Ltd 15,150 9,070 -6,080 Decreased
Southwest Airlines Co. 27,650 26,395 -1,255 Decreased
Time Warner Inc 18,150 14,230 -3,920 Decreased
5.41

Sector Weights
Consumer Discretionary Consumer Staples
Energy Financials
Health Care Industrials
Information Technology Materials
Telecommunication Services
8.8%
0.6%
1.7%
6.4%
29.4%
0.9%
1.9%
34.3%
16.1%
Sector Returns
0.0 4.0 8.0 12.0 16.0 20.0-4.0
Consumer Discretionary
Consumer Staples
Energy
Financials
Health Care
Industrials
Information Technology
Materials
Telecommunication Services
5.3
4.9
-0.5
8.8
6.9
6.3
13.9
9.6
7.1
Sector Weight & Returns Graph
Vanguard PRIMECAP;Adm (VPMAX)
1 Quarter Ending December 31, 2015
5.42

Sector Weight Returns
BlackRock Equity Index Fund
Consumer Discretionary 13.1 5.8
Consumer Staples 9.9 7.6
Energy 6.9 0.2
Financials 16.5 6.0
Health Care 14.7 9.2
Industrials 10.1 8.1
Information Technology 20.4 9.0
Materials 2.8 9.9
Telecommunication Services 2.4 7.6
Utilities 3.1 1.1
T. Rowe Price Large Cap Growth
Consumer Discretionary 24.9 2.9
Consumer Staples 5.3 11.2
Energy 1.4 -4.2
Financials 3.5 8.4
Health Care 20.6 8.8
Industrials 9.4 -1.8
Information Technology 32.6 7.5
Materials 2.2 10.0
Style Weight Returns
BlackRock Equity Index Fund
Large Growth 27.4 7.8
Large Neutral 29.1 9.7
Large Value 22.4 5.5
Mid Growth 5.8 4.6
Mid Neutral 6.5 4.2
Mid Value 7.2 2.7
Small Neutral 0.0 -34.6
Small Value 0.0 -11.9
Unclassified 1.5 7.2
T. Rowe Price Large Cap Growth
Large Growth 38.1 8.4
Large Neutral 16.5 10.3
Large Value 5.1 10.0
Mid Growth 19.5 2.0
Mid Neutral 18.5 0.6
Mid Value 1.0 -5.5
Small Growth 0.2 -18.4
Unclassified 1.2 1.1
Portfolio Weight & Return Table 1 Quarter Ending December 31, 2015
5.43

No. Of
Assets/
Identifier
No. Of
SharesPrice
Market
Value
Pct of
Total
Outstd
Cap.
P/E
Ratio
Current
Yield
Price
To
Book
EPS
5 Year
Growth
Annual
EPSDividends
Quarter
Return
Consumer Discretionary 11 5,545,914 - 541,552 22.0 101,493,642 24.5 1.0 6.3 23.2 9.7 0.5 6.2
Apparel Retail 1 174,740 - 16,744 0.7 27,733,566 24.1 2.1 N/A 13.2 3.5 0.5 N/A
L Brands Inc 501797104 174,740 96 16,744 0.7 27,733,566 24.1 2.1 N/A 13.2 3.5 0.5 6.9
Automotive Retail 1 80,450 - 20,388 0.8 24,997,349 29.0 0.0 12.5 26.0 7.3 N/A 1.4
O'Reilly Automotive Inc 67103H107 80,450 253 20,388 0.8 24,997,349 29.0 0.0 12.5 26.0 7.3 N/A 1.4
Cable & Satellite 2 1,747,694 - 107,272 4.4 93,994,988 16.9 1.2 2.7 20.4 3.3 0.3 -0.4
AMC Networks Inc 00164V103 473,964 75 35,396 1.4 4,548,311 15.4 0.0 N/A N/A 3.6 N/A 2.1
Comcast Corp 20030N101 1,273,730 56 71,877 2.9 138,043,014 17.7 1.8 2.7 20.4 3.2 0.3 -0.4
Footwear 1 568,077 - 35,505 1.4 84,750,000 30.4 1.0 8.0 14.6 3.7 0.2 1.9
Nike Inc 654106103 568,077 63 35,505 1.4 84,750,000 30.4 1.0 8.0 14.6 3.7 0.2 1.9
General Merchandise Stores 1 360,140 - 27,810 1.1 18,130,947 62.3 0.0 4.4 -2.6 2.9 N/A 15.8
Dollar Tree Inc 256746108 360,140 77 27,810 1.1 18,130,947 62.3 0.0 4.4 -2.6 2.9 N/A 15.8
Home Improvement Retail 1 815,724 - 107,879 4.4 167,677,262 24.8 1.8 22.0 23.9 4.7 0.6 15.0
Home Depot Inc. (The) 437076102 815,724 132 107,879 4.4 167,677,262 24.8 1.8 22.0 23.9 4.7 0.6 15.0
Internet & Direct Marketing Retail 1 58,500 - 74,585 3.0 63,472,111 26.6 0.0 7.5 39.0 45.7 N/A 6.7
Priceline Group Inc (The) 741503403 58,500 1,275 74,585 3.0 63,472,111 26.6 0.0 7.5 39.0 45.7 N/A 3.1
Movies & Entertainment 1 672,557 - 70,672 2.9 173,715,944 21.4 1.4 4.0 19.3 4.9 0.7 3.5
Walt Disney Co (The) 254687106 672,557 105 70,672 2.9 173,715,944 21.4 1.4 4.0 19.3 4.9 0.7 3.5
Restaurants 1 935,332 - 56,148 2.3 89,132,544 33.0 1.3 15.3 24.0 1.8 0.2 6.0
Starbucks Corp 855244109 935,332 60 56,148 2.3 89,132,544 33.0 1.3 15.3 24.0 1.8 0.2 6.0
Statistical Summary-Fundamental
AllianceBernstein Lg Cap Gr;C (APGCX) vs. Russell 1000 Growth Index
As of December 31, 2015
5.44

BlackRock Equity Index Fund T. Rowe Price Large Cap Growth T. Rowe Price Large Cap Value Eaton Vance AC SMID-Cap Fund
Consumer Discretionary 12.9 23.4 13.1 14.1
Consumer Staples 10.1 5.0 10.1 12.9
Energy 6.5 1.2 5.8 N/A
Financials 16.5 3.2 17.6 26.0
Health Care 15.2 19.8 16.1 3.3
Industrials 10.0 8.7 10.8 10.2
Information Technology 20.7 36.3 24.7 20.7
Materials 2.8 2.4 1.7 10.2
Telecommunication Services 2.4 N/A N/A N/A
Utilities 3.0 N/A N/A 2.6
Total 100.0 100.0 100.0 100.0
Equity Assets Exposures by Sector As of December 31, 2015
5.45

T. Rowe Price Large Cap Growth T. Rowe Price Large Cap Value
Weighted Averages
Wtd. Avg. Mkt. Cap $K 101,507,333 118,287,875
Median Mkt. Cap $K 29,168,230 25,107,537
Price/Earnings ratio 29.9 18.4
Price/Book ratio 5.7 3.2
5 Yr. EPS Growth Rate 9.3 7.2
Current Yield 0.9 1.8
Number of Stocks 83 60
Debt to Equity 3.9 1.1
Equity Characteristics As of December 31, 2015
5.46

T. Rowe Price Large Cap Growth
Weight % Qtr Return
T. Rowe Price Large Cap Value
Weight % Qtr Return
Ten Largest Holdings Alexion Pharmaceuticals Inc 4.1 22.0 Zoetis Inc 5.2 16.6
(as a % of Equities Alphabet Inc 3.7 21.9 Apple Inc 4.6 -4.2
Profiled & Short Facebook Inc 3.5 16.4 Alphabet Inc 4.1 21.9
Term Investments) Amazon.com Inc 3.2 32.0 Pfizer Inc 3.8 3.6
Apple Inc 2.8 -4.2 Procter & Gamble Co (The) 3.7 11.4
Dollar Tree Inc 2.7 15.8 Kellogg Co 3.6 9.4
Microchip Technology Inc 2.6 8.8 Bank of America Corp 3.4 8.3
Alliance Data Systems Corp 2.5 6.8 Advance Auto Parts Inc. 3.3 -20.6
Mastercard Inc 2.3 8.2 Honeywell International Inc 3.2 10.0
Starbucks Corp 2.2 6.0 Cisco Systems Inc 2.7 4.3
Total Weight % 29.6 Total Weight % 37.6
Total Assets Profiled $K 43,717 31,898
No. Equity Issues $K 83 60
Top 10 Holdings As of December 31, 2015
5.47

Portfolio NonHoldings Based Reports
6

Dodge and Cox International Stock Fund MSCI EAFE Index
0.0 3.0 6.0 9.0 12.0 15.0 18.0 21.0 24.0 27.0 30.0
Australia
Austria
Belgium
Brazil
Canada
China
Denmark
Finland
France
Germany
Hong Kong
India
Ireland
Israel
Italy
Japan
Korea
Mexico
Netherlands
New Zealand
Norway
Portugal
South Africa
Singapore
Spain
Sweden
Switzerland
Thailand
Turkey
United Kingdom
United States
Cash
Other
0.0
0.0
0.0
3.1
0.6
2.8
0.0
0.0
9.3
6.7
1.4
2.9
1.5
0.0
1.8
13.4
4.4
2.4
3.6
0.0
0.0
0.0
5.4
0.0
0.6
1.9
14.7
1.5
1.2
12.1
6.7
0.7
1.3
6.8
0.2
1.4
0.0
0.0
0.0
1.9
0.9
9.7
9.2
3.1
0.0
0.4
0.8
2.4
23.4
0.0
0.0
3.0
0.2
0.6
0.2
0.0
1.3
3.2
2.8
9.4
0.0
0.0
19.2
0.0
0.0
0.1
Country/Region Allocation
Dodge and Cox International Stock Fund vs. MSCI EAFE Index
As of December 31, 2015
6.1

Credit Quality Distribution (%)
AAA AA A BBB BB B CCC NR
0.0
25.0
50.0
75.0
100.0
All
oc
ati
on
(%)
3/15 6/15 9/15 12/15
Sector Distribution (%)
US Gov't/Agency ILB Intl Sovereigns/Credit Mortgages
CMBS Investment Grade Corp Yankees ABS
US High Yield Intl High Yield Bank Loans Convertibles
Distressed Debt EMD Munis Cash
0.0
25.0
50.0
75.0
100.0
All
oc
ati
on
(%)
3/15 6/15 9/15 12/15
Historical Portfolio Allocation Graph (Non Holdings)
Dodge and Cox Income Fund
1 Year Ending December 31, 2015
6.2

Dec-2015 Sep-2015 Jun-2015 Mar-2015
US Gov't/Agency
Dodge and Cox Income Fund 7.59 10.07 10.63 12.67
PIMCO Total Return 5.20 -6.00 -4.00 -13.00
ILB
Dodge and Cox Income Fund 0.00 - - -
PIMCO Total Return 8.00 10.00 10.00 12.00
Intl Sovereigns/Credit
Dodge and Cox Income Fund - - - -
PIMCO Total Return - 4.00 4.00 3.00
Mortgages
Dodge and Cox Income Fund 34.69 33.64 33.53 32.28
PIMCO Total Return 31.20 42.00 31.00 27.00
CMBS
Dodge and Cox Income Fund 0.00 38.97 - -
PIMCO Total Return - 1.00 1.00 -
Investment Grade Corp
Dodge and Cox Income Fund 33.76 - 32.24 34.37
PIMCO Total Return 24.00 14.00 13.00 13.00
Yankees
Dodge and Cox Income Fund 0.00 - - -
PIMCO Total Return - 1.00 1.00 -
ABS
Dodge and Cox Income Fund 7.76 7.12 8.06 7.84
PIMCO Total Return 10.10 - - 2.00
US High Yield
Dodge and Cox Income Fund 9.15 5.46 10.33 5.03
PIMCO Total Return 8.50 5.00 5.00 6.00
Intl High Yield
Dodge and Cox Income Fund - - - -
PIMCO Total Return - - - -
Bank Loans
Dodge and Cox Income Fund - - - -
PIMCO Total Return - - - -
Historical Portfolio Allocation Table (Non Holdings)
Sectors
As of December 31, 2015
6.3

Historical Portfolio Allocation Table (Non Holdings)
Sectors
As of December 31, 2015
Dec-2015 Sep-2015 Jun-2015 Mar-2015
Convertibles
Dodge and Cox Income Fund - - - -
PIMCO Total Return - - - -
Distressed Debt
Dodge and Cox Income Fund - - - -
PIMCO Total Return - - - -
EMD
Dodge and Cox Income Fund - - - -
PIMCO Total Return - 10.00 11.00 15.00
Munis
Dodge and Cox Income Fund 3.49 3.46 3.64 5.35
PIMCO Total Return 4.20 6.00 5.00 6.00
Cash
Dodge and Cox Income Fund 3.56 1.28 1.57 2.46
PIMCO Total Return 8.80 13.00 23.00 29.00
6.4

Effective Duration Yield To Maturity Avg. Maturity
0.0
0.8
1.6
2.4
3.2
4.0
4.8
5.6
6.4
7.2
8.0
3/15 6/15 9/15 12/15
6.9 7.0
6.5 6.6
2.7
3.1
3.5 3.4
4.64.5
4.4
4.6
Historical Portfolio Characteristics 2 Years Ending December 31, 2015
6.5

Dodge and Cox Income Fund PIMCO Total Return PIMCO:Short-Term;Inst (PTSHX)
0.0
0.6
1.2
1.8
2.4
3.0
3.6
4.2
4.8
5.4
3/15 6/15 9/15 12/15
1.0 1.0
1.11.2
4.64.5
4.4
4.6
4.2
4.6
4.24.3
Historical Portfolio Characteristics Comparison
Effective Duration
1 Year Ending December 31, 2015
6.6

Maturity Distribution (%)
0.0
15.0
30.0
45.0
60.0
0 to 3 Yrs 3 to 5 Yrs 5 to 10 Yrs 10 to 20 Yrs Greater than 20 Yrs
22.120.6
42.2
3.9
11.2
Credit Quality Distribution (%)
0.0
25.0
50.0
75.0
100.0
AAA AA A BBB
71.8
4.4
10.613.2
Index Portfolio Characteristics (Non Holdings)
Barclays Capital Aggregate
As of December 31, 2015
6.7

Portfolio Characteristics
Portfolio Benchmark
Effective Duration 4.6 5.7
Modified Duration 4.9 5.6
Avg. Maturity 6.6 7.9
Current Yield 3.4 1.9
Yield To Maturity (%) 3.4 2.6
Avg. Quality Aa3 Aa1/Aa2
Coupon Rate (%) 3.3 3.2
Holdings Count 4,433 9,720
Credit Quality Distribution (%)
PIMCO Total Return Blmbg. Barc. U.S. Aggregate
0.0
25.0
50.0
75.0
100.0
AAA AA ABBB BB B
CCC
71.8
4.4
10.613.2
0.0 0.0 0.0
68.0
7.0 6.09.0
4.0 3.0 3.0
Maturity Distribution (%)
PIMCO Total Return Blmbg. Barc. U.S. Aggregate
0.0
15.0
30.0
45.0
60.0
0 to
3 Yrs
3 to
5 Yrs
5 to
10 Yrs
10 to
20 Yrs
Greate
r th
an 20
Yrs
22.1 20.6
42.2
3.9
11.2
6.0
44.0
39.0
11.0
0.0
Sector Distribution (%)
PIMCO Total Return Blmbg. Barc. U.S. Aggregate
0.0
10.0
20.0
30.0
40.0
US Gov't/
AgencyIL
B
Mort
gages
Inve
stment
Gra
de Corp
ABS
US Hig
h Yie
ld
Munis
Cash
0.0 0.0 0.0 0.0 0.0 0.0 0.0 0.0
5.28.0
31.2
24.0
10.18.5
4.2
8.8
Portfolio Characteristics
PIMCO Total Return vs. Blmbg. Barc. U.S. Aggregate
As of December 31, 2015
6.8

Dodge and Cox Income Fund PIMCO Total Return PIMCO:Short-Term;Inst (PTSHX)
Market Value $40,294 $135,489 $37,503
% of Total Managed Portfolio($213,285) 18.9 63.5 17.6
Portfolio Characteristics
Avg. Maturity 7.7 6.6 5.0
Effective Duration 4.3 4.6 1.2
Yield To Maturity (%) 3.3 3.4 3.0
Quality Breakdown
AAA 49.5 68.0 60.0
AA 1.6 7.0 12.0
A 4.8 6.0 5.0
BBB 31.9 9.0 5.0
BB 10.2 4.0 4.0
B 2.0 3.0 4.0
CCC - 3.0 4.0
NR - - 6.0
Sectors Allocation Breakdown
US Gov't/Agency 7.6 5.2 8.0
ILB 0.0 8.0 -
Mortgages 34.7 31.2 27.0
CMBS 0.0 - 12.0
Investment Grade Corp 33.8 24.0 33.0
Yankees 0.0 - -
ABS 7.8 10.1 -
US High Yield 9.2 8.5 -
Munis 3.5 4.2 13.0
Cash 3.6 8.8 7.0
Portfolio Comparison As of December 31, 2015
6.9

Private Equity Reports
7

Market Value
$000%
1
Quarter
1
Year
2
Years
3
Years
4
Years
5
Years
Since
Inception
Inception
Date
Private Equity Composite 24,850 4.7 11.3 11.6 1.5 -22.1 -14.1 -10.8 -4.4 07/17/2006
BlackRock Vesey Street III, LP 1,893 0.4 0.0 -11.2 0.8 12.1 5.7 2.1 0.5 07/17/2006
BlackRock Vesey Street IV, LP 11,668 2.2 24.1 35.1 -2.8 -2.6 2.0 2.8 2.1 11/17/2008
Columbia Partners 11,289 2.2 1.6 2.3 7.1 -38.4 -33.5 -29.5 -18.7 10/23/2006
Comparative Performance - IRR As of December 31, 2015
7.1

Private Equity Composite BlackRock Vesey Street III, LP BlackRock Vesey Street IV, LP Columbia Partners
-90.0
-75.0
-60.0
-45.0
-30.0
-15.0
0.0
15.0
30.0
IRR
(%)
12/04 9/05 6/06 3/07 12/07 9/08 6/09 3/10 12/10 9/11 6/12 3/13 12/13 9/14 6/15 3/16
Years
J-Curve
Private Equity Composite
As of December 31, 2015
7.2

Geographic Allocation By Market Value
Europe
11,289.4
United States
1,892.8
International
11,668.1
Strategy Allocation By Market Value
Structured Finance
11,289.4 Hybrid
13,560.9
Industry Allocation By Market Value
Diversified
1,892.8
Telecom. Services
11,289.4
Info. Tech.
11,668.1
Vintage Year Allocation By Count
2005
1
2006
1
2011
1
2008
1
Private Equity Composite Allocations As of December 31, 2015
7.3

Vintage Year Allocation By Market Value
2005
1,892.8
2008
11,668.1
2006
11,289.4
Strategy Allocation by Remaining Capital Commitment
Venture Capital
5,000.0
Vintage Year Commitments and Cashflows
Market Value Capital Commitment
Remaining Capital Commitment Contributions
Distributions
0
25,000
50,000
75,000
100,000
2005 2006 2008 2011
Commitments and Cashflows By Strategy
Market Value Capital Commitment
Remaining Capital Commitment Contributions
Distributions
0
30,000
60,000
90,000
120,000
Hybrid Structured Finance Venture Capital
Private Equity Composite Allocations As of December 31, 2015
7.4

Commitments and Cashflows By Geographic Focus
Market Value Capital Commitment Remaining Capital Commitment
Contributions Distributions
0
25,000
50,000
75,000
100,000
Europe International United States Other
Commitments and Cashflows By Industry Focus
Market Value Capital Commitment Remaining Capital Commitment
Contributions Distributions
0
25,000
50,000
75,000
100,000
Diversified Info. Tech. Telecom. Services Other
Private Equity Composite Allocations As of December 31, 2015
7.5

Allocation By Vintage Year
Market Value
%Market Value
Remaining
Capital
Commitment
%
Remaining
Capital
Commitment
Number
of Funds
2005 0.4 1,893 -0.4 -1,940 1
2006 2.2 11,289 -2.3 -12,105 1
2008 2.2 11,668 -0.9 -4,930 1
2011 0.0 - 1.0 5,000 1
Total 4.7 24,850 -2.7 -13,975 4
Allocation By Strategy
Market Value
%Market Value
Remaining
Capital
Commitment
%
Remaining
Capital
Commitment
Number
of Funds
Hybrid 2.6 13,561 -1.3 -6,870 2
Structured Finance 2.2 11,289 -2.3 -12,105 1
Venture Capital 0.0 - 1.0 5,000 1
Total 4.7 24,850 -2.7 -13,975 4
Allocation By Geographic Focus
Market Value
%Market Value
Remaining
Capital
Commitment
%
Remaining
Capital
Commitment
Number
of Funds
Europe 2.2 11,289 -2.3 -12,105 1
International 2.2 11,668 -0.9 -4,930 1
United States 0.4 1,893 -0.4 -1,940 1
Other 0.0 - 1.0 5,000 1
Total 4.7 24,850 -2.7 -13,975 4
Allocation By Industry Focus
Market Value
%Market Value
Remaining
Capital
Commitment
Remaining
Capital
Commitment
%
Number
of Funds
Diversified 0.4 1,893 -0.4 -1,940 1
Info. Tech. 2.2 11,668 -0.9 -4,930 1
Telecom. Services 2.2 11,289 -2.3 -12,105 1
Other 0.0 - 1.0 5,000 1
Total 4.7 24,850 -2.7 -13,975 4
Private Equity Composite Allocations As of December 31, 2015
7.6

Cash Flow Summary
Capital Committed: 125,000
Capital Invested: 145,399
Management Fees: 6,732
Expenses: 2,159
Interest: 74
Total Contributions: 154,364
Remaining Capital Commitment: -13,975
Total Distributions: 104,613
Market Value: 24,850
Inception Date: 07/17/2006
Inception IRR: -4.4
TVPI: 0.8
DPI: 0.7
RVPI: 0.2
PIC: 1.2
Cash Flow Analysis
Net Asset Value Distribution Contributions
0.0
45,000.0
90,000.0
135,000.0
180,000.0
225,000.0
-45,000.0
In T
hou
sa
nd
s7/06 7/07 7/08 7/09 7/10 7/11 7/12 7/13 7/14 1/16
Private Equity Portfolio
PartnershipsInvestment
Type
Vintage
Year
Investment
Strategy
Size of
Fund
$000
Capital
Committed
$000
Total
Contribution
$000
Total
Distribution
$000
Market
Value
$000
IRR
(%)
TVPI
Multiple
(%)
BlackRock Vesey Street III, LP Fund Of Funds 2005 Hybrid 1,600,000 65,000 67,171 66,975 1,893 0.5 1.0
BlackRock Vesey Street IV, LP Fund Of Funds 2008 Hybrid 790,100 20,000 25,198 14,975 11,668 2.1 1.1
Columbia Partners Direct 2006 Structured Finance 30,000 30,000 56,996 17,663 11,289 -18.7 0.5
DCM VI, LP Partnership 2011 Venture Capital 475,000 10,000 5,000 5,000 - 0.3 1.0
Private Equity Composite Total Fund Hybrid - 125,000 154,364 104,613 24,850 -4.4 0.8
Private Equity Composite Overview
Private Equity Composite
As of December 31, 2015
7.7

Date Market Value
Contribution
Investment FeesFees
No AffectExpenses
Expenses
No Affect
Catch-Up
InterestTotal
Distribution
Gain Cash Gain Stock Interest
Catch-Up
Interest
Received
Recallable
Capital
Return of
Capital
Cash
Return of
Capital
Stock
Total
Jun-2014 Market Value : $11,840 TVPI : 0.0
24 - - - - - - - - 187 - - - - - - 187
Sub Total - - - - - - - - 187 - - - - - - 187
Jul-2014 Market Value : $12,960 TVPI : 49.6
22 - 261 - - - - - 261 - - - - - - - -
Sub Total - 261 - - - - - 261 - - - - - - - -
Oct-2014 Market Value : $13,094 TVPI : 57.1
10 - - 30 - 200 - - 229 - - - - - - - -
24 - - - - - - - - 171 - - - - - - 171
Sub Total - - 30 - 200 - - 229 171 - - - - - - 171
Jan-2015 Market Value : $13,249 TVPI : 161.1
22 - 82 - - - - - 82 - - - - - - - -
Sub Total - 82 - - - - - 82 - - - - - - - -
Feb-2015 Market Value : $13,249 TVPI : 0.0
2 - - - - - - - - 1,590 - - - - - - 1,590
Sub Total - - - - - - - - 1,590 - - - - - -1,590
Mar-2015 Market Value : $7,035 TVPI : 90.1
13 - 78 - - - - - 78 1,402 - - - - 2,846 - 4,248
Sub Total - 78 - - - - - 78 1,402 - - - - 2,846 -4,248
Apr-2015 Market Value : $1,990 TVPI : 0.0
28 - - - - - - - - 1,362 - - - - 3,683 - 5,045
Sub Total - - - - - - - - 1,362 - - - - 3,683 -5,045
Total - 422 30 - 200 - - 651 4,712 - - - - 6,529 -11,241
Private Equity Financial Reconciliation
($000)
2 Years Ending December 31, 2015
7.8

Fund Information
Type of Fund: Fund Of Funds Vintage Year: 2005
Strategy Type: Hybrid Management Fee: 1% on commitments less than $30M; 0.85% on
commitments between $30M & $75M
Size of Fund: 1,600,000 Preferred Return:
Inception: 04/30/2006 General Partner: BlackRock Private Equity Partners
Final Close: 06/30/06 Number of Funds: 0
Investment Strategy: BlackRock Fund III has a target allocation of approximately 75% to partnership funds, up to around 30% in direct investments and 15% in
secondaries. Geographically, depending on market conditions, the Fund will commit 60-70% of capital to US portfolio investments and
approximately 30-40% internationally. Venture capital will focus mostly on early stage investments and represent approximately 20-30%
of the Fund (anticipate no more than 5% in non-US venture), with buyouts/corporate finance funds at around 50-60%. The overweighting
toward buyouts reflects the BlackRock view that this sector will produce strong IRR’s over the next few years given the wave of business
recapitalizations and capital market growth anticipated. Venture is included as a hedge in the event that climbing interest rates and
valuations will make buyouts more risky.
Cash Flow Summary
Capital Committed: 65,000
Capital Invested: 62,553
Management Fees: 3,025
Expenses: 1,579
Interest: 14
Total Contributions: 67,171
Remaining Capital Commitment: -1,940
Total Distributions: 66,975
Market Value: 1,893
Inception Date: 07/17/2006
Inception IRR: 0.5
TVPI: 1.0
Cash Flow Analysis
Net Asset Value Distribution Contributions
0.0
25,000.0
50,000.0
75,000.0
100,000.0
-25,000.0
In T
ho
us
an
ds
12/06 12/07 12/08 12/09 12/10 12/11 12/12 12/13 12/14 12/15
Private Equity Fund Overview
BlackRock Vesey Street III, LP
As of December 31, 2015
7.9

Region Allocation By Market Value
Market Value : 1,892.8
North America Europe Asia
3.0%
32.0%
65.0%
Strategy Allocation By Market Value
Market Value : 1,892.8
Venture Capital Buyouts Other
11.0%15.0%
74.0%
Private Equity Portfolio Characteristics
BlackRock Vesey Street III, LP
As of December 31, 2015
7.10

Portfolio Summary
As of Sep-2011
Vintage
Year
Investment
Type
Investment
Strategy
Capital
Committed
$000
Drawn
Down
$000
Addici 2007 Direct Buyouts 22,700 22,700
Alliance Data System 2008 Direct Buyouts 4,100 4,100
Bausch & Lomb 2007 Direct Buyouts 48,900 48,900
Biomet 2007 Direct Buyouts 29,700 29,700
CDW 2007 Direct Buyouts 33,600 33,600
Cengage Learning 2007 Direct Buyouts 48,400 48,400
Coating Excellence International 2008 Direct Buyouts 9,400 9,400
Evenflo Company 2007 Direct Buyouts 18,000 18,000
Fabory 2008 Direct Buyouts 17,000 17,000
Caesars Entertainment (formerly Harrah's) 2008 Direct Buyouts 42,500 42,500
Independent Insurance Investments 2006 Direct Buyouts 14,100 14,100
Realogy Corporation 2007 Direct Buyouts 51,500 51,500
The Brock Group 2007 Direct Buyouts 11,100 11,100
The ServiceMaster Company 2007 Direct Buyouts 4,100 4,100
U.S. Foodservice 2007 Direct Buyouts 11,800 11,800
Univision Communications 2007 Direct Buyouts 22,100 22,100
Ziggo (formerly Dutch Cable) 2007 Direct Buyouts 26,100 26,100
Accel London II, L.P. 2006 Partnership Venture Capital 5,000 3,950
Apax France VII, L.P. 2006 Partnership Buyouts 27,800 25,298
Apax US VII, L.P. 2006 Partnership Buyouts 40,000 33,600
Apollo Investment Fund VI, L.P. 2006 Partnership Buyouts 30,000 25,800
Argan Capital, L.P. 2006 Partnership Secondaries 27,700 49,099
Asia Opportunity Fund II, L.P. 2005 Partnership Buyouts 10,000 87,000
Bay Partners XI, L.P. 2006 Partnership Venture Capital 10,000 7,100
BDCM Opportunity Fund II, L.P. 2006 Partnership Buyouts 27,000 22,410
Blackstone V-A, L.P. 2006 Partnership Buyouts 10,000 7,900
Candover 2005 Fund, L.P. 2005 Partnership Buyouts 28,900 27,455
CCMP Capital Investors II, L.P. 2006 Partnership Buyouts 50,000 31,000
Charterhouse Capital Partners VIII, L.P. 2006 Partnership Buyouts 41,600 33,280
Private Equity Portfolio Detail
BlackRock Vesey Street III, LP
7.11

Private Equity Portfolio Detail
BlackRock Vesey Street III, LP
Portfolio Summary
As of Sep-2011
Vintage
Year
Investment
Type
Investment
Strategy
Capital
Committed
$000
Drawn
Down
$000
Clayton Dublier & Rice Fund VII, L.P. 2005 Partnership Buyouts 25,000 22,750
Diamond Castle Partners IV, L.P. 2005 Partnership Buyouts 40,000 34,800
Edison Venture Fund VI, L.P. 2006 Partnership Buyouts 15,000 14,550
Goode Partners Consumer Fund I, L.P. 2007 Partnership Buyouts 15,000 12,450
Graphite VII, L.P. 2006 Partnership Buyouts 10,800 5,184
Hg Capital 5, L.P. 2006 Partnership Buyouts 26,300 22,092
KarpReilly Pledge Fund, L.P. 2007 Partnership Buyouts 9,700 9,700
Lindsay, Goldberg & Bessemer II, L.P. 2006 Partnership Buyouts 60,000 51,000
M/C Venture Partners VI, L.P. 2006 Partnership Venture Capital 20,000 16,200
Madison Dearborn Capital Partners V, L.P. 2006 Partnership Buyouts 50,000 41,500
Mason Wells Buyout Fund II, L.P. 2005 Partnership Buyouts 20,000 17,400
New Enterprise Associates 12 L.P. 2006 Partnership Venture Capital 40,000 32,400
NV Partners IV, L.P. 2006 Partnership Venture Capital 15,000 84,000
Oak Investment Partners XII, L.P. 2006 Partnership Venture Capital 35,000 30,100
OCM European Principal Opportunities Fund, L.P. 2006 Partnership Buyouts 25,000 25,000
PAI Europe IV, L.P. 2005 Partnership Buyouts 25,400 23,876
Parallel 2005 Equity Fund, L.P. 2006 Partnership Buyouts 25,000 23,250
Partech International Ventures V 2006 Partnership Venture Capital 9,600 8,640
Quadrangle Capital Partners II, L.P. (Secondary) 2005 Partnership Buyouts 4,000 3,360
Quandrangle Capital Parnters II, L.P. 2005 Partnership Buyouts 25,000 21,000
SKM Equity Fund III, L.P. 2000 Partnership Buyouts 13,600 13,056
Sterling Capital Partners II, L.P. 2005 Partnership Buyouts 20,000 16,600
TA Associates X, L.P. 2006 Partnership Buyouts 12,500 12,125
Tailwind Capital Partners, L.P. 2006 Partnership Buyouts 35,000 24,850
The Alchemy Investment Plan 2005 Partnership Buyouts 26,200 26,200
The Fourth Cinven Fund, L.P. 2006 Partnership Buyouts 55,700 38,433
Thoma Cressey Fund VIII, L.P. 2006 Partnership Buyouts 30,000 29,700
Thomas H. Lee Equity Fund VI, L.P. 2006 Partnership Buyouts 50,000 32,000
Warburg Pincus Private Equity IX, L.P. 2005 Partnership Other 25,000 25,000
7.12

Private Equity Portfolio Detail
BlackRock Vesey Street III, LP
Portfolio Summary
As of Sep-2011
Vintage
Year
Investment
Type
Investment
Strategy
Capital
Committed
$000
Drawn
Down
$000
Welsh, Carson, Anderson & Stowe X, L.P. 2005 Partnership Buyouts 50,000 47,000
Zon Capital Partners 2002 Partnership Secondaries 9,300 9,207
Vesey Street Fund III (ERISA), L.P. 2005 Fund Of Funds Hybrid 1,546,200 1,542,415
7.13
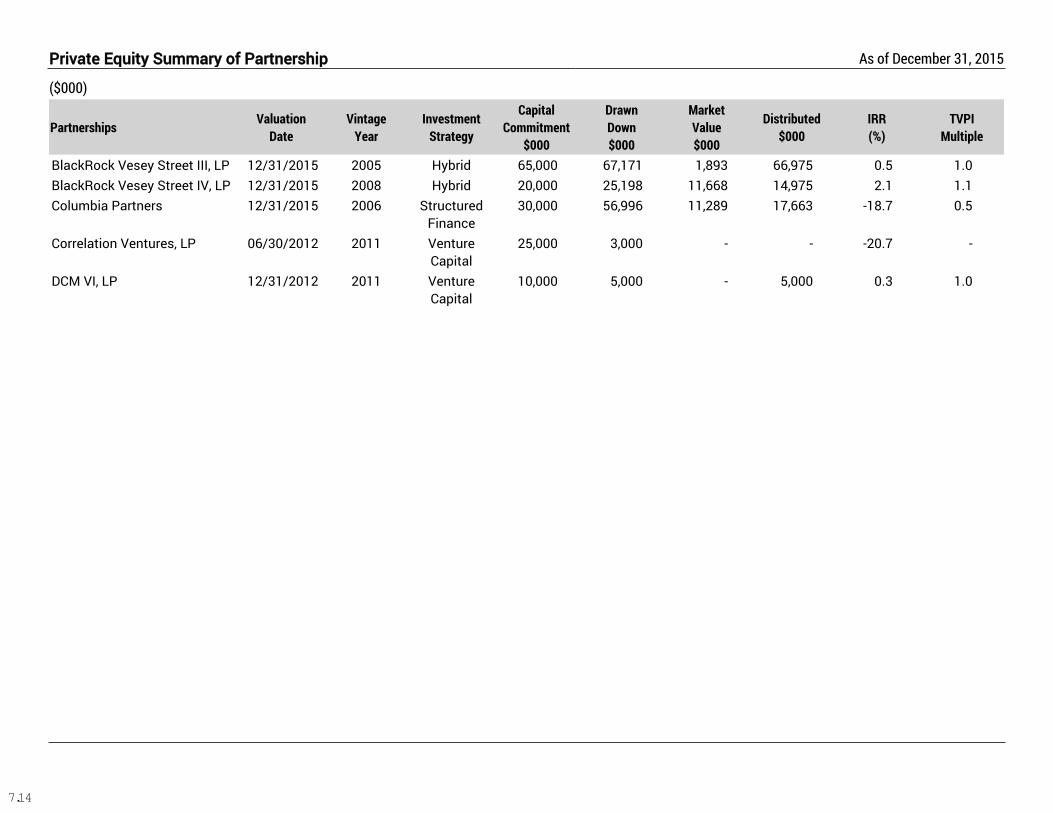
PartnershipsValuation
Date
Vintage
Year
Investment
Strategy
Capital
Commitment
$000
Drawn
Down
$000
Market
Value
$000
Distributed
$000
IRR
(%)
TVPI
Multiple
BlackRock Vesey Street III, LP 12/31/2015 2005 Hybrid 65,000 67,171 1,893 66,975 0.5 1.0
BlackRock Vesey Street IV, LP 12/31/2015 2008 Hybrid 20,000 25,198 11,668 14,975 2.1 1.1
Columbia Partners 12/31/2015 2006 Structured
Finance
30,000 56,996 11,289 17,663 -18.7 0.5
Correlation Ventures, LP 06/30/2012 2011 Venture
Capital
25,000 3,000 - - -20.7 -
DCM VI, LP 12/31/2012 2011 Venture
Capital
10,000 5,000 - 5,000 0.3 1.0
Private Equity Summary of Partnership
($000)
As of December 31, 2015
7.14

Returns Reports
8

Barclays Capital Aggregate Pimco Total Return
0.0
0.5
1.0
1.5
2.0
2.5
3.0
-0.5
-1.0
-1.5
-2.0
1/15 2/15 3/15 4/15 5/15 6/15 7/15 8/15 9/15 10/15 11/15 12/15
2.2%
-0.4%
0.4%
-0.3%
-0.1%
-0.9%
1.0%
-0.7%
-0.4%
0.6%
-0.1%
-0.3%
2.1%
-0.9%
0.5%
-0.4%
-0.2%
-1.1%
0.7%
-0.1%
0.7%
0.0%
-0.3%-0.3%
Absolute Performance 1 Year Ending December 31, 2015
Calculation based on monthly periodicity.
8.1

0.0 2.0 4.0 6.0-2.0-4.0-6.0
Domestic Equity Composite
TD Bank
BlackRock Equity Index Fund
Eaton Vance AC SMID-Cap Fund
T. Rowe Price Large Cap Growth
T. Rowe Price Large Cap Value
-2.2
-3.0
0.7
-2.4
3.3
-4.1
Do
me
sti
c E
qu
ity
B
en
ch
ma
rk
Absolute Return 1 Year Ending December 31, 2015
8.2

Manager Returns Benchmark Returns Active Return
0.0
2.0
4.0
6.0
8.0
10.0
12.0
-2.0
-4.0
-6.0
-8.0
-10.0
Re
turn
(%)
Fidelity Adv Div Gro;A Fidelity Adv Mid Cp;A Fidelity Adv MdCp II;A Fidelity Adv Lev Co;A Fidelity Adv Eq Gro;A
-2.4
-1.0
-1.6
-0.5
6.0
1.4
-2.4
-0.2
-4.8
0.5
-1.0
-3.5
-1.8
-5.8
6.7
Active Return 1 Year Ending December 31, 2015
8.3

Quarterly Added Value (up market) Quarterly Added Value (down market) Annualized Added Value
Objective Rolling 5 Years Added Value
0.0
4.0
8.0
12.0
-4.0
-8.0
-12.0
Ad
de
d V
alu
e (%
)
3/06 9/06 3/07 9/07 3/08 9/08 3/09 9/09 3/10 9/10 3/11 9/11 3/12 9/12 3/13 9/13 3/14 9/14 3/15 12/15
Performance Statistics
Quarters %
Market Capture
Up Markets 27 109.4
Down Markets 13 106.7
Batting Average
Up Markets 27 59.3
Down Markets 13 46.2
Overall 40 55.0
Added Value History
Dodge & Cox Intl Stock (DODFX)
10 Years Ending December 31, 2015
8.4

<= 25
26 - 50
51-75
76-100
Allocation
Market Value
$000% Policy(%)
Performance (%)
1
Quarter
1
Year
3
Years
5
Years2014 2013 2012
Total Plan 499,497 100.0 100.0 2.5 -0.8 7.6 7.8 6.7 17.7 17.1
Total Fund Benchmark wo PE 3.3 0.6 8.0 7.6 7.3 16.8 11.8
Difference -0.8 -1.4 -0.4 0.2 -0.6 0.9 5.3
Domestic Equity Composite 243,987 48.8 45.0 4.5 (53) -2.2 (63) 13.4 (62) 12.8 (30) 12.1 (36) 33.1 (70) 23.7 (5)
Domestic Equity Benchmark 6.3 (27) 0.5 (42) 14.7 (44) 12.2 (42) 12.6 (32) 33.6 (66) 16.4 (46)
Difference -1.8 -2.7 -1.3 0.6 -0.5 -0.5 7.3
IM U.S. Equity (SA+CF) Median 4.6 -0.5 14.3 11.6 10.0 35.8 16.0
Population 2,616 2,592 2,475 2,305 2,724 2,803 2,903
TD Bank 52,518 10.5 - 4.3 (85) -3.0 (87) 9.6 (94) 8.1 (96) 13.7 (45) 19.4 (97) 12.4 (83)
S&P 500 7.0 (26) 1.4 (49) 15.1 (53) 12.6 (52) 13.7 (44) 32.4 (59) 16.0 (47)
Difference -2.7 -4.4 -5.5 -4.5 0.0 -13.0 -3.6
IM U.S. Large Cap Core Equity (SA+CF) Median 6.0 1.3 15.3 12.6 13.4 33.0 15.7
Population 308 307 293 263 332 353 360
BlackRock Equity Index Fund 53,639 10.7 - 6.4 (58) 0.7 (67) 15.2 (66) 12.3 (85) 11.8 (90) 35.7 (21) 15.0 (86)
S&P 500 7.0 (25) 1.4 (46) 15.1 (70) 12.6 (83) 13.7 (57) 32.4 (74) 16.0 (68)
Difference -0.6 -0.7 0.1 -0.3 -1.9 3.3 -1.0
IM U.S. Large Cap Enhd Index Equity (SA+CF) 6.6 1.3 15.6 13.2 14.0 33.6 16.7
Population 67 67 65 63 73 77 80
Eaton Vance AC SMID-Cap Fund 64,027 12.8 - 7.7 (1) -2.4 (71) 15.6 (36) 19.9 (1) 8.3 (41) 46.1 (4) 53.5 (1)
Russell 2500 Index 3.3 (57) -2.9 (85) 12.5 (88) 10.3 (78) 7.1 (73) 36.8 (59) 17.9 (51)
Difference 4.4 0.5 3.1 9.6 1.2 9.3 35.6
IM U.S. SMID Cap Core Equity (SA+CF) Median 3.4 0.1 14.5 11.8 7.8 37.6 17.9
Population 44 44 42 40 47 49 51
T. Rowe Price Large Cap Growth 44,250 8.9 - 6.1 (71) 3.3 (67) 15.6 (68) 12.3 (62) 9.8 (73) 36.2 (38) 17.6 (27)
Russell 1000 Growth Index 7.3 (46) 5.7 (46) 16.8 (48) 13.5 (42) 13.1 (39) 33.5 (60) 15.3 (50)
Difference -1.2 -2.4 -1.2 -1.2 -3.3 2.7 2.3
IM U.S. Large Cap Growth Equity (SA+CF) Median 7.0 5.1 16.8 13.0 12.0 34.6 15.2
Population 326 325 315 301 340 348 362
Asset Allocation & Performance As of December 31, 2015
8.5

Asset Allocation & Performance As of December 31, 2015Allocation
Market Value
$000% Policy(%)
Performance (%)
1
Quarter
1
Year
3
Years
5
Years2014 2013 2012
T. Rowe Price Large Cap Value 29,555 5.9 - 3.6 (85) -4.1 (70) 13.0 (68) 11.1 (62) 16.0 (10) 29.7 (83) 18.0 (26)
Russell 1000 Value Index 5.6 (44) -3.8 (68) 13.1 (67) 11.3 (57) 13.5 (35) 32.5 (63) 17.5 (29)
Difference -2.0 -0.3 -0.1 -0.2 2.5 -2.8 0.5
IM U.S. Large Cap Value Equity (SA+CF) Median 5.4 -2.3 13.9 11.7 12.2 34.3 15.7
Population 366 363 351 329 390 394 415
Fixed Income Composite 213,285 42.7 40.0 -0.3 (26) 0.6 (50) 2.3 (14) 3.9 (54) 3.3 (98) 3.0 (4) 8.6 (23)
Fixed Income Benchmark -0.5 (59) 0.5 (60) 1.3 (91) 2.9 (98) 5.4 (84) -1.8 (75) 3.8 (98)
Difference 0.2 0.1 1.0 1.0 -2.1 4.8 4.8
IM U.S. Broad Market Fixed Income (SA+CF) Median -0.5 0.6 1.8 3.9 6.1 -1.2 6.6
Population 341 338 333 324 371 391 411
Dodge and Cox Income Fund 40,294 8.1 - 0.7 (1) 3.5 (1) 4.4 (1) 5.2 (1) 5.3 (61) 4.6 (1) 7.9 (13)
Blmbg. Barc. U.S. Aggregate -0.6 (36) 0.5 (18) 1.4 (24) 3.2 (42) 6.0 (26) -2.0 (52) 4.2 (79)
Difference 1.3 3.0 3.0 2.0 -0.7 6.6 3.7
IM U.S. Broad Market Core Fixed Income (MF) Median -0.6 0.0 1.1 3.1 5.5 -2.0 6.0
Population 525 489 446 394 480 478 473
PIMCO Total Return 135,489 27.1 - 0.5 (1) 0.7 (12) 2.5 (2) 4.4 (4) 4.7 (78) 2.2 (1) 10.4 (1)
Blmbg. Barc. U.S. Aggregate -0.6 (36) 0.5 (18) 1.4 (24) 3.2 (42) 6.0 (26) -2.0 (52) 4.2 (79)
Difference 1.1 0.2 1.1 1.2 -1.3 4.2 6.2
IM U.S. Broad Market Core Fixed Income (MF) Median -0.6 0.0 1.1 3.1 5.5 -2.0 6.0
Population 525 489 446 394 480 478 473
PIMCO:Short-Term;Inst (PTSHX) 37,503 7.5 - -4.2 (100) -2.5 (100) N/A N/A -2.8 (100) N/A 3.4 (44)
Citigroup 3 Month T-Bill 0.0 (22) 0.0 (71) 0.0 (82) 0.1 (96) 0.0 (89) 0.1 (77) 0.1 (100)
Difference -4.2 -2.5 N/A N/A -2.8 N/A 3.3
IM U.S. Short Term Investment Grade (MF) Median -0.2 0.3 0.5 1.2 0.7 0.5 3.1
Population 462 425 359 280 414 396 354
International Composite 42,224 8.5 15.0 6.0 (36) 1.2 (63) 5.8 (58) 3.8 (76) -5.8 (79) 24.4 (33) 21.0 (31)
MSCI EAFE Index 4.7 (64) -0.4 (76) 5.5 (65) 4.1 (71) -4.5 (65) 23.3 (35) 17.9 (67)
Difference 1.3 1.6 0.3 -0.3 -1.3 1.1 3.1
IM Intl Large Cap Growth Equity (SA+CF) 5.6 2.1 6.1 4.8 -3.4 21.0 19.7
Population 139 138 131 121 143 142 151
8.6

Asset Allocation & Performance As of December 31, 2015Allocation
Market Value
$000% Policy(%)
Performance (%)
1
Quarter
1
Year
3
Years
5
Years2014 2013 2012
Dodge and Cox International Stock Fund 42,224 8.5 - 6.0 (11) 1.2 (26) 5.8 (23) 3.8 (28) -5.8 (64) 24.4 (18) 21.0 (28)
MSCI EAFE Index 4.7 (26) -0.4 (35) 5.5 (25) 4.1 (24) -4.5 (50) 23.3 (21) 17.9 (58)
Difference 1.3 1.6 0.3 -0.3 -1.3 1.1 3.1
IM International Equity (MF) Median 3.3 -2.8 3.1 2.4 -4.5 17.3 18.6
Population 3,182 2,892 2,324 1,874 2,717 2,590 2,450
8.7

1 Year
0.00% 0.80%-0.80 %-1.60 %-2.40 %-3.20 %-4.00 %
T. Rowe Price Large Cap Value
Eaton Vance AC SMID-Cap Fund
T. Rowe Price Large Cap Growth
BlackRock Equity Index Fund
TD Bank
Benchmark Effect
Cash Flow Effect
Total Excess Return
-0.04 %
0.13%
-0.40 %
0.01%
-0.96 %
-0.20 %
-1.23 %
-2.69 %
5 Years
0.00% 0.75% 1.50% 2.25% 3.00%-0.75 %-1.50 %-2.25 %
Eaton Vance AC SMID-Cap Fund
T. Rowe Price Large Cap Value
T. Rowe Price Large Cap Growth
AXA Rosenberg SMID Institutional
AllianceBernstein Style Blend
BlackRock Equity Index Fund
TD Bank
Benchmark Effect
Cash Flow Effect
Total Excess Return
2.22%
-0.06 %
-0.21 %
0.03%
-0.02 %
0.17%
-0.92 %
0.00%
-0.60 %
0.61%
Asset Class Attribution
Domestic Equity Composite
As of December 31, 2015
8.8

1
Quarter
1
Year
3
Years
5
Years
7
Years
10
Years2014 2013 2012
Dodge & Cox Balanced (DODBX) 3.2 -2.9 10.7 9.6 12.5 5.8 8.9 28.4 18.3
Dow Jones U.S. Aggressive Index 4.8 -1.2 13.9 11.5 16.1 7.7 11.4 34.2 17.0
Difference -1.6 -1.7 -3.2 -1.9 -3.6 -1.9 -2.5 -5.8 1.3
IM Mixed-Asset Target Alloc Growth (MF) Median 3.3 -1.2 7.9 6.9 10.4 5.2 6.3 19.8 13.0
Dodge & Cox Balanced (DODBX) Rank 56 78 5 4 5 33 21 1 1
Dodge & Cox Income (DODIX) 0.1 -0.6 1.8 3.6 5.8 5.0 5.5 0.6 7.9
Blmbg. Barc. U.S. Aggregate -0.6 0.5 1.4 3.2 4.1 4.5 6.0 -2.0 4.2
Difference 0.7 -1.1 0.4 0.4 1.7 0.5 -0.5 2.6 3.7
IM U.S. Broad Market Core Fixed Income (MF) Median -0.6 0.0 1.1 3.1 5.1 4.2 5.5 -2.0 6.0
Dodge & Cox Income (DODIX) Rank 2 72 9 21 25 8 55 2 13
Dodge & Cox Intl Stock (DODFX) 0.8 -11.4 3.9 2.6 9.7 3.8 0.1 26.3 21.0
S&P EPAC LargeMidCap 4.8 -0.5 5.1 3.9 8.5 3.6 -4.5 22.2 18.1
Difference -4.0 -10.9 -1.2 -1.3 1.2 0.2 4.6 4.1 2.9
IM International Large Cap Core Equity (MF) Median 2.9 -2.3 3.0 2.4 6.7 2.8 -6.1 19.5 17.1
Dodge & Cox Intl Stock (DODFX) Rank 94 92 35 44 7 16 6 3 11
Dodge & Cox Stock (DODGX) 4.5 -4.5 14.0 11.6 14.5 5.7 10.4 40.5 22.0
Russell 1000 Value Index 5.6 -3.8 13.1 11.3 13.0 6.2 13.5 32.5 17.5
Difference -1.1 -0.7 0.9 0.3 1.5 -0.5 -3.1 8.0 4.5
IM U.S. Large Cap Value Equity (MF) Median 5.2 -3.7 12.3 9.8 12.3 5.5 10.9 32.5 15.4
Dodge & Cox Stock (DODGX) Rank 73 63 13 12 7 44 64 3 2
Zevenbergen Growth Equity 7.0 6.8 21.3 11.8 19.1 10.0 3.5 61.2 8.2
S&P 500 7.0 1.4 15.1 12.6 14.8 7.3 13.7 32.4 16.0
Difference 0.0 5.4 6.2 -0.8 4.3 2.7 -10.2 28.8 -7.8
IM U.S. All Cap Growth Equity (SA+CF) Median 6.2 3.5 15.3 12.2 16.8 9.2 8.9 36.0 15.0
Zevenbergen Growth Equity Rank 35 16 1 59 25 20 94 1 88
> Benchmark
< Benchmark
A Rank higher than 50% Percentile
Comparative Performance As of December 31, 2015
Returns for periods greater than one year are annualized.
Returns are expressed as percentages.
8.9

1
Quarter
1
Year
3
Years
5
Years
7
Years2014 2013 2012 2011 2010
Since
Inception
Inception
Date
PIMCO:Div Income;Admn (PDAAX) 0.8 1.0 0.8 4.1 9.0 2.7 -1.2 14.7 4.2 14.0 6.0 11/01/2004
Blmbg. Barc. U.S. Aggregate -0.6 0.5 1.4 3.2 4.1 6.0 -2.0 4.2 7.8 6.5 4.3
Difference 1.4 0.5 -0.6 0.9 4.9 -3.3 0.8 10.5 -3.6 7.5 1.7
Tracking Error 1.6 5.1 4.3 4.7 5.6 3.8 3.6 2.5 6.5 5.3 5.8
During the quarter, a tactical exposure to the banking sector hurt the fund's performance given the sell-off in the markets and dramatic underperformance of the sector. From a
sector selection standpoint, an overweight to the energy and natural gas also proved detrimental to the fund's performance. In the third quarter, investors' risk aversion caused a
flight to quality with higher quality issues outperforming lower quality and the fund's underweight to global investment grade credit hindered performance. From a country
selection perspective, an overweight to Russia and Ukraine coupled with an underweight to Brazil and Turkey detracted value. In contrast, asset allocation proved beneficial to
performance as the fund's overweight exposure to the emerging markets and underweight exposure to the high yield sector helped performance. In addition, a tactical exposure
to mortgages proved beneficial as did an underweight exposure to Ecuador. The fund's tactical exposure to emerging markets currencies and bank loans continued to add value
during the quarter.
Rolling Active Return Rolling Tracking Error Active Return
0.0
6.0
12.0
18.0
-6.0
-12.0
-18.0
Ac
tiv
e
Re
turn
(%)
3/05 9/05 3/06 9/06 3/07 9/07 3/08 9/08 3/09 9/09 3/10 9/10 3/11 9/11 3/12 9/12 3/13 9/13 3/14 9/14 3/15 12/15
Comparative Performance & Rolling Return
PIMCO:Div Income;Admn (PDAAX) vs. Blmbg. Barc. U.S. Aggregate
As of December 31, 2015
Net Of Fees.
8.10

Russell 1000 Index Russell 2000 Index Russell 3000 Index Russell 2500 Index
0.0
2.0
4.0
6.0
8.0
10.0
12.0
14.0
16.0
18.0
20.0
Sta
nd
ard
De
via
tio
n
1
Quarter
1
Year
3
Years
5
Years
4.9
13.012.6
14.7
5.2
13.3
10.7
12.1
5.6
14.514.2
15.9
5.2
13.4
10.6
11.9
Comparative Performance Statistics As of December 31, 2015
8.11

Actual Correlation Matrix
Fixed Income
Composite
Dodge and
Cox Income
Fund
PIMCO Total
Return
PIMCO:Div
Income
(PDAAX)
Dodge & Cox
Balanced
(DODBX)
Dodge & Cox
Global Stock
(DODWX)
Dodge & Cox
Income
(DODIX)
Dodge & Cox
Intl Stock
(DODFX)
Dodge & Cox
Stock
(DODGX)
PIMCO:Tot
Rtn;Inst
(PTTRX)
Fixed Income Composite 1.00
Dodge and Cox Income Fund 0.33 1.00
PIMCO Total Return 0.97 0.26 1.00
PIMCO:Div Income (PDAAX) 0.78 0.26 0.71 1.00
Dodge & Cox Balanced (DODBX) 0.31 0.23 0.18 0.52 1.00
Dodge & Cox Global Stock (DODWX) 0.40 0.20 0.27 0.64 0.95 1.00
Dodge & Cox Income (DODIX) 0.84 0.31 0.81 0.85 0.34 0.45 1.00
Dodge & Cox Intl Stock (DODFX) 0.48 0.21 0.35 0.72 0.88 0.97 0.52 1.00
Dodge & Cox Stock (DODGX) 0.25 0.19 0.12 0.48 1.00 0.94 0.26 0.86 1.00
PIMCO:Tot Rtn;Inst (PTTRX) 0.81 0.33 0.83 0.75 0.14 0.25 0.90 0.34 0.07 1.00
<= 0.75
0.75 - 0.95
0.96-0.99
A = 1
Correlation Matrix 3 Years Ending December 31, 2015
8.12

PIMCO Total Return Blmbg. Barc. U.S. Aggregate
0.0
0.9
1.8
-0.9
-1.8
-2.7
-3.6
-4.5
-5.4
-6.3
-7.2
1/11 4/11 7/11 10/11 1/12 4/12 7/12 10/12 1/13 4/13 7/13 10/13 1/14 4/14 7/14 10/14 1/15 4/15 7/15 12/15
Max Drawdown Recovery Periods # of Drawdowns in Period
PIMCO Total Return -5.3 8 Months 8
Blmbg. Barc. U.S. Aggregate -3.7 13 Months 8
Drawdown January 1, 2011 To December 31, 2015
8.13

Dual Statistics 1 Year Rolling Ellipses - 3 Years :
Domestic Equity Composite TD Bank BlackRock Equity Index Fund
T. Rowe Price Large Cap Growth Eaton Vance AC SMID-Cap Fund T. Rowe Price Large Cap Value
-25.0
-20.0
-15.0
-10.0
-5.0
0.0
5.0
10.0
15.0
20.0
25.0
30.0
35.0
40.0
45.0
Tra
ck
ing
Err
or
-40.0 -32.0 -24.0 -16.0 -8.0 0.0 8.0 16.0 24.0 32.0 40.0 48.0 56.0
Active Return
Dual Statistics Rolling Ellipses 4 Quarters Rolling Periods From January 1, 2013 To December 31, 2015
8.14

Dodge & Cox Stock Russell 3000 Value Index
40.0
60.0
80.0
100.0
120.0
140.0
160.0
180.0
200.0
220.0
12/10 6/11 12/11 6/12 12/12 6/13 12/13 6/14 12/14 6/15 12/15
168.3
173.5
Growth of $100 5 Years Ending December 31, 2015
Calculation based on monthly periodicity.
8.15

1
Quarter
Year
To
Date
1
Year
2
Years
3
Years
4
Years
5
Years
6
Years
7
Years
8
Years
9
Years
10
Years
Since
Inception
12/31/2015 6.3 0.5 0.5 6.3 14.7 15.2 12.2 13.0 15.0 6.6 6.5 7.4 11.7
09/30/2015 -7.2 -5.4 -0.5 8.2 12.5 16.7 13.3 12.9 9.9 5.4 6.6 6.9 11.6
06/30/2015 0.1 1.9 7.3 15.9 17.7 14.1 17.5 17.2 9.7 6.6 8.0 8.2 11.9
03/31/2015 1.8 1.8 12.4 17.4 16.4 14.0 14.7 20.3 9.4 7.3 7.7 8.4 12.0
12/31/2014 5.2 12.6 12.6 22.6 20.5 15.3 15.6 17.7 7.5 7.2 8.1 7.9 12.0
09/30/2014 0.0 7.0 17.8 19.7 23.1 17.0 15.8 11.7 6.2 7.5 7.8 8.4 12.0
06/30/2014 4.9 6.9 25.2 23.3 16.5 20.2 19.3 10.1 6.5 8.1 8.2 8.2 12.0
03/31/2014 2.0 2.0 22.6 18.5 14.6 15.3 21.9 8.9 6.6 7.2 7.9 7.9 12.0
12/31/2013 10.1 33.6 33.6 24.7 16.2 16.4 18.7 6.7 6.5 7.6 7.4 7.9 12.0
09/30/2013 6.3 21.3 21.6 25.8 16.8 15.3 10.6 4.4 6.1 6.6 7.4 8.1 11.8
06/30/2013 2.7 14.1 21.5 12.3 18.6 17.9 7.2 3.6 5.8 6.3 6.5 7.8 11.7
03/31/2013 11.1 11.1 14.6 10.8 13.0 21.8 6.3 4.1 5.1 6.2 6.3 9.2 11.7
12/31/2012 0.2 16.4 16.4 8.4 11.2 15.3 2.0 2.6 4.3 4.6 5.4 7.7 11.4
09/30/2012 6.2 16.1 30.2 14.4 13.3 8.0 1.3 3.7 4.6 5.8 6.7 8.5 11.5
06/30/2012 -3.1 9.3 3.8 17.2 16.7 4.0 0.4 3.4 4.3 4.8 6.4 5.8 11.4
03/31/2012 12.9 12.9 7.2 12.2 24.3 4.3 2.2 3.6 5.1 5.3 8.6 4.7 11.6
12/31/2011 12.1 1.0 1.0 8.7 14.9 -1.3 0.0 2.5 3.0 4.0 6.8 3.5 11.3
09/30/2011 -15.3 -9.9 0.5 5.6 1.5 -4.9 -0.9 0.9 2.7 4.1 6.3 3.5 11.0
06/30/2011 0.0 6.4 32.4 23.8 4.0 -0.4 3.4 4.4 4.9 6.7 6.0 3.4 11.6
03/31/2011 6.4 6.4 17.4 33.8 3.4 1.0 2.9 4.8 5.1 8.7 4.4 4.1 11.7
12/31/2010 11.6 16.9 16.9 22.5 -2.0 -0.3 2.7 3.3 4.5 7.5 3.8 2.2 11.6
09/30/2010 11.5 4.8 11.0 1.9 -6.6 -1.3 0.9 3.1 4.6 7.1 3.8 0.1 11.3
06/30/2010 -11.3 -6.0 15.7 -7.8 -9.5 -2.8 -0.5 0.9 3.5 3.1 0.6 -0.9 11.0
03/31/2010 5.9 5.9 52.4 -2.9 -4.0 -0.4 2.4 3.2 7.6 2.9 2.8 -0.1 11.6
Historical Rolling Performance
Russell 3000 Index
As of December 31, 2015
Returns for periods greater than one year are annualized.
Returns are expressed as percentages.
8.16

Alpha BetaStandard
Deviation
Downside
Risk
Sharpe
RatioR-Squared
Tracking
Error
Information
Ratio
Treynor
Ratio
Up
Market
Capture
Down
Market
Capture
Dodge & Cox Equity -0.82 1.07 13.18 8.02 0.93 0.94 3.21 0.01 0.11 105.89 112.07
Sands Large Cap Growth 2.20 1.12 15.45 8.55 1.03 0.76 7.76 0.47 0.14 111.01 90.03
GSAM US Small/Mid Cap Growth 0.09 1.07 14.42 8.46 0.91 0.78 6.77 0.13 0.12 103.47 99.25
AB US Large Cap Growth 2.51 1.05 13.43 7.23 1.14 0.88 4.73 0.66 0.15 106.34 85.35
IM U.S. Growth Equity Median -0.64 1.07 13.93 8.10 0.88 0.85 5.66 0.04 0.12 101.76 99.74
Russell 3000 Index 0.00 1.00 11.97 6.87 1.02 1.00 0.00 N/A 0.12 100.00 100.00
90 Day U.S. Treasury Bill 0.06 0.00 0.03 0.01 N/A 0.09 11.98 -1.02 0.00 0.12 -0.25
Historical Statistics 5 Years Ending December 31, 2015
Calculation based on monthly periodicity.
8.17

0.0
2.0
4.0
6.0
8.0
-2.0
-4.0
-6.0
1.0 0.9
1.5 1.5
-2.3 -2.3
3.6
1.3
-1.1
-0.5
0.7 0.6
2.0
5.0
5.4
2.4
Fidelity Adv Mid Cp;A Fidelity Adv Lev Co;A Fidelity Adv Eq Gro;A Russell 3000 Growth Index
Tracking Error 2.0 5.0 5.4 2.4¢
Information Ratio -1.1 -0.5 0.7 0.6¢
Active Return -2.3 -2.3 3.6 1.3¢
Sharpe Ratio 1.0 0.9 1.5 1.5¢
Historical Statistics 3 Years Ending December 31, 2015
Calculation based on monthly periodicity.
8.18

Percentile
3
Years
Return
5
Years
Return
3
Years
Standard
Deviation
5
Years
Standard
Deviation
3
Years
Sharpe
Ratio
5
Years
Sharpe
Ratio
10th Eaton Vance AC
SMID-Cap Fund (1)
20th
30th Domestic Equity
Composite (30)
TD Bank (21) Eaton Vance AC
SMID-Cap Fund (26)
40th Index Fund (34)
Eaton Vance AC
SMID-Cap Fund (36)
BlackRock Equity
Index Fund (36)
Domestic Equity
Composite (38)
Domestic Equity
Composite (38)
BlackRock Equity
Index Fund (36)
Composite (31)
BlackRock Equity
Index Fund (40)
50th T. Rowe Price Large
Cap Value (43)
BlackRock Equity
Index Fund (48)
60th BlackRock Equity
Index Fund (51)
T. Rowe Price Large
Cap Value (58)
Domestic Equity
Composite (53)
70th Composite (62)
Cap Growth (68)
T. Rowe Price Large
Cap Value (68)
Cap Growth (62)
T. Rowe Price Large
Cap Value (62)
TD Bank (62)
T. Rowe Price Large
Cap Growth (63)
T. Rowe Price Large
Cap Value (66)
T. Rowe Price Large
Cap Value (66)
80th T. Rowe Price Large
Cap Growth (79)
Cap Growth (71)
Eaton Vance AC
SMID-Cap Fund (76)
T. Rowe Price Large
Cap Growth (74)
90th
100th TD Bank (94) TD Bank (96) Eaton Vance AC
SMID-Cap Fund (100)
Eaton Vance AC
SMID-Cap Fund (100)
TD Bank (97) TD Bank (96)
Manager Rankings vs. Peers As of December 31, 2015
8.19

1
Year
3
Years
5
Years
7
Years
10
Years
Return -4.5 14.0 11.6 14.5 5.7
Standard Deviation 14.8 11.7 13.4 17.1 17.6
Downside Risk 10.4 6.6 8.2 10.6 12.6
vs. Russell 1000 Value Index
Tracking Error 3.4 3.3 3.1 3.5 4.1
Information Ratio -0.1 0.3 0.2 0.4 0.0
Alpha 0.2 0.3 -0.4 0.6 -0.7
Beta 1.2 1.1 1.1 1.1 1.1
R-Squared 1.0 0.9 1.0 1.0 1.0
Consistency 50.0 58.3 51.7 54.8 50.0
Active Return -0.4 0.9 0.5 1.5 -0.1
vs. Russell 3000 Index
Tracking Error 3.9 3.5 3.3 3.9 4.1
Information Ratio -1.2 -0.1 -0.1 0.0 -0.3
Alpha -4.8 -1.3 -1.3 -2.0 -2.1
Beta 1.1 1.1 1.1 1.1 1.1
R-Squared 0.9 0.9 0.9 1.0 1.0
Consistency 33.3 52.8 53.3 52.4 49.2
Active Return -4.8 -0.5 -0.3 -0.1 -1.2
vs. 90 Day U.S. Treasury Bill
Sharpe Ratio -0.2 1.2 0.9 0.9 0.3
MPT Stats
Dodge & Cox Stock (DODGX)
As of December 31, 2015
Calculation based on monthly periodicity.
8.20

3
Years
Return
5
Years
Return
3
Years
Sharpe
Ratio
5
Years
Sharpe
Ratio
3
Years
Tracking
Error
5
Years
Tracking
Error
Since
Inception
Return
Since
Inception
Tracking
Error
Inception
Date
Dodge & Cox Equity 14.3 12.0 1.3 0.9 3.2 3.1 11.9 4.6 03/01/1993
Russell 1000 Value Index 13.1 11.3 1.3 0.9 0.0 0.0 9.6 0.0
IM US Large Cap Growth Equity Median 16.8 13.0 1.7 1.0 5.5 5.7 10.0 10.0
Dodge & Cox Equity Rank 81 69 91 76 96 100 11 100
Russell 1000 Value Index Rank 90 81 91 75 - - 71 -
Sands Large Cap Growth 17.5 15.8 1.3 1.0 7.7 7.6 12.7 7.5 04/01/1992
Russell 1000 Growth Index 16.8 13.5 1.9 1.1 0.0 0.0 8.5 0.0
IM US Large Cap Growth Equity Median 16.8 13.0 1.7 1.0 3.1 3.5 10.1 7.4
Sands Large Cap Growth Rank 38 7 90 53 3 5 7 48
Russell 1000 Growth Index Rank 48 42 23 26 - - 96 -
GSAM US Small/Mid Cap Growth 15.5 12.8 1.3 0.8 3.6 3.7 11.6 4.7 07/01/2005
Russell 2500 Growth Index 14.5 11.4 1.1 0.7 0.0 0.0 9.0 0.0
IM U.S. SMID Cap Growth Equity (SA+CF) Median 13.8 11.4 1.1 0.7 4.1 4.3 9.4 5.6
GSAM US Small/Mid Cap Growth Rank 22 17 11 26 64 69 15 67
Russell 2500 Growth Index Rank 36 50 44 50 - - 61 -
AB US Large Cap Growth 21.3 15.5 2.1 1.0 2.6 3.7 12.5 5.0 01/01/1985
Russell 1000 Growth Index 16.8 13.5 1.9 1.1 0.0 0.0 10.6 0.0
IM US Large Cap Growth Equity Median 16.8 13.0 1.7 1.0 3.1 3.5 10.1 7.4
AB US Large Cap Growth Rank 5 12 5 35 68 46 8 87
Russell 1000 Growth Index Rank 48 42 23 26 - - 32 -
Multi Timeperiod Statistics As of December 31, 2015
8.21

January February March April May June July August September October November December Year
2013 6.2 0.7 4.5 1.9 3.1 0.1 5.4 -2.8 4.4 4.3 4.3 2.8 40.5
2014 -3.3 4.5 1.3 -0.5 2.0 2.9 -0.9 3.1 -1.2 -0.1 2.5 -0.1 10.4
2015 -5.5 6.3 -1.7 2.7 1.3 -1.4 1.1 -7.0 -4.2 7.9 -0.5 -2.6 -4.5
Distribution of Returns
0
1
2
3
4
5
6
Fre
qu
en
cy
< -5 -5 To -4 -4 To -3 -3 To -2 -2 To -1 -1 To 0 0 To 1 1 To 2 2 To 3 3 To 4 4 To 5 > 5
Returns (%)
2
1 1
2
3
5
2
4
5
2
5
4
Performance Distribution
Dodge & Cox Stock (DODGX)
3 Years Ending December 31, 2015
8.22

Dodge & Cox Income (DODIX) PIMCO:Tot Rtn;Inst (PTTRX) GMO:Core Plus Bond;III (GUGAX) UBS Core Plus Bond;A (BNBDX)
0.6
0.7
0.8
0.9
1.0
1.1
1.2
1.3
12/05 9/06 6/07 3/08 12/08 9/09 6/10 3/11 12/11 9/12 6/13 3/14 12/14 12/15
0.8
1.0
1.1
1.0
Ratio of Cumulative Wealth 10 Years Ending December 31, 2015
Calculation based on monthly periodicity.
8.23

Cumulative Annualized Over/Under Relative Performance Cumulative Excess Relative Performance Over/Under Performance
0.0
2.0
4.0
6.0
8.0
10.0
-2.0
-4.0
-6.0
Re
lati
ve
Pe
rfo
rma
nc
e in
Pe
rce
nt
1/13 4/13 7/13 10/13 1/14 4/14 7/14 10/14 1/15 4/15 7/15 10/15 12/15
Quarterly Return Periods
2.5
0.8
Relative Performance
Dodge & Cox Stock (DODGX) vs. Russell 1000 Value Index
3 Years Ending December 31, 2015
Calculation based on monthly periodicity.
8.24

Cumulative Return Contributions
0.0% 2.0%-2.0 %-4.0 %
Cash Flow
TD Bank
T. Rowe Price Large Cap Value
T. Rowe Price Large Cap Growth
Eaton Vance AC SMID-Cap Fund
BlackRock Equity Index Fund
Domestic Equity Composite
Risk Contributions
0.0% 50.0% 100.0% 150.0%
Cash Flow
TD Bank
T. Rowe Price Large Cap Value
T. Rowe Price Large Cap Growth
Eaton Vance AC SMID-Cap Fund
BlackRock Equity Index Fund
Domestic Equity Composite
Cumulative Return and Risk Contributions
Cumulative Return Contributions Risk Contributions
0.0% 100.0% 200.0%-100.0 %-200.0 %
Risk Contributions
0.0% 2.0% 4.0%-2.0 %-4.0 %
Cumulative Return Contributions
Cash Flow
TD Bank
T. Rowe Price Large Cap Value
T. Rowe Price Large Cap Growth
Eaton Vance AC SMID-Cap Fund
BlackRock Equity Index Fund
Domestic Equity Composite
Cumulative Return Contributions History
Domestic Equity Composite BlackRock Equity Index Fund
Eaton Vance AC SMID-Cap Fund T. Rowe Price Large Cap Growth
T. Rowe Price Large Cap Value TD Bank
Cash Flow
-12.0 %
-8.0 %
-4.0 %
0.0%
4.0%
8.0%
1/15 4/15 7/15 10/15 12/15
Return and Risk Contribution
Domestic Equity Composite
1 Year Ending December 31, 2015
8.25

JP Morgan:Intl Eq;Sel Templeton Foreign;A T Rowe Price Int:St;Sh
UBS Intl Equity;Y MSCI EAFE Index 90 Day U.S. Treasury Bill
0.4
0.8
1.2
1.6
2.0
2.4
2.8
3.2
3.6
4.0
4.4
Ret
urn
(%)
-6.0 -3.0 0.0 3.0 6.0 9.0 12.0 15.0 18.0 21.0 24.0 27.0
Risk (Standard Deviation %)
UBS Intl Equity;Y
T Rowe Price Int:St;Sh
Templeton Foreign;A
JP Morgan:Intl Eq;Sel
Risk and Return
10 Years Ending December 31, 2015
Sample Client
Calculation based on monthly periodicity.
8.26

International Composite MSCI EAFE Index Fixed Income Composite Fixed Income Benchmark
Domestic Equity Composite Domestic Equity Benchmark Private Equity Composite S&P 500 + 5%
Total Fund Composite Total Fund Benchmark
-9.0
-6.0
-3.0
0.0
3.0
6.0
9.0
12.0
15.0
18.0
Re
turn
(%)
-2.0 0.0 2.0 4.0 6.0 8.0 10.0 12.0 14.0 16.0 18.0 20.0
Risk (Standard Deviation %)
Total Fund Benchmark
Total Fund Composite
S&P 500 + 5%
Private Equity Composite
Domestic Equity Benchmark
Domestic Equity Composite
Fixed Income Benchmark
Fixed Income Composite MSCI EAFE Index
International Composite
Risk and Return Scattergram 1 Year Ending December 31, 2015
Calculation based on monthly periodicity.
8.27

Client Inception 3 Years Rolling Average of Active Return
-0.4
0.0
0.4
0.8
1.2
1.6
2.0
2.4
2.8
3.2
3.6
4.0
8/96 8/97 8/98 8/99 8/00 8/01 8/02 8/03 8/04 8/05 8/06 8/07 8/08 8/09 8/10 8/11 8/12 8/13 8/14 12/15
E(alpha)
E(alpha) + Standard Deviation
E(alpha) - Standard Deviation
1
Quarter2015
1
Year
2
Years
3
Years
4
Years
5
Years
6
Years
7
Years
Since
Inception
Inception
Date
PIMCO Total Return 0.5 0.7 0.7 2.7 2.5 4.4 4.4 5.1 6.3 6.6 09/01/1993
Blmbg. Barc. U.S. Aggregate -0.6 0.5 0.5 3.2 1.4 2.1 3.2 3.8 4.1 5.4
Rolling Active Return & Comparative Performance As of December 31, 2015
8.28

Rolling 3 Years Performance
Rolling 3 Years Active Return Quarterly Active Return
0.0
4.0
8.0
-4.0
-8.0
Act
ive
R
etu
rn (%
)
3/09 9/09 3/10 9/10 3/11 9/11 3/12 9/12 3/13 9/13 3/14 9/14 3/15 12/15
Rolling 3 Years Tracking Error
2.0
2.5
3.0
3.5
4.0
4.5
5.0
Tra
ckin
g E
rro
r
(%)
12/11 6/12 12/12 6/13 12/13 6/14 12/14 6/15 12/15
Rolling 3 Years Information Ratio
-0.4
0.0
0.4
0.8
1.2
1.6
Info
rmat
ion
Rat
io (%
)
12/11 6/12 12/12 6/13 12/13 6/14 12/14 6/15 12/15
Rolling Active Return, Tracking Error & Information Ratio
PIMCO Total Return vs. Blmbg. Barc. U.S. Aggregate
7 Years Ending December 31, 2015
8.29

Rolling 3 Years Cumulative Anualized Geometric Average Rolling 3 Years Over/Under Relative Performance
0.0
3.0
6.0
9.0
12.0
-3.0
-6.0
-9.0
-12.0
Re
turn
(%)
12/08 6/09 12/09 6/10 12/10 6/11 12/11 6/12 12/12 6/13 12/13 6/14 12/14 6/15 12/15
Rolling Cumulative Over/Under Performance
Alpha Tilts Fund A vs. S&P 500
10 Years Ending December 31, 2015
8.30

Russell 1000 Growth Index Outperformed Russell 1000 Value Index Outperformed
0.0%
8.0%
16.0%
24.0%
32.0%
-8.0 %
-16.0 %
-24.0 %
-32.0 %
3/96 3/97 3/98 3/99 3/00 3/01 3/02 3/03 3/04 3/05 3/06 3/07 3/08 3/09 3/10 3/11 3/12 3/13 3/14 12/15
Rolling Excess Performance
Russell 1000 Growth Index vs. Russell 1000 Value Index
12 Quarters Rolling Periods From January 1, 1996 To December 31, 2015
8.31

Dec-2004 Dec-2005 Dec-2006 Dec-2007 Dec-2008 Dec-2009 Dec-2010 Dec-2011 Dec-2012 Dec-2013 Dec-2014 Dec-2015
Return 4.2 16.1 12.0 8.5 -9.3 -7.1 -4.0 13.4 11.7 18.7 22.1 15.5
Standard Deviation 15.0 9.0 7.2 8.1 15.3 19.6 22.1 19.1 16.0 12.5 9.8 10.8
Downside Risk 10.6 3.6 3.8 4.9 14.1 16.1 17.2 12.0 9.8 6.9 5.1 5.6
Kurtosis 3.5 2.9 2.5 2.3 6.2 3.4 2.6 2.4 2.7 4.0 3.4 2.6
Maximum Drawdown -28.0 -4.7 -4.7 -6.4 -41.4 -51.4 -48.1 -18.4 -15.2 -15.2 -6.6 -9.0
Best Quarter 15.6 15.6 10.2 8.5 8.5 25.0 25.0 25.0 16.2 16.2 16.2 11.7
Worst Quarter -17.1 -2.5 -2.5 -5.5 -30.8 -30.8 -30.8 -13.7 -13.7 -13.2 -3.3 -6.9
Upside Semi Deviation 13.8 11.2 8.2 8.5 8.4 15.1 18.7 19.3 16.5 13.7 12.1 12.8
Downside Semi Deviation 16.9 1.9 2.1 8.4 21.9 24.2 25.8 20.0 16.3 3.8 2.8 9.2
vs. S&P 500
Alpha 0.5 1.7 1.1 -0.4 -1.0 -1.5 -1.1 -0.8 0.3 1.6 0.0 0.0
Beta 1.0 1.0 1.0 1.0 1.0 1.0 1.0 1.0 1.1 1.0 1.1 1.0
R-Squared 1.0 1.0 1.0 1.0 1.0 1.0 1.0 1.0 1.0 1.0 1.0 1.0
Tracking Error 1.6 1.3 1.5 1.6 1.8 1.6 1.8 1.7 2.2 1.8 1.8 1.5
Information Ratio 0.4 1.1 1.0 0.0 -0.6 -1.0 -0.6 -0.3 0.4 1.2 0.8 0.2
Up Market Capture 101.6 104.5 108.4 103.0 100.1 98.3 99.5 99.9 105.0 107.1 106.7 101.9
Down Market Capture 98.8 92.3 98.4 107.1 104.7 103.9 103.1 102.5 102.7 96.2 103.2 101.4
Jensen Alpha 0.6 1.7 1.2 -0.3 -0.9 -1.5 -1.1 -0.8 0.3 1.6 0.0 0.0
Jensens Beta 1.0 1.0 1.0 1.0 1.0 1.0 1.0 1.0 1.1 1.0 1.1 1.0
vs. Russell 1000 Index
Alpha -0.1 1.0 0.9 -0.7 -0.9 -2.0 -1.7 -1.2 0.3 1.9 0.2 0.1
Beta 1.0 1.0 1.0 1.0 1.0 1.0 1.0 1.0 1.0 1.0 1.1 1.0
R-Squared 1.0 1.0 1.0 1.0 1.0 1.0 1.0 1.0 1.0 1.0 1.0 1.0
Tracking Error 1.6 1.2 1.4 1.6 1.7 1.4 1.7 1.8 2.2 1.8 1.8 1.4
Information Ratio 0.0 0.4 0.7 -0.3 -0.5 -1.4 -1.0 -0.7 0.3 1.2 0.7 0.3
Up Market Capture 99.7 100.1 104.6 100.3 97.2 94.6 95.7 97.2 102.5 105.5 105.8 102.3
Down Market Capture 100.1 92.4 97.0 107.1 101.6 101.8 101.0 100.8 100.3 93.8 102.5 101.3
Jensen Alpha -0.1 0.9 0.9 -0.6 -1.0 -2.0 -1.7 -1.2 0.3 1.9 0.2 0.1
Jensens Beta 1.0 1.0 1.0 1.0 1.0 1.0 1.0 1.0 1.0 1.0 1.1 1.0
Rolling MPT Stats
Alpha Tilts Fund A
36 Months Rolling Periods As of December 31, 2015
Calculation based on monthly periodicity.
8.32

Return
Alpha Tilts Fund A Russell 3000 Alpha Tilts Fd A Probationary Band
-15.0
0.0
15.0
30.0
45.0
3/11 6/11 9/11 12/11 3/12 6/12 9/12 12/12 3/13 6/13 9/13 12/13 3/14 6/14 9/14 12/14 3/15 6/15 9/15 12/15
Information Ratio
Alpha Tilts Fund A Russell 3000 Alpha Tilts Fd A
-1.6
-0.8
0.0
0.8
1.6
2.4
3/11 9/11 3/12 9/12 3/13 9/13 3/14 9/14 3/15 12/15
Jensen Alpha
Alpha Tilts Fund A Russell 3000 Alpha Tilts Fd A
-4.0
-2.0
0.0
2.0
4.0
3/11 9/11 3/12 9/12 3/13 9/13 3/14 9/14 3/15 12/15
Rolling MPT Stats Chart
Versus. S&P 500
12 Quarters Rolling Periods As of December 31, 2015
8.33

Rolling 1 Year Cumulative Over/Under Relative Performance Over/Under Relative Performance
0.0
2.0
4.0
-2.0
-4.0
-6.0
-8.0
-10.0
-12.0
-14.0
Re
turn
(%)
3/11 6/11 9/11 12/11 3/12 6/12 9/12 12/12 3/13 6/13 9/13 12/13 3/14 6/14 9/14 12/14 3/15 6/15 9/15 12/15
-1.7
-0.1
0.5
-1.4
-0.6-0.9
-1.5
-0.3
-2.7
-7.2
-0.7
0.1 0.1
-1.0
0.7
0.20.7
-1.7
-0.8
-2.8
Rolling Relative Performance
TD Bank vs. S&P 500
5 Years Ending December 31, 2015
8.34

Mar-2006 Dec-2015
-25.0
-20.0
-15.0
-10.0
-5.0
0.0
5.0
10.0
15.0
20.0
25.0
30.0
35.0
Re
turn
(%)
2.0 4.0 6.0 8.0 10.0 12.0 14.0 16.0 18.0 20.0 22.0 24.0 26.0 28.0
Risk (Standard Deviation %)
Rolling Risk Return
Alpha Tilts Fund A
12 Quarters Rolling Periods From January 1, 2006 To December 31, 2015
8.35

Mar-2006 Dec-2015
-3.6
-3.0
-2.4
-1.8
-1.2
-0.6
0.0
0.6
1.2
1.8
2.4
3.0
3.6
Ac
tiv
e
Re
turn
(%)
0.8 1.0 1.2 1.4 1.6 1.8 2.0 2.2 2.4 2.6 2.8 3.0
Tracking Error (%)
Rolling Risk Return
Alpha Tilts Fund A vs. S&P 500
12 Quarters Rolling Periods From January 1, 2006 To December 31, 2015
8.36

Fund Name
Return
behind
index
(3 of 5
most
recent Qts)
Return
Rank
in the
bottom half
(3 of 5
most
recent Qts)
3 Yr Return
behind
index
5 Yr Return
behind
index
3 Yr Rolling
Return
in the
bottom
quartile
SR GT
Index
Negative 3
Yr
Sharpe
Ratio
Firm
Criteria
Strategy
Criteria
Characteris
tics
Criteria
Above
Average
Expense
Ratio
Recommen
dations
Dodge & Cox Stock (DODGX) ✔ ✔ ✖ ✖ ✖ ✖ ✖ ¢ ¢ ¢ ✖ ✖
Dodge & Cox Intl Stock (DODFX) ✔ ✔ ✔ ✔ ✖ ✖ ✖ ¢ ¢ ¢ ✖ ✖
Dodge & Cox Global Stock (DODWX) ✔ ✖ ✖ ✖ ✖ ✔ ✖ ¢ ¢ ¢ ✖ ✖
Score Card As of December 31, 2015
8.37

Total Fund Performance
0.0% 10.0% 20.0%-10.0 %-20.0 %
Total Fund
Total Fund Benchmark
Total Value Added
4.9%
12.8%
-7.9 %
Total Value Added:-7.9 %
0.0% 10.0% 20.0%-10.0 %-20.0 %
Other
Manager Value Added
Asset Allocation
6.8%
-10.9 %
-3.8 %
Total Asset Allocation:-3.8 %
Average Active Weight
0.0% 50.0%-50.0 %
Private Equity Composite
Fixed Income Composite
International Composite
Domestic Equity Composite
-34.1 %
15.1%
-1.7 %
20.6%
Asset Allocation Value Added
0.0% 1.5%-1.5 %-3.0 %-4.5 %
-2.5 %
-1.7 %
0.1%
0.2%
Total Manager Value Added:-10.9 %
Manager Value Added
0.0% 6.0%-6.0 %-12.0 %-18.0 %
-10.7 %
0.3%
0.0%
-0.5 %
Total Fund Attribution
Total Fund Composite vs. Total Fund Benchmark
3 Years Ending December 31, 2015
8.38

Performance Attribution
0.00% 0.44% 0.88% 1.32%-0.44 %-0.88 %-1.32 %-1.76 %
Manager's Skill
Style Selection
Tactical Asset Allocation
Strategic Asset Allocation
Investment Pool Performance
-1.24 %
0.00%
-0.15 %
0.63%
-0.77 %
SAA: 0.63%
0.00% 0.30% 0.60%-0.30 %
International Composite
Fixed Income Composite
Domestic Equity Composite
-0.03 %
0.36%
0.29%
TAA: -0.15 %
-0.14 % -0.07 % 0.00%
-0.04 %
0.00%
-0.11 %
SS: 0.00%
0.00% 0.04%-0.04 %-0.08 %
0.01%
0.01%
-0.03 %
Mgr Skill: -1.24 %
0.00% 1.50%-1.50 %-3.00 %
0.12%
-0.03 %
-1.33 %
Total Fund Attribution - IDP
Total Plan without PE vs. Total Fund Benchmark wo PE
1 Year Ending December 31, 2015
8.39

Over Performance Under Performance Mar-2006 Dec-2015
-20.0
-15.0
-10.0
-5.0
0.0
5.0
10.0
15.0
20.0
25.0
30.0
T R
ow
e P
ric
e E
q In
c (P
RF
DX
)
(%)
-20.0 -15.0 -10.0 -5.0 0.0 5.0 10.0 15.0 20.0 25.0 30.0
S&P 500 (%)
Over
Performance
Under
Performance
Under/Over Performance
T Rowe Price Eq Inc (PRFDX) vs. S&P 500
12 Quarters Rolling Periods From January 1, 2006 To December 31, 2015
8.40

Up Market Capture
Eaton Vance SmCp Val;A Eaton Vance TM SCV;A
0.0
50.0
100.0
150.0
Up
Mar
ket
C
aptu
re R
atio
(%)
1
Year
3
Years
5
Years
7
Years
10
Years
2014 2013 2012 2011 2010
83.7
94.586.9 84.6 85.4 86.6
104.9
53.2
100.9
80.771.9
85.2 83.0 82.3 83.779.6
94.9
62.6
99.4
78.0
Down Market Capture
Eaton Vance SmCp Val;A Eaton Vance TM SCV;A
0.0
50.0
100.0
150.0
Do
wn
Mar
ket
C
aptu
re R
atio
(%)
1
Year
3
Years
5
Years
7
Years
10
Years
2014 2013 2012 2011 2010
87.3 85.179.1 77.6 78.4 81.8
88.1
64.674.1
85.283.3 85.0 84.2 80.5 81.8 80.3
112.1
76.085.7 82.1
Market Capture Ratio
Versus Russell 2000 Value Index
As of December 31, 2015
8.41

Portfolio Behind
Months Benchmark Down(7)
Portfolio AheadFull Period Return
Months Benchmark Up(5)
Portfolio BehindPortfolio Ahead
Portfolio BenchmarkNo.
Months
Average
Ahead
No.
Months
Average
Behind
No.
Months
Average
Ahead
No.
Months
Average
Behind
Fidelity Intl Discvry 4.8 3.4 2 0.8 3 -1.3 6 0.6 1 0.0
Fidelity Aggr Intl Fd 3.1 3.4 2 0.4 3 -1.6 5 0.9 2 -0.5
Fidelity Dvsd Intl 3.1 3.4 2 0.7 3 -1.2 4 0.9 3 -0.6
Fidelity Intl Discvry Fidelity Aggr Intl Fd Fidelity Dvsd Intl
72.0
80.0
88.0
96.0
104.0
112.0
Up
Mar
ket
C
aptu
re R
atio
(%)
72.0 75.0 78.0 81.0 84.0 87.0 90.0 93.0 96.0 99.0 102.0 105.0
Down Market Capture Ratio (%)
Up Down Market Bar Chart
Fidelity Intl Discvry Fidelity Aggr Intl Fd Fidelity Dvsd Intl S&P/Citigroup EPAC BMI Growth
0.0
3.0
6.0
-3.0
-6.0
Ave
rag
e
Ret
urn
(%)
5 Up Months 7 Down Months
4.0
-2.3
3.6
-2.0
3.2
-1.8
3.6
-1.8
Up/Down Markets
Versus S&P/Citigroup EPAC BMI Growth
1 Year Ending December 31, 2015
Calculation based on monthly periodicity.
8.42

Standard Deviation vs Tracking Error
TD Bank BlackRock Equity Index Fund T. Rowe Price Large Cap Growth
Eaton Vance AC SMID-Cap Fund T. Rowe Price Large Cap Value
0.0
1.5
3.0
4.5
6.0
7.5
9.0
10.5
Tra
ck
ing
Err
or
(%
)
9.8 10.5 11.2 11.9 12.6 13.3 14.0 14.7 15.4 16.1 16.8
Standard Deviation (%)
T. Rowe Price Large Cap Value
Eaton Vance AC SMID-Cap Fund
T. Rowe Price Large Cap Growth
BlackRock Equity Index Fund
TD Bank
XY Scattergraph 3 Years Ending December 31, 2015
8.43

Investment Style Exposure
Dodge & Cox Stock (DODGX) Vanguard PRIMECAP;Inv (VPMCX) Fidelity Gro & Inc (FGRIX)
0.0% 20.0% 40.0% 60.0% 80.0% 100.0% 120.0%
Russell 1000 Growth Index
Russell 1000 Value Index
Russell 2000 Growth Index
Russell 2000 Value Index
4.7%
83.0%
1.2%
11.1%
54.4%
16.0%
21.3%
8.3%
33.3%
59.7%
0.0%
7.0%
Style Analysis As of December 31, 2015
8.44

Cumulative Selection Return(36 Months)
Dodge & Cox Stock (DODGX) Vanguard PRIMECAP;Inv (VPMCX) Fidelity Gro & Inc (FGRIX)
-40.0 %
-20.0 %
0.0%
20.0%
40.0%
60.0%
80.0%
100.0%
2/89 8/90 2/92 8/93 2/95 8/96 2/98 8/99 2/01 8/02 2/04 8/05 2/07 8/08 2/10 8/11 2/13 8/14 12/15
-27.8 %
74.5%
24.8%
Style Analysis As of December 31, 2015
8.45

Style Map(36 Months)
Dodge & Cox Stock (DODGX) Vanguard PRIMECAP;Inv (VPMCX) Fidelity Gro & Inc (FGRIX)
Ca
pit
ali
za
tio
n
Manager Style
Large Cap Value
Small Cap Value Small Cap Growth
Large Cap Growth
Fidelity Gro & Inc (FGRIX)
Vanguard PRIMECAP;Inv (VPMCX)
Dodge & Cox Stock (DODGX)
Style Analysis As of December 31, 2015
8.46

Style Map(36 Months)
Dodge & Cox Stock (DODGX) Vanguard PRIMECAP;Inv (VPMCX) Fidelity Gro & Inc (FGRIX)
Ca
pit
ali
za
tio
n
Manager Style
Large Cap Growth
Small Cap GrowthSmall Cap Value
Large Cap Value
Style Analysis As of December 31, 2015
8.47

Historical Performance-Average Returns(36 Months)
Dodge & Cox Stock (DODGX) Vanguard PRIMECAP;Inv (VPMCX) Fidelity Gro & Inc (FGRIX)
0.0 2.0 4.0 6.0 8.0 10.0 12.0 14.0 16.0 18.0-2.0-4.0-6.0
Style
Selection
Total
11.3
0.9
12.2
11.0
2.8
13.7
10.8
-1.0
9.8
Style Analysis As of December 31, 2015
8.48

Historical Performance-Risk(Std. Dev.)(36 Months)
Dodge & Cox Stock (DODGX) Vanguard PRIMECAP;Inv (VPMCX) Fidelity Gro & Inc (FGRIX)
0.0 2.0 4.0 6.0 8.0 10.0 12.0 14.0 16.0 18.0 20.0 22.0
Style
Selection
Total
14.2
4.5
15.3
16.3
5.6
16.6
14.5
4.2
14.4
Style Analysis As of December 31, 2015
8.49

Historical Performance-Information Ratio(36 Months)
Dodge & Cox Stock (DODGX) Vanguard PRIMECAP;Inv (VPMCX) Fidelity Gro & Inc (FGRIX)
0.0 0.2 0.4 0.6 0.8 1.0 1.2 1.4-0.2-0.4-0.6
Style
Selection
Total
0.8
0.2
0.8
0.7
0.5
0.8
0.7
-0.2
0.7
Style Analysis As of December 31, 2015
8.50

Investment Style Exposure
Dodge & Cox Stock
0.0% 50.0% 100.0%
Russell 1000 Growth Index
Russell 1000 Value Index
Russell 2000 Growth Index
Russell 2000 Value Index
Style Map(ppp)
Style History Dec-2015 Average Style Exposure
Ca
pit
aliz
ati
on
Manager Style
Large Cap Growth
Small Cap GrowthSmall Cap Value
Large Cap Value
Style History(ppp)
Russell 1000 Growth Index Russell 1000 Value Index
Russell 2000 Growth Index Russell 2000 Value Index
0.0
25.0
50.0
75.0
100.0
2/09 11/09 8/10 5/11 2/12 11/12 8/13 5/14 2/15 12/15
Return Variance
Selection
4.3%
Style
95.7%
Style Analysis
Dodge & Cox Stock
December 31, 2015
8.51

2001 2002 2003 2004 2005 2006 2007 2008 2009 2010 2011 2012 2013 2014 2015
Best14.0 10.3 56.3 26.0 34.5 32.6 39.8 5.2 79.0 29.1 14.3 18.6 43.3 13.5 13.3
58.4 6.7 48.5 22.2 20.1 26.9 15.8 1.3 57.5 26.9 7.8 18.1 38.8 13.2 5.7
7.3 1.7 47.3 20.7 14.0 23.5 11.8 -6.5 37.2 24.5 4.4 17.9 34.5 13.1 0.9
4.5 1.0 46.0 18.3 7.5 22.2 11.6 -21.4 34.5 19.2 2.6 17.5 33.5 11.8 0.5
3.7 -1.9 39.2 16.5 7.1 18.4 10.3 -26.4 32.5 16.7 1.5 16.4 33.1 6.0 0.0
2.8 -6.0 30.0 14.5 6.3 16.6 7.0 -28.9 28.4 16.1 0.4 16.3 32.5 5.6 -0.3
2.5 -11.4 29.9 14.3 5.3 15.5 7.0 -33.8 27.2 15.5 0.0 15.6 23.3 4.9 -0.4
-2.4 -15.5 29.7 11.4 4.7 13.3 5.8 -36.8 20.6 15.2 -2.9 15.3 11.0 4.2 -1.4
-5.6 -15.7 28.1 10.9 4.6 11.8 4.6 -37.6 19.7 13.1 -4.2 14.6 9.0 3.4 -3.8
-9.2 -20.5 11.6 6.9 4.2 10.4 2.2 -38.4 11.5 8.2 -5.5 10.5 7.4 2.5 -4.4
-12.5 -21.7 9.0 6.3 3.0 9.1 -0.2 -38.5 5.9 6.5 -5.7 4.8 0.0 0.0 -4.6
6-20.4 -27.9 4.1 4.3 2.7 4.8 -1.6 -43.1 0.1 5.7 -11.7 4.2 -2.0 -1.8 -7.5
Worst-21.2 -30.3 1.0 1.2 2.4 4.3 -9.8 -53.2 -16.8 0.1 -18.2 0.0 -2.3 -4.5 -14.6
Small Cap
Value
R2000V
Small Cap
Growth
R2000G
Small Cap
Core
R2000
Large Cap
Value
R1000V
Large Cap
Growth
R1000G
Large Cap
Core
R1000
MSCI
Emerging
Markets
Index
MSCI
EAFE
Index
Real
Estate
NCREIF
HFRI Fund
of Funds
Composite
Index
Barclays
Capital
Aggregate
Citigroup
1 Month T-
Bill
High Yield
ML High
Yield
Master
Annual Asset Class Performance As of December 31, 2015
8.52
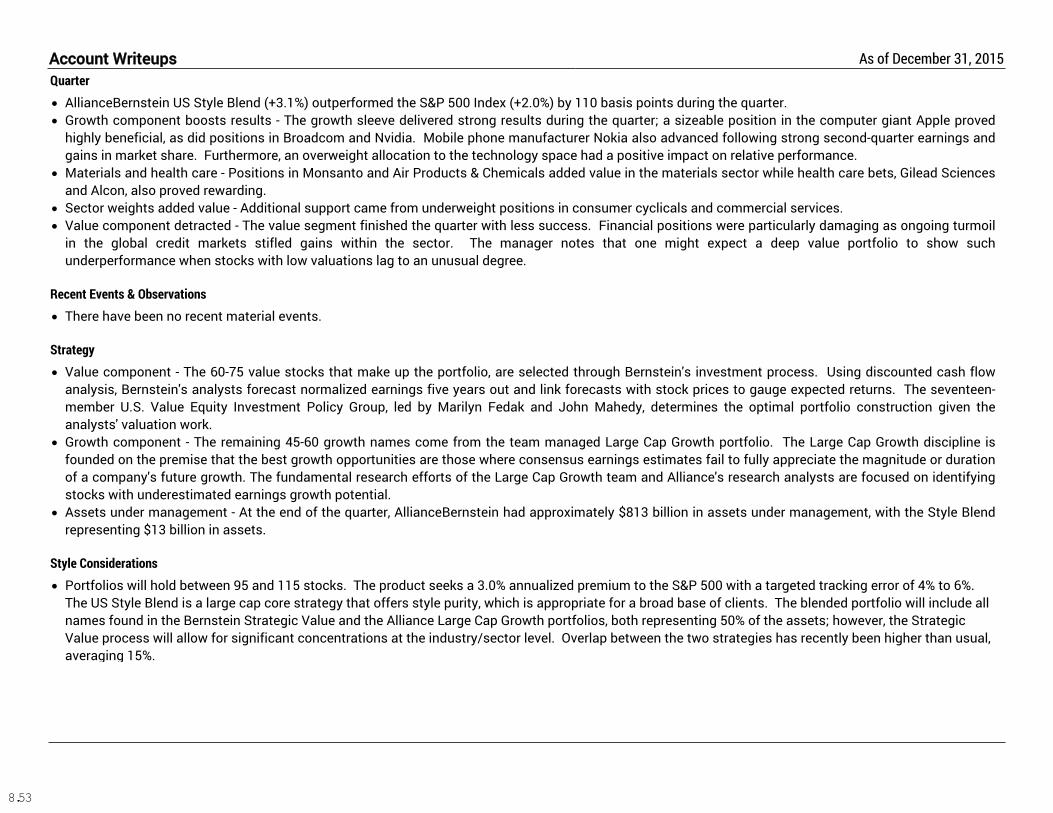
Quarter
· AllianceBernstein US Style Blend (+3.1%) outperformed the S&P 500 Index (+2.0%) by 110 basis points during the quarter.
· Growth component boosts results - The growth sleeve delivered strong results during the quarter; a sizeable position in the computer giant Apple proved
highly beneficial, as did positions in Broadcom and Nvidia. Mobile phone manufacturer Nokia also advanced following strong second-quarter earnings and
gains in market share. Furthermore, an overweight allocation to the technology space had a positive impact on relative performance.
· Materials and health care - Positions in Monsanto and Air Products & Chemicals added value in the materials sector while health care bets, Gilead Sciences
and Alcon, also proved rewarding.
· Sector weights added value - Additional support came from underweight positions in consumer cyclicals and commercial services.
· Value component detracted - The value segment finished the quarter with less success. Financial positions were particularly damaging as ongoing turmoil
in the global credit markets stifled gains within the sector. The manager notes that one might expect a deep value portfolio to show such
underperformance when stocks with low valuations lag to an unusual degree.
Recent Events & Observations
· There have been no recent material events.
Strategy
· Value component - The 60-75 value stocks that make up the portfolio, are selected through Bernstein's investment process. Using discounted cash flow
analysis, Bernstein's analysts forecast normalized earnings five years out and link forecasts with stock prices to gauge expected returns. The seventeen-
member U.S. Value Equity Investment Policy Group, led by Marilyn Fedak and John Mahedy, determines the optimal portfolio construction given the
analysts' valuation work.
· Growth component - The remaining 45-60 growth names come from the team managed Large Cap Growth portfolio. The Large Cap Growth discipline is
founded on the premise that the best growth opportunities are those where consensus earnings estimates fail to fully appreciate the magnitude or duration
of a company's future growth. The fundamental research efforts of the Large Cap Growth team and Alliance's research analysts are focused on identifying
stocks with underestimated earnings growth potential.
· Assets under management - At the end of the quarter, AllianceBernstein had approximately $813 billion in assets under management, with the Style Blend
representing $13 billion in assets.
Style Considerations
· Portfolios will hold between 95 and 115 stocks. The product seeks a 3.0% annualized premium to the S&P 500 with a targeted tracking error of 4% to 6%.
The US Style Blend is a large cap core strategy that offers style purity, which is appropriate for a broad base of clients. The blended portfolio will include all
names found in the Bernstein Strategic Value and the Alliance Large Cap Growth portfolios, both representing 50% of the assets; however, the Strategic
Value process will allow for significant concentrations at the industry/sector level. Overlap between the two strategies has recently been higher than usual,
averaging 15%.
Account Writeups As of December 31, 2015
8.53

Performance :
Intl Equity Fund MSCI EAFE Index
0.0
15.0
30.0
45.0
-15.0
-30.0
Re
turn
(%)
1
Quarter
1
Year
3
Years
5
Years
10
Years
2014 2013 2012
4.7
-0.4
5.5 4.1 3.5
-4.5
23.3
17.9
0.8
-11.4
3.9 2.6 3.80.1
26.3
21.0
Rolling 2 Years Performance - 5 Years :
Rolling 2 Years Active Return Monthly Active Return
Sigma Band Top Line Sigma Band Bottom Line
0.0
3.0
6.0
9.0
-3.0
-6.0
Act
ive
Ret
urn
(%)
1/11 7/11 1/12 7/12 1/13 7/13 1/14 7/14 1/15 7/15 12/15
Historical Statistics - 5 Years :
Alpha BetaStandard
Deviation
Downside
Risk
Intl Equity Fund -1.38 1.04 15.93 11.15
MSCI EAFE Index 0.00 1.00 14.85 10.07
Drawdown - 5 Years :
Intl Equity Fund MSCI EAFE Index
0.0
8.0
-8.0
-16.0
-24.0
-32.0
1/11 7/11 1/12 7/12 1/13 7/13 1/14 7/14 1/15 7/15 12/15
Max Drawdown Recovery Periods # of Drawdowns in Period
Intl Equity Fund -25.7 24 Months 7
MSCI EAFE Index -22.3 24 Months 6
Dual Statistics 3 Year Rolling Ellipses - 5 Years :
Intl Equity Fund MSCI EAFE Index
-15.0
0.0
15.0
30.0
45.0
60.0
Sta
nd
ard
De
via
tio
n
-12.0 -6.0 0.0 6.0 12.0 18.0 24.0 30.0
Return
As of December 31, 2015
Sample Client
Manager Performance Summary
8.54

Peer Group Analysis - Multi Statistics :
Standard Deviation Sharpe Ratio Excess Return Excess Risk
5.0
10.0
15.0
20.0
25.0
StandardDeviation
-0.4
0.2
0.8
1.4
2.0
2.6SharpeRatio
0.0
5.0
10.0
15.0
20.0ExcessReturn
5.0
10.0
15.0
20.0
25.0
ExcessRisk
Large Cap Value Fund 10.8 (72) 14.6 (70) 19.1 (84) 1.3 (59) 0.9 (57) 0.4 (84) 14.2 (42) 12.6 (36) 6.8 (69) 10.8 (72) 14.6 (70) 19.2 (84)¢
Russell 1000 Value Index 10.2 (53) 13.5 (47) 17.5 (63) 1.3 (65) 0.9 (56) 0.4 (81) 13.0 (67) 11.7 (58) 6.4 (80) 10.2 (53) 13.5 (47) 17.6 (63)�
Median 10.2 13.7 16.9 1.4 0.9 0.4 13.7 12.1 7.3 10.2 13.7 17.0
Peer Group Scattergram - 10 Years :
2.0
4.0
6.0
8.0
10.0
12.0
Ret
urn
(%)
10.0 12.0 14.0 16.0 18.0 20.0 22.0 24.0
Risk (Standard Deviation %)
ReturnStandard
Deviation
Large Cap Value Fund 6.3 19.1¢
Russell 1000 Value Index 6.2 17.5�
Median 7.2 16.9¾
3 Year Rolling Relative Ranking - 10 Years :
0.0
25.0
50.0
75.0
100.0
Ret
urn
Per
cen
tile
Ran
k
3/06 3/07 3/08 3/09 3/10 3/11 3/12 3/13 3/14 3/15 12/15
Total Period5-25
Count
25-Median
Count
Median-75
Count
75-95
Count
Large Cap Value Fund 40 13 (33%) 7 (18%) 9 (23%) 11 (28%)¾
Russell 1000 Value Index 40 0 (0%) 16 (40%) 14 (35%) 10 (25%)¾
Sample Client
Peer Group Summary - IM U.S. Large Cap Value Equity (SA+CF) As of December 31, 2015
8.55

Portfolio Characteristics
Portfolio Benchmark
Wtd. Avg. Mkt. Cap $000 90,104,214 98,313,567
Median Mkt. Cap $000 31,892,932 10,833,618
Price/Earnings ratio 16.3 18.1
Price/Book ratio 2.5 2.7
5 Yr. EPS Growth Rate (%) 4.6 7.6
Current Yield (%) 1.9 2.6
Beta (5 Years, Monthly) 1.1 1.0
Number of Stocks 86 1,653
Debt to Equity 1.2 2.2
Forecast P/E 13.5 15.9
Forecast EPS Growth - Long-Term 10.2 10.6
Return on Equity 0.0 0.0
Top Ten Equity Holdings :
Portfolio
Weight
(%)
Benchmark
Weight
(%)
Active
Weight
(%)
Quarterly
Return
(%)
Contribution
to
Return
(%)
Alphabet Inc 3.4 0.7 2.7 24.7 0.9
Time Warner Cable Inc 3.2 0.2 3.0 3.9 0.1
Bank of America Corp 2.7 0.5 2.2 8.3 0.2
Naspers Ltd 2.6 0.0 2.6 9.3 0.2
Roche Holding AG 2.5 0.6 1.9 5.0 0.1
Sanofi 2.4 0.3 2.1 -9.9 -0.2
Time Warner Inc 2.3 0.2 2.1 -5.5 -0.1
Schwab (Charles) Corp 2.2 0.1 2.1 15.5 0.3
Standard Chartered PLC 2.2 0.1 2.1 -14.7 -0.3
Microsoft Corp 2.1 1.3 0.8 26.2 0.6
% of Portfolio 25.6 4.0
Distribution of Market Capitalization (%) :
Intl Equity Fund MSCI World Index
0.0
10.0
20.0
30.0
40.0
50.0
>100 Bil 75 Bil -
100 Bil
25 Bil -
75 Bil
15 Bil -
25 Bil
2 Bil -
15 Bil
0 -
2 Bil
30.3
8.2
30.1
11.5
19.8
0.0
27.2
2.7
45.3
7.8
16.3
0.6
Total Region Attribution :
0.0 0.5 1.0-0.5-1.0-1.5
United Kingdom
Pacific ex Japan
Other
North America
Middle East
Japan
Europe ex UK
EM Mid East+Africa
EM Latin America
EM Europe
EM Asia
Total Sector Attribution :
0.0 0.8 1.6-0.8-1.6
Utilities
Telecommunication Services
Materials
Information Technology
Industrials
Health Care
Financials
Energy
Consumer Staples
Consumer Discretionary
As of December 31, 2015
Sample Client
Manager Holdings Summary
8.56

Historical Asset Allocation by Segment
US Equity Intl Equity Emerging Equity
Domestic Fixed Income Real Estate Private Equity
Cash
0.0
25.0
50.0
75.0
100.0
All
oc
ati
on
(%)
3/98 12/99 9/01 6/03 3/05 12/06 9/08 6/10 3/12 12/13 12/15
Comparative Performance
Total Fund Composite Total Fund Benchmark
0.0
8.0
16.0
24.0
32.0
-8.0
Re
turn
(%)
1
Quarter
1
Year
3
Years
5
Years
2014 2013 2012 2011 2010 Since Inc.3/1/99
5.2
3.0
12.811.6 11.8
24.8
15.7
4.1
15.4
6.5
2.9
-0.2
4.9 5.77.2 7.9
12.4
1.9
14.0
4.5
Risk and Return - 5 Years
0.0
3.0
6.0
9.0
12.0
15.0
Re
turn
(%)
3.0 4.0 5.0 6.0 7.0 8.0 9.0 10.0 11.0
Risk (Standard Deviation %)
ReturnStandard
Deviation
Total Fund Composite 5.7 7.2�
Total Fund Benchmark 11.6 8.9p
Median 6.9 7.3¾
3 Year Rolling Percentile Ranking - 5 Years
0.0
25.0
50.0
75.0
100.0
Re
turn
Pe
rce
nti
le R
an
k
3/11 9/11 3/12 9/12 3/13 9/13 3/14 9/14 3/15 12/15
Total Period5-25
Count
25-Median
Count
Median-75
Count
75-95
Count
Total Fund Composite 20 0 (0%) 6 (30%) 2 (10%) 12 (60%)¾
Total Fund Benchmark 20 17 (85%) 3 (15%) 0 (0%) 0 (0%)¾
Demo Client
Total Fund Composite Summary
As of December 31, 2015
8.57

Comparative Performance
PIMCO Total Return Blmbg. Barc. U.S. Aggregate
0.0
3.0
6.0
9.0
-3.0
Re
turn
(%)
1
Quarter
2015 1
Year
3
Years
5
Years
Inception
9/1/93
-0.6
0.5 0.5
1.4
3.2
5.4
0.5 0.7 0.7
2.5
4.4
6.6
1 Year Rolling Percentile Ranking
PIMCO Total Return Blmbg. Barc. U.S. Aggregate
0.0
25.0
50.0
75.0
100.0
Re
turn
Pe
rce
nti
le R
an
k
3/11 9/11 3/12 9/12 3/13 9/13 3/14 9/14 3/15 12/15
3 Years Rolling Percentile Ranking
PIMCO Total Return Blmbg. Barc. U.S. Aggregate
0.0
25.0
50.0
75.0
100.0
Re
turn
Pe
rce
nti
le R
an
k
3/11 9/11 3/12 9/12 3/13 9/13 3/14 9/14 3/15 12/15
Relative Performance vs. Blmbg. Barc. U.S. Aggregate
Cumulative Annualized Over/Under Relative Performance
Over/Under Performance
0.0
3.0
6.0
-3.0
-6.0
-9.0
Re
turn
(%)
1/11 7/11 1/12 7/12 1/13 7/13 1/14 7/14 1/15 7/15 12/15
5 Years Rolling Percentile Ranking
PIMCO Total Return Blmbg. Barc. U.S. Aggregate
0.0
25.0
50.0
75.0
100.0
Re
turn
Pe
rce
nti
le R
an
k
3/11 9/11 3/12 9/12 3/13 9/13 3/14 9/14 3/15 12/15
PIMCO Total Return vs IM U.S. Broad Market Core Fixed Income (MF) - December 31, 2015
8.58

Rolling 3 Years Active Return
Peer GroupTrailing Year
Calendar Year Performance
Dodge and Cox International Stock Fund
MSCI EAFE Index
0.0
4.0
8.0
12.0
16.0
-4.0
Re
turn
(%)
1
Quarter
1
Year
3
Years
5
Years
7
Years
10
Years
4.7
-0.4
5.5
4.1
8.3
3.5
6.0
1.2
5.8
3.8
10.6
-40.0
-20.0
0.0
20.0
40.0
60.0
Re
turn
1
Quarter
1
Year
3
Years
5
Years
7
Years
10
Years2014 2013 2012
Dodge and Cox International Stock Fund 6.0 (11) 1.2 (26) 5.8 (23) 3.8 (28) 10.6 (19) N/A -5.8 (64) 24.4 (18) 21.0 (28)¢
MSCI EAFE Index 4.7 (26) -0.4 (35) 5.5 (25) 4.1 (24) 8.3 (42) 3.5 (45) -4.5 (50) 23.3 (21) 17.9 (58)�
5th Percentile 7.3 8.2 10.3 7.4 14.2 7.6 5.2 30.6 27.8
1st Quartile 4.8 1.2 5.5 4.0 9.8 4.7 -1.5 22.4 21.3
Median 3.3 -2.8 3.1 2.4 7.9 3.2 -4.5 17.3 18.6
3rd Quartile 1.3 -10.8 -2.6 -0.9 6.5 2.2 -6.8 3.3 15.8
95th Percentile -2.3 -20.2 -9.6 -7.3 4.2 0.0 -11.6 -6.9 9.2
Dodge and Cox International Stock Fund
MSCI EAFE Index
0.0
20.0
40.0
60.0
80.0
-20.0
-40.0
Re
turn
(%)
2014 2013 2012 2011 2010 2009
-4.5
23.3
17.9
-11.7
8.2
32.5
-5.8
24.421.0
-16.0
13.7
47.4
Rolling 3 Years Active Return Monthly Active Return
0.0
3.0
6.0
9.0
-3.0
-6.0
-9.0
Ac
tiv
e R
etu
rn (%
)
4/06 1/07 10/07 7/08 4/09 1/10 10/10 7/11 4/12 1/13 10/13 7/14 4/15 12/15
Dodge and Cox International Stock Fund - December 31, 2015
8.59

Market Cap Distribution
Sector PerformanceSector AllocationSector Attribution
Top 10 Holdings Portfolio Characteristics
Portfolio
Weight
(%)
Benchmark
Weight
(%)
Active
Weight
(%)
Quarterly
Return
(%)
Naspers Ltd 5.4 0.0 5.4 9.3
Roche Holding AG 4.2 1.6 2.6 5.0
Sanofi 3.2 0.8 2.4 -9.9
Novartis AG 2.9 1.6 1.3 -6.4
Lafarge SA 2.6 0.0 2.6 -2.6
Credit Suisse Group 2.4 0.3 2.1 -7.0
Nokia Corp 2.4 0.2 2.2 5.1
Bayer AG 2.4 0.8 1.6 -1.6
Imperial Brands PLC 2.2 0.4 1.8 3.7
Koninklijke Philips NV 2.1 0.2 1.9 8.9
% of Portfolio 29.8 5.9
Portfolio Benchmark
Wtd. Avg. Mkt. Cap $000 65,585,123 55,670,387
Median Mkt. Cap $000 24,393,172 9,004,460
Price/Earnings ratio 16.2 16.4
Price/Book ratio 2.4 2.3
5 Yr. EPS Growth Rate (%) 2.0 6.8
Current Yield (%) 2.9 3.2
Beta (5 Years, Monthly) 1.0 1.0
Number of Stocks 85 926
Dodge and Cox International Stock Fund
MSCI EAFE Index
0.0
10.0
20.0
30.0
40.0
>100 Bil 75 Bil -
100 Bil
25 Bil -
75 Bil
15 Bil -
25 Bil
2 Bil -
15 Bil
0 -
2 Bil
15.1
10.3
34.7
13.7
26.2
0.0
22.6
5.2
36.4
21.4
13.8
0.7
Dodge and Cox International Stock Fund
MSCI EAFE Index
0.0 10.0 20.0 30.0 40.0
Utilities
Telecommunication Services
Materials
Information Technology
Industrials
Health Care
Financials
Energy
Consumer Staples
Consumer Discretionary
0.0
7.1
4.5
17.3
8.0
16.6
23.2
4.6
4.1
14.5
3.8
4.9
6.6
4.8
12.5
11.8
25.8
4.7
12.0
13.1
Dodge and Cox International Stock Fund
MSCI EAFE Index
0.0 10.0 20.0-10.0-20.0
Utilities
Telecommunication Services
Materials
Information Technology
Industrials
Health Care
Financials
Energy
Consumer Staples
Consumer Discretionary
0.0
-10.4
-3.2
6.9
7.1
-1.5
-2.3
0.0
3.6
9.2
2.3
6.5
1.1
10.5
6.5
5.4
3.5
0.8
5.2
5.7
0.0 0.8 1.6-0.8-1.6-2.4
Utilities
Telecommunication Services
Materials
Information Technology
Industrials
Health Care
Financials
Energy
Consumer Staples
Consumer Discretionary
0.1
-1.2
-0.1
0.1
0.0
-1.1
-1.3
0.0
-0.1
0.5
Dodge and Cox International Stock Fund - December 31, 2015
8.60

Relative Performance
3 Yr Rolling Under/Over Perf *
Comparative Performance Graph
Growth of $1 (Since Inception - 01/01/79)
Fund Investment Policy
The Fund seeks long-term growth of principal and income. A secondary objective is to achieve a reasonable current income.
Over Performance Under Performance
Mar-2011 Dec-2015
-10.0
0.0
10.0
20.0
30.0
Do
dg
e &
Co
x S
toc
k (D
OD
GX
)
(%)
-10.0 0.0 10.0 20.0 30.0
Russell 1000 Value Index (%)
Over
Performance
Under
Performance
Dodge & Cox Stock (DODGX) Russell 1000 Value Index
-4,000.0
0.0
4,000.0
8,000.0
12,000.0
16,000.0
12/78 6/82 12/85 6/89 12/92 6/96 12/99 6/03 12/06 6/10 12/15
Cumulative Annualized Over/Under Relative Performance
Over/Under Performance
0.0
3.0
6.0
-3.0
-6.0
-9.0
Re
turn
(%)
1/11 7/11 1/12 7/12 1/13 7/13 1/14 7/14 1/15 7/15 12/15
Dodge & Cox Stock (DODGX) Russell 1000 Value Index
0.0
20.0
40.0
60.0
-20.0
Re
turn
(%)
1
Quarter
1
Year
3
Years
5
Years
7
Years
10
Years
2014 2013 2012
5.6
-3.8
13.111.3
13.0
6.2
13.5
32.5
17.5
4.5
-4.5
14.011.6
14.5
5.7
10.4
40.5
22.0
Dodge & Cox Stock (DODGX) December 31, 2015
* Based on a 5 Year time period, if 5 years is not available, a since inception time period is used.
8.61

Peer Group Analysis - IM U.S. Large Cap Value Equity (MF)
Peer Group Scattergram *
Mutual Fund Info
Historical Statistics *
3 Years Rolling Relative Ranking
ReturnStandard
Deviation
Sharpe
RatioAlpha Beta R-Squared
Tracking
Error
Information
Ratio
Active
Return
Excess
Risk
Inception
Date
Dodge & Cox Stock (DODGX) 11.64 13.37 0.89 -0.45 1.08 0.95 3.14 0.16 0.51 13.38 02/01/1965
Russell 1000 Value Index 11.27 12.02 0.95 0.00 1.00 1.00 0.00 N/A 0.00 12.03 02/01/1965
90 Day U.S. Treasury Bill 0.06 0.03 N/A 0.06 0.00 0.07 12.03 -0.95 -11.39 0.00 02/01/1965
-20.0
-10.0
0.0
10.0
20.0
Re
turn
1
Quarter
1
Year
3
Years
5
Years
7
Years
10
Years
Dodge & Cox Stock (DODGX) 4.5 (73) -4.5 (63) 14.0 (13) 11.6 (12) 14.5 (7) 5.7 (44)¢
Russell 1000 Value Index 5.6 (27) -3.8 (53) 13.1 (24) 11.3 (18) 13.0 (26) 6.2 (30)�
Median 5.2 -3.7 12.3 9.8 12.3 5.5
Product Name : Dodge & Cox Stock (DODGX)
Fund Family : Dodge & Cox
Ticker : DODGX
Peer Group : IM U.S. Large Cap Value
Equity (MF)
Benchmark : Russell 1000 Value Index
Fund Inception : 01/04/1965
Portfolio Manager : Team Managed
Total Assets : 56,553 Million
Total Assets Date : 08/31/2016
Gross Expense : 0.5%
Net Expense : 0.5%
Turnover : 15%
0.0
4.0
8.0
12.0
16.0
Re
turn
(%)
8.0 10.0 12.0 14.0 16.0 18.0
Risk (Standard Deviation %)
ReturnStandard
Deviation
Dodge & Cox Stock (DODGX) 11.6 13.4¢£
Russell 1000 Value Index 11.3 12.0��
Median 9.8 12.6¾
0.0
25.0
50.0
75.0
100.0
Re
turn
Pe
rce
nti
le R
an
k
3/11 9/11 3/12 9/12 3/13 9/13 3/14 9/14 3/15 12/15
Total Period5-25
Count
25-Median
Count
Median-75
Count
75-95
Count
Dodge & Cox Stock (DODGX) 20 13 (65%) 6 (30%) 1 (5%) 0 (0%)¾
Russell 1000 Value Index 20 14 (70%) 4 (20%) 2 (10%) 0 (0%)¾
Dodge & Cox Stock (DODGX) December 31, 2015
* Based on a 5 Year time period, if 5 years is not available, a since inception time period is used.
8.62

![Files Input and Output Program Payroll_Calculator; Uses Crt, Printer; Const A_Payrate = 100.0; B_Payrate = 50.0; Var SS_personnel : string[9]; First_Name,](https://img.dokumen.tips/doc/110x75/56649f0c5503460f94c1ff60/files-input-and-output-program-payrollcalculator-uses-crt-printer-const.jpg)


![Breakout by Race / Ethnicity [Weighted] - CCSSE · Total 7,861 100.0 25,667 100.0 1,138 100.0 50,617 100.0 234,634 100.0 74,299 100.0 18,695 100.0 4g. Worked with classmates outside](https://img.dokumen.tips/doc/110x75/5ac86cc17f8b9a6b578c1ca7/breakout-by-race-ethnicity-weighted-7861-1000-25667-1000-1138-1000-50617.jpg)

