Embed Size (px)
Citation preview
Portfolio Additional Estimates Statements 2017–18
Industry, Innovation and Science (Part of the Jobs and Innovation Portfolio)
Explanations of Additional Estimates 2017–18

© Commonwealth of Australia 2018
ISBN 978-1-925050-03-5
This publication is available for your use under a Creative Commons BY Attribution
3.0 Australia licence, with the exception of the Commonwealth Coat of Arms, the
Department of Industry, Innovation and Science logo, photographs, images, signatures
and where otherwise stated. The full licence terms are available from http://creativecommons.org/licenses/by/3.0/au/legalcode.
Use of Department of Industry, Innovation and Science material under a Creative
Commons BY Attribution 3.0 Australia licence requires you to attribute the work (but
not in any way that suggests that the Department of Industry, Innovation and Science
endorses you or your use of the work).
Department of Industry, Innovation and Science material used 'as supplied'
Provided you have not modified or transformed Department of Industry, Innovation
and Science material in any way including, for example, by changing the Department
of Industry, Innovation and Science text; calculating percentage changes; graphing or
charting data; or deriving new statistics from published Department of Industry,
Innovation and Science statistics – then the Department of Industry, Innovation and
Science prefers the following attribution:
Source: The Australian Government Department of Industry, Innovation and Science
Derivative material
If you have modified or transformed Department of Industry, Innovation and Science
material, or derived new material from those of the Department of Industry,
Innovation and Science in any way, then Department of Industry, Innovation and
Science prefers the following attribution:
Based on The Australian Government Department of Industry, Innovation and Science data
Use of the Coat of Arms
The terms under which the Coat of Arms can be used are set out on the It’s an Honour
website (see www.itsanhonour.gov.au)
Other Uses
Inquiries regarding this licence and any other use of this document are welcome.
Please contact the Chief Financial Officer in the Department of Industry, Innovation
and Science on (02) 6213 6000.
iii
President of the Senate
Australian Senate
Parliament House
CANBERRA ACT 2600
Speaker
House of Representatives
Parliament House
CANBERRA ACT 2600
Dear Mr President
Dear Mr Speaker
We hereby submit Portfolio Additional Estimates Statements in support of the
2017–18 Additional Estimates for the Department of Industry, Innovation and Science
(part of the Jobs and Innovation Portfolio).
These statements have been developed, and are submitted to the Parliament, as a
statement on the funding requirements being sought for the Portfolio.
We present these statements by virtue of our ministerial responsibilities for
accountability to the Parliament and, through it, the public.
Yours sincerely
Senator the Hon Michaelia Cash Senator the Hon Matthew Canavan
iv
ABBREVIATIONS AND CONVENTIONS
The following notations may be used:
NEC/nec not elsewhere classified
- nil
.. not zero, but rounded to zero
na not applicable (unless otherwise specified)
nfp not for publication
$m $ million
Figures in tables and in the text may be rounded. Figures in text are generally rounded
to one decimal place, whereas figures in tables are generally rounded to the nearest
thousand. Discrepancies in tables between totals and sums of components are due to
rounding.
Enquiries
Should you have any enquiries regarding this publication please contact the Chief
Financial Officer in the Department of Industry, Innovation and Science on
(02) 6213 6000.
Links to Portfolio Budget Statements (including Portfolio Additional Estimates
Statements and Portfolio Supplementary Additional Estimates Statements) can be
located on the Australian Government Budget website at www.budget.gov.au.
USER GUIDE TO THE
PORTFOLIO ADDITIONAL ESTIMATES STATEMENTS


vii
USER GUIDE
The purpose of the 2017–18 Portfolio Additional Estimates Statements (PAES), like that
of the Portfolio Budget Statements (PB Statements), is to inform Senators and Members
of Parliament of the proposed allocation of resources to Government outcomes by
entities within the portfolio. The focus of the PAES differs from the PB Statements in
one important aspect. While the PAES include an Entity Resource Statement to inform
Parliament of the revised estimate of the total resources available to an entity, the focus
of the PAES is on explaining the changes in resourcing by outcome(s) since the Budget.
As such, the PAES provides information on new measures and their impact on the
financial and/or non-financial planned performance of programs supporting those
outcomes.
The PAES facilitate understanding of the proposed appropriations in Appropriation
Bills (Nos. 3 and 4) and Appropriation (Parliamentary Departments) Bill (No. 2)
2017–2018. In this sense, the PAES is declared by the Additional Estimates
Appropriation Bills to be a ‘relevant document’ to the interpretation of the Bills
according to section 15AB of the Acts Interpretation Act 1901.
Whereas the Mid-Year Economic and Fiscal Outlook (MYEFO) 2017–18 is a mid-year
budget report which provides updated information to allow the assessment of the
Government’s fiscal performance against its fiscal strategy, the PAES update the most
recent budget appropriations for entities within the portfolio.
User Guide
viii
Structure of the Portfolio Additional Estimates Statements
The PAES are presented in three parts with subsections.
User guide
Provides a brief introduction explaining the purpose of the PAES.
Portfolio overview
Provides an overview of the portfolio, including a chart that outlines the outcomes for entities
in the portfolio.
Entity Additional Estimates Statements
A statement (under the name of the entity) for each entity affected by Additional Estimates.
Section 1: Entity
overview and resources
This section details the changes in total resources available to an
entity, the impact of any measures since Budget, and impact of
Appropriation Bills Nos. 3 and 4.
Section 2: Revisions to
outcomes and planned
performance
This section details changes to Government outcomes and/or
changes to the planned performance of entity programs.
Section 3: Special
account flows and
budgeted financial
statements
This section contains updated explanatory tables on special
account flows and staffing levels and revisions to the budgeted
financial statements.

ix
CONTENTS
Portfolio overview ..................................................................................................... 3
Department of Industry, Innovation and Science ........................................................ 11
Australian Institute of Marine Science ........................................................................ 41


PORTFOLIO OVERVIEW


3
PORTFOLIO OVERVIEW
On 19 December 2017, the Prime Minister, the Hon Malcolm Turnbull MP, announced
changes to his Ministry and areas of responsibility. Senator the Hon Michaelia Cash
was given responsibility for the Jobs and Innovation Portfolio, supported by
the Hon Craig Laundy MP and Senator the Hon Zed Seselja. Together, they are
charged with harnessing the jobs of the future through new industries and small
business so Australians can adapt and thrive in an era of innovation and technological
change.
Senator the Hon Matthew Canavan is responsible for the Resources and Northern
Australia Portfolio. Minister Canavan is charged with working closely with the
Australian resources sector, which is one of the major contributors to Australia’s
economic prosperity, and is focused on unlocking the potential of Northern Australia.
The roles and responsibilities of the Department of Industry, Innovation and Science
and portfolio agencies have not changed since the 2017–18 Portfolio Budget
Statements.
Structure of the portfolio
The Jobs and Innovation Portfolio is split into two sub-portfolios: Jobs and Small
Business, and Industry, Innovation and Science.
The Department of Industry, Innovation and Science (Figure 1) leads the Industry,
Innovation and Science sub-portfolio, and the Resources and Northern Australia
Portfolio, including related non-corporate Commonwealth and corporate
Commonwealth entities. This document provides information on these two areas only.
The Jobs and Small Business sub-portfolio is led by the Department of Jobs and Small
Business. For information on Jobs and Small Business, refer to the Portfolio Additional
Estimates Statements 2017–18, Jobs and Small Business (Part of the Jobs and Innovation
Portfolio).
Ministers and responsibilities
The ministers responsible for the Industry, Innovation and Science sub-portfolio are:
Senator the Hon Michaelia Cash, Minister for Jobs and Innovation
The Hon Craig Laundy MP, Minister for Small and Family Business, the
Workplace and Deregulation
Senator the Hon Zed Seselja, Assistant Minister for Science, Jobs and
Innovation.

Portfolio Overview
4
The minister responsible for Resources and Northern Australia is:
Senator the Hon Matthew Canavan, Minister for Resources and Northern
Australia.
A full outline of the Department’s Portfolio Overview can be found in the
2017-18 Portfolio Budget Statements.

Portfolio Overview
5
Figure 1: Industry, Innovation and Science structure and outcomes

Portfolio Overview
6
ENTITY ADDITIONAL ESTIMATES
STATEMENTS
Department of Industry, Innovation and Science .................................................. 11
Australian Institute of Marine Science ................................................................... 41

9
DEPARTMENT OF INDUSTRY, INNOVATION AND SCIENCE
Section 1: Entity overview and resources ............................................................. 11
1.1 Strategic direction statement .............................................................................. 11
1.2 Entity resource statement ................................................................................... 11
1.3 2017–18 measures since Budget ........................................................................ 14
1.4 Additional estimates, resourcing and variations to outcomes ............................... 16
1.5 Breakdown of additional estimates by Appropriation Bill ..................................... 18
Section 2: Revisions to outcomes and planned performance .............................. 19
2. Changes to outcome and program structures since the last budget statement ............................................................................................................. 19
2.1 Budgeted expenses and performance for Outcome 1 ......................................... 19
2.1.1 Budgeted expenses for Outcome 1 .................................................................. 20
2.1.2 Program components of Outcome 1 ................................................................ 22
2.1.3 Performance criteria for Outcome 1 ................................................................. 24
Section 3: Special account flows and budgeted financial statements ................. 25
3.1 Estimates of special account flows and balance .................................................. 25
3.2 Budgeted financial statements ............................................................................ 27


11
DEPARTMENT OF INDUSTRY, INNOVATION AND SCIENCE
Section 1: Entity overview and resources
1.1 STRATEGIC DIRECTION STATEMENT
The Australian Government seeks to create jobs and capture the opportunities of a
modern, digital and globally integrated economy while helping Australians to manage
the transition. The Department of Industry, Innovation and Science contributes to this
vision by facilitating the growth and productivity of globally competitive industries.
With resources in policy, analysis and program delivery, and the capabilities of
Australia’s largest science agencies, the department reduces barriers to growth and
fosters smart, high growth, globally engaged businesses. The department seeks to
capitalise on Australia’s competitive strengths, exploit emerging digital technologies
and supports the continual improvement of our innovation and scientific advantage.
Further details of the department’s strategic direction can be found in the
2017-18 Portfolio Budget Statements and the department’s 2017–18 Corporate Plan at
www.industry.gov.au.
1.2 ENTITY RESOURCE STATEMENT
The Entity Resource Statement details the resourcing for the Department of Industry,
Innovation and Science at Additional Estimates. Table 1.1 outlines the total resourcing
available from all sources for the 2017–18 Budget year, including variations through
Appropriation Bills No. 3 and No. 4, Special Appropriations and Special Accounts.

Entity Additional Estimates Statements — DIIS
12
Table 1.1: Department of Industry, Innovation and Science resource statement — Additional Estimates for 2017–18 as at Additional Estimates February 2018
Actual
available
appropriation
2016-17
$'000
Estimate
as at
Budget
2017-18
$'000
Proposed
Additional
Estimates
2017-18
$'000
Total
estimate at
Additional
Estimates
2017-18
$'000
Departmental
Annual appropriations - ordinary annual services
Prior year appropriations available (a) 95,585 69,602 - 69,602
Departmental appropriation 365,838 376,445 4,458 380,903
s74 retained revenue receipts (b) 76,536 93,618 - 93,618
Departmental capital budget (c) 28,888 25,234 - 25,234
Annual appropriations - other services -
non-operating
Prior year appropriations available (a) 41,190 27,864 - 27,864
Equity injection 4,880 11,520 387 11,907
Total departmental annual appropriations 612,917 604,283 4,845 609,128
Special accounts (d)
Opening balance 28,151 11,100 787 11,887
Appropriation receipts 4,000 4,000 - 4,000
Non-appropriation receipts 7,311 7,020 1,256 8,276
Total special accounts 39,462 22,120 2,043 24,163
less departmental appropriations drawn from annual
appropriations and credited to special accounts 4,000 4,000 - 4,000
Total departmental resourcing 648,379 622,403 6,888 629,291
Administered
Annual appropriations - ordinary annual services
Outcome 1 552,924 524,250 (24,270) 499,980
Payments to corporate entities (e) 1,020,264 1,042,088 2,931 1,045,019
Annual appropriations - other services - non-operating
Prior year appropriations available (a) 111,542 116,427 - 116,427
Administered assets and liabilities 28,938 8,000 - 8,000
Payments to corporate entities 38,841 32,637 - 32,637

Entity Additional Estimates Statements — DIIS
13
Table 1.1: Department of Industry, Innovation and Science Resource Statement — Additional Estimates for 2017–18 as at Additional Estimates February 2018 (continued)
Actual
available
appropriation
2016-17
$'000
Estimate
as at
Budget
2017-18
$'000
Proposed
Additional
Estimates
2017-18
$'000
Total
estimate at
Additional
Estimates
2017-18
$'000
Total administered annual appropriations 1,752,509 1,723,402 (21,339) 1,702,063
Total administered special appropriations (f) 212,996 713,189 (192,000) 521,189
Special accounts (d)
Opening balance 174,709 150,361 (6,175) 144,186
Appropriation receipts 54,510 10,000 - 10,000
Non-appropriation receipts 36,641 23,802 11 23,813
Total special account receipts 265,860 184,163 (6,164) 177,999
less administered appropriations drawn from annual
appropriations and credited to special accounts 54,510 10,000 - 10,000
Total administered resourcing 2,176,855 2,610,754 (219,503) 2,391,251
Total resourcing for Industry, Innovation and
Science 2,825,234 3,233,157 (212,615) 3,020,542
Actual 2016-17 2017-18
Average staffing level (number) 2,445 2,355
Prepared on a resourcing (i.e. appropriations available) basis.
Please note: All figures shown above are GST exclusive - these may not match figures in the cash flow statement. (a) Actual and estimated adjusted balance carried forward from previous year for annual and equity
appropriations. (b) Estimated retained revenue receipts under section 74 of the Public Governance, Performance and
Accountability Act 2013 (PGPA Act).
(c) Departmental capital budgets are not separately identified in Appropriation Act (No.1) and form part of
ordinary annual services items. Please refer to Table 3.5 for further details. For accounting purposes, this amount has been designated as a 'contribution by owner'.
(d) Refer to Table 3.1 for further information on Special Accounts. (e) This excludes special appropriation payments to the National Offshore Petroleum Safety and
Environmental Management authority (NOPSEMA).
(f) Total special appropriations include funding of $360 million in 2017–18 for the Northern Australia Infrastructure Facility (NAIF) and payments to NOPSEMA. The payments to NOPSEMA are equal in value to the levies NOPSEMA collects from the oil and gas industries.
Entity Additional Estimates Statements — DIIS
14
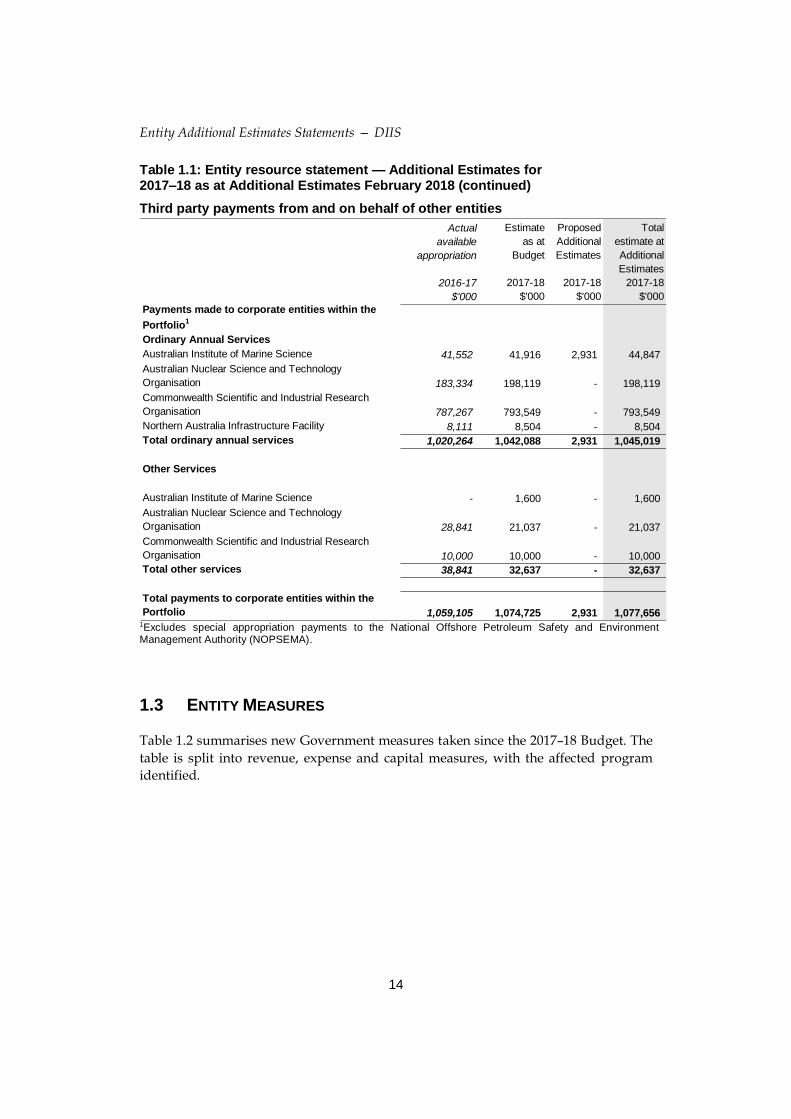
Table 1.1: Entity resource statement — Additional Estimates for 2017–18 as at Additional Estimates February 2018 (continued)
Third party payments from and on behalf of other entities
Actual
available
appropriation
2016-17
$'000
Estimate
as at
Budget
2017-18
$'000
Proposed
Additional
Estimates
2017-18
$'000
Total
estimate at
Additional
Estimates
2017-18
$'000
Payments made to corporate entities within the
Portfolio1
Ordinary Annual Services
Australian Institute of Marine Science 41,552 41,916 2,931 44,847
Australian Nuclear Science and Technology
Organisation 183,334 198,119 - 198,119
Commonwealth Scientific and Industrial Research
Organisation 787,267 793,549 - 793,549
Northern Australia Infrastructure Facility 8,111 8,504 - 8,504
Total ordinary annual services 1,020,264 1,042,088 2,931 1,045,019
Other Services
Australian Institute of Marine Science - 1,600 - 1,600
Australian Nuclear Science and Technology
Organisation 28,841 21,037 - 21,037
Commonwealth Scientific and Industrial Research
Organisation 10,000 10,000 - 10,000
Total other services 38,841 32,637 - 32,637
Total payments to corporate entities within the
Portfolio 1,059,105 1,074,725 2,931 1,077,6561Excludes special appropriation payments to the National Offshore Petroleum Safety and Environment Management Authority (NOPSEMA).
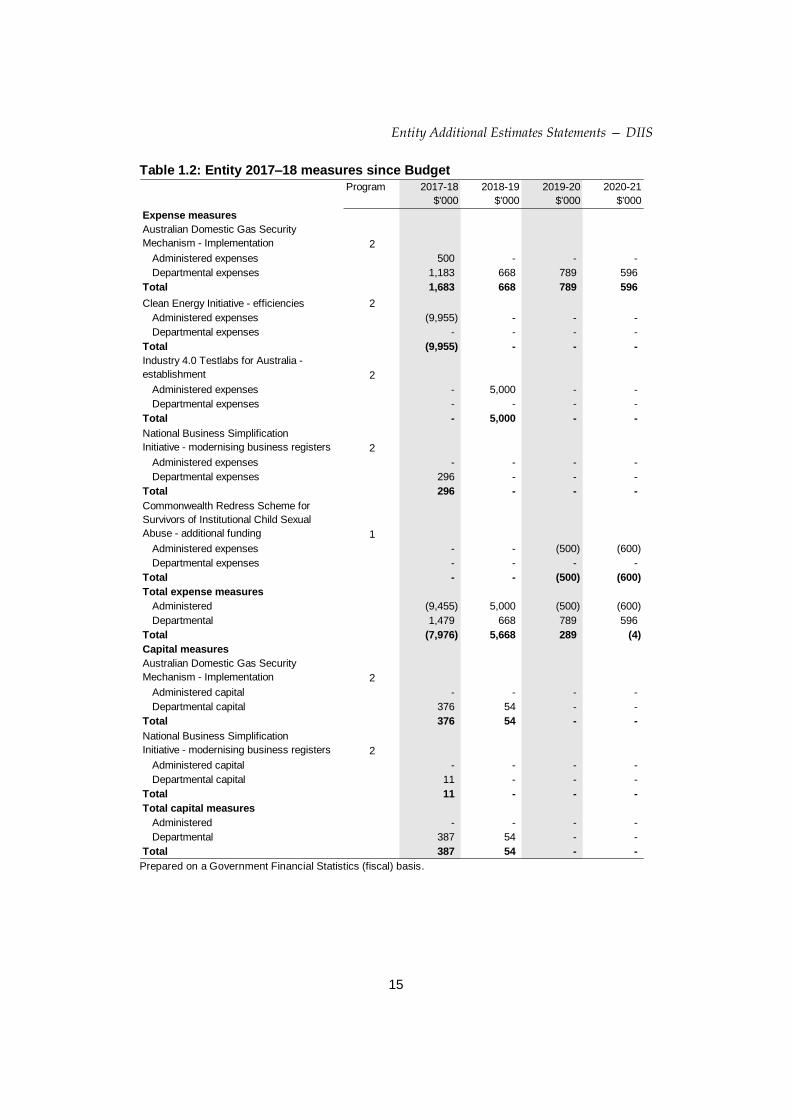
1.3 ENTITY MEASURES
Table 1.2 summarises new Government measures taken since the 2017–18 Budget. The
table is split into revenue, expense and capital measures, with the affected program
identified.
Entity Additional Estimates Statements — DIIS
15
Table 1.2: Entity 2017–18 measures since Budget
Program 2017-18
$'000
2018-19
$'000
2019-20
$'000
2020-21
$'000
Expense measures
Australian Domestic Gas Security
Mechanism - Implementation 2
Administered expenses 500 - - -
Departmental expenses 1,183 668 789 596
Total 1,683 668 789 596
Clean Energy Initiative - efficiencies 2
Administered expenses (9,955) - - -
Departmental expenses - - - -
Total (9,955) - - -
Industry 4.0 Testlabs for Australia -
establishment 2
Administered expenses - 5,000 - -
Departmental expenses - - - -
Total - 5,000 - -
National Business Simplification
Initiative - modernising business registers 2
Administered expenses - - - -
Departmental expenses 296 - - -
Total 296 - - -
Commonwealth Redress Scheme for
Survivors of Institutional Child Sexual
Abuse - additional funding 1
Administered expenses - - (500) (600)
Departmental expenses - - - -
Total - - (500) (600)
Total expense measures
Administered (9,455) 5,000 (500) (600)
Departmental 1,479 668 789 596
Total (7,976) 5,668 289 (4)
Capital measures
Australian Domestic Gas Security
Mechanism - Implementation 2
Administered capital - - - -
Departmental capital 376 54 - -
Total 376 54 - -
National Business Simplification
Initiative - modernising business registers 2
Administered capital - - - -
Departmental capital 11 - - -
Total 11 - - -
Total capital measures
Administered - - - -
Departmental 387 54 - -
Total 387 54 - - Prepared on a Government Financial Statistics (fiscal) basis.

Entity Additional Estimates Statements — DIIS
16
1.4 ADDITIONAL ESTIMATES, RESOURCING AND VARIATIONS TO
OUTCOMES
The following tables detail the changes to the resourcing for the Department of
Industry, Innovation and Science at Additional Estimates, by outcome. Table 1.3
details the Additional Estimates resulting from new measures and other variations
since the 2017–18 Budget in Appropriation Bills Nos. 3 and 4.
Table 1.3: Additional estimates and other variations to outcomes since 2017–18 Budget
Program
impacted
2017-18
$'000
2018-19
$'000
2019-20
$'000
2020-21
$'000
Outcome 1
Administered
Annual appropriations
Measures
Industry 4.0 Testlabs for Australia -
establishment 2 - 5,000 - -
Australian Domestic Gas Security
Mechanism - Implementation 2 500 - - -
Commonwealth Redress Scheme for
Survivors of Institutional Child Sexual
Abuse - additional funding 1 - - (500) (600)
Movement of Funds
net increase 1,2 4,704 8,525 3,000 3,000
net decrease 2 (20,525) (3,289) - -
Changes in Parameters
net increase 1,2 - 160 - 68
Other Variations
net increase 2 1,006 - - -
Special account
Measures
Clean Energy Initiative - efficiencies 2 (9,955) - - -
Special appropriations
Other Variations
net increase 2 - 161,000 189,000 -
net decrease 2 (192,000) - - (90,000)
Net impact on appropriations for
Outcome 1 (administered) (216,270) 171,396 191,500 (87,532)
Entity Additional Estimates Statements — DIIS
17
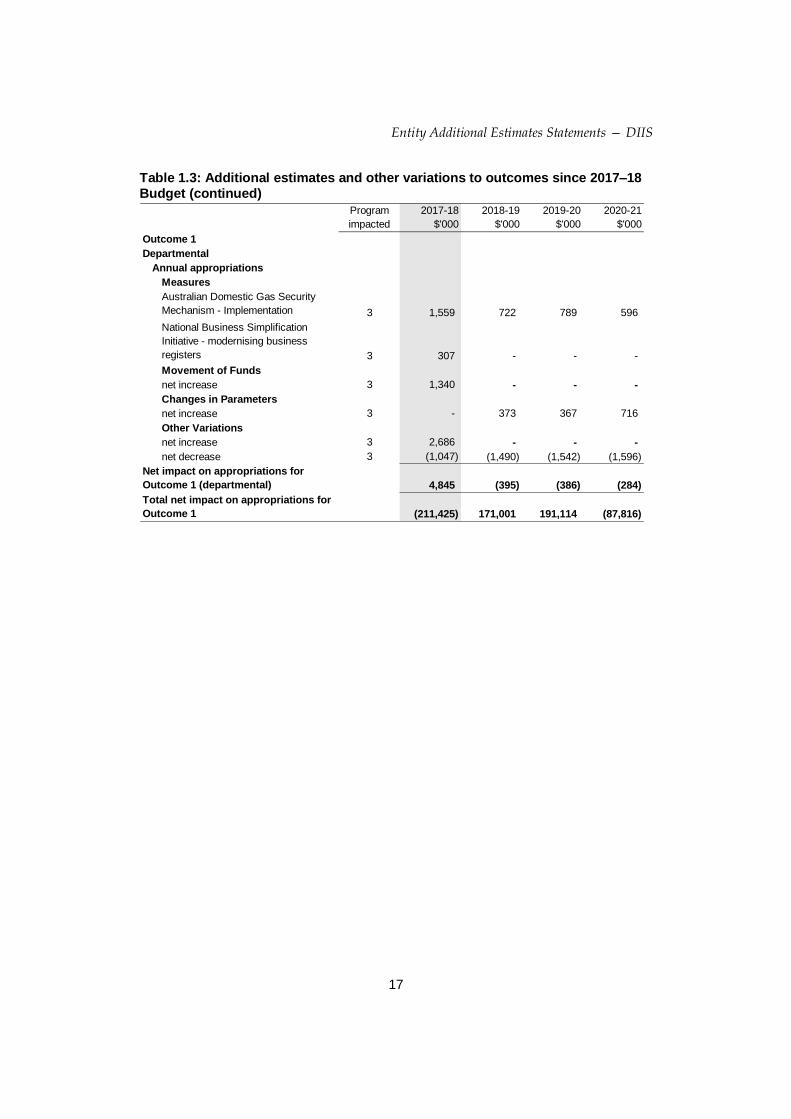
Table 1.3: Additional estimates and other variations to outcomes since 2017–18 Budget (continued)
Program
impacted
2017-18
$'000
2018-19
$'000
2019-20
$'000
2020-21
$'000
Outcome 1
Departmental
Annual appropriations
Measures
Australian Domestic Gas Security
Mechanism - Implementation 3 1,559 722 789 596
National Business Simplification
Initiative - modernising business
registers 3 307 - - -
Movement of Funds
net increase 3 1,340 - - -
Changes in Parameters
net increase 3 - 373 367 716
Other Variations
net increase 3 2,686 - - -
net decrease 3 (1,047) (1,490) (1,542) (1,596)
Net impact on appropriations for
Outcome 1 (departmental) 4,845 (395) (386) (284)
Total net impact on appropriations for
Outcome 1 (211,425) 171,001 191,114 (87,816)

Entity Additional Estimates Statements — DIIS
18
1.5 BREAKDOWN OF ADDITIONAL ESTIMATES BY APPROPRIATION
BILL
The following tables detail the Additional Estimates sought for the Department of
Industry, Innovation and Science through Appropriation Bills Nos. 3 and 4.
Table 1.4: Appropriation Bill (No. 3) 2017–18
2016-17
Available
$'000
2017-18
Budget
$'000
2017-18
Revised
$'000
Additional
Estimates
$'000
Reduced
Estimates
$'000
Administered items
Outcome 1
Enabling growth and productivity for
globally competitive industries through
supporting science and
commercialisation, growing business
investment and improving business
capability and streamlining regulation.
552,924 524,250 499,980 6,210 (30,480)
Total administered 552,924 524,250 499,980 6,210 (30,480)
Departmental programs
Outcome 1
Enabling growth and productivity for
globally competitive industries through
supporting science and
commercialisation, growing business
investment and improving business
capability and streamlining regulation.
394,726 401,679 406,137 5,505 (1,047)
Total departmental 394,726 401,679 406,137 5,505 (1,047)
Total administered
and departmental 947,650 925,929 906,117 11,715 (31,527)
Table 1.5: Appropriation Bill (No. 4) 2017–18
2016-17
Available
$'000
2017-18
Budget
$'000
2017-18
Revised
$'000
Additional
Estimates
$'000
Reduced
Estimates
$'000
Non-operating
Equity injections 4,880 11,520 11,907 387 -
Administered assets and liabilities 28,938 8,000 8,000 - -
Total non-operating 33,818 19,520 19,907 387 -
Total other services 33,818 19,520 19,907 387 -

Entity Additional Estimates Statements — DIIS
19
Section 2: Revisions to outcomes and planned performance
2. CHANGES TO OUTCOME AND PROGRAM STRUCTURES
There have been no changes to outcome and program structures since the 2017–18
Portfolio Budget Statements.
2.1 BUDGETED EXPENSES AND PERFORMANCE FOR OUTCOME 1
Outcome 1: Enabling growth and productivity for globally competitive
industries through supporting science and commercialisation, growing
business investment and improving business capability and streamlining
regulation.
Linked programs
There have been no changes to linked programs for Outcome 1 since the 2017–18
Portfolio Budget Statements.
Budgeted expenses for Outcome 1
This table shows how much the entity intends to spend (on an accrual basis) on
achieving the outcome, broken down by program, as well as by Administered and
Departmental funding sources.

Entity Additional Estimates Statements — DIIS
20
Table 2.1.1 Budgeted expenses for Outcome 1
2016-17
Actual
expenses
$'000
2017-18
Revised
estimated
expenses
$'000
2018-19
Forward
estimate
$'000
2019-20
Forward
estimate
$'000
2020-21
Forward
estimate
$'000
Program 1: Supporting Science and Commercialisation
Administered expenses
Ordinary annual services (Appropriation Act
No. 1 and Bill No. 3)151,528 163,203 165,104 193,140 196,349
Administered total 151,528 163,203 165,104 193,140 196,349
Total expenses for Program 1 151,528 163,203 165,104 193,140 196,349
Program 2: Growing Business Investment and Improving Business Capability
Administered expenses
Ordinary annual services (Appropriation Act
No. 1 and Bill No. 3)188,577 236,498 233,365 178,341 173,110
Ordinary annual services (Appropriation Act
No. 1 and Bill No. 3) credited to special
accounts
26,500 33,000 9,900 - -
Special accounts 22,485 18,098 300 700 -
Expenses not requiring appropriation in the
Budget year (a)- 139,235 523,294 583,629 425,442
Administered total 237,562 426,831 766,859 762,670 598,552
Total expenses for Program 2 237,562 426,831 766,859 762,670 598,552
Program 3: Program Support
Departmental expenses
Departmental appropriation 365,838 380,903 357,513 350,715 342,231
s 74 Retained revenue receipts (b) 76,536 93,618 67,801 65,008 64,774
Special accounts 12,912 9,116 7,552 6,321 5,307
Expenses not requiring appropriation in the
Budget year (c)62,894 43,197 43,217 43,483 43,483
Departmental total 518,180 526,834 476,083 465,527 455,795
Total expenses for Program 3 518,180 526,834 476,083 465,527 455,795
Outcome 1: Enabling growth and productivity for globally competitive industries through supporting science and
commercialisation, growing business investment and improving business capability and streamlining regulation.

Entity Additional Estimates Statements — DIIS
21
Table 2.1.1 Budgeted expenses for Outcome 1 (continued)
2016-17
Actual
expenses
$'000
2017-18
Revised
estimated
expenses
$'000
2018-19
Forward
estimate
$'000
2019-20
Forward
estimate
$'000
2020-21
Forward
estimate
$'000
Outcome 1 Totals by appropriation type
Administered expenses
Ordinary annual services (Appropriation Act
No. 1 and Bill No. 3)340,105 399,701 398,469 371,481 369,459
Ordinary annual services (Appropriation Act
No. 1 and Bill No. 3) credited to special
accounts
26,500 33,000 9,900 - -
Special accounts 22,485 18,098 300 700 -
Expenses not requiring appropriation in the
Budget year (a)- 139,235 523,294 583,629 425,442
Administered total 389,090 590,034 931,963 955,810 794,901
Departmental expenses
Departmental appropriation 365,838 380,903 357,513 350,715 342,231
s 74 Retained revenue receipts (b) 76,536 93,618 67,801 65,008 64,774
Special accounts 12,912 9,116 7,552 6,321 5,307
Expenses not requiring appropriation in the
Budget year (c)62,894 43,197 43,217 43,483 43,483
Departmental total 518,180 526,834 476,083 465,527 455,795
Total expenses for Outcome 1 907,270 1,116,868 1,408,046 1,421,337 1,250,696
Movement of administered funds between
years (d)
2016-17
Actual
expenses
$'000
2017-18
Revised
estimated
expenses
2018-19
Forward
estimate
$'000
2019-20
Forward
estimate
$'000
2020-21
Forward
estimate
$'000Outcome 1:
Program 1
Research and Development Tax Initiative (262) 262 - - -
Program 2 -
Bindaree Beef - assistance - (5,525) 5,525 - -
Industry Growth Centres - (15,000) 3,000 3,000 3,000
Victorian Innovation and Investment Fund -
Ford assistance (1,129) 1,129 - - -
Radioactive Waste Management (e) (1,364) 4,653 (3,289) - -
Total movement of administered funds (2,755) (14,481) 5,236 3,000 3,000
2016-17 2017-18
Average staffing level (number) 2,445 2,355 (a) Expenses not requiring appropriation relate to depreciation and amortisation expenses for the National
Offshore Petroleum Titles Administrator program, and the expenses associated with the concessional
loans proposed under the Northern Australia Infrastructure Facility. (b) Estimated expenses incurred in relation to receipts retained under section 74 of the PGPA Act. (c) Expenses not requiring appropriation are made up of depreciation expenses, amortisation expenses and
audit fees. (d) Figures displayed as a negative (-) represent a decrease in funds and a positive (+) represent an
increase in funds.
(e) In addition to the administered Movement of Funds, $1.340m was reclassified from administered to departmental in 2017-18.

Entity Additional Estimates Statements — DIIS
22
Table 2.1.2: Program components of Outcome 1
2016-17
Actual
expenses
$'000
2017-18
Revised
estimated
expenses
$'000
2018-19
Forward
estimate
$'000
2019-20
Forward
estimate
$'000
2020-21
Forward
estimate
$'000
Annual administered expenses:
Cooperative Research Centres
Programme149,717 160,868 163,031 191,067 194,276
Research and Development Tax Incentive 1,811 2,335 2,073 2,073 2,073
Total annual administered expenses 151,528 163,203 165,104 193,140 196,349
Total sub-program 1.2 expenses 151,528 163,203 165,104 193,140 196,349
Total program 1 expenses 151,528 163,203 165,104 193,140 196,349
Program 1: Supporting Science and Commercialisation
Sub-program 1.2: Business research, development and commercialisation
Entity Additional Estimates Statements — DIIS
23
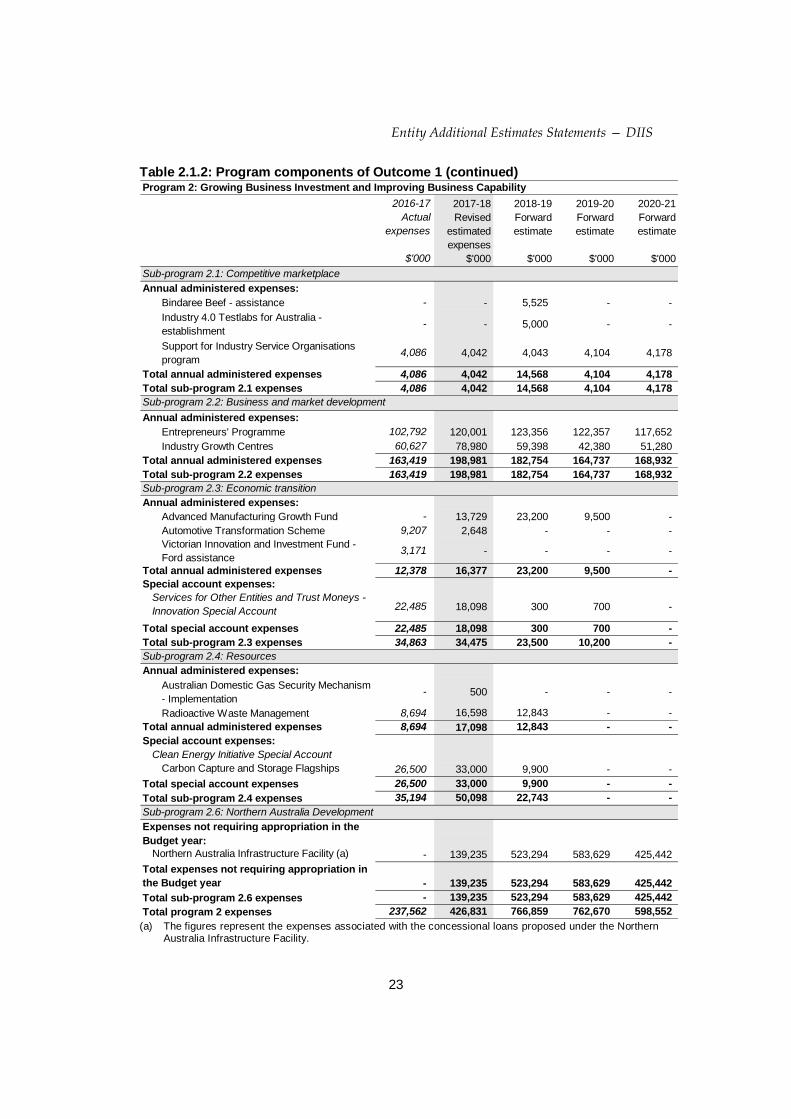
Table 2.1.2: Program components of Outcome 1 (continued)
2016-17
Actual
expenses
$'000
2017-18
Revised
estimated
expenses
$'000
2018-19
Forward
estimate
$'000
2019-20
Forward
estimate
$'000
2020-21
Forward
estimate
$'000
Annual administered expenses:
Bindaree Beef - assistance - - 5,525 - -
Industry 4.0 Testlabs for Australia -
establishment- - 5,000 - -
Support for Industry Service Organisations
program4,086 4,042 4,043 4,104 4,178
Total annual administered expenses 4,086 4,042 14,568 4,104 4,178
Total sub-program 2.1 expenses 4,086 4,042 14,568 4,104 4,178
Annual administered expenses:
Entrepreneurs' Programme 102,792 120,001 123,356 122,357 117,652
Industry Growth Centres 60,627 78,980 59,398 42,380 51,280
Total annual administered expenses 163,419 198,981 182,754 164,737 168,932
Total sub-program 2.2 expenses 163,419 198,981 182,754 164,737 168,932
Annual administered expenses:
Advanced Manufacturing Growth Fund - 13,729 23,200 9,500 -
Automotive Transformation Scheme 9,207 2,648 - - -
Victorian Innovation and Investment Fund -
Ford assistance3,171 - - - -
Total annual administered expenses 12,378 16,377 23,200 9,500 -
Special account expenses:
Services for Other Entities and Trust Moneys -
Innovation Special Account 22,485 18,098 300 700 -
Total special account expenses 22,485 18,098 300 700 -
Total sub-program 2.3 expenses 34,863 34,475 23,500 10,200 -
Annual administered expenses:
Australian Domestic Gas Security Mechanism
- Implementation - 500 - - -
Radioactive Waste Management 8,694 16,598 12,843 - -
Total annual administered expenses 8,694 17,098 12,843 - -
Special account expenses:
Clean Energy Initiative Special Account
Carbon Capture and Storage Flagships 26,500 33,000 9,900 - -
Total special account expenses 26,500 33,000 9,900 - -
Total sub-program 2.4 expenses 35,194 50,098 22,743 - -
Expenses not requiring appropriation in the
Budget year:
Northern Australia Infrastructure Facility (a) - 139,235 523,294 583,629 425,442
Total expenses not requiring appropriation in
the Budget year - 139,235 523,294 583,629 425,442
Total sub-program 2.6 expenses - 139,235 523,294 583,629 425,442
Total program 2 expenses 237,562 426,831 766,859 762,670 598,552
Program 2: Growing Business Investment and Improving Business Capability
Sub-program 2.1: Competitive marketplace
Sub-program 2.2: Business and market development
Sub-program 2.3: Economic transition
Sub-program 2.4: Resources
Sub-program 2.6: Northern Australia Development
(a) The figures represent the expenses associated with the concessional loans proposed under the Northern Australia Infrastructure Facility.

Entity Additional Estimates Statements — DIIS
24
Table 2.1.2: Program components of Outcome 1 (continued)
2016-17
Actual
expenses
$'000
2017-18
Revised
estimated
expenses
$'000
2018-19
Forward
estimate
$'000
2019-20
Forward
estimate
$'000
2020-21
Forward
estimate
$'000
Annual departmental expenses:
Ordinary annual services (Appropriation Act No.
1 and Bill No. 3)365,838 380,903 357,513 350,715 342,231
s74 Retained revenue receipts (a) 76,536 93,618 67,801 65,008 64,774
Special accounts (b) 12,912 9,116 7,552 6,321 5,307
Expenses not requiring appropriation in the
Budget year (c)62,894 43,197 43,217 43,483 43,483
Total program 3 expenses 518,180 526,834 476,083 465,527 455,795
Program 3: Program Support
(a) Estimated expenses incurred in relation to receipts retained under section 74 of the PGPA Act.
(b) Excludes expenditure funded via the Ordinary Annual Services (Appropriation Bill No. 1) (c) Expenses not requiring appropriation are made up of depreciation expenses, amortisation expenses
and audit fees.
Table 2.1.3: Performance criteria for Outcome 1
There have been no changes to the performance criteria since the 2017–18 Budget,
therefore Table 2.1.3 is not presented. Refer to pp. 35–44 of the 2017–18 Industry,
Innovation and Science Portfolio Budget Statements for current performance criteria.
Entity Additional Estimates Statements — DIIS
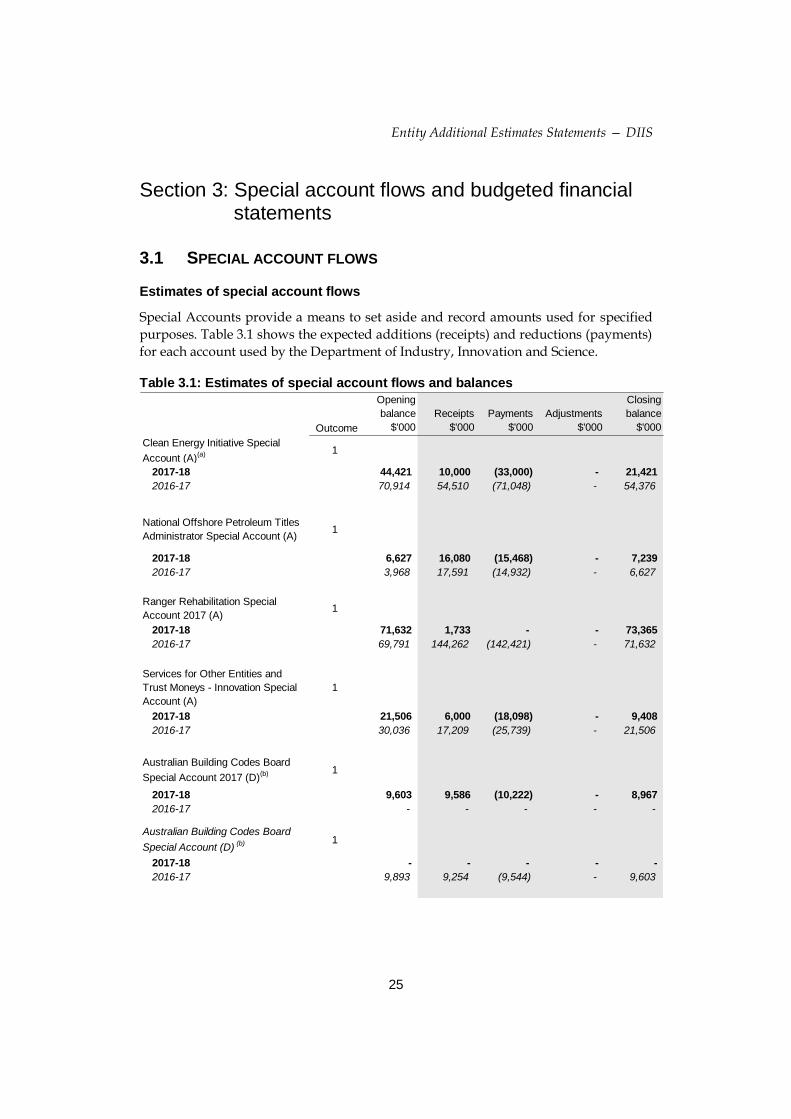
25
Section 3: Special account flows and budgeted financial statements
3.1 SPECIAL ACCOUNT FLOWS
Estimates of special account flows
Special Accounts provide a means to set aside and record amounts used for specified
purposes. Table 3.1 shows the expected additions (receipts) and reductions (payments)
for each account used by the Department of Industry, Innovation and Science.
Table 3.1: Estimates of special account flows and balances
Outcome
Opening
balance
$'000
Receipts
$'000
Payments
$'000
Adjustments
$'000
Closing
balance
$'000
Clean Energy Initiative Special
Account (A)(a) 1
2017-18 44,421 10,000 (33,000) - 21,421
2016-17 70,914 54,510 (71,048) - 54,376
National Offshore Petroleum Titles
Administrator Special Account (A)1
2017-18 6,627 16,080 (15,468) - 7,239
2016-17 3,968 17,591 (14,932) - 6,627
Ranger Rehabilitation Special
Account 2017 (A)1
2017-18 71,632 1,733 - - 73,365
2016-17 69,791 144,262 (142,421) - 71,632
Services for Other Entities and
Trust Moneys - Innovation Special
Account (A)
1
2017-18 21,506 6,000 (18,098) - 9,408
2016-17 30,036 17,209 (25,739) - 21,506
Australian Building Codes Board
Special Account 2017 (D)(b) 1
2017-18 9,603 9,586 (10,222) - 8,967
2016-17 - - - - -
Australian Building Codes Board
Special Account (D)(b) 1
2017-18 - - - - -
2016-17 9,893 9,254 (9,544) - 9,603

Entity Additional Estimates Statements — DIIS
26
Table 3.1: Estimates of special account flows and balances (continued)
Outcome
Opening
balance
$'000
Receipts
$'000
Payments
$'000
Adjustments
$'000
Closing
balance
$'000
Clean Energy Initiative Special
Account (D)1
2017-18 - - - - -
2016-17 14,723 74 (134) (14,663) -
Innovation, Science and Technology
- Donations, Bequests and
Sponsorship Special Account 2016
(D)(c)
1
2017-18 2,284 2,690 (2,894) - 2,080
2016-17 - - - - -
Science and Technology
Donations/Sponsorship Special
Account (D)(c)
1
2017-18 - - - - -
2016-17 3,535 1,983 (3,234) - 2,284
Total special accounts
2017-18 Budget estimate 156,073 46,089 (79,682) - 122,480
Total special accounts
2016-17 actual202,860 244,883 (267,052) (14,663) 166,028
(A) = Administered (D) = Departmental (a) Prior year appropriation was reduced in 2017–18 as an efficiency save.
(b) This is the extension of Determination 2006/68 - Australian Building Codes Board Special Account
Establishment 2006 which sunsetted on 1 April 2017.
(c) This is the extension of Determination 2006/40 - Science and Technology Donations/Sponsorships
Special Account Establishment 2006 which sunsetted on 1 October 2016.
Entity Additional Estimates Statements — DIIS
27
3.2 BUDGETED FINANCIAL STATEMENTS
3.2.1 Analysis of budgeted financial statements
Budgeted Departmental Income Statement
The statement shows the estimated net cost of services for the department.
The budgeted net cost of services to the department for delivering its programs in
2017–18 is $424.2 million.
Expenses
Total departmental expenses budgeted for in 2017–18 are $526.8 million, comprising
$280.7 million for employee expenses, $201.9 million for suppliers, $43.0 million for
depreciation and amortisation, $0.5 million for grants and $0.7 million for other
expenses.
Income
Total departmental own-source income budgeted for in 2017–18 is $102.6 million,
comprising $93.6 million from sale of goods and rendering of services, $8.3 million
from other independent sources and $0.7 million in resources received free of charge.
Revenue from Government for 2017–18 is budgeted at $380.9 million.
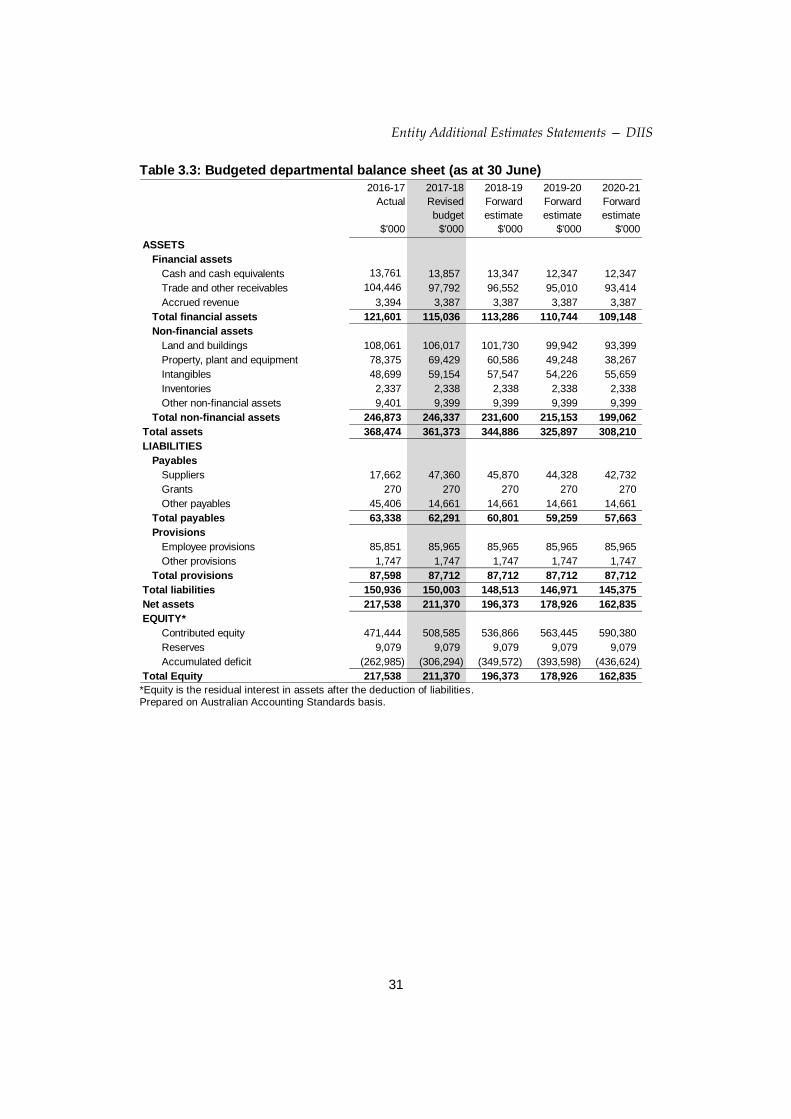
Budgeted Departmental Balance Sheet
The statement shows the estimated end of year position for departmental assets and
liabilities.
Assets
Total departmental assets budgeted for 2017–18 are $361.4 million, comprising
$246.3 million in non-financial assets and $115.0 million in financial assets.
Non-financial assets include $106.0 million for land and buildings, $69.4 million for
property, plant and equipment, $59.2 million for intangibles, $2.3 million for
inventories and $9.4 million in other assets. Financial assets consist of $97.8 million for
receivables, $13.9 million for cash, and $3.4 million in accrued revenue.
Liabilities
Total departmental liabilities budgeted for in 2017–18 are $150.0 million, comprising
$87.7 million in provisions and $62.3 million in payables.
Entity Additional Estimates Statements — DIIS
28
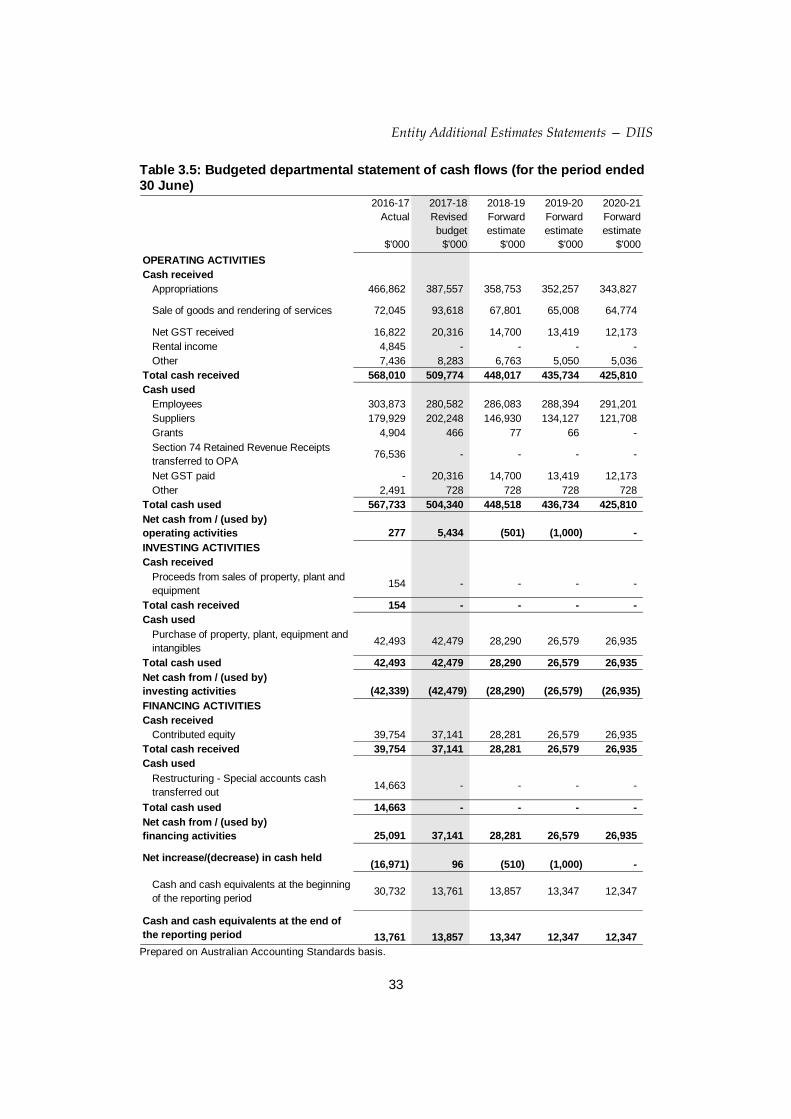
Budgeted Departmental Statement of Cash Flows
The statement provides information on estimates of the extent and nature of cash flows
by categorising the expected cash flows against operating, investing and financing
activities.
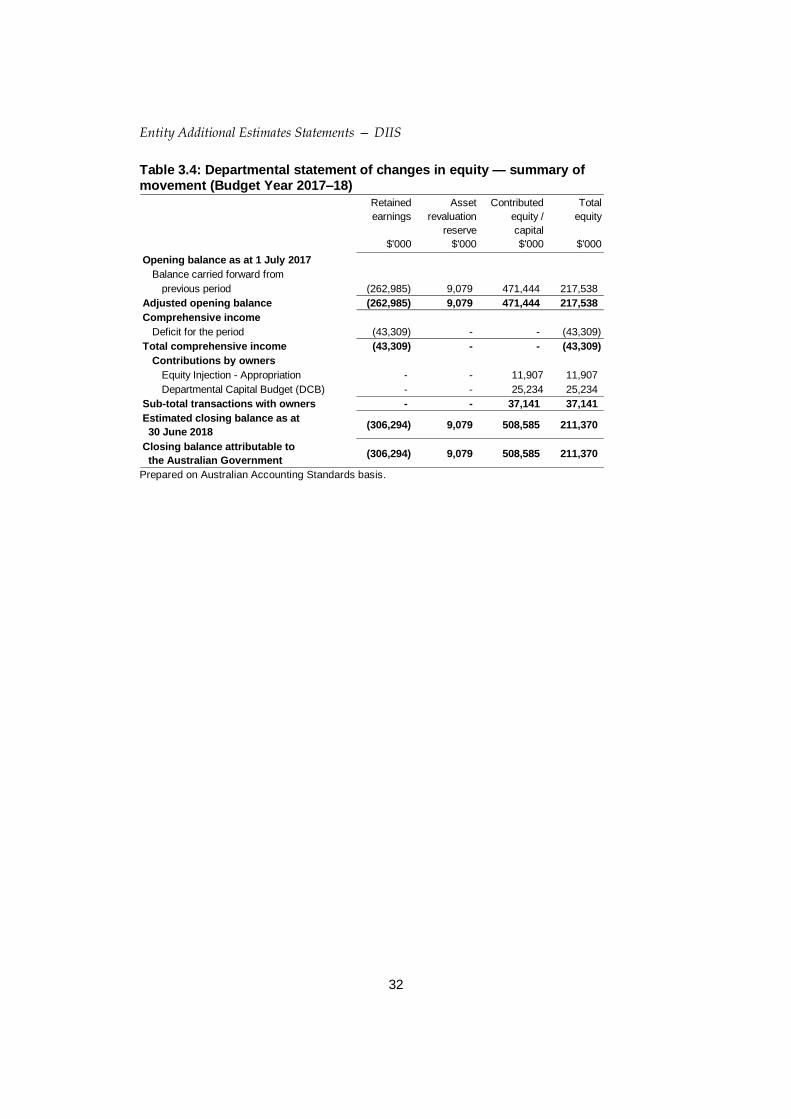
Statement of Changes in Equity – Summary of movement
The statement shows the expected movement of equity during the budget year.
Administered Financial Statements
Schedule of Budgeted Income and Expenses
The schedule shows the estimated income and expenses for programs administered by
the department on behalf of the Government.
Income
Total administered income budgeted for in 2017–18 is $997.8 million, represented by
$898.0 million in royalties, $29.1 million in interest, $48.4 million in fees and
$22.3 million in other revenue.
Expenses
Total administered expenses budgeted for in 2017–18 are $1.9 billion, represented by
$1.1 billion in payments to corporate Commonwealth entities, $467.0 million in grants,
$139.2 million in concessional loan discounts, $111.4 million in subsidies, $89.5 million
in suppliers and depreciation and $6.8 million in employee benefits.
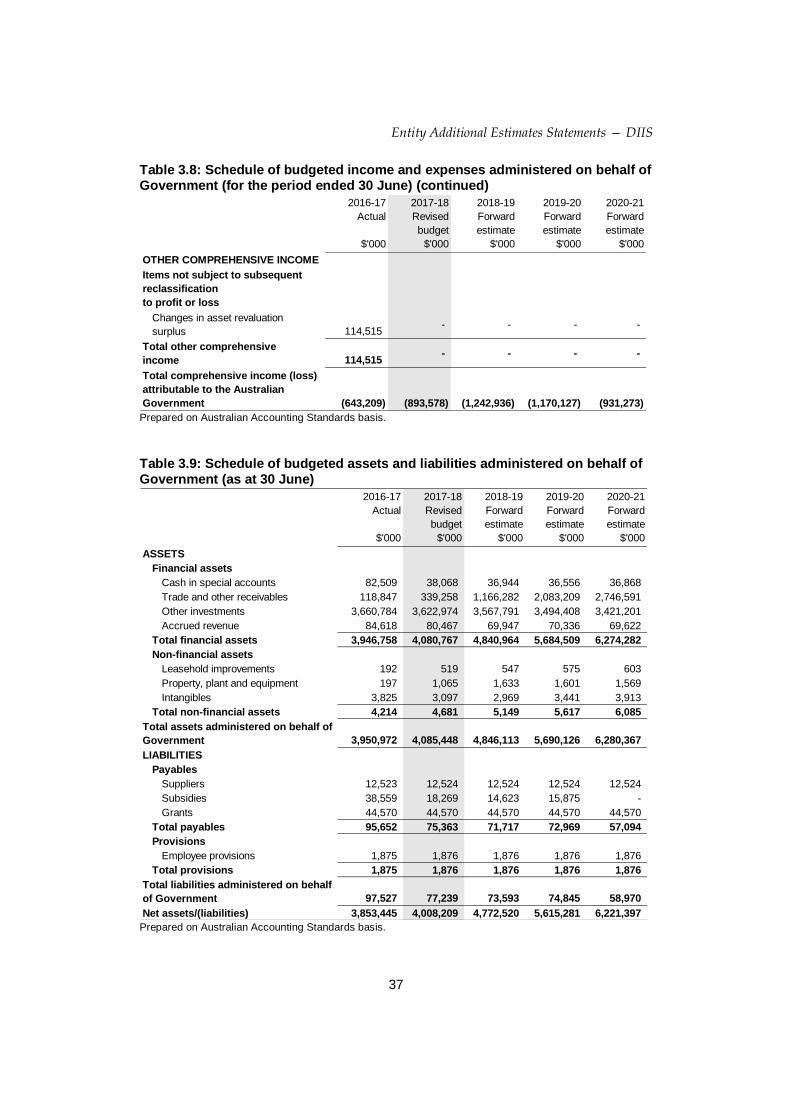
Schedule of Budgeted Assets and Liabilities
The schedule shows the estimated end of year position for assets and liabilities
administered by the department on behalf of the Government.
Assets
Total administered assets budgeted for in 2017–18 are $4.1 billion, represented by
$3.6 billion in investments, $377.3 million in cash and receivables, $80.5 million in other
financial assets and $4.7 million in non-financial assets.
Liabilities
Total administered liabilities budgeted for in 2017–18 are $77.2 million, represented by
$75.4 million in payables and $1.9 million in provisions.
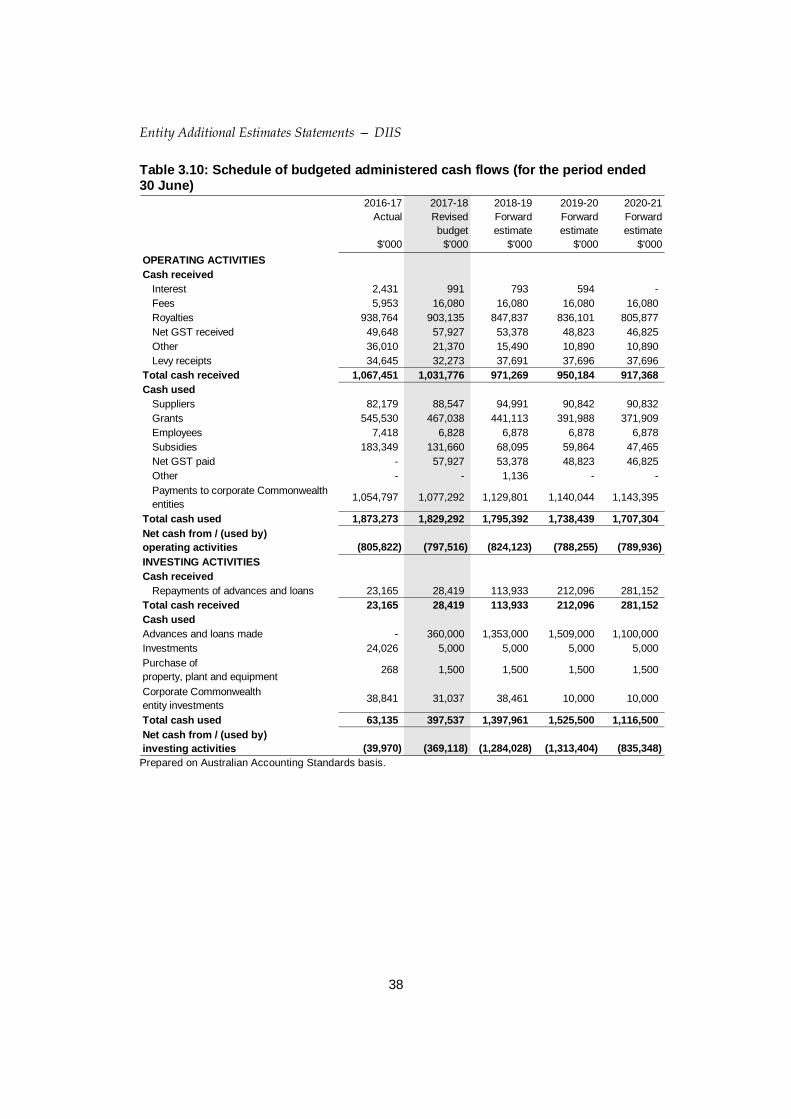
Schedule of Budgeted Administered Cash Flows
The schedule shows the estimated cash receipts and payments administered by the
department on behalf of the Government.

Entity Additional Estimates Statements — DIIS
29
3.2.2 Budgeted financial statements
Table 3.2: Comprehensive income statement (showing net cost of services) for the period ended 30 June
2016-17
Actual
$'000
2017-18
Revised
budget
$'000
2018-19
Forward
estimate
$'000
2019-20
Forward
estimate
$'000
2020-21
Forward
estimate
$'000
EXPENSES
Employee benefits 293,456 280,696 286,083 288,394 291,201
Suppliers 165,340 201,935 146,168 133,313 120,840
Grants 3,499 466 77 66 -
Depreciation and amortisation 38,089 43,009 43,027 43,026 43,026
Write-down and impairment of assets 16,854 - - - -
Losses from asset sales 338 - - - -
Other expenses 604 728 728 728 728
Total expenses 518,180 526,834 476,083 465,527 455,795
LESS:
OWN-SOURCE INCOME
Own-source revenue
Sale of goods and rendering 67,826 93,618 67,801 65,008 64,774
of services
Interest 63 - - - -
Rental income
Other revenue 16,659 8,276 6,763 5,050 5,036
Total own-source revenue 84,548 101,894 74,564 70,058 69,810
Gains
Foreign exchange gains 3 - - - -
Reversals of previous asset
write-downs and impairments 2 - - - -
Other gains 24,852 728 728 728 728
Total gains 24,857 728 728 728 728
Total own-source income 109,405 102,622 75,292 70,786 70,538
Net cost of / (contribution by)
services (408,775) (424,212) (400,791) (394,741) (385,257)
Revenue from Government 365,838 380,903 357,513 350,715 342,231
Deficit attributable to the Australian
Government (42,937) (43,309) (43,278) (44,026) (43,026)
OTHER COMPREHENSIVE INCOME
Changes in asset revaluation reserve (2,166) - - - -
Total other comprehensive
income/(loss) (2,166) - - - -
Total comprehensive income/(loss)
attributable to the Australian Government(45,103) (43,309) (43,278) (44,026) (43,026)

Entity Additional Estimates Statements — DIIS
30
Table 3.2: Comprehensive income statement (showing net cost of services) for the period ended 30 June (continued)
2016-17
$'000
2017-18
$'000
2018-19
$'000
2019-20
$'000
2020-21
$'000
Total comprehensive income/(loss)
excluding depreciation/
amortisation expenses previously
funded through revenue
appropriations
(7,014) (300) (251) (1,000) -
less depreciation/amortisation
expenses previously funded through
revenue appropriations (38,089) (43,009) (43,027) (43,026) (43,026)
Total comprehensive income/(loss)
- as per the statement of
comprehensive income
(45,103) (43,309) (43,278) (44,026) (43,026)
Prepared on Australian Accounting Standards basis.
Entity Additional Estimates Statements — DIIS
31
Table 3.3: Budgeted departmental balance sheet (as at 30 June)
2016-17
Actual
$'000
2017-18
Revised
budget
$'000
2018-19
Forward
estimate
$'000
2019-20
Forward
estimate
$'000
2020-21
Forward
estimate
$'000
ASSETS
Financial assets
Cash and cash equivalents 13,761 13,857 13,347 12,347 12,347
Trade and other receivables 104,446 97,792 96,552 95,010 93,414
Accrued revenue 3,394 3,387 3,387 3,387 3,387
Total financial assets 121,601 115,036 113,286 110,744 109,148
Non-financial assets
Land and buildings 108,061 106,017 101,730 99,942 93,399
Property, plant and equipment 78,375 69,429 60,586 49,248 38,267
Intangibles 48,699 59,154 57,547 54,226 55,659
Inventories 2,337 2,338 2,338 2,338 2,338
Other non-financial assets 9,401 9,399 9,399 9,399 9,399
Total non-financial assets 246,873 246,337 231,600 215,153 199,062
Total assets 368,474 361,373 344,886 325,897 308,210
LIABILITIES
Payables
Suppliers 17,662 47,360 45,870 44,328 42,732
Grants 270 270 270 270 270
Other payables 45,406 14,661 14,661 14,661 14,661
Total payables 63,338 62,291 60,801 59,259 57,663
Provisions
Employee provisions 85,851 85,965 85,965 85,965 85,965
Other provisions 1,747 1,747 1,747 1,747 1,747
Total provisions 87,598 87,712 87,712 87,712 87,712
Total liabilities 150,936 150,003 148,513 146,971 145,375
Net assets 217,538 211,370 196,373 178,926 162,835
EQUITY*
Contributed equity 471,444 508,585 536,866 563,445 590,380
Reserves 9,079 9,079 9,079 9,079 9,079
Accumulated deficit (262,985) (306,294) (349,572) (393,598) (436,624)
Total Equity 217,538 211,370 196,373 178,926 162,835 *Equity is the residual interest in assets after the deduction of liabilities. Prepared on Australian Accounting Standards basis.
Entity Additional Estimates Statements — DIIS
32
Table 3.4: Departmental statement of changes in equity — summary of movement (Budget Year 2017–18)
Retained
earnings
$'000
Asset
revaluation
reserve
$'000
Contributed
equity /
capital
$'000
Total
equity
$'000
Opening balance as at 1 July 2017
Balance carried forward from
previous period (262,985) 9,079 471,444 217,538
Adjusted opening balance (262,985) 9,079 471,444 217,538
Comprehensive income
Deficit for the period (43,309) - - (43,309)
Total comprehensive income (43,309) - - (43,309)
Contributions by owners
Equity Injection - Appropriation - - 11,907 11,907
Departmental Capital Budget (DCB) - - 25,234 25,234
Sub-total transactions with owners - - 37,141 37,141
Estimated closing balance as at
30 June 2018(306,294) 9,079 508,585 211,370
Closing balance attributable to
the Australian Government(306,294) 9,079 508,585 211,370
Prepared on Australian Accounting Standards basis.
Entity Additional Estimates Statements — DIIS
33
Table 3.5: Budgeted departmental statement of cash flows (for the period ended 30 June)
2016-17
Actual
$'000
2017-18
Revised
budget
$'000
2018-19
Forward
estimate
$'000
2019-20
Forward
estimate
$'000
2020-21
Forward
estimate
$'000
OPERATING ACTIVITIES
Cash received
Appropriations 466,862 387,557 358,753 352,257 343,827
Sale of goods and rendering of services 72,045 93,618 67,801 65,008 64,774
Net GST received 16,822 20,316 14,700 13,419 12,173
Rental income 4,845 - - - -
Other 7,436 8,283 6,763 5,050 5,036
Total cash received 568,010 509,774 448,017 435,734 425,810
Cash used
Employees 303,873 280,582 286,083 288,394 291,201
Suppliers 179,929 202,248 146,930 134,127 121,708
Grants 4,904 466 77 66 -
Section 74 Retained Revenue Receipts
transferred to OPA76,536 - - - -
Net GST paid - 20,316 14,700 13,419 12,173
Other 2,491 728 728 728 728
Total cash used 567,733 504,340 448,518 436,734 425,810
Net cash from / (used by)
operating activities 277 5,434 (501) (1,000) -
INVESTING ACTIVITIES
Cash received
Proceeds from sales of property, plant and
equipment154 - - - -
Total cash received 154 - - - -
Cash used
Purchase of property, plant, equipment and
intangibles42,493 42,479 28,290 26,579 26,935
Total cash used 42,493 42,479 28,290 26,579 26,935
Net cash from / (used by)
investing activities (42,339) (42,479) (28,290) (26,579) (26,935)
FINANCING ACTIVITIES
Cash received
Contributed equity 39,754 37,141 28,281 26,579 26,935
Total cash received 39,754 37,141 28,281 26,579 26,935
Cash used
Restructuring - Special accounts cash
transferred out 14,663 - - - -
Total cash used 14,663 - - - -
Net cash from / (used by)
financing activities 25,091 37,141 28,281 26,579 26,935
Net increase/(decrease) in cash held(16,971) 96 (510) (1,000) -
Cash and cash equivalents at the beginning
of the reporting period30,732 13,761 13,857 13,347 12,347
Cash and cash equivalents at the end of
the reporting period 13,761 13,857 13,347 12,347 12,347 Prepared on Australian Accounting Standards basis.

Entity Additional Estimates Statements — DIIS
34
Table 3.6: Departmental capital budget statement (for the period ended 30 June) 2016-17
Actual
$'000
2017-18
Revised
budget
$'000
2018-19
Forward
estimate
$'000
2019-20
Forward
estimate
$'000
2020-21
Forward
estimate
$'000
NEW CAPITAL APPROPRIATIONS
Capital budget - Act No. 1 (DCB) 29,697 25,234 25,174 25,242 25,591
Equity injections - Act No. 2 10,057 11,907 3,107 1,337 1,344
Total new capital appropriations 39,754 37,141 28,281 26,579 26,935
Provided for:
Purchase of non-financial assets 39,754 37,141 28,281 26,579 26,935
Total Items 39,754 37,141 28,281 26,579 26,935
PURCHASE OF NON-FINANCIAL ASSETS
Funded by capital appropriations 10,057 14,236 3,107 1,337 1,344
Funded by capital appropriation - DCB 29,697 26,156 25,174 25,242 25,591
Funded internally from departmental
resources 3,175 2,087 9 - -
TOTAL AMOUNT SPENT 42,929 42,479 28,290 26,579 26,935
RECONCILIATION OF CASH USED TO
ACQUIRE ASSETS TO ASSET MOVEMENT
TABLE
Total purchases 42,929 42,479 28,290 26,579 26,935
TOTAL CASH REQUIRED TO ACQUIRE
ASSETS 42,929 42,479 28,290 26,579 26,935 Prepared on Australian Accounting Standards basis.

35 E
ntity A
dditional E
stimates S
tatemen
t — D
IIS
Table 3.7: Statement of asset movements (2017–18 Budget year) Buildings
$'000
Other
property,
plant and
equipment
$'000
Computer
software
and
intangibles
$'000
Total
$'000
As at 1 July 2017
Gross book value 108,056 122,085 108,916 339,057
Accumulated depreciation/amortisation and
impairment - (43,710) (60,217) (103,927)
Opening net book balance 108,056 78,375 48,699 235,130
CAPITAL ASSET ADDITIONS
Estimated expenditure on new or
replacement assets
By purchase - appropriation ordinary
annual services 9,411 13,013 20,055 42,479
Total additions 9,411 13,013 20,055 42,479
Other movements
Depreciation/amortisation expense (11,450) (21,959) (9,600) (43,009)
Total other movements (11,450) (21,959) (9,600) (43,009)
As at 30 June 2018
Gross book value 117,467 135,098 128,971 381,536
Accumulated depreciation/amortisation and
impairment (11,450) (65,669) (69,817) (146,936)
Closing net book balance 106,017 69,429 59,154 234,600 Prepared on Australian Accounting Standards basis.

Entity Additional Estimates Statement — DIIS
36
Table 3.8: Schedule of budgeted income and expenses administered on behalf of Government (for the period ended 30 June)
2016-17
Actual
$'000
2017-18
Revised
budget
$'000
2018-19
Forward
estimate
$'000
2019-20
Forward
estimate
$'000
2020-21
Forward
estimate
$'000
EXPENSES ADMINISTERED ON
BEHALF OF GOVERNMENT
Employee benefits 7,026 6,828 6,878 6,878 6,878
Suppliers 76,412 88,507 94,951 90,802 90,792
Fees 40 40 40 40 40
Subsidies 168,489 111,370 64,449 61,116 31,590
Grants 490,589 467,038 441,113 391,988 371,909
Depreciation and amortisation 1,227 1,032 1,032 1,032 1,032
Payments to corporate
Commonwealth entities 1,054,797 1,077,292 1,129,801 1,140,044 1,143,395
Concessional loan discount - 139,235 523,294 583,629 425,442
Total expenses administered on
behalf of Government 1,798,580 1,891,342 2,261,558 2,275,529 2,071,078
LESS:
OWN-SOURCE INCOME
Own-source revenue
Taxation revenue
Indirect tax 942 750 550 550 550
Total taxation revenue 942 750 550 550 550
Non-taxation revenue
Fees from regulatory services 49,882 48,353 53,771 53,776 53,776
Fees 5,875 - - - -
Interest 9,572 29,057 112,044 204,246 269,976
Royalties 950,106 897,985 836,301 835,457 804,112
Other non-taxation revenue 24,231 21,619 15,956 11,373 11,391
Total non-taxation revenue 1,039,666 997,014 1,018,072 1,104,852 1,139,255
Total own-source revenue
administered on behalf of
Government 1,040,608 997,764 1,018,622 1,105,402 1,139,805
Gains
Reversal of previous asset write-
downs and impairments248 - - - -
Total gains administered on
behalf of Government 248 - - - -
Total own-source income
administered on behalf of
Government 1,040,856 997,764 1,018,622 1,105,402 1,139,805
Net (cost of)/contribution by
services (757,724) (893,578) (1,242,936) (1,170,127) (931,273)
Total comprehensive income
(loss) (757,724) (893,578) (1,242,936) (1,170,127) (931,273) Prepared on Australian Accounting Standards basis.
Entity Additional Estimates Statements — DIIS
37
Table 3.8: Schedule of budgeted income and expenses administered on behalf of Government (for the period ended 30 June) (continued)
2016-17
Actual
$'000
2017-18
Revised
budget
$'000
2018-19
Forward
estimate
$'000
2019-20
Forward
estimate
$'000
2020-21
Forward
estimate
$'000
OTHER COMPREHENSIVE INCOME
Items not subject to subsequent
reclassification
to profit or loss
Changes in asset revaluation
surplus 114,515- - - -
Total other comprehensive
income 114,515- - - -
Total comprehensive income (loss)
attributable to the Australian
Government (643,209) (893,578) (1,242,936) (1,170,127) (931,273) Prepared on Australian Accounting Standards basis.
Table 3.9: Schedule of budgeted assets and liabilities administered on behalf of Government (as at 30 June)
2016-17
Actual
$'000
2017-18
Revised
budget
$'000
2018-19
Forward
estimate
$'000
2019-20
Forward
estimate
$'000
2020-21
Forward
estimate
$'000
ASSETS
Financial assets
Cash in special accounts 82,509 38,068 36,944 36,556 36,868
Trade and other receivables 118,847 339,258 1,166,282 2,083,209 2,746,591
Other investments 3,660,784 3,622,974 3,567,791 3,494,408 3,421,201
Accrued revenue 84,618 80,467 69,947 70,336 69,622
Total financial assets 3,946,758 4,080,767 4,840,964 5,684,509 6,274,282
Non-financial assets
Leasehold improvements 192 519 547 575 603
Property, plant and equipment 197 1,065 1,633 1,601 1,569
Intangibles 3,825 3,097 2,969 3,441 3,913
Total non-financial assets 4,214 4,681 5,149 5,617 6,085
Total assets administered on behalf of
Government 3,950,972 4,085,448 4,846,113 5,690,126 6,280,367
LIABILITIES
Payables
Suppliers 12,523 12,524 12,524 12,524 12,524
Subsidies 38,559 18,269 14,623 15,875 -
Grants 44,570 44,570 44,570 44,570 44,570
Total payables 95,652 75,363 71,717 72,969 57,094
Provisions
Employee provisions 1,875 1,876 1,876 1,876 1,876
Total provisions 1,875 1,876 1,876 1,876 1,876
Total liabilities administered on behalf
of Government 97,527 77,239 73,593 74,845 58,970
Net assets/(liabilities) 3,853,445 4,008,209 4,772,520 5,615,281 6,221,397 Prepared on Australian Accounting Standards basis.
Entity Additional Estimates Statements — DIIS
38
Table 3.10: Schedule of budgeted administered cash flows (for the period ended 30 June)
2016-17
Actual
$'000
2017-18
Revised
budget
$'000
2018-19
Forward
estimate
$'000
2019-20
Forward
estimate
$'000
2020-21
Forward
estimate
$'000
OPERATING ACTIVITIES
Cash received
Interest 2,431 991 793 594 -
Fees 5,953 16,080 16,080 16,080 16,080
Royalties 938,764 903,135 847,837 836,101 805,877
Net GST received 49,648 57,927 53,378 48,823 46,825
Other 36,010 21,370 15,490 10,890 10,890
Levy receipts 34,645 32,273 37,691 37,696 37,696
Total cash received 1,067,451 1,031,776 971,269 950,184 917,368
Cash used
Suppliers 82,179 88,547 94,991 90,842 90,832
Grants 545,530 467,038 441,113 391,988 371,909
Employees 7,418 6,828 6,878 6,878 6,878
Subsidies 183,349 131,660 68,095 59,864 47,465
Net GST paid - 57,927 53,378 48,823 46,825
Other - - 1,136 - -
Payments to corporate Commonwealth
entities1,054,797 1,077,292 1,129,801 1,140,044 1,143,395
Total cash used 1,873,273 1,829,292 1,795,392 1,738,439 1,707,304
Net cash from / (used by)
operating activities (805,822) (797,516) (824,123) (788,255) (789,936)
INVESTING ACTIVITIES
Cash received
Repayments of advances and loans 23,165 28,419 113,933 212,096 281,152
Total cash received 23,165 28,419 113,933 212,096 281,152
Cash used
Advances and loans made - 360,000 1,353,000 1,509,000 1,100,000
Investments 24,026 5,000 5,000 5,000 5,000
Purchase of
property, plant and equipment268 1,500 1,500 1,500 1,500
Corporate Commonwealth
entity investments38,841 31,037 38,461 10,000 10,000
Total cash used 63,135 397,537 1,397,961 1,525,500 1,116,500
Net cash from / (used by)
investing activities (39,970) (369,118) (1,284,028) (1,313,404) (835,348)
Prepared on Australian Accounting Standards basis.

Entity Additional Estimates Statements — DIIS
39
Table 3.10: Schedule of budgeted administered cash flows (for the period ended 30 June) (continued)
2016-17
Actual
$'000
2017-18
Revised
budget
$'000
2018-19
Forward
estimate
$'000
2019-20
Forward
estimate
$'000
2020-21
Forward
estimate
$'000
FINANCING ACTIVITIES
Cash from Official Public Account
Appropriations 1,707,178 1,672,531 1,698,569 1,656,763 1,628,284
Appropriations - Administered
assets and liabilities24,053 365,000 1,358,000 1,514,000 1,105,000
Equity appropriation -
corporate Commonwealth entities38,841 31,037 38,461 10,000 10,000
Special accounts 54,510 33,813 27,741 17,885 17,927
GST appropriations 55,711 57,927 53,378 48,823 46,825
Total cash received 1,880,293 2,160,308 3,176,149 3,247,471 2,808,036
Cash to Official Public Account
Appropriations (939,151) (913,622) (988,640) (1,080,909) (1,119,847)
Special accounts (66,566) (66,566) (27,104) (16,468) (15,768)
GST appropriations (51,192) (57,927) (53,378) (48,823) (46,825)
Total cash used (1,056,909) (1,038,115) (1,069,122) (1,146,200) (1,182,440)
Net cash from/(used by) financing
activities 823,384 1,122,193 2,107,027 2,101,271 1,625,596
Net increase/(decrease) in cash held (22,408) (44,441) (1,124) (388) 312
Cash and cash equivalents at beginning
of reporting period104,917 82,509 38,068 36,944 36,556
Cash and cash equivalents at end of
reporting period 82,509 38,068 36,944 36,556 36,868
Prepared on Australian Accounting Standards basis.
Table 3.11: Schedule of administered capital budget (for the period ended 30 June)
2016-17
Actual
$'000
2017-18
Revised
budget
$'000
2018-19
Forward
estimate
$'000
2019-20
Forward
estimate
$'000
2020-21
Forward
estimate
$'000
NEW CAPITAL APPROPRIATIONS
Administered Assets and
Liabilities - Bill 2 28,938 8,000 5,000 5,000 5,000
Total new capital appropriations 28,938 8,000 5,000 5,000 5,000
Provided for:
Other Items 28,938 8,000 5,000 5,000 5,000
Total Items 28,938 8,000 5,000 5,000 5,000
Prepared on Australian Accounting Standards basis.
40
En
tity Addition
al Estim
ates Statem
ent —
DIIS
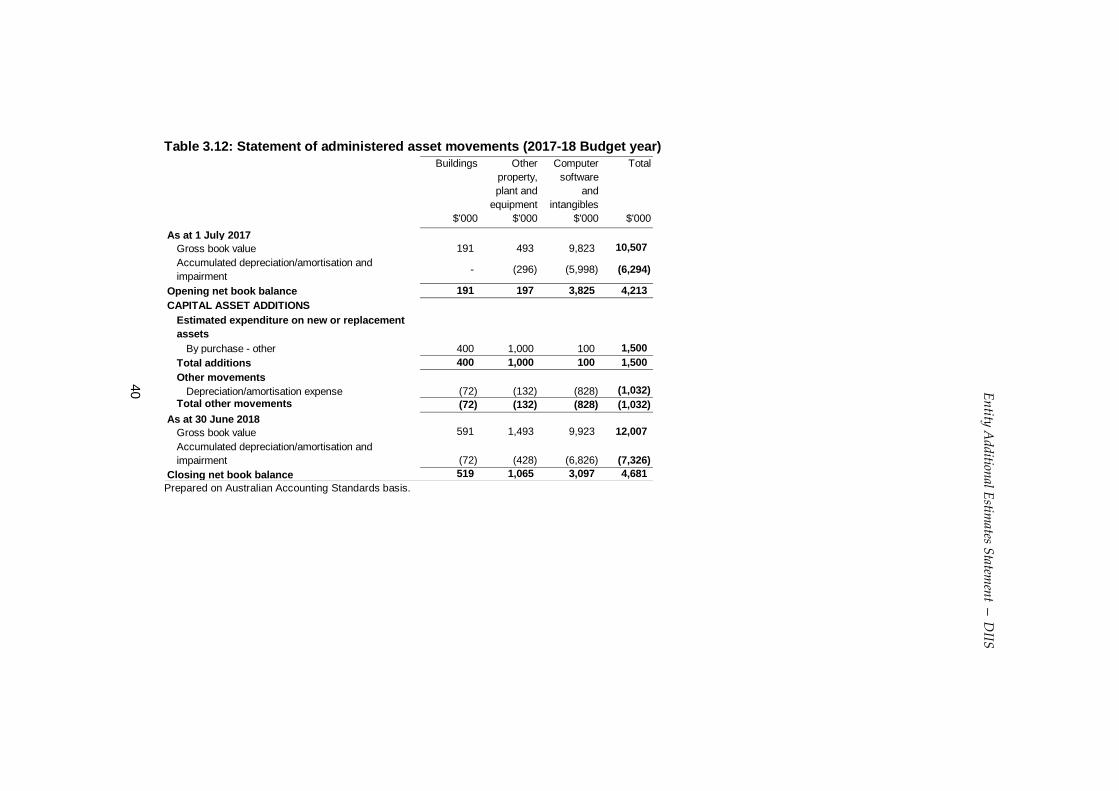
Table 3.12: Statement of administered asset movements (2017-18 Budget year)
Buildings
$'000
Other
property,
plant and
equipment
$'000
Computer
software
and
intangibles
$'000
Total
$'000
As at 1 July 2017
Gross book value 191 493 9,823 10,507
Accumulated depreciation/amortisation and
impairment- (296) (5,998) (6,294)
Opening net book balance 191 197 3,825 4,213
CAPITAL ASSET ADDITIONS
Estimated expenditure on new or replacement
assets
By purchase - other 400 1,000 100 1,500
Total additions 400 1,000 100 1,500
Other movements
Depreciation/amortisation expense (72) (132) (828) (1,032)
Total other movements (72) (132) (828) (1,032)
As at 30 June 2018
Gross book value 591 1,493 9,923 12,007
Accumulated depreciation/amortisation and
impairment (72) (428) (6,826) (7,326)
Closing net book balance 519 1,065 3,097 4,681 Prepared on Australian Accounting Standards basis.

41
AUSTRALIAN INSTITUTE OF MARINE SCIENCE
Section 1: Entity overview and resources ............................................................. 43
1.1 Strategic direction statement .............................................................................. 43
1.2 Entity resource statement ................................................................................... 44
1.3 2017–18 measures since Budget ........................................................................ 45
1.4 Additional estimates, resourcing and variations to outcomes ............................... 45
1.5 Breakdown of additional estimates by Appropriation Bill ..................................... 46
Section 2: Revisions to outcomes and planned performance .............................. 47
2. Changes to outcome and program structures since the last budget statement ............................................................................................................. 47
2.1 Budgeted expenses and performance for Outcome 1 ......................................... 47
2.1.1 Budgeted expenses for Outcome 1 .................................................................. 48
2.1.2 Program components of Outcome 1 ................................................................ 48
2.1.3 Performance criteria for Outcome 1 ................................................................. 48
Section 3: Special account flows and budgeted financial statements ................. 49
3.1 Estimates of special account flows and balances ................................................ 49
3.2 Budgeted financial statements ............................................................................ 49


43
AUSTRALIAN INSTITUTE OF MARINE SCIENCE
Section 1: Entity overview and resources
1.1 STRATEGIC DIRECTION STATEMENT
The Australian Institute of Marine Science (AIMS) is a corporate Commonwealth entity
established by the Australian Institute of Marine Science Act 1972 (AIMS Act).
The mission of AIMS is to provide research and knowledge of Australia’s tropical
marine estate required to support growth in its sustainable use, effective
environmental management and protection of its unique ecosystems.
On 22 January 2018, the Prime Minister, with the Minister for Jobs and Innovation and
the Minister for the Environment and Energy, announced an 18 month research and
development program for coral reef restoration. The additional appropriation for
AIMS is to assess the viability of developing and deploying coral reef restoration and
adaption technologies onto the Great Barrier Reef. The funding will enable scientific,
engineering and social validation of the proposed program approach, stakeholder and
partner engagement (Australian and international), development of co-ordination and
governance frameworks, future program costing (research and development and
deployment phases), the identification of funding options, and independent review.
Further details of AIMS’ strategic direction can be found in the 2017–18 Portfolio
Budget Statements or in the Corporate Plan 2017–2018 at www.aims.gov.au.

Entity Additional Estimates Statements — AIMS
44
1.2 ENTITY RESOURCE STATEMENT
The Entity Resource Statement details the resourcing for AIMS at Additional
Estimates. Table 1.1 outlines the total resourcing available from all sources for the
2017–18 Budget year, including variations through Appropriation Bills No. 3 and
No. 4, Special Appropriations and Special Accounts.
Table 1.1: AIMS resource statement — Additional Estimates for 2017–18 as at Additional Estimates February 2018
Actual
available
appropriation
2016-17
$'000
Estimate
as at
Budget
2017-18
$'000
Proposed
Additional
Estimates
2017-18
$'000
Total
estimate at
Additional
Estimates
2017-18
$'000
Opening balance/Reserves at bank 36,438 35,504 - 35,504
Revenue from Government
Ordinary annual services (a)
Outcome 1 41,552 41,916 2,931 44,847
Total ordinary annual services 41,552 41,916 2,931 44,847
Other services (b)
Equity Injection - 1,600 - 1,600
Total annual appropriations 41,552 43,516 2,931 46,447
Total funds from Government 41,552 43,516 2,931 46,447
Funds from other sources
Interest 1,272 1,114 86 1,200
Sale of goods and services 16,623 19,838 (145) 19,693
Other 1,117 376 - 376
Total funds from other sources 19,012 21,328 (59) 21,269
Total net resourcing for agency 97,002 100,348 2,872 103,220
Actual 2016-17 2017-18
Average staffing level (number) 221 228 All figures are GST exclusive.
(a) Appropriation Act (No. 1) 2017–2018 and Appropriation Bill (No. 3) 2017–2018 (b) Appropriation Act (No. 2) 2017–2018 and Appropriation Bill (No. 4) 2017–2018
Note: AIMS is not directly appropriated as it is a corporate Commonwealth entity. Appropriations are made to DIIS, which are then paid to AIMS and are considered "departmental" for all purposes.

Entity Additional Estimates Statements — AIMS
45
1.3 ENTITY MEASURES
Table 1.2 summarises new Government measures taken since the 2017–18 Budget. The
table is split into revenue, expense and capital measures, with the affected program
identified.
Table 1.2: Entity 2017–18 measures since Budget
Program 2017-18
$'000
2018-19
$'000
2019-20
$'000
2020-21
$'000
Expense measures
Investing in the future of our
Great Barrier Reef 1
Departmental expenses (a) 2,931 3,036 - -
Total 2,931 3,036 - - Prepared on a Government Financial Statistics (fiscal) basis. (a) Measure relates to a decision made post MYEFO.
1.4 ADDITIONAL ESTIMATES, RESOURCING AND VARIATIONS TO
OUTCOMES
The following tables detail the changes to the resourcing for AIMS at Additional
Estimates, by outcome. Table 1.3 details the Additional Estimates resulting from new
measures and other variations since the 2017–18 Budget in Appropriation
Bills Nos. 3 and 4.
Table 1.3: Additional estimates and other variations to outcomes since 2017–18 Budget
Program
impacted
2017-18
$'000
2018-19
$'000
2019-20
$'000
2020-21
$'000
Outcome 1
Departmental
Annual appropriations
Investing in the future of
our Great Barrier Reef1 2,931 3,036
Changes in Parameters
net increase 1 - 36 36 74
Net impact on appropriations for
Outcome 1 (departmental) 2,931 3,072 36 74
Total net impact on appropriations for
Outcome 1 2,931 3,072 36 74

Entity Additional Estimates Statements — AIMS
46
1.5 BREAKDOWN OF ADDITIONAL ESTIMATES BY APPROPRIATION
BILL
The following tables detail the Additional Estimates sought for AIMS through
Appropriation Bills Nos. 3 and 4.
Table 1.4: Appropriation Bill (No. 3) 2017–18
2016-17
Available
$'000
2017-18
Budget
$'000
2017-18
Revised
$'000
Additional
Estimates
$'000
Reduced
Estimates
$'000
Departmental program
Outcome 1
Growth of knowledge to support
protection and sustainable
development of Australia's marine
resources through innovative marine
science and technology.
41,552 41,916 44,847 2,931 -
Total departmental 41,552 41,916 44,847 2,931 -
Table 1.5: Appropriation Bill (No. 4) 2017–18
AIMS has not received any additional appropriations from Appropriation Bill No. 4;
therefore Table 1.5 is not presented.

Entity Additional Estimates Statements — AIMS
47
Section 2: Revisions to outcomes and planned performance
2. CHANGES TO OUTCOME AND PROGRAM STRUCTURES
There have been no changes to outcome and program structures since the 2017–18
Portfolio Budget Statements.
2.1 BUDGETED EXPENSES AND PERFORMANCE FOR OUTCOME 1
Outcome 1: Growth of knowledge to support protection and sustainable
development of Australia’s marine resources through innovative marine
science and technology.
Linked programs
There have been no changes to linked programs for Outcome 1 since the 2017–18
Portfolio Budget Statements.

Entity Additional Estimates Statements — AIMS
48
Budgeted expenses for Outcome 1
This table shows how much the entity intends to spend (on an accrual basis) on
achieving the outcome, broken down by program, as well as by Administered and
Departmental funding sources.
Table 2.1.1 Budgeted expenses for Outcome 1
2016-17
Actual
expenses
$'000
2017-18
Revised
estimated
expenses
$'000
2018-19
Forward
estimate
$'000
2019-20
Forward
estimate
$'000
2020-21
Forward
estimate
$'000
Program 1: Marine Research
Revenue from Government
Ordinary annual services
(Appropriation Act No. 1)41,552 44,847 47,377 44,836 45,371
Expenses not requiring appropriation
in the budget year (a)1,474 4,099 4,116 3,753 3,837
Revenues from industry sources 18,312 21,603 19,644 19,894 19,872
Total expenses for Program 1.1 61,338 70,549 71,137 68,483 69,080
Outcome 1 totals by resource type
Revenue from Government
Ordinary annual services
(Appropriation Act No. 1)41,552 44,847 47,377 44,836 45,371
Expenses not requiring appropriation
in the budget year1,573 4,099 4,116 3,753 3,837
Revenues from industry sources 18,312 21,603 19,644 19,894 19,872
Total expenses for Outcome 1 61,437 70,549 71,137 68,483 69,080
2016-17 2017-18
Average staffing level (number) 221 228
Outcome 1: Growth of knowledge to support protection and sustainable development of Australia's marine
resources through innovative marine science and technology.
(a) Expenses not requiring appropriation in the Budget year are made up of depreciation expenses and
amortisation expenses.
Table 2.1.2: Program components for Outcome 1
AIMS has only one program and outcome; therefore Table 2.1.2 is not presented.
Table 2.1.3: Performance criteria for Outcome 1
There have been no changes to the performance criteria since the 2017–18 Budget.
Refer to pp. 72–73 of the Industry, Innovation and Science Portfolio Budget Statements
and the Corporate Plan 2017–2018 at www.aims.gov.au for current performance
criteria.

Entity Additional Estimates Statements — AIMS
49
Section 3: Special account flows and budgeted financial statements
3.1 SPECIAL ACCOUNT FLOWS
Estimates of special account flows
Special Accounts provide a means to set aside and record amounts used for specified
purposes. AIMS has no special accounts; therefore Table 3.1 is not presented.
3.2 BUDGETED FINANCIAL STATEMENTS
3.2.1 Analysis of budgeted financial statements
The additional appropriation primarily relates to the new measure ‘Investing in the
future of our Great Barrier Reef’, which provides $6.0 million over two years from
2017–18 to undertake a program feasibility and assessment phase.

Entity Additional Estimates Statements — AIMS
50
3.2.2 Budgeted financial statements
Table 3.2: Comprehensive income statement (showing net cost of services) for the period ended 30 June
2016-17
Actual
$'000
2017-18
Revised
budget
$'000
2018-19
Forward
estimate
$'000
2019-20
Forward
estimate
$'000
2020-21
Forward
estimate
$'000
EXPENSES
Employee benefits 27,404 28,343 28,921 29,873 30,648
Suppliers 22,103 30,086 30,079 26,836 26,574
Depreciation and amortisation 11,758 12,120 12,137 11,774 11,858
Losses from asset sales 146 - - - -
Other expenses 26 - - - -
Total expenses 61,437 70,549 71,137 68,483 69,080
LESS:
OWN-SOURCE INCOME
Own-source revenue
Sale of goods and rendering of services 16,318 20,263 18,294 18,544 18,522
Interest 1,109 1,200 1,200 1,200 1,200
Other 885 140 150 150 150
Total own-source revenue 18,312 21,603 19,644 19,894 19,872
Gains
Sale of assets 99 - - - -
Total gains 99 - - - -
Total own-source income 18,411 21,603 19,644 19,894 19,872
Net (cost of)/contribution by
services 43,026 48,946 51,493 48,589 49,208
Revenue from Government 41,552 44,847 47,377 44,836 45,371
Surplus/(deficit) attributable to the
Australian Government (1,474) (4,099) (4,116) (3,753) (3,837)
Total comprehensive income/(loss)
attributable to the Australian
Government (1,474) (4,099) (4,116) (3,753) (3,837) Prepared on Australian Accounting Standards basis.

Entity Additional Estimates Statements — AIMS
51
Table 3.3: Budgeted departmental balance sheet (as at 30 June)
2016-17
Actual
$'000
2017-18
Revised
budget
$'000
2018-19
Forward
estimate
$'000
2019-20
Forward
estimate
$'000
2020-21
Forward
estimate
$'000
ASSETS
Financial assets
Cash and cash equivalents 8,764 7,720 7,720 7,720 7,720
Trade and other receivables 5,534 6,104 5,582 4,910 4,905
Other investments 27,800 27,074 27,757 32,459 34,380
Total financial assets 42,098 40,898 41,059 45,089 47,005
Non-financial assets
Land and buildings 90,005 88,969 89,516 88,348 86,331
Property, plant and equipment 54,217 53,257 48,955 46,306 43,529
Intangibles 2,305 3,687 3,304 3,439 3,329
Inventories 163 163 170 169 168
Other non-financial assets 2,719 2,935 3,306 2,923 2,914
Total non-financial assets 149,409 149,011 145,251 141,185 136,271
Total assets 191,507 189,909 186,310 186,274 183,276
LIABILITIES
Payables
Suppliers 1,813 2,073 2,086 3,490 3,441
Other payables 3,252 3,160 2,880 4,521 4,541
Total payables 5,065 5,233 4,966 8,011 7,982
Provisions
Employee provisions 9,890 10,623 11,257 11,929 12,797
Total provisions 9,890 10,623 11,257 11,929 12,797
Total liabilities 14,955 15,856 16,223 19,940 20,779
Net assets 176,552 174,053 170,087 166,334 162,497
EQUITY(a)
Parent entity interest
Contributed equity 86,607 88,207 88,357 88,357 88,357
Reserves 68,144 68,144 68,144 68,144 68,144
Retained surplus 21,801 17,702 13,586 9,833 5,996
Total parent entity interest 176,552 174,053 170,087 166,334 162,497
Total Equity 176,552 174,053 170,087 166,334 162,497 (a) Equity is the residual interest in assets after the deduction of liabilities. Prepared on Australian Accounting Standards basis.
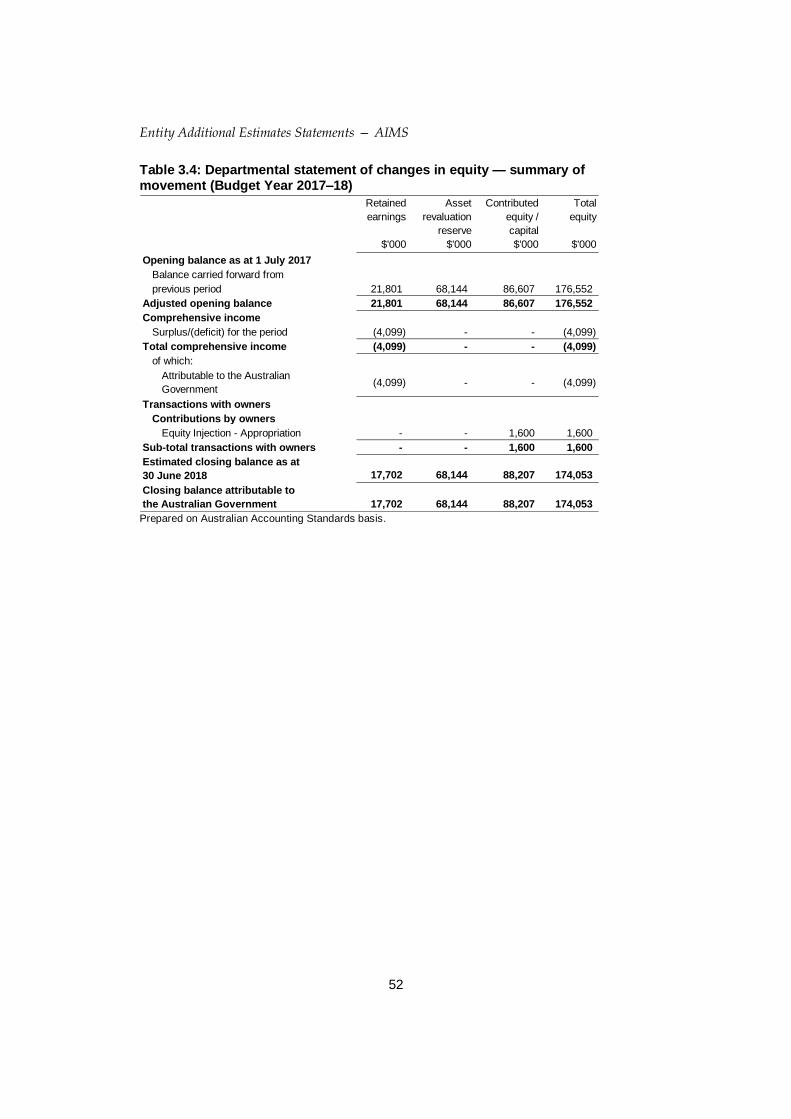
Entity Additional Estimates Statements — AIMS
52
Table 3.4: Departmental statement of changes in equity — summary of movement (Budget Year 2017–18)
Retained
earnings
$'000
Asset
revaluation
reserve
$'000
Contributed
equity /
capital
$'000
Total
equity
$'000
Opening balance as at 1 July 2017
Balance carried forward from
previous period 21,801 68,144 86,607 176,552
Adjusted opening balance 21,801 68,144 86,607 176,552
Comprehensive income
Surplus/(deficit) for the period (4,099) - - (4,099)
Total comprehensive income (4,099) - - (4,099)
of which:
Attributable to the Australian
Government(4,099) - - (4,099)
Transactions with owners
Contributions by owners
Equity Injection - Appropriation - - 1,600 1,600
Sub-total transactions with owners - - 1,600 1,600
Estimated closing balance as at
30 June 2018 17,702 68,144 88,207 174,053
Closing balance attributable to
the Australian Government 17,702 68,144 88,207 174,053 Prepared on Australian Accounting Standards basis.

Entity Additional Estimates Statements — AIMS
53
Table 3.5: Budgeted departmental statement of cash flows (for the period ended 30 June)
2016-17
Actual
$'000
2017-18
Revised
budget
$'000
2018-19
Forward
estimate
$'000
2019-20
Forward
estimate
$'000
2020-21
Forward
estimate
$'000
OPERATING ACTIVITIES
Cash received
Appropriations 41,552 44,847 47,377 44,836 45,371
Sale of goods and rendering of
services16,623 19,693 18,816 19,216 18,527
Interest 1,272 1,200 1,200 1,200 1,200
Net GST received 1,586 - - - -
Other 885 140 150 1,791 170
Total cash received 61,918 65,880 67,543 67,043 65,268
Cash used
Employees 26,821 27,610 28,287 29,201 29,780
Suppliers 26,315 30,042 30,444 25,048 26,613
Other - 92 280 - -
Total cash used 53,136 57,744 59,011 54,249 56,393
Net cash from / (used by)
operating activities 8,782 8,136 8,532 12,794 8,875
INVESTING ACTIVITIES
Cash received
Proceeds from sales of property, plant and
equipment232 236 196 426 201
Investments (a) 300 726 - - -
Total cash received 532 962 196 426 201
Cash used
Purchase of property, plant, equipment and
intangibles8,888 11,742 8,195 8,518 7,155
Investments (a) - - 683 4,702 1,921
Total cash used 8,888 11,742 8,878 13,220 9,076
Net cash from / (used by)
investing activities (8,356) (10,780) (8,682) (12,794) (8,875)
FINANCING ACTIVITIES
Cash received
Contributed equity - 1,600 150 - -
Total cash received - 1,600 150 - -
Net increase/(decrease) in cash held426 (1,044) - - -
Cash and cash equivalents at the beginning
of the reporting period8,338 8,764 7,720 7,720 7,720
Cash and cash equivalents at the end of
the reporting period 8,764 7,720 7,720 7,720 7,720 (a) Relates to the movement in excess funds that are held in term deposit for more than three months.
Prepared on Australian Accounting Standards basis.
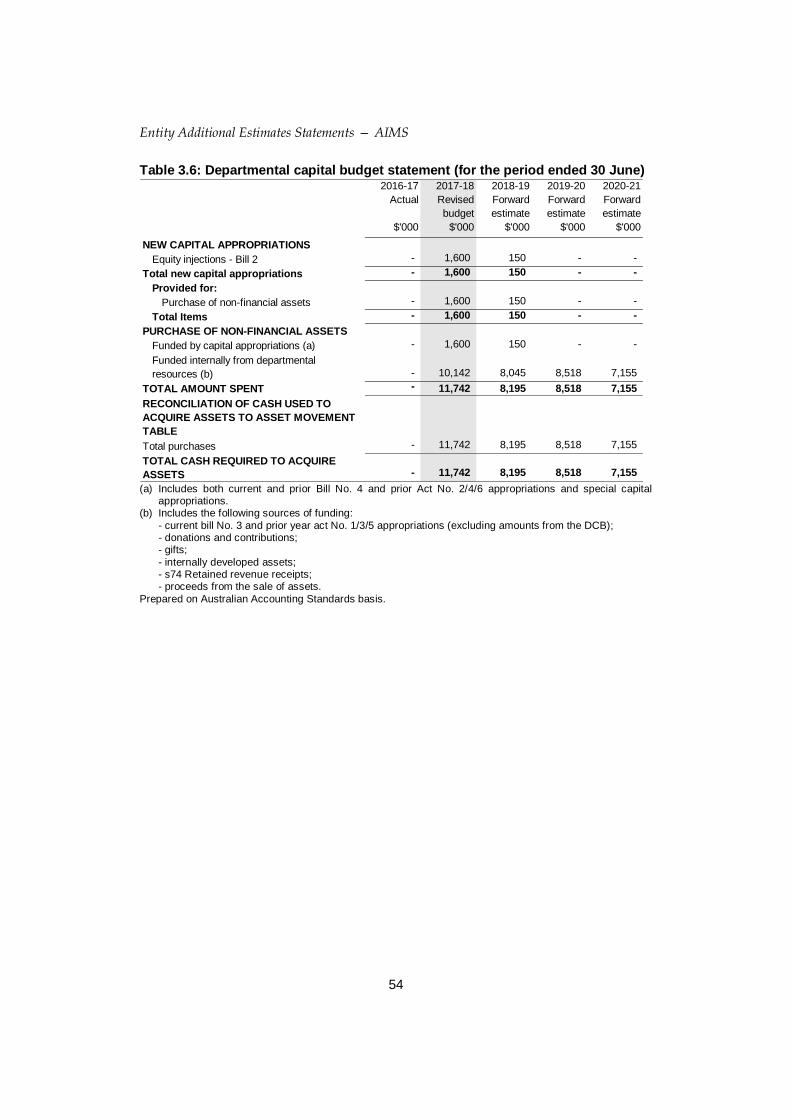
Entity Additional Estimates Statements — AIMS
54
Table 3.6: Departmental capital budget statement (for the period ended 30 June) 2016-17
Actual
$'000
2017-18
Revised
budget
$'000
2018-19
Forward
estimate
$'000
2019-20
Forward
estimate
$'000
2020-21
Forward
estimate
$'000
NEW CAPITAL APPROPRIATIONS
Equity injections - Bill 2 - 1,600 150 - -
Total new capital appropriations - 1,600 150 - -
Provided for:
Purchase of non-financial assets - 1,600 150 - -
Total Items - 1,600 150 - -
PURCHASE OF NON-FINANCIAL ASSETS
Funded by capital appropriations (a) - 1,600 150 - -
Funded internally from departmental
resources (b) - 10,142 8,045 8,518 7,155
TOTAL AMOUNT SPENT - 11,742 8,195 8,518 7,155
RECONCILIATION OF CASH USED TO
ACQUIRE ASSETS TO ASSET MOVEMENT
TABLE
Total purchases - 11,742 8,195 8,518 7,155
TOTAL CASH REQUIRED TO ACQUIRE
ASSETS - 11,742 8,195 8,518 7,155 (a) Includes both current and prior Bill No. 4 and prior Act No. 2/4/6 appropriations and special capital
appropriations. (b) Includes the following sources of funding:
- current bill No. 3 and prior year act No. 1/3/5 appropriations (excluding amounts from the DCB); - donations and contributions; - gifts;
- internally developed assets; - s74 Retained revenue receipts; - proceeds from the sale of assets.
Prepared on Australian Accounting Standards basis.

Entity Additional Estimates Statements — AIMS
55
En
tity Addition
al Estim
ates Statem
ent —
AIM
S
Table 3.7: Statement of asset movements (2017–18 Budget year) Buildings
$'000
Other
property,
plant and
equipment
$'000
Computer
software
and
intangibles
$'000
Total
$'000
As at 1 July 2017
Gross book value 99,397 69,759 4,538 173,694
Accumulated depreciation/amortisation and
impairment (9,392) (15,542) (2,233) (27,167)
Opening net book balance 90,005 54,217 2,305 146,527
CAPITAL ASSET ADDITIONS
Estimated expenditure on new or
replacement assets
By purchase - appropriation equity (a) - 1,600 - 1,600
By purchase - other 3,167 4,983 1,991 10,141
Total additions 3,167 6,583 1,991 11,741
Other movements
Depreciation/amortisation expense (4,203) (7,307) (610) (12,120)
Disposals - (236) 1 (235)
Total other movements (4,203) (7,543) (609) (12,355)
As at 30 June 2018
Gross book value 102,564 76,106 6,530 185,200
Accumulated depreciation/amortisation and
impairment (13,595) (22,849) (2,843) (39,287)
Closing net book balance 88,969 53,257 3,687 145,913 (a) “Appropriation equity” refers to equity injections or Administered Assets and Liabilities appropriations
provided through Appropriation Act (No.2) 2017–2018 and Bill (No.4) 2017–2018, including CDABs. Prepared on Australian Accounting Standards basis.

Entity Additional Estimates Statements — AIMS
56
Table 3.8: Schedule of budgeted income and expenses administered on behalf of Government (for the period ended 30 June)
AIMS has no budgeted income and expenses administered on behalf of Government; therefore Table 3.8 is not presented.
Table 3.9: Schedule of budgeted assets and liabilities administered on behalf of Government (as at 30 June)
AIMS has no budgeted assets and liabilities administered on behalf of Government; therefore Table 3.9 is not presented.
Table 3.10: Schedule of budgeted administered cash flows (for the period ended 30 June)
AIMS has no budgeted administered cash flows; therefore Table 3.10 is not presented.
Table 3.11: Schedule of administered capital budget (for the period ended 30 June)
AIMS has no budgeted administered capital budget; therefore Table 3.11 is not presented. Table 3.12: Statement of administered asset movements (2017–18 Budget year)
AIMS has no budgeted administered asset movements; therefore Table 3.12 is not presented.