Embed Size (px)
Citation preview

© Copyright 2017 OSIsoft, LLCUSERS CONFERENCE 2017 #OSIsoftUCosisoft@
Presented by
Port Performance and
Profitability using PI, Esri
Integration and Analytics
Pradeep Gupta/ Yograjsinh Barad

© Copyright 2017 OSIsoft, LLCUSERS CONFERENCE 2017 #OSIsoftUCosisoft@
Agenda
Adani Group
Port Information Management System
Dynamic Vessel Monitoring System (DVMS)
1
2
3
PI Integrator for Esri ArcGIS4
2
© Copyright 2017 OSIsoft, LLCUSERS CONFERENCE 2017 #OSIsoftUCosisoft@
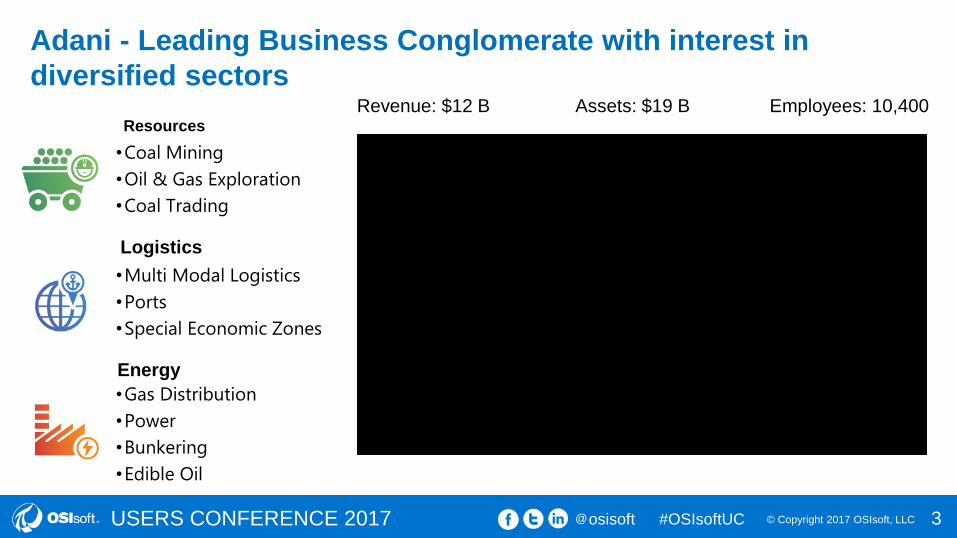
Adani - Leading Business Conglomerate with interest in
diversified sectors
Resources
Logistics
Energy
•Coal Mining
•Oil & Gas Exploration
•Coal Trading
•Multi Modal Logistics
•Ports
•Special Economic Zones
•Gas Distribution
•Power
•Bunkering
•Edible Oil
Revenue: $12 B Assets: $19 B Employees: 10,400
3

© Copyright 2017 OSIsoft, LLCUSERS CONFERENCE 2017 #OSIsoftUCosisoft@
Many Questions on Port’s Operational Performance
Can I include geo spatial intelligence?
Has port’s performance
improved year on year?
How do I bring all the data from different
sources into single platform for analytics?
How can I optimize operations and improve
Port productivity?
What is actual operations
performance?
Can I view and monitor live
status of operations?
Can I continue sparing teams just for
manual recording, collection, and reporting
of data?
Answers / Solutions to these questions not easily and timely available
How does this port fair as compared to
other ports of the Group?
© Copyright 2017 OSIsoft, LLCUSERS CONFERENCE 2017 #OSIsoftUCosisoft@
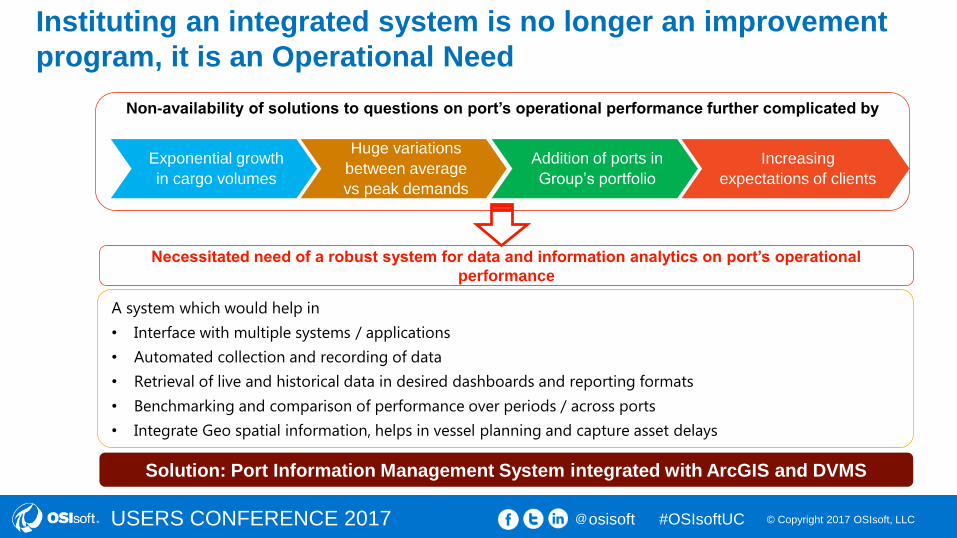
Instituting an integrated system is no longer an improvement
program, it is an Operational Need
Huge variations
between average
vs peak demands
Addition of ports in
Group’s portfolio
Increasing
expectations of clients
Exponential growth
in cargo volumes
Non-availability of solutions to questions on port’s operational performance further complicated by
Necessitated need of a robust system for data and information analytics on port’s operational
performance
A system which would help in
• Interface with multiple systems / applications
• Automated collection and recording of data
• Retrieval of live and historical data in desired dashboards and reporting formats
• Benchmarking and comparison of performance over periods / across ports
• Integrate Geo spatial information, helps in vessel planning and capture asset delays
Solution: Port Information Management System integrated with ArcGIS and DVMS

© Copyright 2017 OSIsoft, LLCUSERS CONFERENCE 2017 #OSIsoftUCosisoft@
Adani initiatives for enabling Businesses
6

© Copyright 2017 OSIsoft, LLCUSERS CONFERENCE 2017 #OSIsoftUCosisoft@
Agenda
Adani Group
Port Information Management System
Dynamic Vessel Monitoring System (DVMS)
1
2
3
PI Integrator for Esri ArcGIS4
7

© Copyright 2017 OSIsoft, LLCUSERS CONFERENCE 2017 #OSIsoftUCosisoft@
Mercury
8
© Copyright 2017 OSIsoft, LLCUSERS CONFERENCE 2017 #OSIsoftUCosisoft@
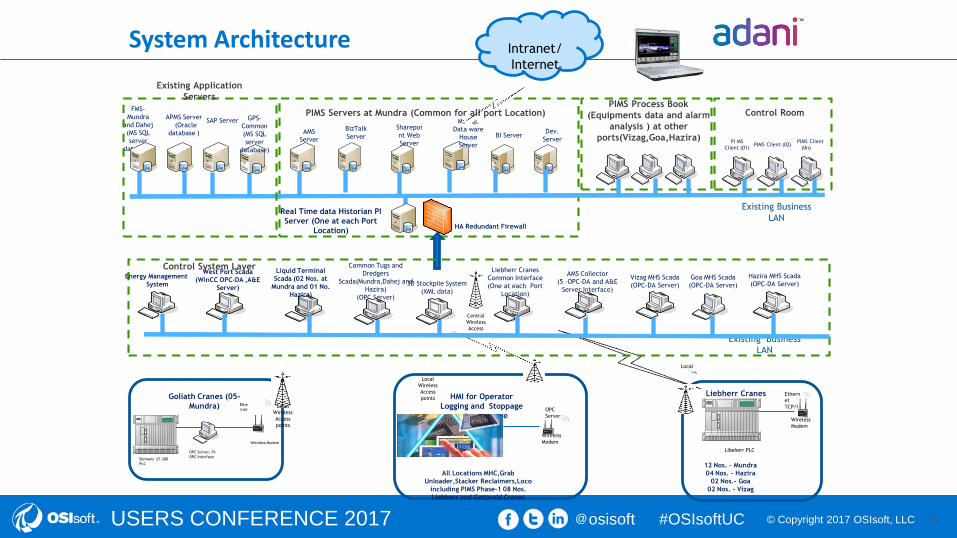
FMS-
Mundra
and Dahej
(MS SQL
server
database)
Local
Wireless
Access
points
Intranet/
Internet
Liebherr Cranes
Wireless
Modem
Libeherr PLC
Ethern
et
TCP/IP
12 Nos. – Mundra
04 Nos. – Hazira
02 Nos.- Goa
02 Nos. - Vizag
Goliath Cranes (05-
Mundra)
Wireless Modem
Ethe
rnet
OPC Server, PI-
OPC InterfaceSiemens S7-300
PLC
`
Local
Wireless
Access
points
HMI for Operator
Logging and Stoppage
entry purpose
Local
Wireless
Access
points
Wireless
Modem
OPC
Server
All Locations MHC,Grab
Unloader,Stacker Reclaimers,Loco
including PIMS Phase-1 08 Nos.
Liebherr and Gottwald Cranes
Sharepoi
nt Web
Server
MS SQL
Data ware
House
Server
BizTalk
Server
Real Time data Historian PI
Server (One at each Port
Location)
APMS Server
(Oracle
database )
SAP Server
` ` `
PIMS Process Book
(Equipments data and alarm
analysis ) at other
ports(Vizag,Goa,Hazira)
`
PI MS
Client (01)
`
PIMS Client (02)
`
PIMS Client
(0n)
Control Room
Existing Business
LAN
AMS
Server
GPS-
Common
(MS SQL
server
database)
BI ServerDev.
Server
PIMS Servers at Mundra (Common for all port Location)
HA Redundant Firewall
Existing Application
Servers
Existing Business
LAN
Central
Wireless
Access
points
`
West Port Scada
(WinCC OPC-DA ,A&E
Server)
`
Liebherr Cranes
Common Interface
(One at each Port
Location)
Liquid Terminal
Scada (02 Nos. at
Mundra and 01 No.
Hazira)
`
Common Tugs and
Dredgers
Scada(Mundra,Dahej and
Hazira)
(OPC Server)
``
Goa MHS Scada
(OPC-DA Server)
Vizag MHS Scada
(OPC-DA Server)
Hazira MHS Scada
(OPC-DA Server)
``
3D Stockpile System
(XML data)
`
AMS Collector
(5 –OPC-DA and A&E
Server Interface)
`
Control System Layer
`
Energy Management
System
System Architecture
9

© Copyright 2017 OSIsoft, LLCUSERS CONFERENCE 2017 #OSIsoftUCosisoft@
Provides historical and comparative statistics on port’s performance
Mercury (PIMS) : Salient Features
Helps to achieve ‘Operational excellence’ by monitoring and analysing performance in real time
Will Allow the evaluation of system and operator performance
Provide client tools for better trending, handling complex calculations
Main components: Integration of equipment information; reports / dashboards; DVMS
Integrates applications like Oracle, SQL server based and intelligent automation systems onboard
Conveyors & Cranes etc

© Copyright 2017 OSIsoft, LLCUSERS CONFERENCE 2017 #OSIsoftUCosisoft@
Mercury (PIMS): Integration with other applications
Interface
NodePI
Server
`
Client
PCData
Source
Systems / Applications / Interfaces
Coal Conveyor System Liquid Terminal Automation
FCC Stacker-/reclaimer
HMI (Delay Capture Application) Wagon / Truck Loading System
Mobile Harbour and Yard Cranes SAP Reports
Fuel Management System (FMS) SSRS Report
GPS Energy Management System (EMS)
Tug & Dredger Automation Alarm Information Management System (AIMS)
APMS Attendance System

© Copyright 2017 OSIsoft, LLCUSERS CONFERENCE 2017 #OSIsoftUCosisoft@
Static Reports : OverviewWhat is it / capabilities
• Regular reports on operations data
• 350+ reports in covering all departments
• Choose from pre-defined parameters to generate reports
• Access from anywhere on Adani intranet
Benefits
• Faster reports generation: savings of man-hours
• Analyse trends / Compare performance
• Visualize average vs Peak demands
• Appreciated relational variables such as PBD with berth
occupancy
• Store reports on local drive for future reference

© Copyright 2017 OSIsoft, LLCUSERS CONFERENCE 2017 #OSIsoftUCosisoft@
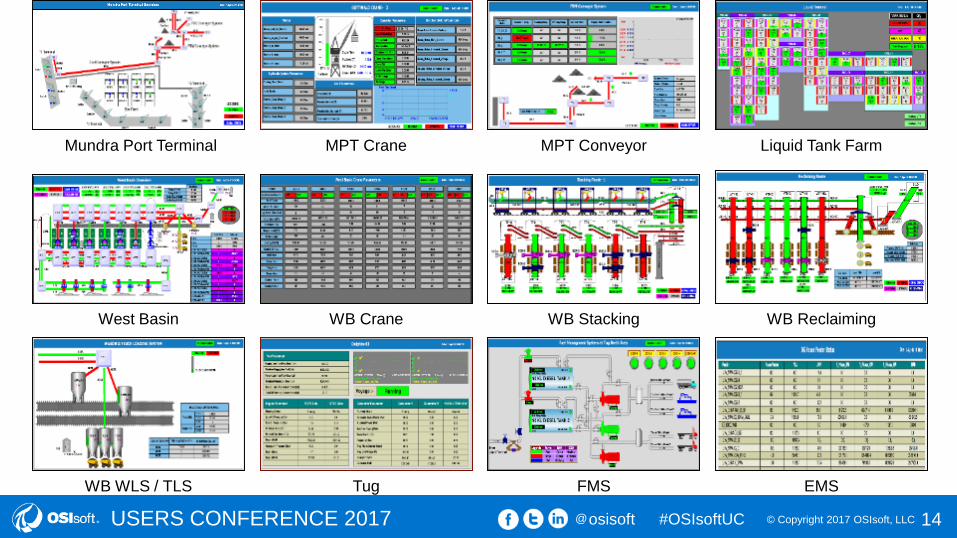
OSI PI Dashboards : Overview
What is it / capabilities
• Graphical representation of entire systems and facilities
• Live status reporting
• Easy to grasp colour coded visuals
• SMS / Email Notifications on alerts
• Accessible anywhere on Adani Network (Mundra, Dahej, Hazira, Vizag Goa ,Ahmedabad, Mumbai, Delhi)
Benefits
• Live Status: Real Time Data
• Glance at KPIs quickly
• No need to phone-call individuals and check
• People can focus on core ops activity rather than spending time on calling up / checking / coordinating and
providing data fetching operations/Equipments data on mobile
© Copyright 2017 OSIsoft, LLCUSERS CONFERENCE 2017 #OSIsoftUCosisoft@
Mundra Port Terminal MPT Crane MPT Conveyor Liquid Tank Farm
West Basin WB Crane WB Stacking WB Reclaiming
WB WLS / TLS Tug FMS EMS
14

© Copyright 2017 OSIsoft, LLCUSERS CONFERENCE 2017 #OSIsoftUCosisoft@
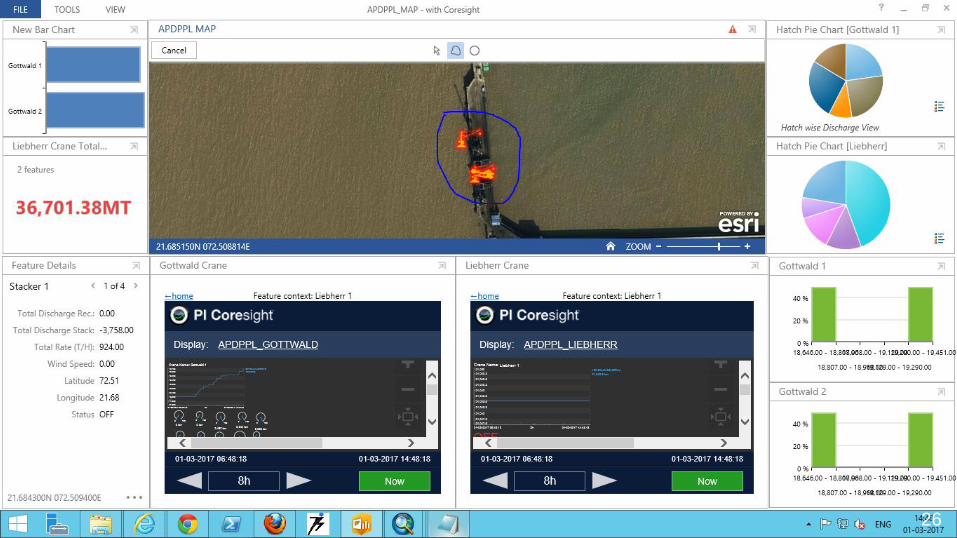
intuitive web-client visualization tool that delivers
fast, easy, and secure access to all your PI System
data
Acknowledge and Comment on Event Frames
Export data to Excel.
Situational awareness
Event Comparison
Ad hoc : Perform ad hoc analysis, discover
answers, and share your insights with others
Mobile browsers : Support for mobile browsers
and customized views for small screen devices
Display sharing: PI Coresight gives users a quick
and easy way to share displays and encourages
colleagues to collaborate across the enterprise.
PI Coresight is easy to deploy, upgrade, and
maintain.
Real time dashboards
© Copyright 2017 OSIsoft, LLCUSERS CONFERENCE 2017 #OSIsoftUCosisoft@
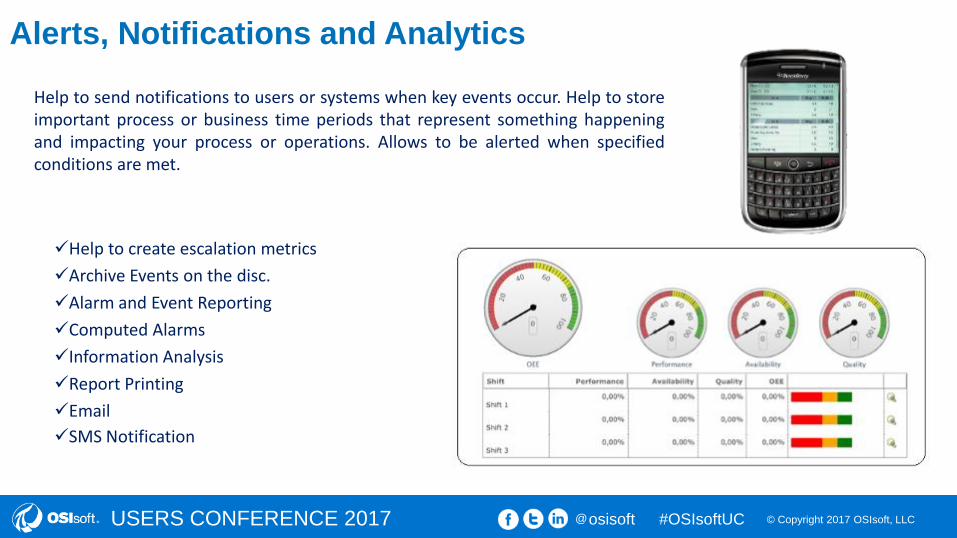
Help to send notifications to users or systems when key events occur. Help to storeimportant process or business time periods that represent something happeningand impacting your process or operations. Allows to be alerted when specifiedconditions are met.
Help to create escalation metrics
Archive Events on the disc.
Alarm and Event Reporting
Computed Alarms
Information Analysis
Report Printing
SMS Notification
Alerts, Notifications and Analytics
© Copyright 2017 OSIsoft, LLCUSERS CONFERENCE 2017 #OSIsoftUCosisoft@
Agenda
Adani Group
Port Information Management System
Dynamic Vessel Monitoring System (DVMS)
1
2
3
PI Integrator for Esri ArcGIS4
17

© Copyright 2017 OSIsoft, LLCUSERS CONFERENCE 2017 #OSIsoftUCosisoft@ 18

© Copyright 2017 OSIsoft, LLCUSERS CONFERENCE 2017 #OSIsoftUCosisoft@
Operations at Dahej port before Implementation
Share planning
with stakeholders
VTMS - Vessel
at AnchorageBerth planning
Discharge sequence &
Sub sequence planning
Allocate Assets
Tugs boats –
Anchorage to Berth
Actual Discharge
MonitoringCapture delay and
stoppage reasons
Capture and share
breakdown of assets
Forecasting of
Vessel & Material
Re arrange the plan as
per available assets
Monitoring
deviations in plan
Monitoring movable
assets & Safety
Reporting on asset
performance
19
© Copyright 2017 OSIsoft, LLCUSERS CONFERENCE 2017 #OSIsoftUCosisoft@
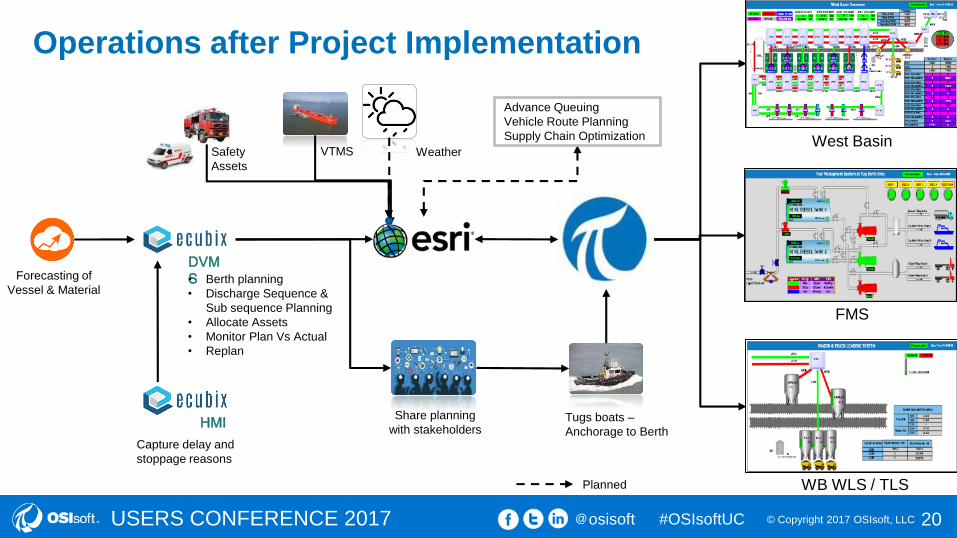
Operations after Project Implementation
Forecasting of
Vessel & Material
Tugs boats –
Anchorage to BerthCapture delay and
stoppage reasons
HMI
West Basin
FMS
WB WLS / TLS
VTMS
• Berth planning
• Discharge Sequence &
Sub sequence Planning
• Allocate Assets
• Monitor Plan Vs Actual
• Replan
Share planning
with stakeholders
DVM
S
Safety
Assets
Weather
Advance Queuing
Vehicle Route Planning
Supply Chain Optimization
Planned
20

© Copyright 2017 OSIsoft, LLCUSERS CONFERENCE 2017 #OSIsoftUCosisoft@
DVMS
Business users were engaged
to identify key pain areas and
DVMS was conceptualized for
differentiating PLANNING
and EXECUTION activities
Improved planning helps in
optimal asset allocation
Higher Port Productivity
21
© Copyright 2017 OSIsoft, LLCUSERS CONFERENCE 2017 #OSIsoftUCosisoft@
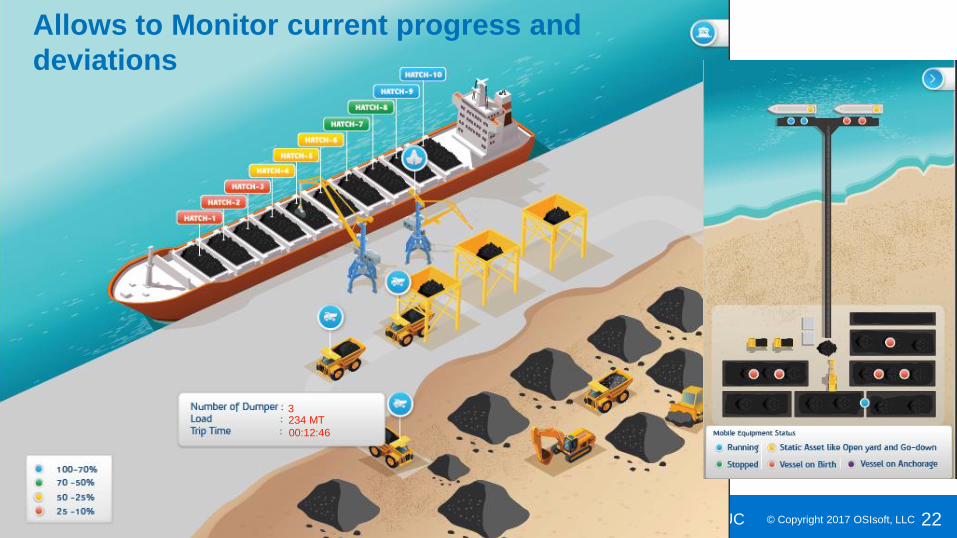
3234 MT
Allows to Monitor current progress and
deviations
00:12:46
22

© Copyright 2017 OSIsoft, LLCUSERS CONFERENCE 2017 #OSIsoftUCosisoft@
PI System provides effective monitoring against planned schedules and shortens Response time in
case of stoppages/ breakdowns
23

© Copyright 2017 OSIsoft, LLCUSERS CONFERENCE 2017 #OSIsoftUCosisoft@ 24

© Copyright 2017 OSIsoft, LLCUSERS CONFERENCE 2017 #OSIsoftUCosisoft@ 25
© Copyright 2017 OSIsoft, LLCUSERS CONFERENCE 2017 #OSIsoftUCosisoft@ 26
© Copyright 2017 OSIsoft, LLCUSERS CONFERENCE 2017 #OSIsoftUCosisoft@
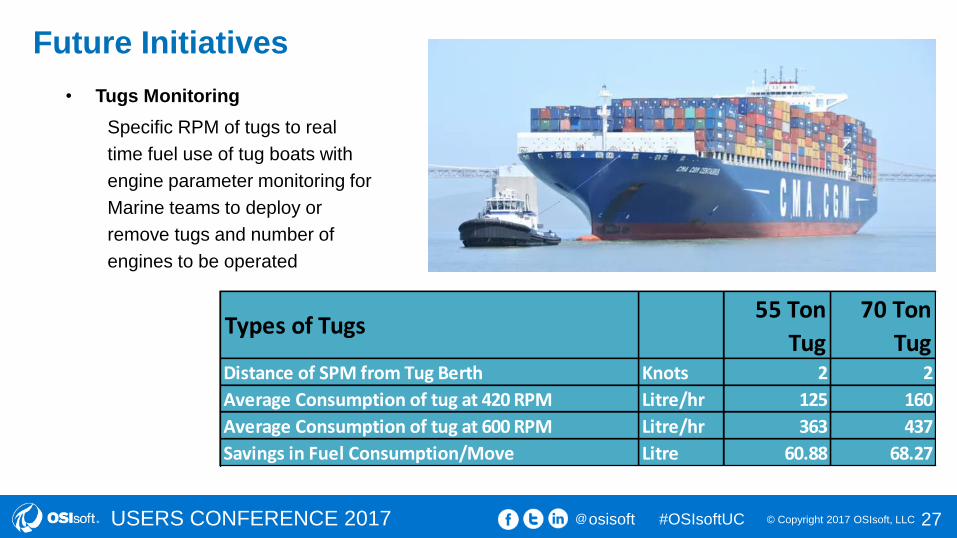
Future Initiatives
• Tugs Monitoring
Specific RPM of tugs to real
time fuel use of tug boats with
engine parameter monitoring for
Marine teams to deploy or
remove tugs and number of
engines to be operated
Types of Tugs55 Ton
Tug
70 Ton
TugDistance of SPM from Tug Berth Knots 2 2
Average Consumption of tug at 420 RPM Litre/hr 125 160
Average Consumption of tug at 600 RPM Litre/hr 363 437
Savings in Fuel Consumption/Move Litre 60.88 68.27
27
© Copyright 2017 OSIsoft, LLCUSERS CONFERENCE 2017 #OSIsoftUCosisoft@
Picture / Image
RESULTSCHALLENGE SOLUTION
COMPANY and GOAL
Company
Logo
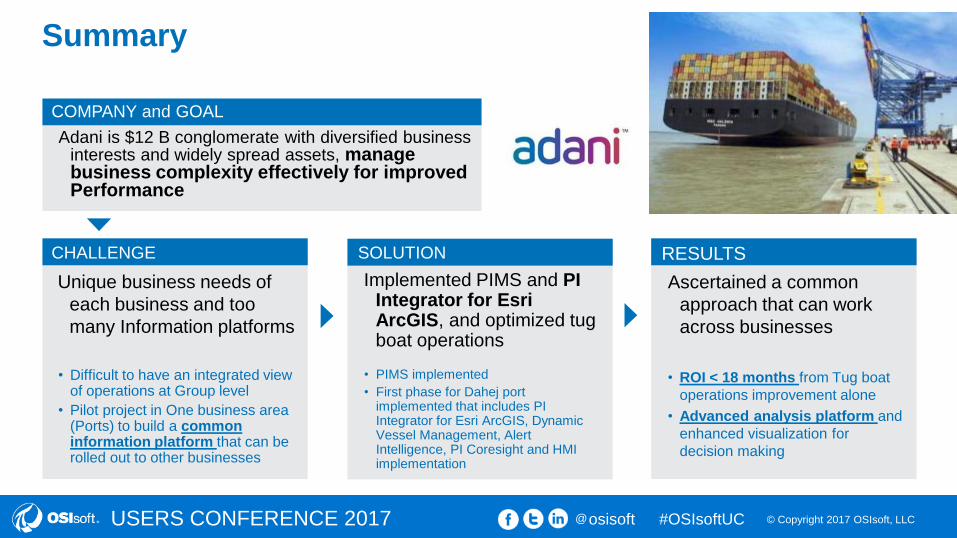
Summary
Adani is $12 B conglomerate with diversified business interests and widely spread assets, manage business complexity effectively for improved Performance
Unique business needs of
each business and too
many Information platforms
Implemented PIMS and PI Integrator for Esri ArcGIS, and optimized tug boat operations
Ascertained a common
approach that can work
across businesses
• PIMS implemented
• First phase for Dahej port implemented that includes PI Integrator for Esri ArcGIS, Dynamic Vessel Management, Alert Intelligence, PI Coresight and HMI implementation
• ROI < 18 months from Tug boat
operations improvement alone
• Advanced analysis platform and
enhanced visualization for
decision making
• Difficult to have an integrated view of operations at Group level
• Pilot project in One business area (Ports) to build a common information platform that can be rolled out to other businesses

© Copyright 2017 OSIsoft, LLCUSERS CONFERENCE 2017 #OSIsoftUCosisoft@
Contact Information
Speaker’s [email protected]
Project In-charge
Howe Engineering Projects (India) Pvt. Ltd.
(Adani Group)
29

© Copyright 2017 OSIsoft, LLCUSERS CONFERENCE 2017 #OSIsoftUCosisoft@
Thank You
For any queries reach out to [email protected]
30