Embed Size (px)
Citation preview
3
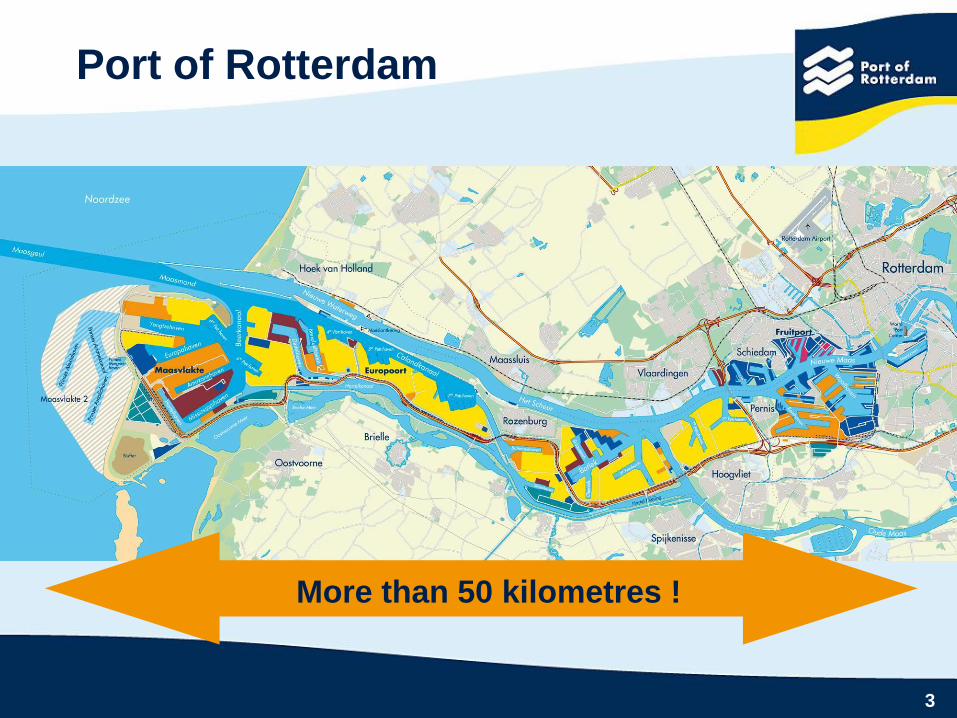
Port of Rotterdam
More than 50 kilometres !
44
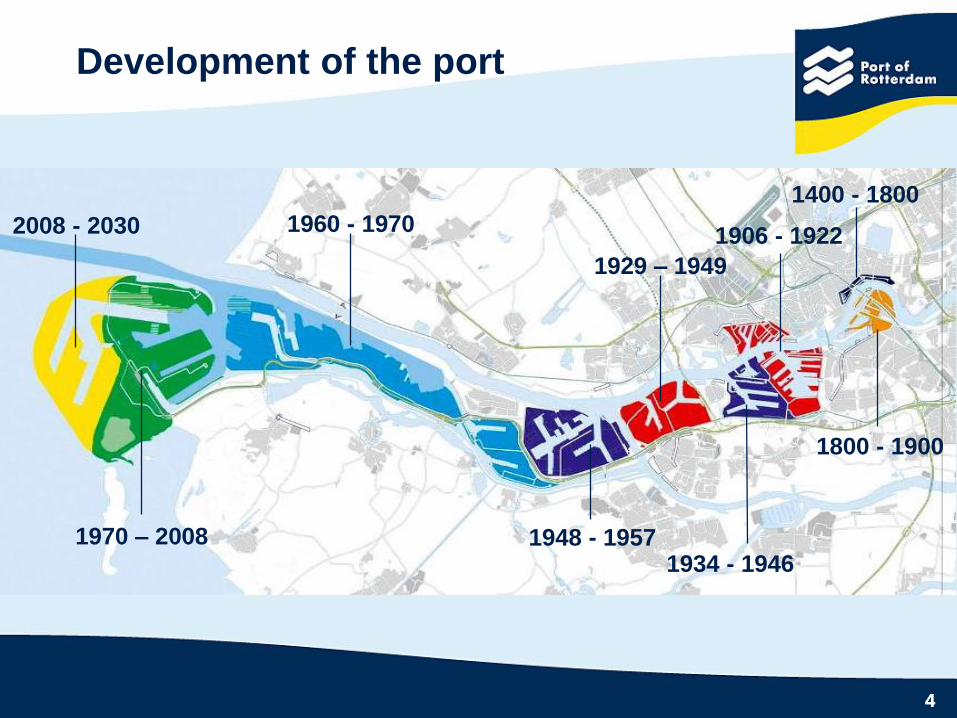
1400 - 1800
1800 - 1900
1929 – 1949
1948 - 1957
1960 - 1970
1970 – 2008
2008 - 2030
Development of the port
1934 - 1946
1906 - 1922

5
Salinity in the port
6
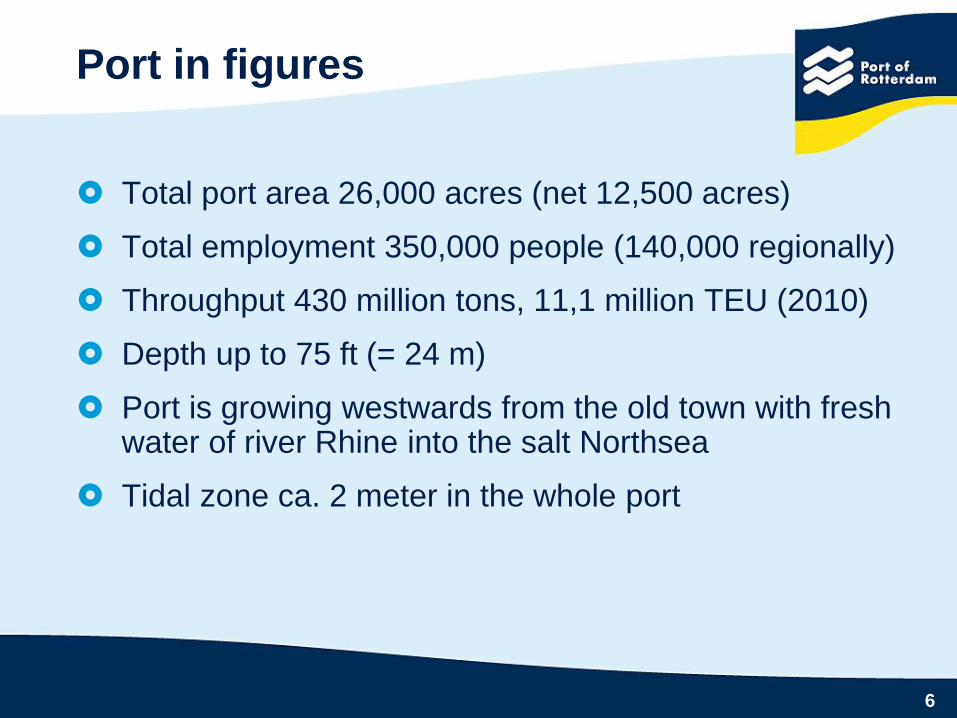
Port in figures
Total port area 26,000 acres (net 12,500 acres)
Total employment 350,000 people (140,000 regionally)
Throughput 430 million tons, 11,1 million TEU (2010)
Depth up to 75 ft (= 24 m)
Port is growing westwards from the old town with fresh water of river Rhine into the salt Northsea
Tidal zone ca. 2 meter in the whole port
7
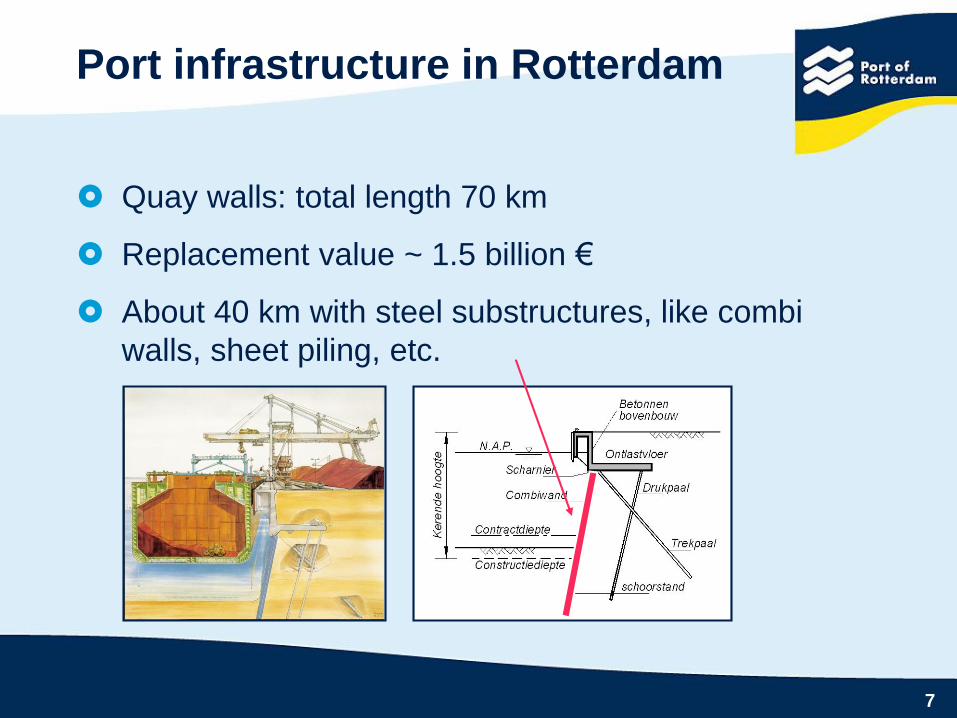
Quay walls: total length 70 km
Replacement value ~ 1.5 billion €
About 40 km with steel substructures, like combi
walls, sheet piling, etc.
Port infrastructure in Rotterdam
Asset Management on Quay Walls
A quay wall’s remaining lifetime and system integrity is
mainly determined by the quality of the sub and
superstructure.
When the quay wall’s integrity is in danger, it’s often
due to:
concrete deterioration in the superstructure
accelerated low water corrosion occurring at
the substructure

9
Corrosion rates according to EAU-Curves
No steel but concrete in the splash-zone
Extra thickness added to steel parts
Inspection of a few quay walls every 5 year
Corrosion strategy (up to 1999)

What was discovered ?
Before cleaning with high pressure After cleaning with high pressure
11
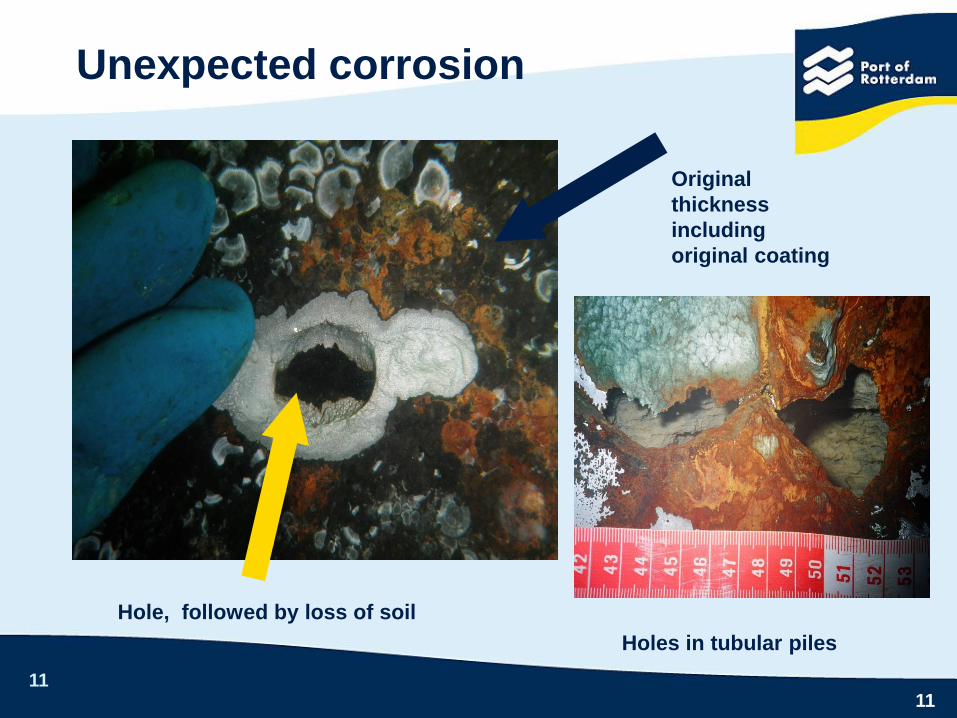
Unexpected corrosion
11
Holes in tubular piles
Hole, followed by loss of soil
Original
thickness
including
original coating

Probable causes (long list)
More salty environment
Galvanic corrosion of combiwalls
pitting influences on the strength
Aeration due to extra oxygen by (bow) thrusters or cooling
Fabrication process of steel parts
Water flow
Cathodic protection to the ship
Vertical layering of water (temperature, oxygen, salinity)
MIC
Etc...

13
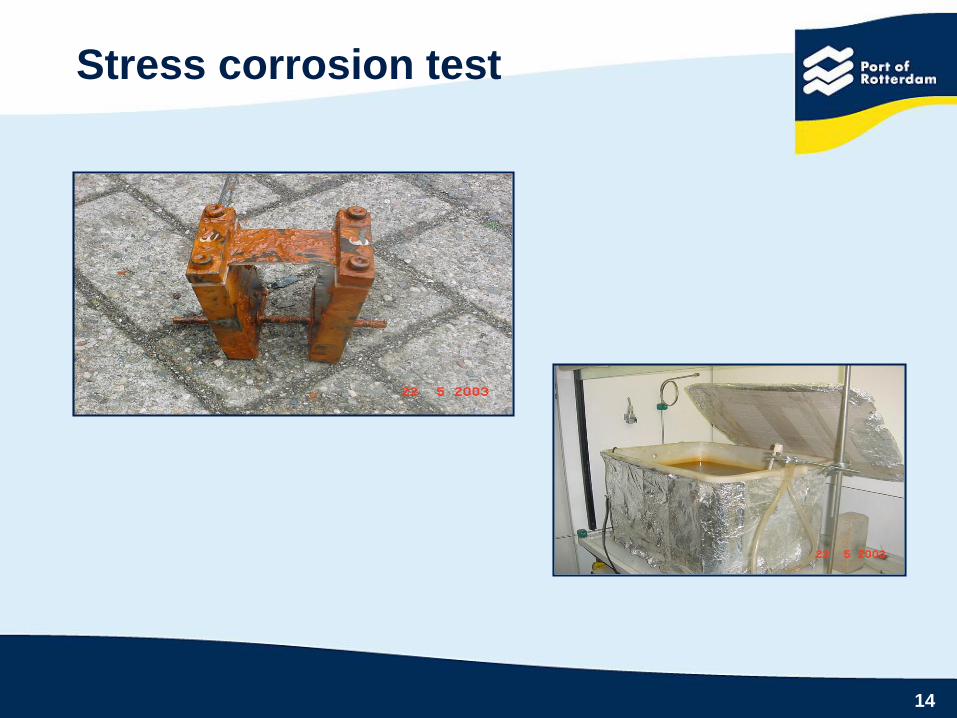
Action plan for investigation
Stress corrosion test
Coupon ladder
Coupons (galvanic cells)
Micro biological influence
Weakening due to pitting
Thickness measurement
14
Stress corrosion test
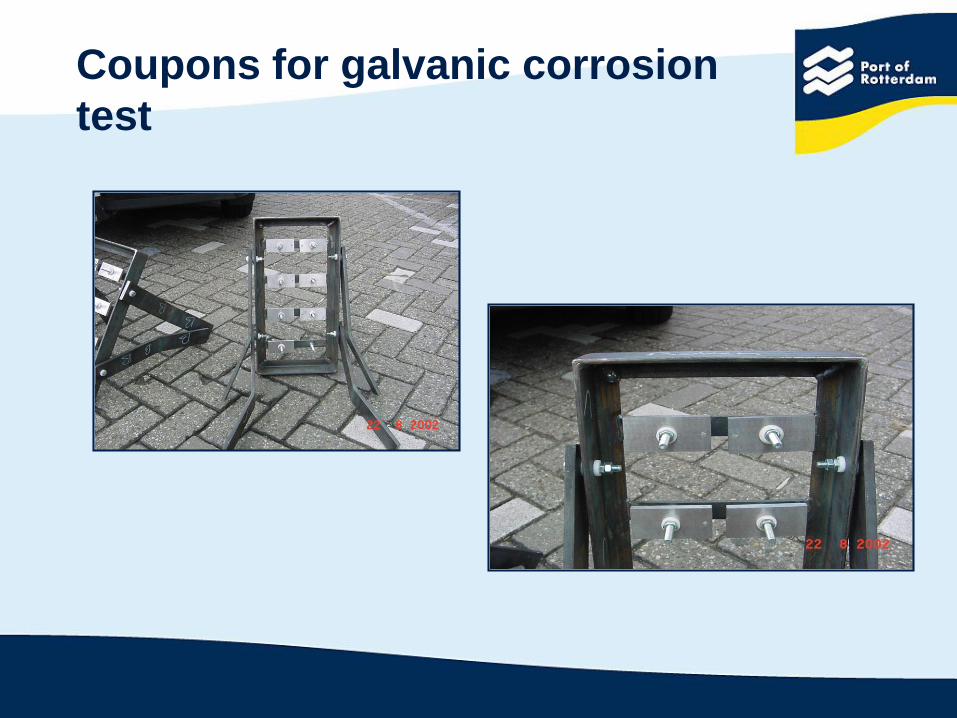
Coupons for galvanic corrosion
test
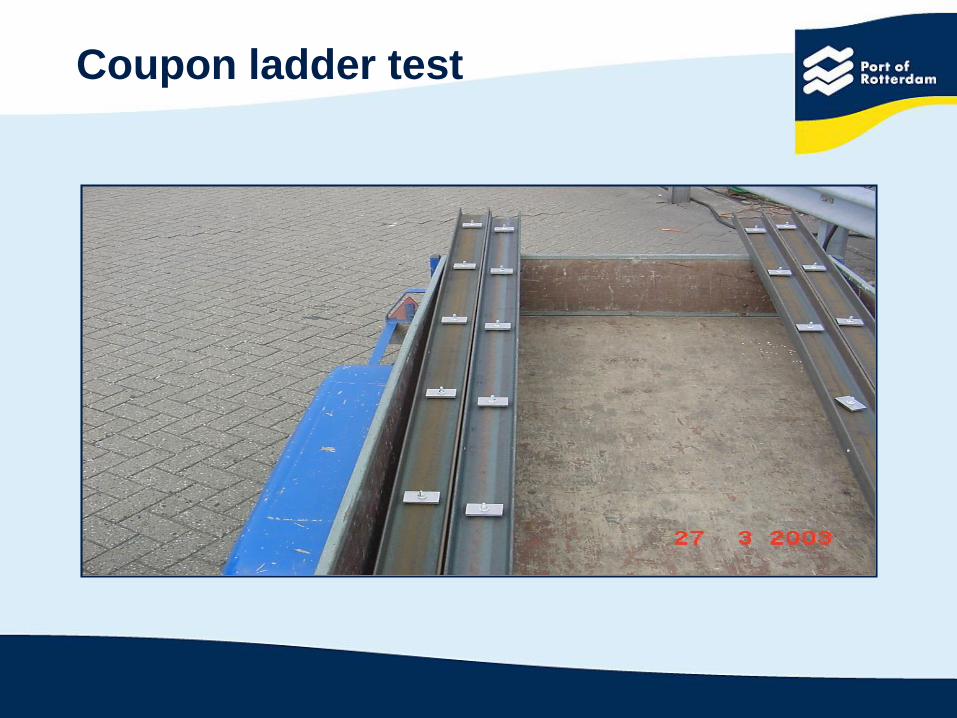
Coupon ladder test
17
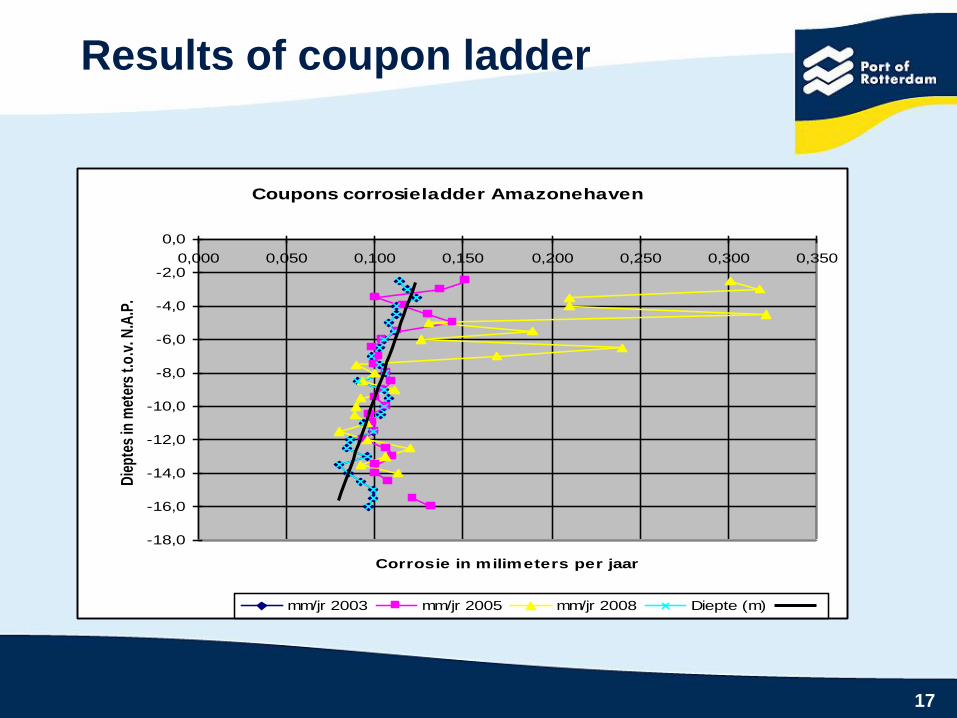
Results of coupon ladder
Coupons corrosieladder Amazonehaven
-18,0
-16,0
-14,0
-12,0
-10,0
-8,0
-6,0
-4,0
-2,0
0,0
0,000 0,050 0,100 0,150 0,200 0,250 0,300 0,350
Corrosie in milimeters per jaar
Die
pte
s in
met
ers
t.o
.v. N
.A.P
.
mm/jr 2003 mm/jr 2005 mm/jr 2008 Diepte (m)
18
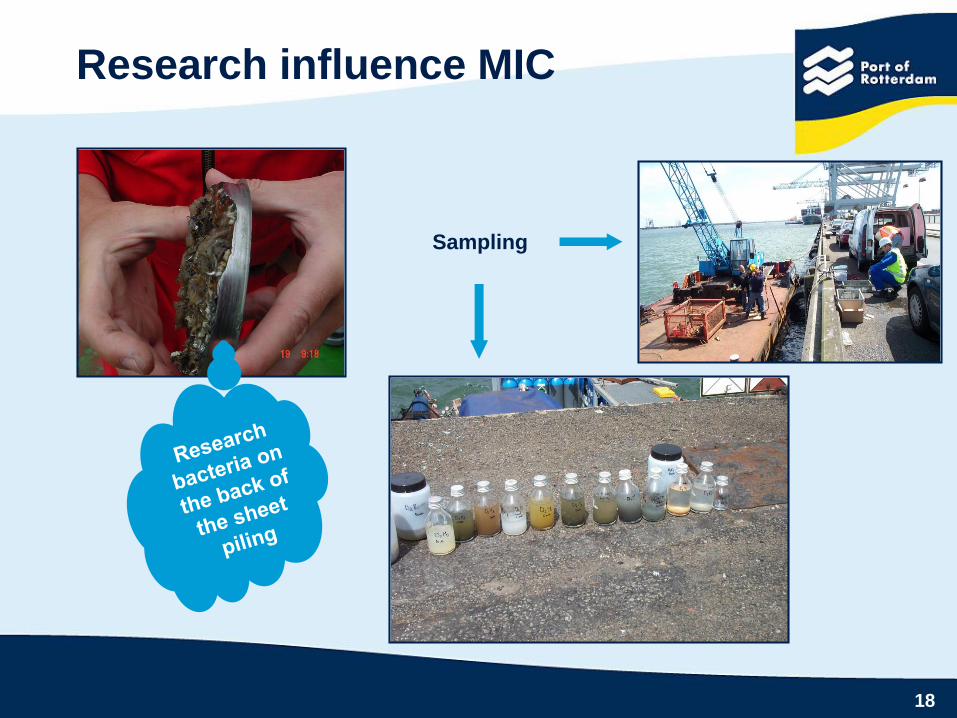
Research influence MIC
Sampling

19
Weakening due to pitting
Kracht- rek diagram 78547-8 Westerkade
-50000
0
50000
100000
150000
200000
250000
300000
0
0,0
1
0,0
2
0,0
3
0,0
5
0,0
8
0,1
0,2
4
0,3
9
0,6
7
0,6
7
0,6
7
0,6
7
0,6
7
0,6
7
0,6
7
0,6
7
0,6
7
0,6
7
0,6
7
0,6
7
0,6
7
0,6
7
rek
kra
ch
t N
coupon 1
coupon 2
coupon 3
coupon 4

20
Ultrasonic measurements
Method: Ultrasonic measurement
Inspection locations: horizontal & vertical
Amount of inspections: one million points
Inspection results processed statistically
Representative values: (incl. pitting!)
21
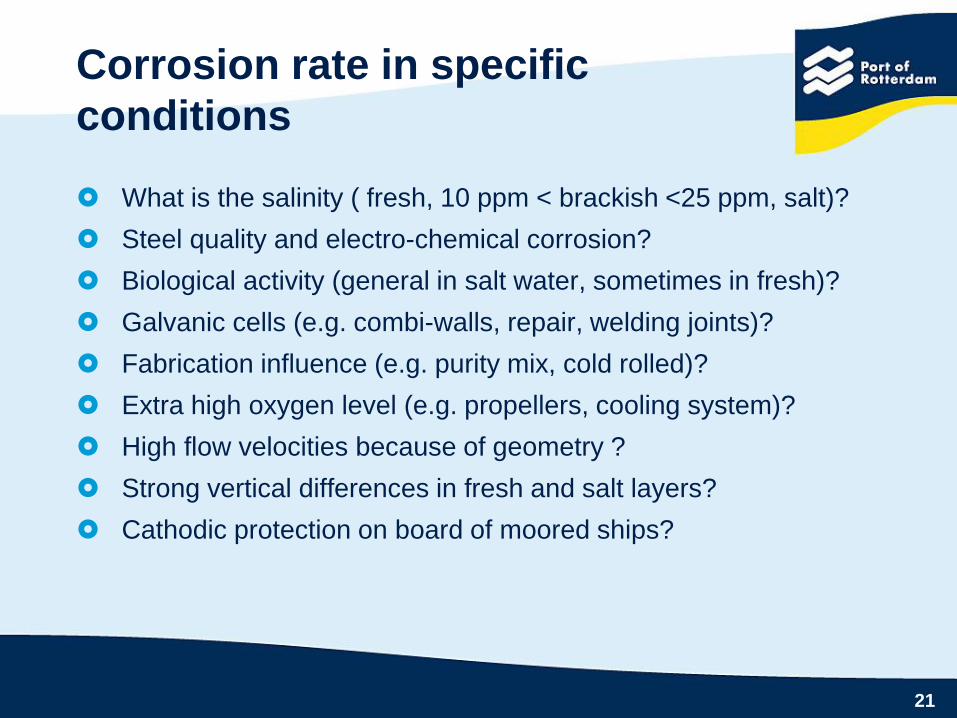
Corrosion rate in specific
conditions
What is the salinity ( fresh, 10 ppm < brackish <25 ppm, salt)?
Steel quality and electro-chemical corrosion?
Biological activity (general in salt water, sometimes in fresh)?
Galvanic cells (e.g. combi-walls, repair, welding joints)?
Fabrication influence (e.g. purity mix, cold rolled)?
Extra high oxygen level (e.g. propellers, cooling system)?
High flow velocities because of geometry ?
Strong vertical differences in fresh and salt layers?
Cathodic protection on board of moored ships?

Contribution of influences
Causes / influences Fresh Brackish Salt
1 Electrochem. Corrosion 5% 5% 9%
2 Biological activities 5% 9% 18%
3 Galvanic influence 0% 9% 27%
4 Fabrication 0% 5% 5%
5 Aeration 5% 5% 9%
6 Local high waterflow 0% 5% 9%
7 Vertical salt-fresh layers 0% 5% 0%
8 Cath. prot. on board of ship 5% 5% 5%
9 Splash-zone 18% 18% 18%
Relative Contribution 38% 66% 100%
Avg. corrosion [mm/50yr] 3,4 5,9 9,0
Max. corrosion [mm/50yr] 10,3 17,8 27,0
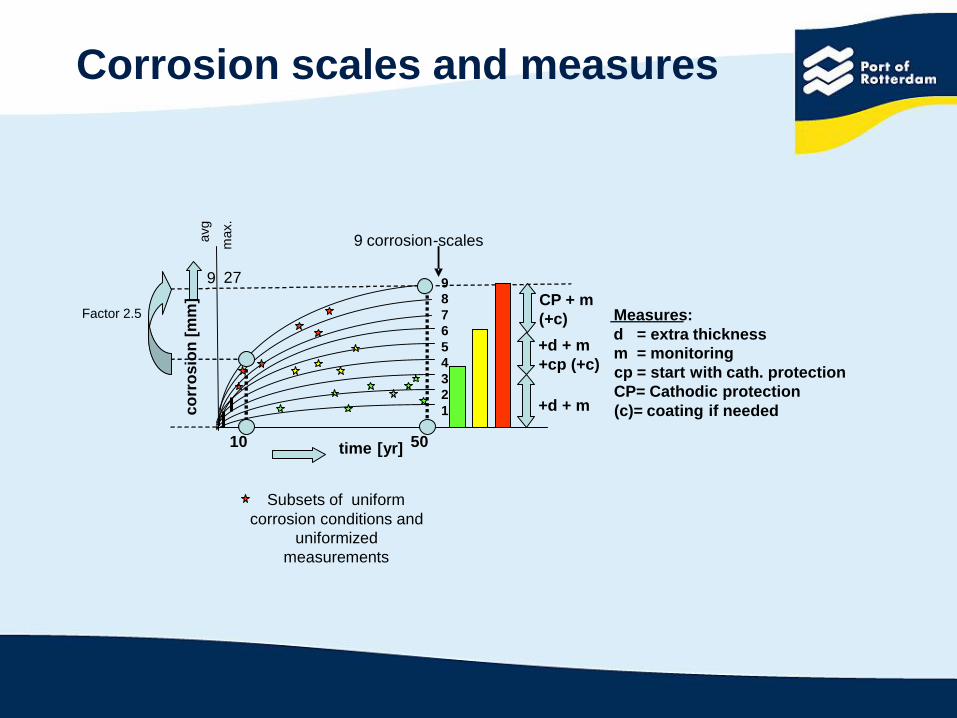
Subsets of uniform
corrosion conditions and
uniformized
measurements
time [yr]
co
rro
sio
n[m
m]
50
9
8
7
6
5
4
3
2
1
10
CP + m
(+c)
+d + m
+d + m
+cp (+c)
9 corrosion-scales
Measures:
d = extra thickness
m = monitoring
cp = start with cath. protection
CP= Cathodic protection
(c)= coating if needed
27
Factor 2.5
9
avg
max.
Corrosion scales and measures

25
Overview
23. ...........
3. ...................2. Biological activity1. Galvanic working
0-hypothesis( 9 main causes )
Probable causesExperts:
in lab in situMeasurements on
specific aspects:
Tuning in practice:
= uniform group
Then from scale to degradation
Uniform group of measurements are placed on the
corrosion scales (example: average 1,9 mm after 16
years)
26

Scale defenition
0,000
1,000
2,000
3,000
4,000
5,000
6,000
7,000
8,000
9,000
10,000
0 2 4 6 8 10 12 14 16 18 20 22 24 26 28 30 32 34 36 38 40 42 44 46 48 50 52 54
Inspection year
co
rro
sio
n s
ca
lel
schaal 1
schaal 2
schaal 3
schaal 4
schaal 5
schaal 6
schaal 7
schaal 8
schaal 9
wanddikte
Then from scale to degradation
Then from scale to degradation
Uniform group of measurements are placed on the
corrosion scales
Extrapolation of corrosion within scales (example
between scale 3 and 4)
28
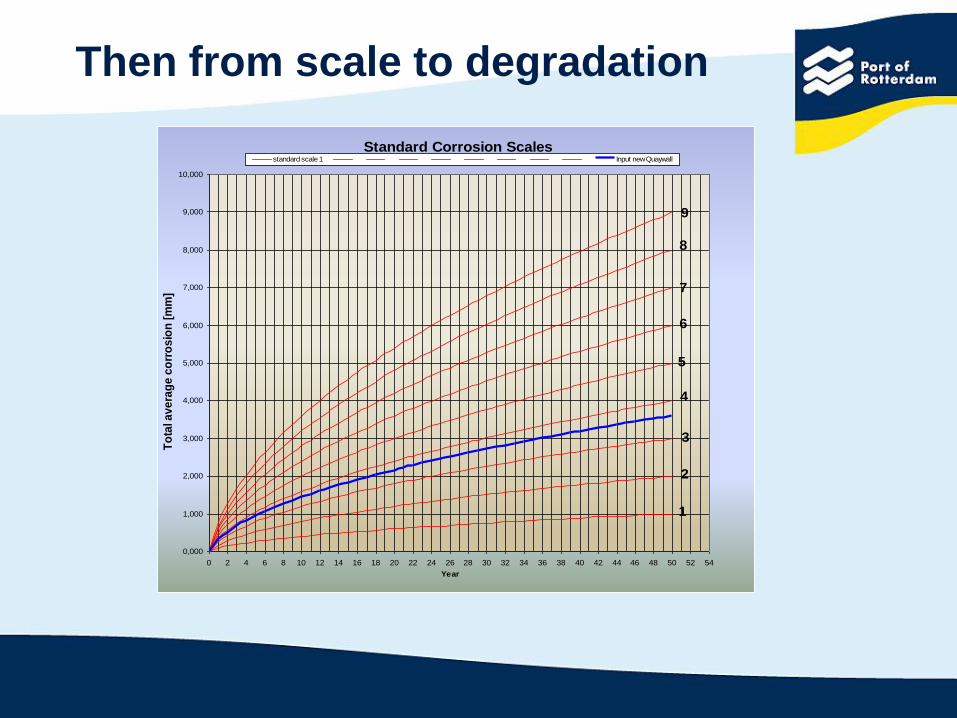
Standard Corrosion Scales
0,000
1,000
2,000
3,000
4,000
5,000
6,000
7,000
8,000
9,000
10,000
0 2 4 6 8 10 12 14 16 18 20 22 24 26 28 30 32 34 36 38 40 42 44 46 48 50 52 54
Year
To
tal a
ve
rag
e c
orr
os
ion
[m
m]
standard scale 1 Input new Quaywall
9
8
7
6
5
4
2
3
1
Then from scale to degradation
Then from scale to degradation
Uniform group of measurements are placed on the
corrosion scales
Extrapolation of corrosion within scales
Translation of corrosion to degradation (example
remaining safety factor 1,30)
Prediction of remaining lifetime
30
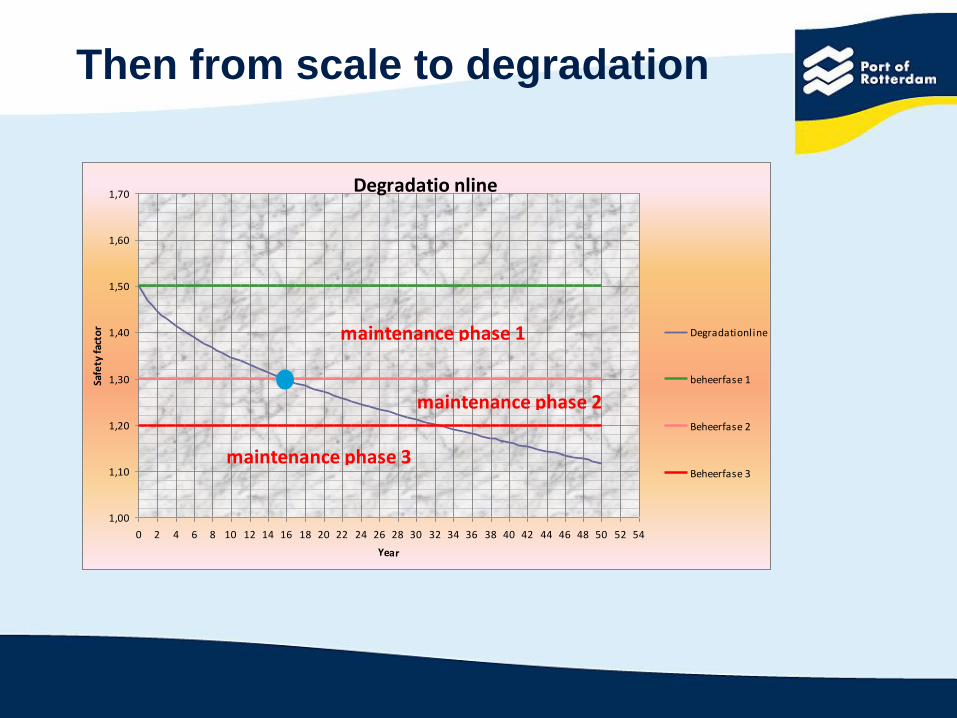
Then from scale to degradation
Degradatio nline
1,00
1,10
1,20
1,30
1,40
1,50
1,60
1,70
0 2 4 6 8 10 12 14 16 18 20 22 24 26 28 30 32 34 36 38 40 42 44 46 48 50 52 54
Year
Safe
ty f
acto
r
Degradationline
beheerfase 1
Beheerfase 2
Beheerfase 3
maintenance phase 1
maintenance phase 2
maintenance phase 3
Input for KMS
KMS: Quay wall modelling system
Port of Rotterdam’s next step in asset management
Supports the asset manager
Combines technical risk and business value in order to prioritise maintenance measure
Degradation model is part of KMS
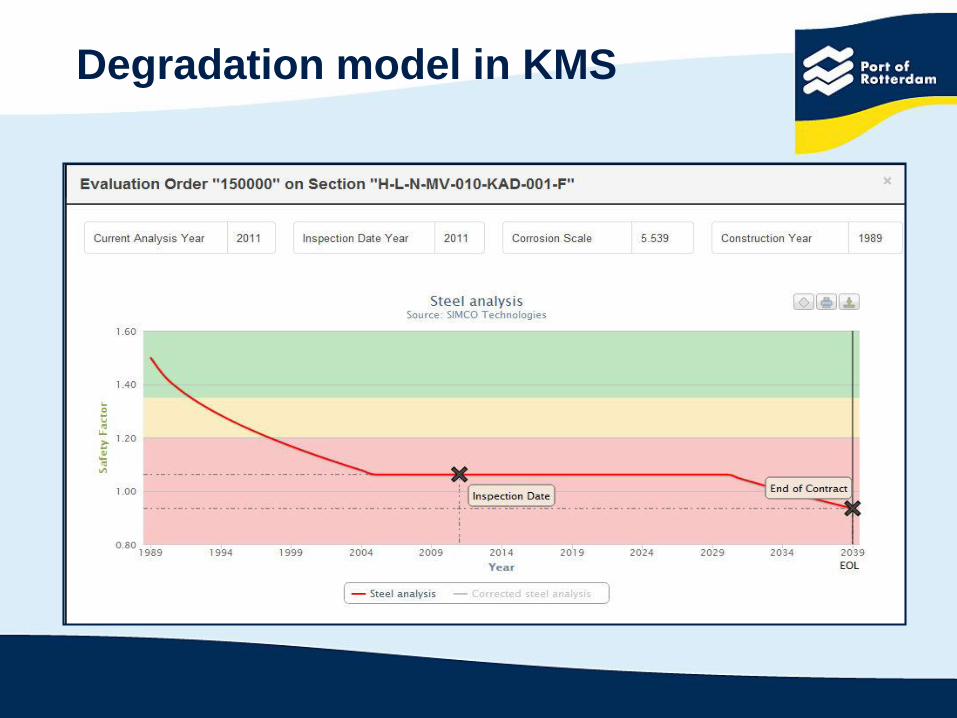
Degradation model in KMS

Ongoing research to improve the
steel model
Research in 2013 A + B + C + D
Coupon frame Measurement waterconditions Coupontest Galvanostat/Potentostat-measurement
H1 hypothesis Divice: Hach Lange
Z1AL L3 Locations Standard coupons
Houston O2
Boston pH exhibition coupons in lab
Corpus Christy Ec
Sohar T under variation of:
P.O.L.B Bart's (Microbiology ) pH
Rotterdam (reference) T
Upper layer O2
Mid. Layer
S235JO Sheetpiles
S465 Piles
"Bart's test":
Research on presence on
Bottom layer sulfate reducer
Coupontest on site
USA Sohar and the
Netherlans (for the
reference)
Water measurements:
O2 - pH - Redox
EC - temp Lab test
coupons
Electrical chemical
test for
determination of
accelerated
corrosion rates
Presentation corrosion research
potentiostat
device
coupon weighting and measuring of
water conditions, is always in
combination
Risks on CP systems
Unsufficient protection
Caused by anodes that don’t work properly
Incomplete coverage of structure
Caused by mechanical damage
Decrease of the anode lifetime
Caused by higher load on anode than designed due to
changing conditions
| 37
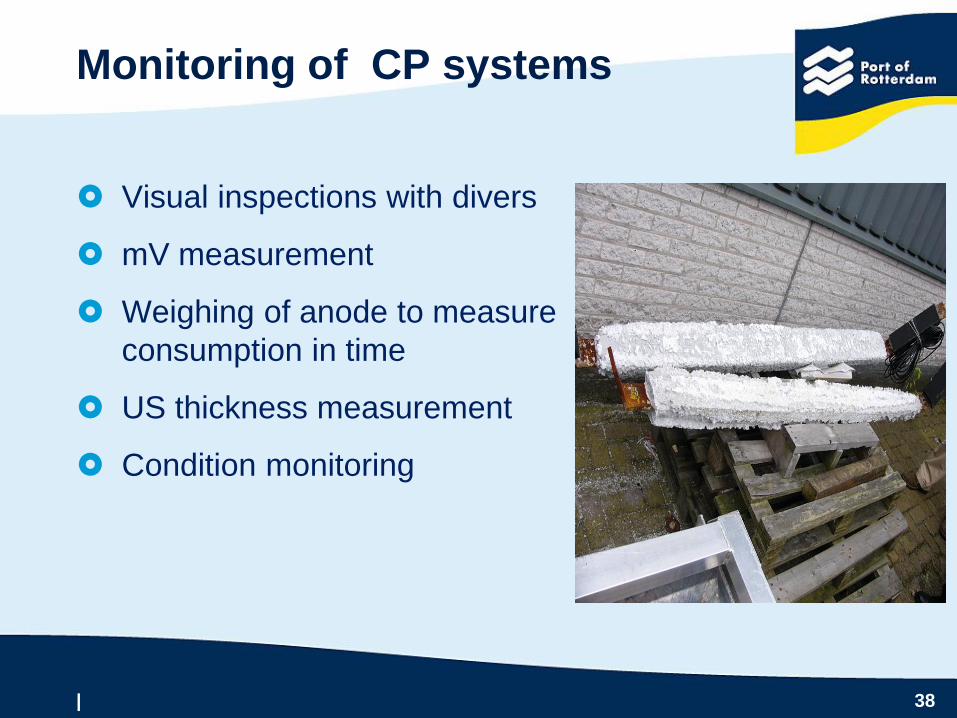
Monitoring of CP systems
Visual inspections with divers
mV measurement
Weighing of anode to measure
consumption in time
US thickness measurement
Condition monitoring
| 38
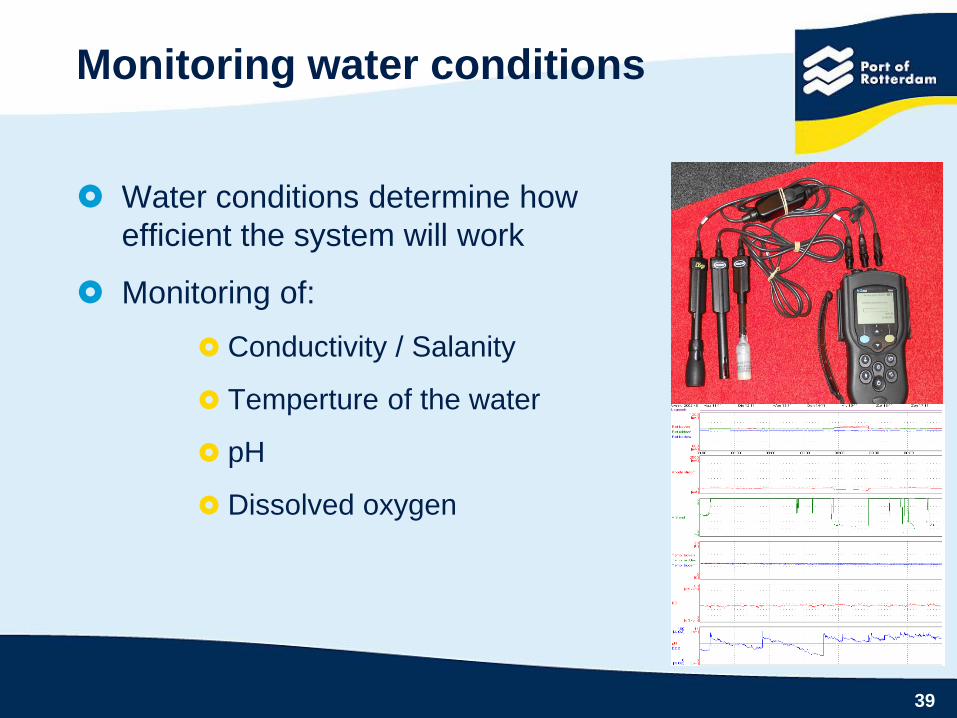
Monitoring water conditions
Water conditions determine how
efficient the system will work
Monitoring of:
Conductivity / Salanity
Temperture of the water
pH
Dissolved oxygen
39

Results of monitoring @PoR
mV is more than sufficient
Brackish/ fresh water :
anode consumption is lower
than in salt conditions
In salt water, the
consumption is less at end
of life of the anode
Development of anode
model
40

Thanks for your attention !