Embed Size (px)
Citation preview

ANNUAL REPORT 2013PORT HEDLAND PORT AUTHORITY

To the Hon Troy Buswell MLA
Minister for Transport
In accordance with Section 68 and clauses 34 and 35 of Schedule 5 of the Port Authorities Act 1999, I hereby submit for your information and presentation to Parliament, the Annual Report of the Port Hedland Port Authority for the financial year ended 30 June 2013.
Ken Pettit
Chairman, PHPA Board of Directors
STATEMENT OF COMPLIANCE

ContentsYear in Review 4
Significant Trends 6Chairman’s Report 8Chief Executive Officer’s Report 10Organisational Profile 12
Facilitating Trade 21
Marine 22Landside 30Maintenance 34
Planning for Future Growth 39
Our People Our Culture 45
License to Operate 51
Environment and Heritage 52Health and Safety 56Corporate Governance, Risk Management and Compliance 58Integrated Management System 59Stakeholder Engagement 60
Corporate Governance 63
Ministerial Directives 64Code of Ethics and Conduct 64Recordkeeping 64Freedom of Information 64Public Interest Disclosure 64 Advertising, Market Research and Sponsorship 65
Directors’ Report 67
Directors 68Net profit after tax 68Review of operations 68Key Performance Indicators - Financial 69Key Performance Indicators - Economic and Operational 72Capital expenditure guidelines 75Remuneration Report 77Indemnification of Directors and Auditors 79Indemnification of Auditors 79Rounding of amounts 79
Financial Statements 81
Directors’ Declaration 82Auditor’s Report 83Financial Statements 85Notes to the Financial Statements 89
3 Port Hedland Port Authority – Annual Report 2013 3

Total throughput (million tonnes) 288.4mt
Underwent corporate rebranding and introduction of new corporate logo
Profit before tax (million) $64.2Record breaking monthly throughput (May 2013) 28.6mt
YEAR IN REVIEWOUR HIGHLIGHTS
4

Record breaking annual Utah Multi-User Bulk Handling Facility throughput of 12.4mt
0 Lost Time Injury Frequency Rate of zero for
PHPA employees. Combined PHPA employee and contractor rate decreased to 4.8 from 9.4
Record breaking single iron ore shipment to leave Port Hedland on-board the PSU Seventh (9 June 2013) (tonnes) 256,450
Record breaking tonnage on a single tide (15 January 2013) 1.059mt
5 cruise ship visits
Recipient of the following awards: Lloyd’s List DCN 2012 – Port of the Year Award
Australian Bulk Handling Review 2012 – Bulk Handling Facility of the Year (Resources and Infrastructure) Award
Australian Bulk Handling Review 2012 – Environmental Project of the Year Award
Water Corporation’s Water Efficiency Management Plan Program – Gold Category Winner
Port Hedland Port Authority – Annual Report 2013 5

6
0
50
100
150
200
250
300
2009
Ton
nes
(‘0
00
,00
0)
2010 2011 2012 2013
Port throughput per fiscal year
159179
199
247
288
0
500
1000
1500
2000
2009 2010 2011 2012 2013
Total number of vessels
1,2211,309
1,485
1,845
2,031
Nu
mb
er o
f ve
ssel
s
0%
2%
4%
6%
8%
10%
12%
14%
16%
7.2%
4.1%
3.0%
13.1%
14.7%
Economic rate of return Comparison 2008-09 to 2012-13
2008-09 2009-10 2010-11 2011-12 2012-13
Per
cen
tag
e
0%
2%
4%
6%
8%
10%
12%
14%
16%
6.8%
12.0%
0.5%
3.9%
14.2%
2008-09 2009-10 2010-11 2011-12 2012-13
Per
cen
tag
e
Return on assets Comparison 2008-09 to 2012-13
Significant Trends
6

7Port Hedland Port Authority – Annual Report 2013
7
7Port Hedland Port Authority – Annual Report 2013

8
Chairman’s Report
I am pleased to report a successful year for the Port Hedland Port Authority.
The Port Hedland Port Authority’s (PHPA) port operations were conducted without significant adverse events in the key fields of health and safety, environment and vessel movements, and the port’s export performance and financial results for the period have been outstanding. Staff are aligned in aim and endeavour with a strong and capable executive leadership.
Ensuring the health and safety of PHPA staff in the workplace continues to be a priority for the Board. The Lost Time Injury Frequency Rate for PHPA employees was zero for the year under review. For contractors on site, the PHPA achieved a reduction in the lost time
injuries from 9.4 to 4.8.
The PHPA’s proactive approach to environmental management was nationally recognised with the Utah Multi-User Bulk Handling Facility (Utah Facility) receiving the Australian Bulk Handling Review 2012 Environmental Project of the Year Award and a Water Corporation Water Efficiency Management Plan Program Gold Category Award in May 2013.
The Board is proud of our mangrove propagation and rehabilitation program and we look forward to its continued advancement next year. Dust reduction and suppression programs have made further substantial progress in the year.
Vessel loading at Utah Facility

9Port Hedland Port Authority – Annual Report 2013
The PHPA has facilitated another period of strong trade performances by its customers. Total throughput at the port continued to increase, reaching a record 288.4 million tonnes for the year (mtpa), an increase of 17% from the previous year.
The PHPA’s four public berths also performed well in one of the busiest years on record. Utah Facility throughput increased 9% and Berth 1 throughput of copper exports rose to a record 469,279 tonnes.
The port’s performance has been nationally acknowledged, with the PHPA winning Lloyd’s List DCN 2012 Port of the Year Award, and the Utah Facility winning the Australian Bulk Handling Review 2012 Bulk Handling Facility of the Year (Resources and Infrastructure) Award.
In light of changing global outlooks and altered regional infrastructure investment commitments, the PHPA has focused on working with port users to optimise exploitation of the port’s existing infrastructure and capacity, achieving excellent outcomes.
Notwithstanding that focus, the PHPA continued to explore and progress opportunities for port expansion and development. The PHPA advanced the strategic planning for a number of key developments, including the Lumsden Point general cargo facility, and the Multi-User Outer Harbour Facility, both critical to ensuring sustainable trade facilitation in the medium to longer term.
These and other developments and improvements have substantially increased our confidence that the PHPA will realise its target throughput capacity for the inner harbour of 495mtpa.
The PHPA trade performances have helped us to a robust financial and operational performance, including a profit before tax of $64.2 million, an improvement on the previous year’s financial performance of 39%.
A large part of these successes is due to our unified and committed staff. This past year, the PHPA implemented a new set of key performance indicators, with robust, measurable targets for the Chief Executive Officer for the 2012-13 financial year. These KPIs link the CEO’s performance to the PHPA’s overall strategic objectives and cascade through the management team to align projects and operational activities. The KPIs were very well received by staff and we will build on this success with further refinements in the coming year.
“ …The port’s projected trade growth for the next five years remains strong…”The Board’s strategic considerations remain
focused on ensuring port development in support of and in advance of forecast growth. The PHPA strategy, at its core, is designed to ensure that the port’s ability to dispatch/receive cargo is always ahead of our customers’ capacity to deliver it to our berths.
On behalf of the Board, I express our appreciation for this year’s performance by the CEO, the Executive Team and all of our staff. I also extend my appreciation to the Minister and his staff, and to the Executive Teams at the Departments of Transport and State Development, for their cooperation, assistance and advice. Finally, I thank my fellow Directors, past and present, for their commitment, professionalism and diligence.
Ken Pettit Chairman, PHPA Board of Directors

10
Chief Executive Officer’s Report
The global demand for bulk commodities, in particular iron ore, remained strong during the 2012-13 financial year. This saw the PHPA register another period of strong trade growth, with a record total throughput of 288.4 million tonnes.
The PHPA’s financial performance also remained strong, with the growth in trade and a continued focus on fiscally sound management generating revenue of $214.9 million and profit before tax of $64.2 million. These results demonstrate the PHPA’s capacity to facilitate and expand regional trade and to operate in a safe, profitable, sustainable, efficient and innovative manner.
Priority areas
The health, safety and wellbeing of every person who enters the port remained an absolute priority for me over the last twelve months. I am encouraged to see that the increased focus in this area has resulted in a Lost Time Injury Frequency Rate (LTIFR) of zero for PHPA employees and a decrease in the combined PHPA employee and contractor LTIFR from 9.4 to 4.8 for the reporting period.
Our goal for the coming period is to build on this positive trend to further improve our safety performance.
“ …Effective and sustainable management of the port environment has also been a priority for the Executive…”
Effective and sustainable management of the port environment has also been a priority for the Executive. The port’s boundary dust monitoring network was upgraded, and additional dust management tools, including a customised desktop dust forecasting and management model, used daily by operators, has further assisted the PHPA to reduce reportable dust events to less than half of that reported the previous year.
Vessels loading at Finucane Island Berths A and B

11Port Hedland Port Authority – Annual Report 2013
I am also pleased to report the continued success of the PHPA’s mangrove propagation and rehabilitation program, a leading initiative in Western Australia for environmental management of the seven species present in the port.
Milestones
The last twelve months have seen a number of significant operational milestones achieved as the PHPA continues to optimise its operations and enhance service delivery at the port.
During the reporting period, a new monthly throughput record of 28.6 million tonnes (mt) was set in May 2013, with a new single shipment record of 256,450 tonnes (on-board the PSU Seventh) also set. The PHPA regularly sailed five to six fully-laden cape size vessels on a single tide, resulting in over 1 million tonnes being exported over a three to four hour period. In March 2013, 1,007,164 tonnes of iron ore was shipped on a single tide with only five vessels for the first time.
The PHPA’s Utah Multi-User Bulk Handling Facility also continued to perform well, achieving a record annual throughput of 12.4mt for the financial year. The development of the Utah Facility’s Stockyard 2 commenced, and, once completed, will present opportunities for further increases in export volumes through the facility.
Key projects
This past year has also seen significant progress on three key projects at the port, namely the development of a business case for a general cargo facility at Lumsden Point, the development of a Multi-User Outer Harbour Master Plan, and the construction of a second stockyard at the Utah Facility. These three projects are key elements of the PHPA’s long term strategic development plan, and will play a critical role in underpinning the port’s capacity for future trade growth.
Finally, the year in review saw the PHPA receive Ministerial and Treasury approval to implement a Port Improvement Rate (PIR) in support of future capital works projects at the port. The PHPA commenced development of the PIR framework, with implementation scheduled for September 2013.
The future
Looking forward to the 2013-14 financial year, the health and wellbeing of our people and environment will remain a priority. The PHPA’s ability to maintain its licence to operate and its performance in this space will continue to serve as a key measure of its success.
Our planning in the year ahead will relate to both our operational focus and our people, building upon our operational capabilities and ensuring that we have sound structures in place to meet the needs of our continuing expansion.
In conclusion, I would like to extend my thanks to the Hon Troy Buswell MLA, Minister for Transport, for his support of the PHPA’s key initiatives over the last twelve months. Similarly, thanks are due to the Chairman, Ken Pettit, for his guidance and support, and to the Directors of the PHPA Board for their contribution and strategic input on a wide range of port matters.
I have also very much appreciated the support of my fellow members of the Executive Team. I would like to acknowledge their efforts and those of all PHPA staff, who, through their diligence and professionalism have all contributed to another successful year for the PHPA.
Roger Johnston Chief Executive Officer

12
• the control of operations and business of the port and the power to hold and dispose of assets and enter into commercial arrangements;
• the safe and efficient operation of the port;
• the maintenance and preservation of property vested in the port; and
• the protection of the port environment and minimisation of the impact of port activities on that environment.
Organisational Profile
Legislative Framework
The Port Hedland Port Authority (PHPA) is a commercialised trading entity under the Port Authorities Act 1999.
The Act defines a clear role for all Port Authorities and establishes lines of accountability and reporting requirements to the State Government.
Under the Act, the PHPA has a duty to act on commercial principles, and is afforded the power to perform defined functions, including:
• the facilitation of trade and planning for future growth and development of the port for the economic benefit of the State;
Vessels waiting in anchorage at Port Hedland

13Port Hedland Port Authority – Annual Report 2013
Act exemptions
The Port Authorities Act 1999 adopts financial reporting provisions equivalent to those of Corporations Law and exempts the PHPA from the Financial Management Act 2006, with the exception of audit provisions. The Auditor General is required to conduct an annual audit of the PHPA.
The Port Authorities Act 1999 also exempts the PHPA from the Public Sector Management Act 1994, but requires it to put in place minimum standards that reflect the principles of the Act. The Commissioner of Public Sector Standards may direct the Board to report to him.
PHPA Board roles
The PHPA’s Board of Directors is responsible to the Minister for Transport. The Board’s role is to set the strategic direction of the PHPA, agreeing to goals for management and monitoring the achievement of those goals.
The PHPA’s governing body is a Board of six non-executive Directors, including the Chairperson. The Board comprises five Directors who are appointed by the Minister for Transport, plus one industry-nominated Director.
The role of the Board is to “perform the functions, determine the policies and control the affairs of the port authority” (Section 8 (2) of the Port Authorities Act 1999).
In carrying out its responsibilities and exercising its powers, the Board at all times recognises its overriding responsibility to act honestly, fairly and diligently, and in accordance with the law, in serving the interests of the State of Western Australia, the PHPA’s employees, its port users and the community.
The enabling legislation sets out the roles, responsibilities and powers of the Board, and the Chief Executive Officer, who is appointed by the Board and is responsible for the PHPA’s day-to-day management.
Stockpiles at Utah Facility

14
WHO WE ARE: VISION, MISSION, VALUESThe vision and mission statements describe the PHPA’s business intent. In conjunction with its organisational values, these statements guide the PHPA in its planning and decision making processes as it works towards delivering on its strategic goals.
VisionTo be the world’s leading port, helping to create a sustainable region.
MissionTo safely, profitably, sustainably, efficiently and innovatively operate the port to promote, facilitate and expand regional trade.
ValuesThe PHPA’s success is underpinned by its skilled, experienced and professional people, and their commitment to the following organisational values:
Respect - operate fairly and honestly in all dealings with all stakeholders.
Excellence – strive to be the best in all we do, and maintain strong focus on continuous improvement and innovation.
Courage – do the right thing every time, act with integrity in all we do, and always speak up.
As the PHPA continues to grow, these overarching objectives and principles establish a clear framework by which the PHPA can meet the challenges that accompany such growth, enabling it to deliver the best outcomes possible.
15Port Hedland Port Authority – Annual Report 2013
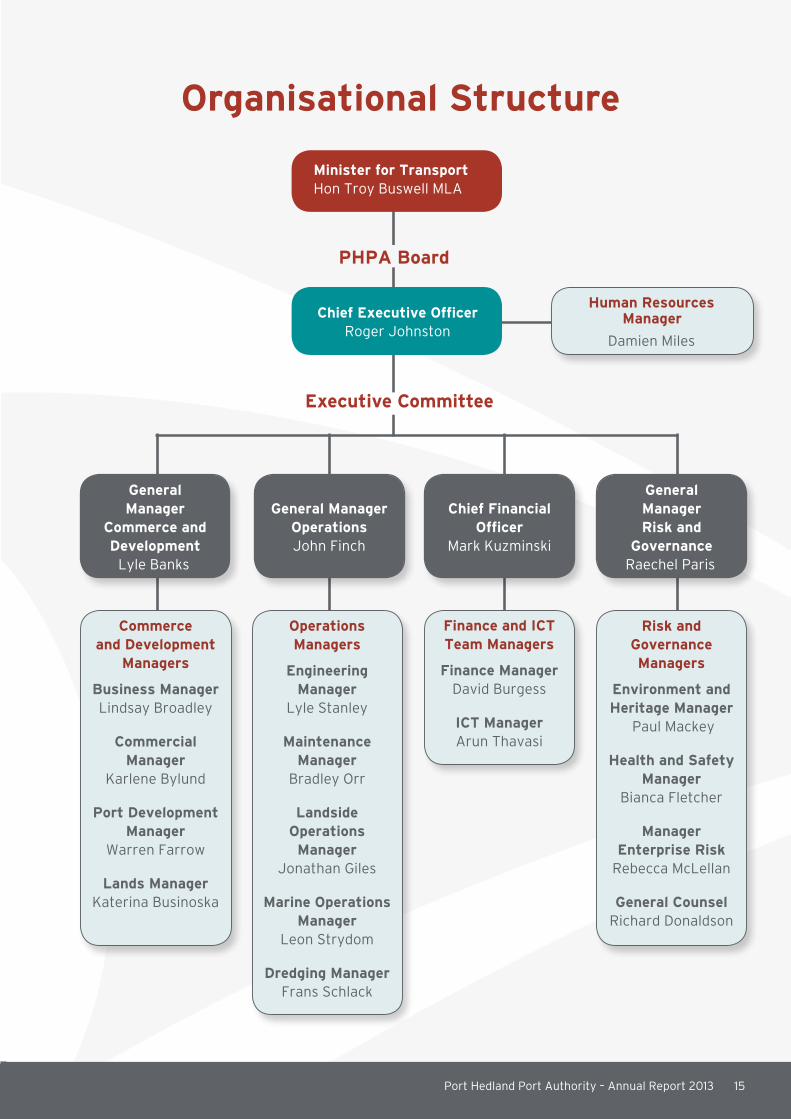
Organisational Structure
Minister for Transport Hon Troy Buswell MLA
PHPA Board
Chief Executive Officer Roger Johnston
General Manager
Commerce and Development
Lyle Banks
General Manager Operations John Finch
Chief Financial Officer
Mark Kuzminski
General Manager Risk and
Governance Raechel Paris
Human Resources Manager
Damien Miles
Executive Committee
Risk and Governance Managers
Environment and Heritage Manager
Paul Mackey
Health and Safety Manager
Bianca Fletcher
Manager Enterprise Risk
Rebecca McLellan
General Counsel Richard Donaldson
Finance and ICT Team Managers
Finance Manager David Burgess
ICT Manager Arun Thavasi
Operations Managers
Engineering Manager
Lyle Stanley
Maintenance Manager
Bradley Orr
Landside Operations Manager
Jonathan Giles
Marine Operations Manager
Leon Strydom
Dredging Manager Frans Schlack
Commerce and Development
Managers
Business Manager Lindsay Broadley
Commercial Manager
Karlene Bylund
Port Development Manager
Warren Farrow
Lands Manager Katerina Businoska

16
Board of Directors
Ken Pettit SC, AIT; BA; BJuris; LLB Chairman
Ken joined the Board as non-executive Chairman in July 2011 for a term expiring 30 June 2013. He is also the chair of the PHPA Remuneration Committee.
Ken is a senior barrister practising from Francis Burt Chambers in Perth, Western Australia. He joined the independent bar in 1995 and was appointed as Senior Counsel in 2003.
Ken has 26 years’ experience, specialising more recently in the fields of mining, property, planning, native title, commercial and industrial relations law. He worked for the State Solicitor’s office between 1986 and 1995.
Before entering the legal profession, Ken graduated and worked as a pharmacist.
Ken is also a Board Member of the Diabetes Research Foundation WA and the Keogh Institute for Medical Research. He is no longer a director of any listed company.
Les Longden, BE (Hons), Grad Dip App Fin, FAICD, F Fin
Deputy Chairman
Les was appointed to the Board on 1 October 2009 and has since been reappointed for a term expiring 31 December 2013.
Les has over 20 years’ experience in the resources industry, across a variety of development and operations roles. He is currently principal of a Perth-based engineering and project management consultancy, and was previously an executive director of an ASX-listed oil exploration and production company.
Les is a fellow of the Australian Institute of Company Directors and a fellow of the Financial Services Institute of Australasia.
Julian Tapp, MSc (Distinction), BA (Upper Second) Director
Julian was appointed to the Board on 30 June 2009 and has since been reappointed for a term expiring 30 June 2013.
Julian is Chief Executive Officer and Executive Director of Energy and Minerals Australia Limited. Julian has a Master’s Degree in the Theory of Public Finance and has worked as an economics lecturer (LSE, Murdoch, Brunel) for five years and as an economist in industry (Ford of Europe, BP and BAE Systems) for 17 years.

17Port Hedland Port Authority – Annual Report 2013
Peter Wilshaw, BSc (1st Class Hons), Chemistry Master’s degree (Business Leadership) Director (Lessee Representative)
Peter was appointed to the Board on 25 July 2012 and resigned on 31 March 2013.
Peter has 30 years’ experience in the resources industry, starting with Impala Platinum in South Africa in 1980. He has held senior operational roles, including General Manger, Chief Executive Officer and Chief Operating Officer with a number of national and international resource companies. More recently, Peter joined BHP Billiton Iron Ore in January 2011 as VP Logistics and Infrastructure.
Elisa Fear, BComm, MBA Director
Elisa was appointed to the Board on 15 June 2010 and has since been re-appointed for a term expiring 30 June 2014.
Elisa has held a wide variety of positions within the financial sector, both in Australia and the United Kingdom. This includes three years with Macquarie Bank’s Project and Structured Finance Division, providing advice in relation to infrastructure assets in Western Australia.
Robert Vitenbergs, BSc (Hons) Director
Rob was appointed to the Board 25 July 2012 and resigned on 30 April 2013.
Rob holds a Bachelor of Science (Hons) and has 22 years’ experience in the Royal Australian Navy. Rob also held a position as Marine Manager with Hamersley Iron and was a former President of the Shire of Roebourne.
Matthew Dowd, BEng Alternate Director (Lessee Representative)
Matt was appointed to the Board as an alternate director to Peter Wilshaw on 25 July 2012 for an open-ended term.
Matt has over 14 years’ experience in mining and construction businesses, focused mainly on iron ore, and has held a variety of senior operational roles throughout that time. Matt is currently employed as General Manager, Port Operations with BHP Billiton Iron Ore.

18
Executive Team
Roger Johnston Chief Executive Officer
Roger joined the PHPA in January 2012.
Well-regarded for his clear leadership and focused strategic capabilities, Roger brings with him over 30 years’ experience as a senior executive and company director.
Prior to commencing at the PHPA, Roger worked in senior roles with a number of multinationals and logistics companies, most recently in the construction materials sector in Western Australia.
Roger holds a Bachelor of Science Degree and is a Member of the Australian Institute of Company Directors.
Lyle Banks General Manager, Commerce and Development
Lyle joined the PHPA in April 2013, bringing with him 25 years’ national and international experience in port development across the private and public sectors.
Prior to joining the PHPA, Lyle worked in senior roles at Fremantle Ports, responsible for the management of planning, environmental and port development functions, and overseeing a successful, integrated approach to the port’s strategic development and asset use.
Lyle holds a Masters of Law and Bachelor of Engineering from the University of Melbourne, a Diploma in Business (Port & Terminal Management) from the Australian Maritime College, and is a Member of the Australian Institute of Company Directors.
Captain John Finch General Manager, Operations and Harbour Master
John joined the PHPA in February 2010 and is a Master Mariner by profession and he holds an MBA in Maritime Management. He has 30 years’ experience in marine, regulatory and port management roles and brings extensive knowledge and operational expertise to the PHPA.
Prior to joining the PHPA, John was Harbour Master in a number of Queensland ports. He held senior port operations and regulatory positions after serving approximately 15 years on international and coastal vessels in various marine industry sectors.

19Port Hedland Port Authority – Annual Report 2013
Mark Kuzminski Chief Financial Officer
Mark joined the PHPA in January 2012 and holds a Bachelor of Business (Accounting) from the University of Western Sydney, in addition to being a CPA.
Mark has over 20 years’ experience in commercial and government roles, both in Australia and overseas. This blend of experience is ideally suited to his role as CFO of the PHPA, which is a Government Trading Enterprise.
Raechel Paris General Manager, Risk and Governance
Raechel joined the PHPA in May 2011 and holds a Bachelor of Arts/Law from Monash University. She has more than 14 years’ experience in legal, commercial and governance roles with national and international accountability, and brings a wealth of corporate governance knowledge to the PHPA.
Raechel is also a member of the Chartered Secretaries Institute and a Graduate of the Australian Institute of Company Directors.
Vessel loading at Finucane Island

20
Port Hedland tug pen

Facilitiating Trade
21Port Hedland Port Authority – Annual Report 2013

MarineThe PHPA’s Marine Operations team is responsible for ensuring the safe and efficient movement of vessels through Port Hedland harbour, whilst providing immediate and appropriate responses to safety and environmental incidents.
The 2012-13 financial year has seen an increase in the demand for marine services, commensurate with the increase in trade through the port.
The port of Port Hedland has continued to experience significant growth in trade with a total throughput of 288.4 million tonnes (mt) for the reporting period; this is an increase of 17% on the 2011-12 financial year.
Record breaking year
Significant milestones were achieved during the reporting period, including a new monthly throughput record of 28.6mt for May 2013, as well as the single shipment record (on-board the PSU Seventh) which now stands at 256,450 tonnes.
In addition, the PHPA now regularly sails five to six fully-laden cape size vessels on a single tide, resulting in over 1 million tonnes being exported within a three to four hour period.
In March 2013, the PHPA shipped 1,007,164 tonnes of iron ore on a single tide. Although this has been achieved in the past with six vessels on a tide, it was the first time this was achieved with only five vessels.
This record was achieved during neap tides (a tide in which the difference between high and low tide is the least), with the deepest draft vessel sailing at 17.41m, demonstrating the benefits of Very Large Ore Carriers greater than 200,000 deadweight tonnes.
22

23Port Hedland Port Authority – Annual Report 2013
Shipping movements
The figure below illustrates port shipping movements, tug jobs and tonnage changes over the years from 2009 to 2013. Shipping movements and tug jobs increased by 66.2% and 69.7% respectively. Tonnage output also increased by 80.4%, thereby indicating a shift towards larger vessels.
Ju
l 20
08
Oct
20
08
Jan
20
09
Ju
l 20
09
Oct
20
09
Jan
20
10
Ap
r 20
09
Ju
l 20
10
Oct
20
10
Ap
r 20
10
Jan
20
11
Ju
l 20
11
Oct
20
11
Jan
20
12
Ap
r 20
11
Ju
l 20
12
Oct
20
12
Ap
r 20
12
Jan
20
13
Ap
r 20
13
0
200
400
600
800
1000
1200
1400
0
5,000,000
10,000,000
15,000,000
20,000,000
25,000,000
30,000,000
Movements Tug jobs (Est.) Tonnage
Ton
nes
Nu
mb
er o
f ve
ssel
s

24
Pilotage
Port Hedland Pilots (PHP) continues to provide the PHPA with pilotage services within the Port Hedland harbour.
The internationally certified company, which achieved the International Standard for Pilotage Organisations Code 2011 (ISPO) and Det Norske Veritas (DNV), is in its third year of a five-year contract.
PHP were only the 10th pilotage organisation in the world to achieve this internationally recognised pilotage system certification.
Increased vessel movements at the port in recent years have resulted in PHP increasing its workforce to 19 marine pilot positions.
In 2012-13, a total of 4,140 piloted shipping movements were undertaken. This represents a 9.4% increase on piloted shipping movements over the 2011-12 financial year.
Relationship of movements per vessel size
DWT
0 – 50,000 17.7%
50,001 – 100,000 6.0%
100,001 – 150,000 2.7%
150,001 – 200,000 46.5%
200,001 – 250,000 24.7%
250,001 – 300,000 2.4%
% of vessels piloted by dead weight tonnages
Marine Pilot transfers
Marine Pilot transfers continued to be operated by Jayrow Helicopters and GO Marine Group, for helicopter and pilot boat operations respectively. The demand placed upon these services continued to grow, with additional marine and aviation staff and assets being required to safely manage increased operations.
Pilot transit mode of operation
Helicopter 88%
Pilot Boat 12%
Pollution response capability
In recent years, the PHPA has invested significantly in oil spill preparedness equipment and training to ensure the risks associated with continued port growth are effectively managed.
This preparedness was tested in May 2013 by conducting exercise ‘Black Watch’ to simulate and improve the PHPA’s first strike response to a tier-one oil spill in the inner harbour. Approximately 60% of PHPA staff participated in the exercise, along with some port service providers and exercise umpires.
Exercise ‘Black Watch’ was highly successful, with the outcomes and observations from this enhancing the PHPA’s capability and preparedness to respond to emergency incidents.

25Port Hedland Port Authority – Annual Report 2013
Dynamic Under-Keel Clearance system
The PHPA has continued the upgrade of its Dynamic Under-Keel Clearance (DUKC) system, a tool critical in accurately predicting the depth of water between a vessel’s keel and the seabed.
In transitioning to the new DUKC Series 5 system, the PHPA has continued to improve port efficiency and enhance risk management capability.
The new system will improve the port’s ability to plan for departures, with graphical window opening and closing displays, an improved editable update facility, access to previous voyage data, and the ability to view progress of current voyages.
Klein Systems Software
The PHPA continues to utilise the world’s leading Klein Systems Group port operations software to efficiently manage marine operations scheduling requirements.
The PHPA has upgraded the Klein vessel management system software to enable operational port stakeholders to move towards an online booking system, reducing the administrative burden on shipping agents and terminals.
Portable Pilot Units
Enhancements to the Portable Pilot Units (PPU) were implemented during the financial year. This technology has allowed the PHPA to pioneer marine pilot passages with the most advanced PPU systems in Australia.
Marine pilots receive direct live feeds from tidal, weather, under-keel clearance and current flow rates to their individual units, promoting safety, emergency contingency planning and general overall channel passage efficiency.
Port security
The PHPA is committed to providing secure port facilities to meet its obligations under the Maritime Transport and Offshore Facilities Security Act 2003, Maritime Transport and Offshore Facilities Security Regulations 2003 and the PHPA Security Plan.
Security is a high priority for the PHPA, and procedures and policies are in place to support the PHPA’s legislative requirement to provide a secure environment.
The PHPA’s Online Induction package was reviewed during the 2012-13 financial year and updated to improve the functionality and accessibility of the system. Staff and port users can now access the PHPA Online Induction via a secure login.
A new Isolation and Tagging Module was also added to the induction package. All personnel sitting the PHPA Online Induction now complete four modules:
• Occupational Health & Safety;
• Security;
• Environment & Heritage; and
• Isolation & Tagging.
Security on-water test
In November 2012, the PHPA participated in a joint security on-water operations exercise called ‘Exercise Mackerel’ with the Pilbara Regiment – Squadron One, North West Water Police, Customs & Border Protection and AQIS.
The aim of the exercise was to promote inter-agency cooperation and to test operational procedures.
In particular, the exercise provided the Pilbara Regiment with the opportunity to exercise their water operations assets, to train personnel and to become familiar with the geography of the inner harbour. The exercise also allowed the PHPA to meet its legal obligations under the maritime security legislation and Port Security Plan.

26
Security improvements will continue through 2013-14 with the following projects approved and underway:
• Eastern Harbour and Utah CCTV expansion and upgrade;
• Improved Electronic Access Control System (EACS); and
• Perth Office CCTV and EACS installation.
In addition, four PHPA personnel and seven personnel from three different maritime industry organisations successfully completed the International Ship and Port Security Port Facility Security Officer training course held at the port in March 2013.
Maritime Security Identification Card
The PHPA is an approved Maritime Security Identification Card (MSIC) Issuing Body.
To date, in excess of 9,000 MSIC applications have been processed since the opening of the MSIC Issuing Body in 2006. The MSIC Issuing Body has established systems and procedures which have been successfully and independently audited on five occasions by Maritime Security Inspectors from the Office of Transport Security.
In addition:
• The latest version of the PHPA MSIC Issuing Body Plan was approved by the Department of Infrastructure and Transport, Office of Transport Security on 27 November 2012.
• Maritime Security Inspectors from the Office of Transport Security performed an external audit of the PHPA MSIC Issuing Office in October 2012.
• The PHPA MSIC Issuing Body achieved 100% compliance with the MSIC Issuing Body Plan and applicable legislation.
Port Security Plan
The PHPA Port Security Plan, which underpins the PHPA’s commitment to providing secure port facilities, is continuously updated as port development expands.
Towards the end of the reporting period, the PHPA commenced an annual review of the Port Security Plan as required by the Department of Infrastructure and Transport, Office of Transport Security.
The Security Regulated Port boundary has been amended to include the Lumsden Point Dredge Material Management Area and the newly-constructed FMG Anderson Point 4 berth, with the landside and waterside Restricted Zone Maps also updated to include this berth.
Recreational vessel safety campaign
With the number of vessel movements within the harbour continuing to grow, the PHPA is committed to educating recreational vessel (RV) users about the potential dangers of large commercial vessels entering and leaving the harbour, and informing RV skippers of waterside restricted zones.
The PHPA has developed and implemented a RV safety awareness campaign as part of a proactive risk management tool to reduce the number of RV related incidents in the harbour.
The campaign was launched in May 2013 and involved local media coverage, local radio and print advertising, and distribution of a PHPA produced RV safety brochure. These brochures were distributed to local bait and tackle retailers in Port Hedland, as well as RV instructors and skippers at the Port Hedland public boat ramp.
27Port Hedland Port Authority – Annual Report 2013
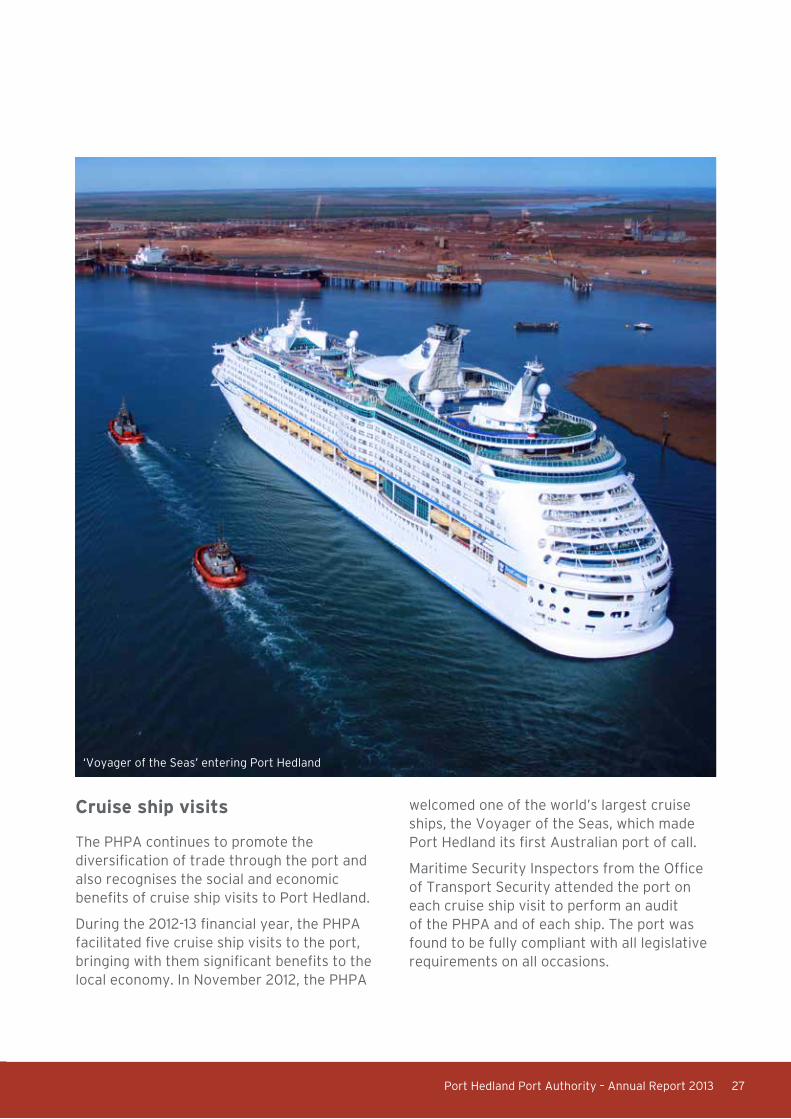
Cruise ship visits
The PHPA continues to promote the diversification of trade through the port and also recognises the social and economic benefits of cruise ship visits to Port Hedland.
During the 2012-13 financial year, the PHPA facilitated five cruise ship visits to the port, bringing with them significant benefits to the local economy. In November 2012, the PHPA
welcomed one of the world’s largest cruise ships, the Voyager of the Seas, which made Port Hedland its first Australian port of call.
Maritime Security Inspectors from the Office of Transport Security attended the port on each cruise ship visit to perform an audit of the PHPA and of each ship. The port was found to be fully compliant with all legislative requirements on all occasions.
‘Voyager of the Seas’ entering Port Hedland

28
Impacts from cyclone events
Port Hedland is located on the Pilbara coast, in a region prone to cyclone events from the months of November to April.
The 2012-13 cyclone season has been active and damage-free for the PHPA, resulting in two separate port closures:
• Cyclone Peta (category 1) closed the port for 21 hours in January 2013; and
• Cyclone Rusty (category 4) closed the port for 86.5 hours in February 2013.
The anchorages were closed for a total of 117 hours for the financial year. The port was closed for 107.5 hours, against a budgeted 120 hours for each financial year.
Maintenance dredging
The PHPA’s most recent maintenance dredging program was completed on 29 July 2012, with some 310,000 cubic metres of material being dredged from the inner harbour and shipping channel.
This successful campaign focused on restoring the navigable depths as annotated on the formal AUS Charts in the berth pockets, swing basin and channel to Hunt Point.
All berths were restored to design depth, where draft restricted vessels could sit alongside over low water if required. PHPA Berth 4 (Utah Facility) benefited from an increase in depth from 14.2m to 14.5m, which significantly improves under keel clearance-related berth efficiency.
Hydrographic survey and tidal study
In November 2012, the PHPA conducted a hydrographic survey of the inner harbour and shipping channel to better optimise the existing depths within the channel. This survey was carried out in conjunction with a tidal behaviour study along the full length of the shipping channel.
The survey’s findings provide the PHPA with insights into the ‘real time’ effect of the tide along some of the channels critical sections. Implementation of survey data is scheduled for July 2013, following an extensive quality control and concept review process.
Tugs and towage services
In March 2013, the PHPA engaged a leading marine consultancy, Thompson Clarke Shipping, to conduct a wide-ranging review of the towage services and related requirements at the port of Port Hedland, based on forecast throughput over the next decade. Thompson Clarke have been asked to consider and report on, amongst other things, the likely optimum number of towage service providers required to meet future towage demands at the port.
Currently, BHP Billiton is the sole licensed provider of towage services at the port. Pending the potential future entry of additional licensed towage operators, in September 2012 the PHPA lodged a notification (N96171) with the Australian Competition and Consumer Commission (ACCC) under section 93(1) of the Competition and Consumer Act 2010 (Cth), in order to avoid any potential contravention of the provisions of the Act that prohibit exclusive dealing (and to gain protection from possible prosecution by the ACCC in relation to the notified conduct).
The PHPA is currently in discussions with BHP Billiton in relation to the proposed grant of a new non-exclusive, long-term licence to provide towage services at the port, using a new fleet of Rotor Tugs.

29Port Hedland Port Authority – Annual Report 2013
Coastal sculptures at Port Hedland

30
Landside The PHPA’s Landside Operations play a critical role in the port’s overall operations, ensuring an efficient and effective linkage between the marine and land-based transport and logistics networks.
There are fifteen berths currently operating within the inner harbour, four of which are owned and operated by the PHPA. Eight are owned and operated by BHP Billiton Iron Ore (four located at Nelson Point and four located at Finucane Island), and three are owned and operated by The Pilbara Infrastructure Group (a subsidiary of Fortescue Metals Group).
In July 2012, the PHPA’s Landside Operations completed the transition to a 24-hour coordination of all operations at the Utah Facility. PHPA personnel also commenced coverage of East Side night time operations.
The number of operational personnel on the East Side has increased throughout the year to meet the growth in general and project cargo imports associated with construction and expansion projects.
Qube Holdings Limited (Qube) continued to manage facility cleaning and road sweeping agreements on both sides of the port, as well as providing stevedoring services to the current Utah Point Stockyard 1 Facility and the soon-to-be-commissioned Stockyard 2 Facility.
30
Looking across East Side of harbour from Finucane Island

31Port Hedland Port Authority – Annual Report 2013
Utah Facility performance
A total of 12.4 million tonnes (mt) was exported through the Utah Facility during the 2012-13 financial year; an increase of 9% over last year’s record of 11.3mt.
The average Gross Loading Rate (GLR) achieved across all products increased to 2,800 tonnes per hour. The increased GLR is largely attributable to system upgrades and improved condition of all products currently being handled.
A monthly record tonnage of 1.33mt was also achieved in May 2013, with 14 vessels loading at the facility.
Increase in copper rates
Copper loading rates have increased by more than 5% as a result of successful conveyor modifications, with GLRs in excess of 550 tonnes per hour being achieved for the first time.
The commencement of copper exports from Sandfire Resources in February 2013 has resulted in copper exports increasing to a record 469,279 tonnes for the 2012-13 financial year. The copper is loaded using a ‘rotainer’ box loading system attached to ships cranes (unlike the conventional, conveyor system used for other copper exports) and has delivered improved environmental performance.
Imports of modular and project cargo contributed to the heavy usage of the public berths throughout the 2012-13 financial year. The figures on pages 32-33, show the movement of cargo across the PHPA’s public berths.

32
0
200,000
400,000
600,000
800,000
1,000,000
1,200,000
Jul 2012
Aug 2012
Sep 2
012
Oct 2
012
Nov 2
012
Dec 2
012
Jan 2
013
Feb 2
013
Mar
2013
Apr 2013
May
2013
Jun 2013
Commodity Group
Export over PHPA Berths
Ton
nes
Iron Ore Salt Manganese Ore
0
10,000
20,000
30,000
40,000
50,000
60,000
70,000
80,000
Jul 2012
Aug 2012
Sep 2
012
Oct 2
012
Nov 2
012
Dec 2
012
Jan 2
013
Feb 2
013
Mar
2013
Apr 2013
May
2013
Jun 2013
Chromite Ore
Containers
Copper Concentrates
General
Commodity Group
Export over PHPA Berths
Ton
nes

33Port Hedland Port Authority – Annual Report 2013
Vessel gangway
0
50,000
100,000
150,000
Jul 2012
Aug 2012
Sep 2
012
Oct 2
012
Nov 2
012
Dec 2
012
Jan 2
013
Feb 2
013
Mar
2013
Apr 2013
May
2013
Jun 2013
Chemical Compound
Containers
General
Hydro Carbon
Commodity Group
Import over PHPA Berths
Ton
nes

34
MaintenanceEffective, ongoing maintenance of the PHPA’s facilities and infrastructure is critical to ensuring the efficient and safe operation of the port. Demand on the port’s maintenance function has increased, commensurate with the increase in trade.
The PHPA’s Maintenance team’s capability continues to grow since returning maintenance responsibilities and functions to an in-house arrangement in February 2012.
Through the implementation of a range of system improvements and initiatives, the PHPA’s maintenance performance indicators for the 2012-13 financial year were achieved in terms of breakdown impacts, critical project delivery and the maintenance metrics described in the following pages.
East Side maintenance activities
Summary of maintenance activities covering PHPA Berths 1, 2 and 3 for 2012-13:
• Percentage of planned work completed = 91%
• Percentage of our total planned work = 59%
• Manpower utilisation* = 155%
The East Side maintenance team and contractors completed a total of 5,026 planned work orders, for a total of 30,915 man hours.
Work break-ins or emergency break downs accounted for an extra 391 work order jobs and 3,476 hours. As at 30 June 2013, the current backlog of work orders was 736 at an estimated 7,576 hours.
* supplemented with overtime and contract labour
Finucane Island Berths A and B with Utah Stockyard 1

35Port Hedland Port Authority – Annual Report 2013
Maintenance Annual Expenditure: East Side 2012-13
Maintenance Contract Services
Wharves and Service Jetties
Roads and Laydown Yards
Shiploader
Buildings and other Shore-based Infrastructure
Maintenance Contract Services
4%Wharves and Service Jetties
30%
Roads and Laydown Yards
7%Shiploader
12%
Buildings and other Shore-based Infrastructure
47%
East Side system improvements
The 2012-13 financial year has seen a number of changes to the PHPA’s approach to dust control and product spillage, resulting in significant improvements to East Side operations.
These improvements include:
• Installation of chute liners to the head chutes of the conveyors.
• Water misters fitted to all return belts, reducing product carry back.
• All covers lowered to reduce air flow through conveyors.
• Polycarbonate guards fitted to tail end of the belts to enclose the whole tail but still able to do a visual inspection.
• Installation of a new sampler to provide safer access and work area for sampling staff, including no walking through the conveyor area.
• Total overhaul and reconfiguration of CV05 feeders. This has also decreased the amount of vibration being injected into the PHPA 1 deck.
• New shiploader telescopic chute installation to prevent dust and spillage.

3636
Utah Facility maintenance activities
Summary of maintenance activities covering the Utah Facility for 2012-13:
• Percentage of planned work completed = 78%
• Percentage of our total planned work = 89.30%
• Manpower utilisation average = 80%
Electrical Distribution, Communications & Automation
5%Inload/Outload Material
29%
Wharf
11%Shiploader
8%
Utilities Maintenance (power, water, fire, dust suppression)
2%
Buildings and other Shore-based Infrastructure
45%
Maintenance Annual Expenditure: Utah Bulk Loading Facility 2012-13
Electrical Distribution, Communications & Automation
Inload/Outload Material
Wharf
Shiploader
Utilities Maintenance (power, water, fire, dust suppression)
Buildings and other Shore-based Infrastructure
Utah system improvements
The PHPA Maintenance team has implemented a number of improvements at the Utah Facility during 2012-13, resulting in a significant improvement to the facility’s overall operability.
These improvements include:
• Conveyor tracking – upgraded conveyor tracking system and rollers to reduce the amount of stoppages and isolations. Downtime for belt tracking and damage to belts was zero.
• Modifications to ship loader cable reeler control system have reduced impacts to a very low frequency. This has also reduced the possibility of high voltage cable damage.
• Modification of belt rip switches, which has improved isolation delays and downtime impacts.
Maintenance Annual Expenditure: Total 2012-13
Channel & Navigational Aids
Eastern Harbour
Utah Bulk Loading Facility
Channel & Navigational Aids*
3%Eastern Harbour
46%
Utah Bulk Loading Facility
51%
* Expenditure relates to replacement of navigational beacon tops

37Port Hedland Port Authority – Annual Report 2013
Vessel coming alongside at Utah Facility

Utah Facility Stockyard 1
38

Planning For Future Growth
39Port Hedland Port Authority – Annual Report 2013

40
Planning for future growthThe PHPA continues to take a long term strategic view and plans ahead of forecast demand in order to maintain service levels and effectively manage the port’s growth.
Against a backdrop of unprecedented growth, the PHPA has positioned itself to manage the rapid expansion, to provide an efficient, effective and responsive service to port users and develop opportunities for additional trade capacity.
The PHPA has implemented a number of strategies to facilitate the development of port infrastructure to support proponent developments, ensure opportunities for expanding the general cargo capacity of the port, and provide the facilities required to meet the increasing volume of both exports and imports.
PHPA Control Tower with salt stockpile in background

41Port Hedland Port Authority – Annual Report 2013
These strategies include:
• implementing the Port Development Plan of the harbour, capacity improvements and operational enhancements in a timely manner;
• ensuring the provision of safe, reliable, competitive and efficient port and marine services, whether they are provided by the PHPA or by others;
• forecasting projected resource production and export and import levels, by utilising a combination of internal forecasting, international forecasting services, industry project collaboration and stakeholder consultation; and
• a review of port facilities and the provision of capital works to ensure that key infrastructure assets owned by the PHPA are efficient, cost effective and contribute directly to the management of key risks in the interest of the port, all port users and the State.
The following key initiatives were undertaken in 2012-13 to align planning and development of the port with the current and future needs of its users and deliver optimum outcomes for the Pilbara and the State.
Lumsden Point development
General cargo handling across the PHPA’s three public berths has increased in line with the development of iron ore mining and related industries. It is anticipated that the existing berths will reach their maximum operating capacity within the next two years as a result of increased general cargo trade.
To cater for this long-term growth in general cargo trade, the PHPA commenced a market sounding exercise in late 2012 to explore opportunities to expand its general cargo
facilities at Lumsden Point. This work will inform the PHPA of market appetite for the facility and the proposed commercial framework for its development.
The general cargo wharf project progressed during the year, with the PHPA optimising the concept to allow larger vessels and channel access for the majority of the tidal window. Environmental approvals are progressing, with submission scheduled for early 2014.
Whole-of-Lumsden Master Plan
Following the Department of Commerce’s decision to progress with Lumsden Point as the location for the proposed Pilbara Marine Services Facility, now called ‘Pilbara Fabrication Services Common User Facility’ (PFSCUF), the PHPA has been working with the Department of Commerce to ensure both projects can be staged and developed alongside each other.
A Whole-of-Lumsden Master Plan was approved by both the PHPA and the PFSCUF steering committee during the financial year.
Utah Point expansion
Atlas Iron’s development of Stockyard 2 at the Utah Facility commenced during the year. This facility will increase the export throughput capacity at Utah Point to approximately 18mt.
The PHPA continues to work with Atlas Iron, planning upgrades within Stockyard 2, including the installation of a purpose-built reclaimer that will improve facility efficiency and capacity, as well as lower dust emissions related to ship loading activities.

42
South West Creek
The Pilbara Infrastructure Pty Ltd (a subsidiary of FMG) progressed with its expansion plans over the last 12 months, including construction work on berth AP4.
The PHPA also approved the development of a temporary wharf access track to Roy Hill Infrastructure’s wharf area. This will support the construction phase of Roy Hill Infrastructure’s port facilities at berths SP1 and SP2 in South West Creek.
Given the continued growth in hydrocarbon imports and projects in the area focused on trade of bulk liquids, the PHPA has commenced planning work to allow the development of a bulk liquids berth at AP6. This will have several benefits for both industry and the town of Port Hedland. Work will continue throughout 2013 to refine the plan for the area.
Multi-User Outer Harbour Facility
The PHPA has continued to progress planning for a Multi-User Outer Harbour (MUOH) Facility, to be located to the west of BHP Billiton Iron Ore’s proposed outer harbour development.
The master plan provides a strategic direction against which future developments can be assessed and considered by the PHPA in accordance with its long term development strategy.
The MUOH Facility provides for trade growth of bulk exports, while also accommodating cargo planned through the Boodarie strategic industrial estate.
Key stakeholders will be consulted over the coming year to gain feedback prior to the adoption of the facility into the PHPA’s Port Master Plan.
PHPA Boodarie Stockyards
The PHPA Boodarie Stockyards land (Stage 1 and Stage 2) will accommodate the needs of existing and future proponents exporting from the inner harbour and the planned MUOH Facility.
The PHPA Boodarie Stockyards is a strategic land area which will facilitate:
• development of proposed transport corridors, including roads, rail and railway loops to stockpiles;
• at least 200mtpa of trade for the planned PHPA MUOH Facility; and
• development of strategic infrastructure and transport corridors, to facilitate trade associated with the Boodarie Industrial Estate.
Stage 1 of the PHPA Boodarie Stockyards (297 hectares) has been cleared of native title and a Reserve has been created under the Land Administration Act 1997 (LAA) to bring the land under the management of the PHPA.
The Notice of Intention to Take over Stage 2 of the PHPA Boodarie Stockyards (2001.6 hectares) was approved by the Minister for Lands in 2012 to progress native title clearance and includes relevant approvals to bring the land under the management of the PHPA under the LAA and then vest the land in the PHPA under the Port Authorities Act 1999.

43Port Hedland Port Authority – Annual Report 2013
Other significant projects
The following major projects were successfully completed during the 2012-13 financial year:
• Various sections of Utah Road have had rock armour protection installed to the batter slopes to prevent erosion. The road has been raised in the vicinity of floodways to prevent damage by rain and flooding.
• Sandfire Resources has completed the development of hardstand areas for the storage of copper concentrate in rotainer boxes. An innovative pavement called ‘Rhigiphalte’, a coarse asphalt mix with grout, was applied to the development, resulting in a pavement which is stronger than asphalt and less expensive than placed concrete.
• As part of the planned expansion of the tug fleet, an additional four pens were constructed by BHPB within the existing tug haven. The new pens are large enough to accommodate the new rotor tugs. It was also necessary to dredge sections of the tug haven to accommodate the deeper draft of the new tugs.
• Replacement of damaged Beacons 24, 32 and 34 with a single driven pile type structure and refitting of new navigation lights and markers.
• Significant structural and environmental upgrades to the front edge of PHPA Berth 1, consisting of new concrete kerbing, cathodic protection, kerb raising/widening and improved quick release mooring hooks.
Unloading product at Utah Facility Stockyard 1

4444

45Port Hedland Port Authority – Annual Report 2013
Our People and Culture
45Port Hedland Port Authority – Annual Report 2013

46
Our people and culture The PHPA is committed to developing and implementing policies and practices to build a strong and positive workplace culture that supports the diversity of employees, potential employees and people generally.
With the continued expansion of the port, employee numbers continue to increase with a total of 154 positions approved for the 2012-13 financial year.
The PHPA has no Fly-In–Fly-Out positions, with all employees residing where they work.
To support this arrangement, the PHPA manages residential properties in Port Hedland, and provides housing for key contractors and transit.
Current and planned office space
The PHPA occupies office space in West Perth and has its main premises in Port Hedland, including new transportables and refits to accommodate continuing growth in employee numbers.
The PHPA is currently planning the development of a new office building at the port’s East Side, with the Vessel Traffic Service Operators from the Control Tower to be relocated to the new premises. Planning has also commenced for the construction of new staff amenities at Utah, and is scheduled to be completed during 2013-14.
Fairness, equity and diversity
The PHPA continues to ensure that it is a workplace that fosters fairness, equity and diversity by providing equal employment and advancement opportunities based on merit.
Merit is measured on the basis of qualifications, experience, potential suitability and job performance, regardless of sex, age, race, pregnancy, marital status, sexual orientation, family responsibility or family status, religious conviction, political conviction or impairment.
PHPA staff member in mangrove nursery

47Port Hedland Port Authority – Annual Report 2013
In 2012, the PHPA introduced a People and Culture policy to underpin this commitment. The policy is supported by documented selection processes, the PHPA’s Code of Ethics and Conduct, training programs, and Equal Opportunity and Diversity Management planning.
Respect-based training
‘Working with Respect’ training has been developed internally and delivered across the organisation in support of the PHPA’s commitment to fairness, equity and diversity.
This training covers the PHPA’s values and Code of Ethics and Conduct, and explicitly outlines behaviours that are not acceptable. It also incorporates the Public Sector Commission requirements on Accountable and Ethical Decision Making.
The PHPA continues to expand its commitment in this area and has recently commenced the rollout of ‘Leading with Respect’ for senior staff and employees interested in developing their leadership skills.
Key agreements
The PHPA’s Equal Opportunity & Diversity Management Plan was reviewed during the financial year by the Public Sector Commission.
Current efforts are focused on the renegotiation of the Port Collaboration and Heritage Agreement with Marapikurrinya to ensure that the PHPA is providing strong support for people employed under the Heritage Agreement.
The Enterprise Agreement for Port Hedland based staff was also negotiated and agreed this financial year. The new agreement provides industrial relations certainty over its four year term, and has simplified a number of employment conditions and brought benefits for employees in the areas of overtime, superannuation, shift rostering, and leave.
Improvements in 2012-13
In keeping with its commitment to improvement, the PHPA has:
• planned and implemented a new payroll system;
• reviewed and implemented the Human Resources Management System across all procedures, forms and templates;
• developed and implemented cross-organisation performance measurement and management;
• refined its workforce planning process, including a review by the Public Sector Commission;
• updated the PHPA uniform to reflect the professionalism of the new logo and corporate style;
• implemented an online helpdesk for all housing and office space maintenance; and
• developed a well-being strategy and value proposition, including health fund discounts, ‘stop smoking’ initiatives, in-work massage and provision of fruit and coffee machines.

48
Recruitment
Recruitment and selection is undertaken in accordance with criteria in the PHPA’s formal recruitment procedure. A comprehensive review was undertaken this year to ensure the procedure supports the PHPA’s objective of attracting and retaining high quality staff.
Permanent and long term contract employees are required to be selected on merit from a pool of applicants in open competition, i.e. selection of the best available person for the job, on the basis of job-related criteria.
The PHPA ensures that selection processes are free from bias, unlawful discrimination, patronage and nepotism. To this end, the recruitment procedure is also publicly available via the PHPA’s website.
Whilst upholding the standards of selection on merit, the procedure creates flexibility in advertising options, with a focus on internet and use of other appropriate media. The procedure also enables panels to look at options that evaluate merit outside traditional interviews.
During 2012-13, the PHPA has had one complaint regarding recruitment and no cases of unfair dismissal. The complaint was reviewed and addressed in line with our complaint procedure.
Code of Ethics and Conduct
The Code of Ethics and Conduct is designed to communicate the PHPA’s standards of conduct and integrity and to promote professionalism in the provision of services to our customers, port users and the general community.
The PHPA’s Code of Ethics and Conduct is available via the PHPA intranet and is publicly available via the PHPA’s website. The PHPA ‘Working with Respect’ program explores the practical application of the Code of Ethics and Conduct with all employees.
There were no breaches of the Code of Ethics and Conduct, or the associated Public Sector Code of Ethics, this financial year.
Training
The PHPA has continued to demonstrate commitment to training in job competency requirements, as well as broader professional development throughout the 2012-13 financial year. This has included the employment of a Training & Development Coordinator and a Health, Safety & Environment Trainer and Assessor.
The increased resources has enabled a comprehensive review of the PHPA’s procedures, as well as the development of a training calendar and management of all mandatory and desirable training for all staff positions.
Additional to the implementation of the ‘Working with Respect’ training, the PHPA has significantly improved its Induction Training through the development of a single module that is delivered monthly to new employees.
The PHPA provides competency training that includes:
• Appointed Persons Training (Mines Safety and Inspection Act);
• Working at Heights;
• Vessel Traffic Services Training;
• Global Maritime Distress Safety System;
• Senior First Aid;
• Marine Oil Spill Response; and
• High Voltage Switching.
The PHPA also provides a diverse range of other opportunities, including training in the areas of media, shipping, ports & marine fundamentals, wildlife rehabilitation and safety law.

49Port Hedland Port Authority – Annual Report 2013
Compliance Program – Competition Law Training
The PHPA treats legal and regulatory compliance seriously. To that end, the PHPA implemented an online training module to reinforce compliance with the PHPA’s statutory obligations (including under the Competition and Consumer Act 2010 (Cth)), as well as the requirements set out in the PHPA’s Code of Ethics and Conduct and organisational values.
The first Salt® Compliance module to be rolled out by the PHPA addressed the topic of competition law compliance, and is intended
to assist PHPA personnel in identifying and avoiding the risks of legal non-compliant and anti-competitive conduct. All nominated personnel completed the training (approximately 50 employees, including the Executive Team and managers).
During 2013-14, the PHPA will progressively roll out additional Salt® modules (including, a module on health and safety), with a refresher of the Salt® competition law training scheduled for 2014.
Tugs at Port Hedland tug pen

5050
Vessel moored at PHPA Berth 1

51Port Hedland Port Authority – Annual Report 2013
License to Operate
51Port Hedland Port Authority – Annual Report 2013

52
License to OperateThe PHPA’s social licence to operate incorporates policies and procedures, environmental and safety management systems, governance, stakeholder engagement, and corporate social responsibility.
The PHPA has maintained its social licence to operate through the following initiatives.
Environment and Heritage
The port of Port Hedland is situated in a unique estuarine environment, characterised by a number of environmental and heritage attributes of regional and state significance.
The PHPA is committed to responsible environmental stewardship of port-controlled land and waters.
The environmental management of the PHPA’s operations and ongoing development is a function of the Port Authorities Act 1999, described as being: ‘to protect the environment of the port and minimise the impact of port activities on that environment’.
Section 51 (1) (b) of the Port Authorities Act 1999 requires the PHPA to have an environmental management plan for the port. The PHPA has a current plan and is constantly working to improve its performance in this area.
Environmental Management System (certified to ISO 14001)
The PHPA maintains its environmental management system, certified to the International Standard ISO 14001 by external auditors.
The PHPA holds the Environmental Licence for the public access berths PHPA Berth 1, PHPA Berth 2, PHPA Berth 3, and PHPA Berth 4 (Utah Facility). The PHPA’s operational activities underwent an annual risk review in 2012-13 and the environmental risk register was updated accordingly.
Air quality management
The PHPA continues to monitor dust at the boundary of its two operational sites at PHPA Berths 1 and 4. Alarms from these monitoring stations are used in conjunction with weather forecasts to predict and proactively respond to excessive levels of dust being generated.
In December 2012, the boundary dust monitoring network was substantially upgraded in line with changes to PHPA’s environmental licence conditions. Additional dust management tools, including a customised desktop dust forecasting and management model, used by daily operators, has further assisted the PHPA to reduce reportable dust events to less than half of that reported the previous year.
The PHPA continued in its role as a major stakeholder in the Port Hedland Industries Council (PHIC), which convened several sub-committees focusing on areas of common interest to industry. The PHIC continued to monitor ambient air quality in the Port Hedland region with results published in real time via the PHIC website.
Utah Facility
Over the past year, the PHPA has made improvements to reduce the environmental impacts of dust and waste generated during the export of product through the Utah Facility, and to satisfy the conditions of its environmental licence. These improvements focused on the areas of waste ore storage, drainage and stormwater management.

53Port Hedland Port Authority – Annual Report 2013
PHPA Berth 1 improvements
The 2012-13 financial year also saw the PHPA commence the export of copper concentrate via closed containers transferred directly into vessel holds, a method that reduces dust emissions. The PHPA also made improvements to reduce the environmental impacts of dust and waste, including modifying the conveyor systems on PHPA 1 and bundling the wharf deck.
Long Term Sea Dumping Permit
In May 2013, the PHPA’s application for a Long Term Sea Dumping Permit was approved by the Department of Sustainability, Environment, Water, Populations and Communities.
Under the permit conditions, the PHPA must implement a Long Term Dredge Material Management Plan during dredging operations. The plan defines the monitoring and reporting requirements for maintenance dredging and is now publicly available on the PHPA website.
Small vessel cyclone mooring protection
Dredging activities were undertaken by a third party proponent during the 2012-13 financial year for the construction of a small vessel cyclone mooring protection facility at the entrances to both Stingray and South East Creeks.
Under the conditions of its Sea Dumping Permit for the project, and in accordance with its approved Dredging and Spoil Disposal Management Plan, the PHPA undertook environmental monitoring during dredging and disposal activities.
Port Hedland mangroves at sunset

54
Mangrove pneumatophores (aerial roots)

55Port Hedland Port Authority – Annual Report 2013
Mangrove research
As part of a commitment to offset habitat destruction, the PHPA continued its mangrove propagation trials in two purpose-built nurseries. Intensive seed collection occurred throughout summer 2012-13, resulting in the nurseries now housing over 15,000 seedlings, representing each of the seven species of mangroves found in Port Hedland.
The PHPA also commenced its pilot field mangrove rehabilitation trial at Redbank, constructing a trial site and marking out eight experimental blocks. Different species of mangrove seedlings were planted into block designs at different tidal elevation levels.
Planting was undertaken by Marapikurrinya Contracting Pty Ltd and PHPA staff. Growth rates and other key success criteria will be monitored by the PHPA over the long term to inform future mangrove rehabilitation works at Port Hedland.
Sustainability Plan
Through its Environmental Management System, the PHPA implements a number of important sustainability programs within the port, including measures to minimise water usage and dust emissions, improve energy efficiency, offset greenhouse gas emissions and rehabilitate mangrove habitats.
In 2013, the PHPA developed a Sustainability Plan to ensure a comprehensive and integrated approach to measuring and monitoring the sustainability programs already in place. The plan also sets sustainability objectives and targets so that through informed decision making, the PHPA can ensure its future growth is sustainably managed, and positive social, environmental and economic outcomes can be achieved.
Carbon Neutral Program
Carbon dioxide emissions were calculated from the PHPA’s vehicles and other plant used throughout the port, including front-end loaders and small vessels during this reporting period. A corresponding number of trees were planted via a third party to offset these emissions. Emissions attributed to the PHPA’s air travel were also offset through the program.
Feral animal control
Quarterly trapping continued over the past year to reduce feral animal populations on PHPA land. Efforts were focused on the turtle beaches at Downes Island and Paradise Beach. Foxes and feral cats were the main target species.
Water Efficiency Management Plan
The PHPA has reduced its water usage per tonne exported by more than 50% as part of its participation in the Water Corporation’s Industry Water Efficiency Program. This was achieved by reusing a substantial amount of water captured onsite during heavy summer rainfall.
The PHPA’s commitment to the sustainable use of water earned it a Water Corporation Gold award for the second year in a row.
Introduced Marine Pests Management
In collaboration with the Department of Fisheries and other major Western Australian ports, the PHPA continued to monitor for invasive marine species in the harbour. No invasive marine species were detected this financial year.
Aboriginal heritage
The PHPA continues its strong relationship with local traditional owners through the Port Collaboration and Heritage Agreement. The PHPA contributed to the local Aboriginal community through business development opportunities for the traditional owners and through sponsorship and participation in the Many Rivers micro financing project.

56
Health and Safety
The PHPA is committed to preventing injury and disease in the workplace.
A primary focus at all levels of the PHPA business is the provision of safe and healthy work environments for all persons within port controlled areas, and minimising the impact of operations on the general community.
In addition to maintaining data relating to employee Occupational Safety and Health (OSH) performance, the Executive and Board also regularly review performance data for all contractors and port users as part of their commitment to the effective management of OSH for all stakeholders.
Reviews in 2012-13
During the past year, the PHPA has undertaken a comprehensive review and made changes to its hazard identification and management processes, including a new Take 5 and Job Hazard Analysis template. This process clearly delineates the appropriate use of each form, as well as the development of Detailed Work Instructions and the reporting of general hazards.
The PHPA has also aligned its operational risk assessments to the enterprise risk matrix to assist with consistent risk management reporting.
Legislative requirements underpin the minimum standard for implementation of all OSH policies and procedures. The PHPA provides appropriate guidance and resources to ensure that each Manager recognises their responsibility and accountability for overseeing OSH within their department.
Statement of Commitment to Occupational Safety, Health and Injury Management
The PHPA is committed to integrating safety into all facets of its operation and providing a safe and healthy work environment for its employees, contractors and visitors.
The PHPA has clear safety targets, with the ultimate aim of no injuries, no harm and no damage.
The Directors and Executive Team have continued to take a strong leadership role in ensuring that achieving a safe workplace remains a top priority and that incident reports are on the agenda for every Board meeting.
The PHPA Executive continues to actively support and promote the importance of reviewing the performance of all stakeholders and commits to fostering strong engagement and consultation processes with all port users to improve inclusive health and safety performance.
Staff consultation on Occupational Safety and Health matters
The PHPA has clearly defined accountabilities for ensuring that effective OSH communication and consultation occurs in the workplace. The PHPA’s aim is to ensure employees are well-informed about workplace matters affecting their health and safety and the environments they work and live in.
Communication of OSH matters begins from the outset of employment with the PHPA through employee participation in an induction process covering OSH and Injury Management policies.
In addition to the safety induction, OSH matters are communicated through regular PHPA Health and Safety Committee meetings, as well as the formal monthly Port Users Health Safety and Environment (HSE) meetings that facilitate the engagement of employees, senior management, contractors and port users.
The PHPA also actively supports shared risk assessments and inspection processes, in conjunction with OSH notice boards, HSE Bulletins and toolbox sessions, to provide opportunities for the sharing of hazards and risks and an open forum for discussing recommendations, standards and experience.

57Port Hedland Port Authority – Annual Report 2013
Injury Management
The PHPA is committed to meeting its obligations under the Worker’s Compensation and Injury Management Act 1981, and is cognisant of its legal obligations to provide workers with compensation in the event of an injury.
There was only one incident requiring Workers Compensation during 2012-13.
Should an employee be injured at work, the PHPA ensures that appropriate treatment is applied and, based on medical advice, an Injury Management Program is developed and commenced as soon as practicable for the injured employee.
Where this expectation is unrealistic or unrealised, then retraining, redeployment or termination will be considered.
The PHPA seeks to provide suitable or alternate duties/employment as an integral part of the Injury Management Program and consults with an injured employee, their treating doctor and, where requested, industrial union representation, to ensure that the program is maintained effectively.
The PHPA OSH Management System attained accreditation in 2011 to the AS/NZS 4801 (Australian Standard and New Zealand Standard for Occupational Health and Safety Management Systems). The PHPA conducts a regular assessment of its ongoing compliance with this accreditation, with the most recent assessment carried out during the 2012-13 financial year.
Annual safety performance: PHPA employees only
Measure
Actual Results Results against Target
2012-13(1) 2010-11(1) TargetComment on result
Number of fatalities 0 0 0 Target met
Lost time injury and/or disease incidence rate No. of LTI/D / full time equivalent
employees x 100
0 0 0 or 10% reduction(2)
Target of 0 met Reduction of 30%
of 3 year trend
Lost time injury and/or disease severity rate No. of Severe Injuries (>60 days lost)/
No. of LTI/D x 100
N/A N/A 0 or 10% reduction(2)
Target met
Percentage of injured workers returned to work:
(i) within 13 weeks N/A N/A N/A
Target met(ii) within 26 weeks N/A N/A Greater than or equal to 80%
Percentage of managers trained in occupational safety, health and injury management responsibilities
100% 100% Greater than or equal to 80%
Target met
Note (1) Results from current reporting year are compared to results from three years prior. (i.e current year is 2012-13; previous year is 2010-11).
Note (2) The reduction may be calculated over a three year period.

58
Corporate Governance, Risk Management and Compliance
Corporate governance is the framework of rules, relationships, systems and processes within, and by which, the PHPA exercises and controls its authority.
The PHPA manages this framework through sound planning and decision-making, and the appropriate management of risk and accountability. This ensures that the PHPA’s corporate governance, risk and compliance obligations are effectively identified and discharged.
Risk management
The PHPA recognises that risk management is an integral part of good management practice. It has committed to managing risk in accordance with the Australian/New Zealand Risk Management Standard IS0 31000:2009.
The PHPA’s Enterprise Risk Management system assists in the identification, prioritisation, and management of risk in a coordinated manner and equips staff to make informed decisions based on risk assessments.
A risk aware organisational culture is fostered at the PHPA, with risks identified, evaluated and managed by responsible officers in all aspects of the business.
This ongoing assessment process accounts for the likelihood of the risk occurring, its potential impact and the implications for the PHPA’s business and operations.
The PHPA’s Enterprise Risk Management Framework is currently being reviewed to ensure that operational and strategic risks can be consistently identified, monitored and reported to the Executive, the Risk Assurance and Audit Committee, and the Board.
A review of the Enterprise Risk Management implementation project was commenced in June 2013 to validate the direction, effectiveness and appropriateness of the PHPA’s risk management methodology.
Compliance
A comprehensive compliance management framework guides the PHPA in achieving its goals and objectives more efficiently.
The framework is compliant with Australian Standard AS 3806-2006 and assists the PHPA in conducting its business activities lawfully, whilst maintaining the highest standards of compliance with applicable laws, regulations and policies.
It also enables the PHPA to promptly detect and correct any non-compliance and provides a uniform approach to the management of compliance obligations throughout the organisation.
Business continuity
The PHPA’s Business Continuity Management (BCM) Program is designed to ensure that critical functions can be maintained or restored in a timely fashion in the event of a material business disruption. The purpose of the program is to minimise the financial, legal, reputational and other consequences arising from the disruption.
A number of the risks faced by the PHPA will have a direct impact on its ability to ensure continuity of business operations. As a consequence, BCM forms a subset of the overall Enterprise Risk Management Program within the PHPA.
A comprehensive review of the PHPA’s Business Continuity Management framework was commenced in late 2012, with a program to refresh and restructure the PHPA’s business continuity plans, and to ensure staff are trained in the deployment of the plans should an interruption to port operations occur.

59Port Hedland Port Authority – Annual Report 2013
Internal Audit
Internal Audit is an important element of the overall process by which the Executive and the Board obtain the assurance it requires that risks are being properly identified, managed and controlled.
Risk-based internal audit plans, prepared on an annual basis, are approved by the Risk Assurance and Audit Committee.
Internal Audit completed a program of work during the 2012-13 financial year, focusing on:
• Project Due Diligence;
• Ethics;
• Purchasing and Order to Cash; and
• Property Management.
Findings and agreed management actions were reported to the PHPA Executive Committee and to the Risk Assurance and Audit Committee.
In 2012-13 the PHPA’s internal audit function was supplemented by services provided by Ernst & Young, an outsourced service provider.
Insurance
The PHPA limits potentially adverse financial impacts associated with risk exposures by purchasing appropriate insurance cover from RiskCover.
RiskCover, the operating arm of the Insurance Commission of Western Australia, provides the PHPA with policies that cover its statutory insurance obligations, as well as policies necessary to carry out business in a prudent manner.
The PHPA also requires that parties who enter into contractual arrangements with the PHPA effect and maintain appropriate levels of insurance with respect to the work to be undertaken.
Integrated Management System
The PHPA successfully maintains its triple certification to the international standards for its Safety, Environmental and Quality Management systems.
The Integrated Management System has been set up to support the continued growth of the PHPA and there is a hands-on approach to the system from all senior managers.
A surveillance audit was carried out by International Certifications Ltd in August 2012, resulting in the PHPA retaining its existing certification with no major non-conformances identified.
In June 2013, the PHPA also achieved certification in the global benchmark of ISO/IEC 27001:2005 Information Security Management System. This certification is a highly regarded information technology standard and was achieved with a superior standard of compliance.
Vessel being escorted by tugs into Port Hedland harbour

60
Stakeholder Engagement
The PHPA is committed to a proactive, open and transparent process of engagement with internal and external stakeholders.
The PHPA recognises that consultation is a two-way process and regards effective stakeholder engagement and communications as key to building the support, confidence and trust necessary for the port to optimise its operations.
During the 2012-13 financial year the PHPA deployed a number of successful initiatives
as part of its commitment to establishing and strengthening active partnerships with port users and the local community.
The 2012-13 financial year, also saw the PHPA commence the development of a framework for the new Port Improvement Rate. The PHPA undertook an extensive engagement program with key government and port stakeholders as part of the development and implementation process.
The PHPA also continued its ‘Community Support Initiative’ funding program and was involved in a number of local community
PHPA staff in attendance at the Welcome to Hedland Night

61Port Hedland Port Authority – Annual Report 2013
events, such as the NAIDOC Open Day and the Welcome to Hedland Night. The PHPA also commenced the roll-out of a community education campaign that focused on safety awareness for recreational vessel skippers.
The reporting period saw the PHPA continue to engage closely with port users through a range of initiatives, including the 2012 Customer Satisfaction Survey and the quarterly Port Consultative Group meetings.
The last twelve months have seen a significant increase in both the level of media interest in the PHPA’s activities, and the requirement for government and community engagement. The PHPA has continued to enhance its communications capability, with the Corporate Communications team facilitating over 950 direct engagements with external stakeholders during the 2012-13 financial year.
The following chart provides a breakdown of the PHPA’s Corporate Communications team’s direct engagements with key external stakeholder groups for 2012-13:
Number of stakeholder engagements for 2012-13
Media
Government
Community
Investment Banks & Financial Analysts
44.1%
45.7%
4.7%5.5%

62
Road trains at Utah Facility, Stockyard 1

63Port Hedland Port Authority – Annual Report 2013
Corporate Governance

64
Corporate GovernanceThe following is a report on the PHPA’s performance with respect to its legislative obligations during the 2012-13 financial year.
Ministerial Directives
The Minister may give directions in writing to the Board of Directors with respect to the performance of the functions prescribed by legislation. There were no Ministerial Directives issued during the year.
Code of Ethics and Conduct
In accordance with Section 23 of the Port Authorities Act 1999, the PHPA has reported to the Minister and the Public Sector Standards Commission on its compliance with the Code of Ethics and Conduct.
There were no detected breaches of the Code of Ethics and Conduct during 2012-13.
Recordkeeping
The PHPA continues its commitment to achieving best practice in recordkeeping. Records are managed according to requirements under the State Records Act 2000 and Quality Management System ISO 9001.
All PHPA employees recognise they have a responsibility under the Act and new employees are provided with information on recordkeeping as part of their induction and through mandatory Records Awareness training.
Approval was given to a Sector Disposal Authority for Port Authorities by the State Records Commission in August 2012, and this is now reflected in the PHPA’s functional retention plans.
The PHPA will consider its Electronic Document and Records Management System strategy in 2013-14. This follows a review of the PHPA’s recordkeeping system and practices, and will focus on ensuring their continued efficiency and effectiveness.
Freedom of Information
Under the provisions of the Freedom of Information Act 1992, the PHPA is required to provide the Office of the Information Commissioner with a Freedom of Information Statement every 12 months.
The PHPA received two new applications and no partial transfers under the Act during the 2012-13 financial year. Both applications were managed in accordance with the requirements of the legislation.
Public Interest Disclosure
The Public Interest Disclosure Act 2003 enables individuals to make disclosures about wrongdoing within the State public sector, local government and public universities, without fear of reprisal.
The PHPA has a nominated Public Interest Disclosure Officer, as required by the legislation.
The PHPA also maintains a Public Interest Disclosure Policy relating to fraud management, including reporting and investigation arrangements and whistleblowing procedures.
The PHPA did not receive any Public Interest Disclosure applications during 2012-13.

65Port Hedland Port Authority – Annual Report 2013
Advertising, Market Research and Sponsorship
In accordance with Section 175Ze of the Electoral Act 1907, the PHPA incurred the following expenditure in market research, sponsorship and media advertising:
Measure Actual Results Results Against Target
Sponsorship • Many Rivers
• Constable Care Child Safety Foundation
• Pilbara Music Festival
• Port Hedland Art Awards
• Hedland Tri Sports
• Town of Port Hedland – Christmas Lights Competition
• Town of Port Hedland – Australia Day Fireworks
• Care for Hedland
• Hedland Water Polo Association
• St John Ambulance South Hedland
• Mother’s Day Classic
• Volunteer Marine Rescue Service
• PHPA Touch Football Team
• Port Hedland Fishing Club
• Australia’s Biggest Morning Tea
Total Sponsorship – $74,000
Media Advertising • Informa Australia (Lloyds List DCN)
• Australian Bulk Handling Review
• Adcorp Australia
• Market Creations
• North West Telegraph
• Redwave Media
Total Media Advertising – $60,000
Market Research Campaign Capital – 2012 Customer Satisfaction Survey
Total Market Research – $25,000
TOTAL EXPENDITURE $159,000

66
Finucane Island Berths C and D, PHPA Public Berths 1 and 2 (rear)

Directors’ Report
67Port Hedland Port Authority – Annual Report 2013

68
Directors’ ReportIn accordance with Schedule 5, Division 9, the Directors of the PHPA present their report for the 12 months ended 30 June 2013.
Directors
The following persons were directors of the PHPA Board at the date of this report:
Mr Ken Pettit (Chairman) Director and Chairman since July 2011
Mr Les Longden Director since 1 October 2009
Mr Julian Tapp Director since 30 June 2009
Ms Elisa Fear Director since 15 June 2010
Mr Matthew Dowd Alternate (BHPBIO) Director since 25 July 2012
Director’s biographies are shown on pages 16-17.
Net profit after tax
The PHPA finished the financial year, after complying with the ‘National Tax Equivalent Regime’, with a profit of $45.8m, compared to last year’s $32.3m. See the accompanying Financial Statements for further details.
Review of operations
The PHPA manages a bulk export port and ensures that port services and facilities meet the needs of customers.
Summary of the results during the year:
2013$’000
2012$’000
Profit before income taxIncome tax expense
64,167 (18,356)
46,184 (13,870)
Profit for the period Retained earnings at 1 July
45,811131,072
32,314100,784
Dividends paid in the financial year
(21,004) (2,026)
Retained earnings at 30 June
155,879 131,072
Utah Facility stockpiles at night

69Port Hedland Port Authority – Annual Report 2013
Key Performance Indicators
Financial
In addition to the key performance indicators provided, the following financial performance indicators, which are not subject to audit, are provided to assist users to assess the financial management performance of the Port Hedland Port Authority (PHPA). The indicators selected are considered appropriate for use in either evaluating the performance of a Government Trading Enterprise or an entity in the private sector.
Current ratio
The current ratio is a liquidity ratio that measures the PHPA’s ability to pay its short term obligations.
The current ratio is calculated by dividing the PHPA’s current assets at the reporting date by the PHPA’s current liabilities at the reporting date.
Interest cover ratio
A ratio used to determine the ability of the PHPA to pay interest on its outstanding debt.
The interest cover ratio is calculated by dividing the PHPA’s earnings before interest and taxes (EBIT) for the reporting period by the PHPA’s interest expenses for the same period.
0.00
1.00
2.00
3.00
1.06
2.29
1.81
2.00
2008-09 2009-10 2010-11 2011-12 2012-13
1.46
Current ratioComparison 2008-09 to 2012-13
Rat
io
0.00
1.00
2.00
3.00
4.00
5.00
6.00
7.00
8.00
3.99
4.64
1.42
7.16
0.37
Interest cover ratioComparison 2008-09 to 2012-13
2008-09 2009-10 2010-11 2011-12 2012-13
Rat
io

70
Debt to equity ratio
The debt to equity ratio is a measure of the PHPA’s financial leverage. It indicates what proportion of equity and debt the PHPA is using to finance its assets.
The debt to equity ratio is calculated by dividing the PHPA’s total liabilities by the PHPA’s total equity.
Return on equity
The return on equity ratio measures the PHPA’s profitability by revealing how much profit a company generates on it’s total equity.
The return on equity ratio is calculated by dividing the PHPA’s profit before tax by the PHPA’s total equity.
0.00
1.00
2.00
3.00
0.78
2.45
2.05
1.71
2.40
Debt to equity ratioComparison 2008-09 to 2012-13
2008-09 2009-10 2010-11 2011-12 2012-13
Rat
io
-5%
0%
5%
10%
15%
20%
25%
30%
35%
6.6%
3.7%
27.1%
32.9%
-2.1%
2008-09 2009-10 2010-11 2011-12 2012-13
Per
cen
tag
e
Return on equityComparison 2008-09 to 2012-13
Tugs escorting vessel out of Port Hedland harbour

71Port Hedland Port Authority – Annual Report 2013
Return on assets
The return on assets ratio is an indicator of how profitable the PHPA is relative to the value of its total assets. It gives an idea as to how efficient management is at using its assets to generate earnings.
The return on assets ratio is calculated by dividing the PHPA’s earnings before interest and taxes (EBIT) by the PHPA’s average total assets.
Economic rate of return
In accordance with Government policy effective July 2000, the PHPA is required to report a rate of return on non-current assets valued at Deprival Value.
The economic rate of return is calculated as per below:
0%
2%
4%
6%
8%
10%
12%
14%
16%
6.8%
12.0%
0.5%
3.9%
14.2%
2008-09 2009-10 2010-11 2011-12 2012-13
Per
cen
tag
e
Return on assets Comparison 2008-09 to 2012-13
0%
2%
4%
6%
8%
10%
12%
14%
16%
7.2%
4.1%
3.0%
13.1%
14.7%
Economic rate of return Comparison 2008-09 to 2012-13
2008-09 2009-10 2010-11 2011-12 2012-13
Per
cen
tag
e
EBIT + historical depreciation - deprival depreciation
Current assets + deprival value net non-current assets

72
Economic and Operational
The table below shows commodity throughput for the past five years. Export of iron ore continues to be the dominant trade by volume.
PHPA Comparative Trade Statistics – Year Ended 30 June 2013
2013 2012 2011 2010 2009
TOTAL CARGO (tonnes) 288,443,039 246,672,060 199,002,079 178,625,449 159,390,660
IMPORTS
Sulphuric Acid - 10,003 6,011 - 73,577
Bitumen - - - - 3,185
Caustic Soda - - 4,166 - 7,433
Ammonium Nitrate 68,824 16,100 - - -
Cement 175,102 186,870 98,573 163,604 82,803
Fuel Oils 1,413,010 1,216,044 988,990 822,794 713,226
General & Containerised Cargo 281,412 227,186 172,285 167,796 128,642
1,938,347 1,656,203 1,270,025 1,154,194 1,008,866
EXPORTS
Iron Ore 280,172,978 238,932,735 192,548,683 173,957,507 153,895,882
Hot Briquetted Iron Fines - - - 44,576 324,389
Manganese 1,691,889 1,958,419 1,881,708 1,645,950 920,216
Chromite 479,265 411,647 173,236 143,421 180,128
Copper 480,607 433,904 461,383 479,545 423,050
Salt 3,589,900 3,197,203 2,623,412 1,165,401 2,609,954
Scrap 64,037 70,245 39,002 25,150 20,008
Livestock 1,590 - - 7,817 5,825
General & Containerised Cargo 24,426 11,703 4,630 1,888 2,342
286,504,692 245,015,856 197,732,054 177,471,255 158,381,794
SHIPPING
Gross Registered Tonnage 167,698,027 145,056,987 112,081,735 100,040,087 74,012,123
Deadweight Tonnage 320,036,184 277,313,992 216,454,152 193,442,785 142,870,875
No. of Vessels 2,028 1,843 1,474 1,303 1,027

73Port Hedland Port Authority – Annual Report 2013
The graph below shows a significant increase in the total port throughput over the last five years.
The graph below indicates a significant increase in the number of vessels visiting the port over the last five years.
0
50
100
150
200
250
300
2009
Ton
nes
(‘0
00
,00
0)
2010 2011 2012 2013
Port throughput per fiscal year
159179
199
247
288
0
500
1000
1500
2000
2009 2010 2011 2012 2013
Total number of vessels
1,2211,309
1,485
1,845
2,031
Nu
mb
er o
f ve
ssel
s
The graph below illustrates a significant increase in the number of piloted vessel movements commensurate with the increase in the number of vessels visiting the port.
The graph below illustrates a change in the profile of vessels visiting the port over the last five years, with a clear shift to larger vessels being used by port users.
0
20
40
60
80
100
2009
Ton
nes
(‘0
00
)
7376 76 76 80
2010 2011 2012 2013
Avg(GRT
Average Gross Register Tonnage
0
1000
2000
3000
4000
2009 2010 2011 2012 2013
Total piloted movements
Nu
mb
er o
f p
ilote
d m
ovem
ents
2,491
2,6583,035
3,7844,140

74
Taiwan
77.67%
0.019%
8.427%9.605%
2.475%
0.077%
0.234%
Republic of Korea
Japan
1.194%
Port Hedland
Australia
Pakistan
China
Singapore
Phillipines
Iron ore distribution by destination 2012-13
75Port Hedland Port Authority – Annual Report 2013
Capital expenditure guidelines
The PHPA has clearly defined guidelines for operating and capital expenditure. These guidelines include requirements for monthly reports against budget for the major business units, as well as Board approved levels of delegated financial authority.
The CEO is required to obtain the approval of the Board for major capital works expenditure that exceeds $2 million. The Board also regularly reviews capital expenditure and cash flows.
Significant changes to the PHPA’s state of affairs
There was no significant change in the nature of the PHPA’s activities this year.
Events subsequent to reporting date
Since the end of the financial year on 30 June 2013 and the date of this report, the Directors are not aware of any matter or circumstance not otherwise dealt with in this report or financial statements that have significantly affected, or may significantly affect the PHPA’s operations, or state of affairs in subsequent financial periods.
Likely developments and future results
The PHPA expects that trade volumes for the 2013-14 financial year will continue to increase, due mainly to the expected increase in iron ore exports. As a consequence, revenue is expected to rise proportionately over this financial year.
The 2013-14 financial year will see completion of the development of the Port Improvement Rate framework, with implementation of the new rate scheduled for September 2013.
Further likely developments at the port are covered on pages 40-43 of this report.
Directors’ interests in contracts
During the financial year, the PHPA did not enter into any contracts with entities in which Directors declared an interest.
• Mr. J Tapp is a Director of the PHPA Board and a previous employee of Fortescue Metals Group Pty Ltd (FMG).
• Mr. P Wilshaw resigned as a Director of the PHPA Board on 31 March 2013 and was an employee of BHP Billiton Iron Ore Pty Ltd (BHPB).
• Mr. M Dowd is the Alternate Director to Mr Peter Wilshaw and is an employee of BHP Billiton Iron Ore Ltd.
• Both BHPB and FMG use port facilities for the export of iron ore commodities and the terms of trade offered to these customers are equivalent to those offered to all other port users.
• BHPB and FMG are leaseholders of the PHPA, and the lease agreements are based on normal commercial terms and conditions.

76
Vessel coming alongside Cavotec Mooring System at Utah Facility

77Port Hedland Port Authority – Annual Report 2013
Remuneration Report
In accordance with Section 13 (c) (ii) of Schedule 5 of the Port Authorities Act 1999, the following report outlines details of the compensation provided to key management personnel.
Directors’ Emoluments
The Minister determines the emoluments of the PHPA Directors in accordance with Section 10 of the Port Authorities Act 1999. Details of emoluments provided to Directors are as follows:
Name Directors Fee Superannuation Total
E Fear $16,500 $1,485 $17,985
J Ford $317 $29 $346
L Longden $25,000 $2,250 $27,250
K Pettit $49,500 $0 $49,500
J Tapp $16,500 $1,485 $17,985
R Vitenbergs $13,835 $1,245 $15,080
P Wilshaw/Matthew Dowd* $16,500 $0 $16,500
*Director’s fees are paid directly to Director’s employer
Executives’ Emoluments
Details of emoluments provided to the three senior executives receiving the highest emoluments are as follows:
NameSalary Non Cash
BenefitSuperannuation Total
John Finch* $348,286 $21,702 $44,751 $414,739
Roger Johnston $331,798 $0 $49,145 $380,943
Lindsay Copeman** $263,759 $0 $30,797 $294,556
* Includes payment of at risk component and back pay from previous FY
** Includes payout of leave entitlements on completion of service

78
Appointment, retirement and continuation of Office of Directors
A Director is appointed by the Minister for Transport in accordance with Section 7 (1) of the Port Authorities Act 1999. Directors are appointed for periods of up to three years and are eligible for reappointment.
The Minister may at any time remove a Director from office and is not required to give any reason for doing so. The Minister appoints a Director as Chairman and another as Deputy Chairman.
Changes during the 2012-13 financial year:
• Mr Robert Vitenbergs was appointed to the Board as a Director on 25 July 2012 for a term expiring 31 December 2013.
• Mr Robert Vitenbergs resigned from the Board on 30 April 2013.
• Mr Peter Wilshaw was appointed to the Board as a Director for BHP Billiton on 25 July 2012.
• Mr Peter Wilshaw resigned from the Board on 31 March 2013.
• Mr Matthew Dowd was appointed to the Board as an Alternate Director to Peter Wilshaw on 25 July 2012.
• Mr Julian Tapp was reappointed to the Board as a Director on 25 July 2012 for a term expiring 30 June 2013.
Ten scheduled Board meetings and two special Board meetings were held during the financial year. A number of PHPA Directors also met in their capacity as members of the PHPA Risk Assurance and Audit Committee (RAAC).
Meetings attended by Directors:
Director Board meetings attended RAAC meetings attended
Mr Ken Pettit 12 1
Mr Les Longden 12 5
Mr Julian Tapp 11 5
Ms Elisa Fear 12 5
Mr Robert Vitenbergs 9 1
Mr Peter Wilshaw 6 1
Mr Matthew Dowd (Alternate Director)
2 0
79Port Hedland Port Authority – Annual Report 2013
Indemnification of Directors and Auditors
The Director’s and Officer’s Liability Insurance Policy was renewed during the financial year to ensure that the Directors and Officers of the PHPA had adequate insurance coverage against all liabilities and expenses arising as a result of work performed in their capacities, to the extent of the law.
The PHPA paid an insurance premium of $42,263.96 (GST exclusive) in respect of the Director’s and Officer’s Liability Insurance Policy for the reporting period.
At the date of this report, zero claims have been made against the policy.
Indemnification of Auditors
The Office of the Auditor General (OAG) has been appointed as the PHPA’s auditor in accordance with Schedule 5 Section 37 (2) of the Port Authorities Act 1999. KPMG has been engaged by the OAG to conduct the audit field work and provide advice to the OAG.
The total fee payable for the financial year ended 30 June 2013 was $46,000 (GST exclusive).
Rounding of amounts
The PHPA satisfies the requirements of clause 31 of Schedule 5 contained within the Port Authorities Act 1999 and accordingly, amounts in the financial statements and Director’s Report have been rounded to the nearest thousand dollars unless specifically stated to be otherwise.
This report has been prepared in accordance with a resolution of the Board on on 4 September 2013.
Ken Pettit
Chairman
Les Longden
Director

8080
Iron ore Stockpiles at Utah Facility, Stockyard 1

81Port Hedland Port Authority – Annual Report 2013
Financial Statements
81Port Hedland Port Authority – Annual Report 2013

82
Directors’ Declaration
In the opinion of the Directors of the Port Hedland Port Authority (the PHPA):
(a) the financial statements and notes, are set out in accordancewith the financial reporting provisions of the Port Authorities Act 1999,including:
(i) giving a true and fair viewof the financial position of thePHPAas at 30 June2013 and its performance, as represented by the results of its operations and its cash flows,fortheyearendedonthatdate;and
(ii) complying with Australian Accounting Standards and the Port Authorities Act 1999; and
(b) there are reasonable grounds to believe that the PHPA will be able to pay its debts as andwhentheybecomedueandpayable.
This declaration is signed in accordance with a resolution of the Directors on 29 August 2013.
Ken Pettit SC Les Longden
Chairman DeputyChairman 6September2013 6September2013
Tel (08) 9173 0000 Fax (08) 9173 0060 Email [email protected]
PO Box 2, Port Hedland, Western Australia 6721 www.phpa.com.au
ABN 94 987 448 870

83Port Hedland Port Authority – Annual Report 2013
Auditor General
Page 1 of 2
7th Floor Albert Facey House 469 Wellington Street Perth MAIL TO: Perth BC PO Box 8489 Perth WA 6849 TEL: 08 6557 7500 FAX: 08 6557 7600
INDEPENDENT AUDITOR’S REPORT
To the Parliament of Western Australia
PORT HEDLAND PORT AUTHORITY
I have audited the financial report of the Port Hedland Port Authority. The financial reportcomprises the Statement of Financial Position as at 30 June 2013, and the Statement of Comprehensive Income, Statement of Changes in Equity and Statement of Cash Flows for the year ended on that date, a summary of significant accounting policies, other explanatory Notes and the Directors’ Declaration.
Directors’ Responsibility for the Financial ReportThe directors of the Port Hedland Port Authority are responsible for the preparation of the financial report that gives a true and fair view in accordance with Australian AccountingStandards and the Port Authorities Act 1999, and for such internal control as the directors determine is necessary to enable the preparation of the financial report that is free from material misstatement, whether due to fraud or error.
Auditor’s ResponsibilityAs required by the Port Authorities Act 1999, my responsibility is to express an opinion on the financial report based on my audit. The audit was conducted in accordance with Australian Auditing Standards. Those Standards require compliance with relevant ethical requirements relating to audit engagements and that the audit be planned and performed to obtain reasonable assurance about whether the financial report is free from material misstatement.
An audit involves performing procedures to obtain audit evidence about the amounts and disclosures in the financial report. The procedures selected depend on the auditor’s judgement, including the assessment of the risks of material misstatement of the financial report, whether due to fraud or error. In making those risk assessments, the auditor considers internal control relevant to the Authority’s preparation of the financial report that gives a true and fair view in order to design audit procedures that are appropriate in the circumstances, but not for the purpose of expressing an opinion on the effectiveness of the Authority’s internal control. An audit also includes evaluating the appropriateness of the accounting policies used and the reasonableness of accounting estimates made by the directors, as well as evaluating the overall presentation of the financial report.
I believe that the audit evidence obtained is sufficient and appropriate to provide a basis for my audit opinion.
IndependenceIn conducting this audit, I have complied with the independence requirements of the Auditor General Act 2006 and Australian Auditing Standards, and other relevant ethical requirements.

84
OpinionIn my opinion, the financial report of the Port Hedland Port Authority is in accordance with schedule 5 of the Port Authorities Act 1999, including:
(a) giving a true and fair view of the Authority’s financial position as at 30 June 2013 and of its performance for the year ended on that date; and
(b) complying with Australian Accounting Standards and the Corporations Regulations 2001.
Matters Relating to the Electronic Publication of the Audited Financial ReportThis auditor’s report relates to the financial report of the Port Hedland Port Authority for the year ended 30 June 2013 included on the Authority’s website. The Authority’s directors areresponsible for the integrity of the Authority’s website. This audit does not provide assuranceon the integrity of the Authority’s website. The auditor’s report refers only to the financial reportdescribed above. It does not provide an opinion on any other information which may have been hyperlinked to/from this financial report. If users of the financial report are concerned with the inherent risks arising from publication on a website, they are advised to refer to the hard copy of the audited financial report to confirm the information contained in this website version of the financial report.
COLIN MURPHYAUDITOR GENERALFOR WESTERN AUSTRALIAPerth, Western Australia11 September 2013
Page 2 of 2

85Port Hedland Port Authority – Annual Report 2013
Financial Statements
Notes 2013$’000
2012$’000
Revenue 3 205,231 155,120
Other revenue 3 9,718 15,678
Depreciation and amortisation expense 5 (18,960) (18,353)
Marine expenses (37,591) (29,879)
Port operations expense (18,441) (13,539)
General administration (14,650) (11,124)
Asset maintenance (26,113) (14,275)
Environmental expenses (3,156) (2,950)
Port utilities (7,409) (5,133)
Safety and security (1,777) (800)
Finance costs 7 (14,719) (18,495)
Other expenses 8 (7,966) (10,066)
Profit before income tax 64,167 46,184
Income tax expense 9 (18,356) (13,870)
Net profit for the year 45,811 32,314
Total comprehensive income for the year 45,811 32,314
The above Statement of Comprehensive Income should be read in conjunction with the accompanying notes.
Statement of Comprehensive IncomeFor the year ended 30 June 2013

86
Financial Statements
Notes 2013$’000
2012$’000
Restated*
2011$’000
Restated*
ASSETS
Current Assets
Cash and cash equivalents 11 34,912 77,778 27,632
Other financial assets 12(a) 62,000 - -
Trade and other receivables 12(b) 31,942 39,939 23,394
Inventories 13 2,043 2,323 2,310
Total current assets 130,897 120,040 53,336
Non-current assets
Property, plant and equipment 14 332,117 342,254 350,201
Intangible assets 15 9,796 10,168 10,461
Deferred tax assets 16 10,571 9,801 7,092
Other receivables 17 45,782 36,360 39,729
Total non-current assets 398,266 398,583 407,483
Total assets 529,163 518,623 460,819
LIABILITIES
Current liabilities
Trade and other payables 18(a) 21,410 22,650 19,962
Interest bearing borrowings 18(b) 20,000 4,000 15,000
Current tax liabilities 19 9,874 15,249 (7,125)
Provisions 20 14,134 10,504 1,629
Total current liabilities 65,418 52,403 29,466
Non-current liabilities
Other non-current liabilities 21(a) 20,770 27,789 42,495
Interest bearing borrowings 21(b) 184,700 204,700 193,700
Provisions 20 63,241 63,504 61,729
Total non-current liabilities 268,711 295,993 297,924
Total liabilities 334,129 348,396 327,390
Net assets 195,034 170,227 133,429
EQUITY
Contributed equity 39,155 39,155 32,645
Retained earnings 155,879 131,072 100,784
Total equity 195,034 170,227 133,429
The above Statement of Financial Position should be read in conjunction with the accompanying notes.*Refer to Note 1 (f) for further details.
Statement of Financial PositionFor the year ended 30 June 2013

87Port Hedland Port Authority – Annual Report 2013
Financial Statements
Statement of Changes in EquityFor the year ended 30 June 2013
Contributed Equity $’000
Restated*
Retained Earnings
$’000
Total Equity $’000
Restated*
Balance at 1 July 2011 23,415 100,784 124,199
Effect of recognition of vested/management order land 9,230 - 9,230
Restated balance at 1 July 2011 32,645 100,784 133,429
Total comprehensive income for the year - 32,314 32,314
Transactions with owners in their capacity as owners:
Royalties for Regions contribution 6,000 - 6,000
Restated Contribution of vested land 510 - 510
Dividends paid - (2,026) (2,026)
Restated total transactions with owners in their capacity as owners 6,510 (2,026) 4,484
Restated balance at 30 June 2012 39,155 131,072 170,227
Restated balance at 1 July 2012 39,155 131,072 170,227
Total comprehensive income for the year - 45,811 45,811
Transactions with owners in their capacity as owners
Dividends paid - (21,004) (21,004)
Balance at 30 June 2013 39,155 155,879 195,034
The above Statement of Changes in Equity should be read in conjunction with the accompanying notes.*Refer to Note 1 (f) for further details.

88
Financial Statements
Notes 2013$’000
2012$’000
Cash flows from operating activities
Receipts from customers (inclusive of goods and services tax) 210,360 148,401
Payments to suppliers and employees (inclusive of goods and services tax)
(135,320) (101,611)
Other receipts 7,412 12,398
Interest received 3,668 1,568
Interest paid (8,932) (10,619)
Income taxes paid (24,502) 5,795
Net cash inflow / (outflow) from operating activities 27 52,686 55,932
Cash flows from investing activities
Payments for property, plant and equipment (8,574) (9,769)
Investment in term deposits with a maturity date greater than 3 months
(62,000) -
Proceeds from sale of property, plant and equipment 26 9
Net cash inflow / (outflow) from investing activities (70,548) (9,760)
Cash flows from financing activities
Repayment of borrowings (4,000) -
Equity contributions - 6,000
Dividends paid 10 (21,004) (2,026)
Net cash inflow / (outflow) from financing activities (25,004) 3,974
Net increase / (decrease) in cash and cash equivalents (42,866) 50,146
Cash and cash equivalents at the beginning of the financial year 77,778 27,632
Cash and cash equivalents at the end of the financial year 11 34,912 77,778
The above Statement of Cash Flows should be read in conjunction with the accompanying notes.
Statement of Cash FlowsFor the year ended 30 June 2013

89Port Hedland Port Authority – Annual Report 2013
Notes to the Financial Statements For the year ended 30 June 2013
1. Basis of preparation
(a) Statement of compliance
The Port Hedland Port Authority (“the Authority”) is a not-for-profit entity that prepares general purpose financial statements in accordance with Australian Accounting Standards (AASBs) (including Australian Interpretations) adopted by the Australian Accounting Standards Board (AASB) and the financial reporting provisions of the Port Authorities Act 1999, except as disclosed in note 1(b).
The financial statements were authorised for issue on 4th September 2013 by the Board of Directors of the Authority.
(b) Presentation
Statement of Comprehensive Income
Statement of comprehensive income classification of expenses by nature is considered to provide more relevant and reliable information than classification by function due to the nature of the Authority’s operations.
According to AASB 101 Presentation of Financial Statements, expenses classified by nature are not reallocated among various functions within the entity. However, the Authority has allocated employee benefits expenses to various line items on the statement of comprehensive income including marine expenses, port operations expenses, general administration, asset maintenance, environmental expenses and safety and security. This allocation reflects the internal reporting structure of the Authority which allocates labour expenses to significant expense items in the statement of comprehensive income based on the nature of the
expenses incurred. The Authority believes that this allocation is more relevant to the understanding of the financial performance of the Authority although it does not result in a functional expense presentation.
The Directors have concluded that the financial statements present fairly the Authority’s financial position, financial performance and cash flows and that it has complied with applicable standards and interpretations, except that it has departed from AASB 101, Para 99, to achieve a fair presentation.
Total employee benefits expenses are disclosed in note 6 to the financial statements.
(c) Basis of measurement
The financial statements have been prepared on the accrual basis of accounting using the historical cost convention.
(d) Functional and presentation currency
These financial statements are presented in Australian dollars which is the Authority’s functional currency. All financial information presented in Australian dollars has been rounded to the nearest thousand dollars ($’000) unless otherwise stated.

90
Notes to the Financial Statements For the year ended 30 June 2013
(e) Use of estimates and judgements
The preparation of financial statements in conformity with International Financial Reporting Standards (IFRS) requires management to make judgements, estimates and assumptions that affect the application of accounting policies and the reported amount of assets, liabilities, income and expenses. Actual results may differ from these estimates.
Estimates and underlying assumptions are reviewed on an ongoing basis. Revisions to accounting estimates are recognised in the period in which the estimate is revised and in any future periods affected.
Information about significant areas of estimation, uncertainty and critical judgements in applying accounting policies that have the most significant effect on the amounts recognised in the financial statements is included in the following notes:
• Note 2(m) – Long service leave: actuarial assumptions.
• Note 2(f) – Property, Plant & Equipment: useful life of Assets.
• Note 20 – Provision for environmental remediation: assumptions and uncertainties including the:
— extent of environmental damages to be rectified
— methodology and timing of the rectifications
— timing of cash flows receivable
— financial rates to be used, including discount and inflation rates.
(f) Restatement for prior period error
The 30 June 2012 and 30 June 2011 comparatives have been restated to include Crown land either vested in or held under management order by the Port Hedland Port Authority (PHPA). The PHPA recognises the land as a contribution from the Government within its financial statements.
In accordance with the Port Authorities Act 1999 and the guidance set out in the Treasurer’s instructions 955 and 1101, the land is recognised at fair value at the date on which the land vests in or commences being held under management order by the PHPA. The fair values are as advised by Valuation Services (Landgate) and are determined on the basis of a “current use” methodology.
The following land was vested in the Port and recognised as a contribution from Government:
• Lot 6098 vested to the Port. Valuation of fair value of $4.9 million at 01/07/2003.
• Lot 370 vested to the Port. Valuation of fair value of $250,000 at 01/07/2004.
• Lot 372 vested to the Port. Valuation of fair value of $1.7 million at 01/07/2006.
The following land is held under management order and recognised as a contribution from Government:
• Lot 376 - Valuation of fair value of $2.38 million at 01/07/2010.
• Reserve 50892 - Valuation of fair value of $510,000 at 01/07/2011.

91Port Hedland Port Authority – Annual Report 2013
Notes to the Financial Statements For the year ended 30 June 2013
The recognition of these land assets had the following impact on the PHPA’s financial statements:
Restated sections of the Statement of Financial Position
Property, Plant &
Equipment $’000
Non-Current Assets $’000
Total Assets $’000
Contributed Equity $’000
Equity $’000
Balance at 1 July 2011 as previously reported 340,971 398,253 451,589 23,415 124,199
Effect of land vested or held under management order in the Port 9,230 9,230 9,230 9,230 9,230
Restated balance at 1 July 2011 350,201 407,483 460,819 32,645 133,429
Balance at 30 June 2012 as previously reported 332,514 388,843 508,883 29,415 160,487
Effect of land vested or held under management order in the Port 9,740 9,740 9,740 9,740 9,740
Restated balance at 30 June 2012 342,254 398,583 518,623 39,155 170,227
2. Statement of significant accounting policies
(a) Revenue recognition
Revenue is measured at the fair value of consideration received or receivable. Revenue is recognised for the major business activities as follows:
(i) Rendering of services
Revenue from services rendered is recognised in profit or loss in proportion to the stage of completion of the transaction at the reporting date. Where a contract outcome cannot be measured reliably, revenue is recognised only to the extent of the expenses recognised that are recoverable.
(ii) Interest revenue
Interest revenue is recognised as it accrues using the effective interest method. (See note 2(b)).
(iii) Rental income
Rental income is recognised in profit or loss on a straight line basis over the term of the lease. Lease incentives granted are recognised as an integral part of total rental income, over the term of the lease.
(b) Finance income and finance costs
Finance income comprises interest income on funds invested and interest receivable under finance leases. Interest income is recognised as it accrues in profit or loss, using the effective interest method. The interest receivable component of finance lease receivables is also recognised in the Statement of Comprehensive Income using the effective interest method.
Finance costs comprise interest expense on borrowings, unwinding of discount on provisions and finance charges payable under finance leases. All finance costs are recognised in profit or loss using
92
Notes to the Financial Statements For the year ended 30 June 2013
the effective interest method. The interest expense component of finance lease payments is also recognised in the Statement of Comprehensive Income using the effective interest method.
Borrowing costs are recognised as expenses in the period in which they are incurred except where they are directly attributable to the acquisition, construction or production of a qualifying asset in which case they are capitalised as part of the cost of the asset, in accordance with AASB 123 Borrowing Costs.
In determining the amount of borrowing costs to be capitalised during the financial year, investment revenue earned directly relating to the borrowings is deducted from the borrowing costs incurred.
(c) Income tax
The Authority operates within the national tax equivalent regime (“NTER”) whereby an equivalent amount in respect of income tax is payable to the State Government. The calculation of the liability in respect of income tax is governed by NTER guidelines and directions approved by Government.
As a consequence of participation in the NTER, the Authority is required to comply with AASB 112 Income Taxes.
Income tax expense comprises current and deferred tax. Income tax expense is recognised in profit or loss except to the extent that it relates to items recognised directly in equity or in other comprehensive income.
Current tax is the expected tax payable or receivable on the taxable income or loss for the year, using tax rates enacted or substantively enacted at the reporting date, and any adjustment to tax payable in respect of previous years.
Deferred tax is recognised on temporary differences between the carrying amounts of assets and liabilities for financial reporting purposes and the amounts used for taxation purposes. Deferred tax is not recognised for temporary differences on the initial recognition of assets or liabilities in a transaction that is not a business combination and that affects neither accounting nor taxable profit nor loss. Deferred tax is measured at the tax rates that are expected to be applied to the temporary differences when they reverse, using tax rates enacted or substantively enacted at the reporting date.
Deferred tax assets and liabilities are offset if there is a legally enforceable right to offset current tax liabilities and assets, and they relate to income taxes levied by the same tax authority on the same taxable entity, or on different tax entities, but they intend to settle current tax liabilities and assets on a net basis or their tax assets and liabilities will be realised simultaneously.
A deferred tax asset is recognised for unused tax losses, tax credits and deductible temporary differences to the extent that it is probable that future taxable profits will be available against which they can be utilised. Deferred tax assets are reviewed at each reporting date and are reduced to the extent that it is no longer probable that the related tax benefit(s) will be realised.

93Port Hedland Port Authority – Annual Report 2013
Notes to the Financial Statements For the year ended 30 June 2013
(d) Receivables
(i) Trade receivables
Trade receivables are recognised and carried at the original invoice amounts less an allowance for any uncollectible amounts. Receivables are generally settled within 30 days except for property rentals, which are governed by individual lease agreements and may be settled under different terms as a result.
The collectability of receivables is reviewed on an ongoing basis and any receivables identified as uncollectible are written-off against the allowance account. Currently, the Port does not need to record an allowance for uncollectable amounts. This is due to the Port’s strong performance in collecting trade receivables. However, if required in the future, an allowance for uncollectible amounts (doubtful debts) will be raised when there is objective evidence that the Authority will not be able to collect its debts.
(ii) Lease receivables
A finance lease receivable is recognised for leases of property, plant and equipment which effectively transfer to the lessee substantially all of the risks and benefits incidental to legal ownership of the leased asset. The lease receivable is initially recognised as the amount of the present value of the minimum lease payments receivable at the reporting date plus the present value of any unguaranteed residual value expected to accrue at the end of the lease term.
Finance lease payments are allocated between interest revenue and reduction of the lease receivable over the term of the lease in order to reflect a constant periodic rate of return on the net investment outstanding in respect of the lease with interest revenue calculated
using the interest rate implicit in the lease and recognised directly in the Statement of Comprehensive Income.
(iii) Other receivables
Other receivables are recognised at fair value. In estimating the fair value a discounted cash flow methodology has been applied using a risk free rate (5 year government bond rate) plus a risk premium of 1% to more accurately reflect the low risk associated with this receivable.
(e) Inventories
Inventories consist of spares which are measured at the lower of cost and net realisable value.
(f) Property, plant and equipment
(i) Recognition and measurement
Items of property, plant and equipment are measured at cost less accumulated depreciation and accumulated impairment losses.
Cost includes expenditure that is directly attributable to the acquisition of the asset. The cost of self-constructed assets include the following:
• The cost of materials and direct labour,
• Any other costs directly attributable to bringing the assets to a working condition for their intended use,
• When the Authority has an obligation to remove the assets or restore the site, an estimate of the costs of dismantling and removing the items and restoring the site on which they are located, and
• Capitalised borrowing costs.

94
Notes to the Financial Statements For the year ended 30 June 2013
Purchased software that is integral to the functionality of related equipment is capitalised as part of that equipment.
When parts of an item of property, plant and equipment have different useful lives, they are accounted for as separate items (major components) of property, plant and equipment.
Any gain or loss on disposal of an item of property, plant and equipment is calculated as the difference between the net proceeds from disposal and the carrying amount of the item and is recognised in profit or loss.
(ii) Subsequent costs
Subsequent expenditure is capitalised only when it is probable that future economic benefits associated with the expenditure will flow to the Authority. The carrying amount of a replaced part is de-recognised. Ongoing repairs and maintenance are expensed as incurred.
(iii) Depreciation
Items of property, plant and equipment are depreciated on a straight line basis in profit or loss over the estimated useful lives of each component. Leased assets are depreciated over the shorter of the lease term and their useful lives unless it is reasonably certain that the Authority will obtain ownership by the end of the lease term. Land is not depreciated.
Items of property, plant and equipment are depreciated from the date that they are installed and are ready for use, or in respect of internally constructed assets, from the date that the asset is completed and ready for use.
The estimated useful lives for the current and comparative years of significants items of property, plant and equipment are as follows. The straight line method of calculating depreciation is applied to each of the asset classes depicted below.
• Buildings and port improvements 25 - 40 years
• Navigational aids 2 - 30 years
• Wharves and utilities 10 - 40 years
• Office furniture, fittings and equipment 3 - 20 years
(iv) Repairs and maintenance
Routine maintenance, repair costs, and minor renewal costs (under $5,000) are expensed as incurred. This includes repairs that relate to the restoration of an asset to its original service potential. Repairs that improve the functionality of the asset or increase the effective life are capitalised and depreciated.
(v) Land
Land which is either freehold, vested in the Port or under management order is considered to be under the control of the Port and is subsequently recorded in Property, Plant and Equipment.

95Port Hedland Port Authority – Annual Report 2013
Notes to the Financial Statements For the year ended 30 June 2013
(g) Intangible assets
(i) Research and development
Expenditure on research activities is recognised in profit or loss as incurred.
Development activities involve a plan or design for the production of new or substantially improved products and processes. Development expenditure is capitalised only if development costs can be measured reliably, the product or process is technically and commercially feasible, future economic benefits are probable, and the Authority intends to and has sufficient resources to complete development and to use or sell the asset. The expenditure capitalised includes the cost of materials, direct labour and overhead costs that are directly attributable to preparing the asset for its intended use, and capitalised borrowing costs. Other development expenditure is recognised in profit or loss as incurred.
Capitalised development expenditure is measured at cost less accumulated amortisation and accumulated impairment losses.
(ii) Subsequent expenditure
Subsequent expenditure is capitalised only when it increases the future economic benefits embodied in the specific asset to which it relates.
(iii) Computer software
Software that is an integral part of related hardware is treated as property, plant and equipment. Software that is not an integral part of related hardware is treated as an intangible asset.
(iv) Amortisation
Intangible assets are amortised on a straight line basis in profit or loss over their estimated useful lives, from the date that they are available for use. The estimated useful lives for the current and comparative years are as follows:
• Computer software 4 years
• Capital Dredging 40 years
Amortisation methods, useful lives and residual values are reviewed at each reporting date and adjusted if appropriate.
(h) Impairment
Property, plant and equipment and intangible assets are tested for any indication of impairment at each balance sheet date. Where there is any indication of impairment, the recoverable amount is estimated. Where the recoverable amount is less than the carrying amount, the asset is considered impaired and is written down to the recoverable amount and an impairment loss is recognised. Unless an asset has been identified as a surplus asset, the carrying amounts of assets are reviewed at each reporting date to determine whether there is any indication of impairment. If any such indication exists, then the asset’s recoverable amount is estimated. An impairment loss is recognised if the carrying amount of an asset exceeds its recoverable amount. The recoverable amount is the greater of an asset’s fair value less costs to sell and depreciated replacement cost.

96
Notes to the Financial Statements For the year ended 30 June 2013
The risk of impairment is generally limited to circumstances where an asset’s depreciation is materially understated, where the replacement cost is falling or where there is a significant change in useful life. Each relevant class of assets is reviewed annually to verify that the accumulated depreciation / amortisation reflects the level of consumption or expiration of the asset’s future economic benefits and to evaluate any impairment risk from falling replacement costs.
Intangible assets with an indefinite useful life and intangible assets not yet available for use are tested for impairment at each reporting date irrespective of whether there is any indication of impairment.
The recoverable amount of assets identified as surplus assets is the higher of fair value less costs to sell and the present value of future cash flows expected to be derived from the asset. Surplus assets carried at fair value have no risk of material impairment where fair value is determined by reference to market-based evidence. Where fair value is determined by reference to depreciated replacement cost, surplus assets are at risk of impairment and the recoverable amount is measured. Surplus assets valued at cost are tested for indications of impairment at the end of each reporting period.
Impairment losses are recognised in profit or loss.
An impairment loss is reversed only to the extent that the asset’s carrying amount does not exceed the carrying amount that would have been determined, net of depreciation or amortisation, if no impairment loss had been recognised.
(i) Leases
Leases are classified as either finance leases or operating leases based on the economic substance of the lease agreements.
Leases in terms of which the Authority assumes substantially all the risks and rewards of ownership are classified as finance leases. Upon initial recognition, the leased asset is measured at an amount equal to the lower of its fair value and the present value of the minimum lease payments. A finance lease liability is also recognised. Subsequent to initial recognition, the asset is accounted for in accordance with the accounting policy applicable to that asset.
Other leases are operating leases and the leased assets are not recognised on the Authority’s Statement of Financial Position.
Payments made under operating leases are recognised in profit or loss on a straight line basis over the term of the lease. Lease incentives received are recognised as an integral part of the total lease expense, over the term of the lease.
Minimum lease payments made under finance leases are apportioned between the finance expense and the reduction of the outstanding liability. The finance expense is allocated to each period during the lease term so as to produce a constant periodic rate of interest on the remaining balance of the liability. Contingent lease payments are accounted for by revising the minimum lease payments over the remaining term of the lease when the lease adjustment is confirmed, where appropriate.

97Port Hedland Port Authority – Annual Report 2013
Notes to the Financial Statements For the year ended 30 June 2013
(j) Financial instruments
In addition to cash and cash equivalents, the Authority has three categories of financial instruments:
• Loans and receivables;
• Held to maturity investments; and
• Financial liabilities measured at amortised cost.
Financial instruments have been disaggregated into the following classes:
• Financial assets
— Cash and cash equivalents;
— Other financial assets; and
— Trade and other receivables.
• Financial liabilities
— Trade and other payables; and
— Interest bearing liabilities.
Refer to Note 22 for further information on the classification of financial instruments.
Initial recognition and measurement is at fair value plus directly attributable transaction costs for assets not carried at fair value through profit or loss. Subsequent measurement is at amortised cost using the effective interest method.
The fair value of short-term receivables and payables approximates their carrying amount because there is no interest rate applicable and subsequent measurement is not required as the effect of discounting is not material. Gains or losses are recognised when the financial assets are derecognised or impaired.
(k) Payables
Payables, including trade payables, amounts payable and accrued expenses, are recognised for amounts to be paid in the future for goods and services received prior to the reporting date.
The carrying amount is equivalent to fair value, as they are generally settled within 30 days.
(l) Borrowings
All borrowings are initially recognised at the fair value of the consideration received less directly attributable transaction costs. Subsequent measurement is at amortised cost using the effective interest rate method.
Gains and losses are recognised in the statement of Comprehensive Income when the liabilities are derecognised, as well as through the amortisation process.
Borrowing costs are expensed as incurred unless they relate to qualifying assets.
(m) Employee benefits
The liability for annual and long service leave expected to be settled within 12 months after the reporting date is recognised and measured at the undiscounted amounts expected to be paid when the liabilities are settled using the remuneration rates expected to apply at the time of settlement. Annual and long service leave expected to be settled more than 12 months after the reporting date is measured at the present value of amounts expected to be paid when the liabilities are settled. Leave liabilities are in respect of services provided by employees up to the reporting date.
When assessing expected future payments, consideration is given to estimated future wage and salary levels including non-salary components, as well as the experience of employee departures and periods of service. The expected future payments are discounted to present value using market yields at the reporting date on national government

98
Notes to the Financial Statements For the year ended 30 June 2013
bonds with terms to maturity that match, as closely as possible, the estimated future cash outflows.
All annual leave and unconditional long service leave provisions are classified as current liabilities as the Authority does not have an unconditional right to defer settlement of the liability for at least 12 months after the reporting date.
Associated payroll on-costs are included in the determination of employee benefits.
(n) Dividends
Dividends, to the extent that they are not paid within the period, are recognised as a liability in the period in which they are declared.
(o) Cash and cash equivalents
Cash and cash equivalents in the Statement of Financial Position comprise cash on hand, cash at bank, at call deposits and term deposits due within 3 months.
For the purpose of the cash flow statement, cash equivalents consist of cash and cash equivalents as defined above.
(p) Goods and services tax
Revenue, expenses and assets are recognised net of the amount of goods and services tax (GST), except where the amount of GST incurred is not recoverable from the taxation authority. In these circumstances, the GST is recognised as part of the cost of acquisition of the asset or as part of the expense item as applicable.
Receivables and payables are stated inclusive of GST. The net amount of GST recoverable from, or payable to, the ATO is included as a current asset or liability in the Statement of Financial Position.
Cash flows are included in the statement of cash flows on a gross basis. The GST components of cash flows arising from investing and financing activities which are recoverable from, or payable to, the ATO are classified as operating cash flows.
(q) Provisions
A provision is recognised if, as a result of a past event, the Authority has a present legal or constructive obligation that can be estimated reliably, and it is probable that an outflow of economic benefits will be required to settle the obligation. Provisions are determined by discounting the expected future cash flows at a pre-tax rate that reflects current market assessments of the time value of money and the risks specific to the liability.
The unwinding of the discount is recognised as a finance cost.
(i) Payroll
Payroll is processed fortnightly, accordingly a provision is recognised to account for the salary costs arising to 30 June yet not payable until after year end. Further employee benefits are discussed at Note 20.
(ii) Land rehabilitation
Provision for land rehabilitation liability has been recognised using a discounted cash flow methodology. The cash flows have been inflated at the Port’s estimated long term inflation rate and discounted at the risk free rate (5 year government bond rate). No adjustment for risk has been made to the discount rate as management has built risk factors into the cash flow estimates.

99Port Hedland Port Authority – Annual Report 2013
Notes to the Financial Statements For the year ended 30 June 2013
(r) Contributed equity
The Authority receives support from the WA Government. The amount received is recognised directly as a credit to contributed equity.
(s) New accounting standards and interpretations
This financial year the Australian Accounting Standards Board (AASB) has issued the following compiled standards incorporating amendments made by AASB 2011-3, AASB 2011-9, AASB 2011-13 and AASB 2012-6:
• AASB 1 First-time Adoption of Australian Accounting Standards
• AASB 5 Non-current Assets Held for Sale and Discontinued Operations
• AASB 7 Financial Instruments: Disclosures
• AASB 101 Presentation of Financial Statements
• AASB 112 Income Taxes
• AASB 120 Accounting for Government Grants and Disclosure of Government Assistance
• AASB 121 The effects of Changes in Foreign Exchange Rates
• AASB 132 Financial Instruments: Presentation
• AASB 133 Earnings per Share
• AASB 134 Interim Financial Reporting
• AASB 1039 Concise Financial Reports
• AASB 1049 Whole of Government and General Government Sector Financial Reporting
All of the above amendments have been assessed for application by the Port Hedland Port Authority. There were no material changes in accounting
policies required. The PHPA’s financial statements are fully compliant with all incorporating amendments.
In addition to the above current amendments, the following revised, reissued, and new standards have been identified for future assessment in advance of their application dates:
• AASB 119 Employee Benefits – applicable to financial years beginning on or after 1 January 2013
• AASB 127 Separate Financial Statements – applicable to financial years beginning on or after 1 January 2013
• AASB 128 Investments in Associates – applicable to financial years beginning on or after 1 January 2013
• AASB 10 Consolidated Financial Statements – applicable to financial years beginning on or after 1 January 2013
• AASB 11 Joint Arrangements – applicable to financial years beginning on or after 1 January 2013
• AASB 12 Disclosure of Interests in Other Entities – applicable to financial years beginning on or after 1 January 2013
• AASB 13 Fair Value Measurement – applicable to financial years beginning on or after 1 January 2013
• AASB 9 Financial Instruments – applicable to financial years beginning on or after 1 January 2015
The impact of the above mentioned amendments will be assessed on a case by case basis and changes to the PHPA’s accounting policies and / or practices will be implemented as may be required.

100
Notes to the Financial Statements For the year ended 30 June 2013
3. Revenue
Revenue consists of the following items2013
$’0002012$’000
Rendering of services
Charges on cargo 94,579 76,877
Charges on ships 64,304 38,905
Shipping services 26,102 23,054
Interest revenue 3,668 1,568
Rental and leases 16,578 14,716
Total revenue 205,231 155,120
Other revenue
Other revenue (a) 9,718 15,678
Revenue from ordinary activities 214,949 170,798
Total revenue 214,949 170,798
(a) Includes movements in finance revenue receivable of $3.4m (2013) and $2.6m (2012).
4. Expenses
Operating expenses are presented on the face of the statement of comprehensive income using a classification based on the nature of expenses (see note 1(b)). Marine expenses include those expenses derived from water based activities, port operations expenses include those expenses related to land based support activities, whilst general administration expenses includes expenditure of an administrative nature.

101Port Hedland Port Authority – Annual Report 2013
Notes to the Financial Statements For the year ended 30 June 2013
5. Depreciation and amortisation expense
2013$’000
2012$’000
Depreciation
Channels and breakwaters 320 214
Buildings and improvements 1,157 1,139
Plant and equipment 8,766 8,597
Berths, jetties and Infrastructure 8,132 7,865
Total depreciation 18,375 17,815
Amortisation
Intangible assets 585 538
Total amortisation 585 538
Total depreciation and amortisation 18,960 18,353
6. Employee benefits
2013$’000
2012$’000
Wages and salaries (a) 19,751 15,488
Superannuation (b) 2,230 1,744
Long service leave 747 29
Annual leave 1,584 1,170
24,312 18,431
Allocated to the following line items on the statement of comprehensive income
Marine expenses 3,967 3,366
Port operations expenses 10,800 7,738
General administration 4,479 4,597
Environmental expenses 999 616
Safety and security 1,066 524
Other expenditure 3,001 1,590
24,312 18,431
(a) Includes the value of the fringe benefit to the employee plus the fringe benefit tax component.
(b) Includes defined benefits plan.

102
Notes to the Financial Statements For the year ended 30 June 2013
7. Finance costs
2013$’000
2012$’000
Interest expensed 1,481 2,086
WATC borrowing costs 10,506 10,619
Finance costs (rehabilitation) 2,732 5,790
Finance costs expensed 14,719 18,495
Finance costs include borrowing costs. AASB 123.5 defines borrowing costs as interest and other costs that an entity incurs in connection with the borrowing of funds. Borrowing costs may include finance charges in respect of finance leases recognised in accordance with AASB 117 Leases (AASB 123.6(d)). AASB 119 requires the unwinding of the discount of employee benefits to be recognised under employee benefits expense rather than separately as a finance cost.
8. Other expenses
2013$’000
2012$’000
Rented accommodation 7,862 5,881
Loss on disposal of fixed assets 103 160
Port development costs - 3,135
Risk and governance - 890
Doubtful / bad debts 1 -
7,966 10,066
Port development costs and risk and governance have been reclassified in 2013 to port operations and general administration to align the presentation of the financial statements of the Port Authority with the guidelines supplied by Government.

103Port Hedland Port Authority – Annual Report 2013
Notes to the Financial Statements For the year ended 30 June 2013
9. Income tax expense
2013$’000
2012$’000
(a) Income tax expense
Current taxation 20,028 16,675
Deferred income tax (761) (2,792)
Over provision in prior year (911) (13)
18,356 13,870
(b) Numerical reconciliation of income tax expense to prima facie tax payable
Profit before income tax expense 64,167 46,184
Tax at the Australian tax rate of 30% (2012–30%) 19,250 13,855
Tax effect of amounts which are not deductible (taxable) in calculating taxable income:
Entertainment and travel 14 24
Other 3 4
19,267 13,883
Under (over) provision in prior years (911) (13)
Total income tax expense 18,356 13,870
10. Dividends
2013$’000
2012$’000
Dividends paid in the financial year 21,004 2,026
In accordance with Government Financial Policy, WA Ports are required to pay dividends of 65% of after tax profits. However, in accordance with Australian Accounting Standards, dividends relating to the financial results for the year ended 30 June 2013 have not been provided as they are expected to be declared by the Board and approved by Government after the reporting date.
A dividend of $21,004k in respect of the financial results for the year ended 30 June 2012 was paid by 30 June 2013.

104
Notes to the Financial Statements For the year ended 30 June 2013
11. Cash and cash equivalents
2013$’000
2012$’000
Current
Bank balances 34,912 57,778
Term deposits maturing within 3 months - 20,000
Cash and cash equivalents in the statement of cash flows 34,912 77,778
The Authority’s exposure to interest rate risk and sensitivity analysis for financial assets and liabilities are disclosed in note 22.
12. (a) Other financial assets
2013$’000
2012$’000
Term deposits maturating in greater than 3 months but less than 1 year 62,000 -
12. (b) Trade and other receivables
2013$’000
2012$’000
Net trade receivables
Trade receivables 31,398 33,496
Provision for doubtful debts - -
Prepayments 544 443
31,942 33,939
Other current receivables
Rehabilitation costs receivable - 6,000
Trade and other receivables 31,942 39,939
At 30 June, the aged analysis of trade debtors past due but not impaired is as follows:
Not more than 3 months 8,284 6,119
More than 3 months but less than 6 months 41 1,050
More than 6 months but less than 1 year 84 467
More than 1 year - -
8,409 7,636

105Port Hedland Port Authority – Annual Report 2013
Notes to the Financial Statements For the year ended 30 June 2013
13. Inventories
2013$’000
2012$’000
Spares – at cost 2,043 2,323
14. Property, plant and equipment
2013$’000
2012$’000
Restated*
2011$’000
Restated*
Channels and breakwaters
At cost 8,694 7,480 7,524
Less: Accumulated depreciation (4,664) (4,480) (4,615)
Less: Accumulated impairment losses - - -
4,030 3,000 2,909
Land
Freehold Land
At cost 1,305 1,305 1,305
Less: Accumulated depreciation - - -
Less: Accumulated impairment losses - - -
Vested/management order Land 9,740 9,740 9,230
Less: Accumulated depreciation - - -
Less: Accumulated impairment losses - - -
11,045 11,045 10,535
Buildings and improvements
At cost 32,646 32,485 31,190
Less: Accumulated depreciation (6,304) (5,192) (4,059)
Less: Accumulated impairment losses - - -
26,342 27,293 27,131
Plant and equipment
At cost 134,173 132,097 129,387
Less: Accumulated depreciation (28,374) (19,935) (11,710)
Less: Accumulated impairment losses - - -
105,799 112,162 117,677

106
Notes to the Financial Statements For the year ended 30 June 2013
2013$’000
2012$’000
Restated*
2011$’000
Restated*
Berths, jetties and infrastructure
At cost 218,596 213,056 209,875
Less: Accumulated depreciation (33,914) (25,786) (17,926)
Less: Accumulated impairment losses - - -
184,682 187,270 191,949
Total property, plant and equipment at net book value 331,898 340,770 350,201
Add: Work in progress at cost 219 1,484 -
Total Property plant and equipment 332,117 342,254 350,201
*Refer to Note 1(f) for further details
Reconciliation of carrying amounts
Channels and breakwaters
Carrying amount as at 1 July 3,000 2,909 3,122
Additions 1,353 395 7
Transfer from work in progress - - -
Depreciation for year (320) (214) (215)
Disposals (3) (90) (5)
Impairment losses - - -
Carrying amount as at 30 June 4,030 3,000 2,909
Land
Carrying amount as at 1 July – as previously stated 1,305 1,305 1,305
Effect of land vested in the Port 9,740 9,230 9,230
Carrying amount as at 1 July – as restated 11,045 10,535 10,535
Additions – as previously stated - - -
Effect of land vested/under management order in the Port - 510 -
Additions – as restated - 510 -
Transfer from work in progress - - -
Depreciation for year - - -
Disposals - - -
Impairment losses - - -
Carrying amount as at 30 June 11,045 11,045 10,535
14. Property, plant and equipment (continued)

107Port Hedland Port Authority – Annual Report 2013
Notes to the Financial Statements For the year ended 30 June 2013
2013$’000
2012$’000
Restated*
2011$’000
Restated*
Buildings and improvements
Carrying amount as at 1 July 27,293 27,131 10,385
Additions 221 1,302 17,447
Transfer from work in progress - - -
Depreciation for year (1,157) (1,139) (690)
Disposals (15) (1) (11)
Impairment losses - - -
Carrying amount as at 30 June 26,342 27,293 27,131
Plant and equipment
Carrying amount as at 1 July 112,162 117,677 9,126
Additions 1,796 3,142 114,353
Transfer from work in progress 838 - -
Depreciation for year (8,766) (8,597) (5,751)
Disposals (231) (60) (51)
Carrying amount as at 30 June 105,799 112,162 117,677
Berths, jetties and infrastructure
Carrying amount as at 1 July 187,270 191,949 32,684
Additions 4,908 3,200 164,845
Transfer from work in progress 646 - -
Depreciation for year (8,132) (7,865) (5,580)
Disposals (10) (14) -
Impairment losses - - -
Carrying amount as at 30 June 184,682 187,270 191,949
Work in progress
Carrying amount as at 1 July 1,484 - 8,164
Additions 219 1,484 -
Transfer to property, plant and equipment (1,484) - -
Transfer to intangible assets - - (8,164)
Carrying amount as at 30 June 219 1,484 -
*Refer to Note 1(f) for further details
Impairment of assets
There were no indications of impairment to property, plant and equipment as at 30 June 2013. wThe Authority held no goodwill or intangible assets with an indefinite useful life at reporting date.
14. Property, plant and equipment (continued)

108
Notes to the Financial Statements For the year ended 30 June 2013
15. Intangible assets
2013$’000
2012$’000
Capital Dredging
At cost 10,523 21,909
Less: Accumulated amortisation (1,108) (12,231)
Less: Accumulated impairment losses - -
9,415 9,678
Computer software
At cost 1,662 1,328
Less: Accumulated amortisation (1,281) (838)
Less: Accumulated impairment losses - -
381 490
Total intangible assets 9,796 10,168
Reconciliation of carrying amounts
Capital Dredging
Carrying amount as at 1 July 9,678 9,941
Additions - -
Impairment losses - -
Amortisation expense (263) (263)
Carrying amount as at 30 June 9,415 9,678
Computer software
Carrying amount as at 1 July 490 520
Additions 213 245
Impairment losses - -
Amortisation expense (322) (275)
Carrying amount as at 30 June 381 490

109Port Hedland Port Authority – Annual Report 2013
Notes to the Financial Statements For the year ended 30 June 2013
16. Deferred tax assets
Deferred tax assets2013
$’0002012$’000
Movements:
Opening balance at 1 July 25,747 24,034
Charged to the statement of comprehensive income 1,337 1,796
Movement attributable to the prior year adjustments - (83)
Gross deferred tax assets 27,084 25,747
The balance comprises temporary difference attributable to:
Amounts recognised in profit or loss:
Accrued expenses 61 58
Employee benefits 937 724
Incentive provision - -
Borrowing expenses 548 143
Capital works expenditure 2,859 2,938
Fixed assets 391 406
Superannuation clearing 12 -
Rehabilitation contribution 22,276 21,478
Gross deferred tax assets 27,084 25,747
Deferred tax liabilities
Movements:
Opening balance at 1 July 15,946 16,942
Charged/(credit) to the statement of comprehensive income 567 (996)
Movement attributable to the prior year adjustments - -
Gross deferred tax liabilities 16,513 15,946
The balance comprises temporary difference attributable to:
Amounts recognised in profit or loss:
Others 18 18
Fixed assets 2,760 3,220
Receivable 13,735 12,708
Gross deferred tax liabilities 16,513 15,946
Net deferred tax assets 10,571 9,801

110
Notes to the Financial Statements For the year ended 30 June 2013
17. Other receivables
2013$’000
2012$’000
Rehabilitation costs receivable 45,782 36,360
18. (a) Trade and other payables
2013$’000
2012$’000
Trade payables 7,659 9,873
Rent received in advance 4,110 3,993
Other payables 1,906 2,114
Accrued expenses 7,735 6,670
21,410 22,650
18. (b) Interest bearing borrowings
2013$’000
2012$’000
WA Treasury Corporation loans 20,000 4,000
19. Current tax liabilities
2013$’000
2012$’000
Opening balance 15,249 (7,125)
Current year true up 5 (96)
R&D claim refund (909) -
June instalment paid (1,077) (188)
September instalment paid (992) (209)
December instalment paid (4,483) (216)
March instalment paid (4,477) (717)
R&D claim refund received 991 -
2011 tax refund - 7,125
2012 tax paid (14,463) -
Tax payable 20,030 16,675
9,874 15,249

111Port Hedland Port Authority – Annual Report 2013
Notes to the Financial Statements For the year ended 30 June 2013
20. Provisions
2013$’000
2012$’000
Employee benefits provision
Annual leave 1,564 1,280
Long service leave 531 511
Other employee benefits 39 38
Other
Provision for rehabilitation 12,000 8,675
14,134 10,504
Non-Current
Employee benefits provision
Long service leave 617 186
Other employee benefits 370 400
Other
Provision for rehabilitation 62,254 62,918
63,241 63,504
Movements in provisionsMovements in each class of provision during the financial year, other than employee benefits, are set out below.
Current
Rehabilitation
Carrying amount at 1 July 8,675 4,670
Provisions made during the year 3,395 4,115
Amounts utilised during the year (70) (110)
Carrying amount at 30 June 12,000 8,675
Non-current
Rehabilitation
Carrying amount at 1 July 62,918 61,243
Movements during the year (664) 1,675
Carrying amount at 30 June 62,254 62,918
(a) Pension and gold state scheme
Reconciliation of the present value of the defined benefit obligation
Present value of defined benefit obligations at the beginning of the year 400 350
Interest cost 10 17
Actuarial (gains)/losses (4) 71
Benefits paid (36) (38)
Present value of defined benefit obligations at end of the year 370 400
Two persons remain in the gold state scheme

112
Notes to the Financial Statements For the year ended 30 June 2013
21. (a) Other non-current liabilities
2013$’000
2012$’000
Prepaid revenue 20,770 27,789
21. (a) Interest bearing borrowings
2013$’000
2012$’000
WA Treasury Corporation loans 184,700 204,700
The Western Australian Treasury Corporation (WATC) loan is repayable via annual payments of principal in accordance with the 5 year borrowing limit schedule provide by WATC and quarterly interest payments in accordance with a fixed instalment repayment schedule. Excluding the contractual obligation to repay the WATC under its portfolio lending arrangements, the PHPA has not provided any security in respect of the loan.
22. Financial instruments
Financial risk management objectives and policies
The Authority’s principal financial instruments comprise cash and cash equivalents, trade receivables, other receivables, payables and interest bearing borrowings. The Authority has limited exposure to financial risks. The Authority’s overall risk management program focuses on managing the risks identified below.
Credit risk
Credit risk arises when there is the possibility of the Authority’s debtors defaulting on their contractual obligations resulting in financial loss to the Authority. The Authority measures credit risk on a fair value basis and monitors risk on a regular basis. With respect to credit risk arising from cash and cash equivalents, The Authority’s exposure to credit risk arises from default of the counter party, with a maximum exposure equal to the carrying amount of the cash and cash equivalents. The Authority only holds funds and deposits with Australian
financial institutions with appropriate credit ratings.
The Authority operates predominantly within the shipping and cargo handling industry and accordingly is exposed to risks affecting the industry. The maximum exposure to credit risk at reporting date in relation to each class of recognised financial assets is the gross carrying amount of those assets inclusive of any provisions for impairment, as shown in the table at Note 12 ‘Trade and other receivables’.
The Authority follows stringent credit control and management procedures in reviewing and monitoring debtor accounts and outstanding balances as evidenced by the improvement in historical aged debtor balances. In addition, management of receivable balances includes frequent monitoring thereby minimising the Authority’s exposure to bad debts. For financial assets that are either past due or impaired, refer to note 12 ‘Trade and other receivables’.
113Port Hedland Port Authority – Annual Report 2013
Notes to the Financial Statements For the year ended 30 June 2013
The Authority has very low levels of default. Aged accounts receivable and key debts are reviewed monthly by the Board and legal action instigated if necessary. There has been no case where this action was necessary in the current year and only one in the prior year.
The Authority’s credit risk management is further supported by rental agreements and sections 116 & 117 of the Port Authorities Act 1999. Section 116 refers to the liability to pay port charges in respect of vessels and Section 117 refers to the liability to pay port charges in respect of goods. Port charges are defined in Section 115.
BHP Billiton (BHPB) is one of the world’s largest diversified resource companies. The Authority has a commercial arrangement with BHPB - MNJV RGP6 Temporary Works Deed that clearly sets out each parties rights. While the Authority has a concentration risk associated with the large receivable that ensues from this deed, the risk is controlled by management by monitoring BHPB’s financial position, maintaining positive business relationships with BHPB and managing the factors which attach to its rights under the deed. On this basis, the residual concentration risk is felt to be satisfactorily managed.
Liquidity risk
Liquidity risk is the risk that the Authority will not be able to meet its financial obligations as they fall due.
The Authority’s objective is to maintain a balance between continuity of funding and flexibility through the use of cash reserves and its borrowing facilities. The Authority manages its exposure to liquidity risk by ensuring appropriate procedures are in place to manage cash flows, including monitoring forecast cash
flows to ensure that sufficient funds are available to meet its commitments as and when they fall due.
Market risk
The Authority does not trade in foreign currency and is not materially exposed to other price risks (for example, equity securities or commodity price changes). The Authority’s exposure to market risk for changes in interest rates relates primarily to cash and cash equivalents. The Authority’s borrowings are all obtained through the Western Australian Treasury Corporation (WATC) and are at fixed rates with varying maturity dates. The risk is managed by WATC through portfolio diversification and variation in maturity dates.
Cash flow sensitivity analysis
Fair value sensitivity analysis for financial instruments.
The Authority does not account for any fixed rate financial assets and liabilities at fair value through profit or loss. Therefore a change in interest rates at the end of the reporting period would not affect profit and loss.
The Authority’s policy is to manage its finance costs through diversification and variation in maturity dates with the objective of achieving optimum returns whilst managing interest rate risk to avoid uncertainty and volatility in the market place.
The Authority constantly analyses its interest rate exposure. Within this analysis consideration is given to potential renewals of existing positions and alternative financing structures.

114
Notes to the Financial Statements For the year ended 30 June 2013
At the reporting date, if interest rates had moved as illustrated in the table below, with all other variables held constant, the effect would be as follows:
2012/13
Carrying amount ($’000)
-1% change Profit
($’000)
+1% change Profit
($’000)
Interest rate sensitivity analysis
Financial assets
Cash and cash equivalents 34,912 (349) 349
2011/12
Carrying amount ($’000)
-1% change Profit
($’000)
+1% change Profit
($’000)
Interest rate sensitivity analysis
Financial assets
Cash and cash equivalents 77,778 (778) 778
Categories of financial instruments
Set out below are the carrying amounts of the Authority’s financial instruments. The Directors consider the carrying amounts of the financial instruments represent their fair values unless otherwise disclosed.
2013$’000
2012$’000
Financial assets
Cash and cash equivalents 34,912 77,778
Deposits 62,000 -
Loans and receivables 77,180 75,856
174,092 153,634
Financial liabilities
Interest bearing liabilities 204,700 208,700
Trade and other payables 21,410 22,650
226,110 231,350

115Port Hedland Port Authority – Annual Report 2013
Notes to the Financial Statements For the year ended 30 June 2013
The risk implied from the values shown in the table below reflects cash inflows and outflows. Leasing obligations, trade payables and other financial liabilities mainly originate from the financing of assets used in the ongoing operations such as property, plant and equipment and investments in working capital e.g. inventories and trade receivables. These assets are considered in the Authority’s overall liquidity risk.
The table below reflects the contractual maturity of financial liabilities. The table includes both principal and interest cash flows.
Risk associated with the liability on borrowings is reduced by the Authority paying a guarantee charge. This charge guarantees payment to the WATC by the Government for outstanding borrowings in case of default.
2013$’000
2012$’000
Composition and maturity analysis
Financial Liabilities are expected to be paid as follows:
Less than 6 months 21,424 23,541
6 months to 1 year 24,125 8,884
1 to 5 years 109,157 118,540
Over 5 years 113,707 140,060
268,413 291,025
2013
Weighted average effective
interest rate
Interest bearing$’000
Non-interest bearing $’000
Total $’000
Financial assets and liabilities
Cash and cash equivalents 3.81% 34,911 1 34,912
Deposits - 62,000 - 62,000
Receivables - - 31,398 31,398
Other receivables - - 45,782 45,782
Interest bearing borrowings 4.28% (204,700) - (204,700)
Trade and other payables - - (17,300) (17,300)
2012
Weighted average effective
interest rate
Interest bearing$’000
Non-interest bearing $’000
Total $’000
Financial assets and liabilities
Cash and cash equivalents 3.65% 77,777 1 77,778
Receivables - - 33,496 33,496
Other receivables - - 42,360 42,360
Interest bearing borrowings 5.06% (208,700) - (208,700)
Trade and other payables - - (18,657) (18,657)

116
Notes to the Financial Statements For the year ended 30 June 2013
Fair values
All financial assets and liabilities recognised in the statement of financial position, whether they are carried at amortised cost or fair value, are recognised at amounts that represent a reasonable approximation of fair value unless otherwise disclosed.
The fair value of a financial asset or financial liability is the amount at which the asset could be exchanged or the liability settled in a current transaction between willing parties after allowing for transaction costs.
Carrying Amount
2013$’000
Fair Value 2013
$’000
Carrying Amount
2012$’000
Fair Value 2012$’000
Borrowings from WATC 204,700 210,775 208,700 217,139
The fair value of borrowings is estimated by discounting expected principal and interest cash flows at the interest rate at the measurement date.
Other than the above, the carrying amounts of financial assets and liabilities included in the balance sheet approximate their fair values due to their short terms of maturity.
23. Remuneration of auditors
Remuneration payable to the Auditor General in respect to the audit for the current financial year is as follows:
2013$’000
2012$’000
Auditing the accounts and the financial statements 46 37
24. Contingencies
Contingent liabilities
Under the Contaminated Sites Act 2003, the Authority is required to report known and suspected contaminated sites to the Department of Environment and Conservation (DEC). In accordance with the Act, DEC classifies these sites on the basis of the risk to human health, the environment and environmental values. During the reporting period, a section of land vested in Port Hedland Port Authority was listed under the Contaminated Sites Act as Contaminated-Remediation Required. Where sites are classified as contaminated – remediation required or possibly contaminated – investigation required, the Authority may have a liability in respect of investigation or remediation expenses. Port Hedland Port Authority has made previous submissions under the Act and is working with the lessees and specialist consultants to investigate and manage the remediation requirements.

117Port Hedland Port Authority – Annual Report 2013
Notes to the Financial Statements For the year ended 30 June 2013
25. Expense Commitments
2013$’000
2012$’000
Service contracts – Port operations
Within one year 38,820 34,026
Later than one year but not later than five years 155,544 166,275
Later than five years 21,491 -
Total 215,855 200,301
Capital commitments
Within one year 4,720 3,580
Later than one year but not later than five years - -
Later than five years - -
Total 4,720 3,580
Operating lease commitments
Within one year 515 316
Later than one year but not later than five years 719 261
Later than five years - -
Total 1,234 577
Operating lease commitments - leased in employee housing
Within one year 6,143 6,246
Later than one year but not later than five years 5,986 7,729
Later than five years 1,550 2,131
Total 13,679 16,106
26. Revenue Commitments
Long Term Property Leases
Properties are leased to proponents under operating leases with lease payments in accordance with the terms of their respective lease agreements. Minimum lease payments receivable on property leases are as follows:
2013$’000
2012$’000
Within one year 14,738 18,703
Later than one year but not later than five years 67,938 92,827
Later than five years (Up to 50 years) 417,934 337,139
Total 500,610 448,669

118
Notes to the Financial Statements For the year ended 30 June 2013
27. Notes to Statement of Cash Flows
Reconciliation of profit after income tax to net cash inflow from operating activities
2013$’000
2012$’000
Net Profit 45,811 32,314
Depreciation expense 18,960 18,353
Net loss on sale of non-current assets 98 156
Change in assets and liabilities:
Trade debtors (1,325) (13,289)
Inventory 279 (13)
Future tax benefits (1,336) (1,712)
Prepayments (102) 112
Trade creditors 1,897 1,802
Land rehabilitation liability 2,661 5,680
Accrued expenses 816 1,563
Prepaid revenue (11,012) (10,712)
Provision for income tax (5,375) 22,374
Provision for deferred income tax 567 (996)
Provision for employee entitlements 747 300
52,686 55,932
28. Related Parties
Directors
Mr. J Tapp is a Director of the PHPA Board and a previous employee of Fortescue Metals Group Pty Ltd.
Mr. P Wilshaw resigned as a Director of the PHPA Board on 31 March 2013 and was an employee of BHP Billiton Iron Ore Pty Ltd.
Mr. M Dowd is the Alternate Director to Mr. Peter Wilshaw and is an employee of BHP Billiton Iron Ore Ltd.
Both BHPB and FMG use port facilities for the export of iron ore commodities and the terms of trade offered to these customers are equivalent to those offered to all other port users.
BHPB and FMG are leaseholders of the Authority, and the lease agreements are based on normal commercial terms and conditions.
Details of other Directors and key management personnel are set out in the Directors Report.
Remuneration Benefits
Information on remuneration of Directors is disclosed in the Directors’ Report.

119Port Hedland Port Authority – Annual Report 2013
Notes to the Financial Statements For the year ended 30 June 2013
29. Subsequent events
There has not arisen in the interval between the end of the financial year and the date of this report any item, transaction or event of a material and unusual nature likely, in the opinion of the directors of the Authority, to affect significantly the operations of the Authority, the results of those operations, or the state of affairs of the Authority, in future financial years.
In addition to the key performance indicators provided, the following financial performance indicators, which are not subject to audit, are provided to assist users to assess the financial management performance of the Port Hedland Port Authority. The indicators selected are considered appropriate for use in either evaluating the performance of a Government Trading Enterprise or an entity in the private sector.

Port Hedland Locked Bag 2 PORT HEDLAND WESTERN AUSTRALIA 6721 Tel: (08) 9173 0000
Perth
Level 1, 1195 Hay Street WEST PERTH WESTERN AUSTRALIA 6005 Tel: (08) 9212 8100
Email: [email protected]
www.phpa.com.au