Embed Size (px)
Citation preview

Supplementary Information
Thermally reversible DNA and PEG nanoparticle gels with tuneable porosity showing structural colour
Z. Ruff,a,b P. Cloetens,c T. O’Neill,a C. P. Grey, b and E. Eisera
a University of Cambridge, Cavendish Laboratory, JJ Thompson Ave, Cambridge CB3 OHE
b University of Cambridge, Department of Chemistry, Lensfield Rd, Cambridge, CB2 1EW
Electronic Supplementary Material (ESI) for Physical Chemistry Chemical Physics.This journal is © the Owner Societies 2017

Chord analysis technique
Chord analysis was used to characterize the length-scales of both the colloid-rich gel branches and the colloid-free pores in the confocal micrographs of the homogenized PEG-NP and DNA-NP gels.1, 2 The diagram in figure S1 summarizes the technique.
Figure S1: Diagram depicting the chord analysis procedure. (A) A “raw” microscopy image is taken using confocal microscopy. (B) The image is blurred using a Gaussian filter, such that the image pixel size is averaged to the optical diffraction limit in the x-y plane. (C) The image is binarized using a built-in Mathematica function based on the “Otsu” method3. (D) The lengths of the chords are measured in both the x and y dimensions for both the pores (black) and the colloid-rich (white) phases individually. (E) The histogram of the measured chord lengths in both the x and y dimensions is normalized and fitted with an exp(-λr) dependence. Scale bar is 10µm and applies to all micrographs.
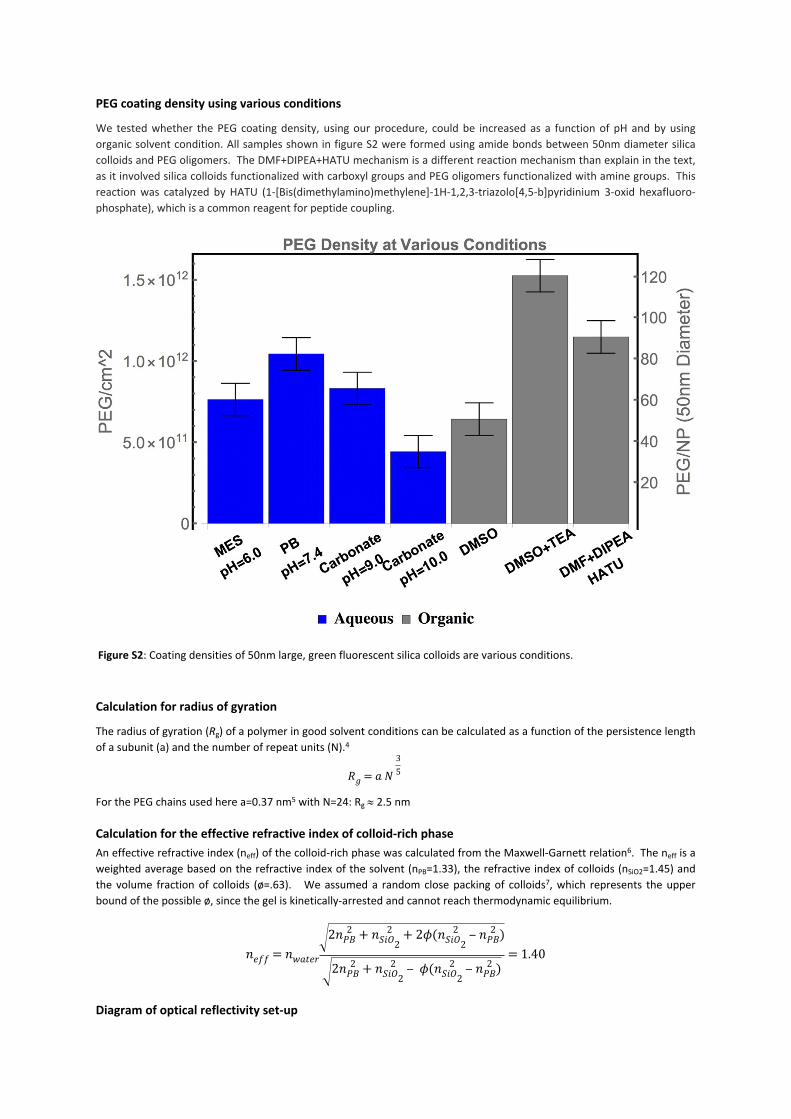
PEG coating density using various conditions
We tested whether the PEG coating density, using our procedure, could be increased as a function of pH and by using organic solvent condition. All samples shown in figure S2 were formed using amide bonds between 50nm diameter silica colloids and PEG oligomers. The DMF+DIPEA+HATU mechanism is a different reaction mechanism than explain in the text, as it involved silica colloids functionalized with carboxyl groups and PEG oligomers functionalized with amine groups. This reaction was catalyzed by HATU (1-[Bis(dimethylamino)methylene]-1H-1,2,3-triazolo[4,5-b]pyridinium 3-oxid hexafluoro-phosphate), which is a common reagent for peptide coupling.
Calculation for radius of gyration
The radius of gyration (Rg) of a polymer in good solvent conditions can be calculated as a function of the persistence length of a subunit (a) and the number of repeat units (N).4
𝑅𝑔 = 𝑎 𝑁 35
For the PEG chains used here a=0.37 nm5 with N=24: Rg 2.5 nm
Calculation for the effective refractive index of colloid-rich phaseAn effective refractive index (neff) of the colloid-rich phase was calculated from the Maxwell-Garnett relation6. The neff is a weighted average based on the refractive index of the solvent (nPB=1.33), the refractive index of colloids (nSiO2=1.45) and the volume fraction of colloids (ø=.63). We assumed a random close packing of colloids7, which represents the upper bound of the possible ø, since the gel is kinetically-arrested and cannot reach thermodynamic equilibrium.
𝑛𝑒𝑓𝑓 = 𝑛𝑤𝑎𝑡𝑒𝑟
2𝑛 2𝑃𝐵 + 𝑛 2
𝑆𝑖𝑂2+ 2𝜙(𝑛 2
𝑆𝑖𝑂2‒ 𝑛 2
𝑃𝐵)
2𝑛 2𝑃𝐵 + 𝑛 2
𝑆𝑖𝑂2‒ 𝜙(𝑛 2
𝑆𝑖𝑂2‒ 𝑛 2
𝑃𝐵)= 1.40
Diagram of optical reflectivity set-up
Figure S2: Coating densities of 50nm large, green fluorescent silica colloids are various conditions.
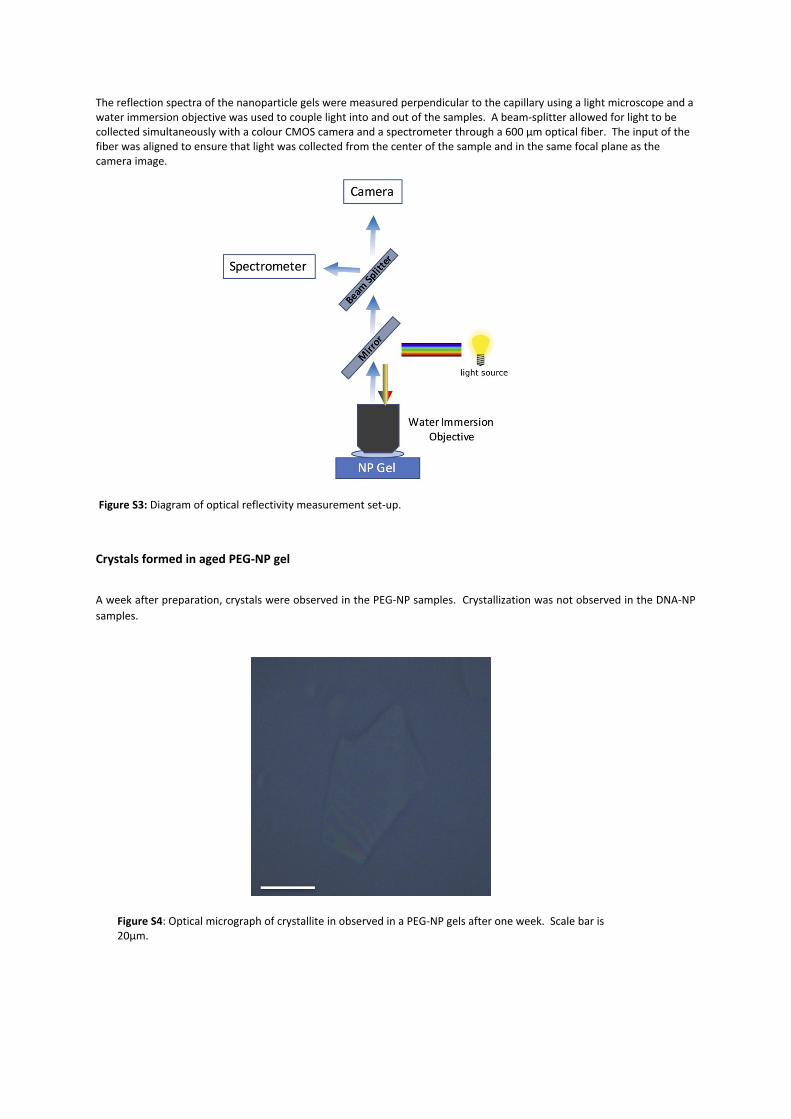
The reflection spectra of the nanoparticle gels were measured perpendicular to the capillary using a light microscope and a water immersion objective was used to couple light into and out of the samples. A beam-splitter allowed for light to be collected simultaneously with a colour CMOS camera and a spectrometer through a 600 µm optical fiber. The input of the fiber was aligned to ensure that light was collected from the center of the sample and in the same focal plane as the camera image.
Crystals formed in aged PEG-NP gel
A week after preparation, crystals were observed in the PEG-NP samples. Crystallization was not observed in the DNA-NP samples.
Figure S4: Optical micrograph of crystallite in observed in a PEG-NP gels after one week. Scale bar is 20µm.
Figure S3: Diagram of optical reflectivity measurement set-up.

Optical reflection spectroscopy of gels referenced to a white diffuser
The optical reflectivity of the PEG-NP and DNA-NP gels shown in the text are referenced to a capillary filled with phosphate buffered saline to minimize the effects of reflections from the capillary interfaces. To compare the magnitude of our reflectivity measurements to other works, we show the reflectivity of our gel samples (in glass capillaries) referenced to a white diffuser standard. The magnitude of the gels’ reflection spectrum referenced to the white diffuser is on the order of a single percent.
Enlarged micrograph of DNA-NP gel reflection
Micrographs taken of the PEG-NP and DNA-NP gels have different colours on the length-scale of the camera pixels. The speckling of the image shows the variety of local environments in the nanoparticle gel. This micrograph was enlarged 5 times with respect to the micrograph in figure 7 of the main text.
PEG-NP Phase Transition
Figure S6: Camera image of the optical reflection DNA-NP at ø=35% (right), expanded 5x from the image in figure 7. Scale bar is 10 µm and the image is 500 pixels by 500 pixels.
Figure S5: Optical reflection spectroscopy of the PEG-NP (left) and DNA-NP (right) at different ø referenced to the white diffuser.
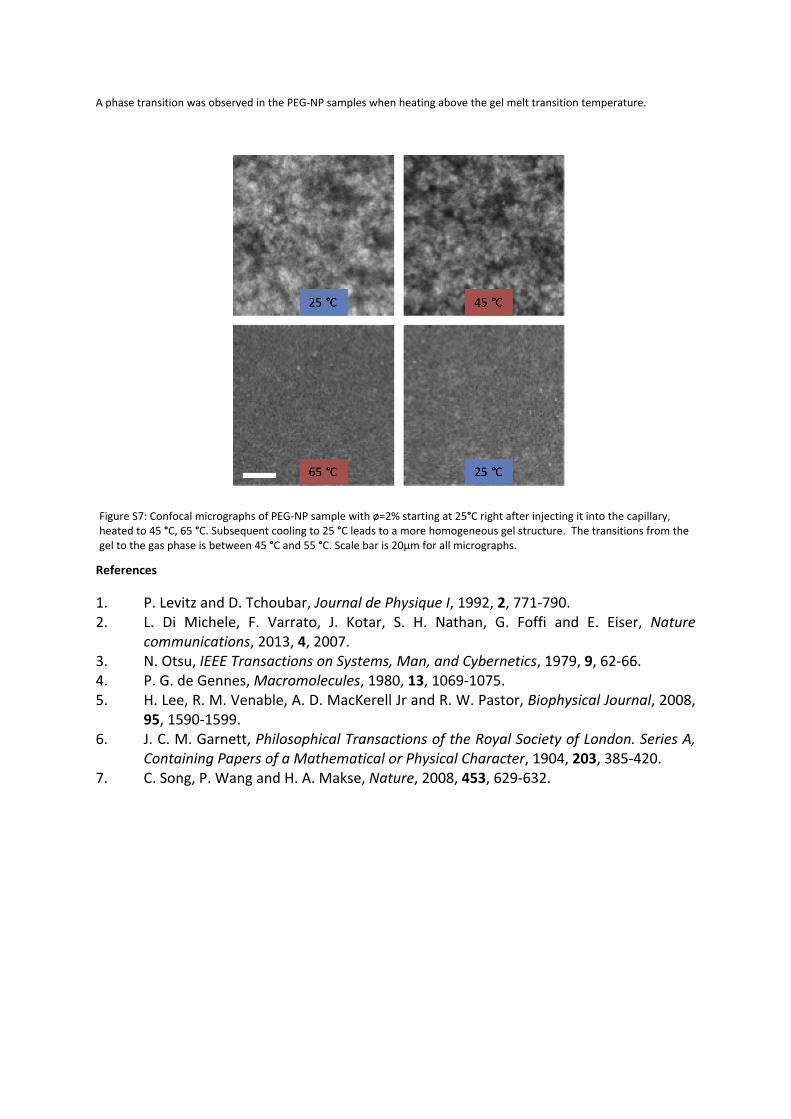
A phase transition was observed in the PEG-NP samples when heating above the gel melt transition temperature.
References
1. P. Levitz and D. Tchoubar, Journal de Physique I, 1992, 2, 771-790.2. L. Di Michele, F. Varrato, J. Kotar, S. H. Nathan, G. Foffi and E. Eiser, Nature
communications, 2013, 4, 2007.3. N. Otsu, IEEE Transactions on Systems, Man, and Cybernetics, 1979, 9, 62-66.4. P. G. de Gennes, Macromolecules, 1980, 13, 1069-1075.5. H. Lee, R. M. Venable, A. D. MacKerell Jr and R. W. Pastor, Biophysical Journal, 2008,
95, 1590-1599.6. J. C. M. Garnett, Philosophical Transactions of the Royal Society of London. Series A,
Containing Papers of a Mathematical or Physical Character, 1904, 203, 385-420.7. C. Song, P. Wang and H. A. Makse, Nature, 2008, 453, 629-632.
Figure S7: Confocal micrographs of PEG-NP sample with ø=2% starting at 25°C right after injecting it into the capillary, heated to 45 °C, 65 °C. Subsequent cooling to 25 °C leads to a more homogeneous gel structure. The transitions from the gel to the gas phase is between 45 °C and 55 °C. Scale bar is 20µm for all micrographs.