Embed Size (px)
Citation preview
1
A PROFILE OF THE SOUTH AFRICAN PORK MARKET VALUE CHAIN
2017
Directorate Marketing Tel: 012 319 8455 Private Bag X 15 Fax: 012 319 8131 Arcadia E-mail:[email protected] 0007 www.daff.gov.za
TABLE OF CONTENTS
2
1. DESCRIPTION OF THE INDUSTRY ......................................................................................................... 3 1.1 Production areas...................................................................................................................................... 3 1.2. Production trends .................................................................................................................................... 4 1.3. Local consumption .................................................................................................................................. 5
1.3. Employment ............................................................................................................................................ 6 2. MARKET STRUCTURE ............................................................................................................................ 6 2.1. Domestic market ..................................................................................................................................... 6 2.2. Import-export analysis ............................................................................................................................ 7
2.3 South African export and import analysis ............................................................................................ 7 2.2.1. Exports for pork ............................................................................................................................... 7
2.2.3. Imports .......................................................................................................................................... 18 3. MARKETING CHANNELS / VALUE CHAIN ........................................................................................... 20
4. OPPORUNITIES AND CHALLENGES ................................................................................................... 23
5. STRENGTHS AND WEAKNESSES ....................................................................................................... 23
6. MARKET INTELLIGENCE ...................................................................................................................... 24 6.1. Export tariffs ......................................................................................................................................... 24 6.2. Import tariffs .......................................................................................................................................... 25
7. PERFORMANCE ANALYSIS OF SOUTH AFRICAN PORK INDUSTRY IN 2016 ................................. 26 7.1. Exports ................................................................................................................................................. 26 7.2. Imports. ................................................................................................................................................. 32
8. ACKNOWLEDGEMENTS ....................................................................................................................... 38
3
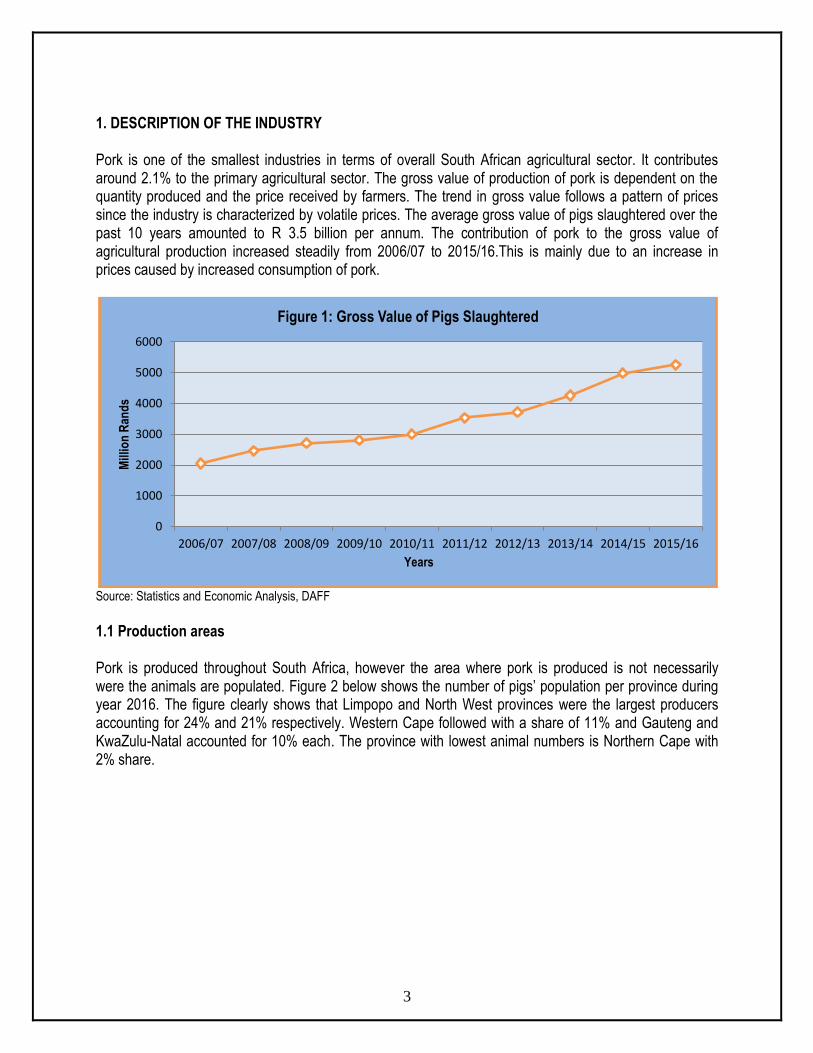
1. DESCRIPTION OF THE INDUSTRY Pork is one of the smallest industries in terms of overall South African agricultural sector. It contributes around 2.1% to the primary agricultural sector. The gross value of production of pork is dependent on the quantity produced and the price received by farmers. The trend in gross value follows a pattern of prices since the industry is characterized by volatile prices. The average gross value of pigs slaughtered over the past 10 years amounted to R 3.5 billion per annum. The contribution of pork to the gross value of agricultural production increased steadily from 2006/07 to 2015/16.This is mainly due to an increase in prices caused by increased consumption of pork.
Source: Statistics and Economic Analysis, DAFF
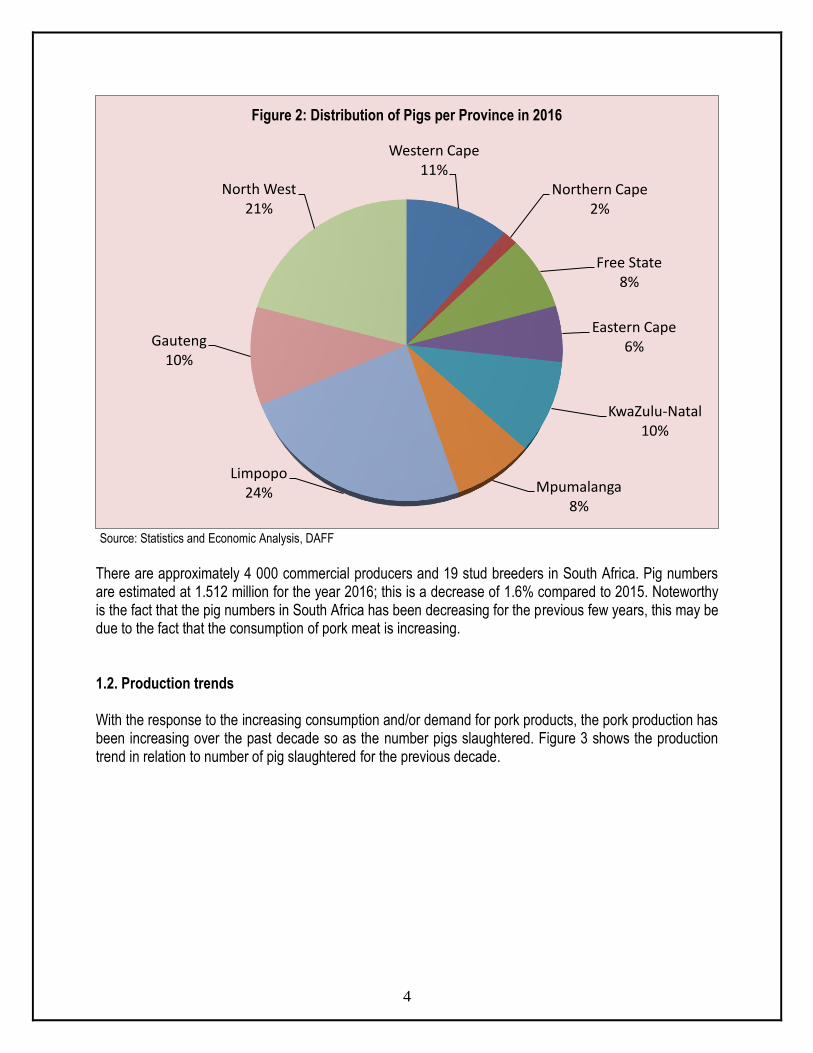
1.1 Production areas Pork is produced throughout South Africa, however the area where pork is produced is not necessarily were the animals are populated. Figure 2 below shows the number of pigs’ population per province during year 2016. The figure clearly shows that Limpopo and North West provinces were the largest producers accounting for 24% and 21% respectively. Western Cape followed with a share of 11% and Gauteng and KwaZulu-Natal accounted for 10% each. The province with lowest animal numbers is Northern Cape with 2% share.
0
1000
2000
3000
4000
5000
6000
2006/07 2007/08 2008/09 2009/10 2010/11 2011/12 2012/13 2013/14 2014/15 2015/16
Mill
ion
Ran
ds
Years
Figure 1: Gross Value of Pigs Slaughtered
4
Source: Statistics and Economic Analysis, DAFF
There are approximately 4 000 commercial producers and 19 stud breeders in South Africa. Pig numbers are estimated at 1.512 million for the year 2016; this is a decrease of 1.6% compared to 2015. Noteworthy is the fact that the pig numbers in South Africa has been decreasing for the previous few years, this may be due to the fact that the consumption of pork meat is increasing. 1.2. Production trends With the response to the increasing consumption and/or demand for pork products, the pork production has been increasing over the past decade so as the number pigs slaughtered. Figure 3 shows the production trend in relation to number of pig slaughtered for the previous decade.
Western Cape11%
Northern Cape2%
Free State8%
Eastern Cape6%
KwaZulu-Natal10%
Mpumalanga8%
Limpopo24%
Gauteng10%
North West21%
Figure 2: Distribution of Pigs per Province in 2016

5
Source: Statistics and Economic Analysis, DAFF During the past decade, above 26 million pigs were slaughtered yielding more than 2 million tons of pork meat. On average, 2.6 million pigs were slaughtered and produced an average of 212 100 tons per year for the period under analysis. As illustrated, from 2006/07 to 2007/08 the slaughtering shown a decreasing trend and from 2008/09 to 2015/16 the trend was increasing this shows that there may be improvements on the pork production efficiency. 1.3. Local consumption Figure 4 below depicts local consumption of pork comparing it to the total production for the past decade to determine if the country is self-sufficient in terms of pork production.
500
1 000
1 500
2 000
2 500
3 000
3 500
0,0
50,0
100,0
150,0
200,0
250,0
300,0
Sla
ug
hte
red
(1
000)
Th
ou
san
d t
on
sFigure 3: Pork production and Pig slaughtered
Production Slaughterings
3,6
3,8
4
4,2
4,4
4,6
4,8
5
0,0
50,0
100,0
150,0
200,0
250,0
300,0
2006/072007/082008/092009/102010/112011/122012/132013/142014/152015/16
Kg1
00
0 t
Figure 4: Pork Production, Consumption and Per capita consumption
Production Consumption Per Capita Consumption
6
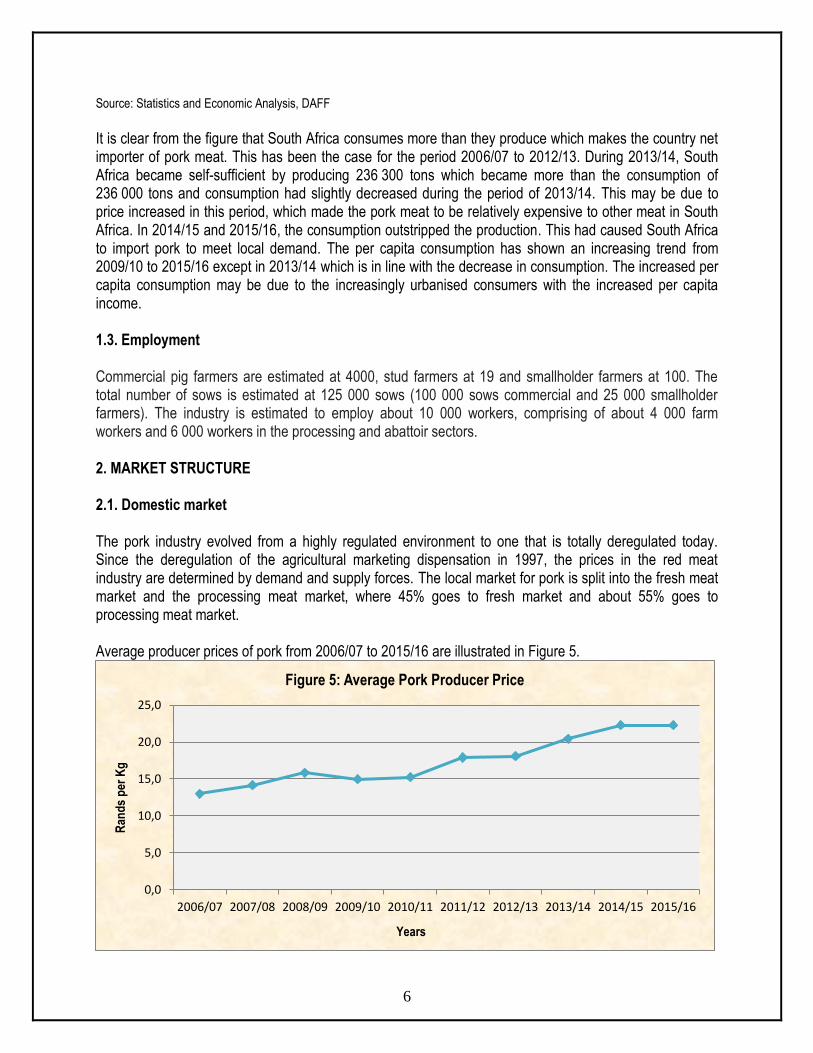
Source: Statistics and Economic Analysis, DAFF It is clear from the figure that South Africa consumes more than they produce which makes the country net importer of pork meat. This has been the case for the period 2006/07 to 2012/13. During 2013/14, South Africa became self-sufficient by producing 236 300 tons which became more than the consumption of 236 000 tons and consumption had slightly decreased during the period of 2013/14. This may be due to price increased in this period, which made the pork meat to be relatively expensive to other meat in South Africa. In 2014/15 and 2015/16, the consumption outstripped the production. This had caused South Africa to import pork to meet local demand. The per capita consumption has shown an increasing trend from 2009/10 to 2015/16 except in 2013/14 which is in line with the decrease in consumption. The increased per capita consumption may be due to the increasingly urbanised consumers with the increased per capita income. 1.3. Employment Commercial pig farmers are estimated at 4000, stud farmers at 19 and smallholder farmers at 100. The total number of sows is estimated at 125 000 sows (100 000 sows commercial and 25 000 smallholder farmers). The industry is estimated to employ about 10 000 workers, comprising of about 4 000 farm workers and 6 000 workers in the processing and abattoir sectors. 2. MARKET STRUCTURE 2.1. Domestic market The pork industry evolved from a highly regulated environment to one that is totally deregulated today. Since the deregulation of the agricultural marketing dispensation in 1997, the prices in the red meat industry are determined by demand and supply forces. The local market for pork is split into the fresh meat market and the processing meat market, where 45% goes to fresh market and about 55% goes to processing meat market. Average producer prices of pork from 2006/07 to 2015/16 are illustrated in Figure 5.
0,0
5,0
10,0
15,0
20,0
25,0
2006/07 2007/08 2008/09 2009/10 2010/11 2011/12 2012/13 2013/14 2014/15 2015/16
Ran
ds
per
Kg
Years
Figure 5: Average Pork Producer Price
7
Source: Statistics and Economic Analysis, DAFF
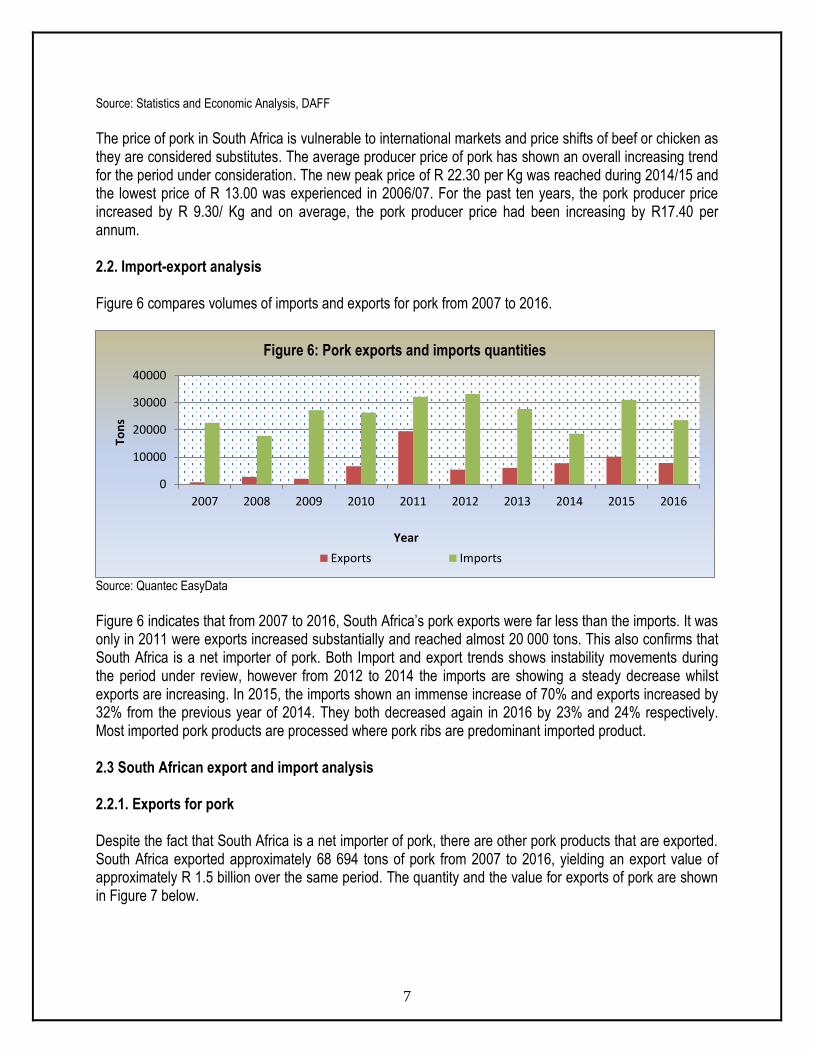
The price of pork in South Africa is vulnerable to international markets and price shifts of beef or chicken as they are considered substitutes. The average producer price of pork has shown an overall increasing trend for the period under consideration. The new peak price of R 22.30 per Kg was reached during 2014/15 and the lowest price of R 13.00 was experienced in 2006/07. For the past ten years, the pork producer price increased by R 9.30/ Kg and on average, the pork producer price had been increasing by R17.40 per annum. 2.2. Import-export analysis Figure 6 compares volumes of imports and exports for pork from 2007 to 2016.
Source: Quantec EasyData
Figure 6 indicates that from 2007 to 2016, South Africa’s pork exports were far less than the imports. It was only in 2011 were exports increased substantially and reached almost 20 000 tons. This also confirms that South Africa is a net importer of pork. Both Import and export trends shows instability movements during the period under review, however from 2012 to 2014 the imports are showing a steady decrease whilst exports are increasing. In 2015, the imports shown an immense increase of 70% and exports increased by 32% from the previous year of 2014. They both decreased again in 2016 by 23% and 24% respectively. Most imported pork products are processed where pork ribs are predominant imported product. 2.3 South African export and import analysis
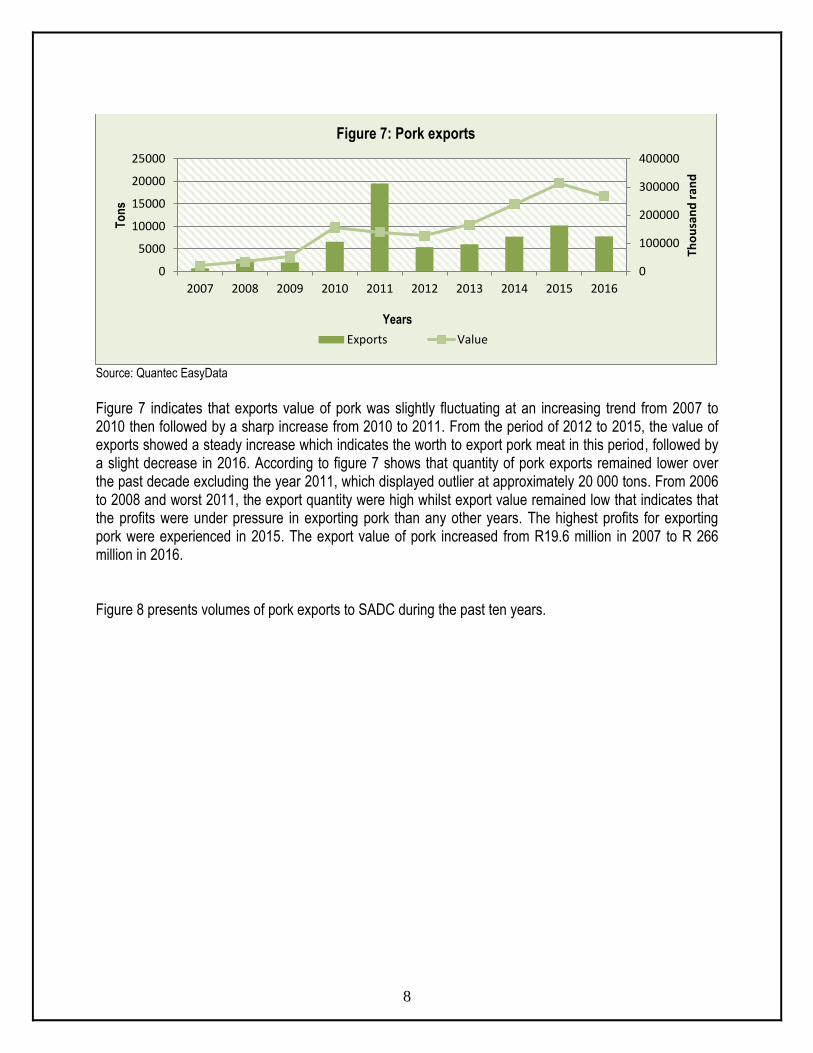
2.2.1. Exports for pork Despite the fact that South Africa is a net importer of pork, there are other pork products that are exported. South Africa exported approximately 68 694 tons of pork from 2007 to 2016, yielding an export value of approximately R 1.5 billion over the same period. The quantity and the value for exports of pork are shown in Figure 7 below.
0
10000
20000
30000
40000
2007 2008 2009 2010 2011 2012 2013 2014 2015 2016
Ton
s
Year
Figure 6: Pork exports and imports quantities
Exports Imports
8
Source: Quantec EasyData
Figure 7 indicates that exports value of pork was slightly fluctuating at an increasing trend from 2007 to 2010 then followed by a sharp increase from 2010 to 2011. From the period of 2012 to 2015, the value of exports showed a steady increase which indicates the worth to export pork meat in this period, followed by a slight decrease in 2016. According to figure 7 shows that quantity of pork exports remained lower over the past decade excluding the year 2011, which displayed outlier at approximately 20 000 tons. From 2006 to 2008 and worst 2011, the export quantity were high whilst export value remained low that indicates that the profits were under pressure in exporting pork than any other years. The highest profits for exporting pork were experienced in 2015. The export value of pork increased from R19.6 million in 2007 to R 266 million in 2016. Figure 8 presents volumes of pork exports to SADC during the past ten years.
0
100000
200000
300000
400000
0
5000
10000
15000
20000
25000
2007 2008 2009 2010 2011 2012 2013 2014 2015 2016
Tho
usa
nd
ran
d
To
ns
Years
Figure 7: Pork exports
Exports Value

9
Source: Quantec EasyData
South African pork is mainly exported to SADC countries. The highest exports of pork experienced in 2008 and 2015 were mainly exported to Malawi and Mozambique respectively. Mozambique demanded the greatest share of pork exported by South Africa during the period under analysis followed by Malawi and Zimbabwe. United Republic of Tanzania and Seychelles recorded the lowest shares of South Africa pork exports during the period under review. During 2016, Mozambique has decreased its intake of South African pork by 18% within SADC from previous year. However, it commanded a share of 82% followed by DRC and Zambia with a share of 7% and 4.7% respectively. The rest of the countries within SADC shared the remaining 6%.
0
500000
1000000
1500000
2000000
2500000
3000000
2007 2008 2009 2010 2011 2012 2013 2014 2015 2016
Kilo
gra
ms
Figure 8: South African pork exports to SADC
Angola DRC Mauritius
Malawi Mozambique Seychelles
United Republic of Tanzania Zambia Zimbabwe
10
Source: Quantec EasyData
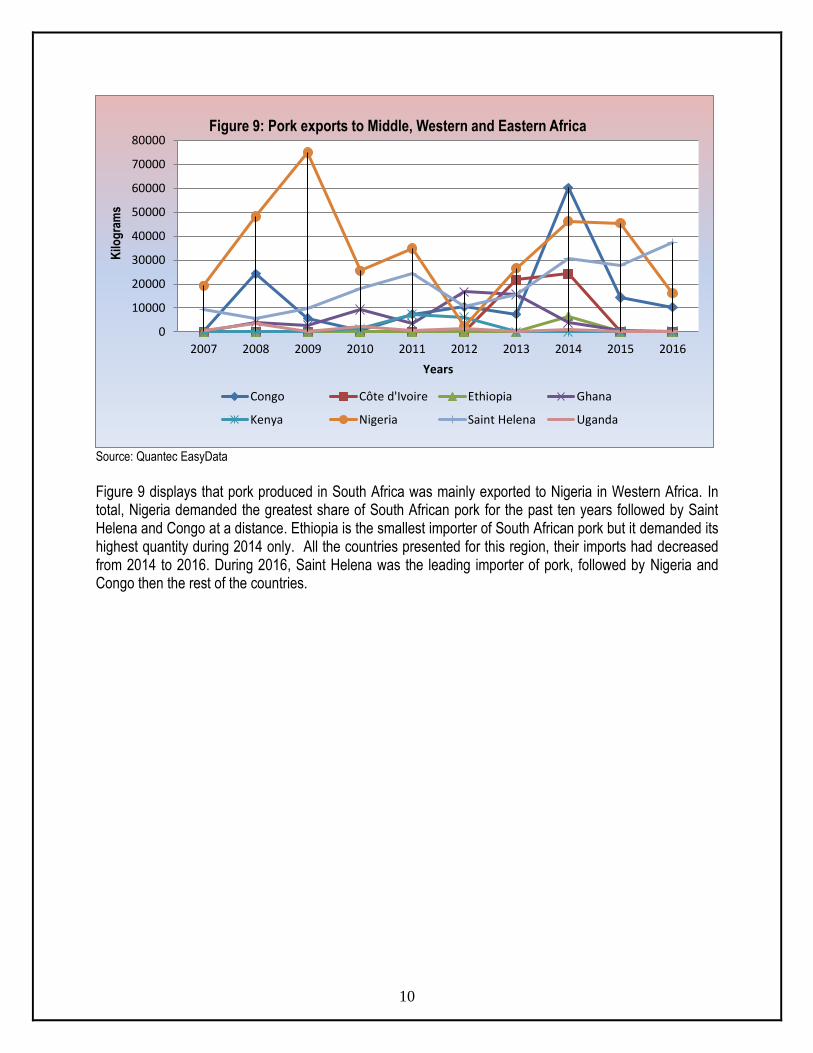
Figure 9 displays that pork produced in South Africa was mainly exported to Nigeria in Western Africa. In total, Nigeria demanded the greatest share of South African pork for the past ten years followed by Saint Helena and Congo at a distance. Ethiopia is the smallest importer of South African pork but it demanded its highest quantity during 2014 only. All the countries presented for this region, their imports had decreased from 2014 to 2016. During 2016, Saint Helena was the leading importer of pork, followed by Nigeria and Congo then the rest of the countries.
0
10000
20000
30000
40000
50000
60000
70000
80000
2007 2008 2009 2010 2011 2012 2013 2014 2015 2016
Kilo
gra
ms
Years
Figure 9: Pork exports to Middle, Western and Eastern Africa
Congo Côte d'Ivoire Ethiopia Ghana
Kenya Nigeria Saint Helena Uganda

11
Source: Trade Map
It is noted that South African pork is exported within the continent, mostly to SADC countries, which constitutes 94% of the total pork exports. Namibia is the greatest commander of South African pork, leading by 29% followed by Mozambique with 27%, Lesotho with 15%, Botswana and Swaziland with 12% and 6% respectively. Values of pork exports from various provinces of South Africa are presented in Figure 11.
Namibia29%
Mozambique27%
Lesotho15%
Botswana12%
Swaziland6%
DRC2%
Hong Kong, China2%
Zambia2%
Zimbabwe1%
Other4%
Figure 10: South African pork destination in 2016
12
Source: Quantec EasyData
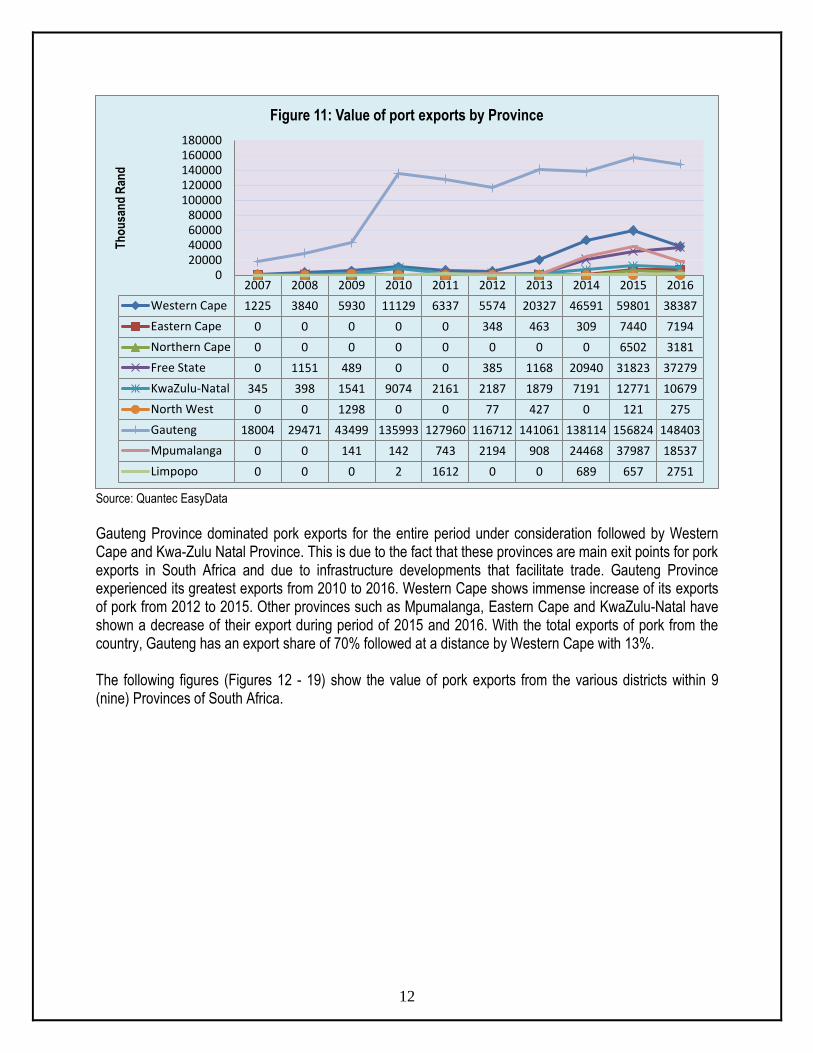
Gauteng Province dominated pork exports for the entire period under consideration followed by Western Cape and Kwa-Zulu Natal Province. This is due to the fact that these provinces are main exit points for pork exports in South Africa and due to infrastructure developments that facilitate trade. Gauteng Province experienced its greatest exports from 2010 to 2016. Western Cape shows immense increase of its exports of pork from 2012 to 2015. Other provinces such as Mpumalanga, Eastern Cape and KwaZulu-Natal have shown a decrease of their export during period of 2015 and 2016. With the total exports of pork from the country, Gauteng has an export share of 70% followed at a distance by Western Cape with 13%. The following figures (Figures 12 - 19) show the value of pork exports from the various districts within 9 (nine) Provinces of South Africa.
2007 2008 2009 2010 2011 2012 2013 2014 2015 2016
Western Cape 1225 3840 5930 11129 6337 5574 20327 46591 59801 38387
Eastern Cape 0 0 0 0 0 348 463 309 7440 7194
Northern Cape 0 0 0 0 0 0 0 0 6502 3181
Free State 0 1151 489 0 0 385 1168 20940 31823 37279
KwaZulu-Natal 345 398 1541 9074 2161 2187 1879 7191 12771 10679
North West 0 0 1298 0 0 77 427 0 121 275
Gauteng 18004 29471 43499 135993 127960 116712 141061 138114 156824 148403
Mpumalanga 0 0 141 142 743 2194 908 24468 37987 18537
Limpopo 0 0 0 2 1612 0 0 689 657 2751
020000400006000080000
100000120000140000160000180000
Th
ou
san
d R
and
Figure 11: Value of port exports by Province
13
Source: Quantec EasyData
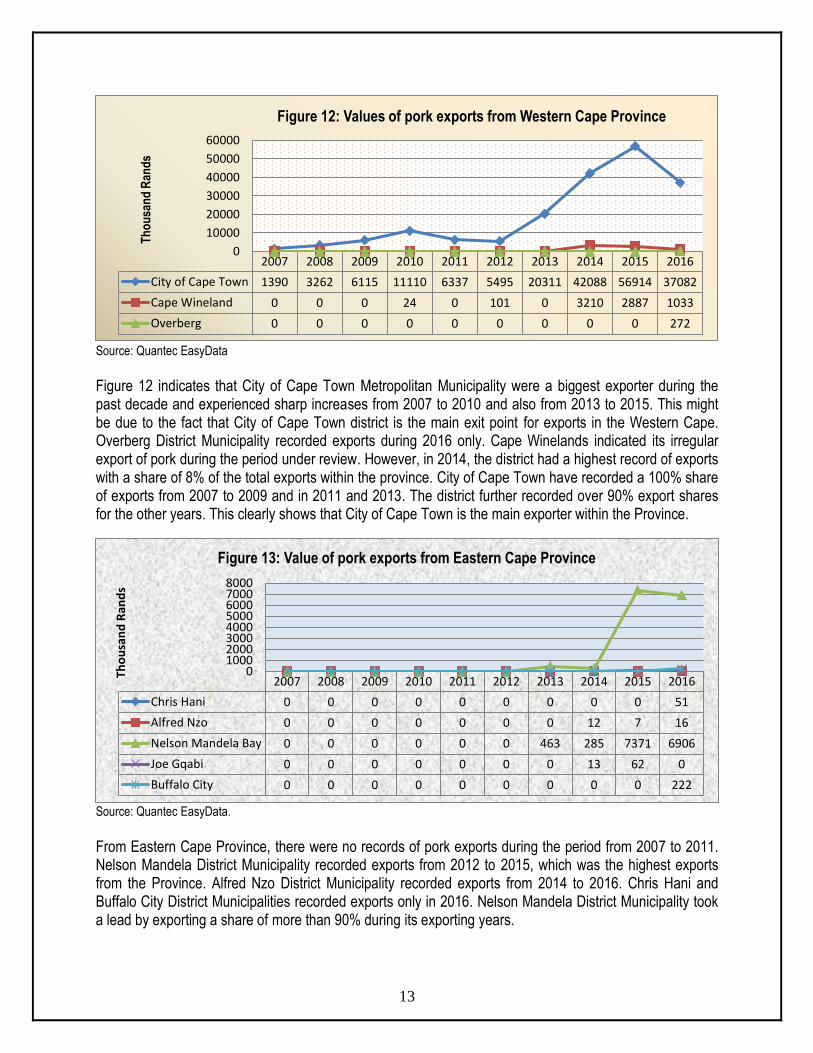
Figure 12 indicates that City of Cape Town Metropolitan Municipality were a biggest exporter during the past decade and experienced sharp increases from 2007 to 2010 and also from 2013 to 2015. This might be due to the fact that City of Cape Town district is the main exit point for exports in the Western Cape. Overberg District Municipality recorded exports during 2016 only. Cape Winelands indicated its irregular export of pork during the period under review. However, in 2014, the district had a highest record of exports with a share of 8% of the total exports within the province. City of Cape Town have recorded a 100% share of exports from 2007 to 2009 and in 2011 and 2013. The district further recorded over 90% export shares for the other years. This clearly shows that City of Cape Town is the main exporter within the Province.
Source: Quantec EasyData.
From Eastern Cape Province, there were no records of pork exports during the period from 2007 to 2011. Nelson Mandela District Municipality recorded exports from 2012 to 2015, which was the highest exports from the Province. Alfred Nzo District Municipality recorded exports from 2014 to 2016. Chris Hani and Buffalo City District Municipalities recorded exports only in 2016. Nelson Mandela District Municipality took a lead by exporting a share of more than 90% during its exporting years.
2007 2008 2009 2010 2011 2012 2013 2014 2015 2016
City of Cape Town 1390 3262 6115 11110 6337 5495 20311 42088 56914 37082
Cape Wineland 0 0 0 24 0 101 0 3210 2887 1033
Overberg 0 0 0 0 0 0 0 0 0 272
0
10000
20000
30000
40000
50000
60000T
ho
usa
nd
Ran
ds
Figure 12: Values of pork exports from Western Cape Province
2007 2008 2009 2010 2011 2012 2013 2014 2015 2016
Chris Hani 0 0 0 0 0 0 0 0 0 51
Alfred Nzo 0 0 0 0 0 0 0 12 7 16
Nelson Mandela Bay 0 0 0 0 0 0 463 285 7371 6906
Joe Gqabi 0 0 0 0 0 0 0 13 62 0
Buffalo City 0 0 0 0 0 0 0 0 0 222
010002000300040005000600070008000
Tho
usa
nd
Ran
ds
Figure 13: Value of pork exports from Eastern Cape Province

14
Source: Quantec EasyData
From Free State Province, Thabo Mofutsanyane District Municipality recorded exports of pork during the period 2008 to 2009 and again from 2014 to 2016. Xhariep District Municipality recorded its exports from 2012 to 2016. Mangaung District Municipality recorded exports of pork from 2014 to 2016. During 2016, Thabo Mofutsanyane had a highest export share of 66%, followed by Mangaung with 29%. Lejweleputswa and Xhariep District Municipalities had a share of 5% and 1% respectively in the same year.
Source: Quantec EasyData
Exports of pork from KwaZulu-Natal occurred mainly in eThekwini District Municipality. Uthukela District Municipality has shown irregular pork exports during the period under analysis. iLembe District Municipality exported pork only in 2015 and 2016 for the past ten years. eThekwini District Municipality dominated the export with the highest values recorded in 2010 and 2015. This is because eThekwini District is the main
2007 2008 2009 2010 2011 2012 2013 2014 2015 2016
Xhariep 0 0 0 0 0 385 1168 262 216 29
Lejweleputswa 0 0 0 0 0 0 0 515 737 1937
Thabo Mofutsanyane 0 1152 489 0 0 0 0 13294 20720 24438
Mangaung 0 0 0 0 0 0 0 6870 10150 10876
0
5000
10000
15000
20000
25000
30000T
ho
usa
nd
Ran
ds
Figure 14: Values of pork exports from Free State Province
2007 2008 2009 2010 2011 2012 2013 2014 2015 2016
Uthukela 0 0 0 652 423 0 0 779 823 1746
eThekwini 345 398 1541 8422 1731 2187 1879 6413 11567 7482
iLembe 0 0 0 0 0 0 0 0 380 1447
0
2000
4000
6000
8000
10000
12000
14000
Th
ou
san
d R
and
s
Figure 15: Values of Pork exports from KwaZulu-Natal Province
15
exit point in KwaZulu–Natal Province for exports. On average, eThekwini had more than 90% share of pork exports within the province in the past decade.
Source: Quantec EasyData
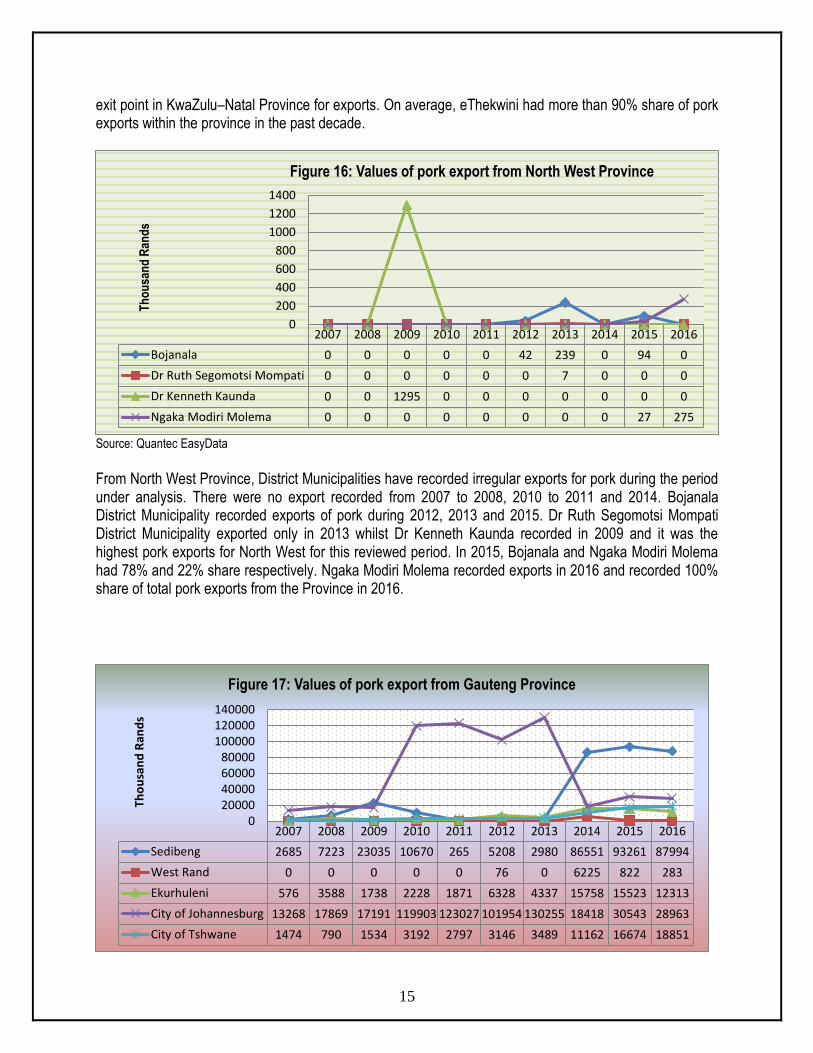
From North West Province, District Municipalities have recorded irregular exports for pork during the period under analysis. There were no export recorded from 2007 to 2008, 2010 to 2011 and 2014. Bojanala District Municipality recorded exports of pork during 2012, 2013 and 2015. Dr Ruth Segomotsi Mompati District Municipality exported only in 2013 whilst Dr Kenneth Kaunda recorded in 2009 and it was the highest pork exports for North West for this reviewed period. In 2015, Bojanala and Ngaka Modiri Molema had 78% and 22% share respectively. Ngaka Modiri Molema recorded exports in 2016 and recorded 100% share of total pork exports from the Province in 2016.
2007 2008 2009 2010 2011 2012 2013 2014 2015 2016
Bojanala 0 0 0 0 0 42 239 0 94 0
Dr Ruth Segomotsi Mompati 0 0 0 0 0 0 7 0 0 0
Dr Kenneth Kaunda 0 0 1295 0 0 0 0 0 0 0
Ngaka Modiri Molema 0 0 0 0 0 0 0 0 27 275
0
200
400
600
800
1000
1200
1400
Th
ou
san
d R
and
s
Figure 16: Values of pork export from North West Province
2007 2008 2009 2010 2011 2012 2013 2014 2015 2016
Sedibeng 2685 7223 23035 10670 265 5208 2980 86551 93261 87994
West Rand 0 0 0 0 0 76 0 6225 822 283
Ekurhuleni 576 3588 1738 2228 1871 6328 4337 15758 15523 12313
City of Johannesburg 13268 17869 17191 119903 123027 101954 130255 18418 30543 28963
City of Tshwane 1474 790 1534 3192 2797 3146 3489 11162 16674 18851
020000400006000080000
100000120000140000
Tho
usa
nd
Ran
ds
Figure 17: Values of pork export from Gauteng Province
16
Source: Quantec EasyData
From Gauteng Province, pork exports occurred mainly in City of Johannesburg, City of Tshwane, Sedibeng and Ekurhuleni District Municipalities. On average, City of Johannesburg dominated the pork exports for the entire period under review. It recorded the highest exports during the period 2010 to 2013. However, in 2014 there was decline of 85%. Noteworthy is the fact that City of Johannesburg is the main exit point for exports in South Africa. Sedibeng District Municipality has shown a steady increase of exports from 2007 until 2009 as it reached its first peak with an export value of more than R 23 million. The highest peak was reached in 2015 were the district recorded exports valued at R 93 million. These records boosted the average values of Sedibeng District Municipality to be the second highest exporter during the past decade following City of Johannesburg Metropolitan Municipality. From 2014 to 2016, Sedibeng took a lead and had the highest share (64%, 59% and 59% respectively) of total exports from the province, followed by City of Johannesburg with 14%, 19% and 20% respectively.
Source: Quantec EasyData
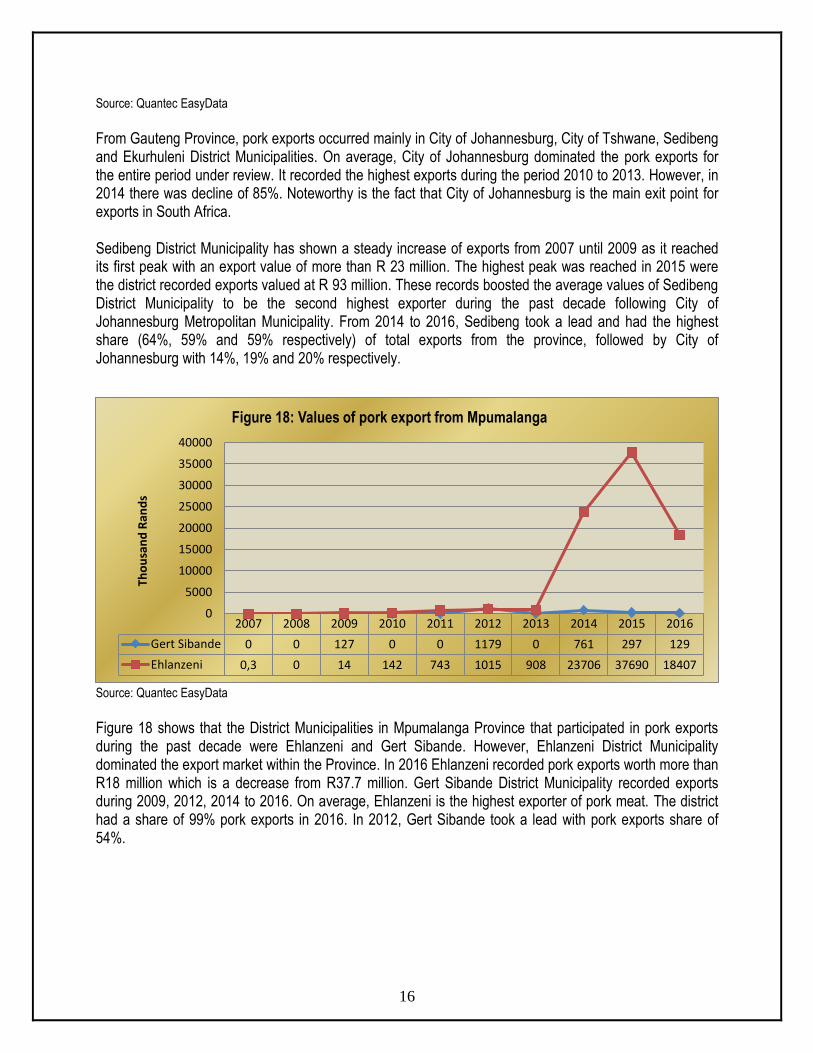
Figure 18 shows that the District Municipalities in Mpumalanga Province that participated in pork exports during the past decade were Ehlanzeni and Gert Sibande. However, Ehlanzeni District Municipality dominated the export market within the Province. In 2016 Ehlanzeni recorded pork exports worth more than R18 million which is a decrease from R37.7 million. Gert Sibande District Municipality recorded exports during 2009, 2012, 2014 to 2016. On average, Ehlanzeni is the highest exporter of pork meat. The district had a share of 99% pork exports in 2016. In 2012, Gert Sibande took a lead with pork exports share of 54%.
2007 2008 2009 2010 2011 2012 2013 2014 2015 2016
Gert Sibande 0 0 127 0 0 1179 0 761 297 129
Ehlanzeni 0,3 0 14 142 743 1015 908 23706 37690 18407
0
5000
10000
15000
20000
25000
30000
35000
40000
Tho
usa
nd
Ran
ds
Figure 18: Values of pork export from Mpumalanga
17
Source: Quantec EasyData
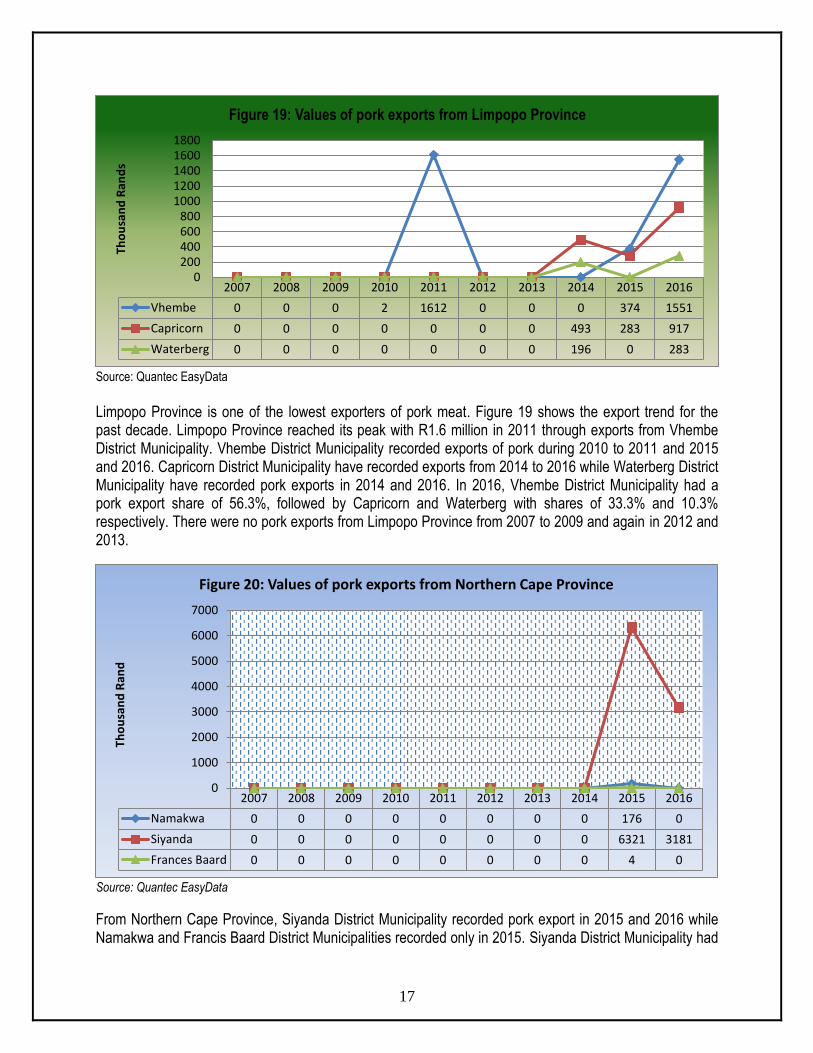
Limpopo Province is one of the lowest exporters of pork meat. Figure 19 shows the export trend for the past decade. Limpopo Province reached its peak with R1.6 million in 2011 through exports from Vhembe District Municipality. Vhembe District Municipality recorded exports of pork during 2010 to 2011 and 2015 and 2016. Capricorn District Municipality have recorded exports from 2014 to 2016 while Waterberg District Municipality have recorded pork exports in 2014 and 2016. In 2016, Vhembe District Municipality had a pork export share of 56.3%, followed by Capricorn and Waterberg with shares of 33.3% and 10.3% respectively. There were no pork exports from Limpopo Province from 2007 to 2009 and again in 2012 and 2013.
Source: Quantec EasyData
From Northern Cape Province, Siyanda District Municipality recorded pork export in 2015 and 2016 while Namakwa and Francis Baard District Municipalities recorded only in 2015. Siyanda District Municipality had
2007 2008 2009 2010 2011 2012 2013 2014 2015 2016
Vhembe 0 0 0 2 1612 0 0 0 374 1551
Capricorn 0 0 0 0 0 0 0 493 283 917
Waterberg 0 0 0 0 0 0 0 196 0 283
0200400600800
10001200140016001800
Tho
usa
nd
Ran
ds
Figure 19: Values of pork exports from Limpopo Province
2007 2008 2009 2010 2011 2012 2013 2014 2015 2016
Namakwa 0 0 0 0 0 0 0 0 176 0
Siyanda 0 0 0 0 0 0 0 0 6321 3181
Frances Baard 0 0 0 0 0 0 0 0 4 0
0
1000
2000
3000
4000
5000
6000
7000
Tho
usa
nd
Ran
d
Figure 20: Values of pork exports from Northern Cape Province
18
a share of 97% of pork export from the province in 2015, followed by Namakwa and Frances Baard District Municipalities with 2.7% and 0.1% respectively. In 2016, Siyanda reduced its exports by half from 2015. However, the District Municipality had a share of 100% in 2016.
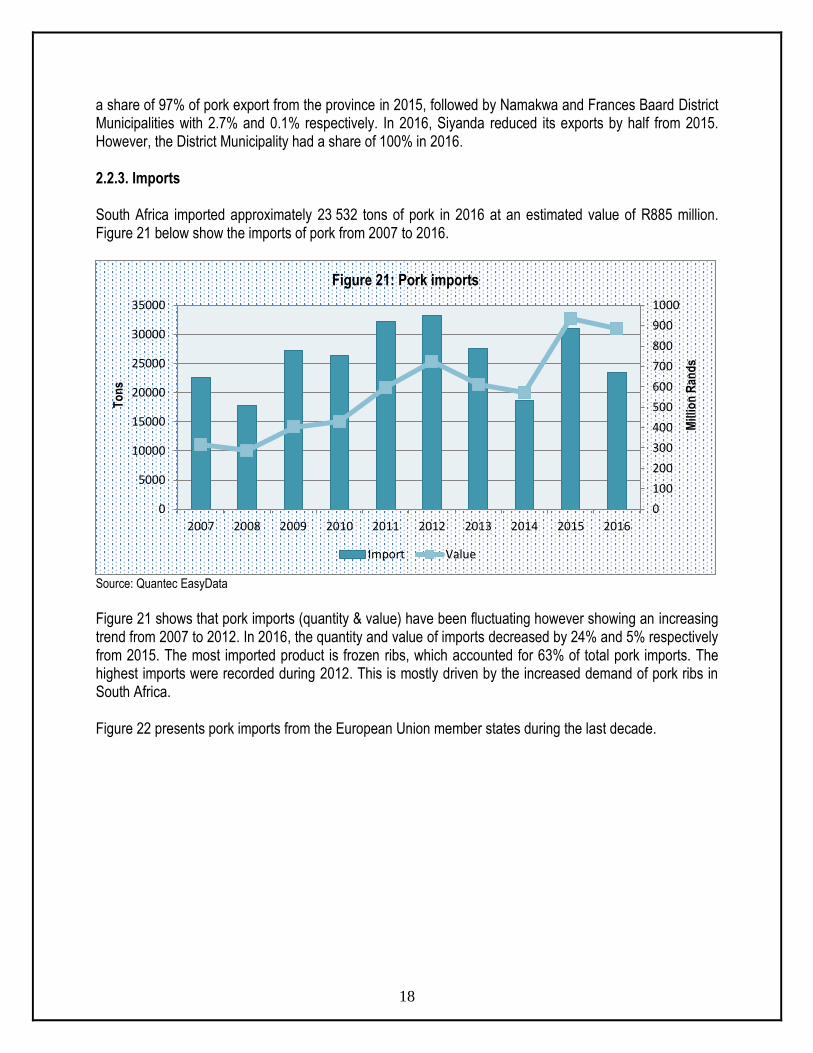
2.2.3. Imports South Africa imported approximately 23 532 tons of pork in 2016 at an estimated value of R885 million. Figure 21 below show the imports of pork from 2007 to 2016.
Source: Quantec EasyData
Figure 21 shows that pork imports (quantity & value) have been fluctuating however showing an increasing trend from 2007 to 2012. In 2016, the quantity and value of imports decreased by 24% and 5% respectively from 2015. The most imported product is frozen ribs, which accounted for 63% of total pork imports. The highest imports were recorded during 2012. This is mostly driven by the increased demand of pork ribs in South Africa. Figure 22 presents pork imports from the European Union member states during the last decade.
0
100
200
300
400
500
600
700
800
900
1000
0
5000
10000
15000
20000
25000
30000
35000
2007 2008 2009 2010 2011 2012 2013 2014 2015 2016
Mill
ion
Ran
ds
To
ns
Figure 21: Pork imports
Import Value
19
Source: Quantec EasyData
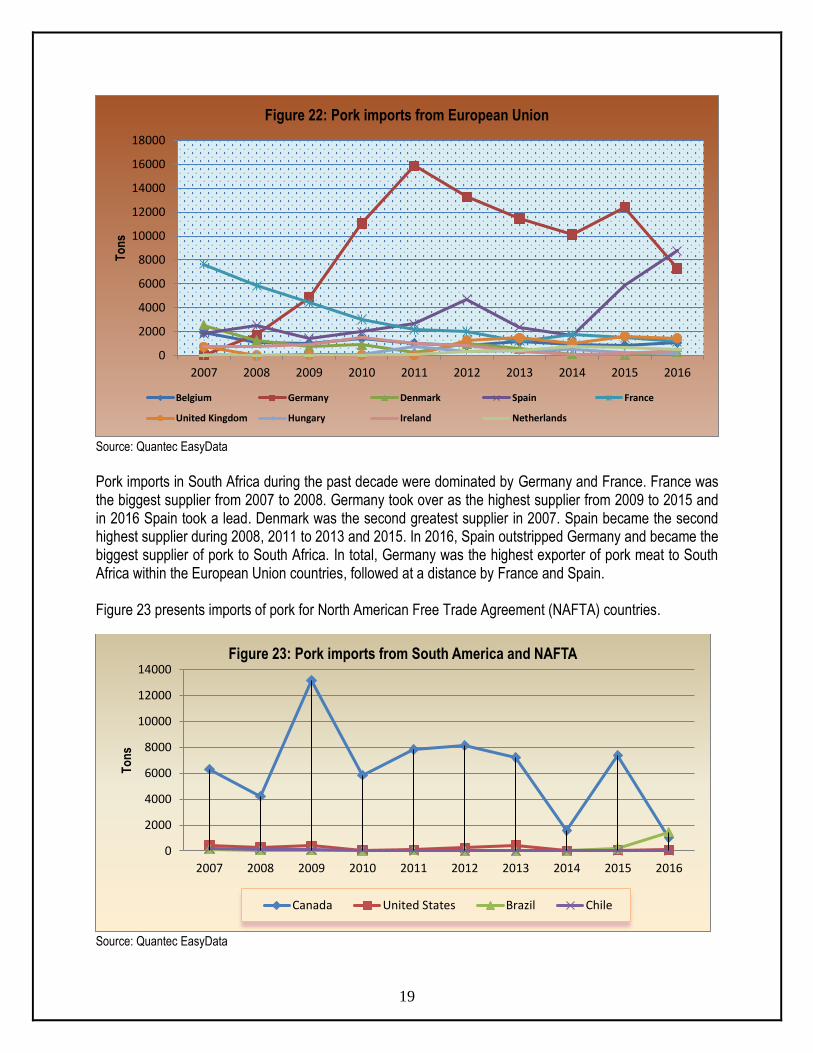
Pork imports in South Africa during the past decade were dominated by Germany and France. France was the biggest supplier from 2007 to 2008. Germany took over as the highest supplier from 2009 to 2015 and in 2016 Spain took a lead. Denmark was the second greatest supplier in 2007. Spain became the second highest supplier during 2008, 2011 to 2013 and 2015. In 2016, Spain outstripped Germany and became the biggest supplier of pork to South Africa. In total, Germany was the highest exporter of pork meat to South Africa within the European Union countries, followed at a distance by France and Spain. Figure 23 presents imports of pork for North American Free Trade Agreement (NAFTA) countries.
Source: Quantec EasyData
0
2000
4000
6000
8000
10000
12000
14000
16000
18000
2007 2008 2009 2010 2011 2012 2013 2014 2015 2016
To
ns
Figure 22: Pork imports from European Union
Belgium Germany Denmark Spain France
United Kingdom Hungary Ireland Netherlands
0
2000
4000
6000
8000
10000
12000
14000
2007 2008 2009 2010 2011 2012 2013 2014 2015 2016
To
ns
Figure 23: Pork imports from South America and NAFTA
Canada United States Brazil Chile
20
It can be observed from Figure 23 above that Canada demanded the highest share of pork imports during the period under analysis, followed at a distance by United States, Brazil and Chile. However, in 2016, Brazil increased their supply to South Africa and took a lead with an export share of 57%. On average, South African pork imports from NAFTA and South America shows that Canada accounted for 93% share, followed by United State (3%), Brazil (3%) and Chile with 1%. Intermittent imports of pork were recorded from the three countries hence the lowest shares.
Source: Quantec EasyData
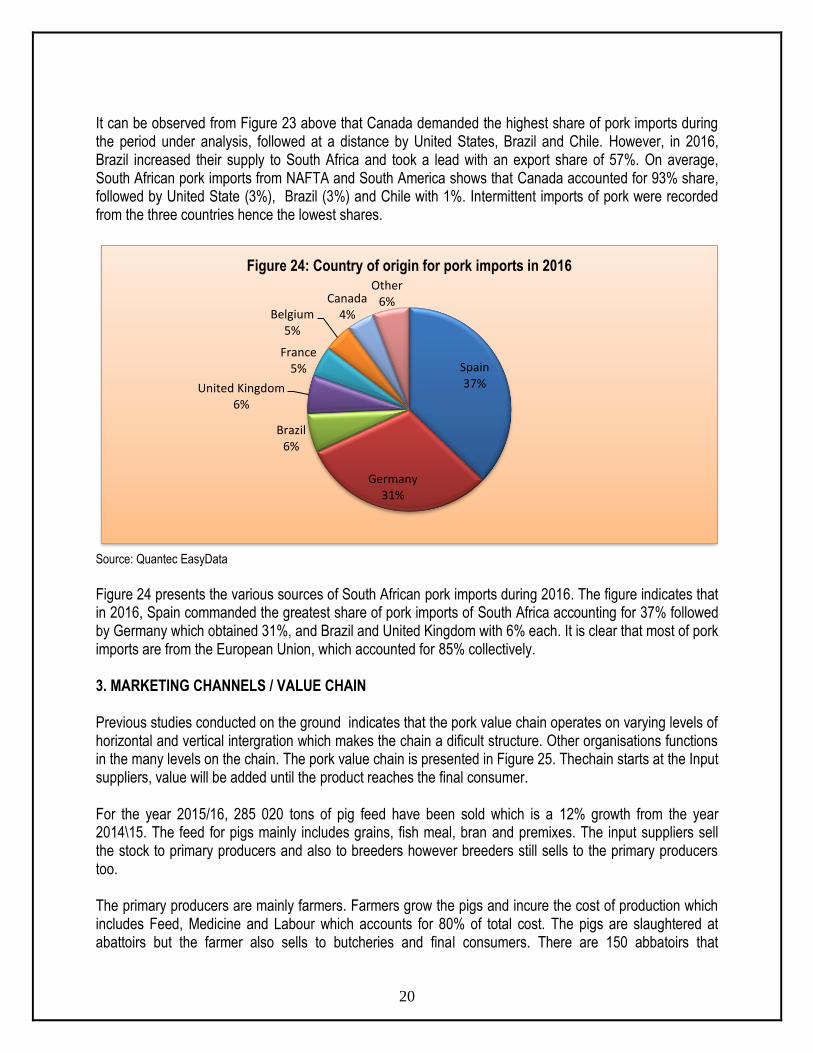
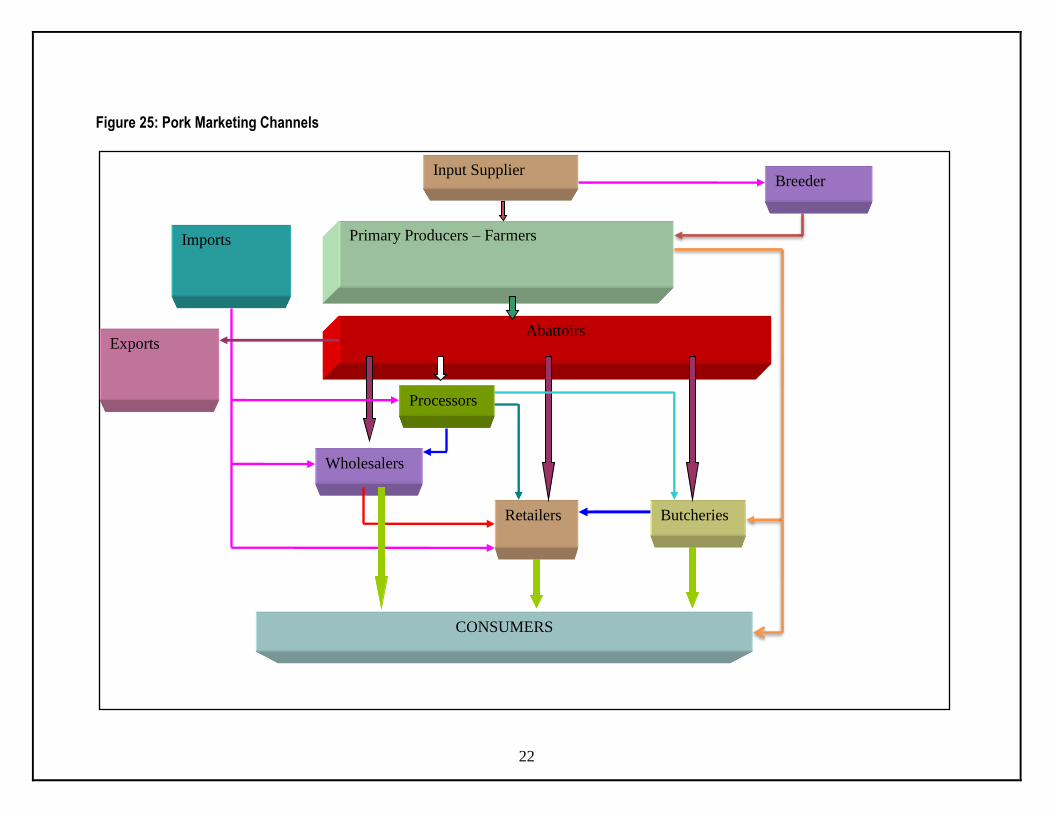
Figure 24 presents the various sources of South African pork imports during 2016. The figure indicates that in 2016, Spain commanded the greatest share of pork imports of South Africa accounting for 37% followed by Germany which obtained 31%, and Brazil and United Kingdom with 6% each. It is clear that most of pork imports are from the European Union, which accounted for 85% collectively. 3. MARKETING CHANNELS / VALUE CHAIN Previous studies conducted on the ground indicates that the pork value chain operates on varying levels of horizontal and vertical intergration which makes the chain a dificult structure. Other organisations functions in the many levels on the chain. The pork value chain is presented in Figure 25. Thechain starts at the Input suppliers, value will be added until the product reaches the final consumer. For the year 2015/16, 285 020 tons of pig feed have been sold which is a 12% growth from the year 2014\15. The feed for pigs mainly includes grains, fish meal, bran and premixes. The input suppliers sell the stock to primary producers and also to breeders however breeders still sells to the primary producers too. The primary producers are mainly farmers. Farmers grow the pigs and incure the cost of production which includes Feed, Medicine and Labour which accounts for 80% of total cost. The pigs are slaughtered at abattoirs but the farmer also sells to butcheries and final consumers. There are 150 abbatoirs that
Spain37%
Germany31%
Brazil6%
United Kingdom6%
France5%
Belgium5%
Canada4%
Other6%
Figure 24: Country of origin for pork imports in 2016
21
slaughters pigs. The abattoirs sells meat to the butchers/wholesalers/retailers/processors. The meat can be bought by consumers directly from abattoirs and/or butcheries and/or wholesalers and/or retailers. In some cases the consumer buys live pig and perform processing activities him/herself.
22
Figure 25: Pork Marketing Channels
Primary Producers – Farmers
Abattoirs
Wholesalers
Retailers Butcheries
Processors
Imports
CONSUMERS
Exports
Input Supplier
Breeder
23
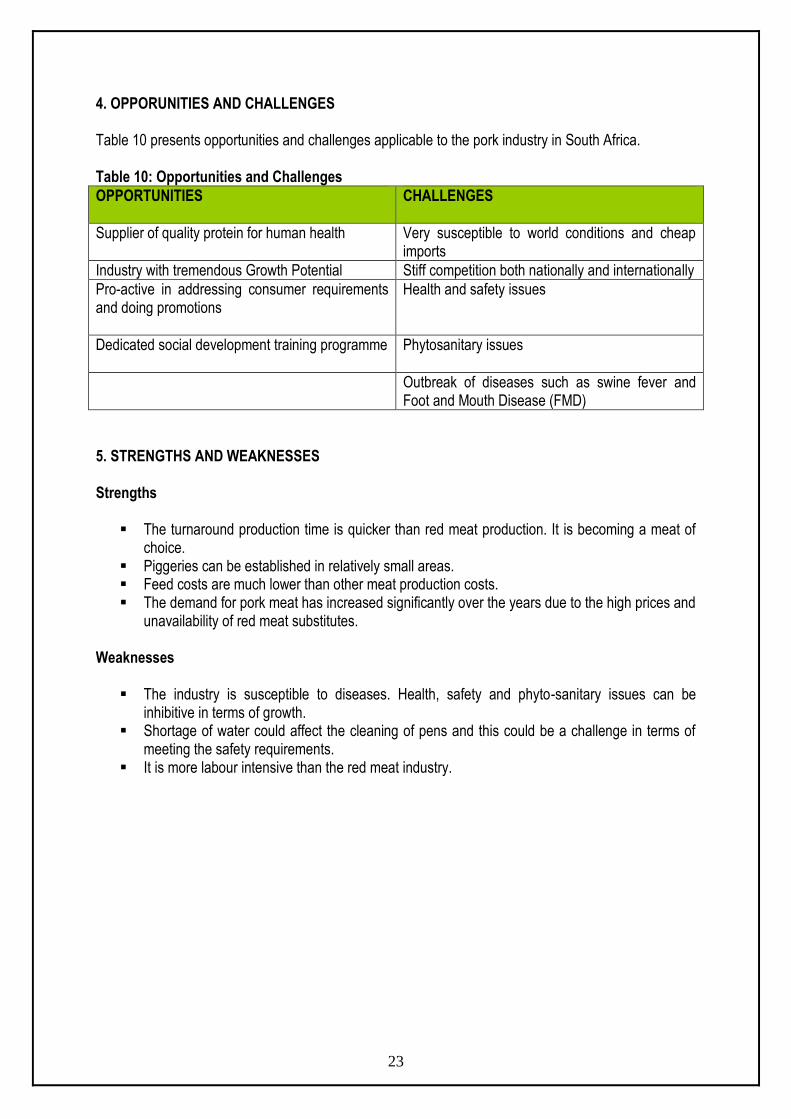
4. OPPORUNITIES AND CHALLENGES Table 10 presents opportunities and challenges applicable to the pork industry in South Africa. Table 10: Opportunities and Challenges
OPPORTUNITIES CHALLENGES
Supplier of quality protein for human health
Very susceptible to world conditions and cheap imports
Industry with tremendous Growth Potential Stiff competition both nationally and internationally
Pro-active in addressing consumer requirements and doing promotions
Health and safety issues
Dedicated social development training programme Phytosanitary issues
Outbreak of diseases such as swine fever and Foot and Mouth Disease (FMD)
5. STRENGTHS AND WEAKNESSES Strengths
The turnaround production time is quicker than red meat production. It is becoming a meat of choice.
Piggeries can be established in relatively small areas. Feed costs are much lower than other meat production costs. The demand for pork meat has increased significantly over the years due to the high prices and
unavailability of red meat substitutes. Weaknesses
The industry is susceptible to diseases. Health, safety and phyto-sanitary issues can be inhibitive in terms of growth.
Shortage of water could affect the cleaning of pens and this could be a challenge in terms of meeting the safety requirements.
It is more labour intensive than the red meat industry.
24
6. MARKET INTELLIGENCE
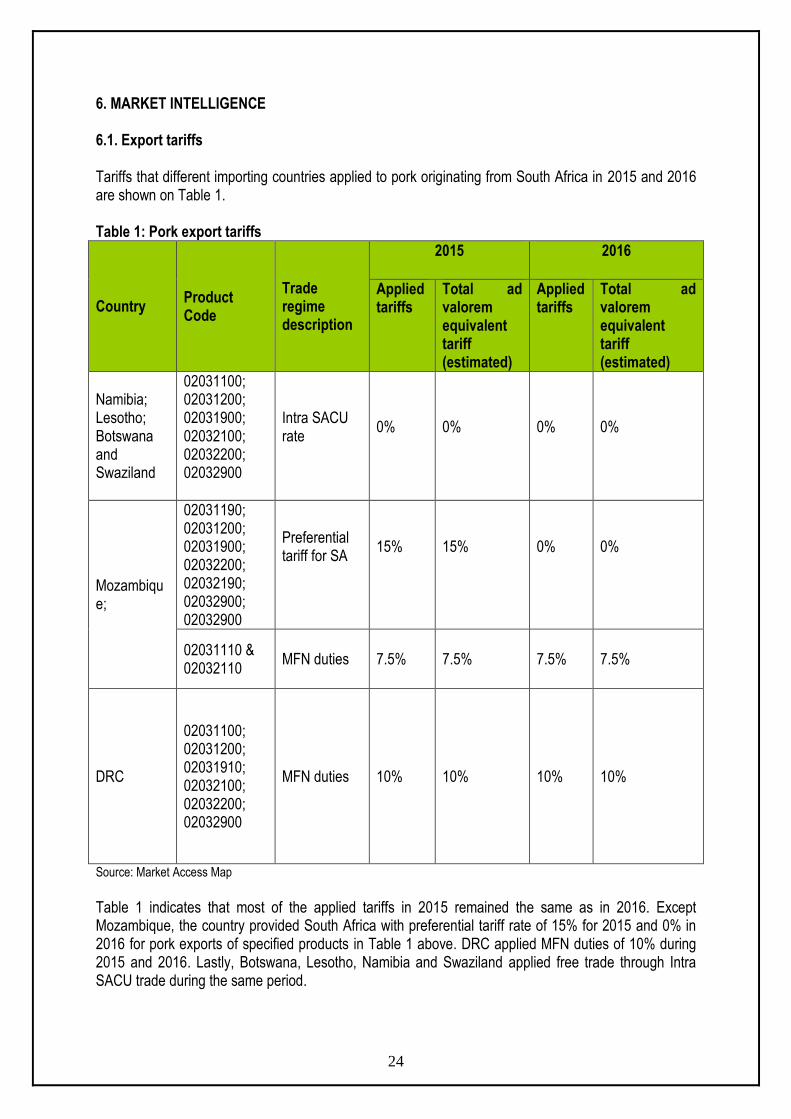
6.1. Export tariffs Tariffs that different importing countries applied to pork originating from South Africa in 2015 and 2016 are shown on Table 1. Table 1: Pork export tariffs
Country Product Code
Trade regime description
2015 2016
Applied tariffs
Total ad valorem equivalent tariff (estimated)
Applied tariffs
Total ad valorem equivalent tariff (estimated)
Namibia; Lesotho; Botswana and Swaziland
02031100; 02031200; 02031900; 02032100; 02032200; 02032900
Intra SACU rate
0%
0%
0%
0%
Mozambique;
02031190; 02031200; 02031900; 02032200; 02032190; 02032900; 02032900
Preferential tariff for SA
15%
15%
0%
0%
02031110 & 02032110
MFN duties 7.5% 7.5% 7.5% 7.5%
DRC
02031100; 02031200; 02031910; 02032100; 02032200; 02032900
MFN duties 10% 10% 10% 10%
Source: Market Access Map
Table 1 indicates that most of the applied tariffs in 2015 remained the same as in 2016. Except Mozambique, the country provided South Africa with preferential tariff rate of 15% for 2015 and 0% in 2016 for pork exports of specified products in Table 1 above. DRC applied MFN duties of 10% during 2015 and 2016. Lastly, Botswana, Lesotho, Namibia and Swaziland applied free trade through Intra SACU trade during the same period.
25
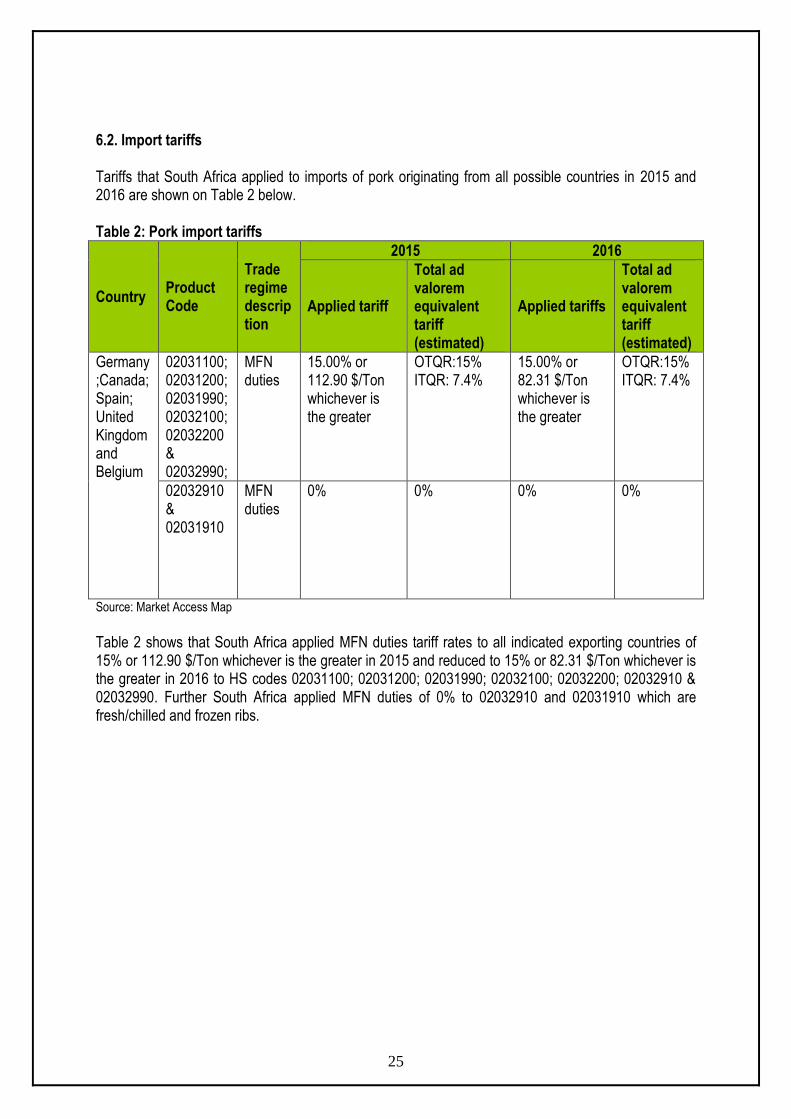
6.2. Import tariffs Tariffs that South Africa applied to imports of pork originating from all possible countries in 2015 and 2016 are shown on Table 2 below. Table 2: Pork import tariffs
Country Product Code
Trade regime description
2015 2016
Applied tariff
Total ad valorem equivalent tariff (estimated)
Applied tariffs
Total ad valorem equivalent tariff (estimated)
Germany;Canada;Spain; United Kingdom and Belgium
02031100; 02031200; 02031990; 02032100; 02032200& 02032990;
MFN duties
15.00% or 112.90 $/Ton whichever is the greater
OTQR:15% ITQR: 7.4%
15.00% or 82.31 $/Ton whichever is the greater
OTQR:15% ITQR: 7.4%
02032910 & 02031910
MFN duties
0% 0% 0%
0%
Source: Market Access Map
Table 2 shows that South Africa applied MFN duties tariff rates to all indicated exporting countries of 15% or 112.90 $/Ton whichever is the greater in 2015 and reduced to 15% or 82.31 $/Ton whichever is the greater in 2016 to HS codes 02031100; 02031200; 02031990; 02032100; 02032200; 02032910 & 02032990. Further South Africa applied MFN duties of 0% to 02032910 and 02031910 which are fresh/chilled and frozen ribs.
26
7. PERFORMANCE ANALYSIS OF SOUTH AFRICAN PORK INDUSTRY IN 2016
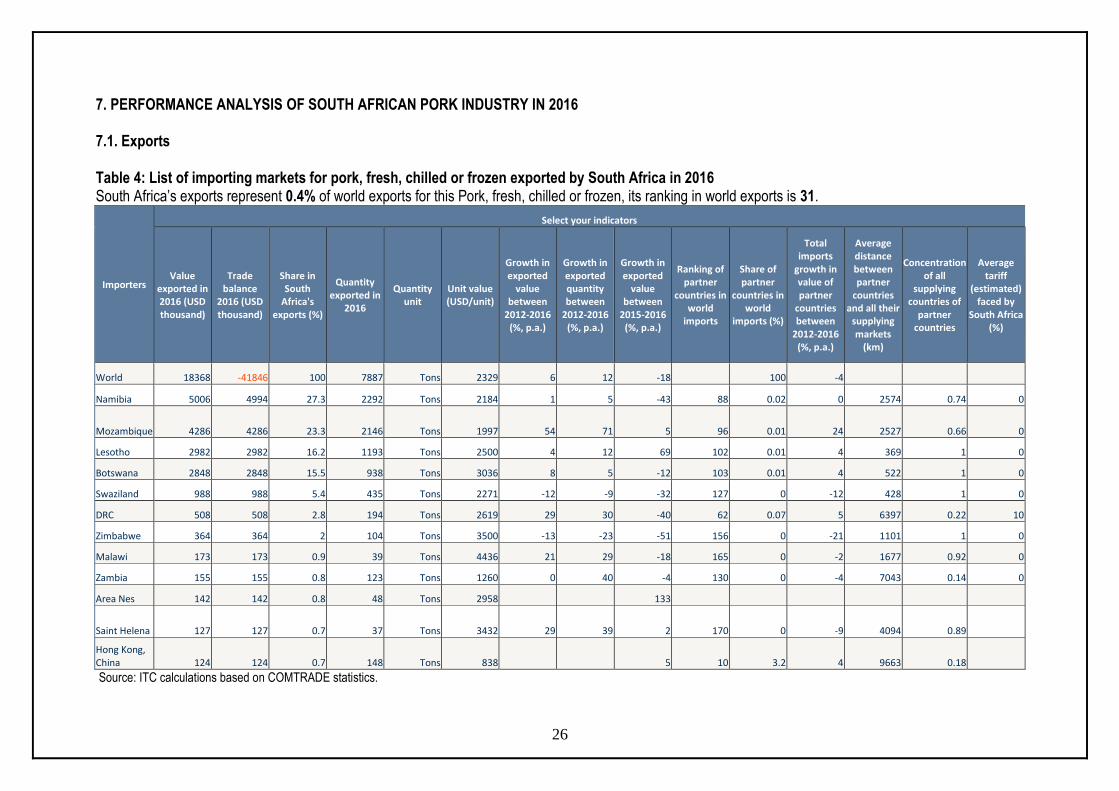
7.1. Exports Table 4: List of importing markets for pork, fresh, chilled or frozen exported by South Africa in 2016 South Africa’s exports represent 0.4% of world exports for this Pork, fresh, chilled or frozen, its ranking in world exports is 31.
Importers
Select your indicators
Value exported in 2016 (USD thousand)
Trade balance
2016 (USD thousand)
Share in South
Africa's exports (%)
Quantity exported in
2016
Quantity unit
Unit value (USD/unit)
Growth in exported
value between
2012-2016 (%, p.a.)
Growth in exported quantity between
2012-2016 (%, p.a.)
Growth in exported
value between
2015-2016 (%, p.a.)
Ranking of partner
countries in world
imports
Share of partner
countries in world
imports (%)
Total imports
growth in value of partner
countries between
2012-2016 (%, p.a.)
Average distance between partner
countries and all their
supplying markets
(km)
Concentration of all
supplying countries of
partner countries
Average tariff
(estimated) faced by
South Africa (%)
World 18368 -41846 100 7887 Tons 2329 6 12 -18 100 -4
Namibia 5006 4994 27.3 2292 Tons 2184 1 5 -43 88 0.02 0 2574 0.74 0
Mozambique 4286 4286 23.3 2146 Tons 1997 54 71 5 96 0.01 24 2527 0.66 0
Lesotho 2982 2982 16.2 1193 Tons 2500 4 12 69 102 0.01 4 369 1 0
Botswana 2848 2848 15.5 938 Tons 3036 8 5 -12 103 0.01 4 522 1 0
Swaziland 988 988 5.4 435 Tons 2271 -12 -9 -32 127 0 -12 428 1 0
DRC 508 508 2.8 194 Tons 2619 29 30 -40 62 0.07 5 6397 0.22 10
Zimbabwe 364 364 2 104 Tons 3500 -13 -23 -51 156 0 -21 1101 1 0
Malawi 173 173 0.9 39 Tons 4436 21 29 -18 165 0 -2 1677 0.92 0
Zambia 155 155 0.8 123 Tons 1260 0 40 -4 130 0 -4 7043 0.14 0
Area Nes 142 142 0.8 48 Tons 2958 133
Saint Helena 127 127 0.7 37 Tons 3432 29 39 2 170 0 -9 4094 0.89
Hong Kong, China 124 124 0.7 148 Tons 838 5 10 3.2 4 9663 0.18
Source: ITC calculations based on COMTRADE statistics.

27
Table 4 presents the trade indicators of importing market of pork from South Africa in 2016. During this year, South Africa exported a total of 7 887 tons of pork (fresh, chilled or frozen) that valued at US$ 18.4 million. The major export destinations for pork (fresh, chilled or frozen) originating from South Africa during 2016 were Namibia, Mozambique, Lesotho, Botswana and Swaziland. The greatest share of South African pork (fresh, chilled or frozen) exports were exported to Namibia which commanded 27% followed by Mozambique which commanded 23%, Lesotho with 16%. It is clear from the table that almost 95% of South African exports went to SADC countries in 2016. This may be due to the benefits of regional trade agreement with South Africa which is 0% tariff. South Africa’s pork (fresh, chilled or frozen) exports increased by 6% in value and 12% in quantity during the period of 2012 and 2016. During the same period, exports of pork (fresh, chilled or frozen) to Namibia, the top market had increased by 1% in value and increased by 5% in quantity. Mozambique increased by 54% in value and 71% in quantity. Lesotho increased by 4% in value and 12% in quantity and Botswana increased by 8% in value and increased by 5% in quantity during the same periods. Between the period 2015 and 2016, South African exports of pork (fresh, chilled or frozen) to the world decreased by 18%. During the same periods, the exports to Namibia decreased by 43%, Mozambique and Lesotho increased by 5%,and 69% respectively whilst Botswana and Swaziland decreased by 12% and 32% respectively in value.
28
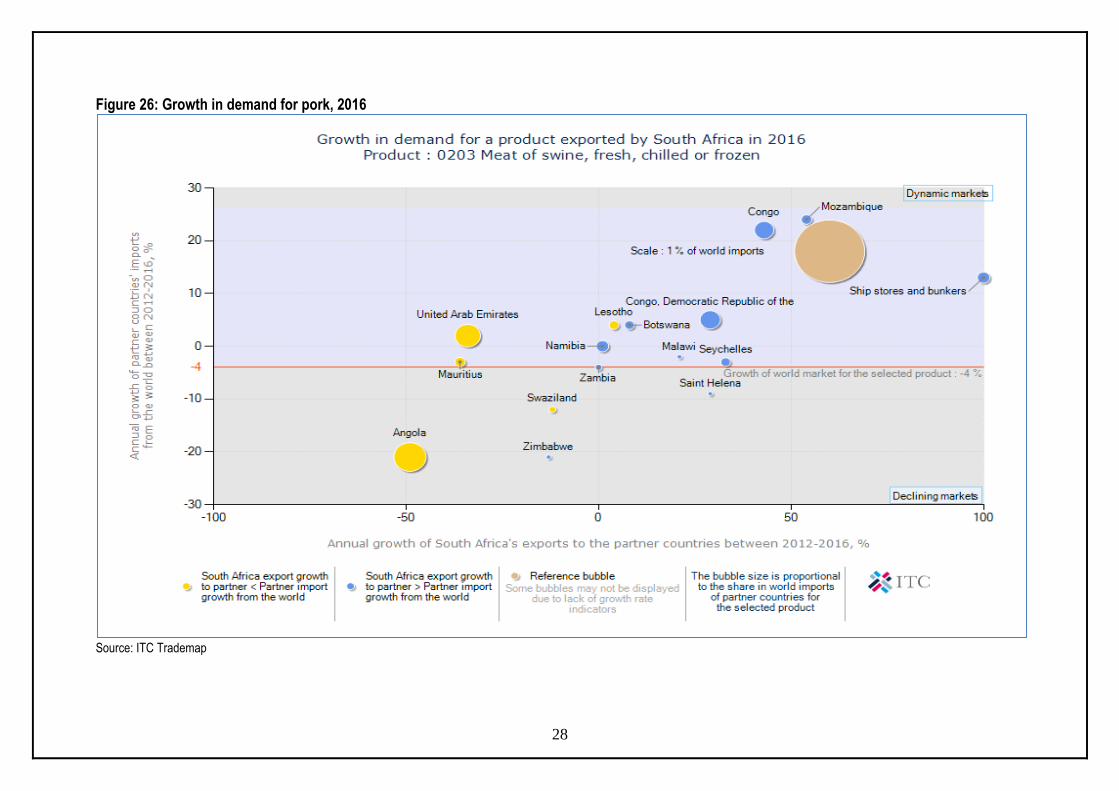
Figure 26: Growth in demand for pork, 2016
Source: ITC Trademap

29
Growth in demand for South African pork in 2016 is depicted in Figure 26. The figure illustrates that between 2012 and 2016; South Africa’s pork (fresh, chilled or frozen) exports to, Angola, United Arab Emirates (UAE), Mauritius, Lesotho and Swaziland were growing at a rate that is less than their import growth from the rest of the world. Angola is the biggest market with a world share of 0.19%. Its annual imports decreased by 21%. At the same period, South Africa’s pork (fresh, chilled or frozen) exports to Democratic Republic of Congo (DRC), Congo, Botswana, Namibia, Zambia, Seychelles and Saint Helena were growing at a rate that is greater than their imports from the rest of the world. Mozambique and Congo represent gains in dynamic market and Angola, Zimbabwe and Swaziland represent losses in the declining market of South Africa pork (fresh, chilled or frozen) exports. Mozambique experienced the most growing demand of pork with South Africa’s export annual growth of 54% and Mozambique’s imports increased by 24%.
30
Figure 27: South African pork’s prospects for market diversification in 2016
Source: ITC Trademap
31
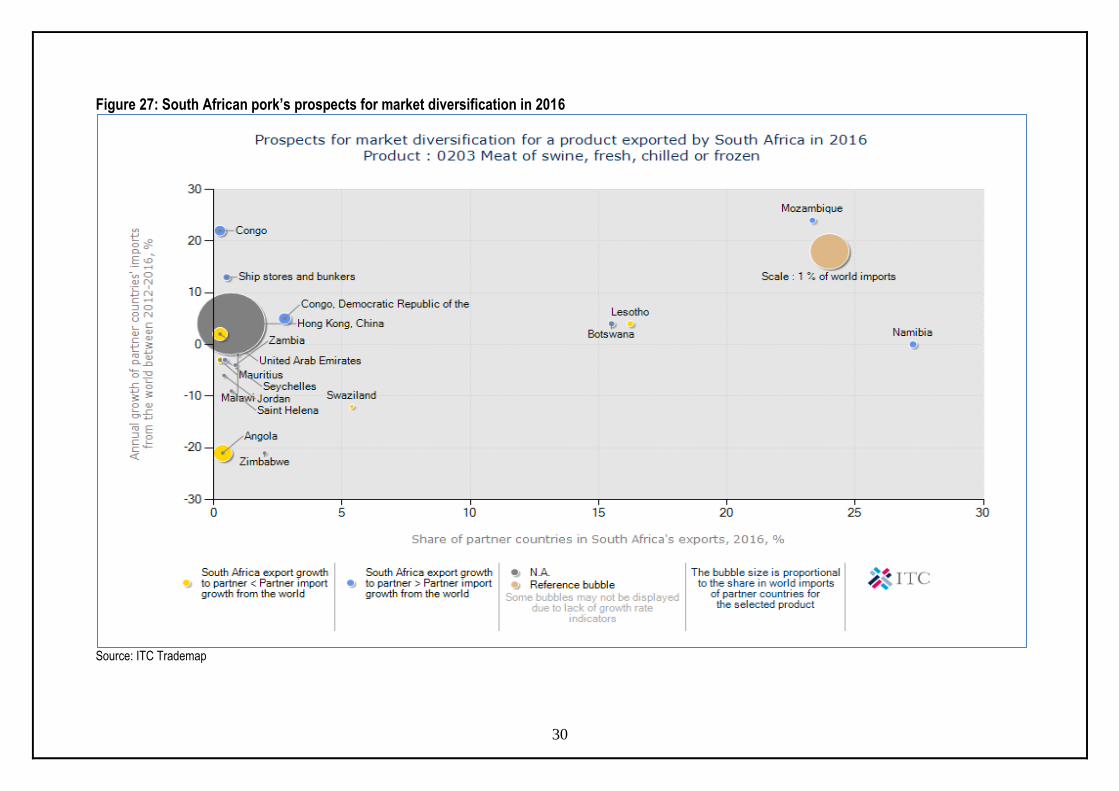
Figure 27 shows the prospects for market diversification for pork (fresh, chilled or frozen) exports by South Africa in 2016. The analysis on the figure above shows that Namibia commanded the greatest shares of South Africa’s pork (fresh, chilled or frozen) exports of 27.29% during the year 2016, followed by Mozambique with 23.33%. If South Africa is to diversify its pork (fresh, chilled or frozen) exports, the biggest market exists in Congo due to its annual import growth of pork (fresh, chilled or frozen) of 22%.
32
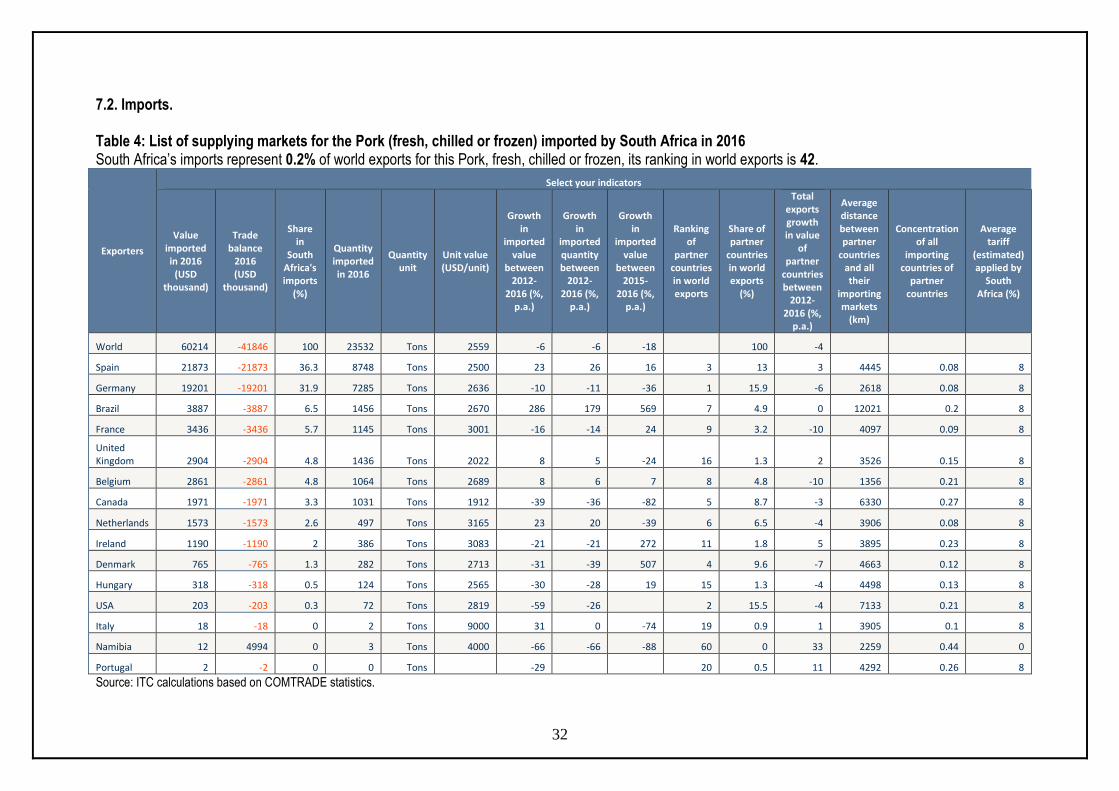
7.2. Imports. Table 4: List of supplying markets for the Pork (fresh, chilled or frozen) imported by South Africa in 2016 South Africa’s imports represent 0.2% of world exports for this Pork, fresh, chilled or frozen, its ranking in world exports is 42.
Exporters
Select your indicators
Value imported in 2016
(USD thousand)
Trade balance
2016 (USD
thousand)
Share in
South Africa's imports
(%)
Quantity imported in 2016
Quantity unit
Unit value (USD/unit)
Growth in
imported value
between 2012-
2016 (%, p.a.)
Growth in
imported quantity between
2012-2016 (%,
p.a.)
Growth in
imported value
between 2015-
2016 (%, p.a.)
Ranking of
partner countries in world exports
Share of partner
countries in world exports
(%)
Total exports growth in value
of partner
countries between
2012-2016 (%,
p.a.)
Average distance between partner
countries and all their
importing markets
(km)
Concentration of all
importing countries of
partner countries
Average tariff
(estimated) applied by
South Africa (%)
World 60214 -41846 100 23532 Tons 2559 -6 -6 -18 100 -4
Spain 21873 -21873 36.3 8748 Tons 2500 23 26 16 3 13 3 4445 0.08 8
Germany 19201 -19201 31.9 7285 Tons 2636 -10 -11 -36 1 15.9 -6 2618 0.08 8
Brazil 3887 -3887 6.5 1456 Tons 2670 286 179 569 7 4.9 0 12021 0.2 8
France 3436 -3436 5.7 1145 Tons 3001 -16 -14 24 9 3.2 -10 4097 0.09 8
United Kingdom 2904 -2904 4.8 1436 Tons 2022 8 5 -24 16 1.3 2 3526 0.15 8
Belgium 2861 -2861 4.8 1064 Tons 2689 8 6 7 8 4.8 -10 1356 0.21 8
Canada 1971 -1971 3.3 1031 Tons 1912 -39 -36 -82 5 8.7 -3 6330 0.27 8
Netherlands 1573 -1573 2.6 497 Tons 3165 23 20 -39 6 6.5 -4 3906 0.08 8
Ireland 1190 -1190 2 386 Tons 3083 -21 -21 272 11 1.8 5 3895 0.23 8
Denmark 765 -765 1.3 282 Tons 2713 -31 -39 507 4 9.6 -7 4663 0.12 8
Hungary 318 -318 0.5 124 Tons 2565 -30 -28 19 15 1.3 -4 4498 0.13 8
USA 203 -203 0.3 72 Tons 2819 -59 -26 2 15.5 -4 7133 0.21 8
Italy 18 -18 0 2 Tons 9000 31 0 -74 19 0.9 1 3905 0.1 8
Namibia 12 4994 0 3 Tons 4000 -66 -66 -88 60 0 33 2259 0.44 0
Portugal 2 -2 0 0 Tons -29 20 0.5 11 4292 0.26 8
Source: ITC calculations based on COMTRADE statistics.
33
Table 4 provides a list of supplying nations for pork imported by South Africa in 2016. South Africa’s imports represent 0.2% of world imports for pork (fresh, chilled or frozen) and its ranking in world imports is 42. Table 4 shows that during 2016 South Africa imported a total of 23 532 tons of pork (fresh, chilled or frozen) that worth US$ 60 214. The major origins for pork (fresh, chilled or frozen) imported by South Africa during 2016 were Spain, Germany, Brazil and France. These four countries constituted 80.4% of South African pork imports during 2016. South Africa’s pork (fresh, chilled or frozen) imports decreased by 6% both in value and quantity between the periods 2012 and 2016. During the same period, imports for pork (fresh, chilled or frozen) from Spain increased by 23% in value and 26% in quantity and imports from Germany decreased by 10% in value 11% in quantity. Between the year 2015 and 2016, South Africa’s imports of pork (fresh, chilled or frozen) decreased by 18% in value. During the same period, imports of pork (fresh, chilled or frozen) from Spain increased by 16% whilst Germany decreased by 36%.

34
Figure 28: Competitiveness of suppliers of South Africa’s pork imports in 2016
Source: ITC Trademap
35
Figure 28 depicts the competitiveness of suppliers to South Africa for pork in 2016. The figure illustrates that South Africa’s pork (fresh, chilled or frozen) imports from Germany, Canada, France, and United States of America (USA), Denmark and Ireland were growing at a rate that is less than their export growth to the rest of the world. It can also be noticed that South Africa’s annual growth of imports from the mentioned countries have decreased. At the same time, South Africa’s pork (fresh, chilled or frozen) imports from Spain, Belgium, United Kingdom, Netherlands, Italy and Brazil were growing at a rate that is greater than their exports to the rest of the world. The most competitive market is Germany due to its world biggest share of 15.92% and Namibia with its annual export growth of 33%.
36
Figure 29: Prospects for market diversification of suppliers of pork imported by South Africa in 2016
Source: ITC Trademap
37
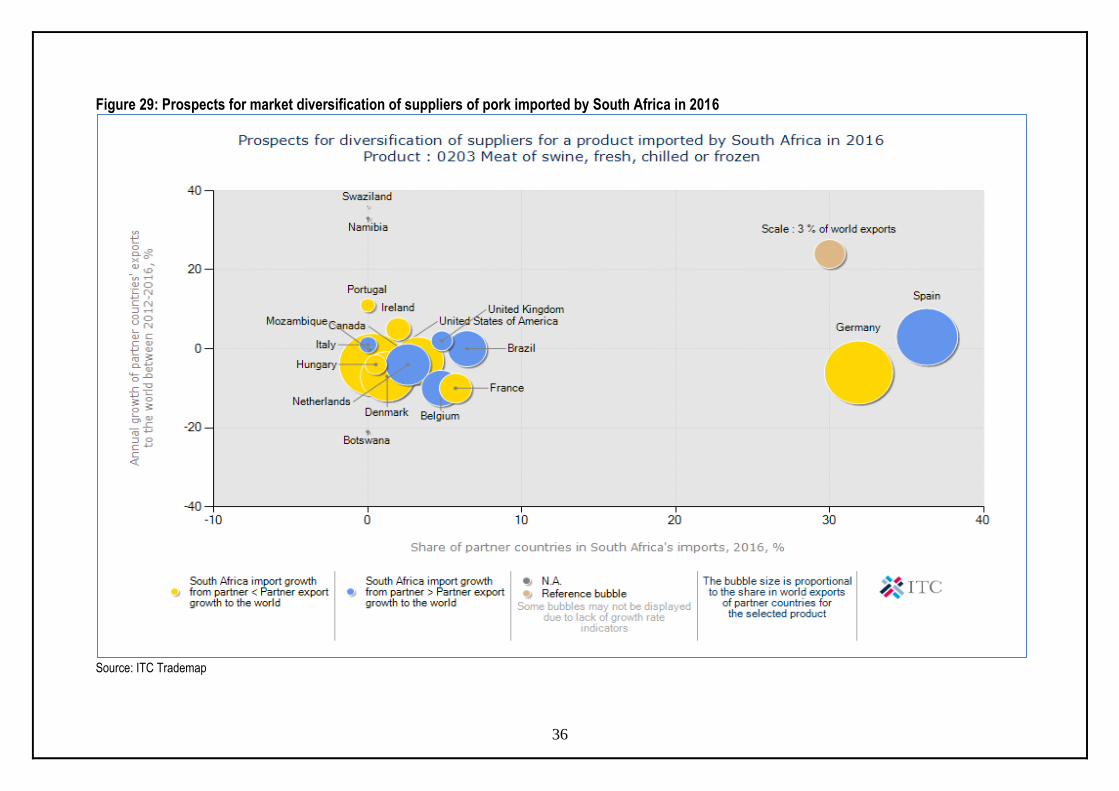
Figure 29 illustrates prospects for diversification of suppliers of pork imported by South Africa in 2016. The analysis shows that Spain and Germany commanded the greatest shares of South Africa’s pork (fresh, chilled or frozen) imports during the year 2016. Spain is the biggest supplier of pork (fresh, chilled or frozen) with a share of 36.33% in South African import market followed by Germany with 31.89%. Germany remains the biggest market of pork imports with the world market share of 15.92%, followed by USA with world import of 15.47%. Germany is the biggest supplier of pork to the world. Therefore, South Africa can increase its imports if it wishes to diversify because South Africa’s growth is less than Germany’s export growth to the world. Another opportunity lies in Portugal due to its highest export growth of 11%. This makes Portugal the fastest growing market in the world and it can be a target for South African pork imports.
38
8. ACKNOWLEDGEMENTS The following organizations are acknowledged:
Directorate: Statistics and Economic Analysis. www.daff.gov.za
Quantec Easydata www.easydata.co.za
ITC Market Access Map http://www.macmap.org/SouthAfrica
ITC Trade Map http://www.trademap.org.
Disclaimer: This document and its contents have been compiled by the Department of Agriculture, Forestry and Fisheries for the purpose of detailing the Pork value chain. Anyone who uses the information as contained in this document does so at his/her own risk. The views expressed in this document are those of the Department of Agriculture, Forestry and Fisheries with regard to the industry, unless otherwise stated. The Department of Agriculture, Forestry and Fisheries therefore accepts no liability that can be incurred resulting from the use of this information.