Embed Size (px)
Citation preview

Perspectives 2016
Adolfo Fontes – October 2015
Pork Global Market

Pork Global Market Perspectives
Pork market overview
Latin American Potential
Brazilian Pork industry
Challenges
Conclusions

Rabobank is a premier bank to the leading companies across the food, beverage and agribusiness industry
Leading Global Bank
Relationship-Focused
Financial solutions to more than 10 million clients in 46 countries
• Rabobank International global presence
• Rabobank Netherlands
• Rabobank International
Over 100 years of banking history rooted in the Food & Agri sector
Safest privately-owned bank, more than USD1 trillion in Assets
Wholesale Banking
F&A Research
Corporate Banking Global Financial Markets
Mergers & Acquisitions
Focus on Food & Agribusiness
International Retail Banking
Professional Products/ AF
Asset management
Mortgage
Leasing
Commercial Real Estate Insurance
Corporates
All industries
Corporate and Retail banking
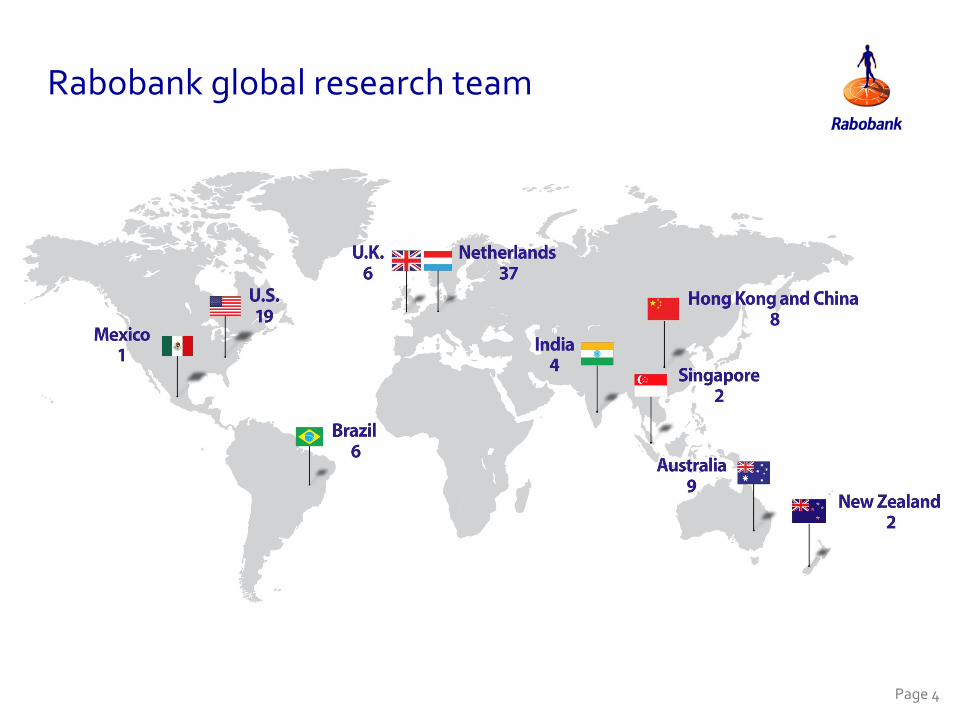
Rabobank global research team
Page 4

World population
Source: US Department of Commerce, 2014
Bil
hõ
es
2014 7.2 More food will be needed
in the first half of this
century, than it was
consumed in the last
7,000 years

Globally, poultry is the fastest growing meat and should replace pork as the most consumed animal protein by 2022
• Global consumption of meat [ MM tons]
• Note 1: Compound annual growth rate • Source: Rabobank, OECD, FAO
+1,4%
CAGR¹
2013-2022
+1,3%
+1,9%
+1,5%
Pork
Poultry
Sheep
Beef
2022p
+1,6%
+2,6%
346
76 (22,0%)
16 (4,6%)
128 (37,0%)
126 (36,4%)
2013
301
14 (4,7%)
108 (35,9%)
112 (37,2%)
67 (22,3%)
2005
254
12 (4,7%)
83 (32,7%)
98 (38,6%)
61 (24,0%)
1995
189
9 (4,8%)
46 (24,3%)
78 (41,3%)
56 (29,6%)

FAO Projection (2023) for Latin America*
Page 7 Source: OECD, FAO, 2015
(1,000 t.)
Latin America and Caribbean Production
24.03627.113
29.880
7.384
8.060
8.833
19.760
20.479
18.025
59.192
54.933
2019 2024 2014
49.445
Pigmeat Beef Poultry CARG 2014-24
1,3%
1,8%
2,2%
*and Caribbean

Meat per capita consumption per region per year
28 3219
15
49
28 36
2237
34
13
33 1428
1612216 126 7
World
41
10
Oceania
84
Europe
68
Asia
31
10 5
South America
81
Central America and Caribbean
53
North America
110
Africa
15
Pork
Poultry
Beef
3920
34 28
20
1745
38
51
31
10
13
39 60
35
16
15140 9
13
Argentina
107
Brazil
98
South Korea
64
Japan
50
India
4
2 1
China
57 5
Mexico
62
USA
114
Fonte: USDA, FAO, Rabobank
• Per capita consumption (kg/year) – 2013
Per capita consumption (kg/year)

Source: Rabobank

0
2,000
4,000
6,000
8,000
10,000
12,000
Chicken Beef Pork
x 1,000 tonnes
Growing importance of trade, but volatile global market conditions
Global trade in meat 2000-2015
Source: Rabobank, USDA, 2015
Pork: CAGR: +5.4% , 6% of global supply
Poultry: CAGR: +5.5% , 12% of global supply
Beef: CAGR: +3.7%, 17% of global supply
Page 11
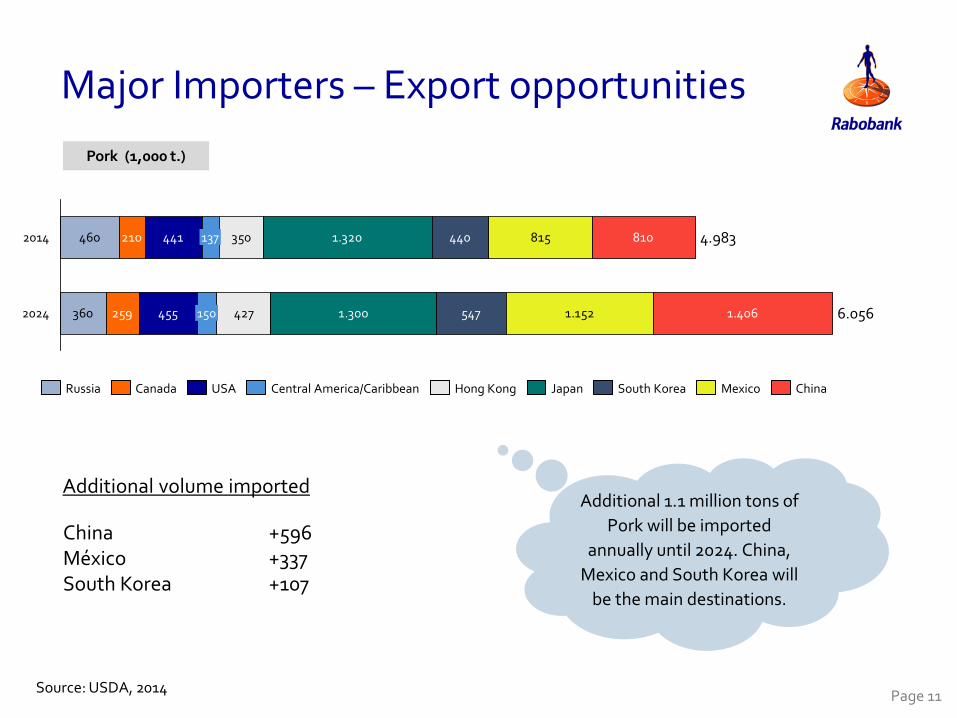
460
360
210
259
441
455
350
427
1.320
1.300
440
547
815
1.152
810
1.4062024 6.056 150
2014 4.983 137
Canada Russia China Mexico South Korea Japan Hong Kong Central America/Caribbean USA
+596 +337 +107
Additional 1.1 million tons of
Pork will be imported
annually until 2024. China,
Mexico and South Korea will
be the main destinations.
Additional volume imported
China México South Korea
Major Importers – Export opportunities
Pork (1,000 t.)
Source: USDA, 2014

Asia’s growing impact on global meat markets
-
500
1,000
1,500
2,000
2,500
3,000
3,500
4,000
4,500
1990 1995 2000 2005 2010
Beef Pork Broiler
1,000 tonnes
43%
46%
48%
Asian imports of meat 1990-2014
Source: Rabobank/USDA, 2015

Rising.....
Population
Urbanization
And per capita income
Page 13

Self-sufficiency in animal protein and GDP per capita (1980-2014)
Source: USDA, FAO
As China grows economically, it will not only import grain but also meat
40%
50%
60%
70%
80%
90%
100%
$0 $10.000 $20.000 $30.000 $40.000 $50.000
Pe
rce
nt
self
-su
ffic
ien
t in
an
ima
l pro
tein
GDP per capita (current prices, US$)
Japan
Korea
China (including Hong Kong)
Page 14

Fonte: Rabobank, 2015
China’s Self-Sufficiency Has Big Implications for Global Pork
Page 15
Today, China (including Hong Kong) imports only 2% of its annual pork demand.
This 1,150k tons of imports accounts for about 19% of the global pork trade.
BUT, if China’s self-sufficiency fell by 5% (from 98% to 93%) then its share of the pork trade would rise to 40% .
AND, pork production in the US would have to rise by 28% to meet this demand.

More changes are coming...
15%
85%
34%
66%
68%
32%
Packaged Pork
Fresh Pork
Page 16


Global view: Pork 2015/2016
Fonte: Rabobank, 2014
Strong recovery after PEDv
Pork production increased more than
70% in the last 5 years
Embargo against the US, Australia and
the EU
Production has decreased in 2015 while
imports are increasing
Pork exports will increase almost
10% in 2015
Page 18
Brazil has been benefited from the
Russia embargo against other exporters
Largest
importer

Latin America Pork Production
Pork production in 2015 (million tons) Latin America production in 2015
China
EU
Latin America
Russia
5,7
10,8 2,3
54,7
USA
22,5 Others
13,0
Total 109 million tons
0,50,6
1,3
3,4
Argentina Brazil Chile Mexico
The fourth largest producer
Page 19 Source: USDA, 2015

USDA Pork estimations
+5%
-1%
+8%
+6%
+7%
+8%
+5%


USDA Pork estimations
-5%
+12%
+11%
+25%
+10%
-42% -33%
+8%
+3%

Brazilian exports 2015
Source: MDIC
-29%
-3% -19%
+37%
Uruguai
15,3 15,7
Singapura
20,9 25,8
Angola
27,3 38,7
Hong Kong
84,8 82,6
Russia
176,8
129,5 +3%
Jan/Sep15 Jan/Sep14
(1.000 tons)
Jan to Sep 2015: +6%

Russia ban has had particularly impact on global pork and beef market
0
500
1,000
1,500
2,000
2,500
3,000
3,500
4,000
0
500
1,000
1,500
2,000
2,500
3,000
0
500
1,000
1,500
2,000
2,500
3,000
3,500
4,000
4,500
5,000
Global beef imports in 2013
Global pork imports in 2013
Global chicken imports in 2013
14% 13%
6%
1,000 tonnes 1,000 tonnes 1,000 tonnes
10% of global meat trade was sold to Russia Source: Rabobank analysis based on USDA, Rostat, 2014
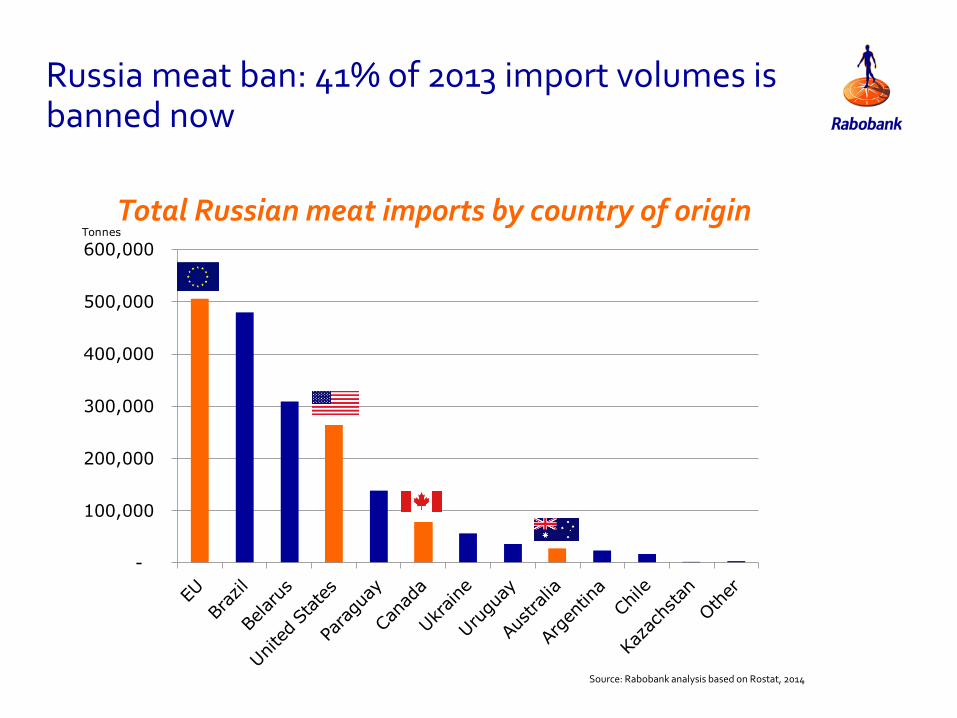
Russia meat ban: 41% of 2013 import volumes is banned now
Total Russian meat imports by country of origin
-
100,000
200,000
300,000
400,000
500,000
600,000 Tonnes
Source: Rabobank analysis based on Rostat, 2014

Exchange rate in Brazil
26 Source: Bloomberg, 2015
0,80
1,20
1,60
2,00
2,40
2,80
3,20
3,60
4,00
Jan-06 Jan-07 Jan-08 Jan-09 Jan-10 Jan-11 Jan-12 Jan-13 Jan-14 Jan-15 Jan-16
BRL/USD
Jul/10 Sep/15 0,57 USD/BRL 0,26 USD/BRL Devaluation
~55%

...From the Brazilian point of view...
27

28
...From the American point of view...

29
...From the Russian point of view...

Russian supermarket H2 2014
Page 30

International meat prices
Source: Bloomberg, 2015 Page 32
Live Cattle (LC1) and Lean Hog (LH1)
0
50
100
150
Jul-15 Apr-11 Oct-11 Apr-12 Oct-12 Jul-13 Apr-13 Jan-11 Jul-11 Jul-14 Jan-15 Jan-14 Oct-10 Oct-15 Apr-15 Oct-14 Apr-14 Oct-13 Jan-13 Jul-12 Jan-12
-42%
-16%
-14%
Usd/cwt
-60%
Live Cattle
Lean Hog

Source: World Bank, 2010
World: new land available for rain-fed agriculture
South America.: new land availability estimated by crop
LA has considerable scope to expand food and feed production
[million hectares]
[million hectares]
95
94
44
25
107
29
28
3
3
0
11
7
ME/N Africa
S & E Asia
E Europe/C Asia
Latam/Caribbean
Sub-Saharan Africa
RoW
Bad logistics
Good logistics
10 10
1122
9
46 47
Wheat
10
2
Sugarcane
15
1
Soybeans
1
36
Corn
26 Other S America
Argentina
Brazil
Global demand for agricultural commodities is rising
as a result of increasing population and rising real
incomes
Although part of the need for greater output can be
achieved by raising productivity, new land will
nevertheless be required for agriculture in the future
The distribution of such resources is hard to
evaluate, but it is certainly uneven around the world.
Nevertheless, it is clear that Latin America, and
specifically Brazil, holds a substantial part of the world’s
unused agricultural land
Page 34
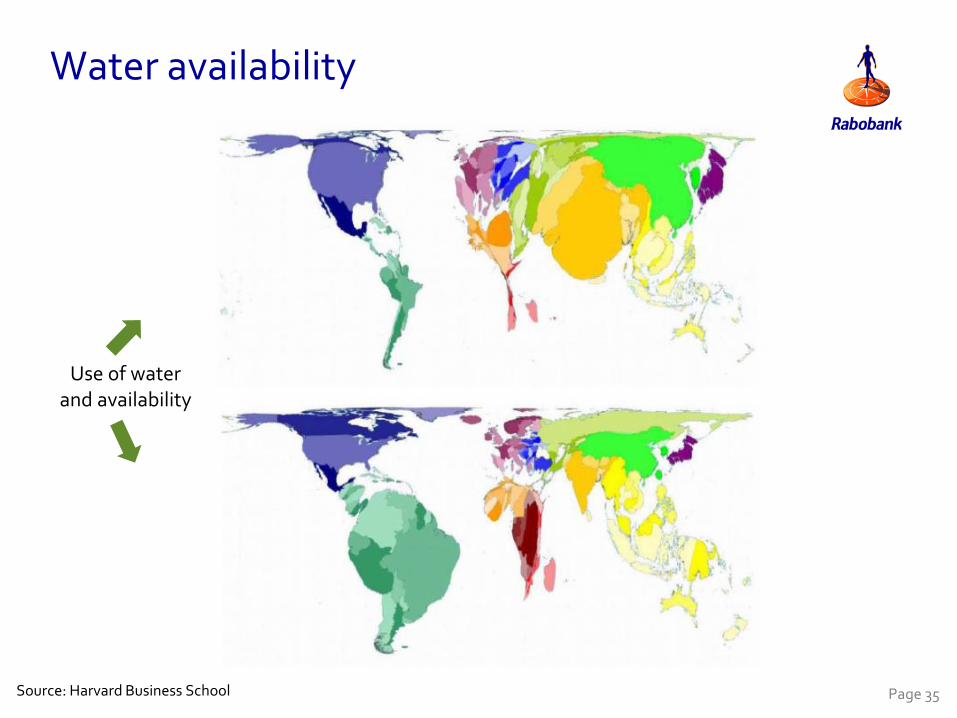
Water availability
Source: Harvard Business School
and availability Use of water
Page 35

Pork cost price comparison selected countries (EUR kg cwe)
0,00
0,50
1,00
1,50
2,00
Feed Other variable costs Labour Other fixed costs

EU high quality processed pork products
EU meat consumption per specie Processed meat consumption
By category and country (1,000 tonnes pw) Beef 15%
Pork 61%
Poultry 21%
Other 3%
-
5.000
10.000
15.000
20.000
25.000
Canned meat Frozen ConvenienceCured meat Bacon & hamChilled convenience
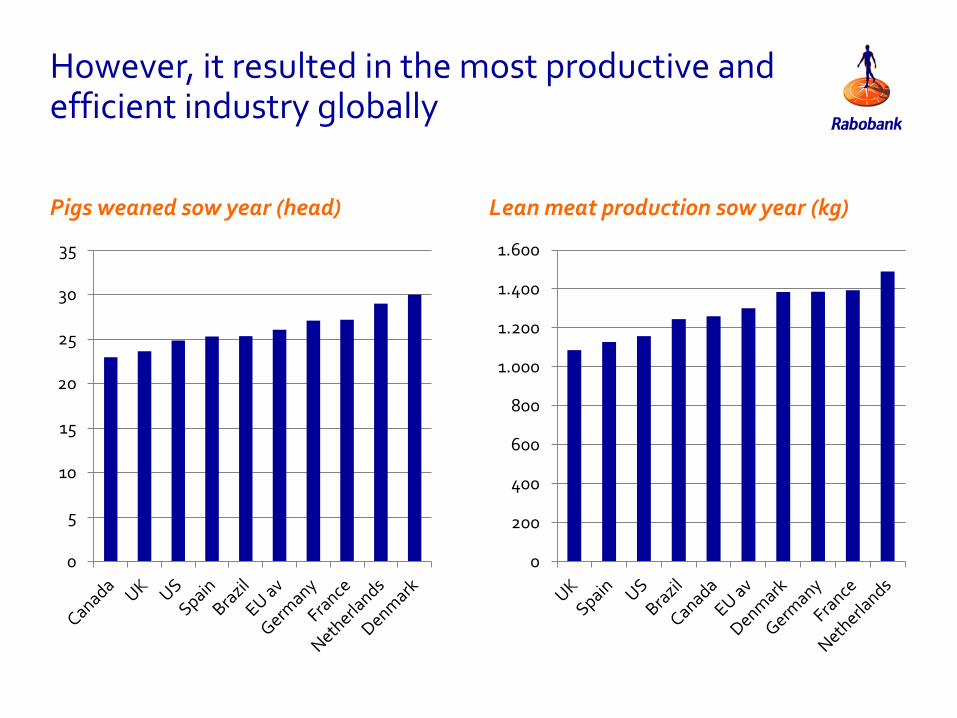
However, it resulted in the most productive and efficient industry globally
Pigs weaned sow year (head) Lean meat production sow year (kg)
0
5
10
15
20
25
30
35
0
200
400
600
800
1.000
1.200
1.400
1.600

EU pork industry dominated by Germany and Spain
EU pork production 2000-2025 (1,000 tonnes cwe)
0
1.000
2.000
3.000
4.000
5.000
6.000
2000 2005 2010 2014 2025F

In the US, High-Flying Pork Producers Margins Have Returned to Earth
• Source: Iowa State
($60)
($40)
($20)
$0
$20
$40
$60
$80
$100
2002 2003 2004 2005 2006 2007 2008 2009 2010 2011 2012 2013 2014 2015
2012 Drought
RFS and Great Recession
PEDv Outbreak
Hog Production Margin per Head

Page 41
Corn prices
Source: Bloomberg, Rabobank, 2015

Source: Bloomberg, Rabobank, 2015
Page 42
Soybean prices

Potential in Argentine meat production
Page 43 Source: OECD, Rabobank estimates, 2014
(1,000 t.)
Beef
Poultry Pork
0
500
1.000
1.500
2.000
2.500
3.000
3.500
2023F 2022F 2021F 2020F 2019F 2018F 2017F 2016F 2015F 2014 2013 2012 2011 2010 2009 2008 2007 2006 2024F
+2,2%
2005 2004 2003 2002 2001 2000
OECD outlook
Beef Production
0
500
1.000
1.500
2.000
2.500
3.000
20
01
20
00
20
23F
20
22
F
20
21F
20
20
F
20
19F
20
18F
20
17F
20
16F
20
15F
20
14
20
13
20
12
20
11
20
10
20
09
20
08
20
07
20
06
20
05
20
04
20
03
20
02
20
24
F
+2,5%
OECD outlook
Poultry Production
0
100
200
300
400
500
600
700
20
23F
20
22
F
20
21F
20
20
F
20
19F
20
18F
20
17F
20
16F
20
15F
20
14F
20
13
20
12
20
11
20
10
20
09
20
08
20
07
20
06
20
05
20
04
20
03
20
02
20
01
20
00
20
24
F
+2,9%
OECD outlook
Pork Production

Rabobank estimates on the Brazilian meat market
Source: USDA, Rabobank estimates, 2015
Growth Potential within 10 years
Beef Poultry Pork
+1,078 +2,585
+750
+1,111 +1,367 +140
Consumption Trade Status Meat
8.826
3.4824.849
7.875
8.953
1.849
2.961
3.4462.696
2013
8.535
725
2023
5.916
585
+2,1%
19.397
2013 2023
11.411
23.810
+3,7%
Poultry
Pork
Beef
Domestic Consumption
Trade Status
World export of AP and Brazilian Share (2013-2023)
(1,000 t.)
18,7% 24,8%
28,8%
30,3%
8,2% 8,5%
0,0%
5,0%
10,0%
15,0%
20,0%
25,0%
30,0%
35,0%
0
2.000
4.000
6.000
8.000
10.000
12.000
14.000
16.000
18.000
2013 Beef 2023 Beef 2013Poultry
2023Poultry
2013 Pork 2023 Pork
Others Brazil Brazil Share

Challenges
Page 45
Infrastructure
Political and economic crisis

Conclusions
Source: Rabobank, 2014
Logistics
Will logistics capacity grow at the same rate as production & export availability?
Increased demand
Asian Protein demand
Domestic Middle Class
Health & security
Animal Heath status
Food safety & quality
Economic framework
Credit crunch, crisis
Exchange rates
Economics
Grain costs
Large (600 mn) domestic market with rising real incomes
Environment
Climate change & emissions
Animal welfare
Potential
Room to growth in productivity
Land and water availability
Page 46
S
O
W
T
Volatile business environment
Exchange rate, commodity prices, interest rates

47
Rabobank International…
“The financial link in the global food chain”™