Embed Size (px)
Citation preview

Department of Applied Geophysics, Indian School of Mines, Dhanbad
*CSIR-National Geophysical Research Institute, Hyderabad
10th Biennial International Conference & Exposition
P 372
Pore Pressure Prediction from Seismic Data using Neural Network
Dip Kumar Singha, Rima Chatterjee, Maheswar Ojha* and Kalachand Sain*
Summary
We have applied a probabilistic neural network (PNN) based approach to predict subsurface pore pressure from 2D multi
channel seismic data. A series of elastic parameters namely P-wave velocity (Vp), S-wave velocity (Vs), Density (dn), Vp/Vs,
P wave impedance (Zp) and S wave impedance (Zs) derived from seismic data using pre-stack inversion and the pore
pressure (PP) estimated from the sonic interval transit time log. The PP for the depth interval 1060-1280 m is ranging from
10.5 to 12.9 MPa where the vertical stress varies from 10.7 to 13.4 MPa at the same depth interval. The estimated PP has
been considered as target log or actual PP during the training of probabilistic neural network (PNN). The input parameters
used to train the PNN are Zp, Zs, Vp/Vs and density to obtain the predicted PP within the time interval of 1420 – 1620 ms
corresponding to the depth interval of 1060-1280m. Two types of PNN models are generated: one from synthetic seismic
angle gather from log and another from pre-stack seismic angle gather. Another set of PNN models are generated with
additional seismic including time, integrated absolute amplitude, dominant frequency, instantaneous phase and apparent
polarity. The trained PNN is then used to generate subsurface PP along a 2D seismic line from Krishna-Godavari basin.
The result shows the pressure predicted from multi seismic attributes using neural network varies laterally till drill depth of
the well but after that no significant variation is observed. Prediction of pore pressure is essential in any comprehensive
geomechanical studies of reservoir.
Keywords: Pore pressure, inverted seismic parameters, probabilistic neural network
Introduction
Predrill estimation of PP from seismic data is a standard
practice followed by many major oil companies. Pore
Pressure information guides the development of the mud
schedule, casing program, rig selection and wellhead
ratings (Chhajlani et al., 2002). Pore Pressure analysis
can be useful in understanding geological influences on
hydrocarbon accumulation. For example it is preferable
to drill the flank of a structure rather than its highest point
where higher pressure within the gas cap may cause
difficulty in drilling.
Krishna-Godavari (K-G) basin is a petroliferous basin,
producing oil and gas located near the mid portion of
eastern continental margin of India (ECMI). It holds a
large number of structures and traps which have been
identified for drilling in the onland and offshore parts of
the basin (Rao, 2001). The knowledge of pore pressure
and fracture pressure during the exploration phase of K-G
basin is required to study the hydrocarbon trap seals,
mapping of migration pathways, analyzing trap
configurations, basin geometry and calibrations for basin
modeling (Chopra and Huffman, 2006). Several authors
have reported that the overpressure at the ECMI has been
generated in the low permeability sediment or in the
sediment, bounded by low permeability media (Roy et al,
2010, Chatterjee et al., 2011)).
The velocity techniques such as stacking/dip
moveout/migration velocities, continuous velocity
analysis (CVA) and residual velocity analysis (RVA)
have been used for determining pore pressure prediction
(Cibin et al., 2008). For predrill pore pressure prediction,
pore pressure can be obtained from seismic velocities
using a velocity-to–pore-pressure transform (Sayers et al.,
2002). The seismic velocities have lower resolution for
well planning purposes. The velocities obtained from
well logs will have higher resolution but well logs are
generally available at few sparse locations thus PP

2
prediction from pre-stack seismic data if possible appears
to be a viable solution.
The integration of well log data and seismic data has
become increasingly important (and successful) in recent
years due to the shift from exploration to development of
existing fields, with a large numbers of wells. Neural
networks have gained an immense popularity in
geophysics since the last decade. They can be used
effectively for integrating seismic and well data.
The main aim of this paper is to predict PP from a 2D
seismic line of about 8 km length located at K-G
offshore. Synthetic angle gather generated from a well
log located at CDP 545 has been used for pre-stack
inversion. The inverted Zp, Zs, Vp/Vs and density have
been considered as input parameters for a PNN model for
training at well location. The trained PNN was then used
for predicting subsurface PP along the 2D seismic line.
Figure 1: Angle gather section of the prestack CDP gather
Theory
Vertical stress (Sv) has been calculated using bulk
density of the rock which is force per unit area applied by
load of rock above the point of measurement. The
required equation given by (Plumb et al., 1991) is
Sv = ∫ ρ (z)g dzz
0 ---------- (1)
where z is depth at point of measurement, bulk density of
the rock which is function of the depth and g =
acceleration of gravity.
The pore pressure (PP) has been calculated using Eaton’s
(Eaton, 1972) sonic equation
PP = Sv – (Sv –Ph) (tn/to)3 ------------- (2)
The hydrostatic pressure (Ph) is assumed to be 10
MPa/km. tn = normal compaction trend (NCT) of interval
compressional travel time, to = observed interval
compressional travel time. NCT has been drawn against
normal compacted shale from a well located at CDP of
545 (Figure 1). Figure 1 shows the CDP gathers and well
location for this study.
Probabilistic Neural Network (PNN)
The Probabilistic Neural Network (PNN) is actually a
mathematical interpolation scheme, which happens to use
neural network architecture for its implementation.
Figure 2. Structure of a conventional PNN
The input layer receives a sample X composed of d
features X1, X2….Xd. There is one hidden unit per
sample in the hidden layer. The hidden unit Xij
corresponds to the i-th, i = 1…, Nj training in the j-th
class, j = 1…, M. the output of the hidden unit Xij with
respect to X is as follows
𝑎𝑖𝑗(X) = 1
(2𝜋)𝑑/2𝜎𝑑 exp {− (X−X𝑖𝑗)𝑇(X−X𝑖𝑗)
2𝜎2 } ---------- (3)
where 𝜎 (sigma) represents the smoothing parameter.
There are M output units, one for each class Cj, j = 1, …,
M. the j-th output defines as
Y𝑗(X) =1
𝑁𝑗 ∑ 𝑎𝑖𝑗(X)
𝑁𝑗
𝑖=1, j = 1, …….., M ……. (4)
The output layer classifies the sample X to class Ck
which satisfies
3
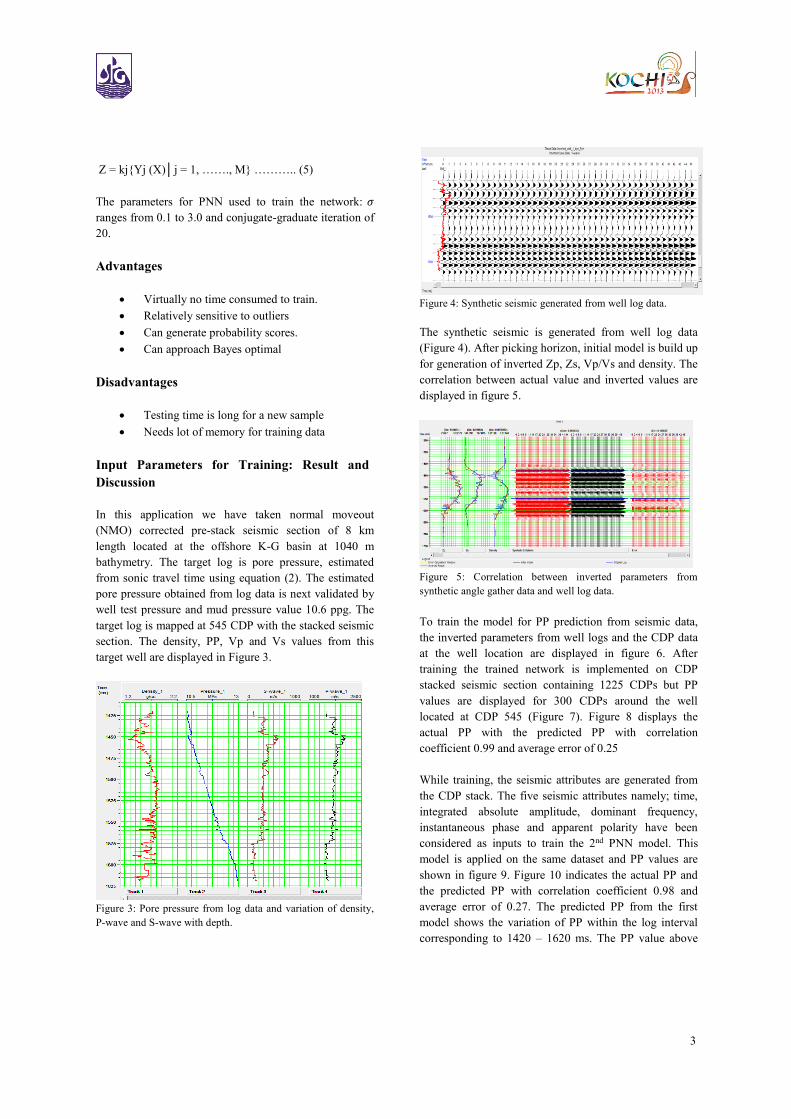
Z = kj{Yj (X)│j = 1, ……., M} ……….. (5)
The parameters for PNN used to train the network: 𝜎
ranges from 0.1 to 3.0 and conjugate-graduate iteration of
20.
Advantages
Virtually no time consumed to train.
Relatively sensitive to outliers
Can generate probability scores.
Can approach Bayes optimal
Disadvantages
Testing time is long for a new sample
Needs lot of memory for training data
Input Parameters for Training: Result and
Discussion
In this application we have taken normal moveout
(NMO) corrected pre-stack seismic section of 8 km
length located at the offshore K-G basin at 1040 m
bathymetry. The target log is pore pressure, estimated
from sonic travel time using equation (2). The estimated
pore pressure obtained from log data is next validated by
well test pressure and mud pressure value 10.6 ppg. The
target log is mapped at 545 CDP with the stacked seismic
section. The density, PP, Vp and Vs values from this
target well are displayed in Figure 3.
Figure 3: Pore pressure from log data and variation of density,
P-wave and S-wave with depth.
Figure 4: Synthetic seismic generated from well log data.
The synthetic seismic is generated from well log data
(Figure 4). After picking horizon, initial model is build up
for generation of inverted Zp, Zs, Vp/Vs and density. The
correlation between actual value and inverted values are
displayed in figure 5.
Figure 5: Correlation between inverted parameters from
synthetic angle gather data and well log data.
To train the model for PP prediction from seismic data,
the inverted parameters from well logs and the CDP data
at the well location are displayed in figure 6. After
training the trained network is implemented on CDP
stacked seismic section containing 1225 CDPs but PP
values are displayed for 300 CDPs around the well
located at CDP 545 (Figure 7). Figure 8 displays the
actual PP with the predicted PP with correlation
coefficient 0.99 and average error of 0.25
While training, the seismic attributes are generated from
the CDP stack. The five seismic attributes namely; time,
integrated absolute amplitude, dominant frequency,
instantaneous phase and apparent polarity have been
considered as inputs to train the 2nd PNN model. This
model is applied on the same dataset and PP values are
shown in figure 9. Figure 10 indicates the actual PP and
the predicted PP with correlation coefficient 0.98 and
average error of 0.27. The predicted PP from the first
model shows the variation of PP within the log interval
corresponding to 1420 – 1620 ms. The PP value above

4
and below this time interval appears erroneous. The
second model predicted result shows variation of PP
within the time interval 1420 – 1620 ms with the
erroneous values beyond the interval. Therefore we have
attempted to consider another PNN models using
inversion of pre-stack seismic gather to derive the same
parameters: Zp, Zs, Vp/Vs and density.
Figure 6: The target log, the CDP seismic data and four input
parameters like, inverted Zp, Zs, Vp/Vs and density from
synthetic seismic are used for training the PNN model.
Figure 7: Pore pressure of the seismic section using synthetic
elastic parameters Zp, Zs, Vp/Vs and density through PNN
model.
The seismic elastic parameters such as Zp, Zs, Vp, Vs,
density and Vp/Vs have been obtained through pre-stack
seismic inversion. Initial model is build through log data
interpolation and extended to seismic angle gather by
picking the horizons (Figure 11). The correlations
between actual and seismic inverted elastic parameters
are shown in figure 12. While inversion seismic attributes
are also generated. For prediction of PP, two numbers of
PNN model are generated, one with the elastic parameters
and other with the seismic attributes. In the third PNN
model; Zp, Zs, Vp/Vs, density are fed as input parameters
to train PNN (Figure 13). Figure 14 and 15 show the
predicted PP and correlation between predicted and actual
Figure 8: Cross plot of predicted pressure from seismic and
actual pressure for synthetic elastic parameters PNN
Figure 9: Pore pressure using seismic attributes through PNN.
Figure 10: Cross plot of predicted pressure from seismic and
actual pressure for attributes PNN.
PP with correlation coefficient 0.98 and average error
0.18. For the fourth PNN model, same seismic attributes
as used in second model have been considered as input
parameters to train the network. This model is applied on
the same dataset and PP values are shown in figure 16.

5
Figure 17 indicates the actual PP and the predicted PP
with correlation coefficient 0.97 and average error of
0.32.
Figure 11: Initial model used in the inversion of pre-stack data.
Figure 12: Correlation between inverted parameters from angle
gather seismic data and well log data
Figure 13: The target log, the CDP seismic data and inverted
seismic parameters Zp, Zs, VpVs and density are used for
training inputs are shown
Figure 14: Pore pressure of the seismic section using seismic
elastic parameters Zp, Zs, Vp/Vs and density through PNN
model.
Figure 15: Cross plot of predicted pressure from PNN and
actual pressure.
The predicted PP obtained using seismic attributes from
inversion of pre-stack angle gather is apparently showing
better result though cross checking is required with PP
values from other wells.
Figure 16: Pore pressure using seismic attributes through PNN.

6
Figure 17: Cross plot of predicted pressure from seismic and
actual pressure.
Conclusions
A pre-drill estimate of formation pore pressure can be
obtained from seismic data and it is predicted using multi
attributes transform through PNN analysis. The elastic
parameters are calculated using pre-stack inversion from
synthetic seismic and pre-stack seismic angle gather data.
It is important to point out that pressure predicted using
1st model neural network varies with depth but no lateral
variation is observed. The predicted PP using seismic
attributes varies laterally and vertically. The PP using 3rd
model indicates lateral variation within drilled depth. The
predicted PP from models 2 and 4 appears to be better
than the other models though further cross-checking is
required with additional well information. The predicted
PP values may be erroneous beyond the drilled depth
because of non availability of well log data.
Acknowledgment
Authors are very much thankful to Director, NGRI,
Hyderabad for providing the required data to prepare this
work. Prof. Mrinal K Sen is highly acknowledged for his
guidance and valuable suggestions. MoES has been
acknowledged for giving us financial support.
References
Chatterjee, R., Mukhopadhyay, M. and Paul, S., 2011,
Overpressure zone under the Krishna–Godavari offshore
basin: geophysical implications for natural hazard in
deeper-water drilling, Nat Hazards, vol.57, pp.121–132.
Chhajlani, R., Zheng., Mayfield, D. and MacArthur, B.,
2002, Utilization of Geomechanics for Medusa Field
Development, Deepwater Gulf of Mexico, SPE Annual
Technical Conference and Exhibition, Texas, 29
September–2 October 2002.
Chopra, S. and Huffman, A., 2006, Velocity
determination for pore pressure prediction, The Leading
Edge, vol. 25, pp.1502-1515.
Cibin, P., Pizzaferri, L. and Martera, M. D., 2008,
Seismic Velocities for Pore-Pressure Prediction. Some
Case Histories, SPG, 7th International Conference and
Exposition on Petroleum Geophysics.
Eaton, B. A., 1972, Graphical method predicts
geopressures worldwide, World Oil, vol. 182, pp. 100-
104.
Hampson, D., Schuelke, J. and Quirein, J., 2001, Use of
Multi-Attribute Transforms to Predict Log Properties
from Seismic Data, Geophysics, vol. 66, pp. 220-236.
Plumb, R.A., Evans, K.F., Engelder, T., 1991,
Geophysical log responses and their corelation with bed-
to-bed stress contrasts in Paleozoic rocks, Appalachian
plateau, New York. Journal of Geophysics Research, vol.
96, pp. 509–528.
Rao, G. N., 2001, Sedimentation, stratigraphy and
petroleum potential of Krishna-Godavari basin, East
Coast of India, AAPG Bulletin, vol. 85, pp. 1623-1043.
Roy, D. K., Ray, G. K. and Biswas, A. K., 2010,
Overview of Overpressure in Bengal Basin, India, Journal
Geological Society of India, vol.75, pp. 644-660.
Sayers, C. M., Johnson, G. M. and Denyer, G., 2002,
Predrill pore-pressure prediction using seismic data,
Geophysics, vol. 67, pp. 1286–1292.