Embed Size (px)
Citation preview
Population Trends
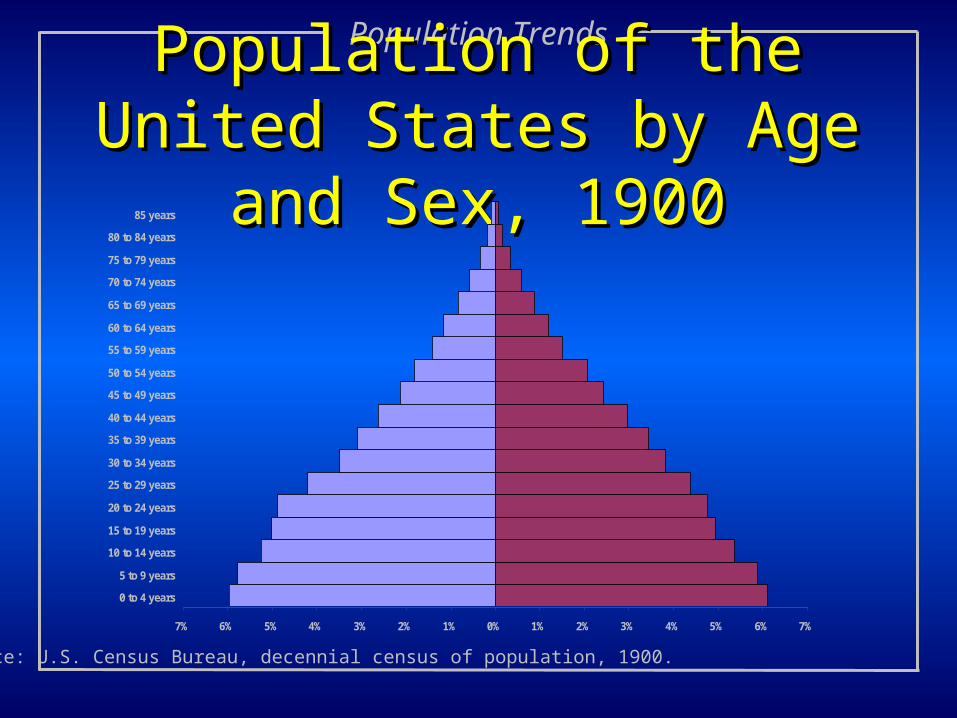
Population of the United States Population of the United States by Age and Sex, 1900by Age and Sex, 1900
Source: U.S. Census Bureau, decennial census of population, 1900.
7% 6% 5% 4% 3% 2% 1% 0% 1% 2% 3% 4% 5% 6% 7%
0 to 4 years
5 to 9 years
10 to 14 years
15 to 19 years
20 to 24 years
25 to 29 years
30 to 34 years
35 to 39 years
40 to 44 years
45 to 49 years
50 to 54 years
55 to 59 years
60 to 64 years
65 to 69 years
70 to 74 years
75 to 79 years
80 to 84 years
85 years
Population Trends
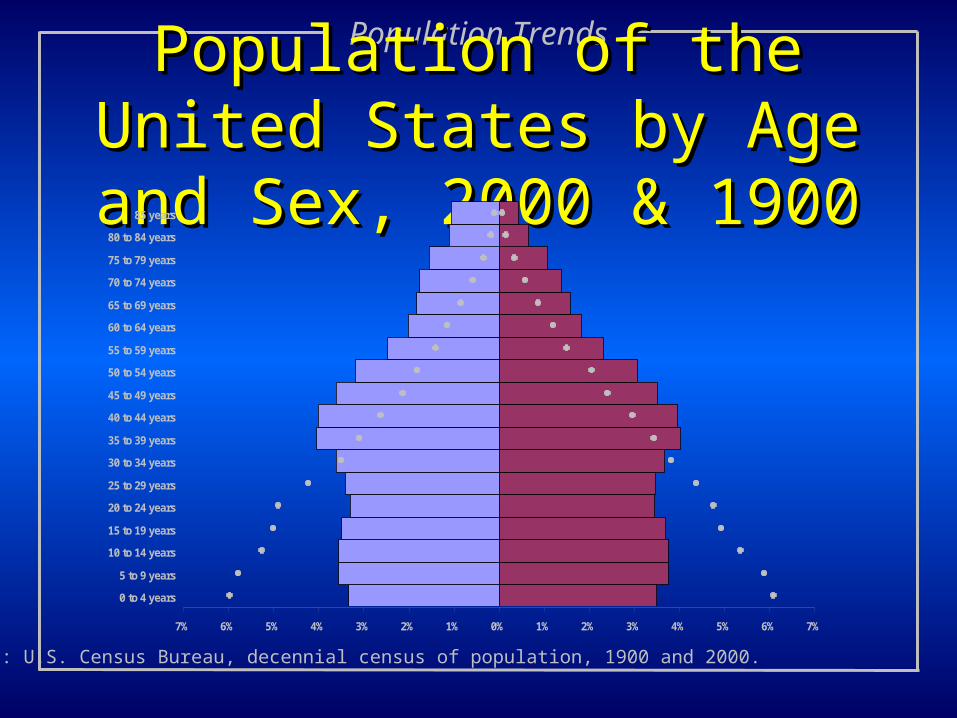
Population of the United States Population of the United States by Age and Sex, 2000 & 1900by Age and Sex, 2000 & 1900
Source: U.S. Census Bureau, decennial census of population, 1900 and 2000.
7% 6% 5% 4% 3% 2% 1% 0% 1% 2% 3% 4% 5% 6% 7%
0 to 4 years
5 to 9 years
10 to 14 years
15 to 19 years
20 to 24 years
25 to 29 years
30 to 34 years
35 to 39 years
40 to 44 years
45 to 49 years
50 to 54 years
55 to 59 years
60 to 64 years
65 to 69 years
70 to 74 years
75 to 79 years
80 to 84 years
85 years
Population Trends
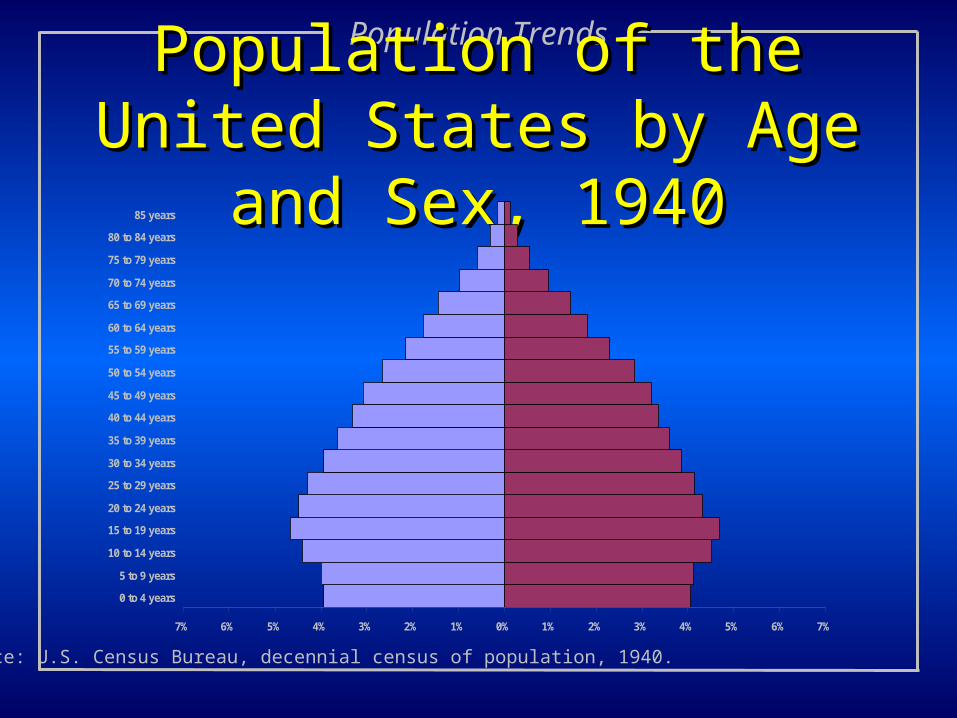
Population of the United States Population of the United States by Age and Sex, 1940by Age and Sex, 1940
Source: U.S. Census Bureau, decennial census of population, 1940.
7% 6% 5% 4% 3% 2% 1% 0% 1% 2% 3% 4% 5% 6% 7%
0 to 4 years
5 to 9 years
10 to 14 years
15 to 19 years
20 to 24 years
25 to 29 years
30 to 34 years
35 to 39 years
40 to 44 years
45 to 49 years
50 to 54 years
55 to 59 years
60 to 64 years
65 to 69 years
70 to 74 years
75 to 79 years
80 to 84 years
85 years
Population Trends
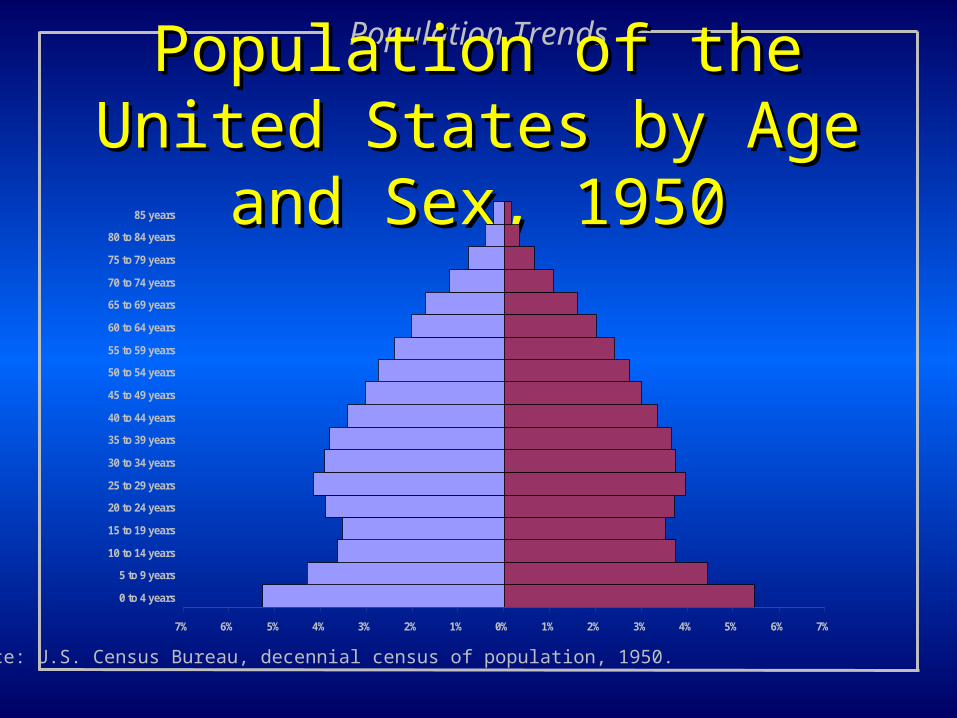
Population of the United States Population of the United States by Age and Sex, 1950by Age and Sex, 1950
Source: U.S. Census Bureau, decennial census of population, 1950.
7% 6% 5% 4% 3% 2% 1% 0% 1% 2% 3% 4% 5% 6% 7%
0 to 4 years
5 to 9 years
10 to 14 years
15 to 19 years
20 to 24 years
25 to 29 years
30 to 34 years
35 to 39 years
40 to 44 years
45 to 49 years
50 to 54 years
55 to 59 years
60 to 64 years
65 to 69 years
70 to 74 years
75 to 79 years
80 to 84 years
85 years
Population Trends
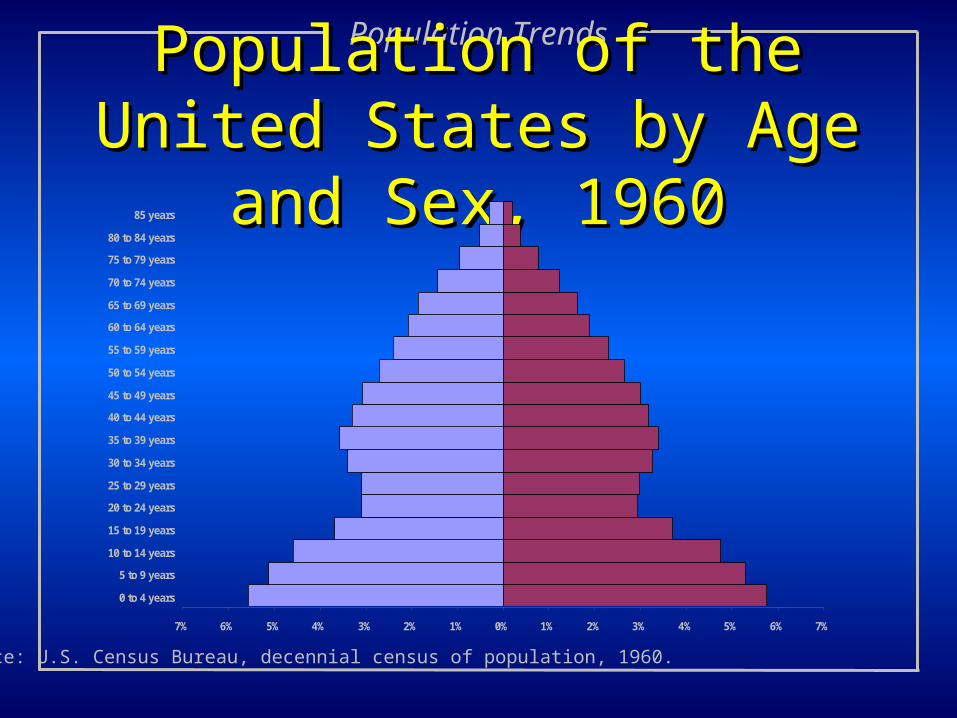
Population of the United States Population of the United States by Age and Sex, 1960by Age and Sex, 1960
Source: U.S. Census Bureau, decennial census of population, 1960.
7% 6% 5% 4% 3% 2% 1% 0% 1% 2% 3% 4% 5% 6% 7%
0 to 4 years
5 to 9 years
10 to 14 years
15 to 19 years
20 to 24 years
25 to 29 years
30 to 34 years
35 to 39 years
40 to 44 years
45 to 49 years
50 to 54 years
55 to 59 years
60 to 64 years
65 to 69 years
70 to 74 years
75 to 79 years
80 to 84 years
85 years
Population Trends
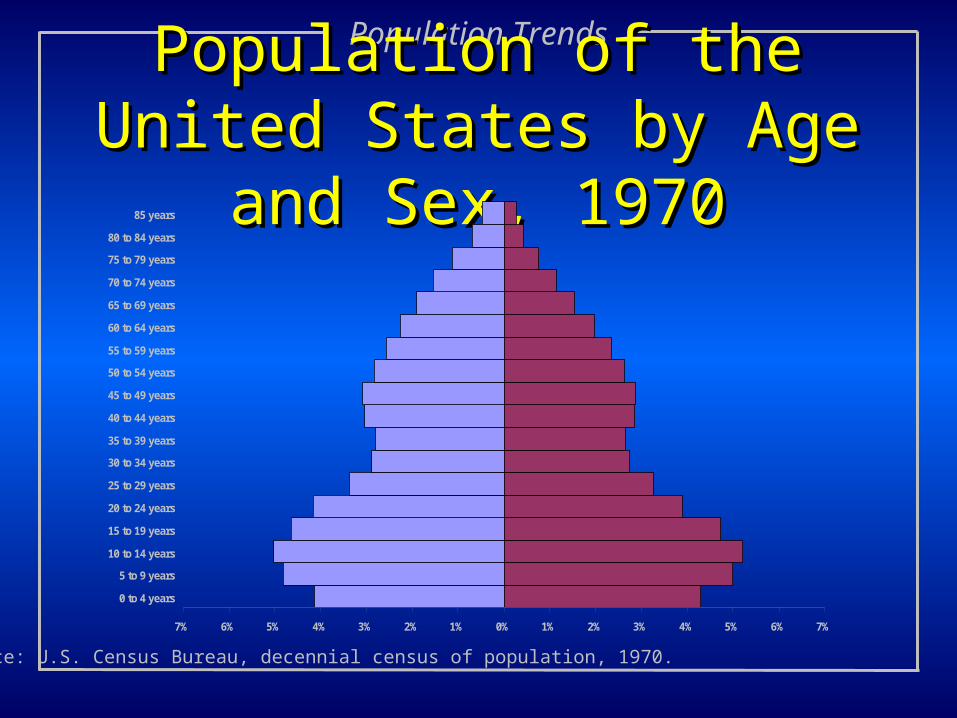
Population of the United States Population of the United States by Age and Sex, 1970by Age and Sex, 1970
Source: U.S. Census Bureau, decennial census of population, 1970.
7% 6% 5% 4% 3% 2% 1% 0% 1% 2% 3% 4% 5% 6% 7%
0 to 4 years
5 to 9 years
10 to 14 years
15 to 19 years
20 to 24 years
25 to 29 years
30 to 34 years
35 to 39 years
40 to 44 years
45 to 49 years
50 to 54 years
55 to 59 years
60 to 64 years
65 to 69 years
70 to 74 years
75 to 79 years
80 to 84 years
85 years
Population Trends
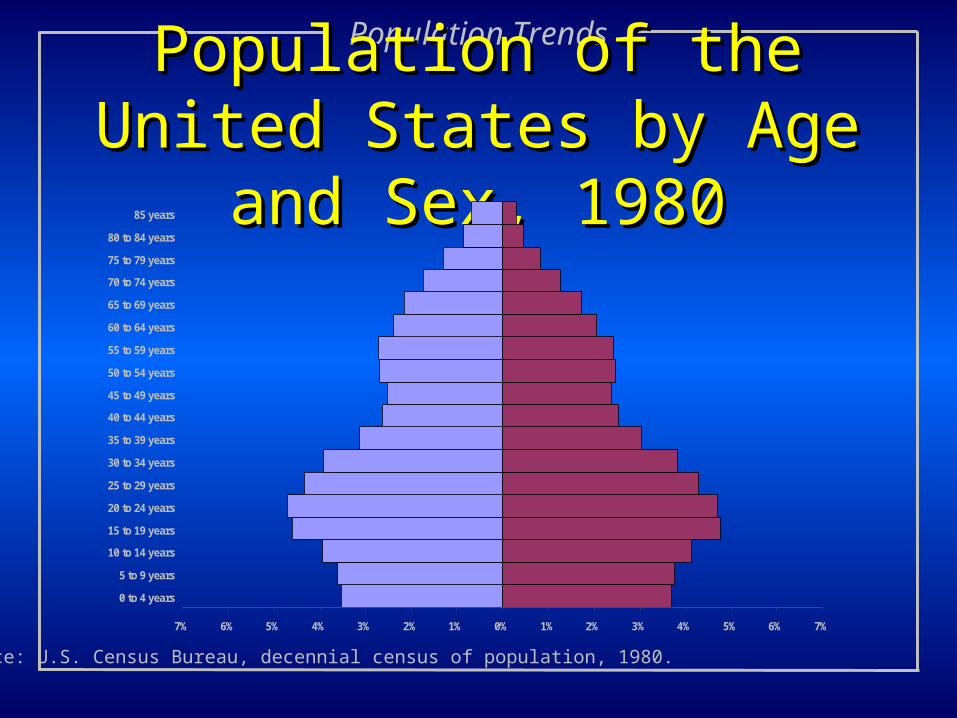
Population of the United States Population of the United States by Age and Sex, 1980by Age and Sex, 1980
Source: U.S. Census Bureau, decennial census of population, 1980.
7% 6% 5% 4% 3% 2% 1% 0% 1% 2% 3% 4% 5% 6% 7%
0 to 4 years
5 to 9 years
10 to 14 years
15 to 19 years
20 to 24 years
25 to 29 years
30 to 34 years
35 to 39 years
40 to 44 years
45 to 49 years
50 to 54 years
55 to 59 years
60 to 64 years
65 to 69 years
70 to 74 years
75 to 79 years
80 to 84 years
85 years
Population Trends
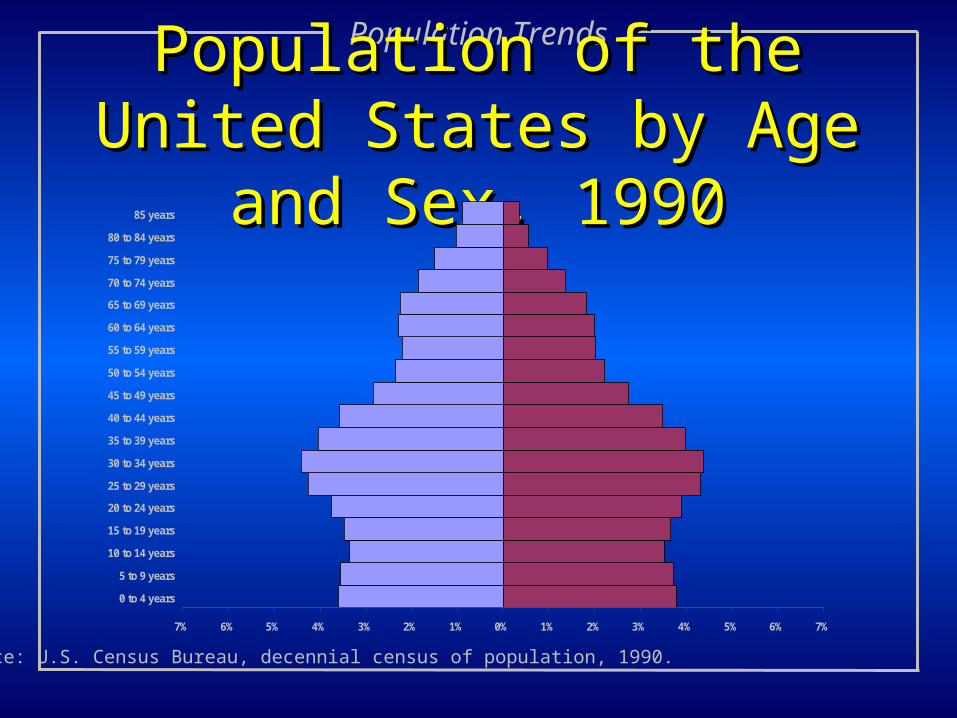
Population of the United States Population of the United States by Age and Sex, 1990by Age and Sex, 1990
Source: U.S. Census Bureau, decennial census of population, 1990.
7% 6% 5% 4% 3% 2% 1% 0% 1% 2% 3% 4% 5% 6% 7%
0 to 4 years
5 to 9 years
10 to 14 years
15 to 19 years
20 to 24 years
25 to 29 years
30 to 34 years
35 to 39 years
40 to 44 years
45 to 49 years
50 to 54 years
55 to 59 years
60 to 64 years
65 to 69 years
70 to 74 years
75 to 79 years
80 to 84 years
85 years
Population Trends
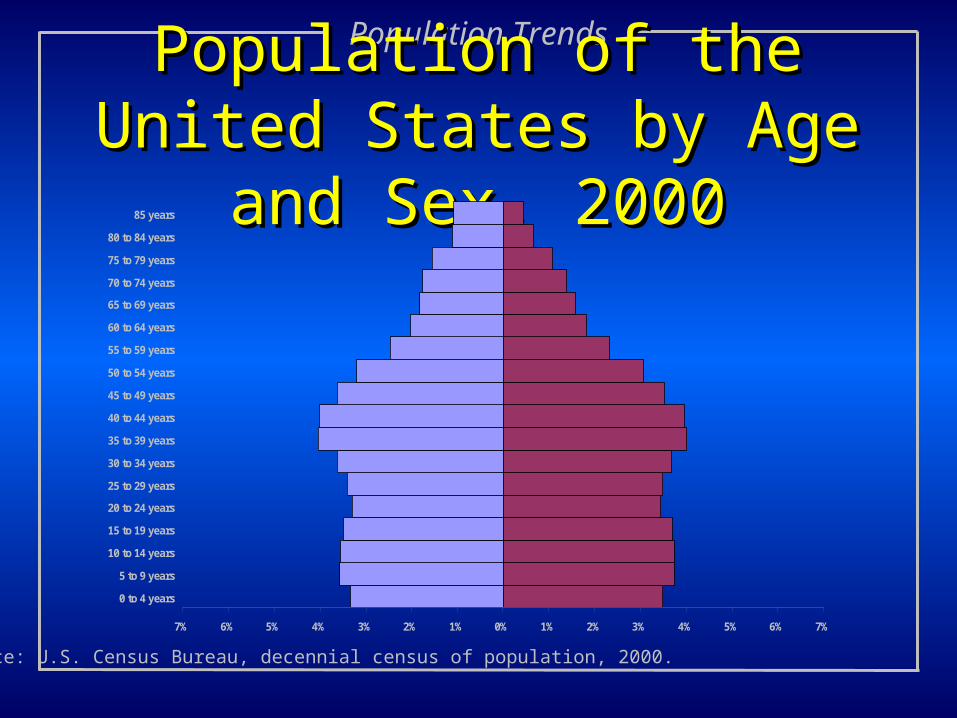
Population of the United States Population of the United States by Age and Sex, 2000by Age and Sex, 2000
Source: U.S. Census Bureau, decennial census of population, 2000.
7% 6% 5% 4% 3% 2% 1% 0% 1% 2% 3% 4% 5% 6% 7%
0 to 4 years
5 to 9 years
10 to 14 years
15 to 19 years
20 to 24 years
25 to 29 years
30 to 34 years
35 to 39 years
40 to 44 years
45 to 49 years
50 to 54 years
55 to 59 years
60 to 64 years
65 to 69 years
70 to 74 years
75 to 79 years
80 to 84 years
85 years
Population Trends
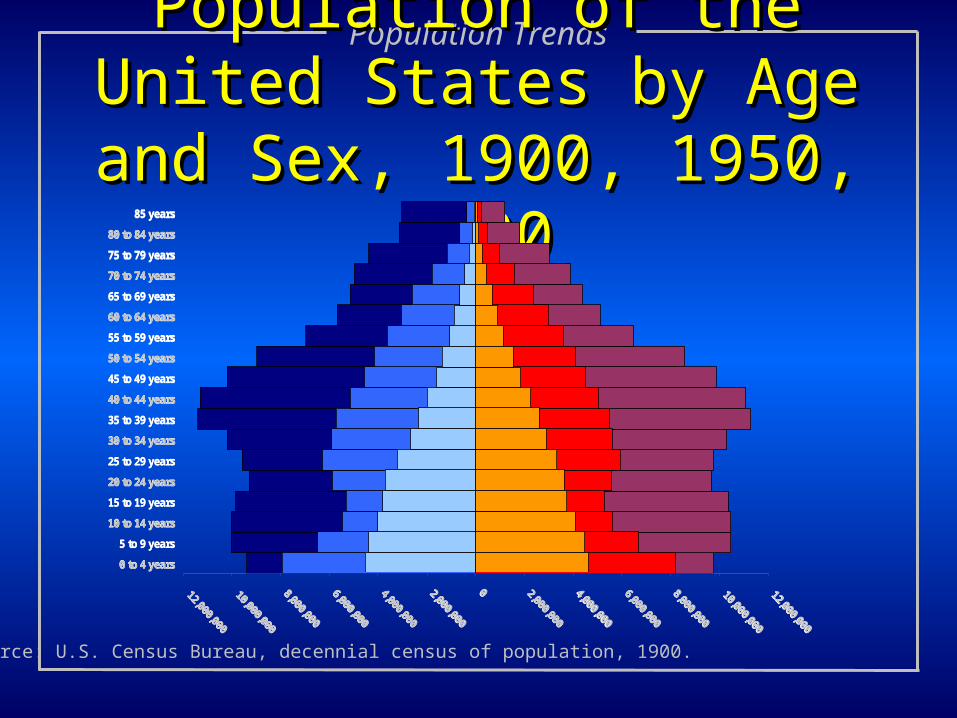
Population of the United States by Population of the United States by Age and Sex, 1900, 1950, 2000Age and Sex, 1900, 1950, 2000
Source: U.S. Census Bureau, decennial census of population, 1900.
0 to 4 years
5 to 9 years
10 to 14 years
15 to 19 years
20 to 24 years
25 to 29 years
30 to 34 years
35 to 39 years
40 to 44 years
45 to 49 years
50 to 54 years
55 to 59 years
60 to 64 years
65 to 69 years
70 to 74 years
75 to 79 years
80 to 84 years
85 years
0 to 4 years
5 to 9 years
10 to 14 years
15 to 19 years
20 to 24 years
25 to 29 years
30 to 34 years
35 to 39 years
40 to 44 years
45 to 49 years
50 to 54 years
55 to 59 years
60 to 64 years
65 to 69 years
70 to 74 years
75 to 79 years
80 to 84 years
85 years
0 to 4 years
10 to 14 years
20 to 24 years
30 to 34 years
40 to 44 years
50 to 54 years
60 to 64 years
70 to 74 years
80 to 84 years
Population Trends
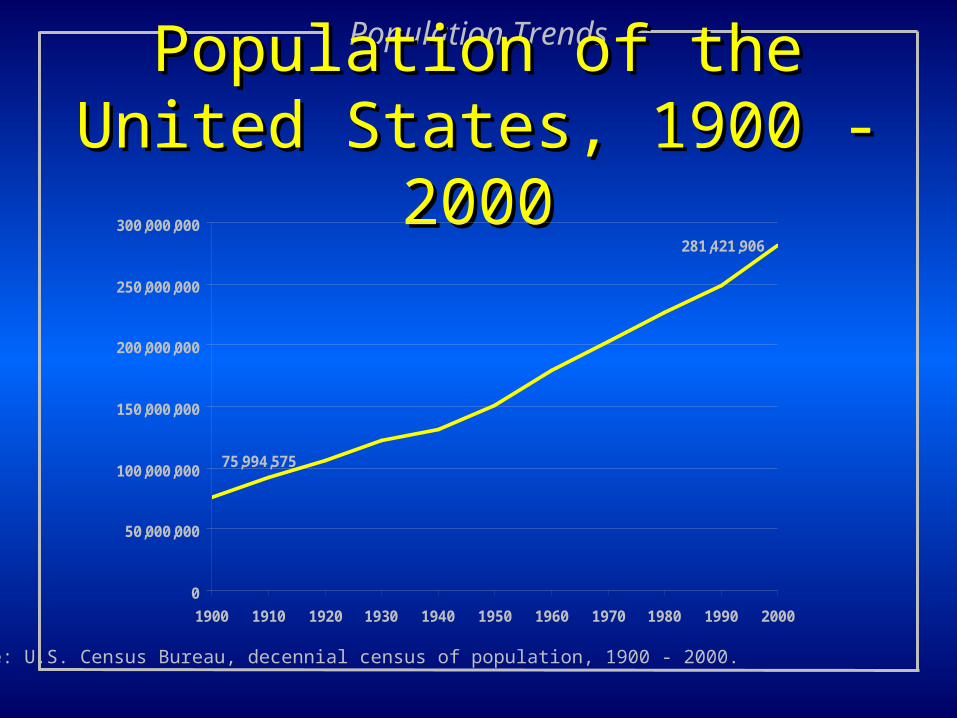
Population of the United States, Population of the United States, 1900 - 20001900 - 2000
Source: U.S. Census Bureau, decennial census of population, 1900 - 2000.
281,421,906
75,994,575
0
50,000,000
100,000,000
150,000,000
200,000,000
250,000,000
300,000,000
1900 1910 1920 1930 1940 1950 1960 1970 1980 1990 2000
Population Trends
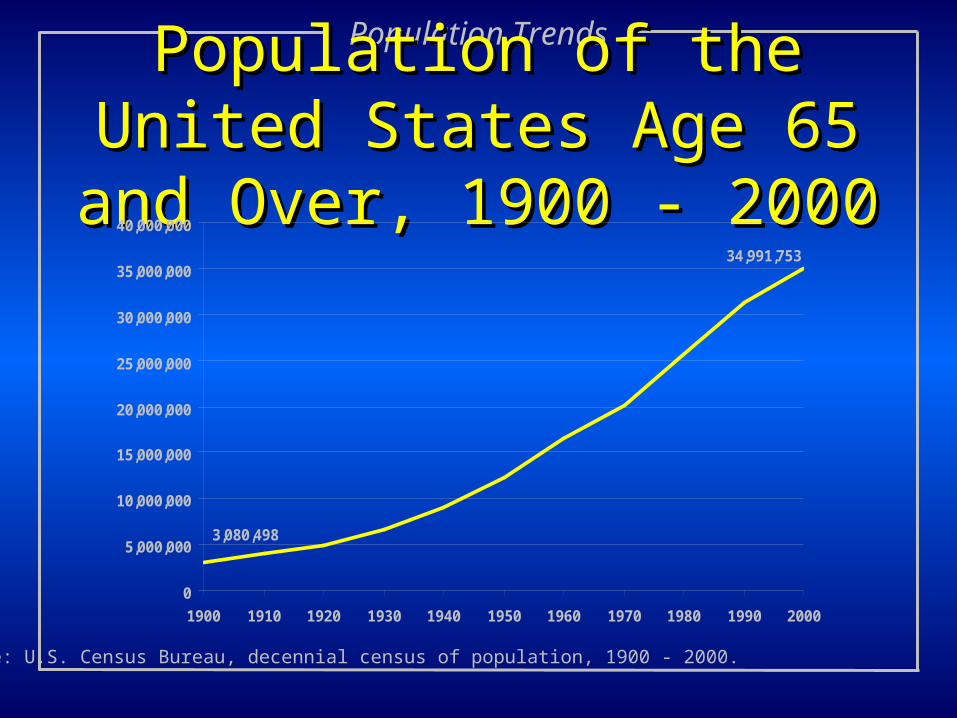
Population of the United States Population of the United States Age 65 and Over, 1900 - 2000Age 65 and Over, 1900 - 2000
Source: U.S. Census Bureau, decennial census of population, 1900 - 2000.
3,080,498
34,991,753
0
5,000,000
10,000,000
15,000,000
20,000,000
25,000,000
30,000,000
35,000,000
40,000,000
1900 1910 1920 1930 1940 1950 1960 1970 1980 1990 2000
Population Trends
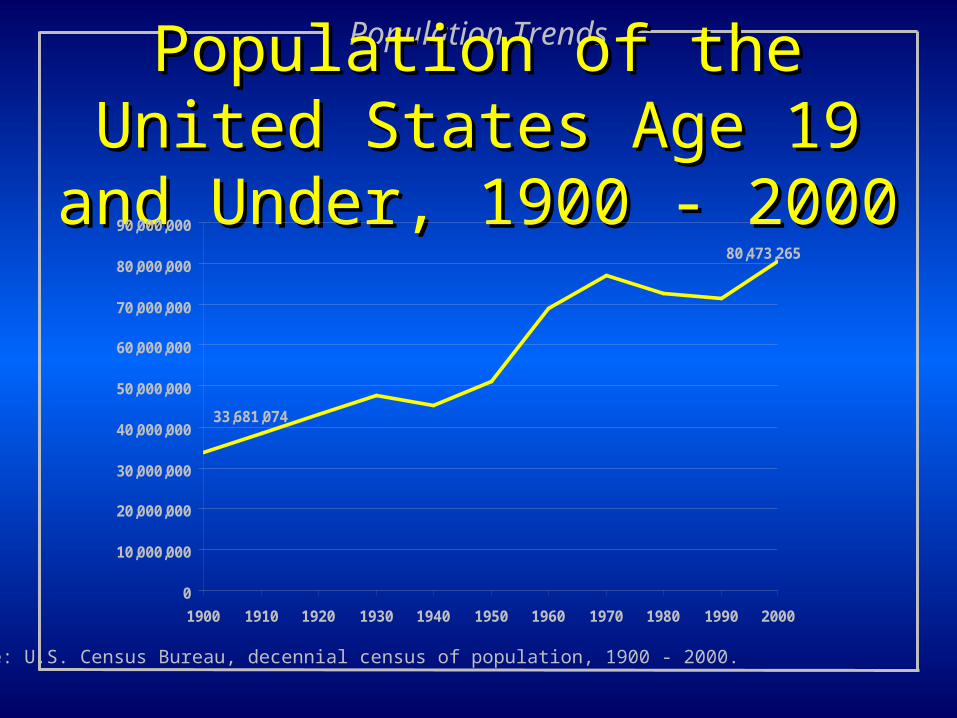
Population of the United States Population of the United States Age 19 and Under, 1900 - 2000Age 19 and Under, 1900 - 2000
Source: U.S. Census Bureau, decennial census of population, 1900 - 2000.
80,473,265
33,681,074
0
10,000,000
20,000,000
30,000,000
40,000,000
50,000,000
60,000,000
70,000,000
80,000,000
90,000,000
1900 1910 1920 1930 1940 1950 1960 1970 1980 1990 2000
Population Trends
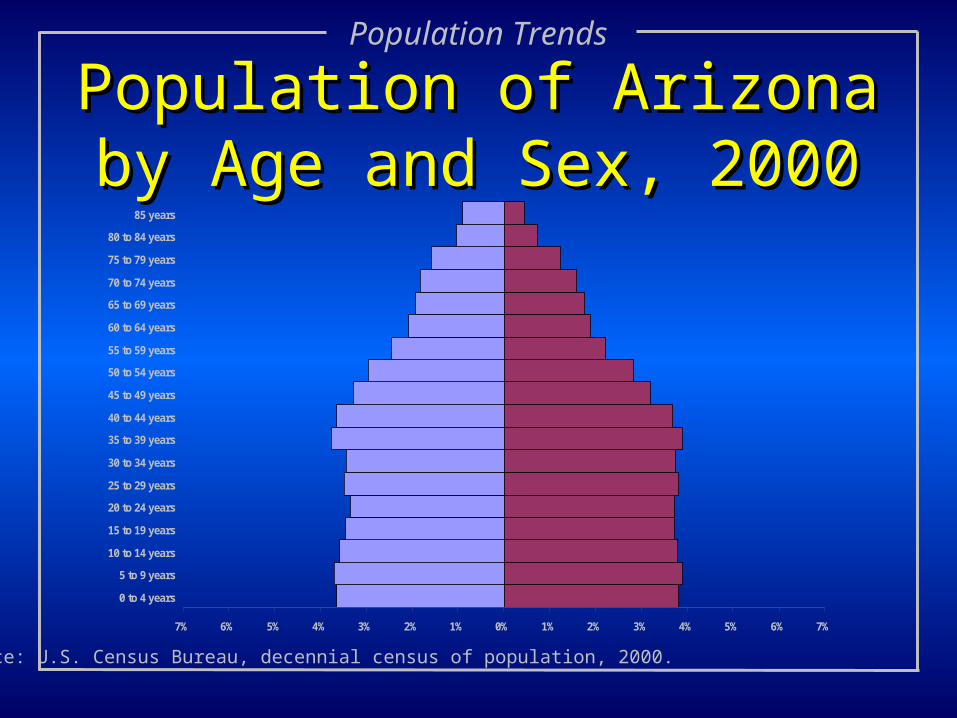
Population of Arizona by Age Population of Arizona by Age and Sex, 2000and Sex, 2000
Source: U.S. Census Bureau, decennial census of population, 2000.
7% 6% 5% 4% 3% 2% 1% 0% 1% 2% 3% 4% 5% 6% 7%
0 to 4 years
5 to 9 years
10 to 14 years
15 to 19 years
20 to 24 years
25 to 29 years
30 to 34 years
35 to 39 years
40 to 44 years
45 to 49 years
50 to 54 years
55 to 59 years
60 to 64 years
65 to 69 years
70 to 74 years
75 to 79 years
80 to 84 years
85 years
Population Trends
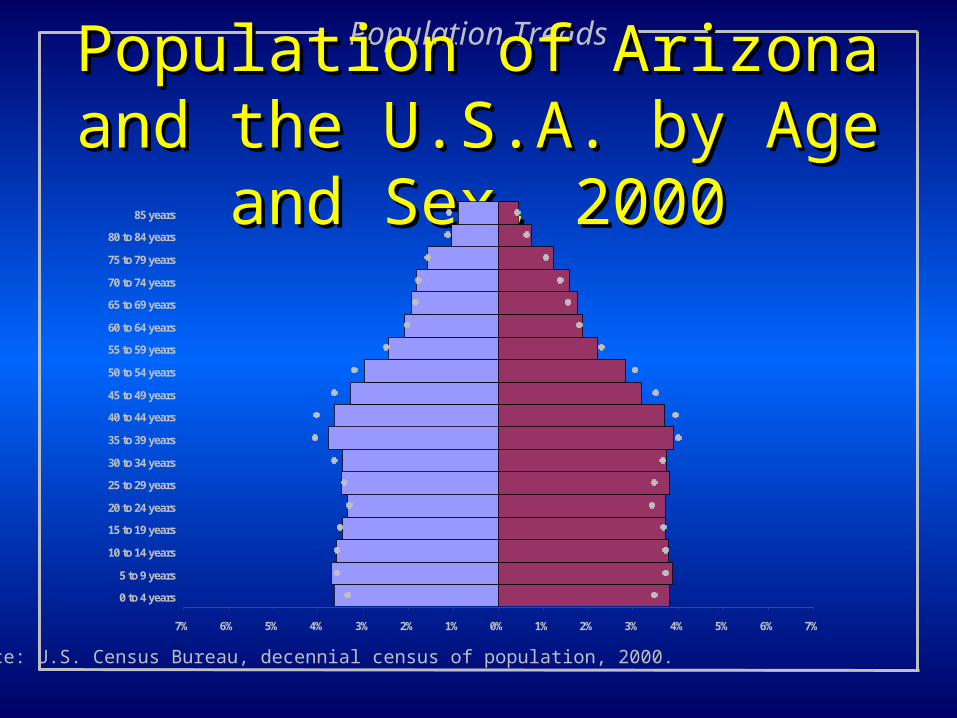
Population of Arizona and the Population of Arizona and the U.S.A. by Age and Sex, 2000U.S.A. by Age and Sex, 2000
Source: U.S. Census Bureau, decennial census of population, 2000.
7% 6% 5% 4% 3% 2% 1% 0% 1% 2% 3% 4% 5% 6% 7%
0 to 4 years
5 to 9 years
10 to 14 years
15 to 19 years
20 to 24 years
25 to 29 years
30 to 34 years
35 to 39 years
40 to 44 years
45 to 49 years
50 to 54 years
55 to 59 years
60 to 64 years
65 to 69 years
70 to 74 years
75 to 79 years
80 to 84 years
85 years
Population Trends
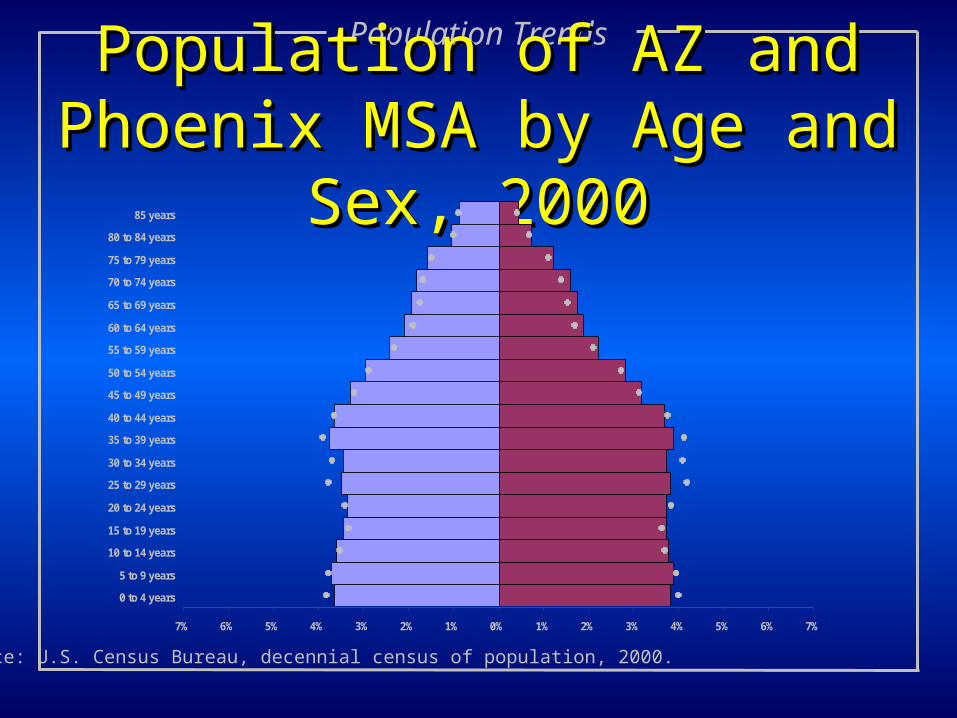
Population of AZ and Phoenix Population of AZ and Phoenix MSA by Age and Sex, 2000MSA by Age and Sex, 2000
Source: U.S. Census Bureau, decennial census of population, 2000.
7% 6% 5% 4% 3% 2% 1% 0% 1% 2% 3% 4% 5% 6% 7%
0 to 4 years
5 to 9 years
10 to 14 years
15 to 19 years
20 to 24 years
25 to 29 years
30 to 34 years
35 to 39 years
40 to 44 years
45 to 49 years
50 to 54 years
55 to 59 years
60 to 64 years
65 to 69 years
70 to 74 years
75 to 79 years
80 to 84 years
85 years
Population Trends
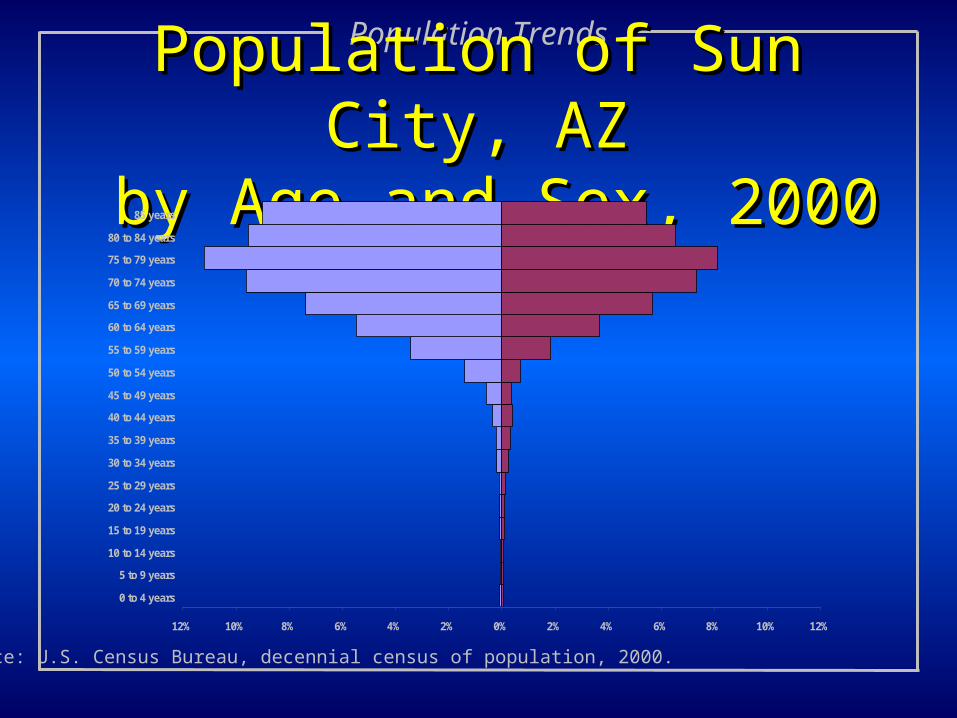
Population of Sun City, AZPopulation of Sun City, AZ by Age and Sex, 2000by Age and Sex, 2000
Source: U.S. Census Bureau, decennial census of population, 2000.
12% 10% 8% 6% 4% 2% 0% 2% 4% 6% 8% 10% 12%
0 to 4 years
5 to 9 years
10 to 14 years
15 to 19 years
20 to 24 years
25 to 29 years
30 to 34 years
35 to 39 years
40 to 44 years
45 to 49 years
50 to 54 years
55 to 59 years
60 to 64 years
65 to 69 years
70 to 74 years
75 to 79 years
80 to 84 years
85 years
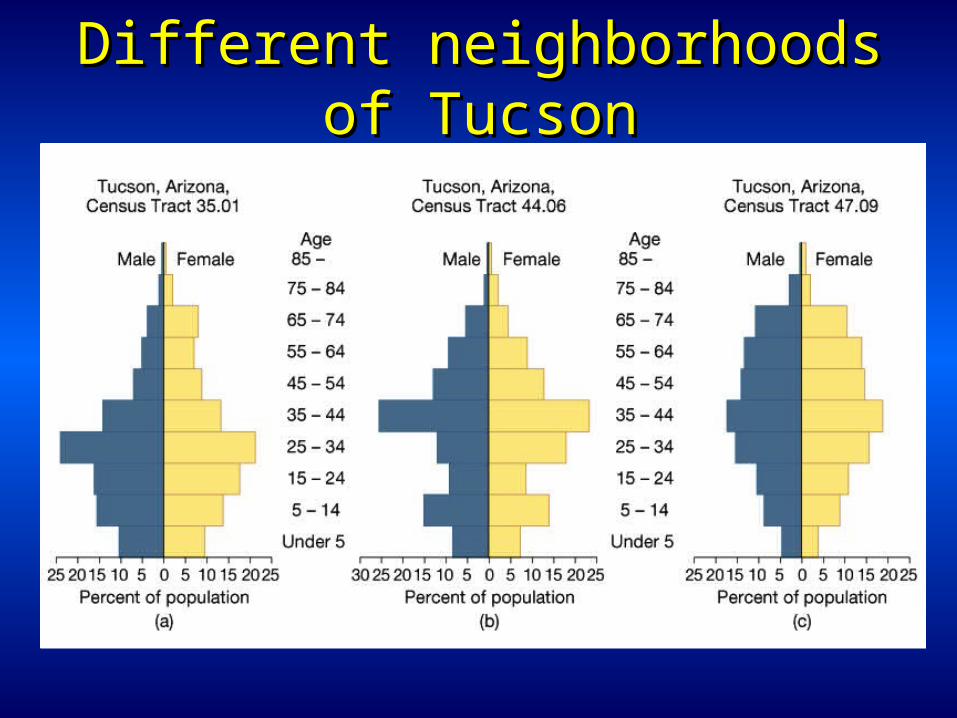
Different neighborhoods of TucsonDifferent neighborhoods of Tucson
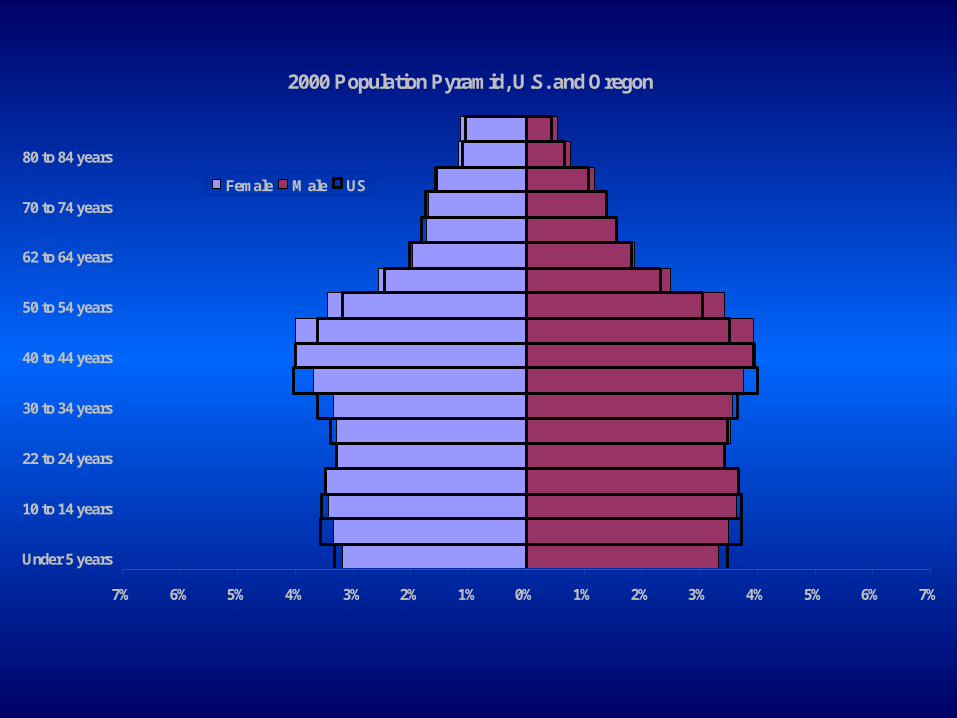
2000 Population Pyramid, U.S. and Oregon
7% 6% 5% 4% 3% 2% 1% 0% 1% 2% 3% 4% 5% 6% 7%
Under 5 years
10 to 14 years
22 to 24 years
30 to 34 years
40 to 44 years
50 to 54 years
62 to 64 years
70 to 74 years
80 to 84 years
Female Male US
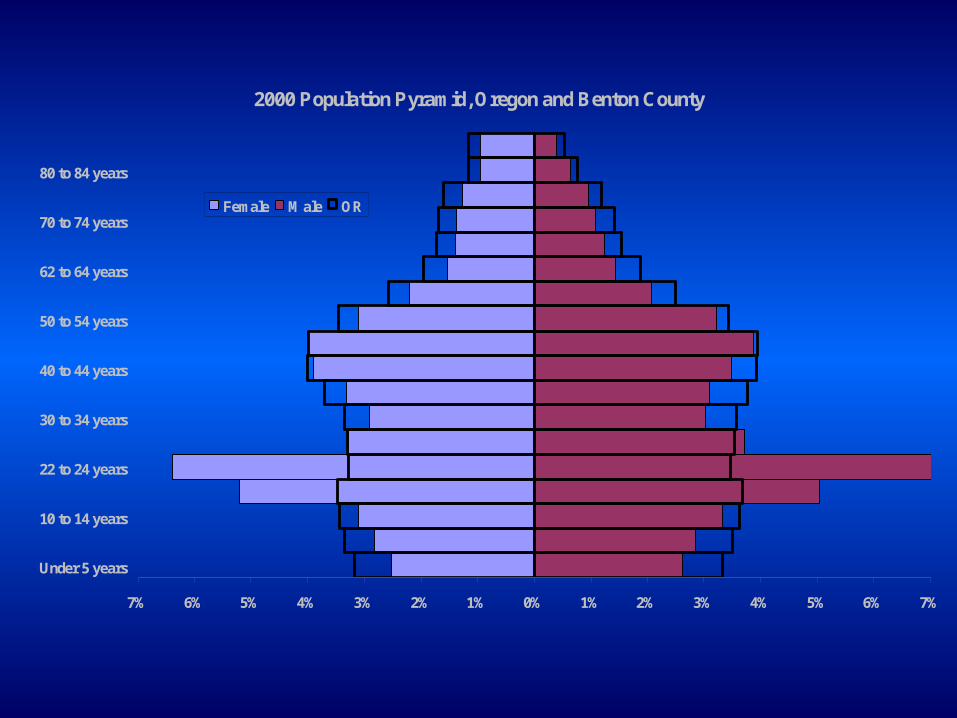
2000 Population Pyramid, Oregon and Benton County
7% 6% 5% 4% 3% 2% 1% 0% 1% 2% 3% 4% 5% 6% 7%
Under 5 years
10 to 14 years
22 to 24 years
30 to 34 years
40 to 44 years
50 to 54 years
62 to 64 years
70 to 74 years
80 to 84 years
Female Male OR
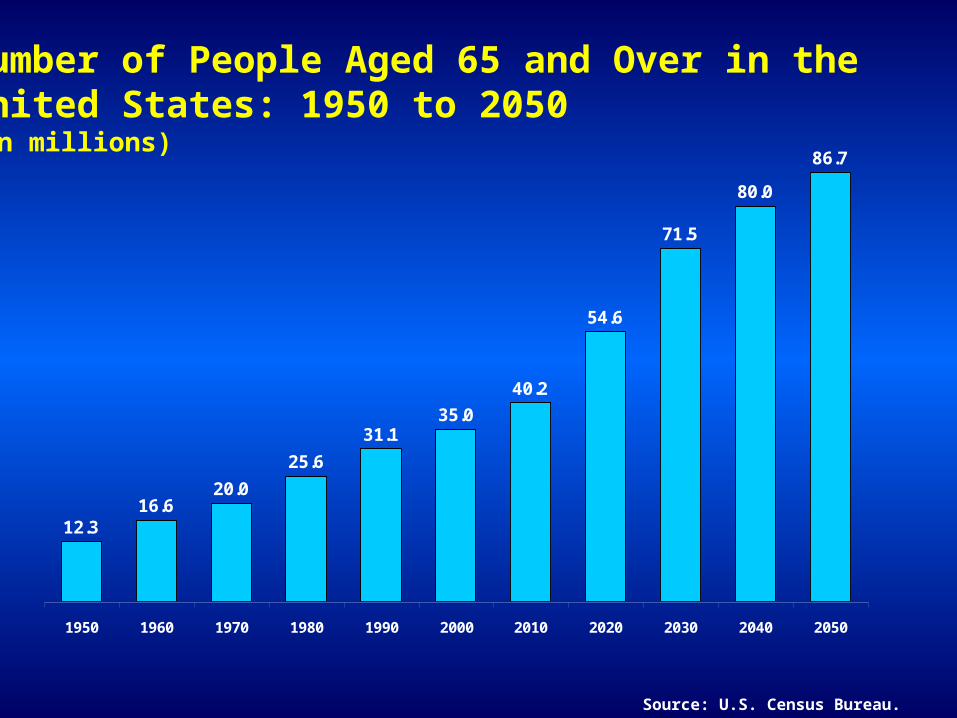
12.316.6
20.0
25.6
31.135.0
40.2
54.6
71.5
80.0
86.7
1950 1960 1970 1980 1990 2000 2010 2020 2030 2040 2050
Number of People Aged 65 and Over in the United States: 1950 to 2050(in millions)
Source: U.S. Census Bureau.
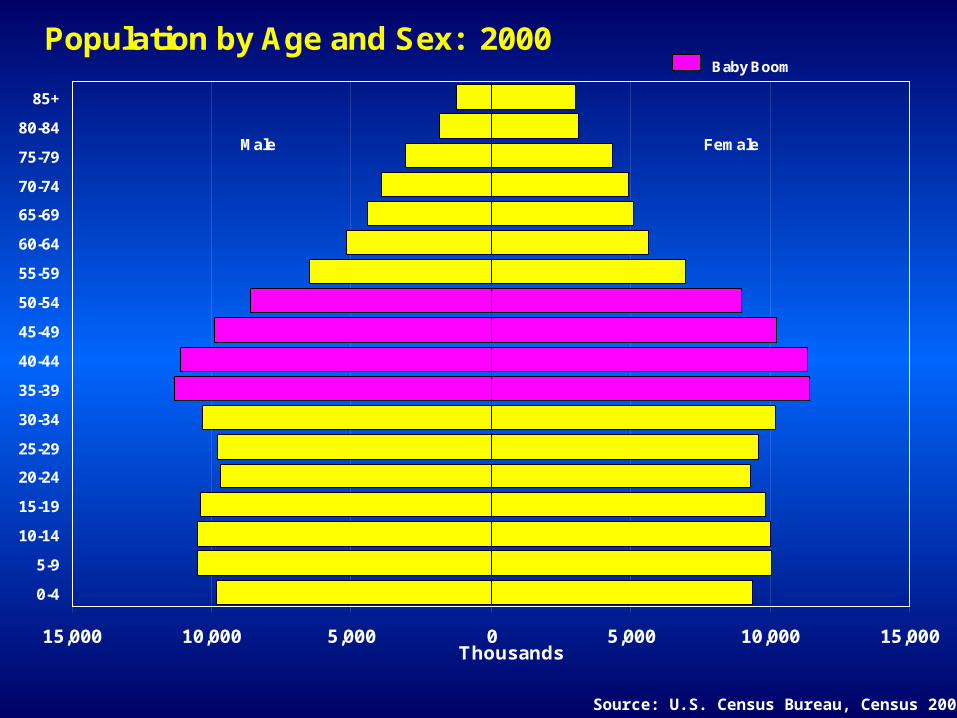
Population by Age and Sex: 2000
15,000 10,000 5,000 0 5,000 10,000 15,000
0-4
5-9
10-14
15-19
20-24
25-29
30-34
35-39
40-44
45-49
50-54
55-59
60-64
65-69
70-74
75-79
80-84
85+
Thousands
Male Female
Baby Boom
Source: U.S. Census Bureau, Census 2000.
15,000 10,000 5,000 0 5,000 10,000 15,000
0-4
5-9
10-14
15-19
20-24
25-29
30-34
35-39
40-44
45-49
50-54
55-59
60-64
65-69
70-74
75-79
80-84
85+
Thousands
Male Female
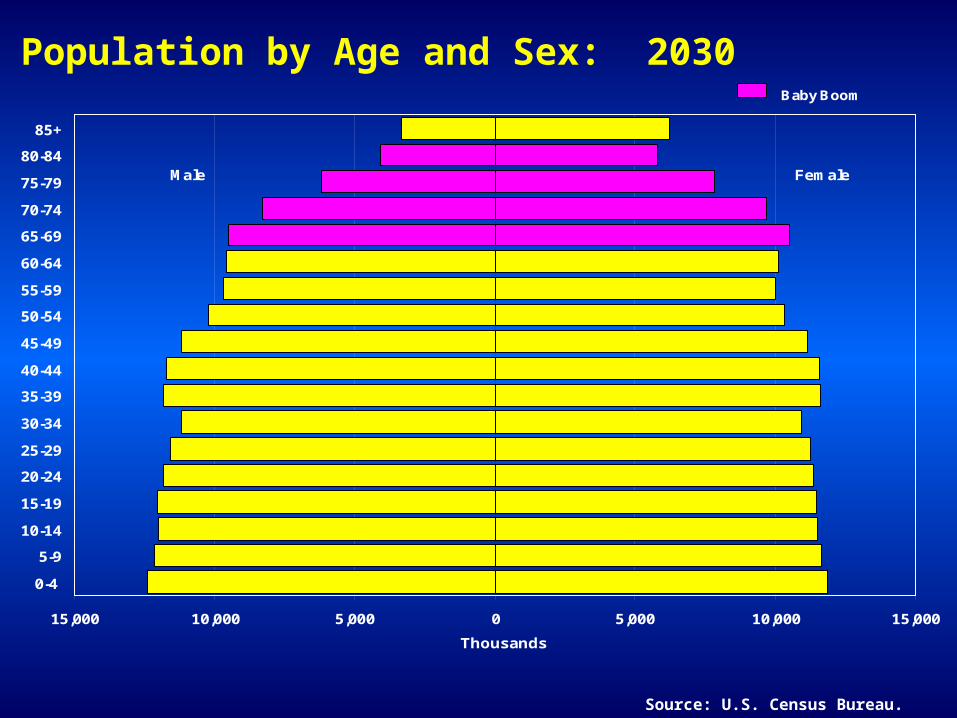
Baby Boom
Population by Age and Sex: 2030
Source: U.S. Census Bureau.
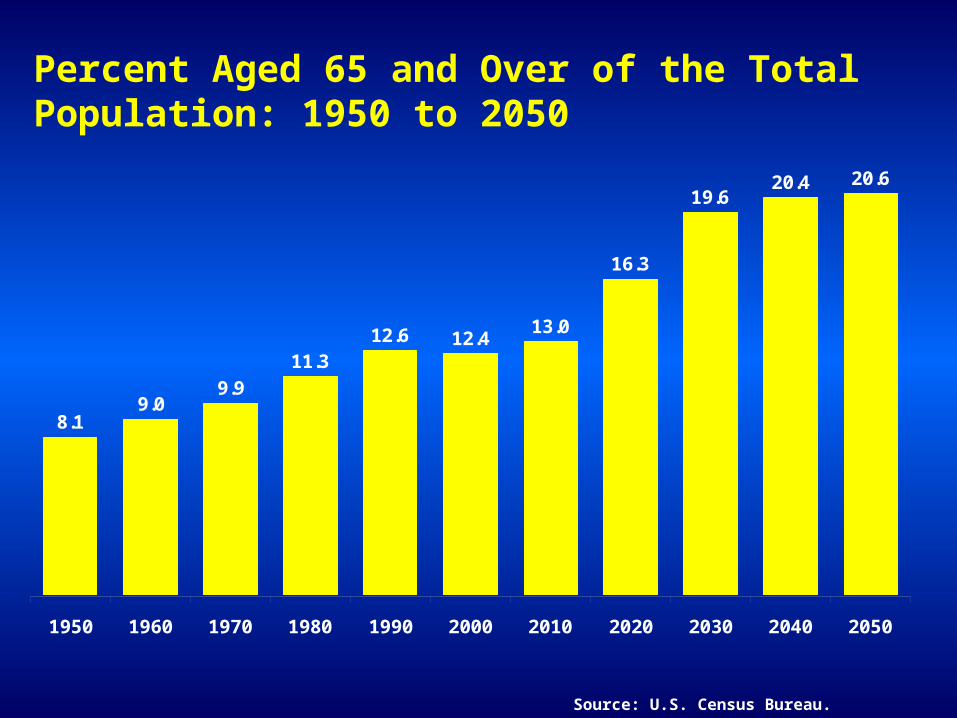
8.19.0
9.9
11.312.6 12.4
13.0
16.3
19.620.4 20.6
1950 1960 1970 1980 1990 2000 2010 2020 2030 2040 2050
Percent Aged 65 and Over of the Total Population: 1950 to 2050
Source: U.S. Census Bureau.
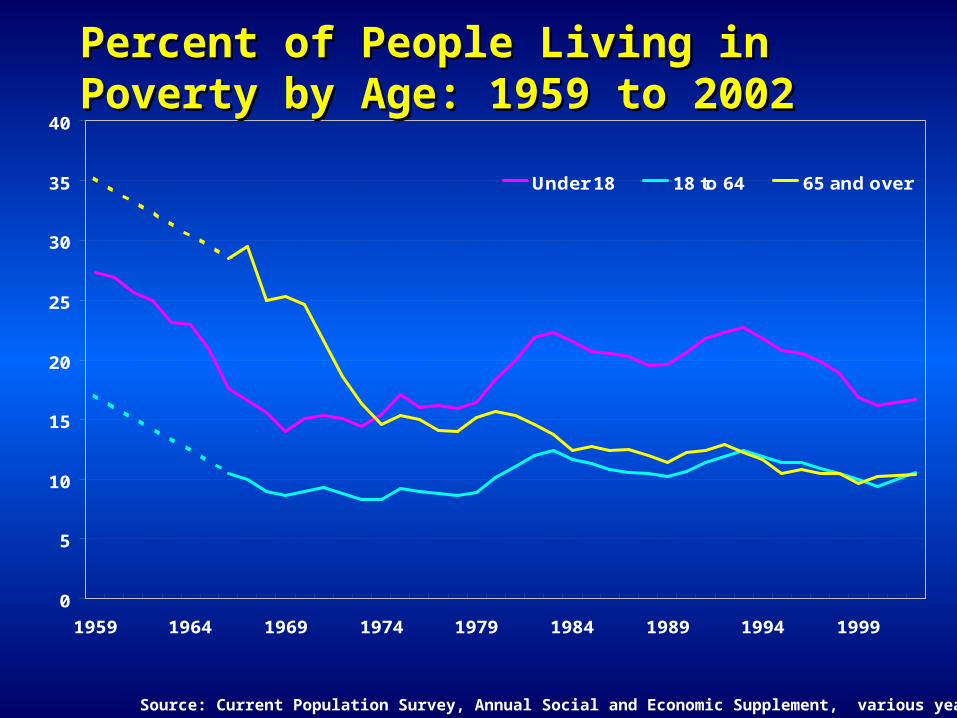
0
5
10
15
20
25
30
35
40
1959 1964 1969 1974 1979 1984 1989 1994 1999
Under 18 18 to 64 65 and over
Percent of People Living in Poverty by Age: Percent of People Living in Poverty by Age: 1959 to 20021959 to 2002
Source: Current Population Survey, Annual Social and Economic Supplement, various years..
Population Trends
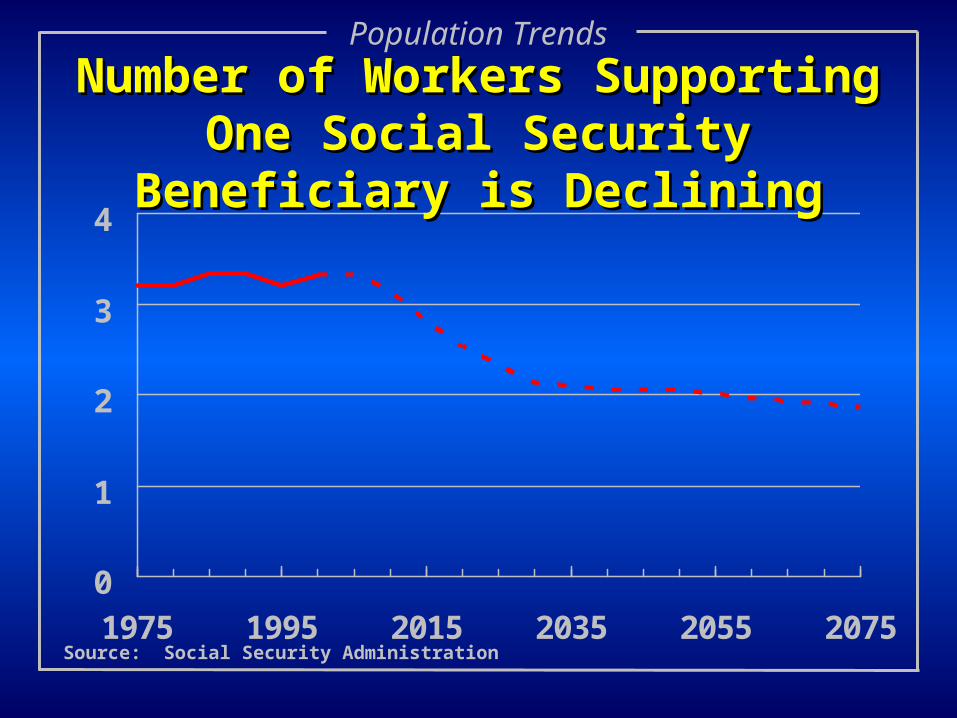
0
1
2
3
4
1975 1995 2015 2035 2055 2075
Number of Workers Supporting One Number of Workers Supporting One Social Security Beneficiary is DecliningSocial Security Beneficiary is Declining
Source: Social Security Administration
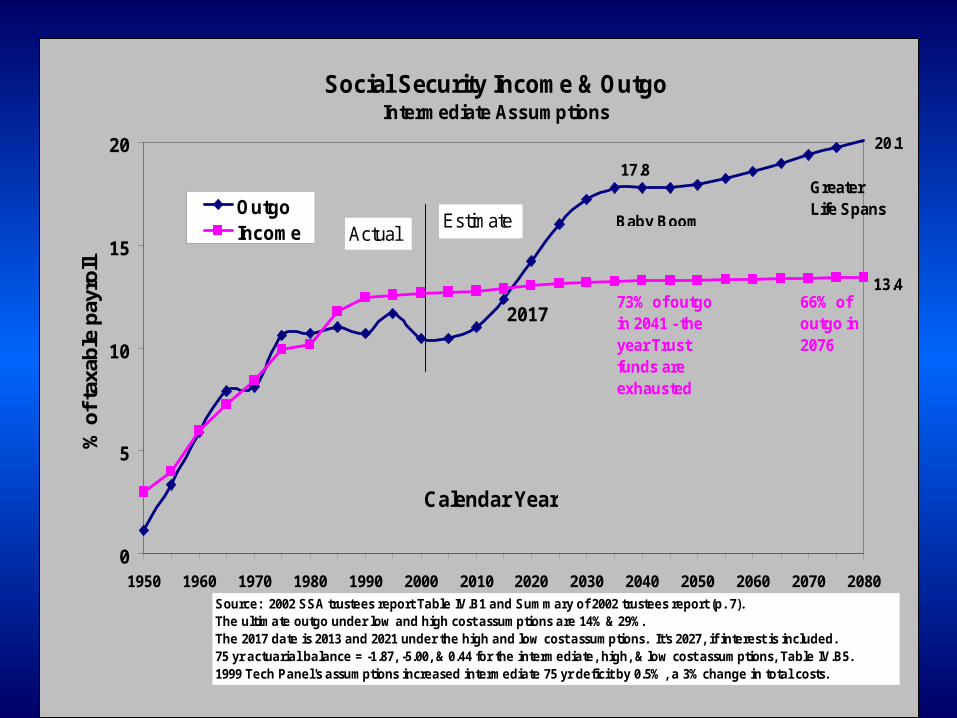
Social Security Income & Outgo Intermediate Assumptions
20.1
17.8
13.4
0
5
10
15
20
1950 1960 1970 1980 1990 2000 2010 2020 2030 2040 2050 2060 2070 2080
Calendar Year
% o
f ta
xab
le p
ayro
ll
OutgoIncome
66% of outgo in 2076
73% of outgo in 2041 - the year Trust funds are exhausted
Baby Boom
GreaterLife Spans
Source: 2002 SSA trustees report Table IV.B1 and Summary of 2002 trustees report (p. 7).The ultimate outgo under low and high cost assumptions are 14% & 29%.The 2017 date is 2013 and 2021 under the high and low cost assumptions. It's 2027, if interest is included.75 yr actuarial balance = -1.87, -5.00, & 0.44 for the intermediate, high, & low cost assumptions, Table IV.B5.1999 Tech Panel's assumptions increased intermediate 75 yr deficit by 0.5% , a 3% change in total costs.
Estimates
Actual
2017
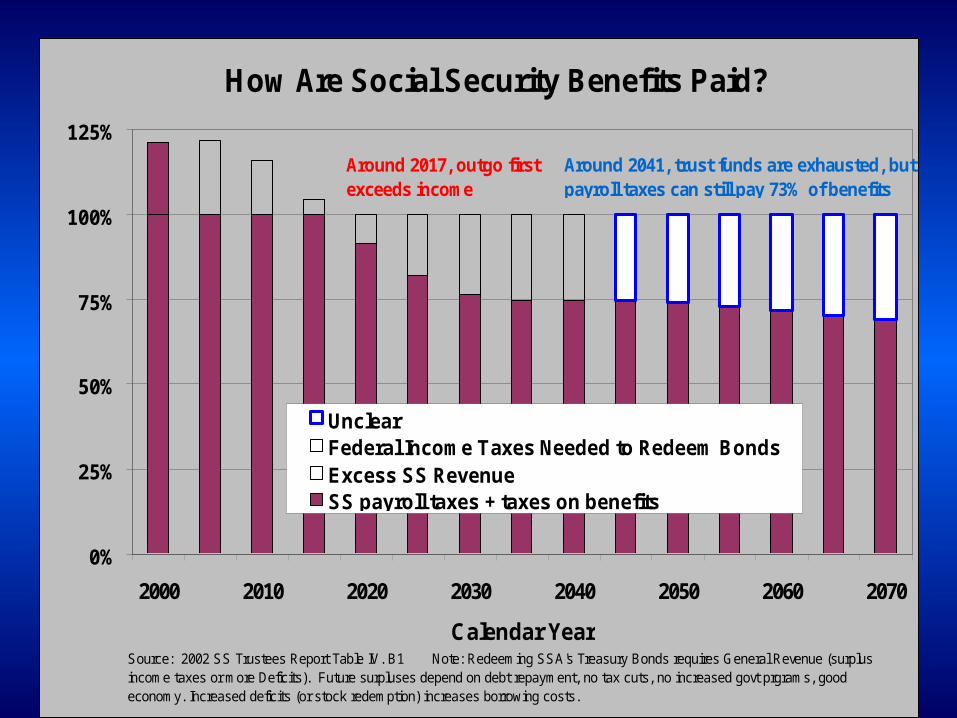
How Are Social Security Benefits Paid?
0%
25%
50%
75%
100%
125%
2000 2010 2020 2030 2040 2050 2060 2070
Calendar Year
UnclearFederal Income Taxes Needed to Redeem BondsExcess SS RevenueSS payroll taxes + taxes on benefits
Source: 2002 SS Trustees Report Table IV. B1 Note: Redeeming SSA's Treasury Bonds requires General Revenue (surplus income taxes or more Deficits). Future surpluses depend on debt repayment, no tax cuts, no increased govt prgrams, good economy. Increased deficits (or stock redemption) increases borrowing costs.
Around 2017, outgo first exceeds income
Around 2041, trust funds are exhausted, but payroll taxes can still pay 73% of benefits
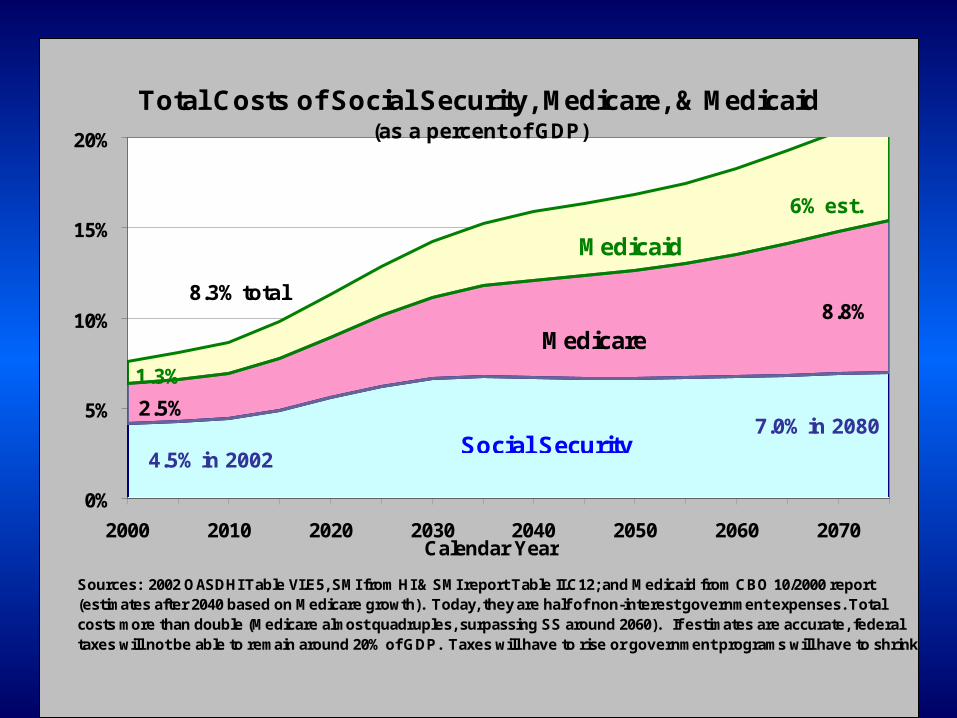
Total Costs of Social Security, Medicare, & Medicaid(as a percent of GDP)
4.5% in 2002
7.0% in 20802.5%
8.8%
1.3%
0%
5%
10%
15%
20%
2000 2010 2020 2030 2040 2050 2060 2070Calendar Year
Sources: 2002 OASDHI Table VI.E5, SMI from HI & SMI report Table II.C12; and Medicaid from CBO 10/2000 report (estimates after 2040 based on Medicare growth). Today, they are half of non-interest government expenses. Total costs more than double (Medicare almost quadruples, surpassing SS around 2060). If estimates are accurate, federal taxes will not be able to remain around 20% of GDP. Taxes will have to rise or government programs will have to shrink.
8.3% total
Social Security
Medicare
Medicaid
6% est.
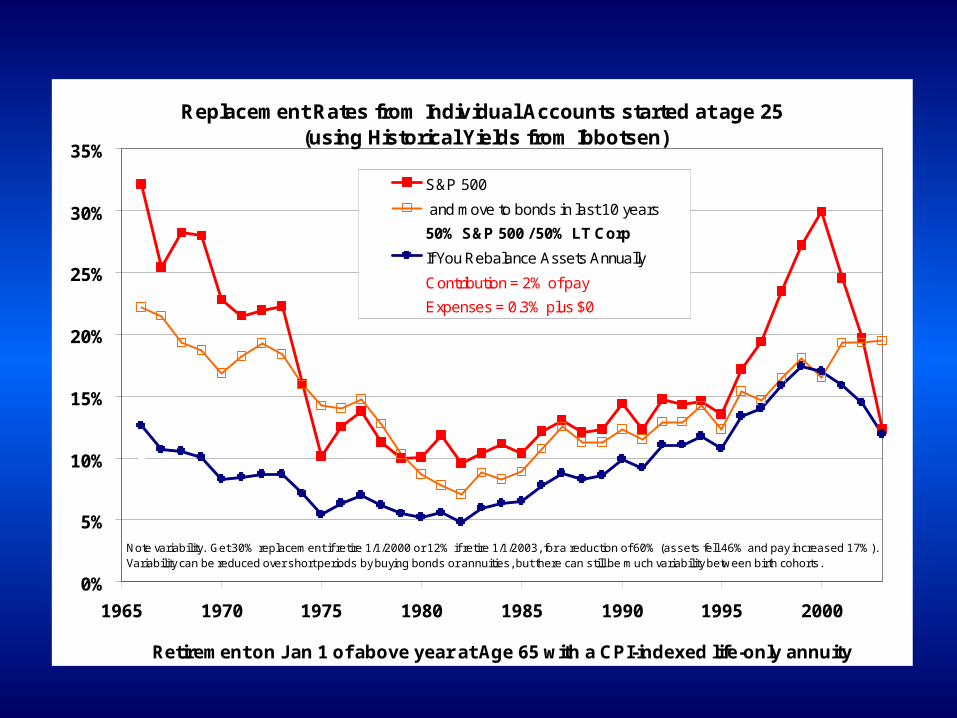
Replacement Rates from Individual Accounts started at age 25 (using Historical Yields from Ibbotsen)
0%
5%
10%
15%
20%
25%
30%
35%
1965 1970 1975 1980 1985 1990 1995 2000
Retirement on Jan 1 of above year at Age 65 with a CPI-indexed life-only annuity
S&P 500
and move to bonds in last 10 years
50% S&P 500 / 50% LT Corp
If You Rebalance Assets Annually
Contribution = 2% of pay
Expenses = 0.3% plus $0
Note variability. Get 30% replacement if retire 1/1/2000 or 12% if retire 1/1/2003, for a reduction of 60% (assets fell 46% and pay increased 17%). Variability can be reduced over short periods by buying bonds or annuities, but there can still be much variability between birth cohorts.

Population Trends
The Social Security GameThe Social Security Game
http://www.actuary.org/socialsecurity/game.html