Embed Size (px)
Citation preview
Population in Advanced Placement Human Geography
Martha B. Sharma
The Oxford Dictionary of Geography defines human geography as the study of "relationships between [human] activities and the physical environment" (Mayhew 1997, 215). Clearly, the emphasis is on people— where they are and i n what numbers and densities, who they are and how they live, how they alter and divide the land, how they interact w i t h their environment and w i t h each other. The study of human geography logically begins w i t h a study of population for such is the foundation of all that follows: culture, political systems, economic activities, development, and urbanization. Each of these topics unfolds i n a diverse and multilayered complex of ideas as a result of different human populations—large or small, dense or dispersed, fast or slow growing, traditional or technologically advanced—responding to and acting upon perceived opportunities i n the landscape.
Population and related issues are at the forefront of many concerns confronting society as we embark upon a new mil lennium. Demographers and sociologists, as wel l as geographers, study population, but what separates the geographic perspective from the focus of these other disciplines? What special questions does the geographer bring to the study of population? Geographers are interested i n the spatial dimensions of population—the distribution and patterns of people on Earth's surface and the changes, consequences, and connections that result from their presence. The challenge for teachers of Advanced Placement (AP) human geography lies i n merging the concepts and models of a college-level introduction to population geography w i t h a pedagogical approach that w i l l engage high school students.
The population section of the AP course outline identifies four important themes i n the study of population: geographical analysis of population, population distribution and composition, population growth and decline over time and space, and population movement. This article addresses some of the central concepts and topics related to each of these themes and identifies examples of the types of data one might use to develop analytical case studies i n the context of an AP course i n human geography.
GEOGRAPHICAL ANALYSIS OF POPULATION
A B S T R A C T
The Advanced Placement human geography course affords high school students the opportunity to experience an introductory college-level course in geography. Population is one of six major themes in the course. The course outline identifies four key areas of study in the population unit: geographical analysis of population, population distribution and composition, population growth and decline over time and space, and population movement. This article addresses each of these areas of study and identifies examples of concepts, topics, and types of data that could form the basis for instructional activities. A resource list is provided for additional reading.
Key Words: population, age-sex composition, demographic transition, demographic equation, migration
Even a brief glance at a global-scale population distribution map 1
confirms that people are spread very unevenly on Earth's surface. Approximately 75% of Earth's population occupies only about 5% of the land area, w i t h the largest concentrations being i n east and south Asia,
Martha B. Sharma is a Geography Teacher at the National Cathedral School, Washington, D.C. 20016 USA.
Journal of Geography 99:99-110 ©2000 National Council for Geographic Education

100 Sharma
western Europe, and northeastern North America. Populations range from the small South Pacific island countries of N a u r u and Tuvalu, each w i t h only 11,000 people, to China, w i t h almost 1.3 bi l l ion people. According to the United Nations 1998 revision of w o r l d population estimates and projections, the world's population was 5.9 bi l l ion i n mid-1998, and passed the 6 bi l l ion mark i n mid-October 1999. These figures reflect an annual rate of growth of 1.33%, d o w n from a high of 2.04% i n the period 1965-1970, but projected to decline further to only 0.34% by 2050. Population projections are typically based on high-, medium-, and low-growth assumptions. Projections based on the medium variant call for a w o r l d population of 8.9 bi l l ion i n 2050 (United Nations Population Division 1999).
I n 1950, 68% of the world's population lived i n regions termed less developed by the United Nations. By 1998, 80% of the world's population, or more than 4.7 bi l l ion people, l ived i n less-developed regions, w i t h Asia, at almost 3.6 bi l l ion, accounting for about three-quarters of that amount. With almost 750 mi l l ion people, Africa surpassed Europe's estimated 729 mi l l ion people. Latin America and the Caribbean were estimated to have 504 mi l l ion people and N o r t h America, 305 mil l ion. According to current estimates, 23 countries have populations greater than 50 mi l l ion people, and among these 10 have populations greater than 100 mi l l ion (United Nations Population Division 1999) (Table 1).
Because it is relatively simple to calculate, density is widely used as a basis for comparison between countries. However, when density is represented on small-scale maps, the degree of generalization is dangerously misleading. Students need to keep i n m i n d that density is a ratio of people to
Table 1. Counties with a population of>100 million, 1998 (United Nations Population Division 1999).
Country Population
(in millions)
China India United States Indonesia Brazil Pakistan Russian Federation Japan Bangladesh Nigeria
1,256 982 274 206 166 148 147 126 125 106
land. I t suggests an abstract relationship, but i t does not provide any clues to actual distribution. Egypt, w i t h an arithmetic density of only 71 people/mi. 2 , does not have the even distribution of population implied by this ratio which fails to take into account the limitations of much of the land w i t h i n the country. I n the case of Egypt, where almost all of the country is desert, the majority of the populat ion lives in the Nile river valley on only about 3% of the country's land. A n alternative measure of density is the ratio of people to cultivated land, or physiological density. Egypt's physiological density of almost 4,800 people/mi . 2 of cultivated land reveals the immense pressure put on l imited farmland by the country's population of almost 66 m i l l ion. Nevertheless, even this expression of density should be used w i t h caution. I n a country such as Egypt, w i t h a large rural-agrarian population, physiological density may relate fairly closely to distribution, but i n an urban-industrial country such as the United States, it is again merely an abstract relationship and not a reflection of distribution. Students w i l l benefit from frequent opportunities to use and compare densities at multiple scales and i n different forms so that they w i l l begin to appreciate both the uses and the limitations of this common measure of population.
Issues of representing population numbers, densities, and distributions notwithstanding, people i n their increasing numbers are an important element in the intricate equation of population, resources, and environment. The human impact on environmental systems is complex, involving not only numbers but also use of technology, resource consumption, pollution, and generation of waste on the one hand, and sociopolitical forces that affect access and allocation on the other. Such concepts as carrying capacity and sustainable use invite analysis of the relationship between population and environmental concerns, including air quality, safe water, food supply, and biodiversity. As early as 1798 Thomas Malthus raised the alarm about Earth's ability to support a growing population. I n 1972 the Club of Rome's Limits to Growth model used variables of population, food, industrialization, nonrenewable resources, and pollution to predict environmental degradation that w o u l d lead to the collapse of Earth systems. A model developed i n the Netherlands i n 1997 for the United Nations Environment Programme suggests that global climate change, loss of biodiversity, water scarcity, and spread of environment-related health problems are likely consequences of expanding agricultural

Population 101
and industrial activity associated w i t h growing populations. Ecologist Paul Erlich attempted to measure the human-environment relationship using the formula I=PAT, i n which I = environmental impact, P = population, A = affluence, and T = technology. No single model provides the answer to this complex question of the connection between population and the environment (Livernash and Rodenburg 1998). However, i n its complexity, the question is rich i n opportunities for students to explore and debate the issues raised. The often hasty assumption that the rapid population growth i n some less-developed countries places the w o r l d at risk because of depletion of resources and degradation of the environment can be debated i n light of high levels of consumption and waste generation i n more affluent industrialized countries where population growth rates are near or at zero. Likewise, assumptions that crises such as famine are caused by too many people and too little food can be evaluated i n the context of sociopolitical environments that impose barriers to free movement and distribution of resources. Such an approach to issues related to population calls upon AP students to apply higher-order critical-thinking skills and requires them to revisit assumptions about population and the environment.
POPULATION DISTRIBUTION AND COMPOSITION
H u m a n settlement decisions are motivated, at least i n part, by the need for a resource base that is sufficient to support the population. But inasmuch as the very concept of resource is subject to cultural and economic definition, one must be cautious not to overgeneralize or oversimplify w h y large population concentrations occur where they do. China and India, each the center of one of the two largest concentrations, have populations that are primarily rural and agriculturally based. Therefore, the need for fertile land and ample water has contributed to densely settled river valleys and coastal plains where traditional agricultural systems persist. I n contrast, the urban-industrial populations of western Europe and northeastern Nor th America have emerged i n a different resource environment, one based on minerals, energy, and accessibility. I n these regions high densities coincide not w i t h farmlands, but w i t h urban centers where use of technology rather than reliance on human labor is more likely to account for high yields. The temptation to rationalize population densities i n terms of simplis
tic environmental explanations is strong, but should be approached w i t h caution. The answers are much more complex.
A t the global level, patterns of distribution and density seem clear, but if one adjusts the lens of scale and zooms in , one discovers that generalized global patterns disguise just as much variation as they reveal. For example, density is not uniform throughout the area of h igh concentration i n the northeastern United States (Figure 1) or i n any of the other areas of high concentration. I n fact, there is great variation f rom Maine to Virginia. If, however, one adjusts the lens of scale yet again, this time to examine the state of New York (Figure 2) which appears to have uniformly high density at the national level, we again discover great variation. While New York state has a population density of 380 persons/mi. 2 (as per the 1990 census), only 16 of the state's 62 counties have a density of 300 or more persons/mi. 2 . This map raises many questions: Why is population concentrated i n some places and not i n others? H o w does this pattern of population distribution reflect a state's development? H o w has it been influenced by changes i n the economy? Has the pattern changed over time; w h y and w i t h what effect? Encouraging students to exercise critical-thinking skills such as questioning, evaluating, and analyzing patterns they observe i n maps or in the landscape around them is an important step toward cultivating a geographic perspective.
Such a line of questioning and analysis can be carried one step further if students examine patterns i n the county i n which their school is located. A t the county level, students can collect data, both from historical records and i n the field. Data and maps at the census tract level are available from the U.S. Census Bureau's American FactFinder and the Tiger Mapping Service Web sites.2 I n addition, data from the Tiger Mapping Service for 1995 can be downloaded from the ESRI Web site3 i n a format compatible w i t h geographic information system (GIS) software such as Arc View. Student research, combined w i t h census data, can be used to create a GIS that supports analysis of patterns of density and distribution at the local level. Not only does such an activity allow students to " d o " geography, but i t also leads to generalizations about density and distribution that can be tested by examining patterns in other places and at different scales. Pattern and scale are important concepts that appear not just i n the population unit , but throughout the entire course i n human geography.

102 Sharma
Population per square mile • 300-9,949
• 150-300
Rl 50-150
• 1-50
Figure 1. U.S. population density by state, 1990 (U.S. Census Bureau 1990 Census).
Population per square mile • 300-67,615
• 150-300
• 50-150
• 1-50
Figure 2. New York population density by county, 1990 (U.S. Census Bureau 1990 Census).
Patterns can also be observed i n characteristics that define human populations, such as age, sex, race, ethnicity, and rural /urban distribution. The composition of a population affords insight not only into present conditions w i t h i n the population, but also into the potential for change i n the future. Analyzing the age-sex distribution w i t h i n a given population reveals a demographic story—past, present, and future—about the place i n question.
The age-sex composition of a population can be represented graphically through a population pyram i d , which shows the percentage of total population i n each age and sex cohort. Pyramids are commonly used to illustrate populations of countries at different stages of development, both economic and demographic. The broad base of Ethiopia's pyramid (Figure 3) reflects the country's high total fertil ity rate of 7.0 and a young age structure that includes 46% of the population below the age of 15 years. Inferences can be made about future growth potential due to population momentum and economic conditions associated w i t h a high dependency ratio

Population 103
AGE
100* yrs-
90-&4yrs.
80-84 yrs.
70-74 yrs.
60-64 yrs.
50-54 yrs
40-14 yrs.
30-34 yrs. .
20-24 yrs
0-4 yrs.
Figure 3. Ethiopia, age-sex distribution, 1984 (U.S. Census Bureau 1999c).
Figure 4. Spain, age-sex distribution, 1991 (U.S. Census Bureau 1999c).
resulting from the large population under the age of 15 years. I n contrast, the almost column-like pyramid of Spain (Figure 4) reflects this country's more stable demographic situation. With a below-replacement total fertil ity rate of 1.2 and a 0% rate of natural increase, Spain faces very different issues than Ethiopia. Spain's concerns are w i t h the needs of an aging population rather than a youthful one, and Spain is not unique. Sixty-one countries or areas of the w o r l d currently have fertility below the replacement level of 2.1 and, among these, 30 are projected to experience decreases i n population by 2050 (Livernash and Rodenburg 1998).
Pyramids also reflect the demographic history of a country. A series of pyramids for the United States from the mid-1950s to the present w o u l d reveal the progress of the baby-boom generation toward middle age, as wel l as the "echo" genera
tion fol lowing i n their wake. A pyramid for Germany w o u l d reveal the ravages of two w o r l d wars, as wel l as that country's post-war baby boom. Age-sex data for most countries, as wel l as for all states and counties of the United States, are available from the U.S. Census Bureau Web site.4
A t a different scale, comparison of pyramids for Florida (Figure 5) and Utah (Figure 6) reveals the diversity of the U.S. population. Florida's median age of 37.6 years becomes quickly apparent when the state's pyramid is compared to that of Utah, where the median age is only 26.8 years. Even at the county scale, pyramids can reveal a pattern of changing demographics w i t h i n a single metropolitan area. What decision processes lie behind very different demographic profiles i n different locations w i t h i n the same metropolitan area?
Examination of demographic patterns at the
Figure 5. Florida, age-sex distribution, 1996 (U.S. Census Bureau 1999).
Figure 6. Utah, age-sex distribution, 1996 (U.S. Censns Bureau 1999).
104 Sharma
local level allows students to explore questions such as those raised above. Population pyramids are valuable tools for demographic analysis as long as students use them as a basis for inference and not for absolute interpretation.
POPULATION G R O W T H AND D E C L I N E O V E R T I M E AND SPACE
For much of human history, Earth's population was relatively small—estimated at about 10 mi l l ion people. It was also relatively stable, fluctuating between periods of growth and decline, but never experiencing dramatic change unt i l about 8000 BC when the first agricultural revolution resulted i n a more reliable food supply, which i n turn led to gradually declining death rates and rising rates of natural increase. A t the onset of the Christian era, the world's population is estimated to have been about 300 mi l l ion people. By 1500 i t had increased to about 500 mi l l ion i n spite of wars, famines, and plagues, and by 1800, to one bil l ion. Then, as today, Asia dominated, w i t h about 64% of the total population, followed by Europe w i t h 21% and Africa w i t h 13%.
The mid-eighteenth century saw the beginnings of change w i t h the arrival of the second agricultural revolution, which was spawned by the industrial revolution. New, more efficient farm tools increased productivity; better transportation systems improved distribution and availability of food; and scientific developments i n medicine and sanitation resulted i n better health. A l l of these innovations combined to send death rates spiraling downward, prompting theories of doom, such as Thomas Malthus's prophesy that famine w o u l d be the inevitable outcome of the population exceeding increases i n food production.
By 1930 the world's population had reached the second bil l ion, w i t h most of the growth occurring i n the more developed countries of western Europe and Nor th America. For example, between 1800 and 1900, Europe's population doubled, and that of the United States and Canada, fueled by the combination of natural increase and migration, increased from 7 mi l l ion to over 80 mil l ion. But the most rapid period of population growth was still to come.
I n the post-World War I I environment of crumbling colonial empires, the medical revolution tr iggered population growth unlike that previously experienced. The medical knowledge and technology developed over the previous 200 years i n the
industrializing countries of western Europe and Nor th America spread quickly to the newly independent countries of Asia, Africa, and Latin Ameri ca. The result was a population explosion of dramatic proportions. In 1950 the world's population was about 2.5 bi l l ion. The year 1975 saw 4 bi l l ion people, and 1987 saw 5 bi l l ion. Although the rate of natural increase leveled off at a little over 2% i n the period 1965-1970 due to declining fertil ity rates and has since fallen to the current rate of 1.4%, the total number of people added to Earth's population each year—almost 80 mi l l ion annually—remains high because of the very large base population i n the less developed regions of Asia, Africa, and Latin Ameri ca where most growth is now occurring. Declining fertility rates i n all regions of the w o r l d combined w i t h the deadly impact of H I V / A I D S have slowed population increase. Nevertheless, medium-variant projections by the United Nations indicate a population of 8.9 bi l l ion people by the year 2050. Asia is expected to continue to dominate w i t h 59% of the world's population and, despite the epidemic proportions of AIDS, Africa is projected to have almost 20% of the world's population, while Europe w i l l have dropped to only 7% from a current share of about 12% (Livernash and Rodenburg 1998).
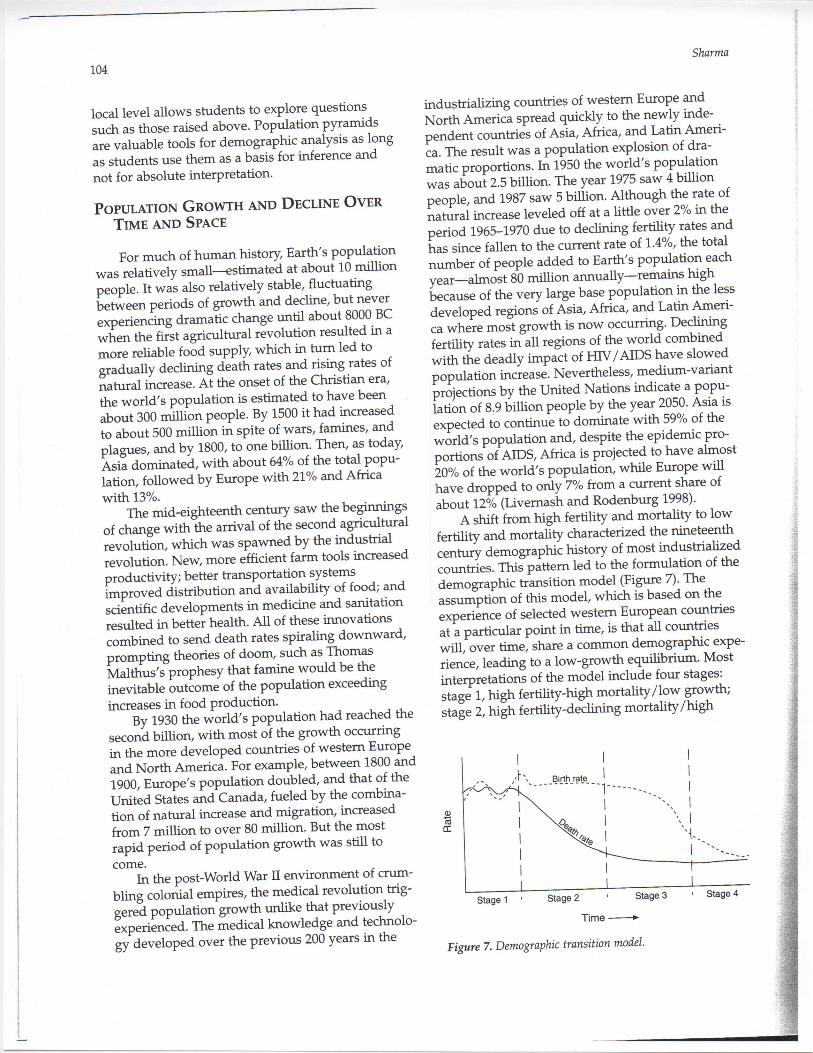
A shift from high fertil ity and mortality to low fertil ity and mortality characterized the nineteenth century demographic history of most industrialized countries. This pattern led to the formulation of the demographic transition model (Figure 7). The assumption of this model, which is based on the experience of selected western European countries at a particular point i n time, is that all countries w i l l , over time, share a common demographic experience, leading to a low-growth equil ibrium. Most interpretations of the model include four stages: stage 1, high fertil ity-high morta l i ty / low growth; stage 2, high fertility-declining morta l i ty /high
Figure 7. Demographic transition model.
Population 105
growth; stage 3, declining ferti l i ty-low mortal i ty/ high, but declining growth; and stage 4, low fert i l i ty- low morta l i ty / low growth. The rate of growth is a function of the gap between fertil ity and mortality, especially i n stages 2 and 3.
For most industrial countries, presently i n late stage 3 or stage 4, the absolute increase i n population has been moderate. However, i n most less-developed countries, which have begun the transit ion at a later date, the population increase has been dramatic, i f not overwhelming. First of all, less-developed countries have, i n many instances, begun the transition from a much larger population base. Further, the decline i n mortality has often been precipitous due to medical assistance and knowledge and technology transfer from industrial countries. I n contrast, changes i n fertility are closely l inked to sociocultural standards that may or may not respond to demographic change i n a manner similar to that experienced i n European countries. Consequently, the experience of contemporary less-developed countries may be different from that of countries that made this transition i n the nineteenth century. This notwithstanding, the demographic transition model remains a useful tool for evaluating a country's demographic development as long as students keep i n m i n d that a model is only a generalization intended to facilitate analysis; i t is not meant to be a literal depiction of reality.
Fertility and mortality, which are central elements of the demographic transition, exhibit a varied spatial pattern. Total fertility rate refers to the total number of children a woman can be expected to have during her childbearing years at current bir th rates. I n 1950 the average total fertility rate i n the more developed countries was 2.8, while the average i n less developed countries was 6.2, ranging from 6.6 i n Africa to 5.9 i n Latin America. By 1998 fertil ity rates had fallen dramatically i n most regions, to a low of 1.4 i n Europe and 2.0 i n Nor th America—both below replacement fertility of 2 . 1— and 2.8 i n Asia and 3.0 i n Latin America. Only Africa lags behind i n the trend toward lower ferti l i ty, where the average rate remains 5.6, and i n sub-Saharan Africa, 6.0 (Gelbard et al. 1999,13-14). Once again, however, scale is an issue. Regional averages disguise tremendous variation among individual countries. I n Asia, some countries, including China, South Korea, and Thailand, are below replacement fertility while other countries such as Pakistan, Cambodia, and Laos have fertil ity levels above 5.0. Likewise, i n sub-Saharan Africa the average fertility rate of 6.0 includes a range that
extends from a low of 3.3 i n South Africa to a high of 7.5 i n Niger (Haub and Cornelius 1999).
Country-level fertility rates, like regional rates, mask significant variations. I n the United States, minorities account for 40% of all births, despite the fact that members of minori ty groups make up only 28% of the total population (Pollard and O'Hare 1999,16). The national average fertil ity rate is 2.0, but the total fertil ity rate among Hispanics is about 3.0 and among African Americans, about 2.2. Among Asians and Pacific Islanders, however, the total fertility rate of 1.9 is slightly below the national average (Ventura et al. 1999). This generally younger age profile of minorities and their higher fertility rates w i l l result i n minorities accounting for an increasing proportion of the total population in the future, projected at 39% by 2050 (Pollard and O'Hare 1999,19). I n addition to variations according to race and ethnicity, fertility rates also vary inversely w i t h income and women's level of education. The fertil ity rate among women w i t h more than four years of college averages 1.4; among women w i t h a high school education, 2.0; and among women w h o d i d not complete high school, 2.7. Further, fertil ity rates tend to be higher among rural populations than among urban dwellers, where couples and single women tend to delay fert i l i ty decisions (McFalls 1998). A similar correlation between income, educational attainment, and fertili ty rates can also be observed among women i n less developed countries.
The counterbalance to fertility i n the demographic equation is mortality. Like fertility, mortality varies widely. Improved health conditions have brought death rates d o w n , first i n Europe and Nor th America, and more recently i n virtually every country throughout the w o r l d . Analysis of patterns i n death rates is a complex process and must be linked to such concepts as age structure and life expectancy. Libya, a country w i t h a young median age, has a death rate of only 3/1,000, compared to Sweden, which has an older median age and a death rate of 11/1,000. Should one infer that quality of life i n Libya is better than that i n Sweden? To the contrary; examination of other indicators of quality of life confirms that conditions i n Sweden, where 17% of the population is 65 years old and above, are better than those i n Libya, where only 4% of the population is 65 years old and above. In other words, death rate is not a reliable indicator of quality of life because i t is sensitive to related factors, particularly age structure.
One alternative indicator of quality of life is

106 Sharma
infant mortality. Children under the age of one year are particularly vulnerable to poor l iv ing conditions, inadequate food supply, and lack of sanitation and clean water. Although conditions have improved in recent years, i n many less-developed countries more than one child i n every 10 dies before reaching one year old. As w i t h crude death rates, infant mortality is highest i n sub-Saharan Africa, where it reaches 170/1,000 i n Sierra Leone. I n the United States, infant mortality is 7/1,000, half what it was only 20 years ago, but still higher than i n many European countries, including Germany and Iceland where rates are only 5/1,000 (World Health Organization 1999).
Life expectancy at b ir th ranges from a low of 36 years in Malawi to a high of 79 years i n such countries as Canada, Iceland, Sweden, and Switzerland. Life expectancy i n the United States is 77 years, a dramatic improvement over 47 years i n 1900, and clear evidence that our population is aging. I n fact, the fastest growing cohort i n the United States is the group 85 years old and up, termed "oldest o l d " by the U.S. Census Bureau (Treas 1995, 6). Similar improvements have occurred i n other countries, including India, Japan, and Russia. Rising life expectancies have been made possible by advances i n medical care and disease control. This change i n the patterns of mortality, referred to as the epidemiological transition, results i n major changes i n the age structure of the population, as the concentration of deaths shifts from younger to older cohorts. I n England and Wales i n 1891, one-third of all deaths occurred in the youngest cohort, age 0 to 4 years, and the median age at death fell i n the 30- to 34-year cohort. By 1966 this pattern had shifted dramatically, w i t h less than 5% of deaths occurring before the age of 5 years and more than 40% occurr ing after the age of 75 years. Median age at death was i n the 70- to 74-year cohort. As w i t h the demographic transition, the epidemiological transition has reached the less developed regions at a later date than was experienced i n Europe. As recently as 1955 almost 50% of deaths in Latin America and the Caribbean occurred i n the youngest cohort and median age at death fell i n the 5- to 9-year cohort. The region is projected to make the transition to mortality patterns similar to those of England and Wales by 2030 (World Bank 1993).
While communicable diseases and preventable health conditions have been held at bay, non-communicable diseases and degenerative conditions associated w i t h aging have gained a foothold. I n the more developed countries, the leading causes of
death are cancer and heart disease, accounting for almost 60% of deaths i n the United States. By contrast, in less developed countries, the main causes of mortality are H I V / A I D S , tuberculosis, and pregnancy-related conditions. I n Africa especially, the spread of H I V / A I D S has had a devastating impact on those countries most affected (Figure 8). In Botswana i t is believed that one person i n every four is infected w i t h this deadly disease, and life expectancy is projected to fall to only 41 years by 2005, 29 years lower than that projected without the incidence of H I V / A I D S (United Nations Population Division 1999).
As w i t h other demographic measures, mortality and life expectancy also vary according to socioeconomic status, race, and ethnicity. Death rates are higher among those w i t h lower incomes and among those w i t h lower levels of educational attainment. I n the United States, life expectancy of African Americans and of Native Americans fall several years below that of the general population. However, life expectancy of Hispanics is the same as that of the general population, and life expectancy of Asian Americans is higher than that of the general population (McFalls 1998,11-13).
Figure 8. Countries in Africa hardest hit by HIV/AIDS, 1997 (United Nations Population Division 1999).
Population 107
POPULATION M O V E M E N T
Fertility and mortality are two elements of the demographic equation. The third element is migration, the movement of people into or out of a given place. Migration may take people across national political boundaries i n response to deteriorating political, economic, or environmental conditions; or it may only involve movement w i t h i n the country. It may also be involuntary or voluntary. A few countries, including the United States, Canada, and Australia, have been profoundly influenced by immigrant populations whose culture, language, and religion have blended to form new national identities. The large numbers affecting selected countries notwithstanding, international migrants account for only about 2% of the world's population—about 125 mi l l ion people—and have little impact on population change i n most countries.
Some international migrants are forced to leave their home countries due to war or unstable pol i t i cal circumstances. According to the United Nations
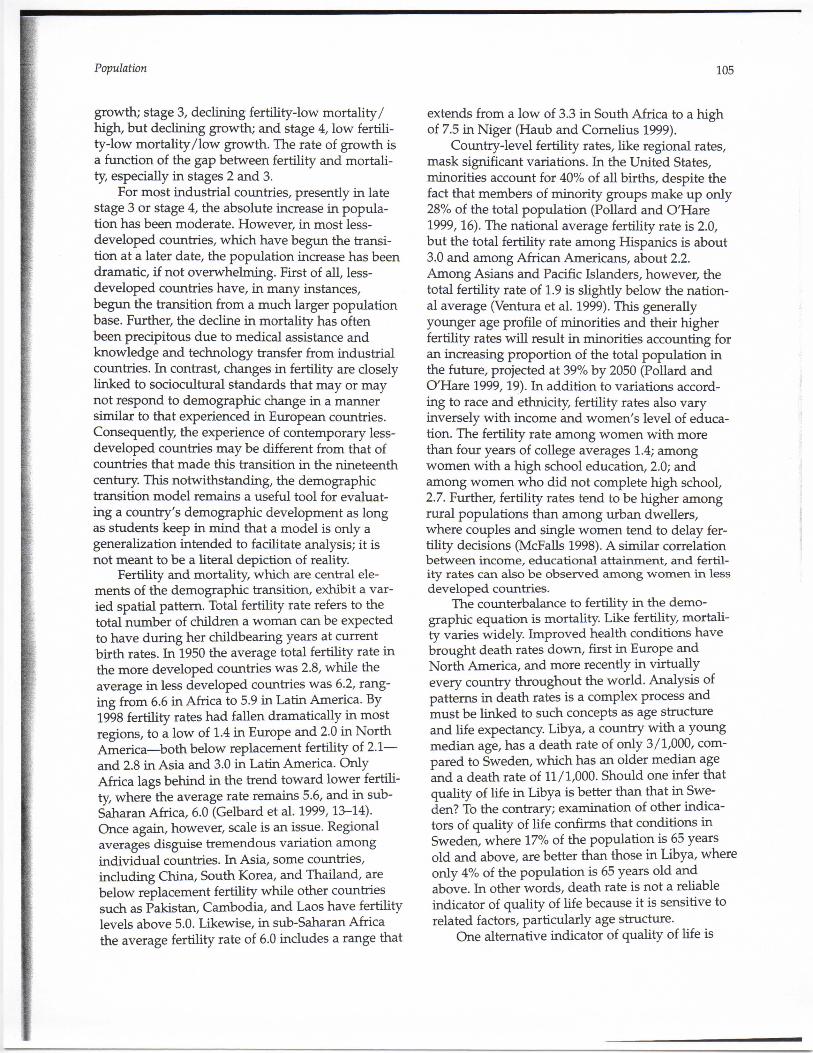
H i g h Commission for Refugees (1999a), almost 1.5 mi l l ion refugees from Afghanistan were l iv ing i n Iran i n 1997 and another 1.2 mi l l ion i n Pakistan. I n 1999 almost 11.5 mi l l ion people were recognized as refugees, w i t h most l iv ing in the Middle East, Africa, and Europe. In addition, another 6.7 mi l l ion people were recognized as "internally displaced persons" (United Nations H i g h Commission for Refugees 1999b), people forced to leave their homes but who remain w i t h i n their original country of residence (Table 2).
Not all international migrants are refugees. Many move i n search of employment and a better standard of l iv ing. About half of all international migrants move from one developing country to another. Large numbers of men, many of them from such countries as Egypt, South Korea, the Philippines, Thailand, and Pakistan, have moved as guest workers to the oil-rich countries of the Persian Gulf region to take advantage of a job surplus i n this area. I n many cases, immigrant labor makes up a large share of the labor force and skews the popula-
Table 2. Persons of concern to the United Nations High Commission for Refugees (1999c,d).
Country of Origin
Origin of Major Refugee Populations (10 largest groups3) Main Countries of Asylum Number of Refugees
Afganistan Iraq Bosnia and Herzegovina Somalia Burundi Liberia Sudan Croatia Sierra Leone Vietman
Iran, Pakistan, India 2,648,000 Iran, Syria, Saudi Arabia, Western Europe 631,000 F.R. Yugoslavia, Germany, Croatia, Sweden, Switzerland 597,000 Ethiopia, Kenya, Yemen, Djibouti 525,000 Tanzania, D.R. Congo, Rwanda, Zambia 517,000 Guinea, Cote d'lvoire, Ghana, Sierra Leone 487,000 Uganda, D.R. Congo, Ethiopia, Kenya, Central African Republic 351,000 F.R. Yugoslavia, Bosnia and Herzegovina 342,000 Guinea, Liberia, Gambia 328,000 China, France, Sweden, Switzerland 317,000
a N o t included are an estimated 3.2 mi l l ion Palestinian refugees w h o are also of concern.
Estimates of Major Populations of Internally Displaced Persons, 1998
Bosnia and Herzegovina 836,400 Sierra Leone 670,000 Rwanda 625,000 Sri Lanka 603,000 Azerbaijan 576,300 Afghanistan 315,800 Georgia 277,000 Cyprus 265,000 F.R. Yugoslavia 225,000 Guinea-Bissau 195,600 Russian Federation 171,900
108 Sharma
t ion age structure (Gelbard et al. 1999). I n the United Arab Emirates, immigrants made up 90% of the labor force i n 1995 (Martin and Widgren 1996, 33). Other international migrants flock to more developed countries, f i l l ing jobs left vacant by aging and affluent populations. About one-third of the world's migrant population lives i n Germany, France, United Kingdom, United States, Italy, Japan, and Canada. Migrants f rom Nor th Africa and Turkey have located i n France and Germany, respectively, i n the late twentieth century. Use of the gravity model aids i n the analysis of contemporary migration patterns and affords students the opportunity to test such concepts as distance decay, friction of distance, and mtervening opportunity as they relate to migration decisions.
The United States is also a popular destination for migrants seeking employment and education opportunities. I n 1997 an estimated 25.8 mi l l ion foreign-born residents were i n the United States, or 9.7% of the total population (U.S. Census Bureau 1999a). Nearly half of all foreign-born residents are of Hispanic origin. The single largest group is from Mexico, accounting for almost 30% of all i m m i grants, followed by persons born i n the Philippines, Canada, China, Cuba, Dominican Republic, El Salvador, Jamaica, South Korea, Germany, United Kingdom, and Poland (U.S. Census Bureau 1997). I n addition to the introduction of greater racial and ethnic diversity into the American population, immigrants may also affect the age structure of the U.S. population. The majority of immigrants tend to be young adults and their families, which may hold d o w n the median age of foreign-born populations somewhat; however, little if any effect is projected for the population as a whole. The Census Bureau projects that the median age i n the United States w i l l rise to 38.1 years by 2050, f rom the current 34.3 years (Martin and Midgley 1999, 22). Foreign-born populations, while found in every state, have gravitated toward certain gateway states, especially California w i t h more than 7.7 mi l l ion foreign-born residents and New York w i t h 3.0 mi l l ion foreign-born residents (U.S. Census Bureau 1997).
Migration also occurs w i t h i n countries. I n many less-developed countries, just as i n the case of international migration, internal migrants are often fleeing civil disturbances or failing economic conditions. Rural to urban migration involves the movement of tens of thousands of people to large metropolitan areas, adding to the problems of already burgeoning cities w i t h over-taxed utilities and services. I n the more developed countries, the trend is
reversed, w i t h people often abandoning crowded, expensive central cities i n favor of suburbs and the rapidly transforming rural fringe beyond. I n the United States this process is evident i n declining populations of central cities w i t h i n growing metropolitan areas, such as Washington, D.C., where the city itself experienced a net decline of 10.6% i n population between 1990 and 1996, while the metropolitan area saw a net increase of 8.1% over the same period (U.S. Census Bureau 1999b).
A t a different scale, the United States has experienced an internal shift i n population from states i n the Northeast and Midwest to states i n the South and West—the region referred to as the Sunbelt. I n 1960, 54% of the U.S. population l ived i n the Northeast and Midwest, but by 1995 only 43% of the population lived i n these two regions. Attracted by employment opportunities and a lower cost of l i v ing, people have flocked to Nevada, Arizona, Colorado, Utah, New Mexico, Idaho, and Washington i n the West, and to Georgia i n the South, all states which experienced annual growth of 2% or above between 1990 and 1995 (De Vita 1996). This trend i n population movement is not only changing the demographic profile of the country and the states most involved; i t is also changing the cultural, political, and economic fabric of regions losing population as wel l as those gaining population.
Regardless of where students live, migrat ion— either international or internal—is likely to have left its mark on the local area, whether by the presence of an immigrant population or by the relocation of jobs and the associated movement of labor. Local or personal experience can be the springboard for studying migration on a larger scale. Students can trace their o w n immigrant roots and compare them to major national trends. Or they can look for and analyze immigrant imprints, such as architectural style, place names, churches, and restaurants, i n the local cultural landscape.
While students must frequently rely on data sets collected by governments and international agencies as they examine many aspects of population, short-term mobil i ty and activity space fall w i t h i n the realm of local investigation. Short-term movement and activity space can involve daily trips to and from school or work , vacations, and temporary relocation of students attending college away from home. Act ivi ty space is directly related to age, i n that as children get older they are likely to have greater independence to travel farther and farther from home, if only to attend school or to meet friends at the mall . Students can conduct interviews

Population 109
w i t h people of different ages concerning their local mobil i ty patterns. Results can be mapped and graphed to facilitate analysis and formulation of generalizations about mobility based on questions such as, H o w is activity space affected by age? H o w is activity space l imited by perceptions of danger? H o w does activity space vary between weekdays and weekends? H o w does activity space relate to distance decay models (i.e., how is the purpose of a tr ip related to the distance one is w i l l i n g to travel)? Generalizations formed at the local level can then be applied to the movement of people at other scales, state, national, or global.
CONCLUSION
The study of population is central to the study of geography. Our growing numbers and our ever-increasing demand for goods and services puts tremendous stress on Earth's resources and systems. A t the International Conference on Population and Development i n Cairo, Egypt, i n 1994,180 countries endorsed an action plan that calls for improvement in the status of women; alleviation of poverty; provision of better health care, including family planning; and protection of the environment (Ashford 1995). Each country w i l l draft its o w n national action plan to achieve these goals, consistent w i t h i t culture and value system. The extent to which individual countries respond to the Cairo mandate w i l l affect the global population profile and the spatial dimensions of various demographic characteristics. Understanding the dynamics of population change at multiple scales is a central theme of the population unit i n the AP human geography course.
N O T E S
1 A global-scale population distribution map can be found at <http://www.reHefweb.int/mapc/world/ wgppycpd.htmlx
2 U.S. Census Bureau's American FactFinder can be found at <http://factfinder.census.gov>. Tiger Mapping Service can be found at <http:/ /tiger.census.gov>.
3 Data from the Tiger Mapping Service for 1995 can be downloaded from the ESRI Web site <http://www.esri. com/industries/k-12/tiger.htmlx
4 The U.S. Census Bureau Web site can be found at <http://www.census.gov>.
REFERENCES
Ashford, L. S. 1995. New perspectives on population: Lessons from Cairo. Population Bulletin 50(1). Washington, D.C.: Population Reference Bureau.
De Vita, C. J. 1996. The United States at mid-decade. Population Bulletin 50(4). Washington, D.C.: Population Reference Bureau.
Gelbard, A., C Haub, and M. Kent. 1999. World population beyond six billion. Population Bulletin 54(1). Washington, D.C.: Population Reference Bureau.
Haub, C, and D. Cornelius. 1999 world population data sheet. Washington, D.C.: Population Reference Bureau.
Livemash, R., and E. Rodenburg. 1998. Population change, resources, and the environment. Population Bulletin 53(1). Washington, D.C.: Population Reference Bureau.
Martin, P., and E. Midgley. 1999. Immigration to the United States. Population Bulletin 54(2). Washington, D.C.: Population Reference Bureau.
Martin, P., and J.Widgren. 1996. International migration: A global challenge. Population Bulletin 51(1). Washington, D.C.: Population Reference Bureau.
Mayhew, S. 1997. A Dictionary of Geography. Oxford: Oxford University Press.
McFalls, J. A., Jr. 1998. Population: A lively introduction. Population Bulletin 53(3). Third edition. Washington, D.C.: Population Reference Bureau.
Pollard, K. M., and W. P. O'Hare. 1999. America's racial and ethnic minorities. Population Bulletin 54(3). Washington, D.C.: Population Reference Bureau.
Treas, J. 1995. Older Americans in the 1990s and beyond. Population Bulletin 50(2). Washington, D.C: Population Reference Bureau.
United Nations High Commission for Refugees. 1999a. Statistics: Refugees and others of concern to UNHCR, 1998 statistical overview. Available from <http://www.unhcr.ch/statist/ 98oview/intro.htm>.
United Nations High Commission for Refugees. 1999b. UNHCR and refugees: UNHCR by numbers. Available from <http://www.unhcr.ch/un&ref/numbers/numbers.htm>.
United Nations High Commission for Refugees. 1999c. UNHCR by numbers. Available from <http://www.unhcr.ch/ un&ref/numbers/table3.htm>.
United Nations High Commission for Refugees. 1999d. UNHCR by numbers. Available from <http://www.unhcr.ch/ un&ref/numbers/table4.htm>.
United Nations Population Division. 1999. World population prospects: The 1998 revision. Available from <http://www. popin.org/popl998/l.htm>.
U.S. Census Bureau. 1996. How we're changing-Demographic state of the nation: 1997. Current Population Reports, Special Studies, Series P23-193. Washington, D.C. Available from <http://www.census.gOv/prod/2/pop/p23/p23-193.pdf>.
U.S. Census Bureau. 1999a. Historical Census Statistics on the Foreign-born Population of the United States: 1850-1990. Population division working paper No. 29. Washington, D.C. Available from <http://www.census.gov/population/ w w w / documentation / twps0029/ twps0029.html>.
U.S. Census Bureau.. 1999b. Population estimates. Available from <http://www.census.gov/population/www/estimates/pop est.htmlx
U.S. Census Bureau. 1999c. International data base. Available from <http://www. census.gov/ipc/www/idbnew/html>.
Ventura, S. J., J. A. Martin, S. C. Curtain, and T. J. Mathews. 1999. Births: Final data for 1997. National Vital Statistics Reports 47(18). Available from <http://www.cdc.gov/nchswww/ data/nvs47_18.pdf>.
World Bank. 1993. World Development Report 1993: Investing in Health. Washington, D.C: Oxford University Press.
World Health Organization. 1999. The World Health Report, 1999. Available from <http://www.who.int/whr/1999/>.

110 Sharma
Appendix A. Resource list. Resources listed address selected topics and are not intended as a comprehensive reference for the teaching of the population unit in an AP human geography course.
Ashford, L. S. 1995. New perspectives on population: Lessons from Cairo. Population Bulletin 50(1). Washington, D.C: Population Reference Bureau.
De Vita, C. J. 1996. The United States at mid-decade. Population Bulletin 50(4). Washington, D C : Population Reference Bureau.
Environmental Systems Research Institute. 1995 Tiger Mapping Data. Available from <http://www.esri.com/industries/ k-12/tiger.hrmlx
Gelbard, A., C Haub, and M. Kent. 1999. World population beyond six billion. Population Bulletin 54(1). Washington, D.C: Population Reference Bureau.
Gober, P. 1993. Americans on the move. Population Bulletin 48(3). Washington, D C : Population Reference Bureau.
Haub, C, and D. Cornelius. 1999 world population data sheet. Washington, D C : Population Reference Bureau.
Livernash, R., and E. Rodenburg. 1998. Population change, resources, and the environment. Population Bulletin 53(1). Washington, D C : Population Reference Bureau.
Lonsdale, R. E., and J. C. Archer. 1998. Emptying areas of the United States. Journal of Geography 97:108-122.
Martin, P., and E. Midgley. 1999. Immigration to the United States. Population Bulletin 54(2). Washington, D C : Population Reference Bureau.
Martin, P., and J. Widgren. 1996. International migration: A global challenge. Population Bulletin 51(1). Washington, D C : Population Reference Bureau.
McFalls, J. A., Jr. 1998. Population: A lively introduction. Population Bulletin 53(3). Third edition. Washington, D C : Population Reference Bureau.
Pollard, K. M., and W. P. O'Hare. 1999. America's racial and ethnic minorities. Population Bulletin 54(3). Washington, D C : Population Reference Bureau.
Robbins, P. 1998. Population and pedagogy: The geography classroom after Malthus. Journal of Geography 97:241-252.
Shaw, W. 1998. Integrating geographic learning and basic skills: An in-class cooperative activity. Journal of Geography 97:163-175.
Shelley, F. M. , and G. R. Webster. 1998. Population, settlement, race, and ethnicity in the South. Journal of Geography 97:163-175.
Treas, J. 1995. Older Americans in the 1990s and beyond. Population Bulletin 50(2). Washington, D.C: Population Reference Bureau.
United Nations High Commission for Refugees. 1999. Statistics: Refugees and others of concern to UNHCR - 1998 statistical overview. Available from <http://www.unhcr.ch/statist/ 98oview/intro.htm>.
United Nations High Commission for Refugees. 1999. UNHCR and refugees: UNHCR by numbers. Available from <http://www.unhcr.ch/un&ref/numbers/numbers.htmx
United Nations Population Division. 1999. World Population Prospects: The 1998 Revision. Available from <http://www. popin.org/popl998/l.htm>.
United Nations. Women watch. 1999. Available from <http://www. un.org/womenwatch/worId/index.html>.
U.S. Census Bureau - <http://census.gov>. U.S. Census Bureau. American FactFinder - <http://factfinder.
census.gov>. U.S. Census Bureau. 1999. Historical census statistics on the for
eign-bom population of the United States: 1850-1990. Population Division Working Paper No. 29. Available from <http: / / www.census.gov/population/www/ documentation/twps0029/twps0029.html>.
U.S. Census Bureau. 1997. How we're changing - Demographic state of the nation: 1997. Current Population Reports, Special Studies, Series P23-193. Available from <http://www. census.gov/prod/2/pop/p23/p23-193.pdf>.
U.S. Census Bureau. International Data Base - <http://www. census.gov / ipc / www / idbne w /html>.
U.S. Census Bureau. Population Estimates - <http://www. census.gov/population/www/estimates/popest.htmlx
U.S. Census Bureau. 1998. Population profile of the United States, 1997. Current Population Reports, Special Studies Series P23-194. Available from <http://www.census.gov/ prod/3/98pubs/p23-194.pdf>.
U.S. Census Bureau. Tiger Mapping Service - <http://tiger, census.govx
Ventura, S. J., J. A. Martin, S. C. Curtain, and T. J. Mathews. 1999. Births: Final data for 1997. National Vital Statistics Reports 47(18). Available from <http://www.cdc.gov/ nchswww/data/nvs47_18.pdf>.
World Bank. 1993. World Development Report 1993: Investing in Health. Washington, D.C: Oxford University Press.
World Health Organization. The World Health Report, 1999. Available from <http://www.who.int/whr/1999/>.
Wridt, P. 1999. The world of girls and boys: Geographic experience and informal learning opportunities. Journal of Geography 98:253-264.
S E L E C T E D D I C T I O N A R I E S AND R E S O U R C E TEXTBOOKS
Goodall, B. 1987. Dictionary of Human Geography. Middlesex, England: Penguin Books.
Haupt, A., and T. T. Kane. 1997. Population Handbook. Fourth edition. Washington, D C : Population Reference Bureau.
Johnson, R. J., D. Gregory, G. Pratt, and M. Watts, eds. 2000. The Dictionary of Human Geography. Fourth edition. Oxford, U.K.: Blackwell.
Mayhew, S. 1997. A Dictionary of Geography. Oxford: Oxford University Press.
Peters, G. L., and R. P. Larkin. 1997. Population Geography. Sixth edition. Dubuque, Iowa: Kendall/Hunt Publishers.
Weeks, J. R. 1996. Population: An Introduction to Concepts and Issues. Sixth edition. San Francisco, California: Wadsworth Publishing Company.