Embed Size (px)
Citation preview

Population Genomics of Coastal California Resident and Anadromous Oncorhynchus mykiss in
Scott Creek, CA
Devon Pearse
Molecular Ecology and Genetic Analysis TeamNOAA/National Marine Fisheries Service, Southwest Fisheries Science
CenterSanta Cruz, CA
andUniversity of California, Santa Cruz
Dept. of Ocean Science and Dept. of Ecology and Evolutionary Biology
Pacific Coast Steelhead Meeting, March 9, 2010

Oncorhynchus mykiss: a highly variable species.
Steelhead: Anadromous, spend 1-2 years in freshwater and 1-4 years in salt water prior to spawning. Iteroparous.
Rainbow Trout: Stay in stream entire life (Resident).
“Variation... is one of the most marked characteristics of animal life. Andof the the vertebrates, the trouts are among the most variable of all.Further, of the trouts the steelhead is one of the most variable forms.”
----Shapovalov & Taft (1954)

Fitness trade-offs of Resident vs Anadromous life-history
-fecundity advantage for anadromous females (and males)
-low survival at sea
-competition in stream, low growth. (Hayes et al. 2008)
Vs.

S.F.
Santa Cruz
~60miles
~12 miles
Scott Creekwatershed
Over the Falls?
•O. Mykiss introduced above Big Creek Falls c. 1910
•Records indicate source waswithin same watershed
•Hatchery stocking may haveoccurred above other barriers.
•Regardless of source, there mustbe strong selection on above fallsfish not to move downstream.

Above Barrier, ~100%
Below Barrier, >90%

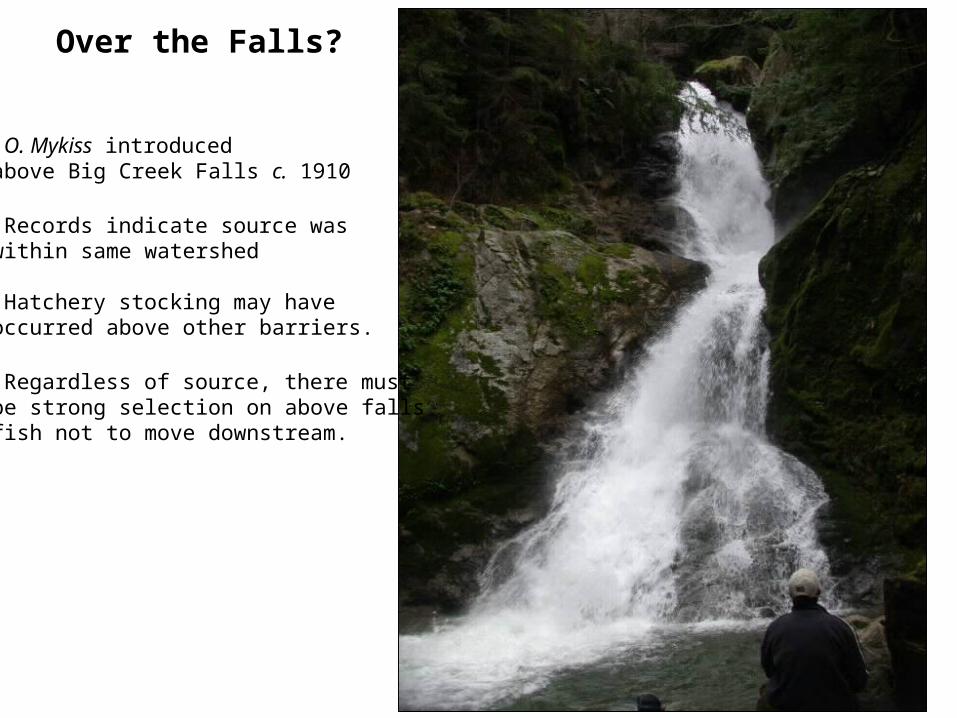
Over the Falls?
•Surveyed 18 microsatellite lociin fish throughout watershed.
•Pairwise Fst at Big Creek Fallswas low, 0.018, supportingwithin basin origin.
•Although above barrier habit islimited, bottleneck/founder effectsdo not appear to be significant. (Anderson & Slatkin 2007)
•Other above-barrier populationsmore divergent (0.05-0.23)
Above-Barrier populations Anadromous Adults
from Pearse et al. 2009
Over the Falls?
Below Big Creek Falls

Photo: Morgan Bond

Above barrier fish phenotypically and genetically distinct:=>drift due to small population sizes=>adaptation to residency.
Hybridization with anadromous fish below is possible.=> one-way gene flow.=> better markers will help here...
When above-barrier fish move below the barrier, they maintain a resident life-history.
=>strong above-barrier selection not to go downstream.
from Pearse et al. 2009

Genome Scan
• Microsatellite loci: Rexroad et al. (2001); Rexroad et al. (2001); Coulibaly et al. (2005)….
• EST-linked microsatellite loci; Rexroad et al. (2005)
• Linkage maps: Nichols et al. (2003); Danzmann et al. 2005; Rexroad et al. (2008)-- >1,000 microsatellites, ~2.6cM resolution.

X a
X a
b
X a
X a
a
b
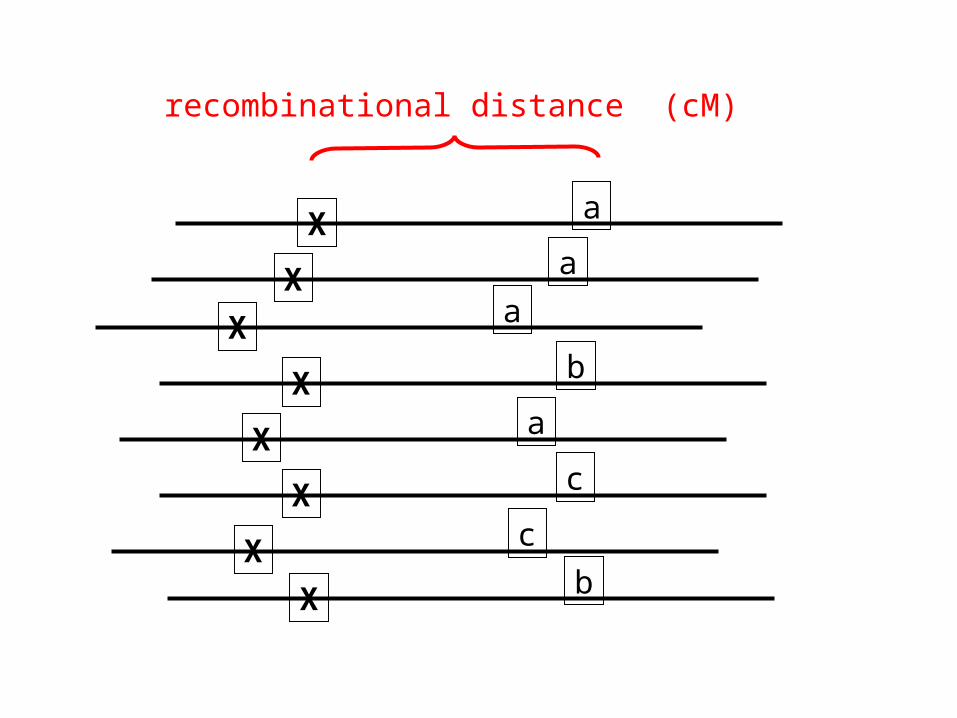
Positive selection onnew mutation
Gene region Genetic marker

time
traitfrequency
linkage to specific marker allele
0
1
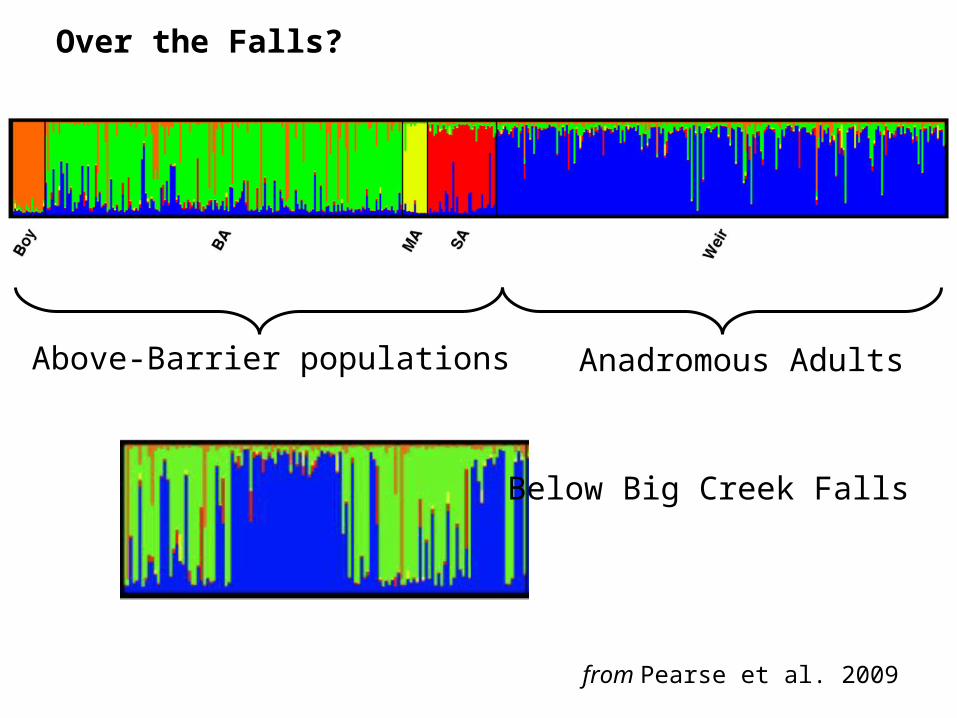
Recombination and mutation selection
Recombination and mutation break down the associationbetween the selected locus and specific marker alleles...
X b
X c
X bX c
X a
X a
X a
X a
recombinational distance (cM)

Of course,situation in Scott Creek is much more complicated!
=>residency as a trait is complex, controlled by many lociso selection is not acting on a single gene.
=>genetic variation for residency likely existed prior totransfer above the falls, so was not a new mutation event.

Genome Scan
• 24 individuals each from above and below falls
• 298 loci successfully genotyped using 363 published primers, 188 anonymous and 110 EST-linked microsatellites
• Loci distributed over all 29 linkage groups with ~10 cM coverage of the O. mykiss genome.

0
5
10
15
20
25
30
35
40
45
50
-0.10-0.08-0.06-0.04-0.020.00 0.02 0.04 0.06 0.08 0.10 0.12 0.14 0.16 0.18 0.20 0.22 0.24 0.26 0.28 0.30 0.32 0.34 0.36 0.38 0.40
Fst
Frequency
Fst(298)=0.034

DifferentiationFdist; Beaumont & Nichols 1996.DetSel; Vitalis et al. 2003.
Variationln(RV), ln(RH); Schlötterer 2002; Kauer et al. 2002.
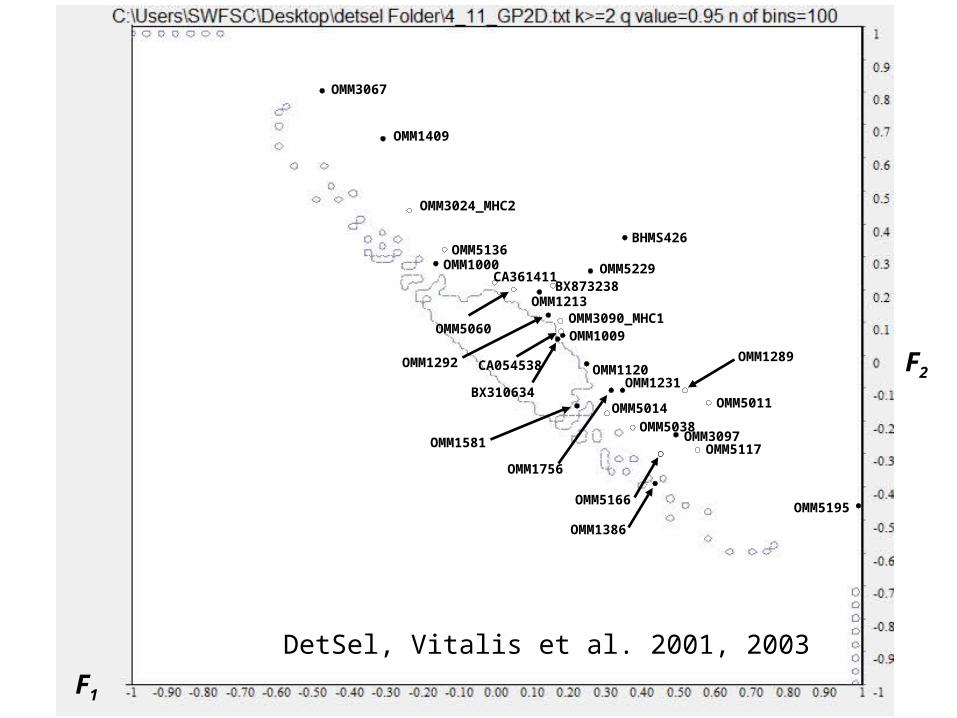
Genome Scan: methods of outlier detection
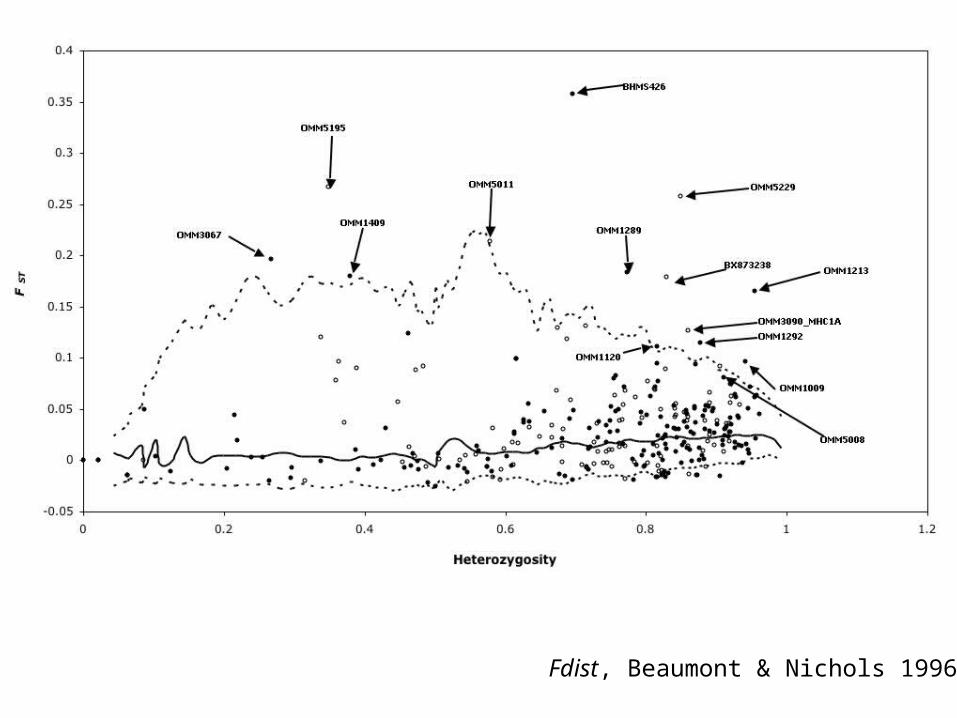
Fdist, Beaumont & Nichols 1996
OMM5166
OMM5136
OMM1009
OMM1120
OMM5117
OMM5014
CA361411
OMM5038
OMM5011
CA054538
OMM3090_MHC1
OMM1756
OMM1213
OMM1000 OMM5229
OMM5060
BX310634
BHMS426
OMM1386
OMM5195
OMM3097
OMM1231
OMM1289
OMM3024_MHC2
OMM3067
OMM1409
BX873238
OMM1292
OMM1581
F2
F1
DetSel, Vitalis et al. 2001, 2003

Standardized ln (RH) vs FST
-0.05
0
0.05
0.1
0.15
0.2
0.25
0.3
0.35
0.4
-5 -4 -3 -2 -1 0 1 2 3 4 5
ln(RH)
FST
OMM1289
OMM5011
OMM1009
OMM1241
BX076085OMM5124
OMM5109
OMM1036
OMM1762
Oki23
OMM3024
OMM1409
OMM3067
Schlötterer 2002; Kauer et al. 2002

Locus DetSel Fdist ln (RH) Linkage group PositionOMM1120 X X X* 10 80.5OMM1009 X X X 5 76.7OMM1289 X X X 21 32.4OMM1409 X X X 15 93.4OMM3067 X X X 19 39.3
OMM5011 X X X 23 24.2BHMS426 X X 5 76.7BX873238 X X 18 110.2OMM1213 X X 6 74.4OMM1292 X X 22 26.4
OMM3090_MHC1 X X 18 62.7OMM5195 X X 10 104.4OMM5229 X X sex 48.3
OMM5136 X X* sex 35.6OMM3024_MHC2 X X 17 0
BX310634 X 9 106.4CA054538 X 6 51.9CA361411 X 22 45.4OMM1000 X sex 21.1OMM1231 X 1 96.8OMM1386 X 22 19.8OMM1581 X 11 22.8OMM1756 X 24 9.6OMM3097 X 11 51.6
OMM5014 X 9 61.9OMM5038 X 20 43OMM5060 X 5 60.5
OMM5117 XOMM5166 XOMM5008 X 12 30.1
OKI23 XOMM1036 X 21 52.4OMM1762 X 28 5.3OMM5109 X 3 120.4OMM5124 X 18 76
•Total of 37 outliers.
•20 anonymous•17 EST-linked --elevated proportion of
EST-linked loci
•9 with two methods.
•6 outlier loci (2%) with all methods
Summary
from Martinez et al. In Prep
QuickTime™ and aTIFF (LZW) decompressor
are needed to see this picture.
from Leder et al. 2006
OMM1009 (3) & BHMS426 (2) map to same region identified as a QTL of 20-50% for spawn timing, as well as the Clock gene.
(O’Malley et al. 2003; Leder at al. 2006)

Conclusions:
Loci identified as outliers are candidate markers ofgenomic regions under selection.
Concordant signals from multiple analyses provide the strongest evidence for selection. 6 loci =>OMM1009, OMM1120, OMM1289,
OMM1409, OMM3067, OMM5011
OMM1009 and BHMS426, which had the highest overall Fst value, are located in a genomic region identified as a QTL for spawn timing and containing the Clock gene.
In addition to being potential markers for selected gene regions, these loci will be fantastic indicators of hybridization and ancestry.
from Martinez et al. In Prep

Now What?
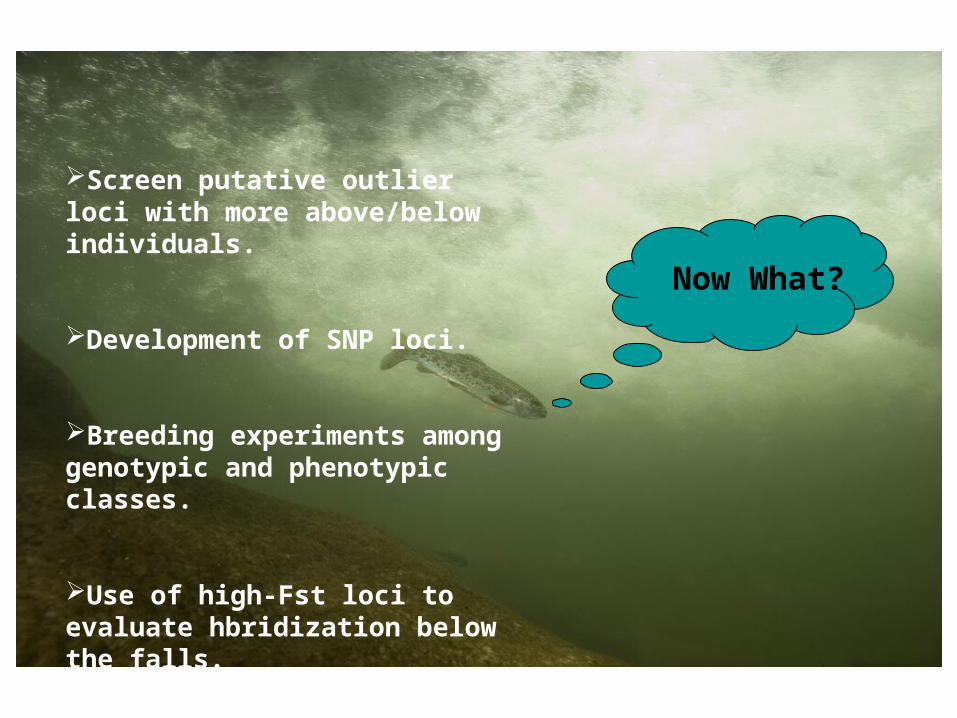
Now What?
Screen putative outlier loci with more above/below individuals.
Development of SNP loci.
Breeding experiments among genotypic and phenotypic classes.
Use of high-Fst loci to evaluate hbridization below the falls.

AcknowledgementsMolecular Ecology Team:Alicia Abadia, Eric Anderson, Anthony Clemento,Gregory Charrier, Carlos Garza, Libby Gilbert-Horvath,Andres Martinez, and Edith Martinez.
Scott Creek Ecology group:Morgan Bond, Chad Hanson, Sean Hayes, Bruce MacFarlane.
FundingNOAA FisheriesCA Dept. Fish & Game Fisheries Restoration Grant ProgramSociety for Advancment of Chicanos and Native Americans in Science

QUESTIONS?