Embed Size (px)
Citation preview

A population is a group of organisms of the same species in the same area
Population Ecology=the study of population growth and distribution and
the factors that affect these things.

Populations can be made up of individuals, clones or
colonies.

The boundaries and distribution of a
population are scale dependent
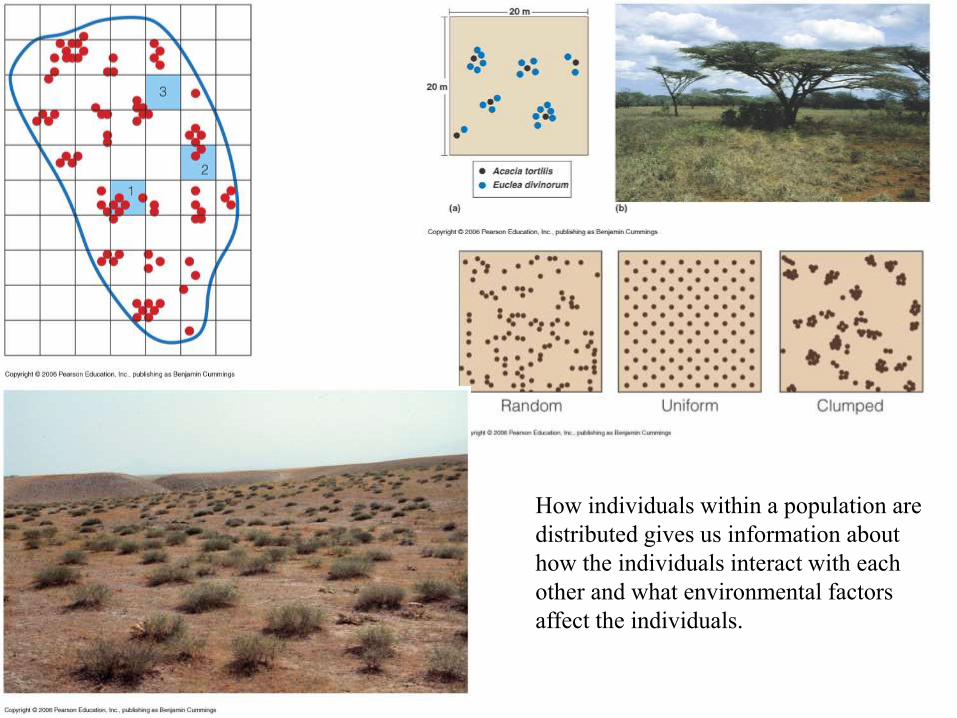
How individuals within a population are
distributed gives us information about
how the individuals interact with each
other and what environmental factors
affect the individuals.

Distribution can be a function
of how an organism can
disperse. Plants are restricted
by seed movement.
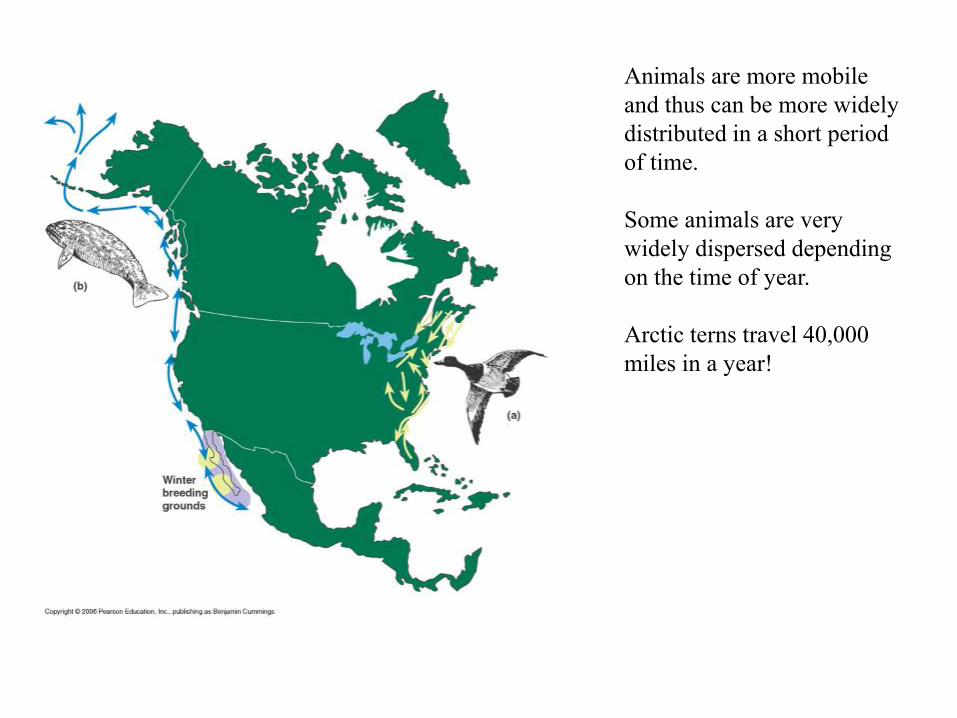
Animals are more mobile
and thus can be more widely
distributed in a short period
of time.
Some animals are very
widely dispersed depending
on the time of year.
Arctic terns travel 40,000
miles in a year!

en.wikipedia.org/wiki/Red_Knot
www.delawareaudubon.org/images/redknot_dcwild.jpg
Red knots in NJ migrate from Patagonia to Hudson Bay. They depend on horseshoe crab
eggs to give them the energy to make it to Hudson Bay and to be able to breed.

We tend to think of populations as being in one place with everybody being in that place.
But, everybody may not be in the same place. There may be several local populations that
together make up the total population. This group of local populations together form a
metapopulation. When looking at a metapopulation, immigration and emigration or
extinction play important roles in regulating population size.

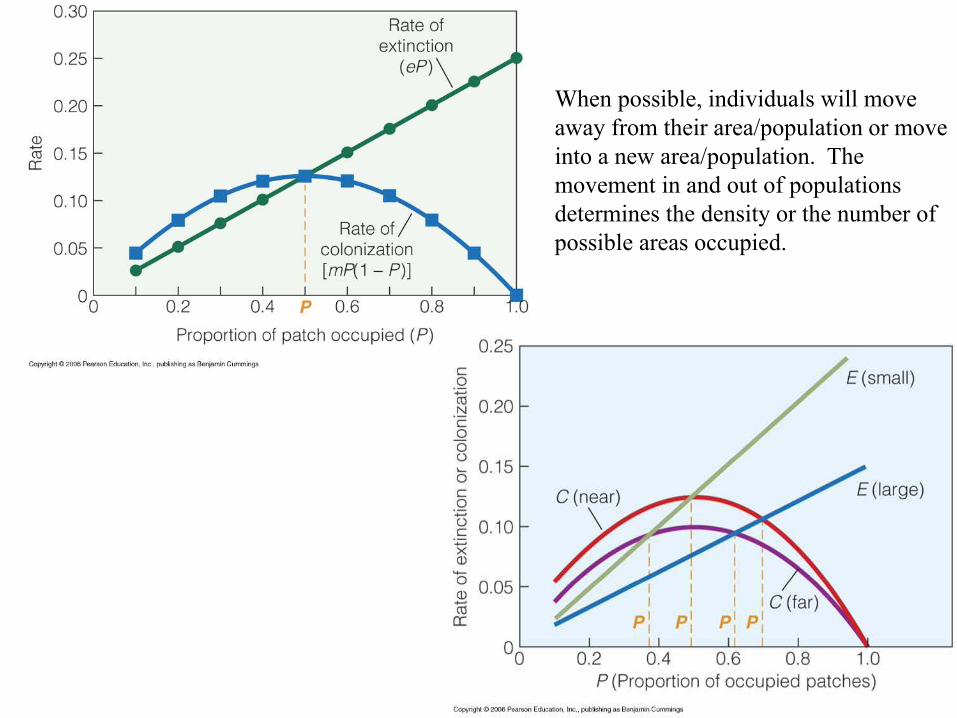
When possible, individuals will move
away from their area/population or move
into a new area/population. The
movement in and out of populations
determines the density or the number of
possible areas occupied.
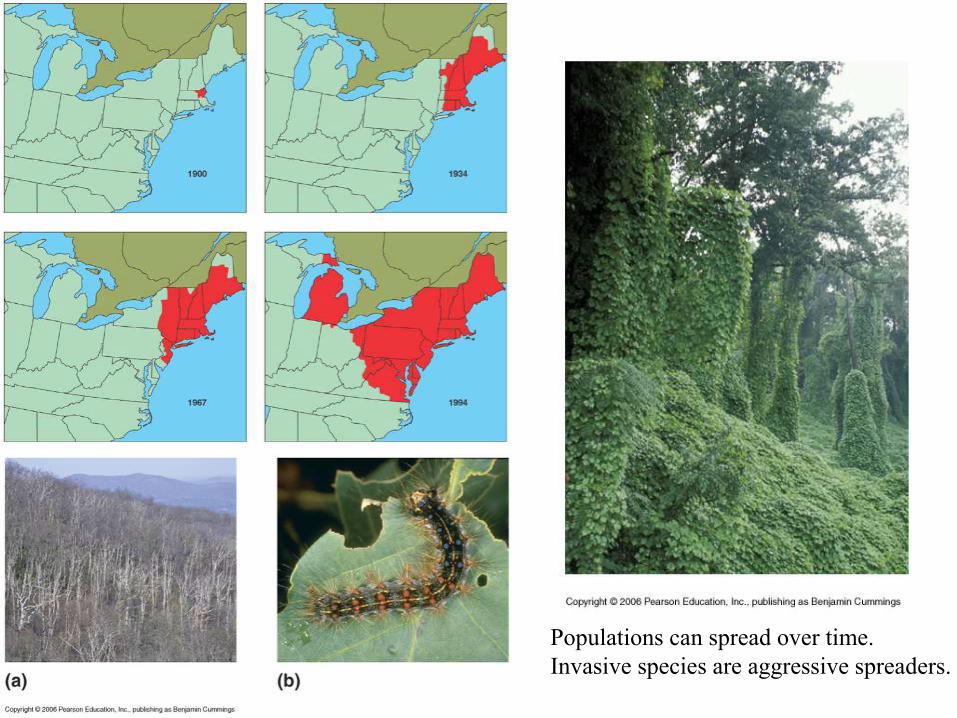
Populations can spread over time.
Invasive species are aggressive spreaders.

Assuming that individuals in a population can not leave or enter, the number of individuals in a
population is N(t). The population changes in size as a result of births (B) and deaths (D).
Population size is given as: N(t2)=N(t1)+B-D or: N(t2)-N(t1)=B-D
Birthrate=b=#births/dt*N(t1) Deathrate=d=#deaths/dt*N(t1)
#births=B=birthrate*dt*N(t1) and #deaths=D=deathrate* dt*N(t1)
N(t2)-N(t1)=(birthrate*dt*N(t1))-(deathrate*dt*N(t1)=(birthrate-deathrate)(dt*N(t1))
Change in population size over time: N/t=(b-d)N(t1); r=b-d; N/t=rN(t1)
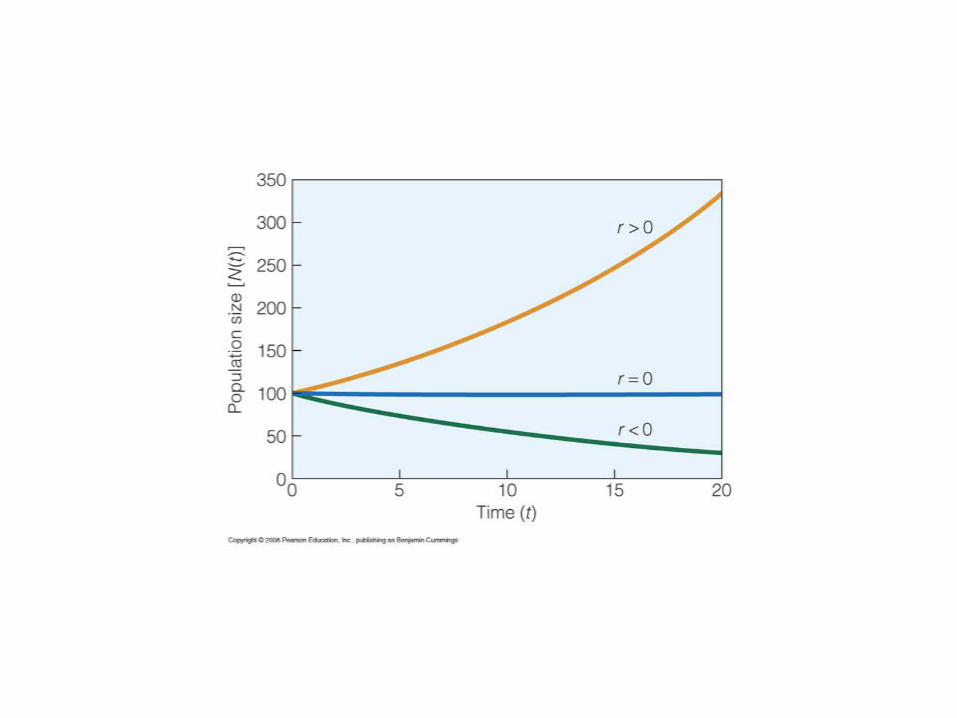


Remember: r=b-d N/t=rN(t1)?
This equation assumes that there is no
limit to population growth. However,
that is not generally the case once the
population reaches a certain density. At
that point, population growth declines
until the population stays at a steady
number. Thus, we need a new
equation!!!
dN/dt=rN(1-N/K)

Density can affect population growth by changing
reproductive output. In plants, this can mean
fewer seeds and smaller seeds. In animals, it can
mean fewer offspring or fewer females having
offspring.
The presence of a predator can also change
population growth. Some studies have shown that
tadpoles will mature faster when a predator is
present.
(GERMÁN ORIZAOLA, FLORENTINO BRAÑA (2005)
Plasticity in newt metamorphosis: the effect of predation at
embryonic and larval stages
Freshwater Biology 50 (3), 438–446.
doi:10.1111/j.1365-2427.2005.01332.x)
But, other studies show that the presence of a predator
can slow down growth due to avoidance of the predator
(this will be discussed at a later time)

Density is directly a result of numbers of
individuals in a population and the area
over which the population is spread.
Larger animals need larger areas or in
other words, area is more limiting for
larger organisms.
Behavior can influence population density
and the effects of population density. For
example, if density is high, certain female
birds will stop producing eggs.
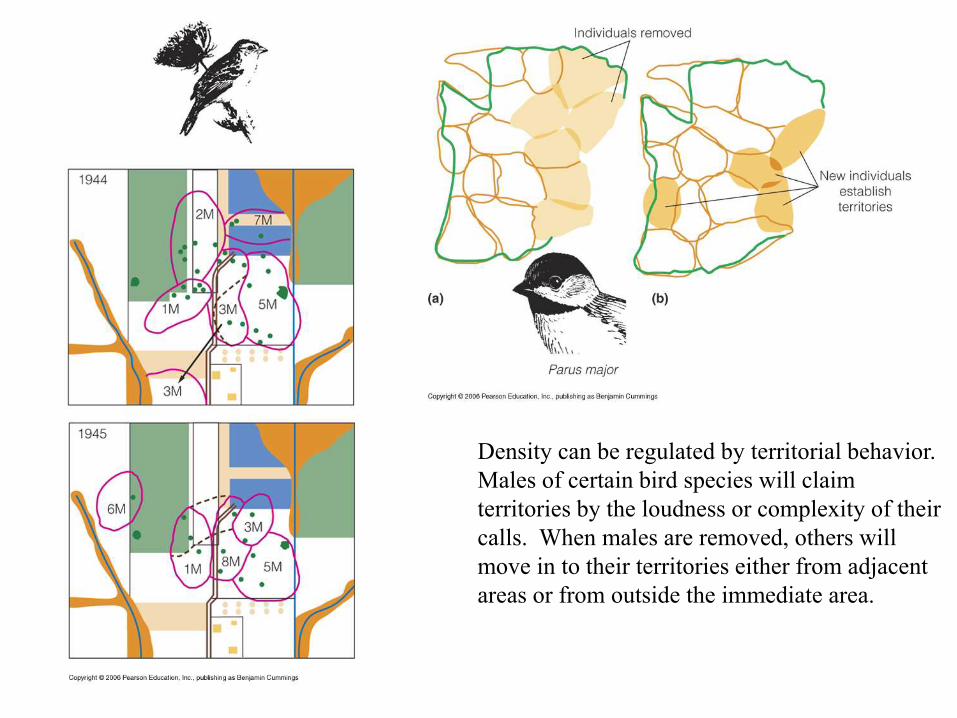
Density can be regulated by territorial behavior.
Males of certain bird species will claim
territories by the loudness or complexity of their
calls. When males are removed, others will
move in to their territories either from adjacent
areas or from outside the immediate area.

The environment also plays a role in
controlling population size. This is called
density independent control.

Age and age distribution are important characteristics of
a population. The question is: what proportion of a
population is the reproducers? How often are they
reproducing?
!
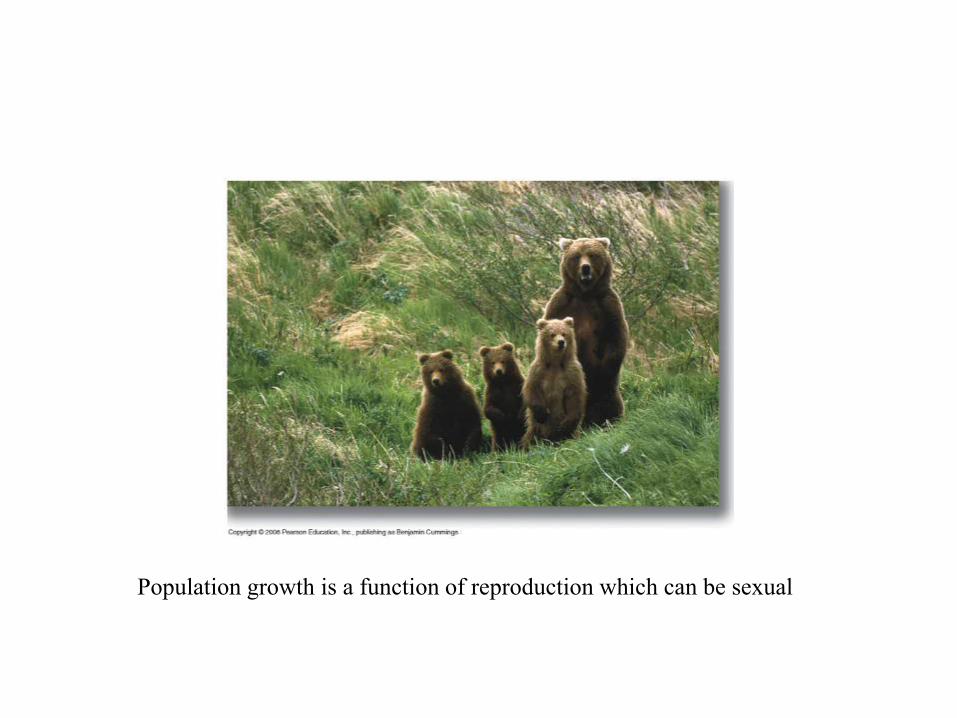
Population growth is a function of reproduction which can be sexual
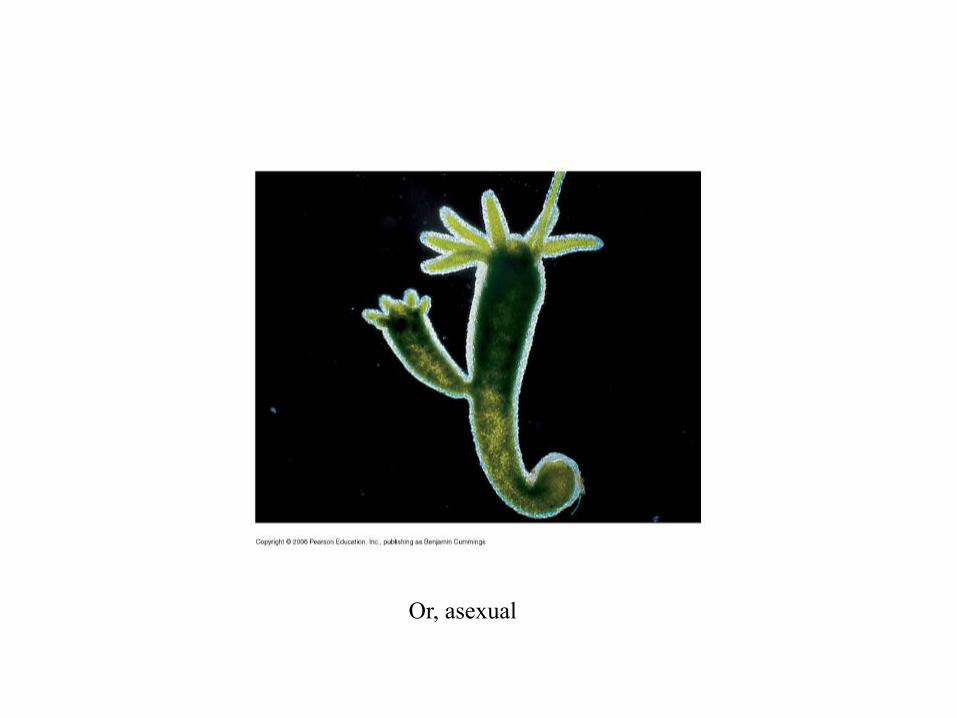
Or, asexual
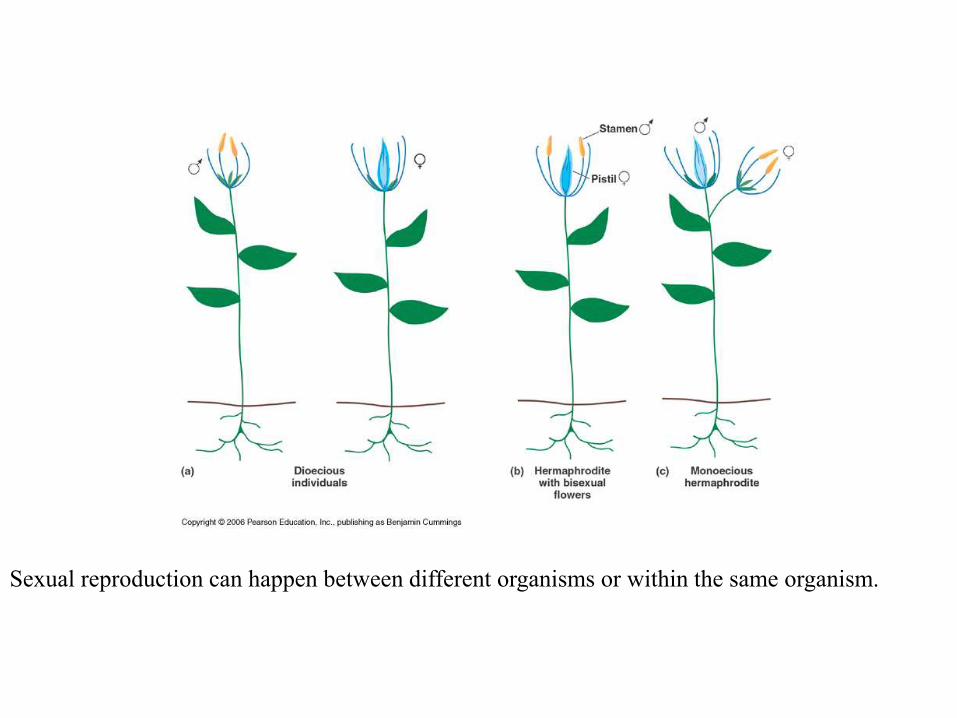
Sexual reproduction can happen between different organisms or within the same organism.

Worms are hermaphroditic, but mate with other worms

Some organisms can change sex depending on environmental conditions
Parrot fish can change from female to male.
Jack-in-the-pulpit can change from asexual to male to female.
Communal insects can change sex ratios depending on colony needs.

Sexual selection:
Either females select males with greatest
chance of success or males with greater chance
of success select females. It’s all about
resources and immune systems and ??.

Different species may invest more or less energy in their
offspring. Species that produce many offspring are termed r-
strategists and those that produce few offspring are termed K-
strategists (we will return to these terms later).

Production of offspring requires energy and thus there are trade-offs between size and numbers
r vs K selection
From an evolutionary point of view, reproduction is a matter of reproductive success which is a
function of trade-offs between access to resources (energy), allocation of resources (growth vs
sex), parental care.
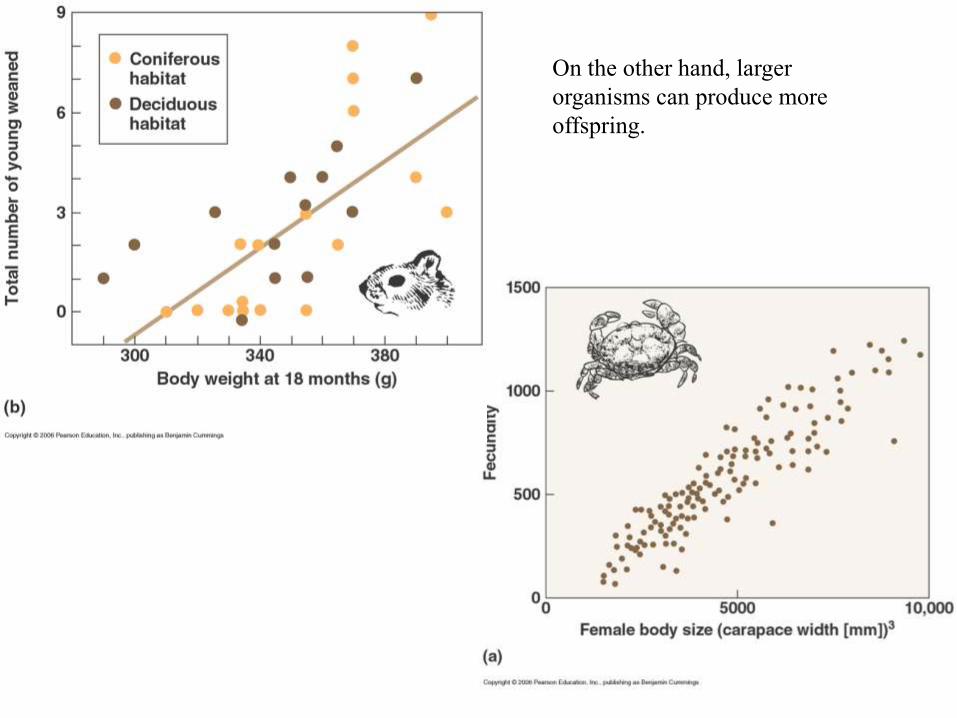
On the other hand, larger
organisms can produce more
offspring.
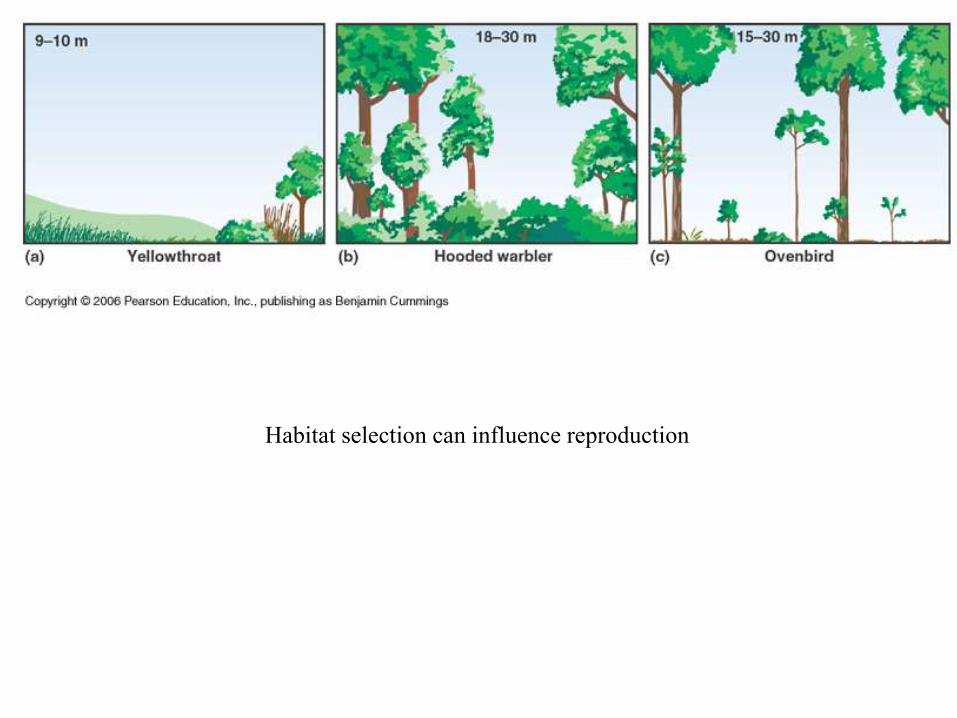
Habitat selection can influence reproduction


Northern birds may have larger clutches
because:
1. They have more food available
2. They live in a less predictable
environment
3. They have higher mortality in the
winter (and thus fewer competitors
for food in the spring)
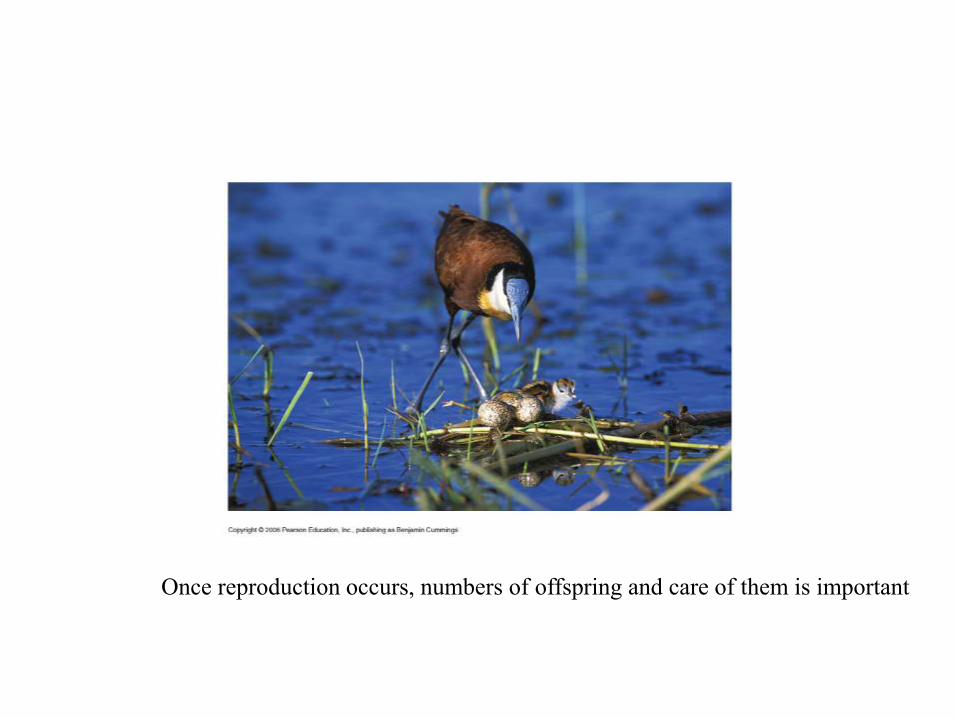
Once reproduction occurs, numbers of offspring and care of them is important
Attack of the plant invaders: A special case of population and ecosystems
ecology
Fact is worse than fiction!!
ww
w.ro
ttento
mato
es.com
/vin
e/sho
wth
read.p
hp?t=
35
270
5

THE REGIONAL IMPACT OF AN
INVASIVE SPECIES, JAPANESE
KNOTWEED, ON SURFACE WATER
SYSTEMS
Acknowledgements:
•Karina Schäfer (Rutgers-Newark), Rob Scherr, Kiryl Bychkouski, Anita Trajkovska, Kim Vanderklein, Ian Vanderklein, Nicole Bujalski, Hyun Kho, Jared Lopes
Dirk Vanderklein Josh Galster
Montclair State University

Why do invasive plants matter?
1. Non-native invasive plants account
for about 26 billion dollars worth of
damage to American agriculture
every year.
2. Non-native invasive plants can take
over a complete ecosystem.
3. Non-native invasive plants displace
native animal and plant species.
4. Non-native invasive plants change
how ecosystems work!!
(Pimentel et al. 2000. BioScience 50:
53-65)
!! Not all non-native plants are invasive
(but may still cause problems
indirectly – Liebold et al. 2012
Frontiers in Ecology and the
Environment) !!
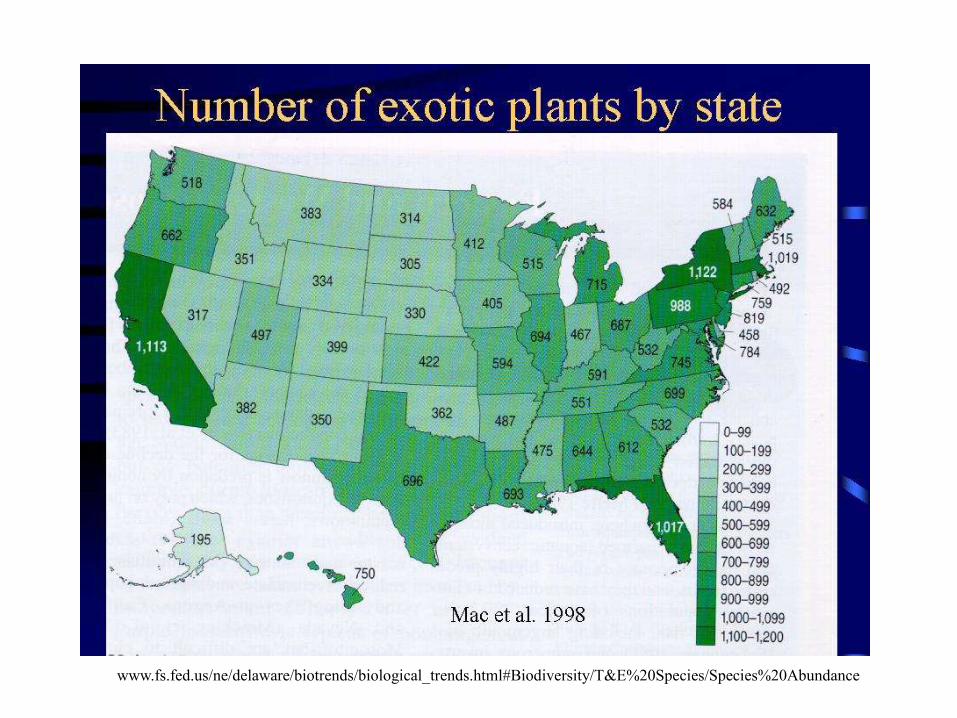
www.fs.fed.us/ne/delaware/biotrends/biological_trends.html#Biodiversity/T&E%20Species/Species%20Abundance
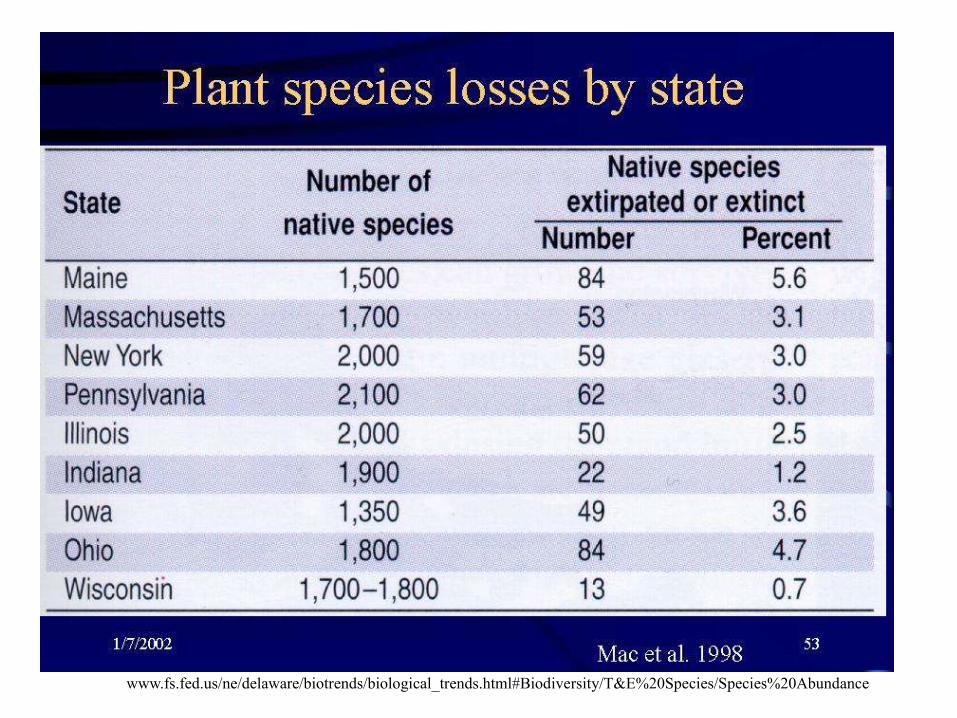
www.fs.fed.us/ne/delaware/biotrends/biological_trends.html#Biodiversity/T&E%20Species/Species%20Abundance

• Outcompeting native species for resources (light, nutrients,
water, pollinators)
• Altering the physical environment (soil properties, water flow,
soil moisture)
• Altering the chemical environment (salt, oxygen, acidity)
• Altering natural sources of disturbance (effects of wind, fire,
flood)
• Altering species interactions & food webs
How do invasive species alter ecosystems?
Ehrenfeld, 2007
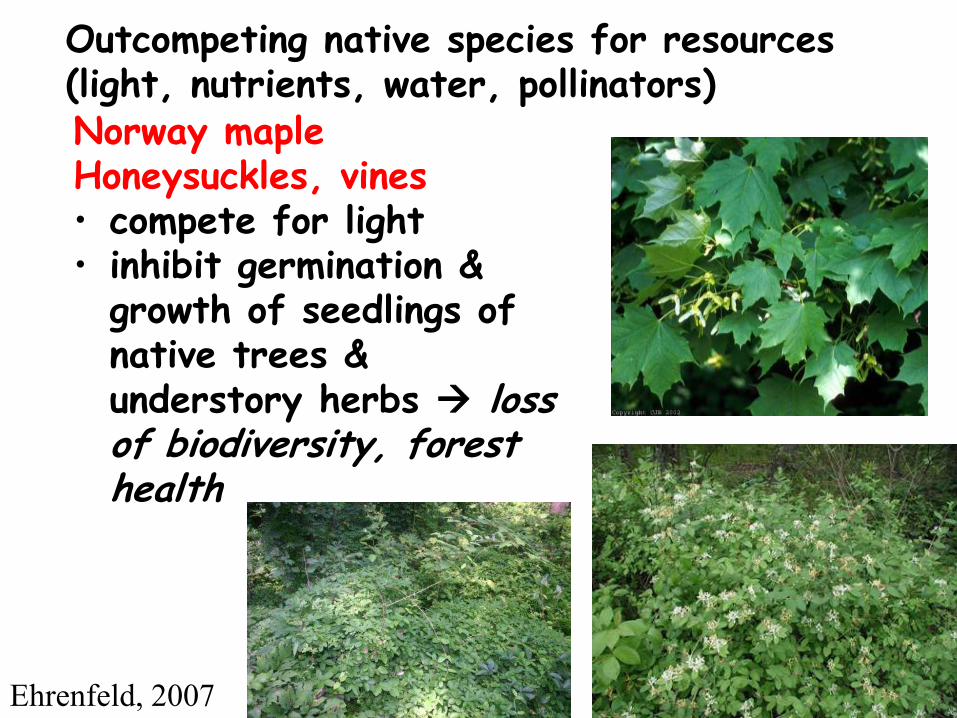
Norway maple Honeysuckles, vines • compete for light • inhibit germination &
growth of seedlings of native trees & understory herbs loss of biodiversity, forest health
Outcompeting native species for resources (light, nutrients, water, pollinators)
Ehrenfeld, 2007

Tamarix • Removes large amounts of
water • Causes large amounts of
sediment to accumulate damages water resources for agriculture, human use
Altering the physical environment
Phragmites • Accumulates sediments • Eliminates refuges (pools)
for young fish reduce sport fish & commercial fish populations
Ehrenfeld, 2007

Altering the chemical environment
Ice plant (Carpobrotus edulis) • concentrates salt at the soil surface discourage native species
Salt-lover (Halogeton) •Takes up salts from the soil poisonous to cattle and sheep on rangelands •Makes surface soils too salty for other plants eliminates desirable forage plants
Ehrenfeld, 2007
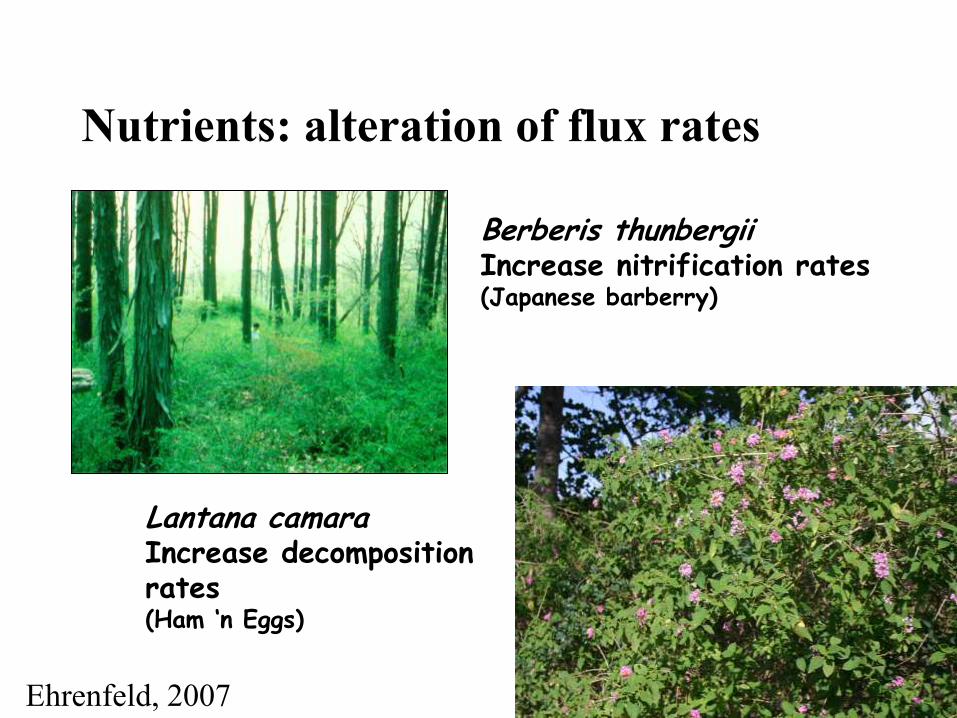
Nutrients: alteration of flux rates
Berberis thunbergii Increase nitrification rates (Japanese barberry)
Lantana camara Increase decomposition rates (Ham ‘n Eggs)
Ehrenfeld, 2007
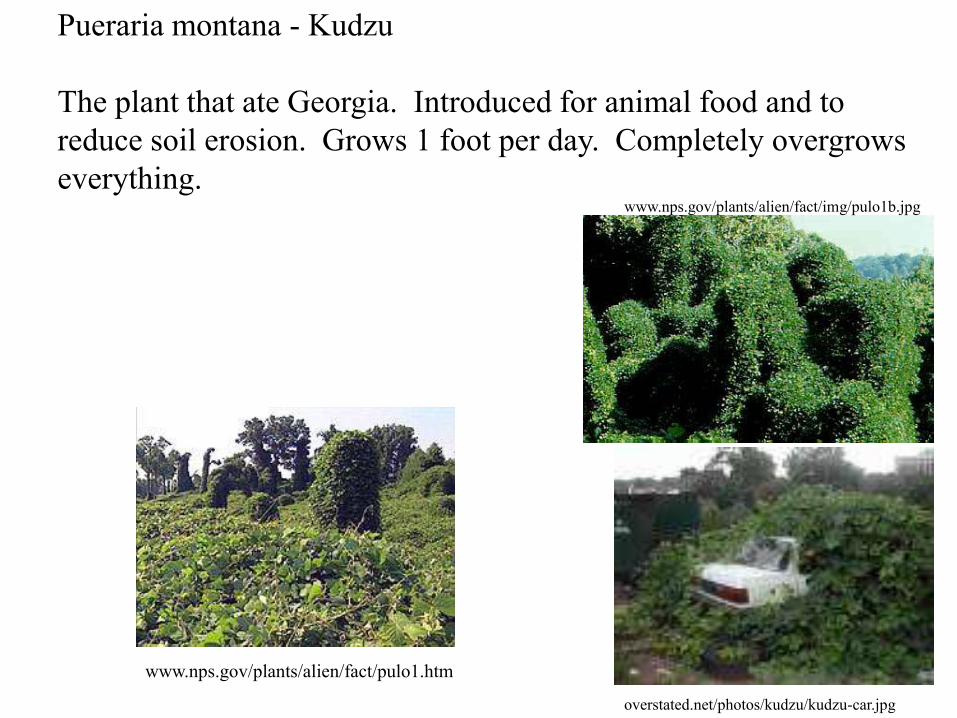
Pueraria montana - Kudzu
The plant that ate Georgia. Introduced for animal food and to
reduce soil erosion. Grows 1 foot per day. Completely overgrows
everything.
www.nps.gov/plants/alien/fact/pulo1.htm
overstated.net/photos/kudzu/kudzu-car.jpg
www.nps.gov/plants/alien/fact/img/pulo1b.jpg

Hedera ilex - English Ivy
Introduced as an ornamental plant. Still used that way. Completely
overgrows everything. Toxic to animals and people.
www.nps.gov/plants/alien/fact/hehe1.htm
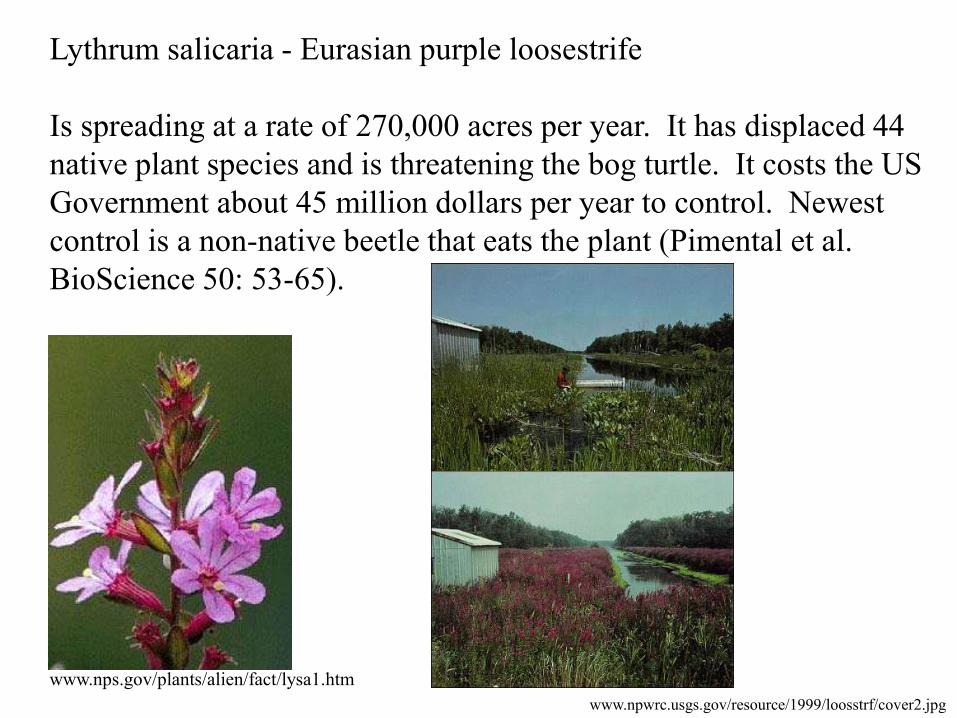
Lythrum salicaria - Eurasian purple loosestrife
Is spreading at a rate of 270,000 acres per year. It has displaced 44
native plant species and is threatening the bog turtle. It costs the US
Government about 45 million dollars per year to control. Newest
control is a non-native beetle that eats the plant (Pimental et al.
BioScience 50: 53-65).
www.nps.gov/plants/alien/fact/lysa1.htm
www.npwrc.usgs.gov/resource/1999/loosstrf/cover2.jpg
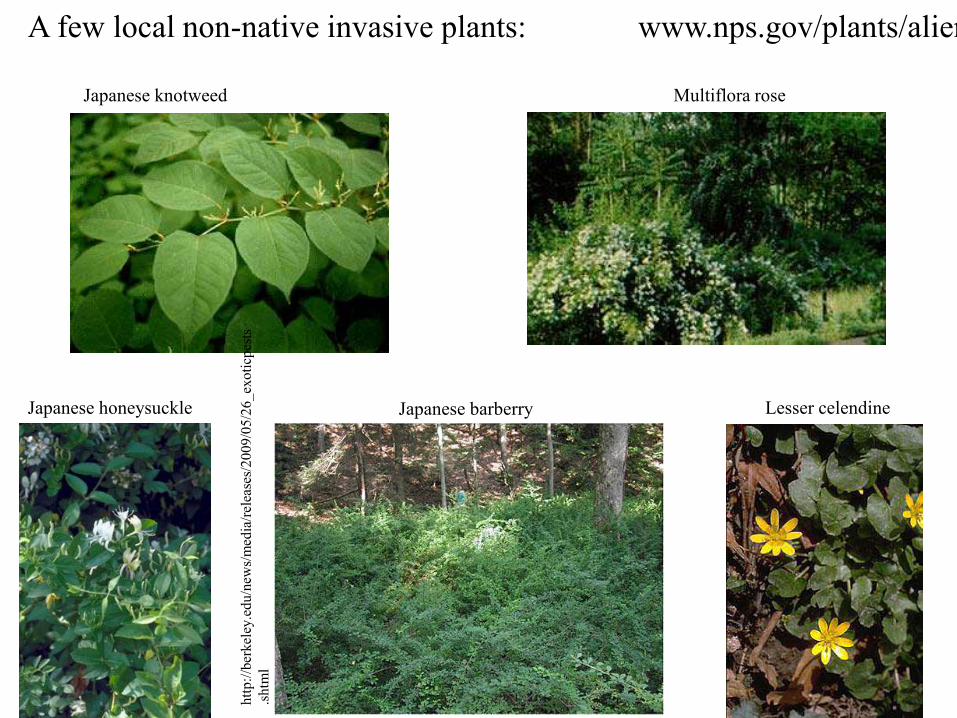
A few local non-native invasive plants:
Japanese knotweed
Japanese honeysuckle Lesser celendine
Multiflora rose
www.nps.gov/plants/alien/fact/
Japanese barberry
htt
p:/
/ber
kel
ey.e
du/n
ews/
med
ia/r
elea
ses/
20
09
/05/2
6_
exo
ticp
ests
.sh
tml
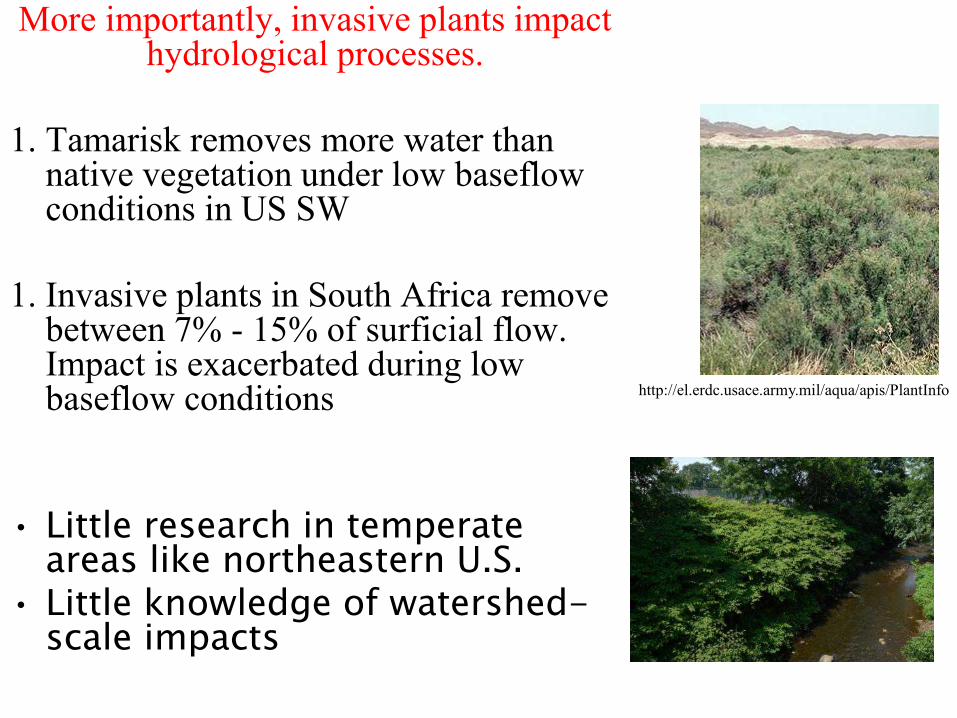
More importantly, invasive plants impact hydrological processes.
1. Tamarisk removes more water than native vegetation under low baseflow conditions in US SW
1. Invasive plants in South Africa remove between 7% - 15% of surficial flow. Impact is exacerbated during low baseflow conditions
• Little research in temperate areas like northeastern U.S.
• Little knowledge of watershed-scale impacts
http://el.erdc.usace.army.mil/aqua/apis/PlantInfo
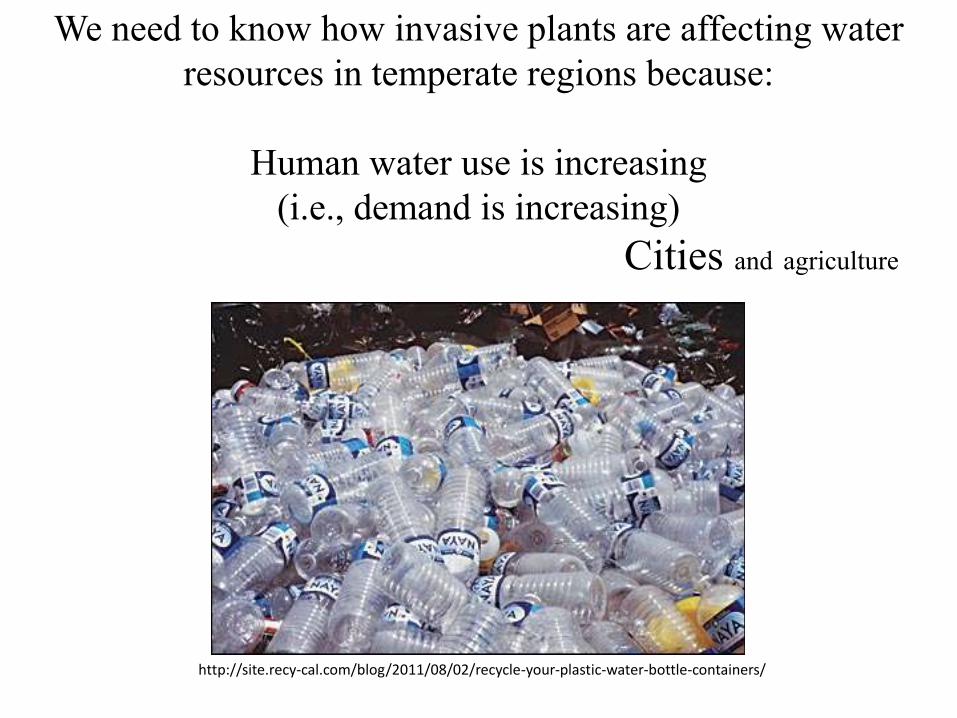
We need to know how invasive plants are affecting water
resources in temperate regions because:
Human water use is increasing
(i.e., demand is increasing)
Cities and agriculture
http://site.recy-cal.com/blog/2011/08/02/recycle-your-plastic-water-bottle-containers/

In NJ Highlands
region, 62% of sub-
watersheds have been
experiencing water
shortages
5.4 million people
depend on this water
(i.e. supply has
decreased)
Results
114 of 183 HUC14
Subwatersheds in
water deficit, from
small to very large
Some public water
supply systems also
exceed capacity
Relating new water
demands from
growth to source
areas difficult
Van Abs & Hutzelmann, NJ Highlands Council 2010
=DEFICIT
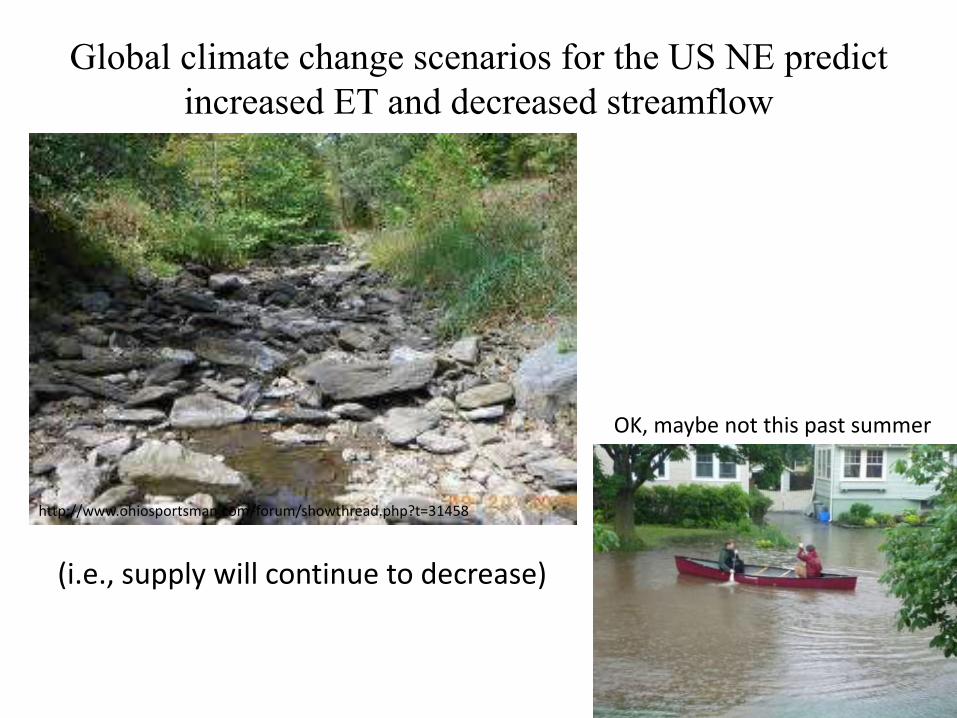
Global climate change scenarios for the US NE predict
increased ET and decreased streamflow
OK, maybe not this past summer
(i.e., supply will continue to decrease)
http://www.ohiosportsman.com/forum/showthread.php?t=31458
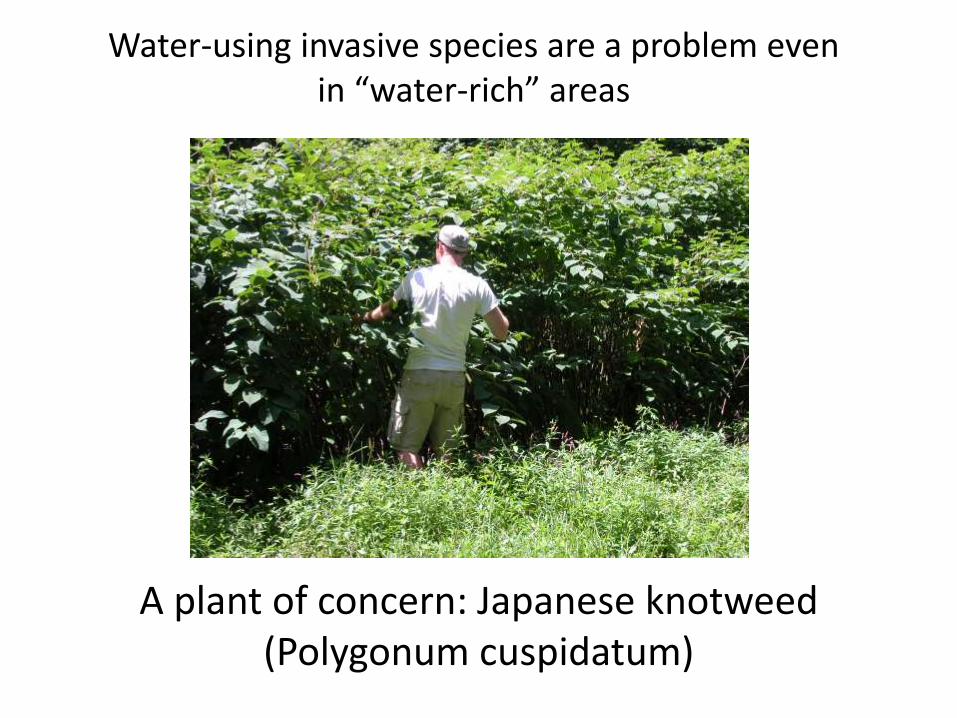
A plant of concern: Japanese knotweed (Polygonum cuspidatum)
Water-using invasive species are a problem even in “water-rich” areas

Japanese knotweed: -Declared “New ornamental plant of the year” in 1848 -Now is declared highly invasive plant in NY and top invasive plant in NJ and banned in several other NE states -Can be found in 41 states and half of Canadian provinces
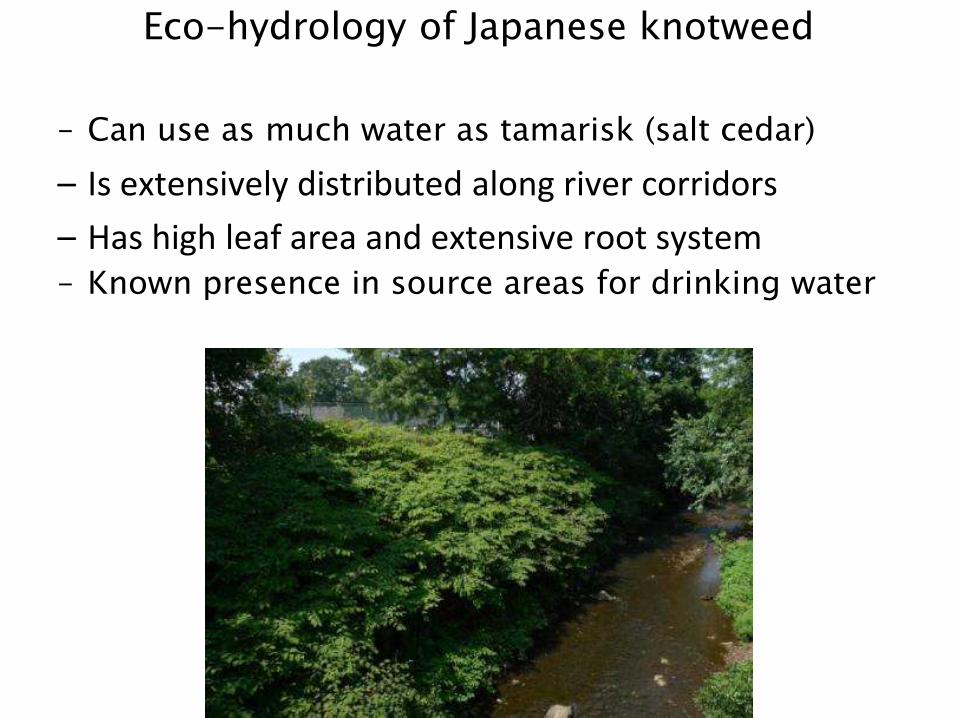
Eco-hydrology of Japanese knotweed
– Can use as much water as tamarisk (salt cedar)
– Is extensively distributed along river corridors
– Has high leaf area and extensive root system – Known presence in source areas for drinking water
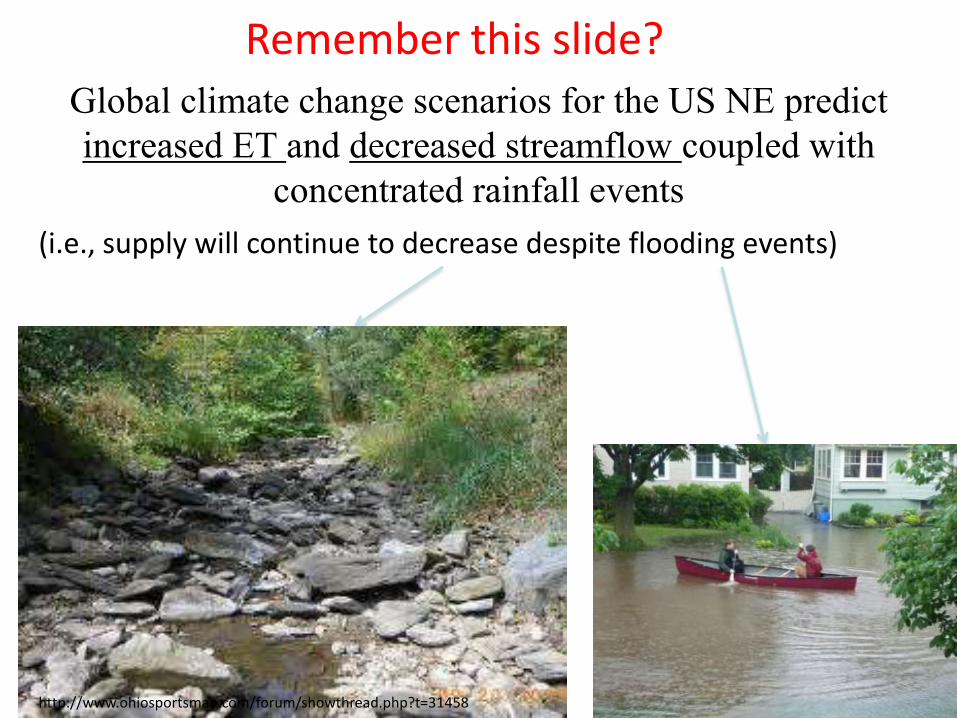
Global climate change scenarios for the US NE predict
increased ET and decreased streamflow coupled with
concentrated rainfall events
(i.e., supply will continue to decrease despite flooding events)
http://www.ohiosportsman.com/forum/showthread.php?t=31458
Remember this slide?
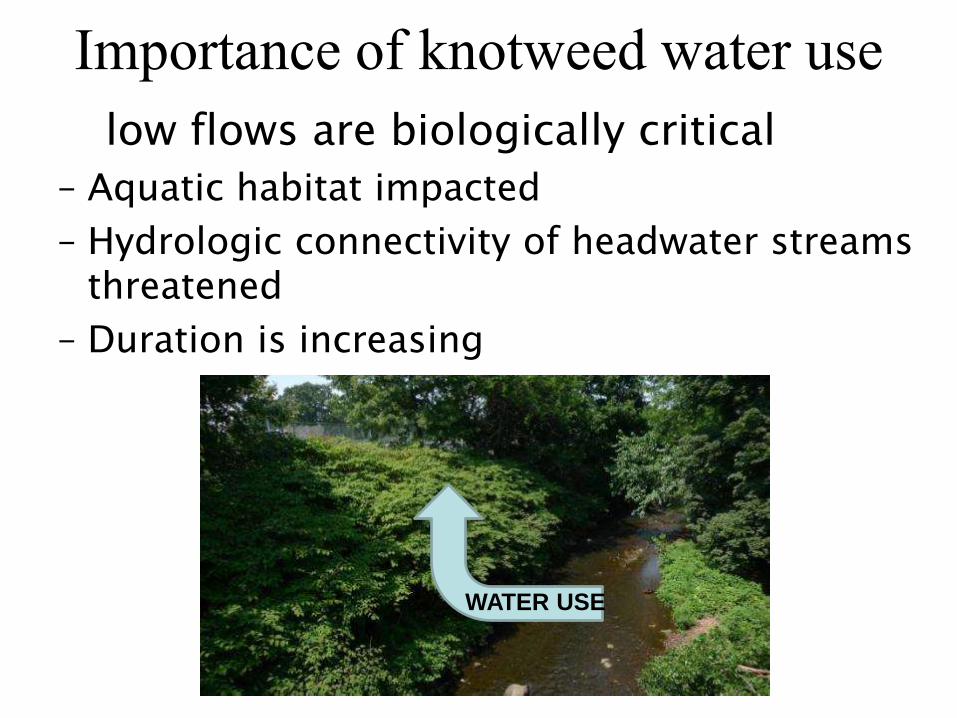
low flows are biologically critical
– Aquatic habitat impacted
– Hydrologic connectivity of headwater streams threatened
– Duration is increasing
•However, we should worry too…
Importance of knotweed water use
WATER USE
So, -We need to know how invasive plants may be affecting water resources in mesic (i.e. wet) environments such as the US NE -Knotweed is a good candidate to consider because of its invasiveness and association with riparian environments Enter Vanderklein and Galster and a multi-year study to assess the eco-hydrological impact of Japanese knotweed on the Third River, NJ.
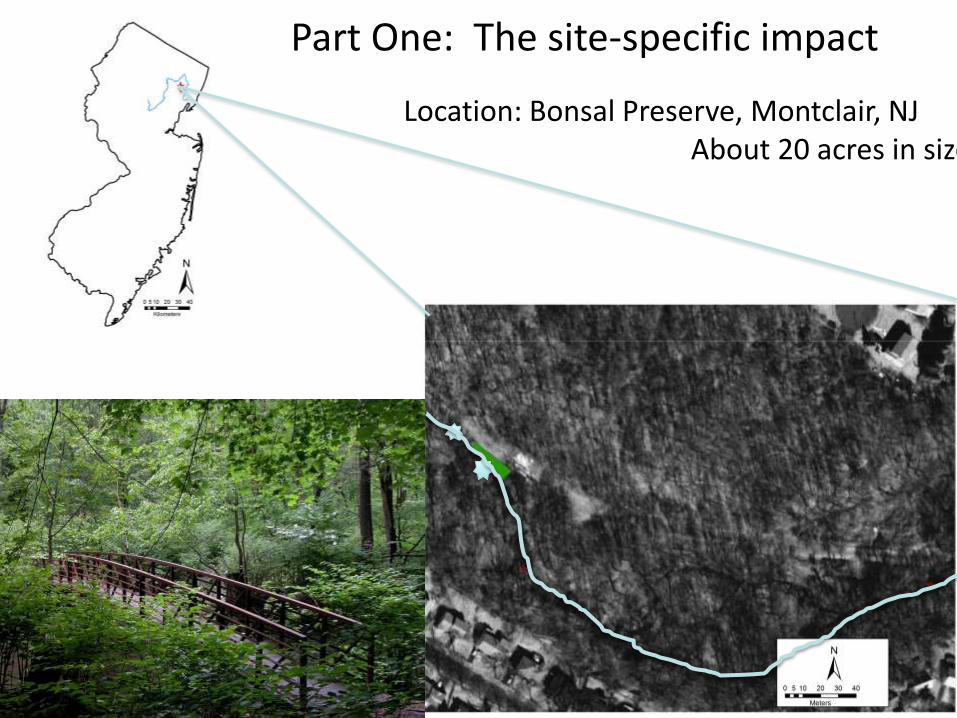
Location: Bonsal Preserve, Montclair, NJ About 20 acres in size
Part One: The site-specific impact

Experimental approach – Hydrological:
•Installed pressure sensors (levelogger junior,
Solinst) in stream bed to measure water levels
upstream and in-patch (adjusted for air pressure
changes). Sensors were installed in June 2008.

Experimental approach – Hydrological:
•Determined diurnal maxima and minima during
baseflow conditions
•Measured stream levels one month prior to and post
knotweed harvest.
Max
Min

Experimental approach – Physiological: Physiological measurements were collected on knotweed plants for two days before being harvested.
Leaves were measured across the canopy from left to right and front to back Measurements were recorded every hour from dawn to dusk

Measured transpiration with a LiCor 6400 IRGA Data were integrated over each measurement period (dawn to dusk) to get total daily water loss from the stand.

Harvested all plants within patch.
Determined total leaf area for the patch (744 m2) and total ground area (150 m2) to give us leaf area index (LAI) of ca. 5 (m2/m2).
"Seriously, how are you NOT going crazy right now?"

6
7
8
9
10
Wate
r Level c
m
Post Pre
PRE/POST HARVEST
6
7
8
9
Wate
r Level c
m
Post Pre
PRE/POST HARVEST
6
7
8
9
10
Wate
r Level c
m
Post Pre
PRE/POST HARVEST
6
7
8
9
Wate
r Level c
m
Post Pre
PRE/POST HARVEST
6
7
8
9
10
Wate
r Level c
m
Post Pre
PRE/POST HARVEST
6
7
8
9
Wate
r Level c
m
Post Pre
PRE/POST HARVEST
6
7
8
9
Wate
r Level c
m
Post Pre
PRE/POST HARVEST
6
7
8
9
Wate
r Level c
m
Post Pre
PRE/POST HARVEST
6
7
8
9
10
Wate
r Level c
m
Post Pre
PRE/POST HARVEST
Average Daily Minimum Stream Depth
In Patch
Average Daily Maximum Stream Depth
In Patch
Before Before After After
Results - Hydrology
Above the patch, change in stream depth was in opposite direction

Sunlight intensity at the measured leaves from dawn to dusk (and beyond).
Water loss from the leaves from dawn to dusk. Total average water loss for the day is 1556 liters. This translates into 10.4 mm of transpiration or the equivalent of 3 people’s water use for one day.
Results - Physiology

• Manageable size (third order)
• Representative of land use in northern NJ
• Site of intensive physiological measurements
Third River, New Jersey
Part two: Extrapolating local impact to regional impact
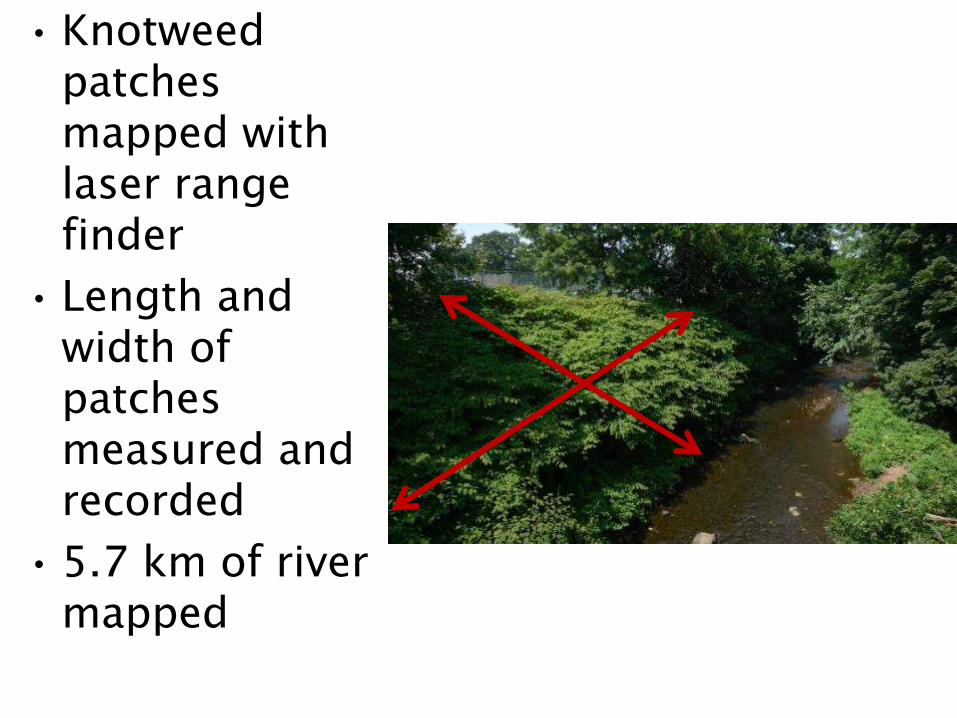
• Knotweed patches mapped with laser range finder
• Length and width of patches measured and recorded
• 5.7 km of river mapped

• 2.3 km river length
– 4.2 m2 of knotweed per meter of stream
• 3.4 km river length
– ~0 knotweed found
Unmanaged vs. Managed

• 28.1 km total stream length
• 10.6 km classified as managed
– No knotweed
• 17.5 km classified as unmanaged
– 4.2 m2 of knotweed per meter of stream
Stream areas
classified in GIS
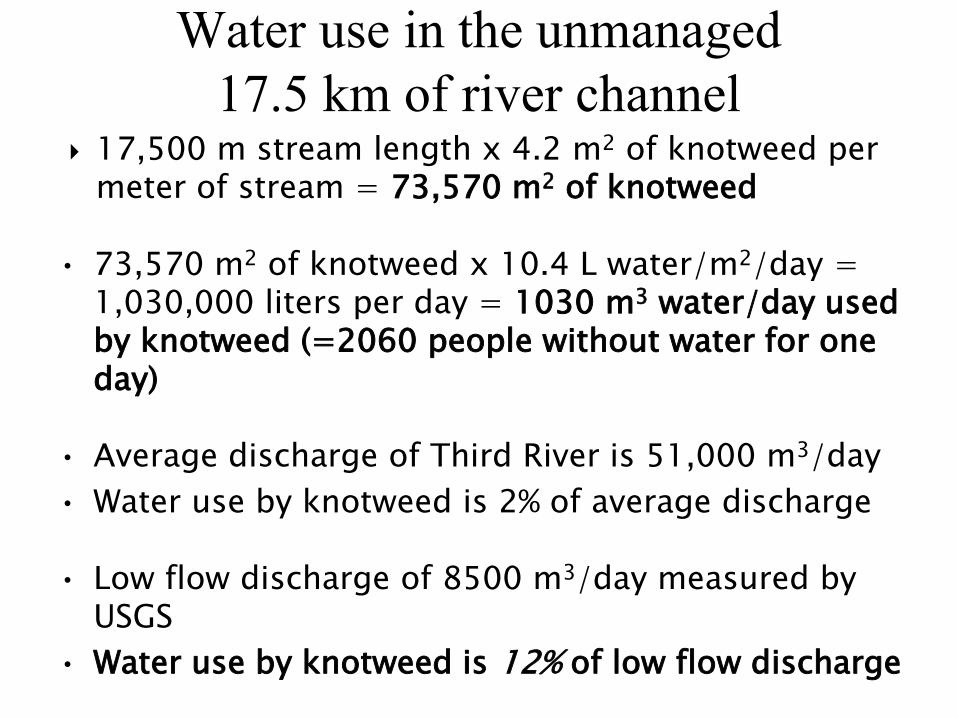
17,500 m stream length x 4.2 m2 of knotweed per meter of stream = 73,570 m2 of knotweed
• 73,570 m2 of knotweed x 10.4 L water/m2/day = 1,030,000 liters per day = 1030 m3 water/day used by knotweed (=2060 people without water for one day)
• Average discharge of Third River is 51,000 m3/day
• Water use by knotweed is 2% of average discharge
• Low flow discharge of 8500 m3/day measured by USGS
• Water use by knotweed is 12% of low flow discharge
Water use in the unmanaged
17.5 km of river channel

• Knotweed uses significant amounts of water in “water-rich” areas (10% or more of low flow discharge)
• Negative impact on aquatic habitat amount and connectivity
• Negative impacts on water supply coupled with projected warmer and drier future climate
• However, this is extrapolating from a small area
• Need for more mapping of invasive species distribution and measure their physiological characteristics
Implications of Japanese knotweed water use

Can we do anything to reduce the impact of Japanese
knotweed on our water supply?
1.First and foremost, do not plant it or distribute it!!
2.Removal is almost impossible. Multiple doses of herbicide
are needed along with mechanical removal.
3.Annecdotally, this does not guarantee permanent removal
So….
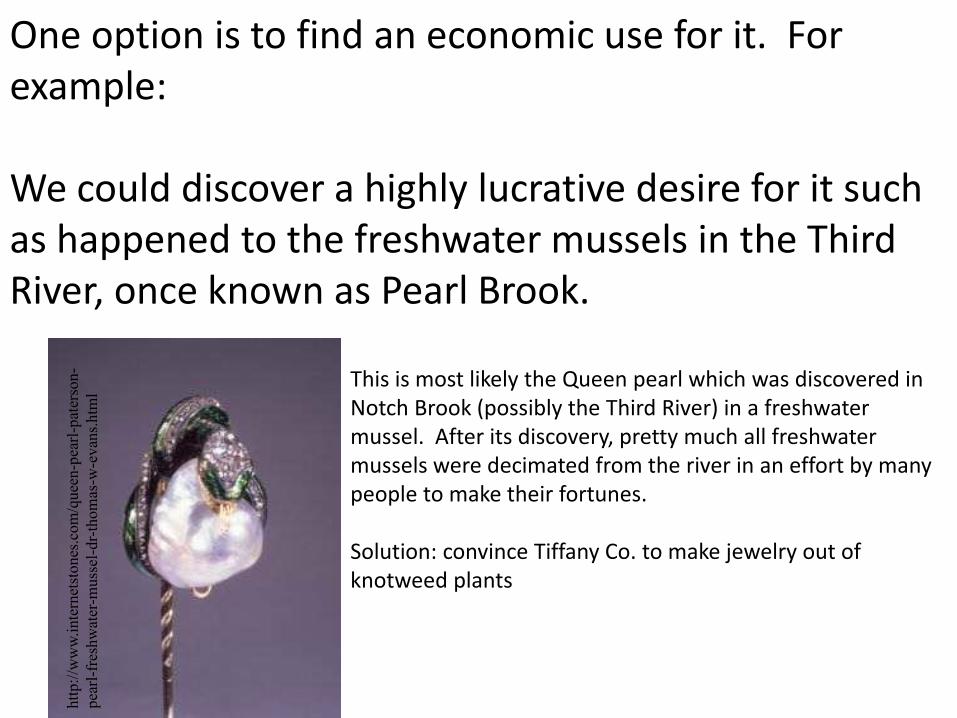
One option is to find an economic use for it. For example: We could discover a highly lucrative desire for it such as happened to the freshwater mussels in the Third River, once known as Pearl Brook.
This is most likely the Queen pearl which was discovered in Notch Brook (possibly the Third River) in a freshwater mussel. After its discovery, pretty much all freshwater mussels were decimated from the river in an effort by many people to make their fortunes. Solution: convince Tiffany Co. to make jewelry out of knotweed plants
htt
p:/
/ww
w.i
nte
rnet
sto
nes
.com
/quee
n-p
earl
-pat
erso
n-
pea
rl-f
resh
wat
er-m
uss
el-d
r-th
om
as-w
-evan
s.htm
l

1. It has medicinal uses: laxative, diuretic, soothes burns and
rashes, anti-oxidant (resveratrol).
2. It can be eaten: like rhubarb.
Option 2: Find an economic use for the plant.
guardian.co.uk ruralintelligence.com

In the meantime, we need to get more accurate data on the distribution of the plant in New Jersey and we need to get better estimates of its water removal and where the water is coming from (soil and/or river). This is where you can come in (if you are interested): Citizen Science: mapping knotweed distribution throughout the state. Research this summer.
Invasive plant data bases:
1. www.nps.gov/plants/alien
2. http://npsnj.org/www/invasive_species_0103.htm
3. http://www.invasivespeciesinfo.gov/unitedstates/nj.shtml