Embed Size (px)
Citation preview

Population Change in The United States:Implications for Human and Socioeconomic
Resources in the 21st Century
by
Steve H. Murdock
Institute for Demographic and
Socioeconomic Research
The University of Texas at San Antonio

Major Demographic Trends Affecting the Future
• Rates, Sources and Distribution of the Population
• Increase in the Minority Population
• Aging of the Population

Total Population and Percent Population Change in Texas and the United States, 1850-2005
Total Population Percent Change
Year* Texas U.S. Texas U.S.
1850 212,592 23,191,876 --- ---1860 604,215 31,443,321 184.2 35.61870 818,579 39,818,449 35.5 26.61880 1,591,749 50,155,783 94.5 26.01890 2,235,527 62,947,714 40.4 25.51900 3,048,710 75,994,575 36.4 20.71910 3,896,542 91,972,266 27.8 21.01920 4,663,228 105,710,620 19.7 14.91930 5,824,715 122,775,046 24.9 16.11940 6,414,824 131,669,275 10.1 7.21950 7,711,194 150,697,361 20.2 14.51960 9,579,677 179,323,175 24.2 19.01970 11,196,730 203,302,031 16.9 13.41980 14,229,191 226,545,805 27.1 11.41990 16,986,510 248,709,873 19.4 9.82000 20,851,820 281,421,906 22.8 13.22005 22,859,968 296,410,404 9.6 5.3
* All values for the decennial dates are for the indicated census year. Values for 2005 are as estimated by the U.S. Bureau of the Census.
Source: Derived from U.S. Bureau of the Census Estimates for datesindicated by the Texas State Data Center, University of Texasat San Antonio
Year* Texas U.S. Texas U.S.
Source: Derived from U.S. Bureau of the Census Estimates for datesindicated by the Texas State Data Center, University of Texas
Percent Change in the U.S. Population, 1790-2000
1790-1800
1800-1810
1810-1820
1820-1830
1830-1840
1840-1850
1850-1860
1860-1870
1870-1880
1880-1890
1890-1900
1900-1910
1910-1920
1920-1930
1930-1940
1940-1950
1950-1960
1960-1970
1970-1980
1980-1990
1990-2000
Decade
0
10
20
30
40Percent Change

Percent of United States Population Change Due to Immigration and Natural Increase, 1820 to 2005
1820-301830-401840-501850-601860-701870-801880-90
1890-19001900-101910-201920-301930-401940-501950-601960-701970-801980-90
1990-20002000-2005
Time Period
0% 20% 40% 60% 80% 100%
Percent
Components of ChangeImmigration Natural Increase

Numerical Population Change by Components of Change in the United States and Selected States,
1990-2000 and 2000-2005
United NewStates Arkansas Louisiana Mexico Oklahoma Texas
1990-2000
Numerical Change 32,630,981 322,776 247,150 303,977 305,078 3,865,485
Natural Increase 17,081,253 93,014 286,697 153,800 150,386 1,922,044
Domestic Migration 0 218,560 -67,157 108,782 123,423 1,166,570
International Migration 15,549,728 11,202 27,610 41,395 31,269 776,871
2000-2005
Numerical Change 14,988,498 105,754 54,652 109,338 97,230 2,008,148
Natural Increase 8,651,861 52,214 129,889 74,397 80,753 1,155,182
Domestic Migration 0 31,593 -95,411 6,967 -20,069 189,805
International Migration 6,336,637 21,947 20,174 27,974 36,546 663,161

Percent of Population Change by Components of Change in the United States and Selected States, 1990-2000 and 2000-2005
United New States Arkansas Louisiana Mexico Oklahoma Texas
1990-2000
Numerical Change 32,630,981 322,776 247,150 303,977 305,078 3,865,485
Percent Natural Increase 52.3 28.8 116.0 50.6 49.3 49.7
Percent Domestic Migration 0.0 67.7 -27.2 35.8 40.5 30.2
Percent International Migration 47.7 3.5 11.2 13.6 10.2 20.1
2000-2005
Numerical Change 14,988,498 105,754 54,652 109,338 97,230 2,008,148
Percent Natural Increase 57.7 49.3 237.7 68.0 83.0 57.5
Percent Domestic Migration 0.0 29.9 -174.6 6.4 -20.6 9.5
Percent International Migration 42.3 20.8 36.9 25.6 37.6 33.0

Percent by Area of Origin
Number of Latin AllTime Period Immigrants Europe Asia Canada America Africa Other 1820-1830 152 70.14 0.02 1.64 6.23 0.01 21.961831-1840 599 82.73 0.01 2.27 3.30 0.01 11.681841-1850 1,713 93.24 0.01 2.44 2.93 0.00 1.381851-1860 2,598 94.40 1.60 2.28 0.60 0.01 1.111861-1870 2,315 89.21 2.80 6.65 0.56 0.01 0.771871-1880 2,812 80.79 4.42 13.64 0.73 0.01 0.421881-1890 5,247 90.26 1.33 7.50 0.65 0.02 0.241891-1900 3,688 96.41 2.03 0.09 0.97 0.01 0.491901-1910 8,795 91.59 3.68 2.07 2.07 0.08 0.541911-1920 5,736 75.35 4.31 12.94 7.00 0.15 0.251921-1930 4,107 59.97 2.73 22.51 14.42 0.15 0.221931-1940 528 65.77 3.14 20.54 9.74 0.33 0.481941-1950 1,035 60.01 3.58 16.59 17.69 0.71 1421951-1960 2,515 52.70 6.09 15.03 24.61 0.56 10.011961-1970 3,322 33.82 12.87 12.44 39.23 0.87 0.771971-1980 4,493 17.81 35.35 3.78 41.19 1.80 0.071981-1990 7,338a 10.38 37.31 2.14 47.13 2.41 0.631991-1999 8,246 14.87 30.80 2.07 47.53 3.81 0.922000-2004 4,630 15.35 33.09 1.83 43.00 5.92 0.81
aaIncludes persons who were granted permanent residence under the legalizationprogram of the Immigration Reform and Control Act of 1986.
Source: Yearbook of Immigration Statistics, Washington, DC: U.S. Department of Homeland Security, Office of Immigration Statistics
Immigration into the United States, by Period and Area of Origin of Immigrants, 1820-2004 (numbers in thousands)

Ten Fastest Growing States (in Numerical Terms) in the United States, 1990-2000
Percent
Numerical Population1990 2000 Change Change
State Population* Population* 1990-2000 1990-2000
California 29,760,021 33,871,648 4,111,627 13.8
Texas 16,986,510 20,851,820 3,865,310 22.8
Florida 12,937,926 15,982,378 3,044,452 23.5
Georgia 6,478,216 8,186,453 1,708,237 26.4
Arizona 3,665,228 5,130,632 1,465,404 40.0
North Carolina 6,628,637 8,049,313 1,420,676 21.4
Washington 4,866,692 5,894,121 1,027,429 21.1
Colorado 3,294,394 4,301,261 1,006,867 30.6
Illinois 11,430,602 12,419,293 988,691 8.6
New York 17,990,455 18,976,457 986,002 5.5
* Population values are decennial census counts for April 1 of the year Indicated
Percent

Numerical Percent2000 2005 Change Change
State Population* Population* 2000-2005 2000-2005
California 33,871,648 36,132,147 2,260,499 6.7
Texas 20,851,820 22,859,968 2,008,148 9.6
Florida 15,982,378 17,789,864 1,807,486 11.3
Georgia 8,186,453 9,072,576 886,123 10.8
Arizona 5,130,632 5,939,292 808,660 15.8
North Carolina 8,049,313 8,683,242 633,929 7.9
Virginia 7,078,515 7,567,465 488,950 6.9
Nevada 1,998,257 2,414,807 416,550 20.8
Washington 5,894,121 6,287,759 393,638 6.7
Colorado 4,301,261 4,665,177 363,916 8.5
* Population values are decennial census counts for April 1 for 2000 andestimates for July 1 for 2005.
Source: Derived from U.S. Bureau of the Census Estimates for dates indicated by the Texas State Data Center, University of Texas at San Antonio
California 33,871,648 36,132,147 2,260,499 6.7
Texas 20,851,820 22,859,968 2,008,148 9.6
* Population values are decennial census counts for April 1 for 2000 andestimates for July 1 for 2005.
Source: Derived from U.S. Bureau of the Census Estimates for dates indicated by the Texas State Data Center, University of Texas at
Ten Fastest Growing States in Numerical Terms in the United States, 2000-2005

PercentNumerical Population
2000 2005 Change ChangeState Population* Population* 2000-2005 2000-2005
Nevada 1,998,257 2,414,807 416,550 20.8
Arizona 5,130,632 5,939,292 808,660 15.8
Florida 15,982,378 17,789,864 1,807,486 11.3
Georgia 8,186,453 9,072,576 886,123 10.8
Utah 2,233,169 2,469,585 236,416 10.6
Idaho 1,293,953 1,429,096 135,143 10.4
Texas 20,851,820 22,859,968 2,008,148 9.6
Colorado 4,301,261 4,665,177 363,916 8.5
North Carolina 8,049,313 8,683,242 633,929 7.9
Delaware 783,600 843,524 59,924 7.6
* Population values are decennial census counts for April 1 for 2000 andestimates for July 1 for 2005.
Source: Derived from U.S. Bureau of the Census Estimates for dates indicated by the Texas State Data Center, University of Texas at San Antonio
* Population values are decennial census counts for April 1 for 2000 andestimates for July 1 for 2005.
Source: Derived from U.S. Bureau of the Census Estimates for dates indicated by the Texas State Data Center, University of Texas at
Ten Fastest Growing States in Percentage Terms in the United States, 2000-2005
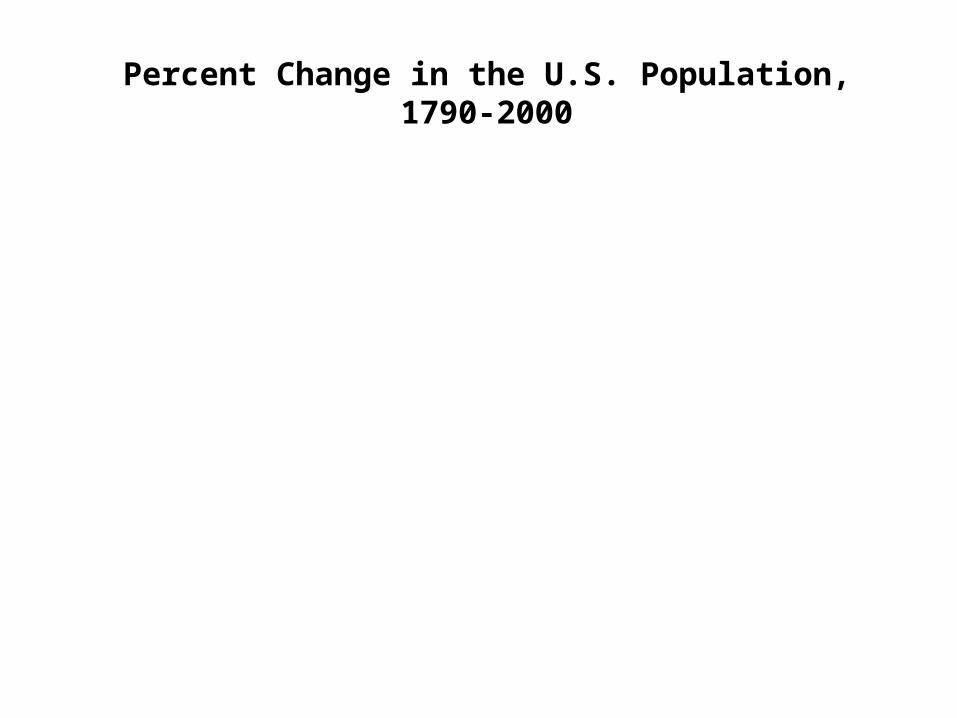
Ten Largest States in United States by Population Size in 2000 Ranked by Population Size in 2000
Numerical Percent1990 2000 Change Change
State Population* Population* 1990-2000 1990-2000
California 29,760,021 33,871,648 4,111,627 13.8
Texas 16,986,510 20,851,820 3,865,310 22.8
New York 17,990,455 18,976,457 986,002 5.5
Florida 12,937,926 15,982,378 3,044,452 23.5
Illinois 11,430,602 12,419,293 988,691 8.6
Pennsylvania 11,881,643 12,281,054 399,411 3.4
Ohio 10,847,115 11,353,140 506,025 4.7
Michigan 9,295,297 9,938,444 643,147 6.9
New Jersey 7,730,188 8,414,350 684,162 8.9
Georgia 6,478,216 8,186,453 1,708,237 26.4
* Population values are decennial census counts for April 1 of the yearindicated

Numerical Percent2000 2005 Change Change
State Population* Population* 2000-2005 2000-2005
California 33,871,648 36,132,147 2,260,499 6.7
Texas 20,851,820 22,859,968 2,008,148 9.6
New York 18,976,457 19,254,630 278,173 1.5
Florida 15,982,378 17,789,864 1,807,486 11.3
Illinois 12,419,293 12,763,371 344,078 2.8
Pennsylvania 12,281,054 12,429,616 148,562 1.2
Ohio 11,353,140 11,464,042 110,902 1.0
Michigan 9,938,444 10,120,860 182,416 1.8
Georgia 8,186,453 9,072,576 886,123 10.8
New Jersey 8,414,350 8,717,925 303,575 3.6
* Population values are decennial census counts for April 1 for 2000 andestimates for July 1 for 2005.
Source: Derived from U.S. Bureau of the Census Estimates for dates indicated by the Texas State Data Center, University of Texas at San Antonio
California 33,871,648 36,132,147 2,260,499 6.7
Texas 20,851,820 22,859,968 2,008,148 9.6
* Population values are decennial census counts for April 1 for 2000 andestimates for July 1 for 2005.
Source: Derived from U.S. Bureau of the Census Estimates for dates indicated by the Texas State Data Center, University of Texas at
Ten Largest States in United States by PopulationSize in 2000 Ranked by Population Size in 2005

Largest Metropolitan Areas in the United States Ranked by Size in 2000
2000
Rank MSA Population
1 New York – Northern New Jersey - Long Island, NY - NJ - CT - PA CMSA 21,199,865
2 Los Angeles - Riverside - Orange County, CA CMSA 16,373,645
3 Chicago - Gary - Kenosha, IL - IN - WI CMSA 9,157,540
4 Washington - Baltimore, DC - MD - VA - WV CMSA 7,608,070
5 San Francisco - Oakland - San Jose, CA CMSA 7,039,362
6 Philadelphia - Wilmington - Atlantic City, PA - NJ - DE - MD CMSA 6,188,463
7 Boston - Worcester - Lawrence, MA - NH - ME - CT CMSA 5,819,100
8 Detroit - Ann Arbor - Flint, MI CMSA 5,456,428
9 Dallas - Ft Worth, TX CMSA 5,221,801
10 Houston - Galveston - Brazoria, TX CMSA 4,669,571

Largest Metropolitan Areas in the United States Ranked by Numerical Change, 1990-2000
Population Population Numerical PercentRank MSA 1990 2000 Change Change
1 Los Angeles-Riverside-Orange County, CA 14,531,529 16,373,645 1,842,116 12.72 New York-Northern New Jersey-Long Island 19,549,649 21,199,865 1,650,216 8.43 Dallas-Fort Worth, TX 4,037,282 5,221,801 1,184,519 29.34 Atlanta, GA 2,959,950 4,112,198 1,152,248 38.95 Phoenix-Mesa, AZ 2,238,480 3,251,876 1,013,396 45.36 Houston-Galveston-Brazoria, TX 3,731,131 4,669,571 938,440 25.27 Chicago-Gary-Kenosha, IL-IN-WI 8,239,820 9,157,540 917,720 11.18 Washington-Baltimore, DC-MD-VA-WV 6,727,050 7,608,070 881,020 13.19 San Francisco-Oakland-San Jose, CA 6,253,311 7,039,362 786,051 12.6
10 Las Vegas, NV-AZ 852,737 1,563,282 710,545 83.311 Miami-Fort Lauderdale, FL 3,192,582 3,876,380 683,798 21.412 Denver-Boulder-Greeley, CO 1,980,140 2,581,506 601,366 30.413 Seattle-Tacoma-Bremerton, WA 2,970,328 3,554,760 584,432 19.714 Portland-Salem, OR-WA 1,793,476 2,265,223 471,747 26.315 Minneapolis-St. Paul, MN-WI 2,538,834 2,968,806 429,972 16.916 Orlando, FL 1,224,852 1,644,561 419,709 34.317 Austin-San Marcos, TX 846,227 1,249,763 403,536 47.718 Boston-Worcester-Lawrence, MA-NH-ME-CT 5,455,403 5,819,100 363,697 6.719 Charlotte-Gastonia-Rock Hill, NC-SC 1,162,093 1,499,293 337,200 29.020 Raleigh-Durham-Chapel Hill, NC 855,545 1,187,941 332,396 38.9
Population Population Numerical PercentRank MSA 1990 2000 Change Change

Largest Metropolitan Areas in the United States Ranked by Percent Change, 1990-2000
Population Population Numerical PercentRank MSA 1990 2000 Change Change
1 Las Vegas, NV-AZ 852,737 1,563,282 710,545 83.32 Naples, FL 152,099 251,377 99,278 65.33 Yuma, AZ 106,895 160,026 53,131 49.74 McAllen-Edinburg-Mission, TX 383,545 569,463 185,918 48.5
5 Austin-San Marcos, TX 846,227 1,249,763 403,536 47.76 Fayetteville-Springdale-Rogers, AR 210,908 311,121 100,213 47.57 Boise City, ID 295,851 432,345 136,494 46.18 Phoenix-Mesa, AZ 2,238,480 3,251,876 1,013,396 45.3
9 Laredo, TX 133,239 193,117 59,878 44.910 Provo-Orem, UT 263,590 368,536 104,946 39.811 Atlanta, GA 2,959,950 4,112,198 1,152,248 38.912 Raleigh-Durham-Chapel Hill, NC 855,545 1,187,941 332,396 38.913 Myrtle Beach, SC 144,053 196,629 52,576 36.5
14 Wilmington, NC 171,269 233,450 62,181 36.315 Fort Collins-Loveland, CO 186,136 251,494 65,358 35.116 Orlando, FL 1,224,852 1,644,561 419,709 34.317 Reno, NV 254,667 339,486 84,819 33.3
18 Ocala, FL 194,833 258,916 64,083 32.919 Auburn-Opelika, AL 87,146 115,092 27,946 32.120 Fort Myers-Cape Coral, FL 335,113 440,888 105,775 31.6
Population Population Numerical PercentRank MSA 1990 2000 Change Change
20 Fort Myers-Cape Coral, FL 335,113 440,888 105,775 31.6

Largest Metropolitan Areas in the United States Ranked by Size in 2004
2004Rank MSA Population
1 New York-Northern New Jersey-Long Island, NY-NJ-PA 18,709,802
2 Los Angeles-Long Beach-Santa Ana, CA 12,925,330
3 Chicago-Naperville-Joliet, IL-IN-WI 9,391,515
4 Philadelphia-Camden-Wilmington, PA-NJ-DE-MD 5,800,614
5 Dallas-Fort Worth-Arlington, TX 5,700,256
6 Miami-Fort Lauderdale-Miami Beach, FL 5,361,723
7 Houston-Sugar Land-Baytown, TX 5,180,443
8 Washington-Arlington-Alexandria, DC-VA-MD-WV 5,139,549
9 Atlanta-Sandy Springs-Marietta, GA 4,708,297
10 Detroit-Warren-Livonia, MI 4,493,165

Largest Metropolitan Areas in the United States Ranked by Numerical Change, 2000-2004
Population Population Numerical PercentRank MSA 2000 2004 Change Change
1 Los Angeles-Long Beach-Santa Ana, CA 12,365,627 12,925,330 559,703 4.5
2 Dallas-Fort Worth-Arlington, TX 5,161,544 5,700,256 538,712 10.4
3 Riverside-San Bernardino-Ontario, CA 3,254,821 3,793,081 538,260 16.5
4 Houston-Sugar Land-Baytown, TX 4,715,407 5,180,443 465,036 9.9
5 Phoenix-Mesa-Scottsdale, AZ 3,251,876 3,715,360 463,484 14.3
6 Atlanta-Sandy Springs-Marietta, GA 4,247,981 4,708,297 460,316 10.8
7 New York-Northern New Jersey-Long Island, NY-NJ-PA 18,323,002 18,709,802 386,800 2.1
8 Miami-Fort Lauderdale-Miami Beach, FL 5,007,564 5,361,723 354,159 7.1
9 Washington-Arlington-Alexandria, DC-VA-MD-WV 4,796,183 5,139,549 343,366 7.2
10 Chicago-Naperville-Joliet, IL-IN-WI 9,098,316 9,391,515 293,199 3.2
11 Las Vegas-Paradise, NV 1,375,765 1,650,671 274,906 20.0
12 Sacramento--Arden-Arcade--Roseville, CA 1,796,857 2,016,702 219,845 12.2
13 Orlando-Kissimmee, FL 1,644,561 1,861,707 217,146 13.2
14 Tampa-St. Petersburg-Clearwater, FL 2,395,997 2,587,967 191,970 8.0
15 Austin-Round Rock, TX 1,249,763 1,412,271 162,508 13.0
16 Denver-Aurora, CO 2,179,240 2,330,146 150,906 6.9
17 Minneapolis-St. Paul-Bloomington, MN-WI 2,968,806 3,116,206 147,400 5.0
18 Charlotte-Gastonia-Concord, NC-SC 1,330,448 1,474,734 144,286 10.8
19 San Antonio, TX 1,711,703 1,854,050 142,347 8.3
20 Portland-Vancouver-Beaverton, OR-WA 1,927,881 2,064,336 136,455 7.1

Largest Metropolitan Areas in the United States Ranked by Percent Change, 2000-2004
Population Population Numerical PercentRank MSA 2000 2004 Change Change
1 St. George, UT 90,354 109,924 19,570 21.7
2 Greeley, CO 180,926 219,257 38,331 21.2
3 Las Vegas-Paradise, NV 1,375,765 1,650,671 274,906 20.0
4 Naples-Marco Island, FL 251,377 296,678 45,301 18.0
5 Cape Coral-Fort Myers, FL 440,888 514,295 73,407 16.6
6 Bend, OR 115,367 134,479 19,112 16.6
7 Riverside-San Bernardino-Ontario, CA 3,254,821 3,793,081 538,260 16.5
8 McAllen-Edinburg-Mission, TX 569,463 658,248 88,785 15.6
9 Gainesville, GA 139,277 160,925 21,648 15.5
10 Stockton, CA 563,598 649,868 86,270 15.3
11 Raleigh-Cary, NC 797,071 914,680 117,609 14.8
12 Phoenix-Mesa-Scottsdale, AZ 3,251,876 3,715,360 463,484 14.3
13 Port St. Lucie-Fort Pierce, FL 319,426 364,772 45,346 14.2
14 Prescott, AZ 167,517 190,628 23,111 13.8
15 Laredo, TX 193,117 219,464 26,347 13.6
16 Orlando-Kissimmee, FL 1,644,561 1,861,707 217,146 13.2
17 Austin-Round Rock, TX 1,249,763 1,412,271 162,508 13.0
18 Boise City-Nampa, ID 464,840 524,884 60,044 12.9
19 Madera, CA 123,109 138,951 15,842 12.9
20 Fayetteville-Springdale-Rogers, AR-MO 347,045 390,881 43,836 12.6

Largest Places in the United StatesRanked by Size in 2004
2004Rank Place Name Population
1 New York, NY 8,104,079
2 Los Angeles, CA 3,845,541
3 Chicago, IL 2,862,244
4 Houston, TX 2,012,626
5 Philadelphia, PA 1,470,151
6 Phoenix, AZ 1,418,041
7 San Diego, CA 1,263,756
8 San Antonio, TX 1,236,249
9 Dallas, TX 1,210,393
10 San Jose, CA 904,522

Largest Places in the United States Rankedby Numerical Change, 2000-2004
Population Population Numerical PercentRank Place 2000 2004 Change Change
1 Los Angeles, CA 3,694,820 3,845,541 150,721 4.1
2 Phoenix, AZ 1,321,045 1,418,041 96,996 7.3
3 New York, NY 8,008,278 8,104,079 95,801 1.2
4 San Antonio, TX 1,144,646 1,236,249 91,603 8.05 Fort Worth, TX 534,694 603,337 68,643 12.8
6 Houston, TX 1,953,631 2,012,626 58,995 3.0
7 Las Vegas, NV 478,434 534,847 56,413 11.8
8 Charlotte, NC 540,828 594,359 53,531 9.99 Raleigh, NC 276,093 326,653 50,560 18.3
10 Henderson, NV 175,381 224,829 49,448 28.2
11 Chandler, AZ 176,581 223,991 47,410 26.8
12 Sacramento, CA 407,018 454,330 47,312 11.613 Gilbert town, AZ 109,697 156,917 47,220 43.0
14 North Las Vegas, NV 115,488 158,748 43,260 37.5
15 Jacksonville, FL 735,617 777,704 42,087 5.7
16 Mesa, AZ 396,375 437,454 41,079 10.4
17 San Diego, CA 1,223,400 1,263,756 40,356 3.318 Bakersfield, CA 247,057 283,936 36,879 14.9
19 Stockton, CA 243,771 279,888 36,117 14.8
20 Albuquerque, NM 448,607 484,246 35,639 7.9

Places 100,000 Population or More in the United States Ranked by Percent Change, 2000-2004
Population Population Numerical PercentRank Place 2000 2004 Change Change
1 Gilbert town, AZ 109,697 156,917 47,220 43.0
2 Miramar, FL 72,739 101,486 28,747 39.5
3 North Las Vegas, NV 115,488 158,748 43,260 37.5
4 Port St. Lucie, FL 88,769 118,396 29,627 33.4
5 Roseville, CA 79,921 103,609 23,688 29.6
6 Henderson, NV 175,381 224,829 49,448 28.2
7 Chandler, AZ 176,581 223,991 47,410 26.8
8 Cape Coral, FL 102,286 127,985 25,699 25.1
9 Rancho Cucamonga, CA 127,743 159,346 31,603 24.7
10 Irvine, CA 143,072 178,317 35,245 24.6
11 Thornton, CO 82,384 102,072 19,688 23.9
12 Fontana, CA 128,929 158,715 29,786 23.1
13 Peoria, AZ 108,364 132,487 24,123 22.3
14 Joliet, IL 106,221 129,519 23,298 21.9
15 Raleigh, NC 276,093 326,653 50,560 18.3
16 Chula Vista, CA 173,556 204,879 31,323 18.0
17 Moreno Valley, CA 142,381 166,290 23,909 16.8
18 Olathe, KS 92,962 108,390 15,428 16.6
19 Aurora, IL 142,990 166,614 23,624 16.5
20 Corona, CA 124,966 145,398 20,432 16.4

Largest Counties in the United States Ranked by Size in 2000
2000
Rank County Population
1 Los Angeles, CA 9,519,338
2 Cook, IL 5,376,741
3 Harris, TX 3,400,578
4 Maricopa, AZ 3,072,149
5 Orange, CA 2,846,289
6 San Diego. CA 2,813,833
7 Kings, NY 2,465,326
8 Miami-Dade, FL 2,253,362
9 Queens, NY 2,229,379
10 Dallas, TX 2,218,899

Largest Counties in the United States Ranked by Numerical Change, 1990-2000
Population Population Numerical PercentRank County 1990 2000 Change Change
1 Maricopa, AZ 2,122,101 3,072,149 950,048 44.82 Los Angeles, CA 8,863,164 9,519,338 656,174 7.43 Clark, NV 741,459 1,375,765 634,306 85.54 Harris, TX 2,818,199 3,400,578 582,379 20.75 Orange, CA 2,410,556 2,846,289 435,733 18.16 Riverside, CA 1,170,413 1,545,387 374,974 32.07 Broward, FL 1,255,488 1,623,018 367,530 29.38 Dallas, TX 1,852,810 2,218,899 366,089 19.89 Miami-Dade, FL 1,937,094 2,253,362 316,268 16.3
10 San Diego, CA 2,498,016 2,813,833 315,817 12.611 San Bernardino, CA 1,418,380 1,709,434 291,054 20.512 Queens, NY 1,951,598 2,229,379 277,781 14.213 Tarrant, TX 1,170,103 1,446,219 276,116 23.614 Cook, IL 5,105,067 5,376,741 271,674 5.315 Palm Beach, FL 863,518 1,131,184 267,666 31.016 Travis, TX 576,407 812,280 235,873 40.917 Gwinnett, GA 352,910 588,448 235,538 66.718 King, WA 1,507,319 1,737,034 229,715 15.219 Collin, TX 264,036 491,675 227,639 86.220 Orange, FL 677,491 896,344 218,853 32.3
Population Population Numerical PercentRank County 1990 2000 Change Change
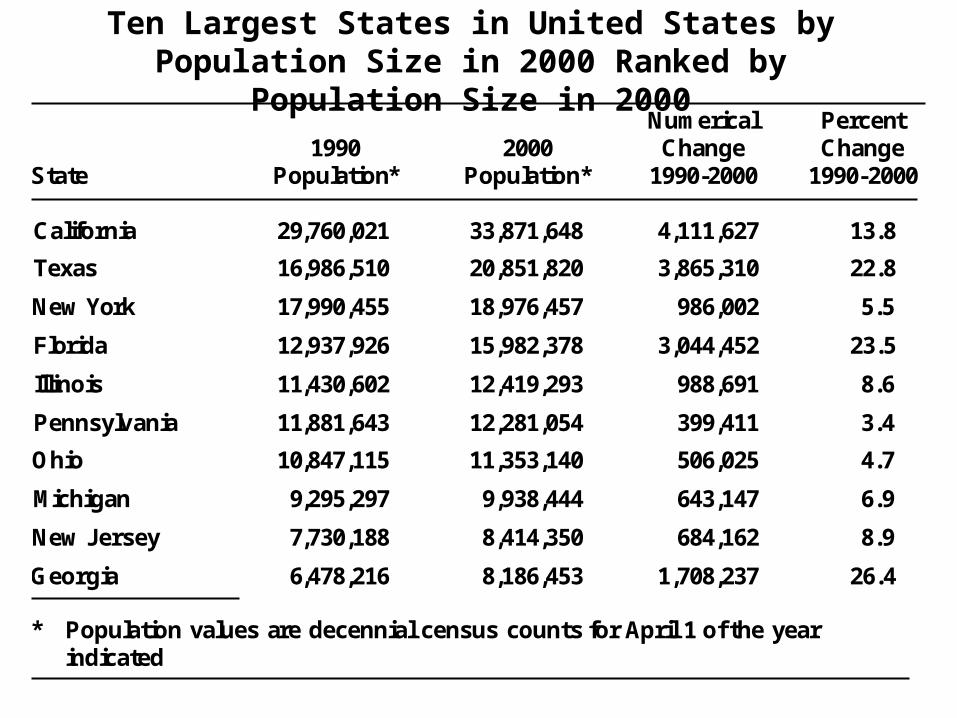
Largest Counties in the United States Ranked by Percent Change, 1990-2000
Population Population Numerical PercentRank County 1990 2000 Change Change
1 Douglas , CO 60,391 175,766 115,375 191.02 Forsyth , GA 44,083 98,407 54,324 123.23 Elbert , CO 9,646 19,872 10,226 106.04 Henry , GA 58,741 119,341 60,600 103.25 Park , CO 7,174 14,523 7,349 102.46 Loudoun , VA 86,129 169,599 83,470 96.97 Paulding , GA 41,611 81,678 40,067 96.38 Summit , UT 15,518 29,736 14,218 91.69 Boise , ID 3,509 6,670 3,161 90.1
10 Eagle , CO 21,928 41,659 19,731 90.011 Collin , TX 264,036 491,675 227,639 86.212 Washington , UT 48,560 90,354 41,794 86.113 Clark , NV 741,459 1,375,765 634,306 85.514 Archuleta , CO 5,345 9,898 4,553 85.215 Summit , CO 12,881 23,548 10,667 82.816 Nye , NV 17,781 32,485 14,704 82.717 Custer , CO 1,926 3,503 1,577 81.918 San Miguel , CO 3,653 6,594 2,941 80.519 Williamson , TX 139,551 249,967 110,416 79.120 Gilmer , GA 13,368 23,456 10,088 75.5
Population Population Numerical PercentRank County 1990 2000 Change Change

Largest Counties in the United States Ranked by Size in 2005
2005Rank Place Name Population
1 Los Angeles, CA 9,935,475
2 Cook, IL 5,303,683
3 Harris, TX 3,693,050
4 Maricopa, AZ 3,635,528
5 Orange, CA 2,988,072
6 San Diego, CA 2,933,462
7 Kings, NY 2,486,235
8 Miami-Dade, FL 2,376,014
9 Dallas, TX 2,305,454
10 Queens, NY 2,241,600

Largest Counties in the United States Ranked by Numerical Change, 2000-2005
Population Population Numerical PercentRank County 2000 2005 Change Change
1 Maricopa, AZ 3,072,149 3,635,528 563,379 18.3
2 Los Angeles, CA 9,519,338 9,935,475 416,137 4.4
3 Riverside, CA 1,545,387 1,946,419 401,032 26.0
4 Clark, NV 1,375,765 1,710,551 334,786 24.3
5 Harris, TX 3,400,578 3,693,050 292,472 8.6
6 San Bernardino, CA 1,709,434 1,963,535 254,101 14.9
7 Tarrant, TX 1,446,219 1,620,479 174,260 12.0
8 Collin, TX 491,675 659,457 167,782 34.1
9 Broward, FL 1,623,018 1,777,638 154,620 9.5
10 Orange, CA 2,846,289 2,988,072 141,783 5.0
11 Will, IL 502,266 642,813 140,547 28.0
12 Sacramento, CA 1,223,499 1,363,482 139,983 11.4
13 Gwinnett, GA 588,448 726,273 137,825 23.4
14 Palm Beach, FL 1,131,184 1,268,548 137,364 12.1
15 Hillsborough, FL 998,948 1,132,152 133,204 13.3
16 Orange. FL 896,344 1,023,023 126,679 14.1
17 Bexar, TX 1,392,931 1,518,370 125,439 9.0
18 Miami-Dade, FL 2,253,362 2,376,014 122,652 5.4
19 Denton, TX 432,976 554,642 121,666 28.1
20 Wake, NC 627,846 748,815 120,969 19.3

Largest Counties in the United States Ranked by Percent Change, 2000-2005
Population Population Numerical PercentRank County 2000 2005 Change Change
1 Flagler, FL 49,832 76,410 26,578 53.32 Loudoun, VA 169,599 255,518 85,919 50.73 Rockwall, TX 43,080 62,944 19,864 46.14 Kendall, IL 54,544 79,514 24,970 45.85 Forsyth, GA 98,407 140,393 41,986 42.76 Douglas, CO 175,766 249,416 73,650 41.97 Henry, GA 119,341 167,848 48,507 40.68 Newton, GA 62,001 86,713 24,712 39.99 Lincoln, SD 24,131 33,381 9,250 38.3
10 Lyon, NV 34,501 47,515 13,014 37.711 Paulding, GA 81,678 112,411 30,733 37.612 Delaware, OH 109,989 150,268 40,279 36.613 Osceola, FL 172,493 231,578 59,085 34.314 Collin, TX 491,675 659,457 167,782 34.115 Scott, MN 89,498 119,825 30,327 33.916 Williamson, TX 249,967 333,457 83,490 33.417 Spencer, KY 11,766 15,651 3,885 33.018 Union, NC 123,677 162,929 39,252 31.719 Hamilton, IN 182,740 240,685 57,945 31.720 Lake, FL 210,528 277,035 66,507 31.621 Washington, UT 90,354 118,885 28,531 31.6

Population of the United States 1990 and 2000, Population Change 1990 to 2000 and Proportion of
Population in 2000 by Region
Change1990 2000 1990-2000 Proportion of
Population Population PopulationRegion (thousands) (thousands) Number Percent in 2000
Northeast 50,809 53,594 2,785 5.5 19.0
Midwest 59,669 64,393 4,724 7.9 22.9
South 85,446 100,237 14,791 17.3 35.6
West 52,786 63,198 10,412 19.7 22.5
U.S. Total 248,710 281,422 32,712 13.2 100.0

Population of the United States by Regions, 1900-2000
Population (in thousands)a
United States/Regions 1900 1950 1960 1970 1980 1990 2000
United States 76,212 151,326 179,323 203,302 226,546 248,710 281,422
Regionsb Percent by Region
Northeast 27.6 26.1 24.9 24.1 21.7 20.4 19.0 Midwest 34.5 29.4 28.8 27.9 25.9 24.0 22.9 South 32.2 31.2 30.7 30.9 33.3 34.4 35.6 West 5.7 13.3 15.6 17.1 19.1 21.2 22.5
Northeast 27.6 26.1 24.9 24.1 21.7 20.4 19.0 Midwest 34.5 29.4 28.8 27.9 25.9 24.0 22.9

Major Changes in Population Composition(Characteristics)
• Race/Ethnicity
• Age

Proportion of U.S. Population by Race/Ethnicityin Each Region in 2000
Region Total White Black Other Hispanic Anglo
Northeast 19.0 19.6 17.3 18.4 14.9 20.1 Midwest 22.9 25.5 19.0 12.5 8.8 26.8 South 35.6 34.4 54.5 20.7 32.8 33.8 West 22.5 20.5 9.2 48.4 43.5 19.3 U.S. Total 100.0 100.0 100.0 100.0 100.0 100.0

Population 1980 and 1990, Percent Change in Population 1980 to 1990and Proportion of Population 1980 and 1990 by Ethnicity for
Texas and the United States
Proportion ofNumber Percent Population
Ethnic ChangeCategory 1980 1990 1980-90 1980 1990
Texas
Anglo 9,350,297 10,291,680 10.1 65.7 60.6Black 1,692,542 1,976,360 16.8 11.9 11.6Hispanic 2,985,824 4,339,905 45.4 21.0 25.6Other 200,528 378,565 88.8 1.4 2.2
Total 14,229,191 16,986,510 19.4 100.0 100.0
United States
Anglo 180,602,838 188,128,296 4.2 79.7 75.7Black 26,091,857 29,216,293 12.0 11.5 11.7Hispanic 14,603,683 22,354,059 53.1 6.5 9.0Other 5,247,427 9,011,225 71.7 2.3 3.6
Total 226,545,805 248,709,873 9.8 100.0 100.0
Texas
Anglo 9,350,297 10,291,680 10.1 65.7 60.6Black 1,692,542 1,976,360 16.8 11.9 11.6
United States
Anglo 180,602,838 188,128,296 4.2 79.7 75.7Black 26,091,857 29,216,293 12.0 11.5 11.7

United States Population by Race/Ethnicity in 1990 and Net Change Due to Each
Racial/Ethnic Group 1980-1990
Anglo75.7%
Black11.7% Hispanic
9.0%
Other3.6%
Anglo33.9%
Black14.1%
Hispanic35.0%
Other17.0%
Percent of Population Net Change

Population 1990 and 2000, Percent Change in Population 1990 to 2000 and Proportion of Population 1990 and 2000
by Ethnicity for Texas and the United StatesProportion of
Number Percent PopulationEthnic ChangeCategory 1990 2000 1990-2000 1990 2000
Texas
Anglo 10,291,680 11,074,716 7.6 60.6 53.1Black 1,976,360 2,421,653 22.5 11.6 11.6Hispanic 4,339,905 6,669,666 53.7 25.6 32.0Other 378,565 685,785 81.2 2.2 3.3
Total 16,986,510 20,851,820 22.8 100.0 100.0
United States
Anglo 188,128,296 197,165,673 4.8 75.7 70.1Black 29,216,293 35,195,894 20.5 11.7 12.5Hispanic 22,354,059 35,305,818 57.9 9.0 12.5Other 9,011,225 13,754,521 52.6 3.6 4.9
Total 248,709,873 281,421,906 13.2 100.0 100.0
Number Percent PopulationEthnic Change
Texas
United States
Anglo 188,128,296 197,165,673 4.8 75.7 70.1Black 29,216,293 35,195,894 20.5 11.7 12.5

United States Population by Race/Ethnicity in 2000 and Net Change Due to Each Racial/Ethnic Group 1990-2000
Anglo70.1%
Black12.5%
Hispanic12.5%
Other4.9%
Anglo27.6%
Black18.3%
Hispanic39.7%
Other14.4%
Percent of Population Net Change

Proportion of Population by Ethnicity for Texas and the United States, 2000
0%
20%
40%
60%
80%
100%
Anglo Black Hispanic Other
Ethnic Group
Texas United States
Proportion of Population

Anglo Population For Ten Largest States in the United States in 1990 and 2000
1990 2000 Numerical PercentAnglo Anglo Change Change
State Population Population 1990-2000 1990-2000 California 17,029,126 16,393,491 -635,635 -3.73
Texas 10,291,680 11,074,716 783,036 7.61
New York 12,460,189 11,921,371 -538,818 -4.32
Florida 9,475,326 10,568,868 1,093,542 11.54
Illinois 8,550,208 8,514,486 -35,722 -0.42Pennsylvania 10,422,058 10,373,049 -49,009 -0.47
Ohio 9,444,622 9,604,550 159,928 1.69
Michigan 7,649,951 7,906,629 256,678 3.36
New Jersey 5,718,966 5,625,346 -93,620 -1.64Georgia 4,543,425 5,170,762 627,337 13.81

Major Changes in Population Composition(Characteristics)
• Age

Median Age in the United States and Texas, 1900-2000
22.924.1
25.326.5
2930.1 29.5
28.130
32.9
35.3
18.720.2
2223.7
26.827.9
27 26.428
30.832.3
1900 1910 1920 1930 1940 1950 1960 1970 1980 1990 20000
10
20
30
40Median Age
United States Texas

Percent Change in Population by Age Group in the United States and Texas, 1990-2000
13.7
1.55.3
49.4
14.812
21.7
16.3 15.3
60.3
2420.7
<18 18-24 25-44 45-54 55-64 65+
Age Groups
0
10
20
30
40
50
60
70
Percent Change
United States Texas

Percent of United States Population By Age Group and Ethnicity, 2000
58
.4
59
.9
62
.8
63
.1
61
.1
61
.9 65
.2 69 7
1.9
74
.2
76
.6
78
.3
78
.5 83
.6
41
.6
40
.1
37
.2
36
.9
38
.9
38
.1
34
.8
31
28
.1
25
.8
23
.4
21
.7
21
.5
16
.4
< 5 y
ears
5 to
9 y
ears
10 to
14
year
s
15 to
19
year
s
20 to
24
year
s
25 to
29
year
s
30 to
34
year
s
35 to
39
year
s
40 to
44
year
s
45 to
49
year
s
50 to
54
year
s
55 to
59
year
s
60 to
64
year
s
65 +
yea
rs0
20
40
60
80
100Percent
Anglo Non-anglo

Population Pyramids for Anglo and Hispanic Ethnic Groups in the United States, 2000
0
2,00
0,00
0
4,00
0,00
0
6,00
0,00
0
8,00
0,00
0
10,0
00,0
00 0
2,00
0,00
0
4,00
0,00
0
6,00
0,00
0
8,00
0,00
0
10,0
00,0
00
100 + years95 to 99 years90 to 94 years85 to 89 years80 to 84 years75 to 79 years70 to 74 years65 to 69 years60 to 64 years55 to 59 years50 to 54 years45 to 49 years40 to 44 years35 to 39 years30 to 34 years25 to 29 years20 to 24 years15 to 19 years10 to 14 years
5 to 9 years< 5 years
0
1,00
0,00
0
2,00
0,00
0
3,00
0,00
0
4,00
0,00
0 0
1,00
0,00
0
2,00
0,00
0
3,00
0,00
0
4,00
0,00
0
Male Female Male Female
Anglo Hispanic

POPULATION CHARACTERISTICS AND SOCIOECONOMIC CONDITIONS

Median Household Income in the United States by Age of Householder, 1999
$25,171
$42,174
$50,873
$56,917
$44,597
$27,304
$19,161
15-24 25-34 35-44 45-54 55-64 65-74 75+
Age of Householder
$0
$10,000
$20,000
$30,000
$40,000
$50,000
$60,000
Dollars
Source: U.S. Census Bureau, Money Income in the United States: 1999, Current Population Report P60-209

Median Household Income in the United States by Race/Ethnicity, 1989 and 1999 with Percent
Change 1989 to 1999
MedianHousehold Income
PercentRace/Ethnicity 1989 1999 Changeof Householder (in 1999 dollars) 1989-99
Total $ 39,009 $ 41,994 7.7
Anglo 41,106 45,367 10.4
Black 25,643 29,423 14.7
Hispanic* 31,351 33,676 7.4
Asian 48,030 51,908 8.1
*Hispanics can be of any race.

Average (Mean) SAT Scores for College Bound Seniors in the United States in 2001
by Selected Characteristics
SAT Score
Mean MeanCharacteristic Verbal Math
All Students 506 514(N = 1,276,320)
Race/Ethnicity:American Indian 481 479African American or Black 433 426Hispanic: Mexican American 451 458 Puerto Rican 457 451 Other Hispanic 460 465White 529 531Asian American or Pacific Islander 501 566
Household Income: < $10,000 421 443 $10,000 - 20,000 442 456 $20,000 - 30,000 468 474 $30,000 - 40,000 487 489 $40,000 - 50,000 501 503 $50,000 - 60,000 509 512 $60,000 - 70,000 516 519 $70,000 - 80,000 522 527 $80,000 - 100,000 534 540
> $100,000 557 569
SAT Score
Mean Mean
Characteristic Verbal Math
All Students 506 514(N = 1,276,320)
Race/Ethnicity:American Indian 481 479
Household Income: < $10,000 421 443
> $100,000 557 569

PROJECTIONS

Non-Hispanic Year White Black Hispanic Asian Other Total 2000 195,728,896 35,817,568 35,621,721 10,684,437 4,272,009 282,124,631
2010 201,111,857 40,453,589 47,755,585 14,240,652 5,373,898 308,935,581
2020 205,936,229 45,365,095 59,755,555 17,988,162 6,759,505 335,804,546
2030 209,175,904 50,442,244 73,055,166 22,580,043 8,331,078 363,584,435
2040 210,331,485 55,876,119 87,584,907 27,992,412 10,160,735 391,945,658
2050 210,283,144 61,361,070 102,559,846 33,429,552 12,219,975 419,853,587
* Population values are decennial census counts for April 1 for 2000 and estimates for July 1
for 2004. Source: Derived from U.S. Bureau of the Census Projections (2004) by the Texas State Data Center, University of Texas at San Antonio
Projections of the Population of the United States from 2000 to 2050 by Race/Ethnicity for the Middle Projection Scenario
(in thousands)

Non-Hispanic Year White Black Hispanic Asian Other Total 2000-2010 2.8 12.9 34.1 33.3 25.8 9.5
2010-2020 2.4 12.1 25.1 26.3 25.8 8.7
2020-2030 1.6 11.2 22.3 25.5 23.2 8.3
2030-2040 0.6 10.8 19.9 24.0 22.0 7.8
2040-2050 0.0 9.8 17.1 19.4 20.3 7.1
2000-2050 7.4 71.3 187.9 212.9 186.0 48.8
* Population values are decennial census counts for April 1 for 2000 and estimates for July 1 for 2004.
Source: Derived from U.S. Bureau of the Census Projections (2004) by the Texas State Data Center, University of Texas at San Antonio
Projected Percent Change for Selected Time Periods for the Population for the United States by Racial/Ethnic
Status for the Middle Projection Scenario

Non-Hispanic Year White Black Hispanic Asian Other 2000 69.4 12.7 12.6 3.8 1.5
2010 65.1 13.1 15.5 4.6 1.7
2020 61.3 13.5 17.8 5.4 2.0
2030 57.5 13.9 20.1 6.2 2.3
2040 53.7 14.3 22.3 7.1 2.6
2050 50.1 14.6 24.4 8.0 2.9
* Population values are decennial census counts for April 1 for 2000 and estimates for July 1
for 2004. Source: Derived from U.S. Bureau of the Census Projections (2004) by the Texas State Data
Center, University of Texas at San Antonio
Projections of the Percent of the Population of the United States by Race/Ethnicity from 2000 to 2050
for the Middle Projection Scenario

Projections of the Percent of the United States Population by Race/Ethnicity, 2000-2050*
*Middle Projection Scenario
69.465.1
57.5
50.1
12.7 13.1 13.9 14.612.615.5
20.124.4
5.3 6.3 8.510.9
2000 2010 2030 2050
Year
0
10
20
30
40
50
60
70
80
Percent
Anglo Black Hispanic Other

Percent of Net Change in the Population of the United States from 2000 to 2050 Due
to Each Race/Ethnicity Group for the Middle Projection Scenario
Race Number Percent
2000-2050
Non-Hispanic White 14,554,248 10.6Black 25,543,502 18.5Hispanic 66,938,125 48.6Asian 22,745,115 16.5Other 7,947,966 5.8Total 137,728,956 100.0
Source: Derived from U.S. Bureau of the CensusProjections (2004) by the Texas State DataCenter, University of Texas at San Antonio.
Race Number Percent

Percent of Net Population Change Due to Each Race/Ethnicity Group for the United States, 2000-2050
Anglo10.6%
Black18.5%
Hispanic48.6%
Other22.3%

Projections of the Percent of the Population of the United States by Age in 2000, 2010, 2030 and 2050 for
the Middle Projection Scenario
AgeGroup 2000 2010 2030 2050
0-4 6.8 6.9 6.7 6.7
5-19 21.7 20.0 19.5 19.3
20-44 36.9 33.8 31.6 31.2
45-64 22.1 26.2 22.6 22.2
65-84 10.9 11.0 17.0 15.7
85+ 1.5 2.0 2.6 5.0
Source: Derived from U.S. Bureau of the Census Projections (2004) by the Texas State Data Center, University ofTexas at San Antonio

Percent Change in Projected Population for the United States by Age Group, 2000-2050
46.132.2 25.8
49.1
113.8
388.9
0-04 5-19 20-44 45-64 65-84 85+
Age Groups
0
100
200
300
400
500
Percent Change

Total, Elementary and Secondary, and College Enrollment

Projections of Total, Elementary and Secondary, and College Enrollment in the United States by Race/Ethnicity,
2000-2050 Under the Middle Scenario
Year Anglo Black Hispanic Other Total
Total Enrollment
1990 44,998,396 8,635,613 6,603,047 2,716,061 62,953,1172000 46,544,986 9,992,343 8,822,217 3,981,682 69,341,2282010 44,162,291 10,818,531 10,799,425 5,349,193 71,129,4402020 42,473,321 11,782,417 12,873,766 6,707,261 73,836,7652030 42,204,796 12,953,683 15,160,021 8,094,644 78,413,1442040 40,584,994 14,098,061 17,324,873 9,476,191 81,484,1192050 39,622,468 15,429,077 19,546,156 10,800,750 85,398,451
Elementary and Secondary
1990 33,968,895 7,245,924 5,764,963 2,101,835 49,081,6172000 36,149,349 8,507,323 7,797,921 3,139,087 55,593,6802010 33,489,275 9,126,868 9,496,823 4,206,358 56,319,3242020 32,548,866 10,015,950 11,331,222 5,256,750 59,152,7882030 32,490,226 11,013,267 13,331,177 6,335,024 63,169,6942040 30,924,441 11,975,831 15,194,885 7,400,387 65,495,5442050 30,375,170 13,135,241 17,123,635 8,410,595 69,044,641
College
1990 11,029,501 1,389,689 838,084 614,226 13,871,5002000 10,395,637 1,485,020 1,024,296 842,595 13,747,5482010 10,673,016 1,691,663 1,302,602 1,142,835 14,810,1162020 9,924,455 1,766,467 1,542,544 1,450,511 14,683,9772030 9,714,570 1,940,416 1,828,844 1,759,620 15,243,4502040 9,660,553 2,122,230 2,129,988 2,075,804 15,988,5752050 9,247,298 2,293,836 2,422,521 2,390,155 16,353,810
Year Anglo Black Hispanic Other Total

Percent Change for Selected Time Periods for Projected Total, Elementary and Secondary, and College Enrollment in the United States by Race/Ethnicity Under the Middle Scenario
Time Period Anglo Black Hispanic Other Total
Total Enrollment
1990-2000 3.4 15.7 33.6 46.6 10.12000-2010 -5.1 8.3 22.4 34.3 2.62010-2020 -3.8 8.9 19.2 25.4 3.82020-2030 -0.6 9.9 17.8 20.7 6.22030-2040 -3.8 8.8 14.3 17.1 3.92040-2050 -2.4 9.4 12.8 14.0 4.81990-2050 -11.9 78.7 196.0 297.7 35.7
Elementary and Secondary
1990-2000 6.4 17.4 35.3 49.3 13.32000-2010 -7.4 7.3 21.8 34.0 1.32010-2020 -2.8 9.7 19.3 25.0 5.02020-2030 -0.2 10.0 17.6 20.5 6.82030-2040 -4.8 8.7 14.0 16.8 3.72040-2050 -1.8 9.7 12.7 13.7 5.41990-2050 -10.6 81.3 197.0 300.2 40.7
College
1990-2000 -5.7 6.9 22.2 37.2 -0.92000-2010 2.7 13.9 27.2 35.6 7.72010-2020 -7.0 4.4 18.4 26.9 -0.92020-2030 -2.1 9.8 18.6 21.3 3.82030-2040 -0.6 9.4 16.5 18.0 4.92040-2050 -4.3 8.1 13.7 15.1 2.31990-2050 -16.2 65.1 189.1 289.1 17.9
Time Period Anglo Black Hispanic Other Total

Projected Percent of Total, Elementary and Secondary, and College Enrollment in the United States by Race/Ethnicity in 1990 and Projected for 2000-2050 Under the Middle Scenario
Year Anglo Black Hispanic Other Total
Total Enrollment
1990 71.5 13.7 10.5 4.3 100.02000 67.1 14.4 12.7 5.8 100.02010 62.1 15.2 15.2 7.5 100.02020 57.5 16.0 17.4 9.1 100.02030 53.8 16.5 19.4 10.3 100.02040 49.8 17.3 21.3 11.6 100.02050 46.4 18.1 22.9 12.6 100.0
Elementary and Secondary
1990 69.2 14.8 11.7 4.3 100.02000 65.0 15.3 14.0 5.7 100.02010 59.5 16.2 16.9 7.4 100.02020 55.0 16.9 19.2 8.9 100.02030 51.5 17.4 21.1 10.0 100.02040 47.2 18.3 23.2 11.3 100.02050 44.0 19.0 24.8 12.2 100.0
College
1990 79.5 10.0 6.1 4.4 100.02000 75.6 10.8 7.5 6.1 100.02010 72.1 11.4 8.8 7.7 100.02020 67.6 12.0 10.5 9.9 100.02030 63.7 12.7 12.0 11.6 100.02040 60.4 13.3 13.3 13.0 100.02050 56.6 14.0 14.8 14.6 100.0
Year Anglo Black Hispanic Other Total

Percent of Net Change in the Number of Persons Enrolled in Schools in the United States from 1990-2050 Due to Each Race/Ethnicity Group Under the
Middle Scenario Race Number Percent
Total Enrollment
Anglo -5,375,928 -24.0 Black 6,793,464 30.3 Hispanic 12,943,109 57.7 Other 8,084,689 36.0 Total 22,445,334 100.0
Elementary and Secondary
Anglo -3,593,725 -18.0 Black 5,889,317 29.5 Hispanic 11,358,672 56.9 Other 6,308,760 31.6 Total 19,963,024 100.0
College
Anglo -1,782,203 -71.8 Black 904,147 36.4 Hispanic 1,584,437 63.8 Other 1,775,929 71.6 Total 2,482,310 100.0
Race Number Percent
Total Enrollment
Anglo -5,375,928 -24.0 Black 6,793,464 30.3 Hispanic 12,943,109 57.7 Other 8,084,689 36.0 Total 22,445,334 100.0
Elementary and Secondary
Anglo -3,593,725 -18.0 Black 5,889,317 29.5 Hispanic 11,358,672 56.9 Other 6,308,760 31.6 Total 19,963,024 100.0
College
Anglo -1,782,203 -71.8 Black 904,147 36.4 Hispanic 1,584,437 63.8 Other 1,775,929 71.6 Total 2,482,310 100.0

EDUCATION IN TEXAS

Year Anglo Black Hispanic Other Total
2000 11,074,716 2,421,653 6,669,666 685,785 20,851,820
Assuming Rates of Zero Net Migration
2010 11,331,893 2,627,284 8,060,578 783,204 22,802,9592020 11,381,151 2,771,391 9,336,524 841,641 24,330,7072030 11,171,425 2,823,276 10,576,281 878,111 25,449,0932040 10,733,074 2,796,626 11,662,262 893,139 26,085,101
Assuming Rates of Net Migration Equal to One-Half of 1990-2000
2010 11,533,980 2,754,737 9,080,466 961,460 24,330,6432020 11,796,479 3,052,412 11,882,993 1,273,908 28,005,7922030 11,789,292 3,268,611 15,140,088 1,632,588 31,830,5792040 11,525,083 3,403,176 18,804,297 2,028,603 35,761,159
Assuming Rates of Net Migration Equal to 1990-2000
2010 11,740,016 2,888,449 10,252,219 1,177,909 26,058,5932020 12,227,555 3,361,702 15,226,371 1,921,057 32,736,6852030 12,442,104 3,783,657 21,871,382 3,020,447 41,117,5902040 12,376,303 4,140,670 30,604,621 4,585,895 51,707,489
Assuming Rates of Net Migration Equal to 2000-2002
2010 11,587,971 2,826,849 9,877,268 1,117,442 25,409,5302020 11,908,234 3,217,037 14,090,715 1,726,191 30,942,1772030 11,960,333 3,539,340 19,449,030 2,569,996 37,518,6992040 11,749,690 3,786,341 26,153,290 3,698,715 45,388,036
Year Anglo Black Hispanic Other Total
Population in Texas by Race/Ethnicity in 2000 and Projections of the Population in Texas by Race/Ethnicity from 2010 to 2040

Year Anglo Black Hispanic Other Total
Assuming Rates of Zero Net Migration
2000-2010 2.3 8.5 20.9 14.2 9.42010-2020 0.4 5.5 15.8 7.5 6.72020-2030 -1.8 1.9 13.3 4.3 4.62030-2040 -3.9 -0.9 10.3 1.7 2.52000-2040 -3.1 15.5 74.9 30.2 25.1
Assuming Rates of Net Migration Equal to One-Half of 1990-2000
2000-2010 4.1 13.8 36.1 40.2 16.72010-2020 2.3 10.8 30.9 32.5 15.12020-2030 -0.1 7.1 27.4 28.2 13.72030-2040 -2.2 4.1 24.2 24.3 12.32000-2040 4.1 40.5 181.9 195.8 71.5
Assuming Rates of Net Migration Equal to 1990-2000
2000-2010 6.0 19.3 53.7 71.8 25.02010-2020 4.2 16.4 48.5 63.1 25.62020-2030 1.8 12.6 43.6 57.2 25.62030-2040 -0.5 9.4 39.9 51.8 25.82000-2040 11.8 71.0 358.9 568.7 148.0
Assuming Rates of Net Migration Equal to 2000-2002
2000-2010 4.6 16.7 48.1 62.9 21.92010-2020 2.8 13.8 42.7 54.5 21.82020-2030 0.4 10.0 38.0 48.9 21.32030-2040 -1.8 7.0 34.5 43.9 21.02000-2040 6.1 56.4 292.1 439.3 117.7
Percent Change for Selected Time Periods for Projected Population in Texas by Racial/Ethnic Status Under Alternative
Assumptions of Migration Scenarios

Year Anglo Black Hispanic Other
2000 53.1 11.6 32.0 3.3
Assuming Rates of Zero Net Migration
2010 49.8 11.5 35.3 3.42020 46.7 11.4 38.4 3.52030 43.8 11.1 41.6 3.52040 41.2 10.7 44.7 3.4
Assuming Rates of Net Migration Equal to One-Half of 1990-2000
2010 47.4 11.3 37.3 4.02020 42.2 10.9 42.4 4.52030 37.0 10.3 47.6 5.12040 32.2 9.5 52.6 5.7
Assuming Rates of Net Migration Equal to 1990-2000
2010 45.1 11.1 39.3 4.52020 37.3 10.3 46.5 5.92030 30.3 9.2 53.2 7.32040 23.9 8.0 59.2 8.9
Assuming Rates of Net Migration Equal to 2000-2002 2010 45.6 11.1 38.9 4.42020 38.5 10.4 45.5 5.62030 32.0 9.4 51.8 6.82040 26.0 8.3 57.6 8.1
Year Anglo Black Hispanic Other
2000 53.1 11.6 32.0 3.3
Assuming Rates of Zero Net Migration
Assuming Rates of Net Migration Equal to One-Half of 1990-2000
Assuming Rates of Net Migration Equal to 1990-2000
Percent of Population in Texas by Race/Ethnicity in 2000 and Projections of the Percent of the Population
in Texas by Race/Ethnicity from 2010 to 2040

Projected Proportion of Population by Race/Ethnicity in Texas, 2000-2040*
*Using U.S. Census count for 2000 and Texas State Data Center 1.0 population projection scenario for 2010-2040.
53.1
45.1
37.3
30.3
23.9
11.6 11.1 10.39.2
8.0
32.0
39.3
46.5
53.2
59.2
3.34.5
5.97.3
8.9
2000 2010 2020 2030 20400.0
10.0
20.0
30.0
40.0
50.0
60.0
70.0Percent
Anglo Black Hispanic Other

Percent of the Projections of the Population by Race/Ethnicity and Age Groups in Texas from 2000-
2040 Under Alternative Migration Scenarios
AgeGroup Anglo Black Hispanic Other Total
All Scenarios
2000
<18 23.0 31.7 35.8 26.1 28.218-24 8.8 11.2 13.2 11.2 10.625-44 30.1 32.1 31.8 37.7 31.145-64 24.4 17.7 14.0 20.1 20.265+ 13.7 7.3 5.2 4.9 9.9
Assuming Rates of Zero Net Migration
2020
<18 20.1 24.8 32.0 21.2 25.218-24 8.2 10.2 11.1 9.1 9.625-44 24.7 29.3 26.9 24.0 26.145-64 27.4 25.0 21.5 29.9 24.965+ 19.6 10.7 8.5 15.8 14.2
2040
<18 17.4 19.9 27.5 16.8 22.218-24 7.6 8.8 10.0 6.5 8.725-44 24.1 27.6 27.1 23.7 25.945-64 24.9 26.5 20.6 22.1 23.065+ 26.0 17.2 14.8 30.9 20.2
2000
<18 23.0 31.7 35.8 26.1 28.218-24 8.8 11.2 13.2 11.2 10.6
Assuming Rates of Zero Net Migration
2020
<18 20.1 24.8 32.0 21.2 25.218-24 8.2 10.2 11.1 9.1 9.6
2040
<18 17.4 19.9 27.5 16.8 22.218-24 7.6 8.8 10.0 6.5 8.7

Projected Percent of Net Change Attributable to Each Race/Ethnicity Group for 2000-2040*
*Using U.S. Census count for 2000 and Texas State Data Center 1.0 population projection scenario for 2040.
Anglo4.2%
Black5.6%
Hispanic77.6%
Other12.6%

Percent Change from 2000 to 2040 in Selected Age Groups in the Texas Population Under the 1.0
Scenario
88.3
112.0
295.5
<18 years 18 to 24 years 65+ years0.0
50.0
100.0
150.0
200.0
250.0
300.0
350.0Percent Change

PercentRacial/ High PercentEthnic School CollegeGroup Graduates Graduates
1990
Anglo 81.5 25.2Black 66.2 12.0Hispanic 44.6 7.3Total 72.1 20.3
2000
Anglo 87.2 30.0Black 75.8 15.3Hispanic 49.3 8.9Total 75.7 23.2
Percent Change
Anglo 7.0 19.0Black 14.5 27.5Hispanic 10.5 21.9Total 5.0 14.3
PercentRacial/ High PercentEthnic School CollegeGroup Graduates Graduates
1990
Anglo 81.5 25.2Black 66.2 12.0Hispanic 44.6 7.3Total 72.1 20.3
2000
Anglo 87.2 30.0Black 75.8 15.3Hispanic 49.3 8.9Total 75.7 23.2
Percent Change
Anglo 7.0 19.0Black 14.5 27.5Hispanic 10.5 21.9Total 5.0 14.3
Educational Attainment Characteristics of the Population in Texas by Race/Ethnicity, 1990-2000

Public Community College and University Enrollment Rates (Per 100 Persons Ages 18 to 35)
in Texas by Race/Ethnicity, 1990 and 2000
Year Anglo Black Hispanic Other Total
Community College
1990 6.3 4.1 4.4 5.6 5.52000 6.5 5.2 4.8 6.8 5.7
Public University
1990 7.4 4.0 3.5 10.0 6.02000 7.5 4.7 3.3 10.3 5.7

Enrollment in Public Elementary and SecondarySchools in Texas for all Scenarios, 2000-2040
4
4
4
5
6
7
44
55
5
4 4 4
4 4
2000 2010 2020 2030 2040
Years
2
3
4
5
6
7
8Millions
0.0 Scenario 0.5 Scenario 1.0 Scenario Census Count

Enrollment in Public Community Colleges andPublic Universities in Texas, 2000-2040*
* Projections are shown for the 1.0 scenario
371
445
495
581
677
421
510
589
710
849
2000 2010 2020 2030 2040
Years
0
200
400
600
800
1,000Thousands
Public Community Colleges Public Universities

Projected Percent of Public Elementary and Secondary Enrollment by Race/Ethnicity in 2000 and Projections for 2040*
* Projections are shown for the 1.0 scenario
43.2
19.9
14.4
8.3
39.5
66.3
2.95.5
2000 2040
Projection Year
0.0
10.0
20.0
30.0
40.0
50.0
60.0
70.0
Percent
Anglo Black Hispanic Other

Projected Percent of Public Community College Enrollment by Race/Ethnicity in 2000 and Projections for 2040*
* Projections are shown for the 1.0 scenario
54.7
25.7
11.18.1
29.5
56.0
4.7
10.2
2000 2040
Projection Year
0.0
10.0
20.0
30.0
40.0
50.0
60.0
70.0
Percent
Anglo Black Hispanic Other

Projected Percent of Public University Enrollment by Race/Ethnicity in 2000 and Projections for 2040*
* Projections are shown for the 1.0 scenario
61.5
32.3
10.38.1
21.3
44.5
6.9
15.1
2000 2040
Projection Year
0.0
10.0
20.0
30.0
40.0
50.0
60.0
70.0
Percent
Anglo Black Hispanic Other

Future Demands for Specific Programs
Source: The New Texas Challenge: Population Change and the Future of Texas
186.8%
119.9%
48.5%
183%
188.1%
64.7%
101.9%
69.9%
Bilingual/ESL
Economically Disadvantaged
Gifted and Talented
Immigrants
Limited English Proficiency (LEP)
Special Education
Title 1
Career and Technology Education
0% 50% 100% 150% 200%
2000-2040 Percent Change
76.2% Elementary and Secondary Enrollment Growth

Percent Change in Public Community College Enrollment, Public University Enrollment, Students with Financial Need Unmet by Household Resources, and State Financial
Assistance Expenditures for Public Higher Education in Texas, 2000-2040*
*Projections are shown for the 1.0 scenario
101.6
82.5
105.4
206.7
Public Community College Enrollment
Public University Enrollment
Students with Financial Need
Unmet
State Financial Assistance
Expenditures
0.0
50.0
100.0
150.0
200.0
250.0
Percent Change

Number of Labor Force Members Reaching 65 Years of Age During Each Decade and
Approximate Monthly Retirement Costs by Decade, 1980-2050
ApproximateNumber of Labor Monthly Costs
Decade Force Members Reaching for Social SecurityPaymentsb 65 During the Decadea Retirement 1980-1990 12,091,450 $7,285,824,0001990-2000 11,746,333 7,077,870,0002000-2010 14,233,736 8,576,680,0002010-2020 21,098,885 12,713,340,0002020-2030 24,559,599 14,798,630,0002030-2040 21,292,369 12,829,930,0002040-2050 22,222,430 13,390,350,000
aAssuming no mortality between age 55 and 65.
bAssuming all persons retire at age 65+ and 1990 levels ofbenefits for retired workers of $602.56 per month as noted inAnnual Statistical Supplement to the Social Security Bulletin,1992, Washington DC: Social Security Administration, 1993.

Average Annual Household Income in Texas and the United Statesby Educational Attainment of Householder in 2000*
*From Census 2000 Public Use Microdata Sample (1% File)
$30,412
$42,271
$52,552
$80,950
$102,410
$32,473
$44,068
$54,467
$80,327
$104,294
Less ThanHigh School
High SchoolGraduate
Some College or Associate Degree
Bachelor'sDegree
Graduate/ProfessionalDegree
$0
$20,000
$40,000
$60,000
$80,000
$100,000
$120,000
Average Income
Texas United States

Percent of Persons 25 Years of Age or Older by Level of Educational Attainment and Race/Ethnicity in 2000 and Projected to 2040* Assuming 1990-2000 Trends in Educational Attainment Rates
*Projections are shown for the 1.0 scenario
12.7
25.7
31.6
30.0
24.0
29.9
30.6
15.5
50.7
22.0
18.4
8.9
21.0
16.1
20.6
42.3
2.2
16.6
33.4
47.8
4.3
25.6
40.5
29.6
32.1
25.8
24.1
18.0
13.4
7.6
11.0
68.0
< High School
High School
Some Coll/Assoc
Bachelor's +
< High School
High School
Some Coll/Assoc.
Bachelor's +
< High School
High School
Some Coll/Assoc
Bachelor's +
< High School
High School
Some Coll/Assoc
Bachelor's +
0.0 10.0 20.0 30.0 40.0 50.0 60.0 70.0 80.0
Percent
2000 2040
Black
Hispanic
Other
Anglo

Aggregate Income and Consumer Expenditures for Population 25 Years of Age or Older in Texas in 2000 and Projected Under
Alternative Educational Attainment Assumptions for 2040*
*Projections are shown for the 1.0 scenario
$251
$621
$765
$938
$210
$528
$629
$752
2000Base Values
2040 Assuming2000 Attainment
Differentials
2040 Assuming1990-2000 Trends
in Differentials
2040 AssumingAnglo Trends
Apply to all Groups
$0
$200
$400
$600
$800
$1,000
$1,200
Billions
Aggregate Income Consumer Expenditures

State Tax Revenues in Texas for 2000 and Projected for 2040 (in 2000 Dollars) Assuming 2000 Rates, 1990-2000 Rates of Closure
Between Anglo-Black and Anglo-Hispanic Household Incomes, and Anglo Income Levels for All Race/Ethnicity Groups*
*Projections are shown for the 1.0 scenario
$29,510,942,468
$68,026,247,958
$74,812,045,501
$89,667,827,701
2000 AggregateHousehold Income
2040 Assuming2000 Income Differentials
2040 Assuming1990-2000 Closure
in Differentials
2040 AssumingAnglo Incomesfor all Groups
$0
$10,000,000,000
$20,000,000,000
$30,000,000,000
$40,000,000,000
$50,000,000,000
$60,000,000,000
$70,000,000,000
$80,000,000,000
$90,000,000,000
$100,000,000,000
Tax Revenues

The mark of a truly educated man is to be moved deeply by statistics.
George Bernard Shaw

Steve MurdockTexas State Data Center
Phone 210 – 458 - 6530Fax 210 – 458 - 6540Website txsdc.utsa.edu