Embed Size (px)
Citation preview

Clark County Demographic Profile 2015
Sources: State of Washington Office of Financial Management, Washington Employment Security Department, and US Census Bureau (2015)
POPULATION
POPULATION BY CITY
Population
Projections 1990 2000 2010 2014 2020 2030 2040
Clark County Total 238,053 345,238 425,363 442,800 509,876 567,982 585,137
Battle Ground 3,758 9,296 17,571 18,680
Camas 6,442 12,534 19,355 20,880
La Center 483 1,654 2,800 3,050
Ridgefield 1,332 2,147 4,763 6,035
Vancouver 46,380 143,560 161,791 167,400
Washougal 4,764 8,595 14,095 14,910
Yacolt 600 1,055 1,566 1,620
POPULATION BY CITY 2014
POPULATION BY AGE Age Group 1990 2000 2010 2014
Under – 20 74,472 108,037 123,429 120,996
20 – 34 53,569 68,789 79,268 82,835
35 – 54 66,752 107,377 121,580 121,245
55 – 74 32,766 45,362 80,458 94,548
75 & Older 10,194 15,673 20,628 23,175
18,680
20,880 3,050
6,035
167,400
14,910 1,620 Battle Ground
Camas
La Center
Ridgefield
Vancouver
Washougal
Yacolt

Clark County Demographic Profile 2015
Sources: State of Washington Office of Financial Management, Washington Employment Security Department, and US Census Bureau (2015)
POPULATION DISTRIBUTION
Distribution by Age Group 1990 2000 2010 2013 Under – 20 31% 31% 29% 28%
20 – 34 23% 20% 19% 19%
35 – 54 28% 31% 29% 28%
55 – 74 14% 13% 18% 20%
75- Older 4% 5% 5% 5%
Median Age 33.47 34.20 36.70 37.30
POPULATION DIVERSITY Total Population by Race
2000 Census 2010 Census
Total % of Total Total % of Total
Total Population 345,238 100% 425,363 100%
White 306,648 88.8% 363,397 85.4%
Black/African American 5,813 1.7% 8,426 1.9%
American Indian/Alaska Native 2,910 0.8% 3,624 0.9%
Asian and Pacific Islander 12,369 3.6% 20,212 4.8%
Two or More Races 10,641 3.1% 17,219 4.0%
Some Other Race alone 6,857 2.0% 12,485 3.0%
Hispanic Origin (of any race) 18,248 4.7% 32,166 7.6%
CLARK COUNTY HOUSEHOLDS
HOUSEHOLD SUMMARY Households 1990 2000 2010 2013
Total Households 92,849 127,290 155,533 170,752
Median Household Income $31,800 $51,232 $54,924 $58,225
Household Income Distribution
Under - $35,000 48,942 42,171 43,860 48,832
$35,001 - $50,000 18,659 23,938 23,952 22,965
$50,001 - $75,000 14,530 30,448 35,773 32,148
$75,001 - Above 6,440 30,733 59,103 59,910
Clark County Demographic Profile 2015
Sources: State of Washington Office of Financial Management, Washington Employment Security Department, and US Census Bureau (2015)
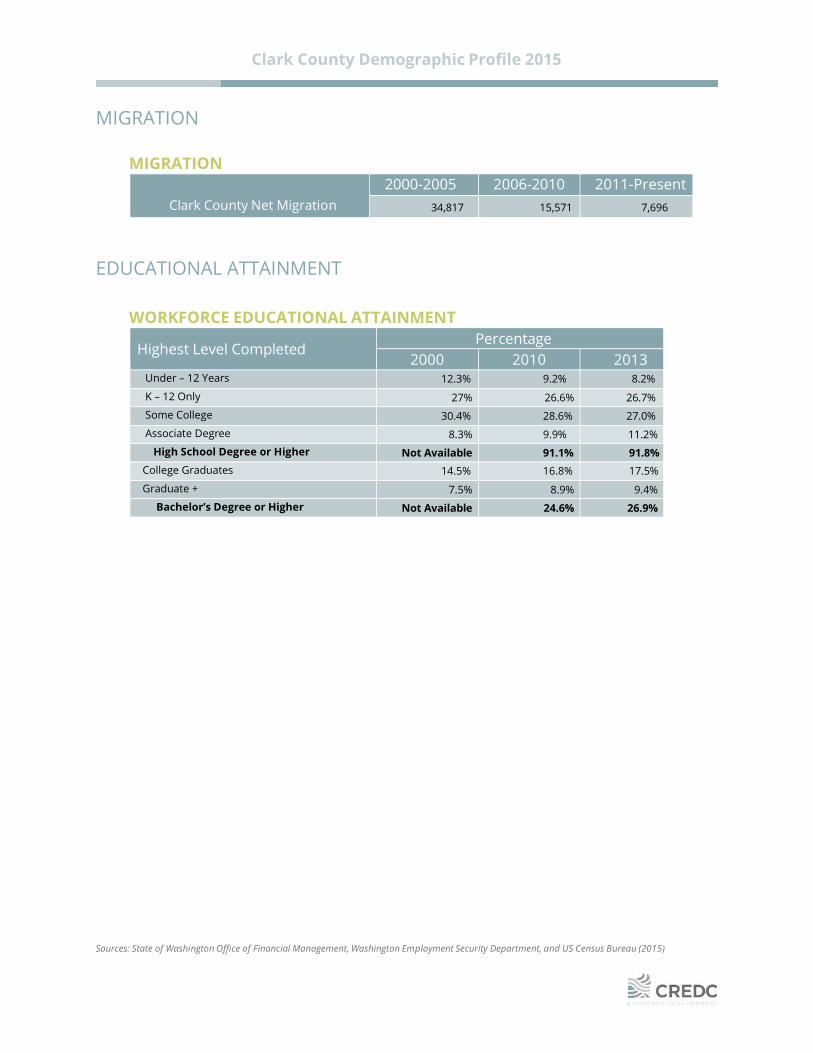
MIGRATION
MIGRATION
Clark County Net Migration 2000-2005 2006-2010 2011-Present
34,817 15,571 7,696
EDUCATIONAL ATTAINMENT
WORKFORCE EDUCATIONAL ATTAINMENT
Highest Level Completed Percentage
2000 2010 2013 Under – 12 Years 12.3% 9.2% 8.2%
K – 12 Only 27% 26.6% 26.7% Some College 30.4% 28.6% 27.0% Associate Degree 8.3% 9.9% 11.2%
High School Degree or Higher Not Available 91.1% 91.8% College Graduates 14.5% 16.8% 17.5%
Graduate + 7.5% 8.9% 9.4% Bachelor’s Degree or Higher Not Available 24.6% 26.9%
8%
26%
26.9%
26%

Clark County Labor Force Characteristics 2015
Sources: US Census Bureau “On The Map”, Washington Employment Security Department, and US Census Bureau (2015)
LABOR FORCE CHARACTERISTICS
CIVILIAN LABOR FORCE
2010
2011
2012
2013
2014 2015
Civilian Labor Force 217,620 214,130 208,930 209,130 209,280 212,940
Unemployment Rate 4.0% 12.4% 9.9% 11.6% 8.9% 7.8%
EMPLOYMENT BY INDUSTRY Non-Agricultural Employment Reported
by Place of Work Total Number Employed % of Total Employed
Persons 2005 2010 2015 2005 2011 2015
Construction, Mining, and Logging 12,500 8,100 9,900 9.70% 6.30% 5.92%
Manufacturing 13,800 11,500 13,300 10.71% 8.99% 7.96%
Wholesale Trade 5,200 5,400 6,400 4.03% 4.22% 3.83%
Retail Trade 15,000 15,700 17,000 11.64% 12.28% 10.18%
Transportation, Warehousing, and Utilities 3,700 4,100 3,800 2.87% 3.20% 2.23%
Information 2,900 2,600 3,100 2.25% 2.03% 1.86%
Finance and Insurance 4,000 3,600 4,900 3.10% 2.80% 2.93%
Real Estate, Rental & Leasing 2,700 2,200 2,300 2.09% 1.72% 1.38%
Professional, Scientific, and Technical Services 6,400 8,300 8,100 4.97% 6.49% 4.85%
Administrative Support and Waste Management 6,800 6,400 7,100 5.28% 5.00% 4.25%
Education Services 1,100 1,300 25,200 0.85% 1.02% 15.09%
Health Care and Social Assistance 15,000 18,100 23,400 11.64% 14.16% 14.01%
Arts, Entertainment and Recreation 2,300 2,000 2,000 1.78% 1.56% 1.20%
Accommodation and Food Services 9,800 9,800 11,000 7.60% 7.67% 6.59%
Other Services 4,300 4,800 5,500 3.34% 3.75% 3.29%
Government 22,500 23,900 24,000 17.49% 18.70% 14.37%
Total 128,900 127,800 167,000 99.31% 99.89% 99.94%
Clark County Labor Force Characteristics 2015
Sources: US Census Bureau “On The Map”, Washington Employment Security Department, and US Census Bureau (2015)
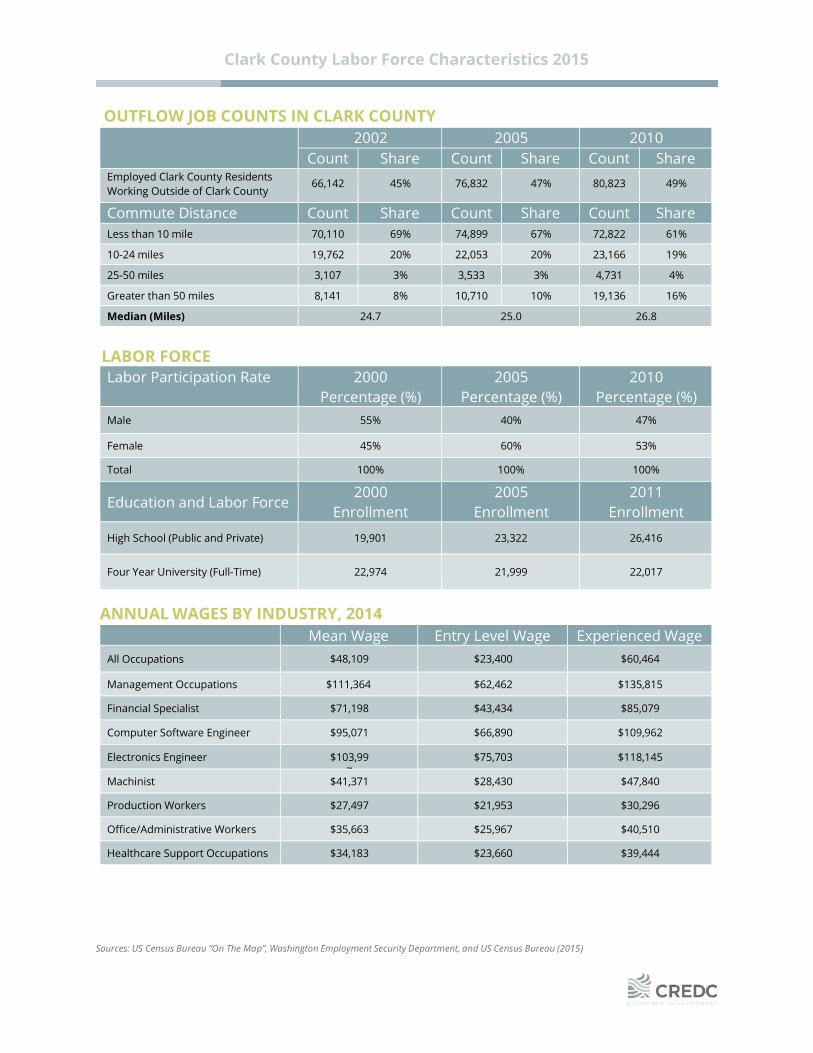
OUTFLOW JOB COUNTS IN CLARK COUNTY
2002 2005 2010 Count Share Count Share Count Share
Employed Clark County Residents Working Outside of Clark County
66,142
45%
76,832
47%
80,823
49%
Commute Distance Count Share Count Share Count Share Less than 10 mile 70,110 69% 74,899 67% 72,822 61%
10-24 miles 19,762 20% 22,053 20% 23,166 19%
25-50 miles 3,107 3% 3,533 3% 4,731 4%
Greater than 50 miles 8,141 8% 10,710 10% 19,136 16%
Median (Miles) 24.7 25.0 26.8 LABOR FORCE
Labor Participation Rate 2000 Percentage (%)
2005 Percentage (%)
2010 Percentage (%)
Male 55% 40% 47%
Female 45% 60% 53%
Total 100% 100% 100%
Education and Labor Force 2000
Enrollment 2005
Enrollment 2011
Enrollment
High School (Public and Private)
19,901
23,322
26,416
Four Year University (Full-Time)
22,974
21,999
22,017
ANNUAL WAGES BY INDUSTRY, 2014 Mean Wage Entry Level Wage Experienced Wage
All Occupations $48,109 $23,400 $60,464
Management Occupations $111,364 $62,462 $135,815
Financial Specialist $71,198 $43,434 $85,079
Computer Software Engineer $95,071 $66,890 $109,962
Electronics Engineer $103,997
$75,703 $118,145
Machinist $41,371 $28,430 $47,840
Production Workers $27,497 $21,953 $30,296
Office/Administrative Workers $35,663 $25,967 $40,510
Healthcare Support Occupations $34,183 $23,660 $39,444
Clark County Infrastructure Profile 2015
Compiled by CREDC, 2015
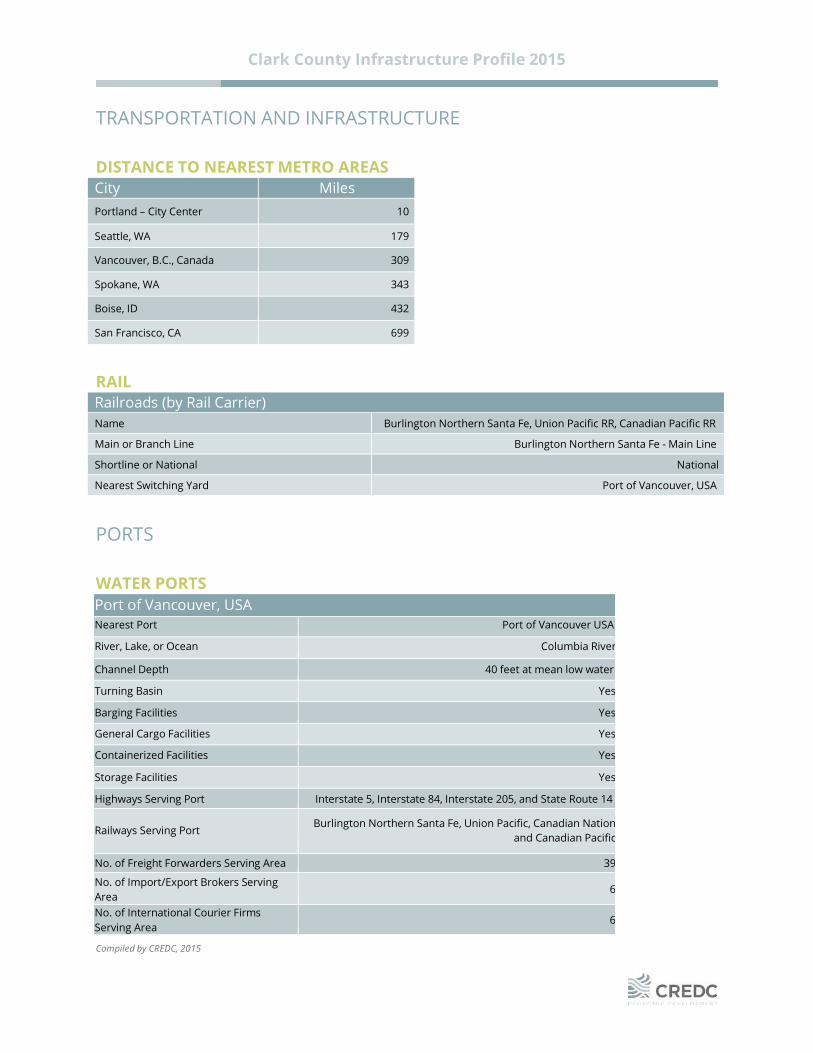
TRANSPORTATION AND INFRASTRUCTURE
DISTANCE TO NEAREST METRO AREAS
City Miles Portland – City Center 10
Seattle, WA 179
Vancouver, B.C., Canada 309
Spokane, WA 343
Boise, ID 432
San Francisco, CA 699
RAIL
Railroads (by Rail Carrier) Name Burlington Northern Santa Fe, Union Pacific RR, Canadian Pacific RR
Main or Branch Line Burlington Northern Santa Fe - Main Line
Shortline or National National
Nearest Switching Yard Port of Vancouver, USA
PORTS
WATER PORTS Port of Vancouver, USA Nearest Port Port of Vancouver USA
River, Lake, or Ocean Columbia River
Channel Depth 40 feet at mean low water
Turning Basin Yes
Barging Facilities Yes
General Cargo Facilities Yes
Containerized Facilities Yes
Storage Facilities Yes
Highways Serving Port Interstate 5, Interstate 84, Interstate 205, and State Route 14
Railways Serving Port
Burlington Northern Santa Fe, Union Pacific, Canadian Nation and Canadian Pacific
No. of Freight Forwarders Serving Area 39
No. of Import/Export Brokers Serving Area
6
No. of International Courier Firms Serving Area
6

Clark County Infrastructure Profile 2015
Compiled by CREDC, 2015
AIRPORT Portland International Airport Name Portland International Airport (PDX)
Hub Status Alaska Airlines (Horizon Airlines) and SeaPort Airlines
Distance from Community (in miles) 10
Hours of Operation 24 hours
Number of Runways 3
Runway Lengths 6,000 ft, 9,825 ft, and 11,000 ft Scheduled Passenger Carriers Serving PDX Air Canada, Alaska Airlines, American Airlines, Condor, Delta, Frontier, Hawaiian
Airlines, Icelandair, jetBlue, SeaPort Airlines, Southwest, Spirit Airlines, United, US Airways, Virgin America, and Volaris
Scheduled Air Cargo Carriers Serving PDX
Air Canada, Alaska Airlines, AmericanAirlines, Ameriflight, DHL, Empire Airlines, FedEx, Frontier, Hawaiian Airlines, United, UPS, US Airways, Western Air Express
Total No. of Non-stop Destinations 58
Carriers to Largest Non-Stop Metro Areas Served
Domestic:
New York City (JFK, EWR) Delta, jetBlue, United
Los Angeles Basin (LAX, BUR, SBA) Alaska Airlines, Delta, Southwest
Chicago (ORD, MDW) Alaska Airlines, American Airlines, Spirit, United, Southwest
Dallas-Fort Worth Alaska Airlines, American Airlines, Spirit, Southwest
Houston (HOU, IAH) Southwest, United
Philadelphia US Airways
Washington, DC (DCA, IAD) Alaska Airlines, United
Atlanta Alaska Airlines, Delta
Boston Alaska Airlines, jetBlue
Phoenix Alaska Airlines, Southwest, US Airways
San Francisco Bay Area (SFO, OAK, SJC) Alaska Airlines, United, Virgin America
Seattle Alaska Airlines, Delta, United
International:
Tokyo, Japan Delta
Amsterdam, Netherlands Delta
Calgary, Alberta, Canada Air Canada
Vancouver, B.C., Canada Air Canada, Alaska Airlines
Frankfurt, Germany (Seasonal) Condor
Reykjavik, Iceland (Seasonal) Icelandair
No. of days closed due to inclement weather in last 3 years
zero

Clark County Infrastructure Profile 2015
Compiled by CREDC, 2015
Foreign Trade Zones in Area
Designation N/A
Number None
Site/Location N/A
NO. of Acres N/A
Operator N/A Custom Port of Entry in the Area Name Portland Service Port
Site/Location 8337 NE Alderwood Road #200 Portland, OR 97220 Warehouses No. of Bonded Warehouses in the Area 7 No. of Public Warehouses in the Area 31
POSTAL SERVICES Overnight Express Service Availability Federal Express
Latest Pick-Up Time 4:00 PM
First Overnight Delivery Time 8:00 AM
Standard Overnight Delivery Time 3:00 PM
Saturday/Sunday Delivery Available
Zone Classification Standard
UPS
Latest Pick-Up Time 6:00 PM
First Overnight Delivery Time 8:00 AM
Standard Overnight Delivery Time 3:00 PM
Saturday/Sunday Delivery Available
Zone Classification Standard
United States Postal Service
Nearest General Mail Vancouver, WA
Latest Pick-Up Time 8:30 PM
Earliest Delivery Next Day
Saturday/Sunday Delivery Available
Nearest Bulk Mail Facility Vancouver, WA

State and Local Tax Incentives 2015
For information on all Washington State tax incentives please visit: http://www.dor.wa.gov/Content/FindTaxesAndRates/TaxIncentives/IncentivePrograms.aspx
INCENTIVES BY INDUSTRY
AEROSPACE INCENTIVE DESCRIPTION B&O Tax Credit Who: Businesses who develop, design, and engineer commercial airplanes or component
parts of commercial airplanes. What: Provides a B&O tax credit for expenditures for aerospace preproduction development. The B&O tax credit is equal to 1.5% of qualified preproduction development expenditures.
Reduced B&O Tax Rate Who: Manufacturers and processors for hire of commercial airplanes or component parts of commercial airplanes, non-manufacturers engaged in the business of aerospace product development, certificated FAR repair stations making retail sales, and aerospace tooling manufacturers. What: Qualifying businesses receive a reduced B&O tax rate (the new rate is .002904 – a reduction of 40%)
B&O Tax Credit Who: Businesses that manufacture commercial airplanes or component parts of commercial airplanes. What: B&O tax credit equal to the property taxes paid on new buildings, the land upon which the new buildings are located; and property taxes attributable to the renovation or expansion of buildings used exclusively in the manufacturing of commercial airplanes or component parts of commercial airplanes.
Reduced B&O Rate Who: Persons certified by the FAA to perform repair and maintenance on commercial airplanes under FAR Part 145. What: Lower B&O tax rate for persons performing repair and maintenance on commercial airplanes.
Sales & Use Tax Exemption Who: Persons who develop, design, and engineer, but do not manufacture, commercial airplanes or component parts of commercial airplanes. What: Sales and use tax exemption for purchases of computer hardware, software and peripherals, and charges for labor and services related to the installation of such equipment.
HIGH-TECHNOLOGY INCENTIVE DESCRIPTION B&O Credit Who: Advanced computing, advanced materials, biotechnology, electronic device
technology, environmental technology. What: An annual credit of up to $2 million for high technology businesses that perform R&D in specific high technology categories.
Sales & Use Tax Deferral Who: Advanced computing, advanced materials, biotechnology, electronic device technology, environmental technology. What: Defers or waives sales and use tax associated with construction, expansion, or renovation of qualified buildings and acquisition of qualified machinery and equipment in research and development and pilot scale manufacturing in the above fields.
Sales & Use Tax Deferral/Waiver
Who: Biotechnology & Medical Device Manufacturers What: Defers or waives sales and use tax on machinery and equipment, construction costs for new or expanded facility.

State and Local Tax Incentives 2015
For information on all Washington State tax incentives please visit: http://www.dor.wa.gov/Content/FindTaxesAndRates/TaxIncentives/IncentivePrograms.aspx
INTERNATIONAL BUSINESSES
INCENTIVE DESCRIPTION B&O Tax Credit Who: Firms engaged in international services
What: May receive a tax credit of $3,000 per year for every new employment position, for up to five years. Firms must be located in one of the eight International Service Districts in Vancouver, WA, to qualify.
WAREHOUSES
INCENTIVE DESCRIPTION Sales Tax Remittance Who: Wholesalers, retail distribution centers, third-party warehousers, and cold storage
warehousers What: A remittance of 100% of state sales tax (6.5%) paid on construction of qualifying structures and a 50% remittance for state sales tax paid on qualifying equipment.
SOFTWARE
INCENTIVE DESCRIPTION Property Tax Exemption Who: Software companies
What: Software designed for a specific need for a single person or group of persons is exempt from property tax. Included in the definition is modification of canned computer software.
MANUFACTURING INCENTIVES
GENERAL MANUFACTURING
INCENTIVE DESCRIPTION Sales & Use Tax Exemption Who: Manufacturers, processors for hire, manufacturers who perform R&D. What:
Exempts sales and use tax on machinery and equipment used directly in manufacturing or research operations. Includes installation, maintenance, and repairs in most cases.
FOOD PROCESSING/MANUFACTURING INCENTIVE DESCRIPTION B&O Tax Exemption Who: Manufacturers and processors of fresh fruit & vegetables, dairy products, and
seafood products. What: B&O tax exemption for goods destined for outside Washington. Defers or waives sales and use tax on machinery and equipment, construction costs for new or expanded facility. Expands the warehouse remittance program to include cold storage warehouses or fresh fruit & vegetables, dairy products, and seafood products.

State and Local Tax Incentives 2015
For information on all Washington State tax incentives please visit: http://www.dor.wa.gov/Content/FindTaxesAndRates/TaxIncentives/IncentivePrograms.aspx
SEMICONDUCTOR MATERIALS MANUFACTURING
INCENTIVE DESCRIPTION
Reduced B&O Tax Rate
Who: Manufacturers or processors for hire of semiconductor materials What: Lower B&O tax rate for manufacturers or processors of semiconductor materials, including silicon crystals, silicon ingots, raw polished semiconductor wafers, and compound semiconductor wafers.
Sales & Use Tax Exemption
Who: Manufacturers or processors for hire of semiconductor materials What: Sales and Use tax exemption on the purchase of gasses and chemicals used in the manufacturing of semiconductor materials, including silicon crystals, silicon ingots, raw polished semiconductor wafers, compound semiconductor wafers, silicon solar wafers, silicon solar cells, thin film solar devices, and compound semiconductor solar wafers.
TIMBER MANUFACTURING
INCENTIVE DESCRIPTION Timber & Wood Products Industry Incentive
Who: Extractors & Manufacturers of timber and wood products What: Provides a two-step reduction in the tax rate for extracting and wholesaling of timber and manufacturing of timber or wood products. Partially offsetting these rate reductions is a new surcharge tax rate that takes effect July 1, 2007.
ALUMINUM SMELTING/MANUFACTURING
INCENTIVE DESCRIPTION
Reduced B&O Tax Rate Who: Aluminum smelters and processors for hire who manufacture aluminum. What: A reduced B&O tax rate is offered to manufacturers of aluminum.
B&O Tax Credit
Who: Aluminum smelters and processors for hire who manufacture aluminum. What: A B&O tax credit is offered for the state portion of sales tax paid on materials, equipment, labor, and services used in aluminum smelter.
B&O Tax Credit Who: Aluminum smelters who manufacture aluminum. What: A B&O tax credit is offered for property tax paid by the aluminum smelter.
Use Tax Exemption
Who: Aluminum smelters who manufacture aluminum. What: A use tax exemption is offered for the use of natural or manufactured gas by an aluminum smelter.
ENERGY INCENTIVES
BIOFUEL AND RENEWABLE ENERGY/GREEN INCENTIVES INCENTIVE DESCRIPTION Reduced B&O Tax rate Who: Manufacturers, processors for hire, or wholesalers of solar energy systems using
photovoltaic modules or silicon components of these systems. What: The B&O rate is lowered from 0.484 percent to 0.2904 percent
Sales & Use Tax Exemption Who: Individuals, businesses, and local government entities that generate electricity using fuel cell, wind, landfill gas, or solar energy. What: Sales and use tax exemption on purchase or lease of machinery and equipment used directly in generating electricity using fuel cells, wind, landfill gas, or solar energy as the principal source of power.
Sales & Use Tax Exemption Who: Individuals & businesses What: Sales and use tax exemption on purchases of OG-300 rated solar water heating systems, OG-100 rated solar water heating collectors, solar heat exchangers, or differential solar controllers; charges for repair and replacement parts for such equipment; charges for labor and services for installing, repairing, cleaning, altering, or improving such equipment.

State and Local Tax Incentives 2015
For information on all Washington State tax incentives please visit: http://www.dor.wa.gov/Content/FindTaxesAndRates/TaxIncentives/IncentivePrograms.aspx
BIOFUEL AND RENEWABLE ENERGY/GREEN INCENTIVES, CONT. Cost Recovery Program Who: Individuals, businesses, and local government entities that are not in the light and
power business or gas distribution business. Light and power company may take public utility tax credit for amounts paid to participants. Participants must generate electricity on their own property with an anaerobic digester or a wind or solar energy system and apply to their light and power company for a cost recovery incentive payment. What: Cost recovery on investment (up to $2,000)
B&O Tax Credit Who: Businesses with a gross income of less than $750,000 in the previous year. What: A B&O tax credit equal to 8.8% of the purchase price on the purchase of qualifying energy efficient equipment.
Sales & Use Tax Exemption Who: Community Trade and Economic Development (CTED) weatherization program contractors. What: A sales and use tax exemption on purchase of tangible personal property that becomes a component part of a qualifying residence under the weatherization program administered by CTED. Examples of qualifying weatherization materials include, but are not limited to the following: insulation and sealants, parts for air infiltration, heating and cooling equipment, and supplies used to seal and repair ducts.
Sales & Use Tax Exemption Who: Any person that is not engaged in selling biodiesel fuel at wholesale or retail. What: Sales and use tax exemption on the purchase of waste vegetable oil to produce biodiesel fuel. Waste vegetable oil is used cooking oil gathered from restaurants or commercial food processors.
Reduced B&O Tax Rate Who: Manufacturers of alcohol fuel, biodiesel fuel, biodiesel feedstock, or wood biomass fuel. What: The tax rate for manufacturers of biodiesel fuel, biodiesel feedstock, alcohol fuel, and wood biomass fuel has been reduced from 0.484% to 0.138%.
Property/Leasehold Tax Exemption
Who: Manufacturers of alcohol fuel, biodiesel fuel, biodiesel feedstock, or wood biomass fuel. What: Qualifying real and personal property that is operational and used primarily for manufacturing alcohol, biodiesel or wood biomass fuels is exempt or partially exempt from property tax and leasehold excise tax.
B&O Tax Deduction Who: Retail sellers and distributors of biodiesel fuel, alcohol fuel, and wood biomass fuel. What: Income received from the distribution or retail sale of biodiesel fuel, wood biomass fuel, or E85 motor fuel may be deducted from gross income reported for B&O tax. Only income attributable to the pure biofuel portion of biodiesel fuel, wood biomass fuel, or E85 motor fuel sold may be deducted. This amount is computed based on the percentage of the product by volume that is the pure biofuel portion of biodiesel, wood biomass, or E85 motor fuel multiplied by the price of the product by volume. For example, if a fuel blend is 50% pure biodiesel and 50% diesel fuel and sells for $1.50 per gallon, the vendor may deduct $0.75 from gross income for each gallon sold.
Sales & Use Tax Exemption Who: Retail sellers of biodiesel fuel, alcohol fuel, and wood biomass fuel. What: The purchase of machinery and equipment and the construction of facilities used directly for the retail sale of biodiesel fuel blend, E85 motor fuel, and wood biomass fuel blend are exempt from retail sales tax and use tax. The purchase of fuel delivery vehicles and labor and service charges related to such vehicles are exempt from retail sales tax and use tax provided 75% of the fuel distributed by them is biodiesel fuel blend, E85 motor fuel, and wood biomass fuel blend.
State and Local Tax Incentives 2015
For information on all Washington State tax incentives please visit: http://www.dor.wa.gov/Content/FindTaxesAndRates/TaxIncentives/IncentivePrograms.aspx
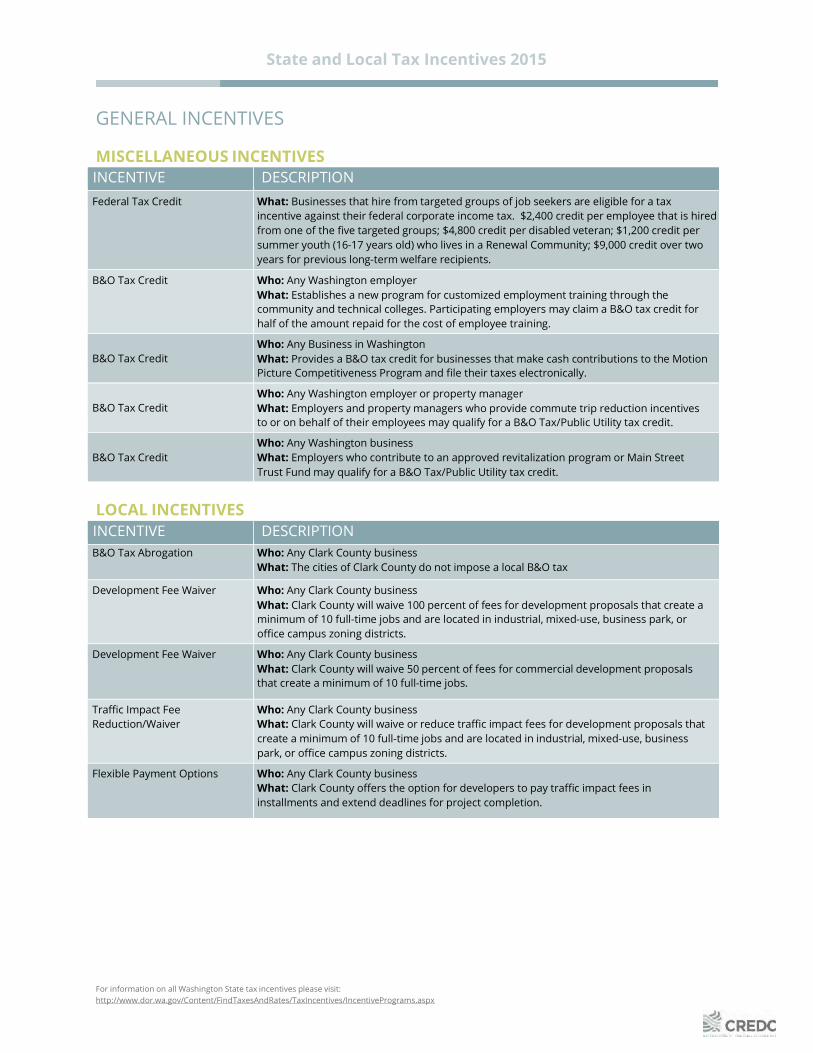
GENERAL INCENTIVES
MISCELLANEOUS INCENTIVES
INCENTIVE DESCRIPTION Federal Tax Credit What: Businesses that hire from targeted groups of job seekers are eligible for a tax
incentive against their federal corporate income tax. $2,400 credit per employee that is hired from one of the five targeted groups; $4,800 credit per disabled veteran; $1,200 credit per summer youth (16-17 years old) who lives in a Renewal Community; $9,000 credit over two years for previous long-term welfare recipients.
B&O Tax Credit Who: Any Washington employer What: Establishes a new program for customized employment training through the community and technical colleges. Participating employers may claim a B&O tax credit for half of the amount repaid for the cost of employee training.
B&O Tax Credit
Who: Any Business in Washington What: Provides a B&O tax credit for businesses that make cash contributions to the Motion Picture Competitiveness Program and file their taxes electronically.
B&O Tax Credit
Who: Any Washington employer or property manager What: Employers and property managers who provide commute trip reduction incentives to or on behalf of their employees may qualify for a B&O Tax/Public Utility tax credit.
B&O Tax Credit
Who: Any Washington business What: Employers who contribute to an approved revitalization program or Main Street Trust Fund may qualify for a B&O Tax/Public Utility tax credit.
LOCAL INCENTIVES INCENTIVE DESCRIPTION B&O Tax Abrogation Who: Any Clark County business
What: The cities of Clark County do not impose a local B&O tax
Development Fee Waiver Who: Any Clark County business What: Clark County will waive 100 percent of fees for development proposals that create a minimum of 10 full-time jobs and are located in industrial, mixed-use, business park, or office campus zoning districts.
Development Fee Waiver Who: Any Clark County business What: Clark County will waive 50 percent of fees for commercial development proposals that create a minimum of 10 full-time jobs.
Traffic Impact Fee Reduction/Waiver
Who: Any Clark County business What: Clark County will waive or reduce traffic impact fees for development proposals that create a minimum of 10 full-time jobs and are located in industrial, mixed-use, business park, or office campus zoning districts.
Flexible Payment Options Who: Any Clark County business What: Clark County offers the option for developers to pay traffic impact fees in installments and extend deadlines for project completion.

State and Local Government 2015
Compiled by CREDC Research Analyst, 2013
GOVERNMENT STRUCTURE
CITY GOVERNMENT
Vancouver, Washington Form (Structure) City Council
Number of Elected Officials 7
Mayor Timothy D. Leavitt
Length of Term 4
Next Election Date 2017
City Manager Eric Holmes
COUNTY GOVERNMENT
Clark County, Washington Form (Structure) Board of County Councilors
Number of Elected Officials 9
County Councilors Tom Mielke, Jeanne E. Stewart, and David Madore
Length of Term 4
Next Election Date 2015
County Manager Mark McCauley
STATE GOVERNMENT
Washington State Form (Structure) Bicameral
Number of Elected Officials 9
Upper House 4
Total Statewide Upper 49
Lower House 8
Total Statewide Lower 98
Governor Name Jay Inslee
Length of Term 4
Current Term Expiration 2017
Allowed to Run for Another Term Yes
Washington Government Representation State Senate
14th District Curtis King (R)
17th District Don Benton (R)
18th District Ann Rivers (R)
49th District Annette Cleveland (D)
STATE GOVERNMENT, CONT.

State and Local Government 2015
Compiled by CREDC Research Analyst, 2013
State House of Representatives
14th District
Norm Johnson (R)
Gina McCabe (R)
17th District
Lynda Wilson (R)
Paul Harris (R)
18th District
Brandon Vick (R)
Liz Pike (R)
49th District
Sharon Wylie (D)
Jim Moeller (D)
FEDERAL GOVERNMENT REPRESENTATION US Congressmen Serving the Area (District 3) Name Jaime Herrera Beutler
Term Length 2
Current Term Expiration 2015
US Senators Serving the Area Name Patty Murray
Term Length 6
Current Tern Expiration 2017
Name Maria Cantwell
Term Length 6
Current Term Expiration 2019
Clark County Higher Education 2015
Compiled by CREDC Research Analyst, 2015
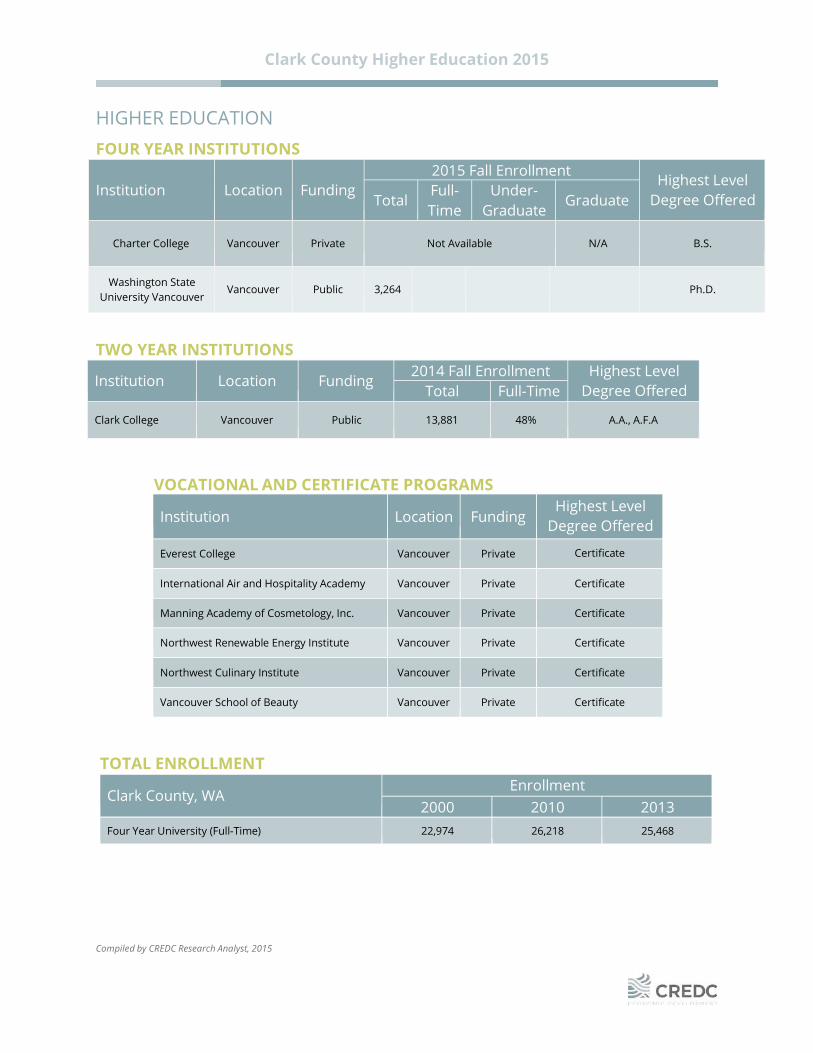
HIGHER EDUCATION
FOUR YEAR INSTITUTIONS
Institution
Location
Funding
2015 Fall Enrollment
Highest Level Degree Offered
Total Full- Time
Under- Graduate
Graduate
Charter College
Vancouver
Private
Not Available
N/A
B.S.
Washington State University Vancouver
Vancouver
Public
3,264
Ph.D.
TWO YEAR INSTITUTIONS
Institution
Location
Funding 2014 Fall Enrollment Highest Level
Degree Offered Total Full-Time
Clark College
Vancouver
Public
13,881
48%
A.A., A.F.A
VOCATIONAL AND CERTIFICATE PROGRAMS Institution
Location
Funding
Highest Level Degree Offered
Everest College
Vancouver
Private Certificate
International Air and Hospitality Academy
Vancouver
Private
Certificate
Manning Academy of Cosmetology, Inc.
Vancouver
Private
Certificate
Northwest Renewable Energy Institute
Vancouver
Private
Certificate
Northwest Culinary Institute
Vancouver
Private
Certificate
Vancouver School of Beauty
Vancouver
Private
Certificate
TOTAL ENROLLMENT
Clark County, WA Enrollment
2000 2010 2013 Four Year University (Full-Time) 22,974 26,218 25,468

Compiled by CREDC Research Analyst, 2015
Clark County Environmental Services 2015
ENVIRONMENTAL SERVICES
PERMITS
Permit Type Average Permit Time (From Date of Completed Routine Application)
Air 60-90 days
Water 60-90 days
Hazardous Waste 60-90 days
Washington does not have a "One Stop" Permit Assistance Center
WASTE DISPOSAL
Nearest Licensed Hazardous Waste Disposal Site Burlington Environmental Site (Washougal, WA)
No. of Licensed Hazardous Waste Haulers Serving the Area 6-11
Landfill Location Finley Buttes Regional Landfill (Boardman, OR)
ENVIRONMENTAL SERVICES Agency Contact Information
Air Quality
Southwest Clean Air Agency
11815 NE 99th St. Suite 1294
Vancouver, WA 97682
P. 360-574-3058
F. 360-576-0925
Toll Free. 800-633-0709
Water Quality
City of Vancouver
Operations and Maintenance
4711 Fourth Plain Blvd.
Vancouver, WA 98661
P. 360-696-8177
F. 360-696-8002
Environmental Business Assistance
Clark County
1101 Broadway Suite 120
Vancouver, WA 98660
P. 360-694-2588 x. 1074

Compiled by CREDC Research Analyst, 2015
Clark County Utilities 2015
UTILITY RATES
WATER CITY OF VANCOUVER – WATER RATES (Effective January 1, 2015)
Within City Limits Outside City Limits Base Charge
6" Meter $221.99 $332.99 8" Meter $354.08 $531.12 10" Meter $530.10 $795.15
Usage Charge
Commercial $1.47 per CCF $2.22 per CCF Industrial $1.47 per CCF $2.22 per CCF
WASTEWATER CITY OF VANCOUVER – WASTEWATER RATES (Effective January 1, 2015)
Within City Limits Outside City Limits Usage Charge
Commercial $5.26 per CCF $7.89 per CCF
Industrial $5.45 per CCF* $5.66 per CCF** Electronics $4.01 per CCF $4.16 per CCF
Electronics Customer Class - Effective January 1, 2015 - December 31, 2015: *For monthly average flows above 2.88 million gallons per day, the rate shall be $3.21 per CCF. **For monthly average flows above 2.88 million gallons per day, the rate shall be $3.33 per CCF.
Industrial User is defined as an industrial user of the public sewer system who: a) Has a discharge flow of ten thousand gallons or more per average work day; or b) Has a concentration of biochemical oxygen demand (BOD) and suspended solids (SS) in excess of two hundred milligrams per liter per average work day; or c) Has a discharge containing cadmium, chromium, copper, lead, zinc, silver, or similar toxic substances; or d) Is found by the city, State Department, or Ecology, or U.S. Environmental Protection Agency to have a significant impact on the wastewater treatment system.
Electronics User is defined as an industrial user of the public sewer system who: a) Has a discharge flow of five hundred thousand gallons or more per average work day; and b) Has a concentration of biochemical oxygen demand (BOD) and suspended solids (SS) less than two hundred milligrams per liter per average work day.

Compiled by CREDC Research Analyst, 2015
Clark County Utilities 2015
ELECTRICITY CLARK PUBLIC UTILITIES – ELECTRIC RATES (Effective January 1, 2013)
Commercial First Tier Schedule 34 Basic Charge $25.00
Energy Charge 7.70 cents per kWh
Commercial Second Tier Schedule 34 Basic Charge $58.00
Energy Charge
Sept-Mar 4.91 cents per kWh Apr-Aug 4.38 cents per kWh
Demand Charge
Primary Point-of-Delivery $6.77 per kWh Secondary Point-of-Delivery $5.94 per kWh
Off-Peak Demand: By special contract with the utility, off-peak demand is available for customers with demands in excess of 30 kW. Service will be available at a discount rate during the off-peak period, which includes all hours except the hours Monday through Saturday between 7 a.m. to 10 p.m. The off-peak demand rates are 60 cents per kW of demand for each kW the off-peak demand exceeds other recorded monthly demands. The energy rate as listed in the Monthly Rate section applies to all hours.
Adjustment of Demand for Power Factor: Demands will be adjusted to correct for average power factors lower than 95%. Such adjustments will be made by increasing the measured demand 1% for each 1% of major fraction thereof by which the average power factor is less than 95% lagging.
CLARK PUBLIC UTILITIES – ELECTRIC RATES (Effective November 1, 2011)
Industrial* Schedule 85 Basic Charge $200.00
Energy Charge
Sep-Mar 4.91 cents per kWh
Apr-Aug 4.38 cents per kWh
Demand Charge
Primary Point-of-Delivery $5.94 per kWh
Secondary Point-of-Delivery $6.77 per kWh
Transmission Point-of-Delivery $4.60 per kWh *To lighting, heating and power service for customers having measured minimum demands of not less than 1500 kilowatts.
Off-Peak Demand: By special contract with the utility, off-peak demand is available for customers with demands in excess of 1500 KW. Service will be available at a discount rate during the off-peak period, which includes all hours except the hours Monday through Saturday between 7:00 a.m. and 10:00 p.m. The off-peak demand rates are 60¢ per KW of demand for each KW the off—peak demand exceeds other recorded monthly demands. The energy rate as listed in the Monthly Rate section applies to all hours.
Adjustment of Demand for Power: Demands will be adjusted to correct for average power factors lower than 95%. Such adjustments will be made by increasing the measured demand l% for each l% or major fraction thereof by which the average power factor is less than 95% lagging.

Compiled by CREDC Research Analyst, 2015
Clark County Utilities 2015
Schedule 41 – Non-Residential Firm Transportation Service
Usage Charges
Customer Charge $250.00
Transportation Charge $250.00
Charge Per Therm
1st 2,000 therms $0.30077
All additional therms $0.26500
Schedule 42 – Non-Residential Large Volume Interruptible Transportation Service
Usage Charges
Customer Charge $1,300.00
Transportation Charge $250.00
Charge Per Therm
1st 10,000 therms $0.11818
Next 20,000 therms $0.10579
Next 20,000 therms $0.08112
Next 100,000 therms $0.06490
Next 600,000 therms $0.04327
All additional therms $0.01622
Distribution Capacity Charge
Per therm/MDDV N/A
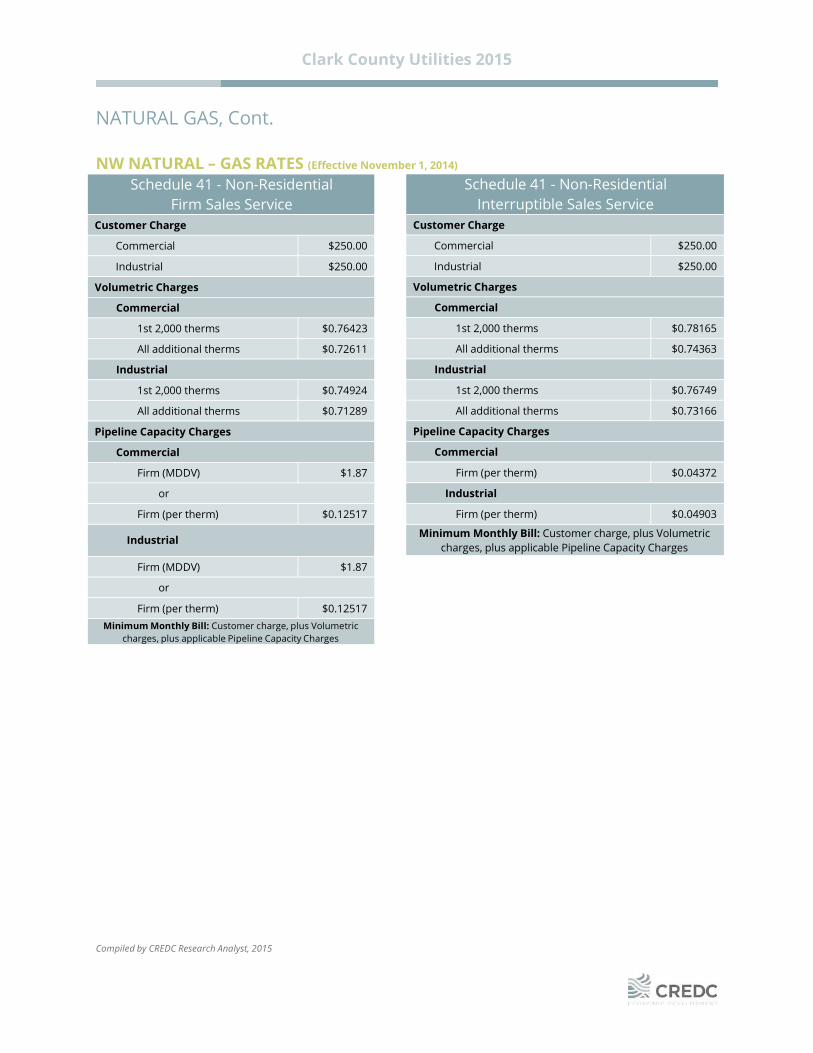
NATURAL GAS NW NATURAL – GAS RATES (Effective November 1, 2014)
NW NATURAL – GAS RATES (Effective November 1, 2014)
Schedule 3 - Basic Firm Sales Service
Usage Charges
Customer Charge $15.00
All Therms
Commercial $1.01161
Industrial $0.99181
Minimum Monthly Bill $15.00
Schedule 42 – Non-Residential Large Volume Firm Transportation Service
Usage Charges
Customer Charge $1,300.00
Transportation Charge $250.00
Charge Per Therm
1st 10,000 therms $0.11818
Next 20,000 therms $0.10579
Next 20,000 therms $0.08112
Next 100,000 therms $0.06490
Next 600,000 therms $0.04327
All additional therms $0.01622
Distribution Capacity Charge
Per therm/MDDV $0.15748
Compiled by CREDC Research Analyst, 2015
Clark County Utilities 2015
Schedule 41 - Non-Residential Interruptible Sales Service
Customer Charge
Commercial $250.00
Industrial $250.00
Volumetric Charges
Commercial
1st 2,000 therms $0.78165
All additional therms $0.74363
Industrial
1st 2,000 therms $0.76749
All additional therms $0.73166
Pipeline Capacity Charges
Commercial
Firm (per therm) $0.04372
Industrial
Firm (per therm) $0.04903
Minimum Monthly Bill: Customer charge, plus Volumetric charges, plus applicable Pipeline Capacity Charges
NATURAL GAS, Cont. NW NATURAL – GAS RATES (Effective November 1, 2014)
Schedule 41 - Non-Residential Firm Sales Service
Customer Charge
Commercial $250.00
Industrial $250.00
Volumetric Charges
Commercial
1st 2,000 therms $0.76423
All additional therms $0.72611
Industrial
1st 2,000 therms $0.74924
All additional therms $0.71289
Pipeline Capacity Charges
Commercial
Firm (MDDV) $1.87
or
Firm (per therm) $0.12517
Industrial
Firm (MDDV) $1.87
or
Firm (per therm) $0.12517 Minimum Monthly Bill: Customer charge, plus Volumetric
charges, plus applicable Pipeline Capacity Charges

Compiled by CREDC Research Analyst, 2015
Clark County Utilities 2015
Schedule 42 - Non-Residential Large Volume Interruptible Sales Service
Customer Charge
Commercial $1,300.00
Industrial $1,300.00
Volumetric Charges
Commercial
1st 10,000 therms $0.58869
Next 20,000 therms $0.57539
Next 20,000 therms $0.54896
Next 100,000 therms $0.53156
Next 600,000 therms $0.50838
All additional therms $0.47941
Industrial
1st 10,000 therms $0.58345
Next 20,000 therms $0.57071
Next 20,000 therms $0.54537
Next 100,000 therms $0.52870
Next 600,000 therms $0.50646
All additional therms $0.47868
Pipeline Capacity Charges
Commercial
Firm (per therm) $0.04372
Industrial
Firm (per therm) $0.04372
Storage Charge (per therm of MDDV)
Commercial $0.10208
Industrial $0.10208
Minimum Monthly Bill: Customer charge, plus Volumetric charges, plus applicable Pipeline Capacity Charges, Distribution Capacity
Charges, and Storage Charge
NATURAL GAS, Cont.
NW NATURAL – GAS RATES (Effective November 1, 2014)
Schedule 42 - Non-Residential Large Volume Firm Sales Service
Customer Charge
Commercial $1,300.00
Industrial $1,300.00
Volumetric Charges
Commercial
1st 10,000 therms $0.57511
Next 20,000 therms $0.56130
Next 20,000 therms $0.53384
Next 100,000 therms $0.51575
Next 600,000 therms $0.49166
All additional therms $0.46152
Industrial
1st 10,000 therms $0.56438
Next 20,000 therms $0.55170
Next 20,000 therms $0.52646
Next 100,000 therms $0.50986
Next 600,000 therms $0.48774
All additional therms $0.46004
Pipeline Capacity Charges
Commercial
Firm (MDDV) $1.87
or
Firm (per therm) $0.12517
Industrial
Firm (MDDV) $1.87
or
Firm (per therm) $0.12517
Distribution Capacity Charge (per therm of MDDV)
Commercial $0.15748
Industrial $0.15748
Storage Charge (per therm of MDDV)
Commercial $0.20415
Industrial $0.20415 Minimum Monthly Bill: Customer charge, plus Volumetric charges,
plus applicable Pipeline Capacity Charges, Distribution Capacity Charges, and Storage Charge
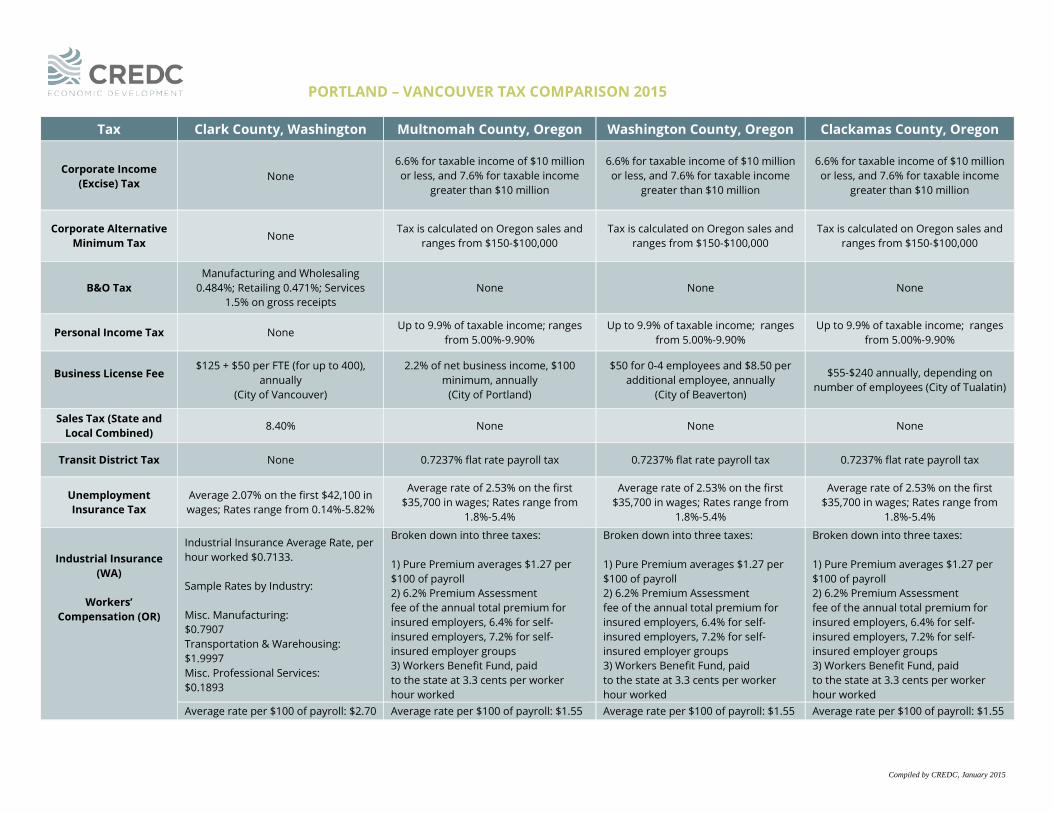
PORTLAND – VANCOUVER TAX COMPARISON 2015
Compiled by CREDC, January 2015
Tax Clark County, Washington Multnomah County, Oregon Washington County, Oregon Clackamas County, Oregon
Corporate Income (Excise) Tax
None
6.6% for taxable income of $10 million or less, and 7.6% for taxable income
greater than $10 million
6.6% for taxable income of $10 million or less, and 7.6% for taxable income
greater than $10 million
6.6% for taxable income of $10 million or less, and 7.6% for taxable income
greater than $10 million
Corporate Alternative Minimum Tax None
Tax is calculated on Oregon sales and ranges from $150-$100,000
Tax is calculated on Oregon sales and ranges from $150-$100,000
Tax is calculated on Oregon sales and ranges from $150-$100,000
B&O Tax Manufacturing and Wholesaling
0.484%; Retailing 0.471%; Services 1.5% on gross receipts
None
None
None
Personal Income Tax None Up to 9.9% of taxable income; ranges
from 5.00%-9.90% Up to 9.9% of taxable income; ranges
from 5.00%-9.90% Up to 9.9% of taxable income; ranges
from 5.00%-9.90%
Business License Fee $125 + $50 per FTE (for up to 400),
annually (City of Vancouver)
2.2% of net business income, $100 minimum, annually
(City of Portland)
$50 for 0-4 employees and $8.50 per additional employee, annually
(City of Beaverton)
$55-$240 annually, depending on number of employees (City of Tualatin)
Sales Tax (State and Local Combined) 8.40% None None None
Transit District Tax None 0.7237% flat rate payroll tax 0.7237% flat rate payroll tax 0.7237% flat rate payroll tax
Unemployment Insurance Tax
Average 2.07% on the first $42,100 in wages; Rates range from 0.14%-5.82%
Average rate of 2.53% on the first $35,700 in wages; Rates range from
1.8%-5.4%
Average rate of 2.53% on the first $35,700 in wages; Rates range from
1.8%-5.4%
Average rate of 2.53% on the first $35,700 in wages; Rates range from
1.8%-5.4%
Industrial Insurance
(WA)
Workers’ Compensation (OR)
Industrial Insurance Average Rate, per hour worked $0.7133. Sample Rates by Industry: Misc. Manufacturing: $0.7907 Transportation & Warehousing: $1.9997 Misc. Professional Services: $0.1893
Broken down into three taxes: 1) Pure Premium averages $1.27 per $100 of payroll 2) 6.2% Premium Assessment fee of the annual total premium for insured employers, 6.4% for self-insured employers, 7.2% for self-insured employer groups 3) Workers Benefit Fund, paid to the state at 3.3 cents per worker hour worked
Broken down into three taxes: 1) Pure Premium averages $1.27 per $100 of payroll 2) 6.2% Premium Assessment fee of the annual total premium for insured employers, 6.4% for self-insured employers, 7.2% for self-insured employer groups 3) Workers Benefit Fund, paid to the state at 3.3 cents per worker hour worked
Broken down into three taxes: 1) Pure Premium averages $1.27 per $100 of payroll 2) 6.2% Premium Assessment fee of the annual total premium for insured employers, 6.4% for self-insured employers, 7.2% for self-insured employer groups 3) Workers Benefit Fund, paid to the state at 3.3 cents per worker hour worked
Average rate per $100 of payroll: $2.70 Average rate per $100 of payroll: $1.55 Average rate per $100 of payroll: $1.55 Average rate per $100 of payroll: $1.55