Embed Size (px)
Citation preview

Biroul Naţional de Statistică al Republicii Moldova Национальное бюро статистики Республики Молдова National Bureau of Statistics of the Republic of Moldova
POPULAŢIA ŞI PROCESELE DEMOGRAFICE ÎN
REPUBLICA MOLDOVA Culegere statistică
НАСЕЛЕНИЕ И ДЕМОГРАФИЧЕСКИЕ ПРОЦЕССЫ В РЕСПУБЛИКЕ МОЛДОВА Статистический сборник
POPULATION AND DEMOGRAPHIC PROCESSES IN THE REPUBLIC OF MOLDOVA
Statistical compilation
Chişinău, 2009

2
Colegiul de redacţie: Vladimir Golovatiuc – Preşedintele colegiului,
Nina Cesnocova, Jana Mazur Редакционная коллегия: Владимир Головатюк – председатель коллегии,
Нина Чеснокова, Жанна Мазур Editorial board: Vladimir Golovatiuc- Boarder president,
Nina Cesnocova, Jana Mazur
Cuprins Содержание
Contents
Prefaţă Предисловие Foreword………………………………………………………………………………………………………………………. 3 Sumar Краткое изложение основных показателей демографического развития Summary…………………………………………………………………………………………………………………….... 4 Organizarea administrativ-teritorială Административно-территориальное устройство Administrative-territorial division……………………………………………………………………………………………. 6 Populaţie Население Population…………………………………………………………………………………………………………………….. 7 Mişcarea naturală a populaţiei Естественное движение населения Vital statistics…………………………………………………………………………………………………………………. 15 Mişcarea migratorie a populaţiei Миграционное движение населения Population’s migration………………………………………………………………………………………………………… 54
Simboluri folosite / Используемые обозначения / Symbols used
- = evenimentul nu există / не было явления / not applicable
… = lipsă de date / сведений нет / data not available
In unele cazuri pot apărea decalaje neînsmnate între totalurile indicate şi sumele componente incluse, fapt ce se explică prin rotunjirea datelor. В отдельных случаях незначительные расхождения между итогом и суммой слагаемых объясняются округлением данных. In some cases, there may occur insignificant discrepancies between the totals and corresponding sums of the components, fact that could be explained by data approximation.

3
PREFAŢĂ Prin publicarea acestei culegeri cu date demografice, Biroul Naţional de Statistică doreşte să vină în întîmpinarea tuturor celor care
sînt interesaţi în cunoaşterea şi studiul populaţiei, fenomenelor şi proceselor demografice.
Culegerea statistică „Populaţia şi procesele demografice în Republica Moldova” conţine date statistice despre împărţirea administrativ-teritorială a ţării şi serii de date statistice cu privire la numărul şi structura demografică a populaţiei, precum şi la mişcarea ei naturală (născuţi, decedaţi, căsătorii, divorţuri) şi migratorie (internaţională).
Informaţia despre născuţi este redată conform sexului născutului, rangului, grupei de vîrstă a părinţilor şi stării civile a mamei. Datele despre decedaţi sînt reflectate după vîrstă, sexe şi principalele clase ale cauzelor de deces. În culegere sînt de asemenea incluşi şi indicatori demografici generalizatori ce caracterizează procesele reproducerii populaţiei – rata totală de fertilitate, speranţa de viaţă la naştere şi la unele grupe de vîrstă. Principalii indicatori sînt prezentati fără datele din partea stîngă a Nistrului şi mun. Bender, inclusiv cazuri aparte de înregistrare a actelor de stare civilă a persoanelr de pe acest teritoriu.
Conştienţi de faptul, că aceste date demografice nu ar fi fost produse fără contribuţia Ministerului Dezvoltării Informaţionale, Ministerului Afacerilor Interne, Centrului Ştiinţifico-Practic de Sănătate Publică şi Management Sanitar al Ministerului Sănătăţii al Republicii Moldova, adresăm pe această cale mulţumirile noastre lucrătorilor acestor ministere.
Biroul Naţional de Statistică
ПРЕДИСЛОВИЕ Публикацией данного сборника по демографии Национальное бюро статистики выражает желание помочь всем, кто
заинтересован в познании и изучении вопросов, связанных с населением, демографическими явлениями и процессами, происходящими в стране.
Статистический сборник «Население и демографические процессы в Республике Молдова» содержит данные об административно-территориальном делении страны и серию статистических данных о численности и демографической структуре населения, а также о его естественном движении (родившихся, умерших, браках, разводах) и международной миграции.
Информация о родившихся приведена в разбивке по полу новорожденного, порядку его рождения, возрастной группе родителей, семейному положению матери. Данные об умерших отражены по возрасту, полу и основным классам причин смерти. В сборник также включены основные демографические показатели, характеризующие процессы воспроизводства населения – общий коэффициент рождаемости, ожидаемая продолжительность жизни при рождении и по некоторым возрастным группам.
Основные показатели приведены без данных левобережья Днестра и муниципия Бендер, включая отдельные случаи регистрации актов гражданского состояния жителей этой территории.
Публикуемые данные получены при участии Министерства информационного развития, Министерства внутренних дел, Научно-практического центра общественного здравоохранения и санитарного менеджмента Министерства здравоохранения Республики Молдова, в связи с чем выражаем свою признательность работникам данных министерств.
Национальное бюро статистики FOREWORD
By publishing this collection of demographic data, the National Bureau of Statistics has the goal of helping the ones who are interested in the knowledge and study of the population, demographic phenomena and processes happening in the country.
The statistical compilation “Population and demographic processes in the Republic of Moldova” contains statistical data about the administrative-territorial division of the country and series of statistical data concerning the number and demographic structure of the population, as well as its natural movement (borns, deceased, marriages, divorces) and migratory (international) movement.
The information about the borns is presented in accordance with the new-born’s sex, live-birth order, age group of parents and mother’s marital status. The data about the deceased is reflected by age, sex and main causes of death. The collection also includes demographic generalizing indicators of the population’s reproduction processes – total fertility rate, life expectancy at birth and certain age groups.
The basic indicators are presented without the data from the left side of the river Nistru and municipality Bender, including separate cases of civil status act registration of inhabitants of this territory.
Aware of the fact that the demographic data would not be obtained without the contribution of the Ministry of Informational Development, Ministry of Internal Affairs, Scientific-Practical Centre of Public Health and Sanitary Management of the Ministry of Health of the Republic of Moldova, we express our gratitude to the workers of these ministries.
National Bureau of Statistics

4
SUMAR Populaţia. Numărul populaţiei stabile al Republicii Moldova la 1ianuarie 2009 a fost de 3567,5 mii locuitori, din care 1476,1 mii (41,4%) – populaţia urbană şi 2091,4 mii (58,6%) – cea rurală, în scădere faţă de 1 ianuarie 2001, cu 67,6 mii persoane (inclusiv urbană cu 10,3 mii şi rurală cu 57,3 mii) Repartizarea populaţiei după sexe se prezintă astfel: 52,0% – femei şi 48,0% – bărbaţi. Structura populaţiei pe vîrste poartă amprenta caracteristică a unui proces de îmbătrînire demografică, adică creşterea ponderii femeilor şi bărbaţilor vîrstnici şi reducerea ponderii persoanelor în vîrstă de 0-14 ani. În ultimii opt ani s-a înregistrat reducerea ponderii acestei grupe de vîrstă de la 22,8% la 17,1% şi creşterea ponderii populaţiei vîrstnice (de 65 ani şi peste), de la 9,5% la 10,2%. Datorită nivelului înalt al mortalităţii bărbaţilor în vîrsta aptă de muncă procesul îmbătrînirii populaţiei în mai mare măsură este caracteristic pentru femei. Actualmente în structura populaţiei în vîrstă de 65 ani şi peste femeile constituie mai mult de 60%. Speranţa de viaţă la naştere în 2008 a fost de 69,4 ani, inclusiv la bărbaţi – 65,6, la femei – 73,2 ani. Comparativ cu 2001 ea s-a majorat, la bărbaţi cu un an, iar la femei aproximativ cu un an jumate. Evoluţia proceselor demografice se caracterizează prin următorii indicatori ai mişcării naturale a populaţiei: Rata natalităţii în 2008 a fost de 10,9 născuţi-vii la 1000 locuitori, în creştere faţă de cea din 2001 (10,0‰). Rata totală de fertilitate (numărul mediu de copii născuţi la 100 de femei de vîrsta 15-49 ani) a constituit 128 în 2008, cea mai mare din ultimii opt ani. Rata mortalităţii generale a scăzut în 2008 şi a constituit 11,8 decedaţi la 1000 locuitori, faţă de 12,4‰ în 2005. S-a păstrat decalajul dintre ratele de mortalitate din mediul urban şi mediul rural: 9,1‰ şi 13,6‰. Mortalitatea infantilă comparativ cu anul 2001 a scăzut de la 16,3 decedaţi în vîrstă sub 1 an la 1000 născuţi-vii pînă la 12,2 ‰. Căsătorii şi divorţuri. În ultimii opt ani se observă creşterea anuală atît a numărului căsătoriilor înregistrate, cît şi a divorţurilor. Rata nupţialităţii în această perioadă s-a majorat de la 5,8 căsătorii la 1000 locuitori pînă la 7,5, iar rata divorţialităţii - de la 3 pînă la 3,5 divorţuri la 1000 locuitori.
КРАТКОЕ ИЗЛОЖЕНИЕ ОСНОВНЫХ ПОКАЗАТЕЛЕЙ ДЕМОГРАФИЧЕСКОГО РАЗВИТИЯ Население Численность населения Республики Молдова на 1 января 2009 года составила 3567,5 тыс. человек, из которых 1476,1 тыс. (41,4%) проживало в городских поселениях и 2091,4 тыс. (58,6%) – в сельской местности. По сравнению с 2001 годом численность населения страны уменьшилась на 67,6 тыс. человек, в том числе городского – на 10,3 тыс. и сельского – на 57,3 тыс. Удельный вес женщин в общей численности составляет 52%, мужчин – 48%. Возрастная структура населения отражает продолжающуюся тенденцию к «постарению», т. е. увеличению доли женщин и мужчин в старших возрастах и сокращению доли лиц в возрасте 0-14 лет. За последние восемь лет отмечается снижение доли этой возрастной группы с 22,8% до 17,1% и рост удельного вес численности людей старших возрастов (65 лет старше) – с 9,5% до 10,2%. Вследствие высокого уровня смертности мужчин в трудоспособных возрастах процесс демографического старения населения в гораздо большей степени характерен для женщин. В настоящее время в структуре населения в возрасте 65 лет и более женщины составляют более 60%. Ожидаемая продолжительность жизни населения в 2008 году составила 69,4 лет, в том числе у мужчин – 65,6, у женщин -73,2. По сравнению с 2001 годом она увеличилась у мужчин на год, а у женщин почти на полтора года. Развитие демографических процессов характеризуется следующими основными показателями естественного движения населения: Коэффициент рождаемости составил в 2008 году 10,9 новорожденных в расчете на 1000 человек населения, против 10,0‰ в 2001 году. Суммарный коэффициент рождаемости (число родившихся детей в среднем на 100 женщин в возрасте 15-49 лет) составил 128 и является самым высоким за последние восемь лет. Общий коэффициент смертности снизился в 2008 году и составил 11,8 умерших в расчете на 1000 человек населения против 12,4‰ в 2005 году. Неизменным остается и значительный разрыв в показателях между городом и селом: 9,1‰ и 13,6‰ соответственно. Младенческая смертность по сравнению с 2001 годом снизилась с 16,3 умерших в возрасте до 1 года в расчете на 1000 родившихся до 12,2‰. Браки и разводы. За прошедшие восемь лет коэффициент брачности вырос с 5,8 браков в расчете на 1000 населения до 7,5, а коэффициент разводимости – с 3 разводов в расчете на 1000 жителей до 3,5.
SUMMARY
Population. The number of resident population of the Republic of Moldova at January 1st , 2009 constituted 3567,5 thou. inhabitants, of which 1476,1 thou. (41,4%) - urban population and 2091,4 thou. (58,6%) – rural population. In less that at January 1st, 2001 with 67,6 thou. persons (including urban - with 10,3 thou. and rural – with 57,3 thou.). The distribution of population by sex represents: women - 52%, men - 48%. The structure of population by age has the characteristic of a demographic ageing process, namely the increase of the share of old women and men and the decrease of the share of person aged 0-14 years. In the last 8 years was registered a diminuation of the share of this age group from 22,8% to 17,1% and increase of the share of old population (aged 65 years and over), from 9,5% to 10,2%. Because of the high mortality level of men of working age, the ageing population process is more typical to women. At present, in the structure of population aged 65 years and over, women represent more than 60%. The life expectancy at birth in 2008 was 69,4 year, including 65,6 year – men, 73,2 year – women. Compared to 2001, it increased with 1 year for men and approximately with half year for women.

5
The evolution of demographic processes is represented by the text indicators of the natural movement of population: Natality rate in 2008 was 10, 9 live-born per 1000 inhabitants, more than in 2001(10,0%). Total fertility rate (average number of children born per 100 women aged 15-49 years) in 2008 constituted 128, and is the highest for the past eight years. The mortality rate increased in 2008 and constituted to 11,8 deceases per 1000 inhabitants, given to 12,4 ‰ in 2005. The disparity between the mortality rate in urban and rural areas remained: 9, 1 ‰ and 13,6 ‰. Infant mortality, compared to the year 2001, decreased from 16,3 deceased, aged under 1 year per 1000 live-births, to 12,2 ‰. Marriages and divorces. In the last 8 years, the marriage rate increased from 5,8 marriages per 1000 inhabitants to 7,5, and divorciality rate – from 3 to 3,5 divorces per 1000 inhabitants.

6
Organizarea administrativ-teritorială a Republicii Moldova, suprafaţa şi densitatea populaţiei, la 1 ianuarie 2009
Административно-территориальное устройство Республики Молдова, площадь и плотность населения, на 1 января 2008 года
Administrative-territorial division of the Republic of Moldova, area and population’s density, as of January 1, 2009
din care: из них:
of which:
Denumirea unităţii administrativ-teritoriale
Наименование административно- территориальной
единицы Denomination of the
administrative-territorial unit
Total localităţi Всего
населённых пунктов
Total localities
municipii муниципиевmunicipalities
oraşe городов
cities
sate (comune)
сёл (коммун)villages
(communes)
Suprafaţa totală, km2
Общая площадь,
км2
Total area, km2
Numărul locuitorilor pe 1
km2 Число
жителей на 1 км2
Number of inhabitants per
1 km2 Total / Всего / Total
1530
3
51
844
30445,24
117,2
Municipiul Chişinău 35 1 6 12 571,64 1374,3 Nord / Север /North 571 1 19 295 10014,57 101,2 Municipiul Bălţi 3 1 – 2 78,01 1898,5 Briceni 39 – 2 26 814,44 93,6 Donduşeni 30 – 1 21 644,12 71,3 Drochia 40 – 1 27 999,91 91,0 Edineţ 49 – 2 30 932,92 89,6 Făleşti 75 – 1 32 1072,60 86,8 Floreşti 74 – 3 37 1108,19 82,1 Glodeni 35 – 1 18 754,18 82,9 Ocniţa 33 – 3 18 597,47 94,6 Rîşcani 55 – 2 26 936,03 75,7 Sîngerei 70 – 2 24 1033,71 90,7 Soroca 68 – 1 34 1042,99 96,9 Centru /Центр / Center 598 – 14 340 10631,81 100,2 Anenii Noi 45 – 1 25 887,62 93,6 Călăraşi 43 – 1 27 753,55 105,2 Criuleni 43 – 1 24 687,95 105,8 Dubăsari 15 – – 11 309,22 113,8 Hînceşti 63 – 1 38 1472,13 83,7 Ialoveni 34 – 1 24 783,49 125,5 Nisporeni 39 – 1 22 629,02 106,8 Orhei 75 – 1 37 1228,31 102,5 Rezina 41 – 1 24 621,79 85,2 Străşeni 39 – 2 25 729,12 125,5 Şoldăneşti 33 – 1 22 598,37 73,2 Teleneşti 54 – 1 30 848,62 88,0 Ungheni 74 – 2 31 1082,62 108,3 Sud /Юг / South 294 – 10 174 7378,76 73,6 Basarabeasca 10 – 1 6 295,41 100,2 Cahul 55 – 1 36 1545,28 80,5 Cantemir 51 – 1 26 867,86 72,8 Căuşeni 48 – 2 25 1310,58 70,7 Cimişlia 39 – 1 22 922,83 67,8 Leova 39 – 2 23 764,73 70,4 Ştefan Vodă 26 – 1 22 998,38 72,5 Taraclia 26 – 1 14 673,69 66,1 U.T.A. Găgăuzia 32 1 2 23 1848,46 86,5

7
POPULAŢIE НАСЕЛЕНИЕ POPULATION
Numărul populaţiei prezente pe medii, la 1 ianuarie Численность наличного населения по типу местности, на 1 января
Number of the present population by area, as of January, 1
Numărul populaţiei, mii persoane Численность населения, тыс. человек
Number of population, thou. persons
În % faţă de total В % к итогу
In % to the total Anii Годы Years total
всего total
urban городское
urban
rural cельское
rural
urban городское
urban
rural cельское
rural 2001 3634,5 1501,4 2133,1 41,3 58,7 2002 3627,2 1500,2 2127,0 41,4 58,6 2003 3617,7 1499,1 2118,6 41,4 58,6 2004 3606,8 1492,9 2113,9 41,4 58,6 2005 3386,0 1308,8 2077,2 38,7 61,3 2006 3395,6 1322,7 2072,9 39,0 61,0 2007 3432,8 1360,9 2071,9 39,6 60,4 2008 3424,4 1359,0 2065,4 39,7 60,3 2009 3419,4 1358,0 2061,4 39,7 60,3
Numărul populaţiei prezente pe sexe, la 1 ianuarie Численность наличного населения по полу, на 1 января Number of the present population by sex, as of January, 1
Numărul populaţiei, mii persoane
Численность населения, тыс. человек Number of population, thou. persons
În % faţă de total В % к итогу
In % to the total Anii Годы Years total
всего total
masculin мужчины
male
feminin женщины
female
masculin мужчины
male
feminin женщины
female 2001 3634,5 1740,3 1894,2 47,9 52,1 2002 3627,2 1737,4 1889,8 47,9 52,1 2003 3617,7 1733,0 1884,7 47,9 52,1 2004 3606,8 1728,1 1878,7 47,9 52,1 2005 3386,0 1631,2 1754,8 48,2 51,8 2006 3395,6 1636,7 1758,9 48,2 51,8 2007 3432,8 1654,6 1778,2 48,2 51,8 2008 3424,4 1651,1 1773,3 48,2 51,8 2009 3419,4 1648,5 1770,9 48,2 51,8
Numărul populaţiei stabile pe medii, la 1 ianuarie Численность постоянного населения по типу местности, на 1 января
Number of the resident population by area, as of January, 1
Numărul populaţiei, mii persoane Численность населения, тыс. человек
Number of population, thou. persons
În % faţă de total В % к итогу
In % to the total Anii Годы Years total
всего total
urban городское
urban
rural cельское
rural
urban городское
urban
rural cельское
rural 2001 3635,1 1486,4 2148,7 40,9 59,1 2002 3627,8 1485,2 2142,6 40,9 59,1 2003 3618,3 1484,1 2134,2 41,0 59,0 2004 3607,4 1477,9 2129,5 41,0 59,0 2005 3600,4 1476,0 2124,4 41,0 59,0 2006 3589,9 1469,8 2120,1 40,9 59,1 2007 3581,1 1478,0 2103,1 41,3 58,7 2008 3572,7 1476,1 2096,6 41,3 58,7 2009 3567,5 1476,1 2091,4 41,4 58,6

8
Numărul populaţiei stabile pe sexe, la 1 ianuarie Численность постоянного населения по полу, на 1 января
Number of the resident population by sex, as of January, 1
Numărul populaţiei, mii persoane Численность населения, тыс. человек
Number of population, thou. persons
În % faţă de total В % к итогу
In % to the total Anii Годы Years total
всего total
masculin мужчины
male
feminin женщины
female
masculin мужчины
male
feminin женщины
female 2001 3635,1 1740,6 1894,5 47,9 52,1
2002 3627,8 1737,5 1890,3 47,9 52,1
2003 3618,3 1733,3 1885,0 47,9 52,1
2004 3607,4 1728,4 1879,0 47,9 52,1
2005 3600,4 1724,8 1875,6 47,9 52,1
2006 3589,9 1719,3 1870,6 47,9 52,1
2007 3581,1 1721,0 1860,1 48,1 51,9
2008 3572,7 1717,5 1855,2 48,1 51,9
2009 3567,5 1714,9 1852,6 48,1 51,9
Numărul populaţiei stabile pe vîrste şi sexe, la 1 ianuarie 2009 Численность постоянного населения по возрасту и полу, на 1 января 2009 года
Number of the resident population by age and sex, as of January 1, 2009
Vîrsta, ani
Возраст, лет Age, years
010203040 0 10 20 30 40
În vîrstă aptă de muncă / В трудоспособном возрасте / Of working age În vîrstă inaptă de muncă / В нетрудоспособном / Non – working age
85+
80
75
70
65
60
55
50
45
40
35
30
25
20
15
10
5
0
mii / тысяч / thousand mii / тысяч / thousand
Masculin / Мужчины / Men
Feminin / Женщины / Women

9
Populaţia stabilă pe grupe de vîrstă şi sexe, la 1 ianuarie Постоянное население по возрастным группам и полу, на 1 января
Resident population by age group and sex, as of January, 1
persoane / человек / persons
2008 2009
Grupa de vîrstă, ani
Возрастная группа, лет Age group, years
Ambele sexe
Оба пола Both sexes
Bărbaţi
Мужчины Male
Femei
Женщины Female
Ambele sexe
Оба пола Both sexes
Bărbaţi
Мужчины Male
Femei
Женщины Female
Total / Всего / Total 3572703 1717459 1855244 3567512 1714931 1852581
din care: в том числе: of which:
0-4 186033 95879 90154 188420 96981 91439
5 – 9 191792 98446 93346 187085 96135 90950
10 – 14 250035 127383 122652 233916 119281 114635
15 – 19 327472 166383 161089 311371 158489 152882
20 – 24 352983 179330 173653 359072 182437 176635
25 – 29 296669 150473 146196 305936 155389 150547
30 – 34 258136 128727 129409 263607 131741 131866
35 – 39 231013 113608 117405 233245 114822 118423
40 – 44 239429 115240 124189 232865 112349 120516
45 – 49 284708 135133 149575 278555 132256 146299
50 – 54 253117 118349 134768 258964 120754 138210
55 – 59 212879 96683 116196 223987 101552 122435
60 – 64 119442 52627 66815 124959 55078 69881
65 – 69 125242 51231 74011 120120 49295 70825
70 – 74 100880 39228 61652 102908 39793 63115
75 – 79 78219 28657 49562 74471 27246 47225
80 – 84 42582 13450 29132 44858 14275 30583
85 + 22072 6632 15440 23173 7058 16115
Din total – populaţie: Из общей численности – население: At total number – population
0-15 687095 351918 335177 666223 341338 324885
16-56/61 2355459 1197080 1158379 2364603 1206443 1158160
57/62 + 530149 168461 361688 536686 167150 369536

10
Coeficientul îmbătrînirii populaţiei (numărul persoanelor în vîrstă de 60 ani şi peste la 100 locuitori)
Коэффициент старения населения (число лиц в возрасте 60 лет и старше на 100 жителей)
Ageing factor of population (number of persons aged 60 years and over per 100 inhabitants)
2001 2002 2003 2004 2005 2006 2007 2008
Total 13,6 13,9 13,9 13,8 13,6 13,2 13,7 13,7 Bărbaţi 11,2 11,4 11,4 11,2 11,0 10,7 11,2 11,2 Femei 15,9 16,2 16,2 16,1 15,9 15,6 16,0 16,0 Urban 11,2 11,6 11,8 11,8 11,8 11,8 11,6 12,0 Bărbaţi 9,2 9,6 9,8 9,8 9,9 9,8 9,7 10,1 Femei 13,1 13,5 13,6 13,6 13,6 13,6 13,3 13,7 Rural 15,3 15,5 15,4 15,2 14,8 14,3 15,2 14,9 Bărbaţi 12,5 12,7 12,5 12,2 11,8 11,3 12,2 11,9 Femei 17,8 18,0 18,0 17,8 17,5 17,0 18,0 17,7
Structura populaţiei stabile pe principalele grupe de vîrstă,
sexe şi medii, la 1 ianuarie 2009 Структура постоянного населения по основным возрастным группам,
полу и типу местности, на 1 января 2009 года Structure of the resident population by main age groups, sex and area, as of January 1, 2009
Total Urban Rural Всего Городское Сельское Total Urban Rural
19,9 17,5
70,462,5
9,720,0
0%
10%
20%
30%
40%
50%
60%
70%
80%
90%
100%
17,3 14,4
74,167,7
8,617,9
0%
10%
20%
30%
40%
50%
60%
70%
80%
90%
100%
21,7 19,8
58,767,0
21,510,5
0%
10%
20%
30%
40%
50%
60%
70%
80%
90%
100%
Bărbaţi Femei Мужчины Женщины Men Women
Bărbaţi Femei Мужчины Женщины
Men Women
Bărbaţi Femei Мужчины Женщины Men Women
Peste vîrsta aptă de muncă В возрасте старше трудоспособного Over working age
În vîrstă aptă de muncă В трудоспособном возрасте Of working age
Sub vîrsta apta de munca В возрасте старше трудоспособного Under working age

11
Populaţia pe unele grupe de vîrstă, în profil teritorial, la 1 ianuarie 2009 Население по отдельным возрастным группам, в территориальном разрезе, на 1 января 2009 года
Population by separate age groups, in territorial aspect, as of January 1, 2009
Persoane / Человек / Persons În % / В % / In % Denumirea U.A.T. Наименование А.Т.Е. Denomination of A.T.U.
Total Всего Total
0-15 16-56/61 57/62+ 0-15 16-56/61 57/62+
Total / Всего / Total 3567512 666223 2364603 536686 18,7 66,3 15,0
Municipiul Chişinău 785600 118089 569556 97955 15,0 72,5 12,5
Nord / Север / North 1013717 185256 633667 194794 18,3 62,5 19,2
Municipiul Bălţi 148100 22781 103517 21802 15,4 69,9 14,7
Briceni 76201 13628 45368 17205 17,9 59,5 22,6
Donduşeni 45902 7821 26411 11670 17,1 57,5 25,4
Drochia 91000 16325 54187 20488 17,9 59,6 22,5
Edineţ 83600 14643 50343 18614 17,5 60,2 22,3
Făleşti 93102 19155 57653 16294 20,6 61,9 17,5
Floreşti 91000 17061 56973 16966 18,8 62,6 18,6
Glodeni 62502 12162 38540 11800 19,4 61,7 18,9
Ocniţa 56502 9011 35710 11781 15,9 63,2 20,9
Rîşcani 70900 13045 42456 15399 18,4 59,9 21,7
Sîngerei 93800 20806 58584 14410 22,2 62,5 15,4
Soroca 101108 18818 63925 18365 18,6 63,2 18,2
Centru / Центр / Center 1065194 219513 700067 145614 20,6 65,7 13,7
Anenii Noi 83100 16267 55934 10899 19,6 67,3 13,1
Călăraşi 79302 15798 51170 12334 19,9 64,5 15,6
Criuleni 72800 15397 48425 8978 21,2 66,5 12,3
Dubăsari 35200 6849 23514 4837 19,5 66,8 13,7
Hînceşti 123200 25991 80568 16641 21,1 65,4 13,5
Ialoveni 98300 20370 66826 11104 20,7 68,0 11,3
Nisporeni 67199 14728 43578 8893 21,9 64,9 13,2
Orhei 125900 24373 83759 17768 19,4 66,5 14,1
Rezina 53000 10285 34892 7823 19,4 65,8 14,8
Străşeni 91493 18517 61082 11894 20,2 66,8 13,0
Şoldăneşti 43800 9375 26936 7489 21,4 61,5 17,1
Teleneşti 74700 16915 47520 10265 22,7 63,6 13,7
Ungheni 117200 24648 75863 16689 21,0 64,7 14,2
Sud / Юг / South 543101 111956 355102 76043 20,6 65,4 14,0
Basarabeasca 29500 5874 19739 3887 19,9 66,9 13,2
Cahul 124400 24910 82368 17122 20,0 66,2 13,8
Cantemir 63200 14168 41091 7941 22,4 65,0 12,6
Căuşeni 92700 19188 60145 13367 20,7 64,9 14,4
Cimişlia 62601 12786 40880 8935 20,4 65,3 14,3
Leova 53800 11193 35539 7068 20,8 66,1 13,1
Ştefan Vodă 72400 15505 46382 10513 21,4 64,1 14,5
Taraclia 44500 8332 28958 7210 18,7 65,1 16,2
U.T.A. Găgăuzia 159900 31409 106211 22280 19,7 66,4 13,9

12
Persoane / Человек / Persons În % / В % / In % Denumirea U.A.T. Наименование А.Т.Е. Denomination of A.T.U. 0-14 15-59 60+ 0-14 15-59 60+
Total / Всего / Total 609421 2467602 490489 17,1 69,2 13,7
Municipiul Chişinău 108211 588402 88987 13,8 74,9 11,3
Nord / Север / North 169542 663165 181010 16,7 65,4 17,9
Municipiul Bălţi 20996 107503 19601 14,2 72,6 13,2
Briceni 12575 47417 16209 16,5 62,2 21,3
Donduşeni 7161 27647 11094 15,6 60,2 24,2
Drochia 14973 56779 19248 16,5 62,4 21,1
Edineţ 13427 52613 17560 16,1 62,9 21,0
Făleşti 17510 60472 15120 18,8 65,0 16,2
Floreşti 15464 59898 15638 17,0 65,8 17,2
Glodeni 11078 40700 10724 17,7 65,1 17,2
Ocniţa 8229 37118 11155 14,6 65,7 19,7
Rîşcani 11897 44616 14387 16,8 62,9 20,3
Sîngerei 19014 61646 13140 20,3 65,7 14,0
Soroca 17218 66756 17134 17,1 66,0 16,9
Centru / Центр / Center 200753 732981 131460 18,9 68,8 12,3
Anenii Noi 14944 58277 9879 18,0 70,1 11,9
Călăraşi 14328 53689 11285 18,1 67,7 14,2
Criuleni 14088 50789 7923 19,3 69,8 10,9
Dubăsari 6273 24606 4321 17,8 69,9 12,3
Hînceşti 23814 84175 15211 19,3 68,3 12,4
Ialoveni 18765 69880 9655 19,1 71,1 9,8
Nisporeni 13435 45654 8110 20,0 67,9 12,1
Orhei 22295 87634 15971 17,7 69,6 12,7
Rezina 9340 36561 7099 17,6 69,0 13,4
Străşeni 16984 63735 10774 18,5 69,7 11,8
Şoldăneşti 8538 28288 6974 19,5 64,6 15,9
Teleneşti 15388 50016 9296 20,6 67,0 12,4
Ungheni 22561 79677 14962 19,2 67,98 12,77
Sud / Юг / South 102142 371971 68988 18,8 68,5 12,7
Basarabeasca 5325 20714 3461 18,1 70,2 11,7
Cahul 22824 86154 15422 18,3 69,3 12,4
Cantemir 12848 43122 7230 20,3 68,2 11,5
Căuşeni 17582 62933 12185 19,0 67,9 13,1
Cimişlia 11575 42853 8173 18,5 68,4 13,1
Leova 10208 37152 6440 19,0 69,0 12,0
Ştefan Vodă 14162 48723 9515 19,6 67,3 13,1
Taraclia 7618 30320 6562 17,1 68,1 14,8
U.T.A. Găgăuzia 28773 111083 20044 18,0 69,5 12,5

13
Indicii sarcinii demografice şi îmbătrînirii populaţiei Индексы демографической нагрузки и старения населения
Indices of demographic dependence and demographic ageing of population
Numărul copiilor în vîrstă 0-14 ani şi al bătrînilor în vîrstă de 60 ani şi peste la 100 persoane în vîrstă de 15-59 ani
Численность детей в возрасте 0-14 лет и пожилых людей и возрасте 60 лет и старше на 100 человек в возрасте 15-59 лет
Number of children aged 0-14 years and old people aged 60 years and over per 100 persons aged 15-59 years
Inclusiv in vîrstă: в том числе в возрасте:
Including, aged:
Denumirea U.A.T.
Наименование А.Т.Е. Denomination of A.T.U.
Total / Всего / Total 0-14 60+
Numărul populaţiei în
vîrstă de 60 ani şi peste la 100 copii în vîrstă 0-14 ani
Численность населения в возрасте 60 лет и старше на 100 детей в возрасте 0-14
лет Number of population
aged 60 years and over per 100 children aged 0-14
years
Total -Всего 44,6 24,7 19,9 80,5 Mun.Chişinău 33,5 18,4 15,1 82,2 Nord / Север / North 52,9 25,6 27,3 106,8 Mun. Bălţi 37,8 19,5 18,2 93,4 Briceni 60,7 26,5 34,2 128,9 Donduşeni 66,0 25,9 40,1 154,9 Drochia 60,3 26,4 33,9 128,6 Edineţ 58,9 25,5 33,4 130,8 Făleşti 54,0 29,0 25,0 86,4 Floreşti 51,9 25,8 26,1 101,1 Glodeni 53,6 27,2 26,3 96,8 Ocniţa 52,2 22,2 30,1 135,6 Rîşcani 58,9 26,7 32,2 120,9 Sîngerei 52,2 30,8 21,3 69,1 Soroca 51,5 25,8 25,7 99,5 Centru / Центр / Center 45,3 27,4 17,9 65,5 Anenii Noi 42,6 25,6 17,0 66,1 Calaraşi 47,7 26,7 21,0 78,8 Criuleni 43,3 27,7 15,6 56,2 Dubăsari 43,1 25,5 17,6 68,9 Hînceşti 46,4 28,3 18,1 63,9 Ialoveni 40,7 26,9 13,8 51,5 Nisporeni 47,2 29,4 17,8 60,4 Orhei 43,7 25,4 18,2 71,6 Rezina 45,0 25,5 19,4 76,0 Străşeni 43,6 26,6 16,9 63,4 Şoldăneşti 54,8 30,2 24,7 81,7 Teleneşti 49,4 30,8 18,6 60,4 Ungheni 47,1 28,3 18,8 66,3 Sud / Юг / South 46,0 27,5 18,5 67,5 Basarabeasca 42,4 25,7 16,7 65,0 Cahul 44,4 26,5 17,9 67,6 Cantemir 46,6 29,8 16,8 56,3 Căuşeni 47,3 27,9 19,4 69,3 Cimişlia 46,1 27,0 19,1 70,6 Leova 44,8 27,5 17,3 63,1 Ştefan Vodă 48,6 29,1 19,5 67,2 Taraclia 46,8 25,1 21,6 86,1 U.T.A.Găgăuzia 43,9 25,9 18,0 69,7

14
Populaţia în profil teritorial, la 1 ianuarie 2009 Население в территориальном разрезе, на 1 января 2009 года
Population in the territorial aspect, as of January 1, 2009
mii persoane / тысяч человек / thousand persons
inclusiv: в том числе:
including:
inclusiv: в том числе:
including: Denumirea U.A.T. Наименование А.Т.Е. Denomination of A.T.U.
Total populaţie stabilă
Постоянное население – всего
Total resident population
urbană городское
urban
rurală сельское
rural
Total populaţie prezentă
Наличное населе-ние – всего Total present
population
urbană городское
urban
rurală сельское
rural
Total / Всего / Total 3567,5 1476,1 2091,4 3419,4 1358,0 2061,4
Mun. Chişinău 785,6 717,0 68,6 755,9 686,5 69,4
Nord / Север / North 1013,7 354,5 659,2 961,7 313,2 648,5
Mun. Bălţi 148,1 143,2 4,9 127,0 122,1 4,9
Briceni 76,2 15,4 60,8 76,0 14,0 62,0
Donduşeni 45,9 10,7 35,2 44,7 9,6 35,1
Drochia 91,0 20,3 70,7 86,0 17,4 68,6
Edineţ 83,6 26,0 57,6 81,9 25,6 56,3
Făleşti 93,1 16,6 76,5 89,3 14,1 75,2
Floreşti 91,0 19,2 71,8 87,2 17,0 70,2
Glodeni 62,5 11,7 50,8 59,7 10,3 49,4
Ocniţa 56,5 19,5 37,0 55,2 19,1 36,1
Rîşcani 70,9 15,9 55,0 68,0 13,3 54,7
Sîngerei 93,8 18,8 75,0 87,1 15,7 71,4
Soroca 101,1 37,2 63,9 99,6 35,0 64,6
Centru / Центр / Center 1065,2 204,3 860,9 1022,4 178,1 844,3
Anenii Noi 83,1 8,6 74,5 82,3 8,3 74,0
Călăraşi 79,3 16,0 63,3 74,0 14,3 59,7
Criuleni 72,8 8,3 64,5 72,0 7,1 64,9
Dubăsari 35,2 − 35,2 35,0 35,0
Hînceşti 123,2 16,8 106,4 119,2 15,2 104,0
Ialoveni 98,3 15,2 83,1 98,4 15,2 83,2
Nisporeni 67,2 14,7 52,5 64,8 11,9 52,9
Orhei 125,9 33,2 92,7 115,3 25,5 89,8
Rezina 53,0 13,5 39,5 50,5 12,7 37,8
Străşeni 91,5 21,6 69,9 88,8 19,6 69,2
Şoldăneşti 43,8 7,6 36,2 41,5 6,3 35,2
Teleneşti 74,7 8,2 66,5 69,9 6,7 63,2
Ungheni 117,2 40,6 76,6 110,7 35,3 75,4
Sud / Юг / South 543,1 136 407,1 523,9 122,1 401,8
Basarabeasca 29,5 12,5 17,0 28,8 11,2 17,6
Cahul 124,4 39,4 85,0 118,9 35,5 83,4
Cantemir 63,2 6,0 57,2 61,4 5,2 56,2
Căuşeni 92,7 24,5 68,2 89,9 21,7 68,2
Cimişlia 62,6 14,2 48,4 60,2 12,7 47,5
Leova 53,8 15,7 38,1 51,8 14,4 37,4
Ştefan Vodă 72,4 8,7 63,7 70,3 7,8 62,5
Taraclia 44,5 15,0 29,5 42,6 13,6 29,0
U.T.A. Găgăuzia 159,9 64,3 95,6 155,5 58,1 97,4

15
MIŞCAREA NATURALĂ A POPULAŢIEI ЕСТЕСТВЕННОЕ ДВИЖЕНИЕ НАСЕЛЕНИЯ
VITAL STATISTICS
Născuţi-vii, decedaţi şi sporul natural al populaţiei Родившиеся, умершие и естественный прирост населения
Live-births, deceased and natural increase of the population
Total, persoane Всего, человек Total, persons
La 1000 locuitori На 1000 человек населения
Per 1000 inhabitants Anii Годы Years Născuţi-vii
Родившиеся Live-births
Decedaţi Умершие Deceased
Spor natural Естест-венный прирост Natural
increase
Decedaţi sub un an
Умершие в воз-расте до 1 года
Infant deaths
Născuţi-vii Родившиеся
Live-births
Decedaţi Умершие Deceased
Spor natural Естест-венный прирост Natural
increase
Decedaţi sub un an la 1000 năs-
cuţi-vii Умершие в возрасте до
1 года на 1000 родившихся
Infant deaths per 1000 live-births
Total / Всего / Total
2001 36448 40075 -3627 597 10,0 11,0 -1,0 16,3
2002 35705 41852 -6147 528 9,9 11,6 -1,7 14,7
2003 36471 43079 -6608 522 10,1 11,9 -1,8 14,4
2004 38272 41668 -3396 464 10,6 11,6 -1,0 12,2
2005 37695 44689 -6994 468 10,5 12,4 -1,9 12,4
2006 37587 43137 -5550 442 10,5 12,0 -1,5 11,8
2007 37973 43050 -5077 428 10,6 12,0 -1,4 11,3
2008 39018 41948 -2930 473 10,9 11,8 -0,9 12,2
Mediul urban / Городская местность / Urban
2001 12542 12844 -302 212 8,4 8,6 -0,2 16,9
2002 12747 13229 -482 192 8,5 8,8 -0,3 15,1
2003 12788 13650 -862 178 8,6 9,1 -0,5 13,9
2004 14060 13319 741 167 9,4 8,9 0,5 12,0
2005 13583 14199 -616 177 9,1 9,5 -0,4 13,0
2006 13579 13764 -185 177 9,2 9,3 -0,1 13,0
2007 13679 13855 -176 141 9,3 9,4 -0,1 10,3
2008 14288 13463 825 159 9,7 9,1 0,6 11,2
Mediul rural / Сельская местность / Rural
2001 23906 27231 -3325 385 11,2 12,8 -1,6 16,0
2002 22958 28623 -5665 336 10,8 13,5 -2,7 14,4
2003 23683 29429 -5746 344 11,2 13,9 -2,7 14,6
2004 24212 28349 -4137 297 11,5 13,4 -1,9 12,3
2005 24112 30490 -6378 291 11,5 14,5 -3,0 12,1
2006 24008 29373 -5365 265 11,4 14,0 -2,6 11,0
2007 24294 29195 -4901 287 11,6 13,9 -2,3 11,8
2008 24730 28485 -3755 314 11,8 13,6 -1,8 12,7

16
Ratele de natalitate şi mortalitate, pe medii Коэффициенты рождаемости и смертности по типу местности
Birth rate and mortality rate, by area
8,4 8,59,4 9,1 9,2 9,3 9,7
11,210,8
11,2 11,5 11,5 11,4 11,6 11,8
8,69,19,3 9,49,5
8,99,18,88,6
13,613,914,014,5
13,413,913,5
12,8
0
2
4
6
8
10
12
14
16
2001 2002 2003 2004 2005 2006 2007 2008
Rata natalităţii – urban Коэффициент рождаемости - городBirth rate – urban
Rata natalităţii - rural Коэффициент рождаемость – село Birth rate - rural
Rata mortalităţii – urban Коэффициент смертость - город Mortality rate - urban
Rata mortalităţii - rural Коэффициент смертость – село Mortality rate - rural

17
Născuţi-vii, decedaţi şi sporul natural al populaţiei, în profil teritorial Родившиеся, умершие и естественный прирост населения,
в территориальном разрезе Live-births, deceased and population natural increase, in territorial aspect
Total, persoane Всего, человек Total, persons
La 1000 locuitori На 1000 человек населения
Per 1000 inhabitants
Anii Годы Years Născuţi-vii
Родившиеся Live-births
Decedaţi Умершие Deceased
Spor natural Естест-венный прирост
Natural increase
Decedaţi sub un an
Умершие в воз-расте до
1 года Infant deaths
Născuţi-vii Родившиеся
Live-births
Decedaţi Умершие Deceased
Spor natural Естест-венный прирост
Natural increase
Decedaţi sub un an la 1000
născuţi-vii Умершие в возрасте до
1 года на 1000 родившихсяInfant deaths per 1000 live-
births Municipiul Chişinău 2005 7170 6743 427 70 9,2 8,7 0,5 9,7 2006 7250 6367 883 79 9,3 8,2 1,1 10,9 2007 7260 6555 705 57 9,3 8,4 0,9 7,7 2008 7846 6387 1459 73 10,0 8,1 1,9 9,4 Municipiul Bălţi 2005 1367 1530 -163 20 9,2 10,3 -1,1 14,4 2006 1356 1525 -169 11 9,2 10,3 -1,1 8,1 2007 1404 1509 -105 10 9,5 10,2 -0,7 7,1 2008 1459 1553 -94 17 9,9 10,5 -0,6 11,7 Anenii Noi 2005 932 1076 -144 7 11,2 12,9 -1,7 7,8 2006 882 1056 -174 15 10,6 12,7 -2,1 16,8 2007 914 969 -55 12 11 11,7 -0,7 13,3 2008 989 1006 -17 12 11,9 12,1 -0,2 12,3 Basarabeasca 2005 294 385 -91 6 9,9 13,0 -3,1 20,4 2006 299 414 -115 5 10,1 14,0 -3,9 16,7 2007 319 388 -69 5 10,8 13,1 -2,3 15,9 2008 294 335 -41 3 10,0 11,4 -1,4 10,2 Briceni 2005 753 1307 -554 10 9,7 16,9 -7,2 13,3 2006 766 1307 -541 12 9,9 17,0 -7,1 15,7 2007 752 1228 -476 11 9,8 16,0 -6,2 14,6 2008 768 1209 -441 9 10,1 15,8 -5,7 11,8 Cahul 2005 1384 1356 28 19 11,0 10,8 0,2 13,9 2006 1361 1418 -57 18 10,9 11,4 -0,5 13,2 2007 1328 1355 -27 17 10,7 10,9 -0,2 12,7 2008 1390 1297 93 11 11,2 10,5 0,7 8,1 Cantemir 2005 818 687 131 10 12,7 10,7 2,0 12,4 2006 759 716 43 6 11,9 11,2 0,7 7,9 2007 746 729 17 7 11,8 11,5 0,3 9,4 2008 741 742 -1 12 11,7 11,7 0,0 16,1 Călăraşi 2005 907 1235 -328 18 11,3 15,3 -4,0 20,3 2006 857 1121 -264 11 10,7 14,0 -3,3 12,7 2007 877 1192 -315 6 11,0 14,9 -3,9 6,9 2008 792 1058 -266 8 10,0 13,3 -3,3 10,0 Căuşeni 2005 1059 1263 -204 7 11,3 13,5 -2,2 6,5 2006 1053 1214 -161 11 11,3 13,0 -1,7 10,4 2007 1065 1297 -232 11 11,4 13,9 -2,5 10,4 2008 1073 1223 -150 10 11,6 13,2 -1,6 9,3 Cimişlia 2005 640 835 -195 10 9,9 12,9 -3,0 15,6 2006 556 807 -251 3 8,7 12,6 -3,9 5,2 2007 526 781 -255 3 8,3 12,3 -4,0 5,6 2008 527 794 -267 5 8,4 12,7 -4,3 9,5 Criuleni 2005 881 1001 -120 13 12,1 13,7 -1,6 14,8 2006 871 918 -47 11 12,0 12,6 -0,6 12,6 2007 962 942 20 10 13,2 12,9 0,3 10,5

18
Total, persoane Всего, человек Total, persons
La 1000 locuitori На 1000 человек населения
Per 1000 inhabitants
Anii Годы Years Născuţi-vii
Родившиеся Live-births
Decedaţi Умершие Deceased
Spor natural Естест-венный прирост
Natural increase
Decedaţi sub un an
Умершие в воз-расте до
1 года Infant deaths
Născuţi-vii Родившиеся
Live-births
Decedaţi Умершие Deceased
Spor natural Естест-венный прирост
Natural increase
Decedaţi sub un an la 1000
născuţi-vii Умершие в возрасте до
1 года на 1000 родившихсяInfant deaths per 1000 live-
births 2008 989 946 43 8 13,6 13,0 0,6 8,1 Donduşeni 2005 418 811 -393 5 8,9 17,3 -8,4 12,0 2006 405 895 -490 8 8,7 19,1 -10,4 19,8 2007 387 804 -417 4 8,3 17,2 -8,9 10,2 2008 394 811 -417 2 8,5 17,6 -9,1 5,1 Drochia 2005 851 1392 -541 12 9,1 14,9 -5,8 14,0 2006 842 1316 -474 10 9,1 14,2 -5,1 11,9 2007 849 1374 -525 6 9,2 14,9 -5,7 7,1 2008 934 1331 -397 10 10,2 14,6 -4,4 11,4 Dubăsari 2005 355 562 -207 3 10,0 15,8 -5,8 8,5 2006 374 513 -139 4 10,6 14,5 -3,9 11,1 2007 372 496 -124 6 10,5 14,1 -3,6 16,1 2008 421 435 -14 5 12,0 12,4 -0,4 11,9 Edineţ 2005 794 1379 -585 11 9,3 16,2 -6,9 13,8 2006 837 1316 -479 20 9,9 15,6 -5,7 24,1 2007 759 1316 -557 14 9,0 15,6 -6,6 18,3 2008 888 1229 -341 14 10,6 14,7 -4,1 16,2 Făleşti 2005 1065 1314 -249 20 11,2 13,8 -2,6 18,8 2006 1039 1280 -241 15 11,0 13,6 -2,6 14,4 2007 1087 1313 -226 16 11,6 14,0 -2,4 14,9 2008 1039 1346 -307 17 11,1 14,4 -3,3 16,3 Floreşti 2005 882 1518 -636 8 9,5 16,4 -6,9 8,9 2006 963 1468 -505 8 10,4 15,9 -5,5 8,7 2007 963 1422 -459 13 10,5 15,5 -5,0 13,5 2008 928 1356 -428 13 10,2 14,9 -4,7 13,9 Glodeni 2005 586 893 -307 9 9,2 14,0 -4,8 15,1 2006 656 974 -318 4 10,3 15,3 -5,0 6,1 2007 602 911 -309 5 9,5 14,4 -4,9 8,0 2008 611 865 -254 7 9,7 13,8 -4,1 11,5 Hînceşti 2005 1449 1552 -103 23 11,5 12,3 -0,8 15,6 2006 1418 1532 -114 20 11,4 12,3 -0,9 14,1 2007 1452 1553 -101 23 11,7 12,5 -0,8 15,9 2008 1314 1465 -151 17 10,7 11,9 -1,2 12,6 Ialoveni 2005 1230 1108 122 14 12,8 11,6 1,2 11,5 2006 1296 1051 245 17 13,4 10,8 2,6 13,2 2007 1313 1064 249 15 13,4 10,9 2,5 11,4 2008 1336 1117 219 18 13,6 11,4 2,2 13,5 Leova 2005 647 676 -29 10 11,9 12,4 -0,5 15,8 2006 584 614 -30 2 10,7 11,3 -0,6 3,4 2007 635 641 -6 10 11,7 11,8 -0,1 15,9 2008 617 651 -34 8 11,5 12,1 -0,6 12,9 Nisporeni 2005 796 856 -60 14 11,6 12,5 -0,9 17,5 2006 791 806 -15 15 11,6 11,8 -0,2 18,9 2007 791 795 -4 9 11,7 11,8 -0,1 11,4 2008 800 806 -6 10 11,9 12,0 -0,1 12,5 Ocniţa 2005 477 913 -436 8 8,6 16,4 -7,8 16,7 2006 445 898 -453 5 7,9 15,9 -8,0 11,1 2007 488 858 -370 6 8,6 15,1 -6,5 12,5 2008 538 868 -330 2 9,5 15,3 -5,8 3,9

19
Total, persoane Всего, человек Total, persons
La 1000 locuitori На 1000 человек населения
Per 1000 inhabitants
Anii Годы Years Născuţi-vii
Родившиеся Live-births
Decedaţi Умершие Deceased
Spor natural Естест-венный прирост
Natural increase
Decedaţi sub un an
Умершие в воз-расте до
1 года Infant deaths
Născuţi-vii Родившиеся
Live-births
Decedaţi Умершие Deceased
Spor natural Естест-венный прирост
Natural increase
Decedaţi sub un an la 1000
născuţi-vii Умершие в возрасте до
1 года на 1000 родившихсяInfant deaths per 1000 live-
births Orhei 2005 1339 1734 -395 17 10,3 13,4 -3,1 12,7 2006 1417 1620 -203 13 11,1 12,7 -1,6 9,3 2007 1431 1597 -166 20 11,3 12,7 -1,4 14,0 2008 1490 1585 -95 21 11,8 12,6 -0,8 14,2 Rezina 2005 562 779 -217 5 10,5 14,6 -4,1 8,8 2006 545 755 -210 8 10,2 14,1 -3,9 14,5 2007 574 764 -190 8 10,8 14,3 -3,5 14,0 2008 602 725 -123 18 11,3 13,7 -2,4 30,1 Rîşcani 2005 712 1171 -459 10 9,9 16,3 -6,4 14,1 2006 684 1118 -434 8 9,5 15,6 -6,1 11,7 2007 690 1098 -408 5 9,6 15,3 -5,7 7,3 2008 693 1041 -348 11 9,8 14,6 -4,8 15,9 Sîngerei 2005 1071 1108 -37 15 11,2 11,6 -0,4 14,0 2006 1061 1057 4 11 11,2 11,1 0,1 10,4 2007 1096 1062 34 15 11,6 11,3 0,3 13,8 2008 1078 1083 -5 18 11,5 11,5 0,0 16,7 Soroca 2005 927 1477 -550 7 9,1 14,5 -5,4 7,5 2006 940 1422 -482 6 9,3 14,0 -4,7 6,4 2007 922 1469 -547 13 9,1 14,5 -5,4 14,1 2008 955 1311 -356 11 9,4 12,9 -3,5 11,6 Străşeni 2005 1090 1203 -113 13 11,9 13,1 -1,2 11,9 2006 1129 1082 47 12 12,3 11,8 0,5 10,7 2007 1179 1138 41 11 12,9 12,4 0,5 9,5 2008 1158 1155 3 17 12,7 12,6 0,1 14,7 Şoldăneşti 2005 477 752 -275 12 10,7 16,8 -6,1 25,0 2006 502 757 -255 7 11,3 17,0 -5,7 13,9 2007 495 664 -169 5 11,2 15,0 -3,8 10,1 2008 457 654 -197 5 10,4 14,9 -4,5 10,9 Ştefan Vodă 2005 884 972 -88 11 12,0 13,2 -1,2 12,6 2006 833 952 -119 12 11,4 13,0 -1,6 14,3 2007 879 926 -47 11 12,1 12,7 -0,6 12,5 2008 900 904 -4 17 12,4 12,5 -0,1 19,0 Taraclia 2005 478 638 -160 4 10,6 14,2 -3,6 8,4 2006 443 603 -160 2 9,9 13,4 -3,5 4,5 2007 440 609 -169 6 9,8 13,6 -3,8 13,6 2008 472 587 -115 5 10,6 13,2 -2,6 10,6 Teleneşti 2005 872 948 -76 11 11,5 12,5 -1,0 12,6 2006 866 924 -58 10 11,5 12,2 -0,7 11,5 2007 866 863 3 13 11,5 11,5 0,0 15,0 2008 873 883 -10 10 11,7 11,8 -0,1 11,5 Ungheni 2005 1372 1552 -180 20 11,5 13,0 -1,5 14,4 2006 1414 1423 -9 17 12,0 12,0 0,0 12,1 2007 1425 1377 48 17 12,2 11,7 0,5 11,9 2008 1453 1389 64 21 12,4 11,9 0,5 14,9 Găgăuzia 2005 1921 1922 -1 12 12,1 12,1 0,0 6,3 2006 1873 1850 23 25 11,8 11,6 0,2 13,3 2007 1903 1961 -58 24 11,9 12,3 -0,4 12,7 2008 1979 1749 230 23 12,4 10,9 1,5 11,7

20
Rata totală de fertilitate Суммарный коэффициент рождаемости
Total fertility rate
Numărul mediu de copii născuţi de o femeie pe parcursul vieţii sale fertile Среднее число детей, рожденных женщиной за свою жизнь Average number of children that would be born by a woman during her fertile lifetime
Anii Годы Years
Total Всего Total
ediul urban
Городская местностьUrban
Mediul rural
Сельская местность Rural
2001 1,249 1,021 1,419 2002 1,211 1,036 1,337 2003 1,219 1,036 1,350 2004 1,257 1,135 1,342 2005 1,219 1,094 1,301 2006 1,229 1,025 1,387 2007 1,256 0,974 1,543 2008 1,277 1,018 1,533
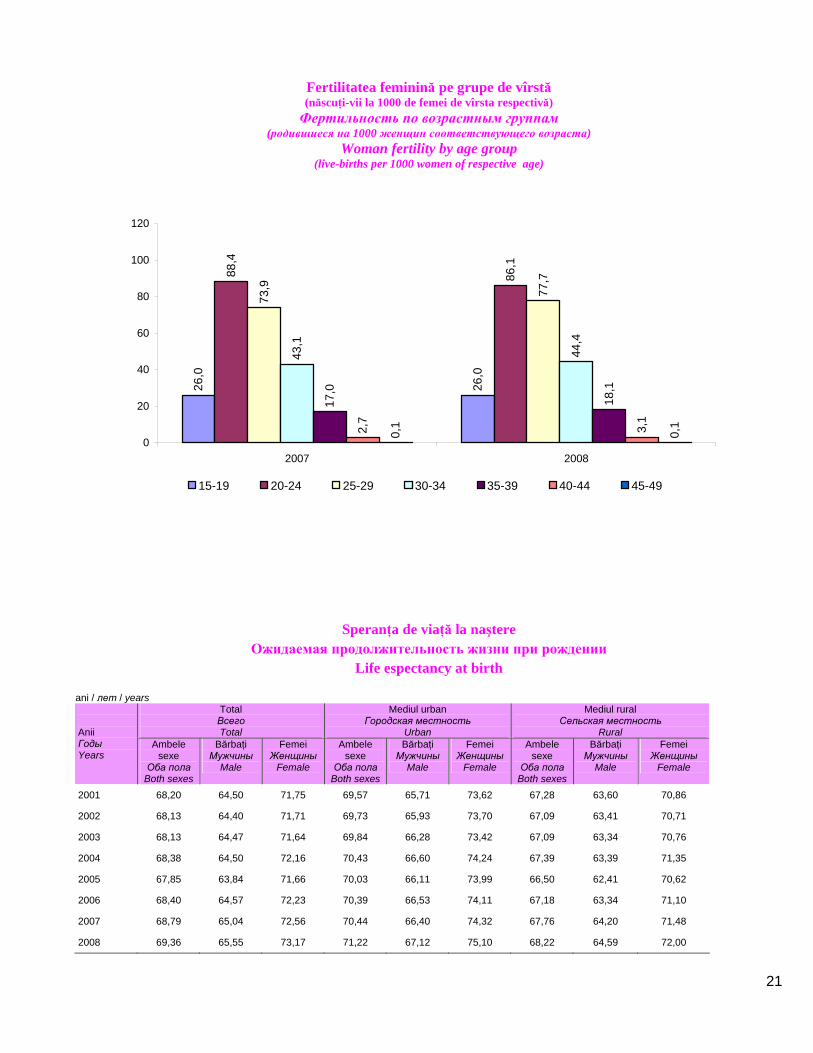
Fertilitatea feminină pe grupe de vîrstă Возрастные коэффициенты рождаемости
Woman fertility by age group
Născuţi-vii la 1000 femei de vîrsta respectivă Родившиеся живыми на 1000 женщин соответствующего возраста
Live-births per 1000 women of respective age Anii Годы Years
Total 15-49 ani
Всего 15-49 лет
Total 15-49 years
15-19 20-24 25-29 30-34 35-39 40-44 45-49
Total / Всего / Total
2001 32,50 33,57 98,08 67,44 35,99 12,02 2,64 0,15
2002 31,35 30,21 91,46 66,23 38,54 13,00 2,55 0,12
2003 35,83 29,17 89,73 67,61 40,71 13,79 2,64 0,09
2004 33,09 29,24 91,24 71,56 41,35 15,12 2,82 0,10
2005 32,59 29,01 87,23 70,77 38,24 15,91 2,47 0,19
2006 37,07 28,71 86,67 71,66 39,97 16,01 2,67 0,03
2007 37,86 26,04 88,42 73,93 43,11 16,98 2,69 0,10
2008 39,04 26,00 86,08 77,72 44,37 18,10 3,08 0,14
Mediul urban / Городская местность / Urban
2001 25,24 21,53 84,10 57,58 29,21 9,67 2,02 0,12
2002 25,35 19,79 79,73 60,86 33,35 11,19 2,12 0,11
2003 28,76 18,91 76,87 62,56 34,36 12,24 2,18 0,07
2004 27,84 18,67 82,20 72,32 37,34 13,99 2,28 0,10
2005 27,05 18,66 75,27 71,83 36,20 14,40 2,18 0,26
2006 30,07 16,87 61,06 68,83 39,96 16,07 2,20 0,01
2007 29,87 14,45 51,19 65,29 43,53 17,70 2,47 0,15
2008 31,37 14,19 49,98 69,14 47,06 19,79 3,23 0,10
Mediul rural / Сельская местность / Rural
2001 38,28 41,02 107,28 75,41 42,70 14,05 3,19 0,18
2002 36,10 36,68 98,95 70,34 43,80 14,58 2,92 0,14
2003 41,31 35,55 97,76 71,30 47,05 15,15 3,05 0,11
2004 37,16 35,82 96,82 71,03 45,15 16,12 3,29 0,10
2005 36,84 35,44 94,56 70,06 40,00 17,32 2,71 0,14
2006 42,68 36,85 107,76 73,82 39,98 15,96 3,07 0,04
2007 44,58 33,57 131,29 81,74 42,77 16,42 2,86 0,06
2008 45,47 33,57 125,33 85,57 42,21 16,75 2,96 0,16
21
Fertilitatea feminină pe grupe de vîrstă (născuţi-vii la 1000 de femei de vîrsta respectivă) Фертильность по возрастным группам
(родившиеся на 1000 женщин соответствующего возраста) Woman fertility by age group
(live-births per 1000 women of respective age)
26
,0
26,0
88,4
86,1
73,9 77
,7
43,1
44,4
17,0
18,1
2,7
3,1
0,1
0,1
0
20
40
60
80
100
120
2007 2008
15-19 20-24 25-29 30-34 35-39 40-44 45-49
Speranţa de viaţă la naştere Ожидаемая продолжительность жизни при рождении
Life espectancy at birth
ani / лет / years Total Всего Total
Mediul urban Городская местность
Urban
Mediul rural Сельская местность
Rural
Anii Годы Years
Ambele sexe
Оба пола Both sexes
Bărbaţi Мужчины
Male
Femei Женщины
Female
Ambele sexe
Оба полаBoth sexes
Bărbaţi Мужчины
Male
Femei Женщины
Female
Ambele sexe
Оба полаBoth sexes
Bărbaţi Мужчины
Male
Femei Женщины
Female
2001 68,20 64,50 71,75 69,57 65,71 73,62 67,28 63,60 70,86
2002 68,13 64,40 71,71 69,73 65,93 73,70 67,09 63,41 70,71
2003 68,13 64,47 71,64 69,84 66,28 73,42 67,09 63,34 70,76
2004 68,38 64,50 72,16 70,43 66,60 74,24 67,39 63,39 71,35
2005 67,85 63,84 71,66 70,03 66,11 73,99 66,50 62,41 70,62
2006 68,40 64,57 72,23 70,39 66,53 74,11 67,18 63,34 71,10
2007 68,79 65,04 72,56 70,44 66,40 74,32 67,76 64,20 71,48
2008 69,36 65,55 73,17 71,22 67,12 75,10 68,22 64,59 72,00

22
Speranţa de viaţă pe sexe, la anumite vîrste Ожидаемая продолжительность жизни лиц,
достигших определенного возраста Life espectancy by sex, at certain ages
anii de viaţă rămaşi / число оставшихся лет / years left
2001 2004 2005 2006 2007 2008
Bărbaţi Femei Bărbaţi Femei Bărbaţi Femei Bărbaţi Femei Bărbaţi Femei Bărbaţi Femei
Мужчи-ны
Женщи-ны
Мужчи-ны
Женщи-ны
Мужчины Женщи-ны
Мужчи-ны
Женщи-ны
Мужчины Женщи-ны
Мужчи-ны
Женщи-ны
Vîrsta Возраст
Age Men Women Men Women Men Women Men Women Men Women Men Women
0 64,50 71,75 64,50 72,16 63,84 71,66 64,57 72,23 65,04 72,56 65,55 73,17
5 61,03 68,19 60,82 68,4 59,91 67,65 60,62 68,26 61,08 68,63 61,50 69,16
10 56,20 63,31 55,95 63,48 55,02 62,77 55,75 63,34 56,18 63,68 56,60 64,22
15 51,35 58,38 51,04 58,57 50,13 57,83 50,87 58,44 51,30 58,75 51,69 59,27
20 46,56 53,49 46,24 53,68 45,33 52,91 46,07 53,55 46,50 53,89 46,89 54,36
25 41,96 48,60 41,54 48,78 40,62 48,03 41,31 48,66 41,82 49,02 42,18 49,48
30 37,38 43,75 36,92 43,93 35,99 43,18 36,71 43,80 37,21 44,20 37,52 44,64
35 32,90 39,01 32,41 39,17 31,55 38,42 32,27 39,03 32,79 39,44 33,10 39,88
40 28,72 34,33 28,23 34,50 27,36 33,76 28,09 34,33 28,52 34,77 28,82 35,18
45 24,75 29,77 24,29 29,95 23,53 29,24 24,17 29,82 24,58 30,19 24,96 30,63
50 21,06 25,41 20,65 25,54 20,02 24,93 20,62 25,47 21,00 25,82 21,26 26,27
55 17,56 21,27 17,33 21,40 16,84 20,82 17,39 21,36 17,69 21,68 17,95 22,09
60 14,50 17,60 14,08 17,53 13,79 16,97 14,36 17,62 14,84 17,98 15,08 18,34
65 11,75 14,17 11,48 14,29 11,21 13,67 11,55 14,30 11,87 14,36 12,08 14,65
70 9,33 11,01 9,22 11,19 8,92 10,58 9,30 11,17 9,67 11,32 9,85 11,55
75 7,27 8,31 7,34 8,48 7,06 7,94 7,29 8,61 7,71 8,69 7,83 8,93
80 5,36 6,08 5,46 6,21 5,32 5,55 5,71 6,51 6,13 6,54 6,16 6,72
85 3,76 4,42 4,15 4,84 4,12 3,54 4,33 4,76 4,73 4,96 4,90 5,04
90 2,41 2,94 3,42 2,99 2,77 2,51 3,18 3,53 3,70 3,59 3,84 3,75
Născuţi-vii după grupa de vîrstă a mamei Родившиеся живыми по возрасту матери
Live-births by mother’s age
Vîrsta mamei, ani Возраст матери, лет
Age of mother, years 2001 2002 2003 2004 2005 2006 2007 2008
Total / Всего / Total
Născuţi-vii – total Родившиеся живыми – всего Live-births – total
36448 35705 36471 38272 37695 37587 37973 39018
din care, la mame în vîrstă: в том числе у матерей в возрасте: of which, born by mothers aged:
Sub / до / under 16 119 81 95 75 66 71 75 64
16 – 19 5821 5355 5163 5142 4991 4811 4216 4017
20 – 24 15046 14357 14529 15247 14932 14762 15079 15076

23
Vîrsta mamei, ani Возраст матери, лет
Age of mother, years 2001 2002 2003 2004 2005 2006 2007 2008
25 – 29 9426 9541 9872 10562 10567 10536 10720 11531
30 – 34 3994 4315 4728 5061 4991 5237 5534 5797
35 – 39 1589 1636 1659 1744 1775 1815 1987 2134
40 – 44 409 392 398 408 338 350 341 377
45 – 49 21 17 13 15 29 4 15 20
50 + 3 3 4 5 4 – 3
Nedeclarată
Не указан
Not stated
20 8 10 13 2 1 3 2
În procente / В процентах / In per cent
Născuţi-vii – total
Родившиеся живыми – всего
Live-births – total
100 100 100 100 100 100 100 100
din care, la mame în vîrstă:
в том числе у матерей в возрасте:
of which, born by mothers aged:
Sub / до / under 16 0,3 0,2 0,3 0,2 0,2 0,2 0,2 0,2
16 – 19 16,0 15,0 14,2 13,4 13,2 12,8 11,2 10,3
20 – 24 41,3 40,2 39,8 39,8 39,6 39,3 39,7 38,6
25 – 29 25,9 26,7 27,1 27,6 28,0 28,0 28,2 29,5
30 – 34 11,0 12,1 13,0 13,3 13,2 14,0 14,6 14,8
35 – 39 4,4 4,6 4,5 4,6 4,7 4,8 5,2 5,5
40 – 44 1,1 1,1 1,1 1,1 1,0 0,9 0,9 1,0
45 – 49 0,0 0,1 0,0 0,0 0,1 0,0 0,0 0,1
50 + 0,0 0,0 0,0 0,0 0,0 – - -
Nedeclarată
Не указан
Not stated
0,0 0,0 0,0 0,0 0,0 0,0 0,0
0,0
Mediul urban / Городская местность / Urban
Născuţi-vii – total
Родившиеся живыми – всего
Live-births – total
12542 12747 12788 14060 13583 13579 13679 14288
din care, la mame în vîrstă:
в том числе у матерей в возрасте:
of which, born by mothers aged:
Sub / до / under 16 39 21 25 15 18 17 11 6
16 – 19 1417 1343 1281 1261 1228 1152 927 864
20 – 24 5114 4880 4780 5238 4893 4696 4673 4560
25 – 29 3598 3799 3852 4390 4314 4376 4496 4898
30 – 34 1612 1880 1994 2222 2195 2356 2505 2743
35 – 39 593 655 687 761 775 849 918 1033
40 – 44 147 153 153 154 139 132 137 176
45 – 49 8 7 5 7 18 1 10 7
50 + 1 2 2 1 1 –
Nedeclarată
Не указан
Not stated
13 7 9 11 2 – 2 1

24
Vîrsta mamei, ani Возраст матери, лет
Age of mother, years 2001 2002 2003 2004 2005 2006 2007 2008
În procente / В процентах / In per cent
Născuţi-vii – total
Родившиеся живыми – всего
Live-births – total
100 100 100 100 100 100 100 100
din care, la mame în vîrstă: в том числе у матерей в возрасте: of which, born by mothers aged:
Sub / до / under 16 0,3 0,2 0,2 0,1 0,1 0,1 0,0 0,0
16 – 19 11,3 10,5 10,0 9,0 9,1 8,5 6,8 6,1
20 – 24 40,8 38,3 37,4 37,3 36,0 34,6 34,2 31,9
25 – 29 28,7 29,7 30,1 31,2 31,8 32,2 32,9 34,3
30 – 34 12,9 14,8 15,6 15,8 16,2 17,3 18,4 19,2
35 – 39 4,7 5,1 5,4 5,4 5,7 6,3 6,7 7,2
40 – 44 1,2 1,2 1,2 1,1 1,0 1,0 1,0 1,2
45 – 49 0,0 0,1 0,0 0,0 0,1 0,0 0,1
50 + 0,0 0,0 0,0 0,0 0,0 – −
Nedeclarată Не указан Not stated
0,1 0,1 0,1 0,1 0,0 – 0,0 0,0
Mediul rural / Сельская местность / Rural Născuţi-vii – total
Родившиеся живыми – всего
Live-births – total
23906 22958 23683 24212 24112 24008 24294 24730
din care, la mame în vîrstă: в том числе у матерей в возрасте: of which, born by mothers aged:
Sub / до / under 16 80 60 70 60 48 54 64 58
16 – 19 4404 4012 3882 3881 3763 3659 3289 3153
20 – 24 9932 9477 9749 10009 10039 10066 10406 10516
25 – 29 5828 5742 6020 6172 6253 6160 6224 6633
30 – 34 2382 2435 2734 2839 2796 2881 3029 3054
35 – 39 996 981 972 983 1000 966 1069 1101
40 – 44 262 239 245 254 199 218 204 201
45 – 49 13 10 8 8 11 3 5 13
50 + 2 1 2 4 3 – 3
Nedeclarată Не указан Not stated
7 1 1 2 - 1 1 1
În procente / В процентах / In per cent
Născuţi-vii – total
Родившиеся живыми – всего
Live-births – total
100 100 100 100 100 100 100 100
din care, la mame în vîrstă: в том числе у матерей в возрасте: of which, born by mothers aged:
Sub / до / under 16 0,3 0,3 0,3 0,3 0,2 0,2 0,3 0,2
16 – 19 18,4 17,5 16,5 16,0 15,6 15,2 13,5 12,8
20 – 24 41,5 41,3 41,2 41,3 41,6 41,9 42,8 42,5
25 – 29 24,4 25,0 25,4 25,5 25,9 25,7 25,7 26,8
30 – 34 10,0 10,6 11,5 11,7 11,6 12,0 12,5 12,3
35 – 39 4,2 4,3 4,1 4,1 4,2 4,0 4,4 4,5
40 – 44 1,1 1,0 1,0 1,1 0,9 1,0 0,8 0,8
45 – 49 0,1 0,0 0,0 0,0 0,0 0,0 0,0 0,1
50 + 0,0 0,0 0,0 0,0 0,0 – −
Nedeclarată Не указан
Not stated
0,0 0,0 0,0 0,0 0,0 0,0 0,0 0,0

25
Repartizarea celor născuţi conform rangului născutului Распределение родившихся по очередности рождения
Distribution of borns by live-birth order
2001 2002 2003 2004 2005 2006 2007 2008
Total / Всего / Total
Născuţi-vii – total / Родившиеся живыми – всего / Live-births – total
36448 35705 36471 38272 37695 37587 37973 39018
din care: / в том числе: / of which:
Primul / Первыми / First 19370 18564 18978 20290 19926 19858 20099 20958
Al doilea / Вторыми / Second 11348 11611 11821 12353 12193 12430 12597 12821
Al treilea / Третьими / Third 3594 3444 3728 3754 3700 3536 3653 3636
Al patrulea şi mai mult / Четвертыми и более / Fourth and over
2136 2086 1944 1875 1876 1763 1624 1603
În procente / В процентах / In per cent
Născuţi-vii – total / Родившиеся живыми – всего / Live-births – total
100 100 100 100 100 100 100 100
din care: / в том числе: / of which:
Primul / Первыми / First 53,1 52,0 52,1 53,0 52,9 52,8 52,9 53,7
Al doilea / Вторыми / Second 31,1 32,5 32,4 32,3 32,3 33,1 33,2 32,9
Al treilea / Третьими / Third 9,9 9,7 10,2 9,8 9,8 9,4 9,6 9,3
Al patrulea şi mai mult / Четвертыми и более / Fourth and over
5,9 5,8 5,3 4,9 5,0 4,7 4,3 4,1
Mediul urban / Городская местность / Urban
Născuţi-vii – total / Родившиеся живыми – всего / Live-births – total
12542 12747 12788 14060 13583 13579 13679 14288
din care: / в том числе: / of which:
Primul / Первыми / First 7852 7689 7711 8519 7898 7673 7538 7954
Al doilea / Вторыми / Second 3677 3955 3976 4426 4494 4740 4914 5083
Al treilea / Третьими / Third 671 763 786 827 894 860 921 950
Al patrulea şi mai mult / Четвертыми и более / Fourth and over
342 340 315 288 297 306 306 301
În procente / В процентах / In per cent
Născuţi-vii – total / Родившиеся живыми – всего / Live-births – total
100 100 100 100 100 100 100 100
din care: / в том числе: / of which:
Primul / Первыми / First 62,6 60,3 60,3 60,6 58,1 56,5 55,2 55,7
Al doilea / Вторыми / Second 29,3 31,0 31,1 31,5 33,1 34,9 35,9 35,6
Al treilea / Третьими / Third 5,4 6,0 6,1 5,9 6,6 6,3 6,7 6,6
Al patrulea şi mai mult / Четвертыми и более / Fourth and over
2,7 2,7 2,5 2,0 2,2 2,3 2,2 2,1
Mediul rural / Сельская местность / Rural
Născuţi-vii – total / Родившиеся живыми – всего / Live-births – total
23906 22958 23683 24212 24112 24008 24294 24730
din care: / в том числе: / of which:
Primul / Первыми / First 11518 10875 11267 11771 12028 12185 12561 13004
Al doilea / Вторыми / Second 7671 7656 7845 7927 7699 7690 7683 7738
Al treilea / Третьими / Third 2923 2681 2942 2927 2806 2676 2732 2686
Al patrulea şi mai mult / Четвертыми и более / Fourth and over
1794 1746 1629 1587 1579 1457 1318 1302

26
2001 2002 2003 2004 2005 2006 2007 2008
În procente / В процентах /In per cent
Născuţi-vii – total / Родившиеся живыми – всего / Live-births – total
100 100 100 100 100 100 100 100
din care: / в том числе: / of which:
Primul / Первыми / First 48,2 47,4 47,6 48,6 49,9 50,8 51,7 52,6
Al doilea / Вторыми / Second 32,1 33,3 33,1 32,7 31,9 32,0 31,6 31,3
Al treilea / Третьими / Third 12,2 11,7 12,4 12,1 11,6 11,1 11,3 10,9
Al patrulea şi mai mult / Четвертыми и более / Fourth and over
7,5 7,6 6,9 6,6 6,6 6,1 5,4 5,2
Numărul copiilor născuţi în afara căsătoriei
Число родившихся у женщин, не состоявших в зарегистрированном браке
Number of extramarital births
Numărul născuţilor Число родившихся
Number of new-borns
În procente faţă de numărul total al născuţilor В процентах к общему числу родившихся
In % to the total number of new-borns
inclusiv: в том числе:
including:
inclusiv: в том числе:
including:
Anii Годы Years
Total Всего Total
urban в городской местности
urban
rural в сельской местности
rural
Total Всего Total
urban в городской местности
urban
rural в сельской местности
rural 2001 8185 2738 5447 22,5 21,8 22,8
2002 8192 2811 5381 22,9 22,1 23,4
2003 8654 2841 5813 23,8 22,2 24,5
2004 9380 3104 6276 24,5 22,1 25,9
2005 9009 3015 5994 23,9 22,2 24,9
2006 8739 2874 5865 23,3 21,2 24,4
2007 8632 2688 5944 22,7 19,7 24,5
2008 8700 2747 5953 22,3 19,2 24,1
Numărul copiilor născuţi în afara căsătoriei Число родившихся у женщин,
не состоявших в зарегистрированном браке Number of extramarital births
01000
20003000
40005000
60007000
80009000
10000
2001 2002 2003 2004 2005 2006 2007 2008
Total / Всего / Total Urban / Городская местность / Urban Rural / Сельская местность / Rural

27
Născuţi-vii conform grupei de vîrstă a părinţilor Живорожденные по возрастной группе родителей
Live-births by age group of parents Vîrsta tatălui, ani
Возраст отца, лет Age of father, years Vîrsta mamei, ani
Возраст матери, лет Age of mother, years
Născuţi-vii – total
Родившиеся живыми – всего
Live-births – total
Sub / до / under 16 16-19 20-24 25-29 30-34 35-39 40-44 45-49 50 +
Nedeclarată Не указанNot stated
2001 Total / Всего / Total 36448 8 725 10407 12480 6597 3115 1196 293 109 1518 Sub / до / under 16 119 2 19 58 10 1 - 2 - - 27 16 – 19 5821 3 476 3388 1269 162 42 18 15 5 443 20 – 24 15046 2 216 6041 6358 1397 295 76 38 24 599 25 – 29 9426 1 11 827 4282 3070 733 183 39 21 259 30 – 34 3994 - - 74 503 1724 1258 265 49 20 101 35 – 39 1589 - 1 11 46 209 720 457 64 22 59 40 – 44 409 - 1 4 10 30 65 191 78 16 14 45 – 49 21 - 1 3 - 2 1 4 9 1 - 50 + 3 - - 1 - - 1 - 1 - - Nedeclarată Не указан Not stated
20 - - - 2 2 - - - - 16
2005 Total / Всего / Total 37695 3 630 8706 12392 7744 3471 1242 370 141 2996 Sub / до / under 16 66 - 11 17 5 - - - - - 33 16 – 19 4991 1 414 2470 1074 169 35 17 1 4 806 20 – 24 14932 1 179 5354 6241 1623 301 73 22 19 1119 25 – 29 10567 1 17 769 4405 3648 819 200 68 33 607 30 – 34 4991 - 9 83 585 2057 1506 327 97 35 292 35 – 39 1775 - - 13 73 225 750 464 108 31 111 40 – 44 338 - - - 6 20 57 151 65 15 24 45 – 49 29 - - - 1 - 3 10 9 4 2 50 + 4 - - - 2 2 - - - - - Nedeclarată Не указан Not stated
2 - - - - - - - - - 2
2006 Total / Всего / Total 37587 2 557 8722 12028 7826 3537 1288 365 143 3119 Sub / до / under 16 71 - 15 26 6 - - - - - 24 16 – 19 4811 2 355 2399 987 197 20 10 6 6 829 20 – 24 14762 - 169 5418 6057 1580 284 73 27 17 1137 25 – 29 10536 - 15 785 4350 3603 867 190 66 22 638 30 – 34 5237 - 2 79 552 2187 1587 366 101 40 323 35 – 39 1815 - 1 15 69 241 727 488 99 38 137 40 – 44 350 - - - 7 18 51 160 63 20 31 45 – 49 4 - - - - - - 1 3 - - 50 + - - - - - - - - - - - Nedeclarată Не указан Not stated
1 - - - - - 1 - - - -
2007 Total / Всего / Total 37973 2 517 8641 11975 8094 3684 1280 437 165 3178 Sub / до / under 16 75 1 15 19 7 33 16 – 19 4216 1 310 2067 841 171 39 6 7 9 765 20 – 24 15079 − 171 5612 6036 1669 284 71 23 23 1190 25 – 29 10720 − 18 806 4447 3657 887 197 71 24 613 30 – 34 5534 − 3 126 572 2312 1608 378 106 59 370 35 – 39 1987 − − 9 65 269 810 495 150 29 160 40 – 44 341 − − 1 7 15 55 130 69 20 44 45 – 49 15 − − − − − − 3 10 1 1 50 + 3 − − 1 − − 1 − 1 − − Nedeclarată Не указан Not stated
3 − − − − 1 − − − − 2
2008 Total / Всего / Total 39018 2 463 8544 12382 8392 3987 1375 444 174 3255 Sub / до / under 16 64 - 7 20 8 1 28 16 – 19 4017 1 292 2002 789 148 32 9 5 1 738 20 – 24 15076 1 145 5529 6065 1679 306 83 22 13 1233 25 – 29 11531 − 16 892 4772 3897 963 192 60 48 691 30 – 34 5797 − 3 86 659 2363 1746 413 114 47 366 35 – 39 2134 − − 13 86 280 884 541 135 36 159 40 – 44 377 − − 1 2 24 55 134 98 26 37 45 – 49 20 − − 1 1 1 3 10 3 1 50 + − − − − − − − − − − Nedeclarată Не указан Not stated
2 − − − − − − − − − 2

28
Născuţi-vii după naţionalitatea mamei, în 2008 Распределение живорожденных по национальности матери в 2008 году
Live-births by mother’s nationality, in 2008
Naţionalitatea Национальность
Nationality
Ambele sexe Оба пола Both sexes
Băieţi Мальчики
Boys
Fetiţe Девочки
Girls
Total / Всего / Total
Total / Всего / Total 39018 20098 18920
din care: / в том числе: / of which:
Moldoveni / Молдоване / Moldavians 32005 16471 15534
Ucraineni / Украинцы / Ukrainians 2363 1241 1122
Ruşi / Русские / Russians 1564 796 768
Găgăuzi / Гагаузы / Gagauzs 1790 902 888
Bulgari / Болгары / Bulgarians 626 355 271
Ţigani / Цыгане / Gipsy 256 129 127
Belaruşi / Беларусы / Belarusians 36 19 17
Evrei / Евреи / Jews 24 9 15
Alte naţionalităţi Другие национальности Other nationalities
354 176 178
Mediul urban / Городская местность / Urban
Total / Всего / Total 14288 7386 6902
din care: / в том числе: / of which:
Moldoveni / Молдоване / Moldavians 10263 5309 4954
Ucraineni / Украинцы / Ukrainians 1339 695 644
Ruşi / Русские / Russians 1350 690 660
Găgăuzi / Гагаузы / Gagauzs 611 312 299
Bulgari / Болгары / Bulgarians 309 175 134
Ţigani / Цыгане / Gipsy 200 103 97
Belaruşi / Беларусы / Belarusians 34 18 16
Evrei / Евреи / Jews 23 9 14
Alte naţionalităţi Другие национальности Other nationalities
159 75 84
Mediul rural / Сельская местность / Rural
Total / Всего / Total 24730 12712 12018
din care: / в том числе: / of which:
Moldoveni / Молдоване / Moldavians 21742 11162 10580
Ucraineni / Украинцы / Ukrainians 1024 546 478
Ruşi / Русские / Russians 214 106 108
Găgăuzi / Гагаузы / Gagauzs 1179 590 589
Bulgari / Болгары / Bulgarians 317 180 137
Ţigani / Цыгане / Gipsy 56 26 30
Belaruşi / Беларусы / Belarusians 2 1 1
Evrei / Евреи / Jews 1 1
Alte naţionalităţi Другие национальности Other nationalities
195 101 94

29
Repartizarea născuţilor-vii după sexe şi luna naşterii, în 2008 Распределение живорожденных по полу и месяцу рождения в 2008 году
Distribution of live-births by sex and month of birth, in 2008
0
200
400
600
800
1000
1200
1400
1600
1800
2000
I II III IV V VI VII VIII IX X XI XII
Băieţi / Мальчики / Boys Fetiţe / Девочки / Girls

30
Decedaţi după grupa de vîrstă şi sexe Число умерших по полу и возрастным группам
Deceased by age group and sex
Bărbaţi / Мужчины / Men
Femei / Женщины / Women
Grupa de vîrstă, ani Возрастная группа,
лет Age group, years
2001 2005 2006 2007 2008 2001 2005 2006 2007 2008
Total / Всего / Total Total / Всего / Total 20591 23277 22499 22238 21809 19484 21412 20638 20812 20139 0-4 424 320 293 280 304 317 270 234 251 260
5-9 76 40 46 34 35 47 36 25 15 17
10-14 100 61 59 57 37 41 31 42 30 22
15-19 156 152 146 145 132 67 50 65 81 49
20-24 281 233 196 255 238 68 82 73 89 79
25-29 297 293 309 292 264 90 93 90 111 98
30-34 324 428 415 421 426 143 153 145 144 151
35-39 642 586 595 541 531 229 215 186 210 186
40-44 1090 1137 989 935 966 424 415 404 325 334
45-49 1421 1820 1758 1702 1505 634 756 703 677 671
50-54 1557 2272 2154 2044 2062 853 1046 1016 970 925
55-59 1370 1978 2159 2464 2560 998 1151 1350 1466 1476
60-64 2250 2107 1786 1623 1591 1724 1624 1455 1159 1084
65-69 2598 2813 2727 2684 2548 2209 2419 2233 2276 2107
70-74 2931 3010 2831 2791 2689 3124 3108 3044 2944 2919
75-79 2291 2820 2923 2879 2719 3521 3745 3749 3742 3477
80-84 1499 1974 1834 1784 1894 2409 3498 3205 3474 3362
85-89 905 795 887 966 1006 1731 1642 1766 1943 2112
90-94 308 361 308 262 247 660 854 655 679 600
95-99 61 63 74 76 52 169 189 161 189 186
100 + 9 14 10 3 3 24 35 37 37 24
Nedeclarată Не указан / Not stated
1 – – − – 2 – – − −
Mediul urban / Городская местность / Urban Total / Всего / Total 6927 7714 7396 7379 7232 5917 6485 6368 6476 6231 0-4 147 113 114 96 103 101 96 89 74 78
5-9 15 13 13 9 6 17 6 10 3 3
10-14 27 14 12 15 10 13 7 8 10 5
15-19 52 51 56 51 53 17 18 22 26 20
20-24 123 89 67 84 87 28 40 23 45 35
25-29 117 110 140 124 104 44 36 24 42 38
30-34 130 171 177 170 169 61 64 57 55 63
35-39 240 223 215 212 203 78 90 79 93 67
40-44 408 427 345 316 341 155 145 142 115 120
45-49 554 657 640 647 532 256 289 266 239 254
50-54 695 907 806 737 768 316 370 395 343 342
55-59 534 851 863 951 963 301 407 487 523 521
60-64 894 736 610 616 610 499 476 439 384 349
65-69 798 963 913 916 848 646 712 666 727 641
70-74 869 797 839 831 809 915 842 901 806 872
75-79 632 803 791 798 734 1034 1101 1088 1039 960
80-84 358 494 491 501 553 666 1005 931 1108 1032
85-90 241 190 219 223 254 518 478 500 586 586
90-94 76 90 70 65 73 207 251 192 214 178 95-99 14 13 12 17 11 39 46 42 37 59
100+ 2 2 3 − 1 4 6 7 7 8
Nedeclarată Не указан / Not stated
1 – – − − 2 – – − −

31
Bărbaţi / Мужчины / Men
Femei / Женщины / Women
Grupa de vîrstă, ani Возрастная группа, лет Age group, years
2001 2005 2006 2007 2008 2001 2005 2006 2007 2008
Mediul rural / Сельская местность / Rural
Total / Всего / Total 13664 15563 15103 14859 14577 13567 14927 14270 14336 13908 0-4 277 207 179 184 201 216 174 145 177 182
5-9 61 27 33 25 29 30 30 15 12 14
10-14 73 47 47 42 27 28 24 34 20 17
15-19 104 101 90 94 79 50 32 43 55 29
20-24 158 144 129 171 151 40 42 50 44 44
25-29 180 183 169 168 160 46 57 66 69 60
30-34 194 257 238 251 257 82 89 88 89 88
35-39 402 363 380 329 328 151 125 107 117 119
40-44 682 710 644 619 625 269 270 262 210 214
45-49 867 1163 1118 1055 973 378 467 437 438 417
50-54 862 1365 1348 1307 1294 537 676 621 627 583
55-59 836 1127 1296 1513 1597 697 744 863 943 955
60-64 1356 1371 1176 1007 981 1225 1148 1016 775 735
65-69 1800 1850 1814 1768 1700 1563 1707 1567 1549 1466
70-74 2062 2213 1992 1960 1880 2209 2266 2143 2138 2047
75-79 1659 2017 2132 2081 1985 2487 2644 2661 2703 2517
80-84 1141 1480 1343 1283 1341 1743 2493 2274 2366 2330
85-90 664 605 668 743 752 1213 1164 1266 1357 1526
90-94 232 271 238 197 174 453 603 463 465 422
95-99 47 50 62 59 41 130 143 119 152 127
100+ 7 12 7 3 2 20 29 30 30 16
Nedeclarată Не указан /Not stated
– – – − − – – – − −
Ratele mortalităţii pe grupe de vîrstă şi sexe Коэффициенты смертности по возрастным группам и полу
Mortality rate by age group and sex
Grupa de vîrstă, ani Возрастная группа, лет Age group, years
Decedaţi la 1000 persoane de sexul şi vîrsta respectivă Умершие на 1000 человек населения соответствующего пола и возраста
Deceased per 1000 persons of respective sex and age
Total / Всего / Total Bărbaţi / Мужчины / Men Femei / Женщины / Women 2005 2006 2007 2008 2005 2006 2007 2008 2005 2006 2007 2008 Total / Всего / Total 12,43 12,03 12,04 11,75 13,52 13,08 12,93 12,71 11,43 11,07 11,20 10,86
0-4 3,25 2,87 2,86 3,01 3,42 3,10 2,93 3,15 3,08 2,63 2,78 2,865-9 0,36 0,35 0,25 0,27 0,37 0,45 0,34 0,36 0,35 0,26 0,16 0,1810-14 0,33 0,38 0,34 0,24 0,43 0,43 0,43 0,30 0,23 0,32 0,24 0,1915-19 0,57 0,61 0,67 0,57 0,84 0,83 0,85 0,81 0,29 0,38 0,49 0,3120-24 0,91 0,78 0,99 0,89 1,34 1,12 1,45 1,32 0,48 0,43 0,52 0,4525-29 1,28 1,34 1,37 1,20 1,91 2,05 1,96 1,73 0,62 0,61 0,77 0,6630-34 2,25 2,15 2,21 2,21 3,35 3,21 3,31 3,27 1,17 1,11 1,12 1,1635-39 3,67 3,51 3,27 3,09 5,49 5,44 4,79 4,65 1,93 1,64 1,80 1,5840-44 5,96 5,55 5,16 5,51 9,22 8,27 7,95 8,49 3,03 3,08 2,56 2,7345-49 9,12 8,59 8,31 7,73 13,69 12,97 12,50 11,26 5,06 4,65 4,50 4,5450-54 13,36 12,76 11,99 11,67 19,74 18,65 17,41 17,25 7,85 7,65 7,24 6,7855-59 18,19 18,34 19,22 18,48 25,50 24,86 26,49 25,83 12,19 12,93 13,15 12,3760-64 29,21 26,60 23,01 21,89 38,84 33,90 30,53 29,54 22,10 21,04 17,11 15,8665-69 40,74 38,99 39,42 37,94 54,15 52,99 52,19 50,69 31,64 29,48 30,60 29,0970-74 62,13 58,69 56,65 55,04 79,57 72,99 70,84 68,06 51,26 49,65 47,61 46,7975-79 88,89 88,40 84,79 81,16 108,07 107,76 100,70 97,28 78,41 77,54 75,59 71,8580-84 145,84 124,78 123,60 120,22 165,66 146,61 133,91 136,63 136,61 114,98 118,89 112,6085 + 245,65 216,02 196,64 186,98 270,87 240,37 205,21 191,09 235,70 208,64 192,94 185,20

32
Decedaţi pe principalele clase ale cauzelor de deces Умершие по основным классам причин смерти
Deceased by main causes of death
persoane / человек / persons
2005 2006 2007 2008 Clase ale cauzelor de deces Классы причин смерти Causes of death
Ambele sexe Оба пола Both
sexes
Bărbaţi Муж-чины Male
FemeiЖен-щины
Female
Ambele sexe Оба пола Both
sexes
BărbaţiМуж-чиныMale
FemeiЖен-щины
Female
Ambele sexe Оба пола Both
sexes
Bărbaţi Муж-чины Male
Femei Жен-щины
Female
Ambele sexe Оба пола Both
sexes
BărbaţiМуж-чиныMale
FemeiЖен-щины
Female
Total / Всего / Total 44689 23277 21412 43137 22499 20638 43050 22238 20812 41948 21809 20139
din care: в том числе: of which:
Boli infecţioase şi parazitare Инфекционные и паразитар-ные болезни Infectious and parasitical deseases
789 643 146 740 601 139 746 589 157 714 561 153
Tumori maligne Злокачественные новооб-разования Malignant neoplasms
5184 2942 2242 5438 3064 2374 5387 2999 2388 5541 3097 2444
Boli ale aparatului circulator Болезни системы крово-обращения Deseases on the circulatory system
25167 11281 13886 24070 10939 13131 24178 10828 13350 23470 10480 12990
din care, infarctul acut al miocardului из них инфаркт миокарда of which, acute cardiac infarction
1210 840 370 1263 849 414 1307 854 453 1515 1023 492
Boli ale aparatului respirator Болезни органов дыхания Deseases of the respiratory system
2845 1887 958 2613 1702 911 2580 1671 909 2460 1684 776
din care, pneumonie acută из них острая пневмония of which, acute pneumonia
959 682 277 905 650 255 927 237 690 942 737 205
Boli ale aparatului digestiv Болезни органов пищеваре-ния Deseases of the digestive system
4622 2367 2255 4393 2243 2150 4270 2173 2097 4010 2046 1964
din care, ciroze ale ficatului из них циррозы печени of which, the cirrhosis
3534 1646 1888 3484 1640 1844 3341 1604 1737 3147 1501 1646
Boli ale sistemului nervos Болезни нервной системы Deseases of the nervous system
393 279 114 365 257 108 473 339 134 442 310 132
Accidente, intoxicaţii şi traume Несчастные случаи, отрав-ления и травмы Accidents, intoxications and traumas
3896 2989 907 3766 2868 898 3646 2765 881 3547 2772 775
Alte boli Другие болезни Other deseases
1793 889 904 1752 825 927 1770 874 896 1764 859 905

33
Structura decedaţilor pe principalele clase ale cauzelor de deces, în 2008 Структура умерших по основным классам причин смерти в 2008 году
Structure of deceased by main causes of death, in 2008
Femei Bărbaţi
3,8%
9,8% 64,5%
3,9%
12,4%
5,7%
7,7%
7,8%
12,7%
14,3%
9,4%
48,1%
Boli ale aparatului circulator Болезни системы кровообращения Deseases of the circulatory system
Alte boli Другие болезни Other deseases
Boli ale aparatului respirator Болезни органов дыхания Deseases of the repiratory system
Boli ale aparatului digestiv Болезни органов пищеварения Deseases of the digestive system
Accidente, intoxicaţii şi traume Несчастные случаи,отравление и травмыAccidents, intoxications and traumas
Tumori Ноовообразование Neoplasms

34
Decedaţi pe principalele clase ale cauzelor de deces, grupe de vîrstă şi sexe, în 2008 Умершие по основным классам причин смерти, возрастным группам и полу в 2008 году
Deceased by main causes of death, by age group and sex, in 2008 persoane / человек / persons
Grupa de vîrstă, ani Возрастная группа, лет
Age group, years
Clase ale cauzelor de deces Классы причин смерти
Causes of death
Total Всего Total 0-4 5-9 10-14 15-19 20-24 25-29 30-34 35-39 40-44 45-49 50-54 55-59 60-64 65 +
Total / Всего / Total
Total / Всего / Total 41948 564 52 59 181 317 362 577 717 1300 2176 2987 4036 2675 25945 din care/ в том числе: of which:
Boli infecţioase şi parazitare Инфекционные и паразитар-ные болезни Infectious and parasitical deseases
714 19 – – 3 19 44 76 87 101 118 96 72 27 52
Tumori maligne Злокачественные новообразования Malignant neoplasms
5541 13 7 5 17 21 40 63 85 162 390 590 915 562 2671
Boli ale aparatului circulator Болезни системы кровообра-щения Deseases on the circulatory system
23470 3 – 3 6 20 23 65 105 240 490 860 1465 1197 18993
din care, infarctul acut al miocardului из них инфаркт миокарда of which, acute cardiac infarction
1515 – – – – 4 3 16 30 54 105 191 257 148 707
Boli ale aparatului respirator Болезни органов дыхания Deseases of the respiratory system
2460 77 2 7 3 12 11 41 47 104 182 216 246 150 1362
din care, pneumonie acută из них острая пневмония of which, acute pneumonia
942 71 2 6 2 8 9 31 41 78 138 167 145 62 182
Boli ale aparatului digestiv Болезни органов пищеварения Deseases of the digestive system
4010 4 – – 2 14 25 61 101 250 410 565 643 387 1548
din care, ciroze ale ficatului из них циррозы печени of which, the cirrhosis
3147 – – – – 9 16 37 68 193 303 444 517 322 1238
Boli ale sistemului nervos Болезни нервной системы Deseases of the nervous system
442 8 4 2 9 8 15 22 30 38 53 65 83 32 73
Accidente, intoxicaţii şi traume Несчастные случаи, отравле-ния и травмы Accidents, intoxications and traumas
3547 66 30 36 128 199 175 221 229 331 417 468 433 200 614
Alte boli Другие болезни Other deseases
1764 374 9 6 13 24 29 28 33 74 116 127 179 120 632
Bărbaţi / Мужчины / Men
Total / Всего / Total 21809 304 35 37 132 238 264 426 531 966 1505 2062 2560 1591 11158 din care: в том числе: of which:
Boli infecţioase şi parazitare Инфекционные и паразитар-ные болезни Infectious and parasitical deseases
561 11 – – 2 12 27 61 74 82 97 77 62 22 34
Tumori maligne Злокачественные новообразования Malignant neoplasms
3097 6 3 5 13 11 21 22 34 76 185 370 564 356 1431
Boli ale aparatului circulator Болезни системы кровообра-щения Deseases on the circulatory system
10480 3 – 2 4 12 17 48 84 181 353 610 910 673 7583
din care, infarctul acut al mio-cardului из них инфаркт миокарда
1023 – – – – 3 3 13 28 44 93 151 210 111 367

35
Grupa de vîrstă, ani Возрастная группа, лет
Age group, years
Clase ale cauzelor de deces Классы причин смерти
Causes of death
Total Всего Total 0-4 5-9 10-14 15-19 20-24 25-29 30-34 35-39 40-44 45-49 50-54 55-59 60-64 65 +
of which, acute cardiac infarction
Boli ale aparatului respirator Болезни органов дыхания Deseases of the respiratory system
1684 41 2 5 3 7 3 37 35 87 151 180 207 124 802
din care, pneumonie acută из них острая пневмония of which, acute pneumonia
737 39 2 5 2 6 3 27 31 65 116 140 122 57 122
Boli ale aparatului digestiv Болезни органов пищеварения Deseases of the digestive system
2046 3 – – 1 9 18 47 67 174 254 312 333 183 645
din care, ciroze ale ficatului из них циррозы печени of which, the cirrhosis
1501 – – – – 4 11 26 41 132 172 234 247 148 486
Boli ale sistemului nervos Болезни нервной системы Deseases of the nervous system
310 5 3 – 4 6 13 13 23 31 35 46 61 22 48
Accidente, intoxicaţii şi traume Несчастные случаи, отравле-ния и травмы Accidents, intoxications and traumas
2772 43 25 22 100 170 150 185 193 281 347 392 328 145 391
Alte boli Другие болезни Other deseases
859 192 2 3 5 11 15 13 21 54 83 75 95 66 224
Femei / Женщины / Women
Total / Всего / Total 20139 260 17 22 49 79 98 151 186 334 671 925 1476 1084 14787 din care: в том числе: of which:
Boli infecţioase şi parazitare Инфекционные и паразитар-ные болезни Infectious and parasitical deseases
153 8 – – 1 7 17 15 13 19 21 19 10 5 18
Tumori maligne Злокачественные новообразования Malignant neoplasms
2444 7 4 – 4 10 19 41 51 86 205 220 351 206 1240
Boli ale aparatului circulator Болезни системы кровообра-щения Deseases on the circulatory system
12990 – – 1 2 8 6 17 21 59 137 250 555 524 11410
din care, infarctul acut al mio-cardului из них инфаркт миокарда of which, acute cardiac infarction
492 – – – – 1 – 3 2 10 12 40 47 37 340
Boli ale aparatului respirator Болезни органов дыхания Deseases of the respiratory system
776 36 – 2 – 5 8 4 12 17 31 36 39 26 560
din care, pneumonie acută из них острая пневмония of which, acute pneumonia
205 32 – 1 – 2 6 4 10 13 22 27 23 5 60
Boli ale aparatului digestiv Болезни органов пищеварения Deseases of the digestive system
1964 1 – – 1 5 7 14 34 76 156 253 310 204 903
din care, ciroze ale ficatului из них циррозы печени of which, the cirrhosis
1646 – – – – 5 5 11 27 61 131 210 270 174 752
Boli ale sistemului nervos Болезни нервной системы Deseases of the nervous system
132 3 1 2 5 2 2 9 7 7 18 19 22 10 25
Accidente, intoxicaţii şi traume Несчастные случаи, отравле-ния и травмы Accidents, intoxications and traumas
775 23 5 14 28 29 25 36 36 50 70 76 105 55 223
Alte boli Другие болезни Other deseases
905 182 7 3 8 13 14 15 12 20 33 52 84 54 408

36
Ratele mortalităţii pe principalele clase ale cauzelor de deces
Коэффициенты смертности по основным классам причин смерти Mortality rates by main causes of death
Decedaţi la 100000 persoane de sexul şi vîrsta respectivă Умершие на 100000 человек населения соответствующего пола и возраста Deaths per 100000 persons of respective sex and age
2005 2006 2007 2008
Clase ale cauzelor de deces Классы причин смерти
Causes of death
Ambele sexe Оба пола Both
sexes
Bărbaţi Мужчи-ны
Male
FemeiЖенщи-
ны Female
Ambele sexe Оба пола Both
sexes
BărbaţiМужчи-ны
Male
FemeiЖенщи-
ны Female
Ambele sexe Оба пола Both
sexes
Bărbaţi Мужчи-ны
Male
Femei Женщи-
ны Female
Ambele sexe Оба пола Both
sexes
BărbaţiМужчи-ны
Male
FemeiЖенщи-
ны Female
Total / Всего / Total 1243,0 1351,7 1143,1 1203,2 1308,0 1106,6 1203,6 1293,5 1120,3 1175,0 1270,8 1086,3 din care: в том числе: of which:
Boli infecţioase şi parazitare Инфекционные и паразитар-ные болезни Infectious and parasitical deseases
22,0 37,3 7,8 20,6 34,9 7,5 20,9 34,3 8,5 20,0 32,7 8,3
Tumori maligne Злокачественные новооб-разования Malignant neoplasms
144,2 170,9 119,7 151,7 178,1 127,3 150,6 174,4 128,5 155,2 180,5 131,8
Boli ale aparatului circulator Болезни системы кровообра-щения Deseases on the circulatory system
700,2 655,1 741,5 671,4 636,0 704,0 675,9 629,8 718,6 657,4 610,7 700,7
din care, infarctul acut al mio-cardului из них инфаркт миокарда of which, acute cardiac infarction
33,7 48,8 19,8 35,2 49,4 22,2 36,5 49,7 24,4 42,4 59,6 26,5
Boli ale aparatului respirator Болезни органов дыхания Deseases of the respiratory system
79,2 109,6 51,2 72,9 99,0 48,8 72,1 97,2 48,9 68,9 98,1 41,9
din care, pneumonie acută из них острая пневмония of which, acute pneumonia
26,7 39,6 14,8 25,2 37,8 13,7 25,9 40,1 12,8 26,4 42,9 11,1
Boli ale aparatului digestiv Болезни органов пищеварения Deseases of the digestive system
128,6 137,5 120,4 122,5 130,4 115,3 119,4 126,4 112,9 112,3 119,2 105,9
din care, ciroze ale ficatului из них циррозы печени of which, the cirrhosis
98,3 95,6 100,8 97,2 95,3 98,9 93,4 93,3 93,5 88,1 87,5 88,8
Boli ale sistemului nervos Болезни нервной системы Deseases of the nervous system
10,9 16,2 6,1 10,2 14,9 5,8 13,2 19,7 7,2 12,4 18,1 7,1
Accidente, intoxicaţii şi traume Несчастные случаи, отравле-ния и травмы Accidents, intoxications and traumas
108,4 173,6 48,4 105,0 166,8 48,1 101,9 160,8 47,4 99,4 161,5 41,8
Alte boli Другие болезни Other deseases
49,5 51,5 48,0 48,9 47,9 48,9 49,5 50,8 48,2 49,4 50,1 48,8

37
Ratele mortalităţii pe principalele clase ale cauzelor de deces, în profil teritorial, în 2008
Коэффициенты смертности по основным классам причин смерти, в территориальном разрезе, в 2008 году
Mortality rates by main causes of death, in territorial aspect, in 2008 Decedaţi la 100000 locuitori Умершие на 100000 человек населения Deaths per 100000 inhabitants
din care, pe clase ale cauzelor de deces: из них по классам причин смерти:
of which, by causes of death:
Denumirea U.A.T. Наименование А.Т.Е. Denomination of A.T.U.
Total decedaţi Всего умерших
Total deaths
boli ale aparatului circulator
болезни системы кровообращенияdeseases of the
circulatory system
tumori maligne злокачест-
венные новооб-разования malignant neoplasms
boli ale aparatului digestiv
болезни органов пищеварения
deseases of the digestive system
boli ale aparatului respirator
болезни органов дыхания
deseases of the respiratory system
accidente, intoxicaţii şi traume
несчастные случаи, отравле-ния и травмы
accidents, intoxi-cations and traumas
Total / Всего / Total 1174,98 657,40 155,21 112,32 68,91 99,35
Mun. Chişinău 815,31 422,24 154,45 65,45 32,47 75,89
Nord / Север / North 1378,16 824,43 172,37 109,56 92,73 92,04
Mun. Bălţi 1050,58 551,62 191,75 79,67 47,26 72,92
Briceni 1583,85 1051,10 136,13 98,17 123,04 92,94
Donduşeni 1759,67 1183,23 214,54 60,68 145,19 97,52
Drochia 1456,50 780,31 176,45 154,53 143,57 87,68
Edineţ 1471,19 960,09 157,63 95,53 47,77 124,19
Făleşti 1436,51 844,13 166,04 173,54 100,70 96,41
Floreşti 1482,80 910,72 207,13 107,40 75,62 90,96
Glodeni 1373,27 805,46 170,66 94,10 121,22 79,75
Ocniţa 1526,89 891,42 192,41 141,22 120,03 100,62
Rîşcani 1471,21 839,69 187,07 136,43 122,37 90,02
Sîngerei 1150,74 751,17 133,19 84,17 27,70 91,63
Soroca 1298,14 752,23 151,04 94,77 118,46 95,76
Centru / Центр / Center 1239,26 670,95 142,62 145,52 75,15 113,34
Anenii Noi 1208,15 641,38 184,11 121,54 71,00 109,50
Călăraşi 1329,09 689,72 137,19 157,33 93,14 103,21
Criuleni 1292,69 714,34 166,22 142,87 70,06 127,76
Dubăsari 1241,30 707,29 110,78 107,94 65,33 127,82
Hînceşti 1185,25 564,25 140,25 163,76 94,04 149,17
Ialoveni 1139,15 618,49 141,63 154,88 23,44 128,38
Nisporeni 1196,28 616,72 132,26 144,15 101,05 109,97
Orhei 1257,27 716,40 146,14 158,05 72,27 92,92
Rezina 1365,35 826,74 109,23 154,43 88,51 86,63
Străşeni 1262,41 667,82 141,00 178,16 59,02 127,88
Şoldăneşti 1481,09 896,39 134,23 111,48 91,00 116,03
Teleneşti 1180,36 688,43 149,72 118,97 52,13 88,23
Ungheni 1184,20 615,99 132,24 127,98 98,97 98,97
Sud / Юг / South 1204,31 670,16 150,93 116,51 68,84 118,17
Basarabeasca 1138,98 576,27 155,93 172,88 40,68 98,31
Cahul 1045,09 584,99 141,82 93,47 56,40 105,56
Cantemir 1173,72 592,39 148,49 134,27 77,41 131,12
Căuşeni 1322,17 737,05 161,63 122,84 95,90 121,76
Cimişlia 1268,49 646,99 156,17 122,71 87,65 154,58
Leova 1220,10 685,26 137,42 137,42 68,71 130,00
Ştefan Vodă 1242,25 753,63 151,83 81,44 46,93 110,42
Taraclia 1317,47 819,21 161,60 127,93 62,84 87,53
UTA Găgăuzia 1090,68 601,97 145,80 120,77 53,81 100,12

38
Repartizarea decedaţilor după sexe şi luna decesului, în 2008 Распределение умерших по полу и месяцу смерти в 2008 году
Distribution of the deaths by sex and month of death, in 2008
2072
1843
1814
1604
1521
1633
1637
1929
1713
1786
1916
2341
1804
1726
1630
1461
1311
1427
1414
1845
1625
1736
1832
2328
0 1000 2000 3000 4000 5000
XII
XI
X
IX
VIII
VII
VI
V
IV
III
II
I
Bărbaţi / Мужчины / Men Femei / Женщины / Women

39
Mortalitatea maternă Материнская смертность
Maternal mortality
Numărul femeilor decedate din cauza complicaţiilor sarcinii, naşterii şi perioadei postnatale Число женщин, умерших от осложнений беременности, родов и послеродового периода Number of women deceased because of pregnancy, delivery and post-delivery complications
Persoane Человек Persons
La 100000 născuţi-vii На 100000 родившихся Per 100000 live-births Anii
Годы Years Total
Всего Total
Mediul urban Городская местность
Urban
Mediul rural Сельская местность
Rural
Total Всего Total
Mediul urban Городская местность
Urban
Mediul rural Сельская местность
Rural 2001 16 6 10 43,9 47,8 41,8
2002 10 3 7 28,0 23,5 30,5
2003 8 2 6 21,9 15,6 25,3
2004 9 1 8 23,5 7,1 33,0
2005 7 1 6 18,6 7,4 24,5
2006 6 3 3 16,0 22,1 12,5
2007 6 3 3 15,8 21,9 12,3
2008 15 4 11 38,4 28,0 44,4
Decedaţi în vîrstă sub 1 an, pe principalele clase ale cauzelor de deces Умершие в возрасте до 1 года по основным классам причин смерти
Deceased under 1 year, by main causes of death persoane / человек / persons
2001
2005
2006
2007
2008
Total decedaţi / Всего умерших / Total deceased 597 468 442 428 473
din care, pe cauze de deces: в том числе по причинам смерти: of which, by causes of death:
Boli infecţioase şi parazitare Инфекционные и паразитарные болезни Infectious and parasitical deseases
25 28 14 14 11
Boli ale sistemului nervos
Болезни нервной системы
Deseases of the nervous system
4 7 7 2 3
Boli ale aparatului respirator Болезни органов дыхания Deseases of the respiratory system
129 74 81 68 68
Boli ale aparatului digestiv Болезни органов пищеварения Deseases of the digestive system
2 2 2 2 3
Anomalii congenitale Врожденные аномалии Congenital anomalies
168 142 134 108 152
Stări care apar în perioada perinatală Состояния, возникающие в перинатальном периоде Certain conditions originating in the prenatal period
185 160 147 149 178
Accidente, intoxicaţii şi traume Несчастные случаи, отравления и травмы Accidents, intoxications and traumas
58 40 34
61 35

40
Ratele mortalităţii infantile, pe principalele clase ale cauzelor de deces Младенческая смертность по основным классам причин смерти
Infant mortality rates, by main causes of death
Decedaţi în vîrstă sub 1 an la 10000 născuţi-vii Число умерших в возрасте до 1 года на 10000 родившихся Deceased under 1 year per 10000 live-births 2001 2005 2006 2007 2008
Total decedaţi / Всего умерших / Total deceased 163,1 123,8 117,5 112,7 121,7 din care, pe cauze de deces:
в том числе по причинам смерти: of which, by causes of death:
Boli infecţioase şi parazitare Инфекционные и паразитарные болезни Infectious and parasitical deseases
6,8 7,4 3,7 3,7 2,8
Boli ale sistemului nervos Болезни нервной системы Deseases of the nervous system
1,1 1,9 1,9 0,5 0,8
Boli ale aparatului respirator Болезни органов дыхания Deseases of the respiratory system
35,2 19,6 21,5 17,9 17,5
Boli ale aparatului digestiv Болезни органов пищеварения Deseases of the digestive system
0,5 0,5 0,5 0,5 0,8
Anomalii congenitale Врожденные аномалии Congenital anomalies
45,9 37,7 35,6 28,4 39,1
Stări care apar în perioada perinatală Состояния, возникающие в перинатальном периоде Certain conditions originating in the prenatal period
50,5 42,4 39,1 39,2 45,8
Accidente, intoxicaţii şi traume Несчастные случаи, отравления и травмы Accidents, intoxications and traumas
15,8 10,6 9,0 16,1 9,0
Decedaţi în vîrstă sub 1 an, pe principalele clase ale cauzelor de deces, pe sexe în 2008, în % Умершие в возрасте до 1 года по основным классам причин смерти, по полу в 2008 году , в %
Deceased under 1 yearof age, bysex and main causes of death in 2008 , in %
Fetiţe Băieţei
13,8%
41,9%
7,8%
30,4%
4,1% 1,8%
4,7%
10,2%2,7%
34,0% 33,6%
14,8%
Anomalii congenitale Врожденные аномалии Congenital anomalies
Boli ale aparatului respirator Болезни оранов дыхания Deseases of the respiratory system Boli infecţioase şi parazitare Инфекционные и паразитарные болезни Infectious and parasitical deseass
Alte cauze Другие причины Other causes
Accidente, intoxicaţii şi traume Несчастные случаи, отравление и травмы Accidents, intoxications and traumas
Stări care apar în perioada perinatală Состаяния возникающие в перинатальном периодеCertain conditions originating in the prenatal period

41
Ratele mortalităţii infantile, pe principalele clase ale cauzelor de deces, în profil teritorial, în 2008
Коэффициенты младенческой смертности по основным классам причин смерти, в территориальном разрезе, в 2008 году
Infant mortality rates by main causes of death, in territorial aspect, in 2008 Decedaţi în vîrstă sub 1 an la 1000 născuţi-vii Число умерших в возрасте до 1 года на 1000 родившихся Deceased under 1 year per 1000 live-births
din care, pe cauze de deces: из них по причинам смерти: of which, by causes of death:
Denumirea U.A.T.
Наименование А.Т.Е. Denomination of A.T.U.
Total decedaţi Всего умерших Total deceased
boli infecţioase şi parazitare
инфекционные и паразитарные
болезни infectious and
parasitical deseases
boli ale aparatului respirator
болезни органов дыхания
deseases of the respiratory system
anomalii congenitale врожденные аномалии congenital anomalies
stări care apar în perioada perinatalăсостояния, возни-кающие в перина-тальном периодеcertain conditions originating in the prenatal period
accidente, into-xicaţii şi traumeнесчастные
случаи, отравле-ния и травмы
accidents, intoxi-cations and
traumas Total / Всего / Total 12,17 0,28 1,75 3,91 4,58 0,90 Mun. Chişinău 9,38 0,13 1,03 3,73 3,85 0,39 Nord / Север / North 12,80 0,38 1,16 3,98 5,63 0,97 Municipiul Bălţi 11,65 0,69 - 5,48 4,11 - Briceni 11,77 1,31 1,31 1,31 5,23 1,31 Donduşeni 5,08 - - 2,53 2,53 - Drochia 11,35 - 1,14 4,54 2,27 3,41 Edineţ 16,15 1,15 - 2,31 10,39 1,15 Făleşti 16,28 - 2,87 2,87 7,65 0,96 Floreşti 13,93 - 2,14 4,28 7,49 - Glodeni 11,51 - - 3,28 6,57 1,64 Ocniţa 3,91 - 1,95 - - 1,95 Rîşcani 15,89 - 1,44 4,32 10,09 - Sîngerei 16,67 0,93 0,93 7,40 6,48 0,93 Soroca 11,63 - 2,11 5,27 3,16 1,05 Centru / Центр / Center 13,42 0,31 2,52 3,62 4,65 0,86
Anenii Noi 12,30 - 4,09 1,02 4,09 2,05 Călăraşi 9,98 1,25 1,25 1,25 3,74 - Criuleni 8,09 - 2,02 1,01 4,04 - Dubăsari 11,88 - - 7,13 4,75 - Hînceşti 12,58 0,74 2,96 1,48 2,22 3,70 Ialoveni 13,51 - 1,50 3,00 6,75 - Nisporeni 12,50 - 2,50 3,75 3,75 - Orhei 14,18 - 3,37 5,39 4,05 0,67 Rezina 30,14 - 8,36 13,38 8,36 - Străşeni 14,65 - 1,72 1,72 6,90 1,72 Şoldăneşti 10,94 - 2,18 - 6,54 - Teleneşti 11,45 1,15 - 6,87 1,15 1,15 Ungheni 14,49 0,69 2,76 4,82 5,51 - Sud / Юг / South 11,84 0,16 2,16 3,99 3,49 1,49
Basarabeasca 10,20 - - 3,39 3,39 - Cahul 8,05 - 2,93 2,20 2,93 - Cantemir 16,14 1,34 2,69 4,03 8,06 - Căuşeni 9,33 - 1,86 1,86 2,79 1,86 Cimişlia 9,49 - - 1,89 1,89 5,68 Leova 12,87 - 3,22 6,43 1,61 1,61 Ştefan Vodă 18,97 - 2,23 10,03 3,34 3,34 Taraclia 10,59 - 2,12 2,12 4,24 - U.T.A. Găgăuzia 11,66 0,51 1,52 4,56 4,05 1,01

42
Căsătorii şi divorţuri Браки и разводы
Marriages and divorces
Numărul căsătoriilor Число браков
Number of marriages
Numărul divorţurilor Число разводов
Number of divorces
Anii Годы Years
Total Всего Total
Mediul urban Городская местность
Urban
Mediul rural Сельская местность
Rural
Total Всего Total
Mediul urban Городская местность
Urban
Mediul rural Сельская местность
Rural 2001 21065 9727 11338 10808 7309 3499 2002 21685 10194 11491 12698 8947 3751 2003 24961 11520 13441 14672 10565 4107 2004 25164 11160 14004 14918 11015 3903 2005 27187 12553 14634 14521 10816 3705 2006 27128 13174 13954 12594 9652 2942 2007 29213 14622 14591 13923 11003 2920 2008 26666 13368 13298 12601 10749 1852
Ratele de nupţialitate şi divorţialitate Коэффициенты брачности и разводимости
Marriage and divorce rates La 1000 locuitori На 1000 человек населения Per 1000 inhabitants
Rata nupţialităţii Коэффициент брачности
Marriage rate
Rata divorţialităţii Коэффициент разводимости
Divorce rate
Anii Годы Years
Total Всего Total
Mediul urban Городская местность
Urban
Mediul rural Сельская местность
Rural
Total Всего Total
Mediul urban Городская местность
Urban
Mediul rural Сельская местность
Rural 2001 5,8 6,5 5,3 3,0 4,9 1,6 2002 6,0 6,8 5,4 3,5 6,0 1,8 2003 6,9 7,7 6,4 4,1 7,1 1,9 2004 7,0 7,5 6,6 4,1 7,4 1,8 2005 7,6 8,4 7,0 4,0 7,3 1,8 2006 7,6 8,9 6,6 3,5 6,5 1,4 2007 8,2 9,9 7,0 3,9 7,5 1,4 2008 7,5 9,1 6,4 3,5 7,3 0,9
Numărul căsătoriilor şi divorţurilor Число браков и разводов
Number of marriages and divorces
0
5000
10000
15000
20000
25000
30000
2001 2002 2003 2004 2005 2006 2007 2008
Căsătorii / Браки / Marriages Divorţuri /Разводы / Divoces

43
Căsătorii şi divorţuri în profil teritorial, în 2008 Браки и разводы в территориальном разрезе, в 2008 году
Marriages and divorces in territorial aspect, in 2008 La 1000 locuitori
На 1000 человек населения Per 1000 inhabitants
Denumirea U.A.T.
Наименование А.Т.Е. Denomination of A.T.U.
Numărul căsătoriilor
Число браков Number of marriages
Numărul divorţurilorЧисло разводов
Number of divorces căsătorii браков
marriages
divorţuri разводов divorces
Total / Всего / Total 26666 12601 7,5 3,5
Mun. Chişinău 6761 3075 8,6 3,9
Nord / Север / North 6762 3156 6,7 3,1
mun. Bălţi 1143 573 7,7 3,9
Briceni 494 196 6,5 2,6
Donduşeni 243 139 5,3 3,0
Drochia 603 293 6,6 3,2
Edineţ 577 239 6,9 2,9
Făleşti 592 276 6,3 3,0
Floreşti 624 312 6,8 3,4
Glodeni 412 176 6,6 2,8
Ocniţa 295 181 5,2 3,2
Rîşcani 479 179 6,7 2,5
Sîngerei 655 286 7,0 3,1
Soroca 645 306 6,4 3,0
Centru / Центр / Center 7909 3399 7,4 3,2
Anenii Noi 714 455 8,6 5,5
Călăraşi 537 244 6,8 3,1
Criuleni 566 195 7,8 2,7
Dubăsari 198 9 5,6 0,3
Hînceşti 902 416 7,3 3,4
Ialoveni 879 284 9,0 2,9
Nisporeni 455 176 6,8 2,6
Orhei 932 426 7,4 3,4
Rezina 321 279 6,1 5,3
Străşeni 767 304 8,4 3,3
Şoldăneşti 243 118 5,5 2,7
Teleneşti 508 173 6,8 2,3
Ungheni 887 320 7,6 2,7
Sud / Юг / South 3633 1691 6,7 3,1
Basarabeasca 175 122 5,9 4,1
Cahul 905 336 7,3 2,7
Cantemir 412 235 6,5 3,7
Căuşeni 625 284 6,7 3,1
Cimişlia 387 191 6,2 3,0
Leova 362 163 6,7 3,0
Ştefan Vodă 490 236 6,8 3,3
Taraclia 277 124 6,2 2,8
U.T.A. Găgăuzia 1497 892 9,4 5,6

44
Căsătorii conform stării civile anterioare a soţilor Браки по семейному положению вступающих в брак
Marriages by previous marital status of spouses
Femei Женщины
Women
Bărbaţi Мужчины
Men
Anii Годы Years
Necăsătorite Незамужние
Single
Văduve Вдовы
Widowed
Divorţate Разведенные
Divorced
Ponderea celor necă-sătorite, % Доля неза-мужних, %
Share of singles, %
Necăsătoriţi Холостые
Single
Văduvi Вдовые Widowed
Divorţaţi Разведенные
Divorced
Ponderea celor necă-sătoriţi, % Доля холо-стых, % Share of
singles, %
Total / Всего / Total
2001 17586 467 2957 83,5 17187 445 3415 81,6
2002 18210 486 2952 84,0 17785 419 3466 82,0
2003 20923 539 3480 83,8 20339 465 4147 81,5
2004 20781 494 3873 82,6 20271 428 4461 80,6
2005 22301 518 4358 82,0 21734 404 5048 79,9
2006 22383 493 4236 82,5 21731 364 5024 80,1
2007 23972 532 4684 82,1 23377 322 5503 80,0
2008 22158 474 4020 83,1 21507 246 4899 80,7
Mediul urban / Городская местность / Urban
2001 7439 203 2063 76,5 7192 194 2336 73,9
2002 7973 193 2016 78,2 7685 163 2341 75,4
2003 9069 220 2223 78,7 8620 191 2704 74,8
2004 8670 215 2270 77,7 8299 170 2691 74,4
2005 9722 227 2602 77,4 9367 157 3029 74,6
2006 10351 200 2622 78,6 9918 144 3111 75,3
2007 11425 248 2944 78,1 11066 102 3446 75,7
2008 10599 215 2554 79,3 10230 63 3064 76,5
Mediul rural / Сельская местность / Rural
2001 10147 264 894 89,5 9995 251 1079 88,2
2002 10237 293 936 89,1 10100 256 1125 87,9
2003 11854 319 1257 88,2 11719 274 1443 88,2
2004 12111 279 1603 86,5 11972 258 1770 86,5
2005 12579 291 1756 86,0 12367 247 2019 86,0
2006 12032 293 1614 86,2 11813 220 1913 84,7
2007 12547 284 1740 86,0 12311 220 2057 84,4
2008 11559 259 1466 86,9 11277 183 1835 84,8

45
Căsătorii după grupa de vîrstă a soţilor la prima căsătorie Браки по возрастным группам супругов, состоящих в первом браке
Marriages by age group of spouses at first marriage
Grupa de vîrstă a soţiei, ani Возрастная группа жены, лет
Age group of wife, years
Grupa de vîrstă a soţului, ani
Возрастная группа мужа, лет
Age group of husband, years
Total Всего Total
sub до
under 20
20-24 25-29 30-34 35-39 40-44 45-49 50-54 55-59 60 +
nede- clarată
не указанаnot stated
2001
Total / Всего / Total 16076 5600 8344 1619 267 80 38 13 9 9 94 3
Sub / до / under 20 838 548 263 25 2 – – – – – – –
20-24 9176 3852 4831 442 40 9 2 – – – – –
25-29 4676 1075 2728 794 63 13 3 – – – – –
30-34 887 105 411 260 89 16 5 1 – – – –
35-39 251 12 82 71 56 24 5 1 – – – –
40-44 90 5 20 20 11 13 17 3 1 – – –
45-49 26 1 6 4 5 5 1 2 – 1 1 –
50-54 19 1 2 1 1 – 4 4 4 1 1 –
55-59 8 – – 1 – – 1 1 2 1 2 –
60 + 102 1 1 1 – – – 1 2 6 90 –
Nedeclarată Не указана Not stated
3 – – – – – – – – – – 3
2005 Total / Всего / Total 20096 827 9951 6933 1703 421 142 56 31 12 20 –
Sub / до / under 20 5078 518 3268 1117 160 10 3 2 – – – –20-24 11065 277 5940 4040 667 108 24 5 4 – – –25-29 3090 29 685 1578 619 148 26 5 – – – –30-34 605 2 48 180 218 107 40 6 4 – – –35-39 124 1 9 13 29 36 26 8 2 – – –40-44 48 – – 4 8 8 11 11 5 1 – –45-49 46 – 1 1 2 4 9 14 13 2 – –50-54 13 – – – – – 2 2 2 7 – –55-59 8 – – – – – 1 2 – 2 3 –60 + 19 – – – – – – 1 1 – 17 –Nedeclarată Не указана Not stated
– – – – – – – – – – – –
2006 Total / Всего / Total 20142 4690 11425 3210 574 134 46 27 10 5 21 –
Sub / до / under 20 752 443 280 25 3 1 – – – – – –20-24 9994 3066 6127 733 61 7 – – – – – –25-29 7047 1037 4202 1602 181 21 4 – – – – –30-34 1732 129 697 665 197 36 5 2 1 – – –35-39 390 9 94 147 92 31 13 4 – – – –40-44 119 2 18 22 30 29 11 6 – 1 – –45-49 49 3 3 12 7 7 8 9 – – – –50-54 21 – 1 3 2 2 4 4 5 – – –55-59 9 1 3 – – – 1 2 2 – – –60 + 29 – – 1 1 – – – 2 4 21 –Nedeclarată Не указана Not stated
– – – – – – – – – – – –
2007 Total / Всего / Total 21563 4492 12235 3818 751 149 43 33 15 8 19 −
Sub / до / under 20 784 456 290 32 6 − − − − − − −20-24 10411 2925 6625 776 78 5 1 − − − 1 −25-29 7599 964 4401 2018 198 16 − 2 − − − –

46
Grupa de vîrstă a soţiei, ani Возрастная группа жены, лет
Age group of wife, years
Grupa de vîrstă a soţului, ani
Возрастная группа мужа, лет
Age group of husband, years
Total Всего Total
sub до
under 20
20-24 25-29 30-34 35-39 40-44 45-49 50-54 55-59 60 +
nede- clarată
не указанаnot stated
30-34 2027 128 778 764 304 44 5 4 − − − –35-39 471 16 110 166 122 47 6 3 1 − − –40-44 137 2 20 36 25 25 16 11 2 − − –45-49 66 1 7 18 11 9 11 7 2 − − –50-54 27 − 4 3 6 3 3 4 2 2 − –55-59 16 − − 3 1 − 1 1 6 4 − –60 + 25 − − 2 − − − 1 2 2 18 −Nedeclarată Не указана Not stated
− − − − − − − − − − − –
2008 Total / Всего / Total 19965 3721 11682 3623 699 147 42 19 8 7 17 −
Sub / до / under 20 550 316 211 21 2 - - - - - - −20-24 9459 2452 6203 752 41 9 1 1 - - -- −25-29 7309 828 4365 1896 195 22 2 1 - - - –30-34 2000 107 772 787 287 34 11 2 - - - –35-39 413 15 110 126 112 39 10 1 - - - –40-44 138 3 13 33 43 31 8 4 2 1 - –45-49 52 - 7 6 15 11 8 5 - - - –50-54 16 - 1 1 2 1 2 4 4 1 - –55-59 6 - - 1 1 - - 2 1 1 –60 + 22 - - - 1 - - 1 - 4 16 −Nedeclarată Не указана Not stated
− − − − − − − − − − –
Căsătorii încheiate după naţionalitatea soţilor, în 2008
Заключенные браки по национальности супругов, в 2008 году Marriages by nationality of spouses, in 2008
Naţionalitatea soţiei / Национальность жены / Nationality of wife Naţionalitatea soţului Национальность
мужа Nationality of husband
Total Всего Total
moldo-veancă
молдован-ка
Moldavian
rusoaicăрусскаяRussian
ucrai-neancă украинкаUkrainian
găgăuzăгагаузкаGagauz
belarusăбеларускаBelarusian
evreică еврейкаJewess
bulgă-roaică
болгарка Bulgarian
alta другая other
Total / Всего / Total
26666
21233 1408 1787 1344 43
29
533 289
din care: / в том числе: / of which:
Moldovean Молдованин Moldavian
20775 18890 620 781 125 22 13 184 140
Rus Русский Russian
1285 584 328 241 46 8 8 47 23
Ucrainean Украинец Ucrainian
1718 777 251 576 34 8 6 43 23
Găgăuz Гагауз Gagauz
1367 140 68 61 1013 - - 72 13
Belarus Беларус Belarus
48 23 4 9 7 - 1 4 -
Evreu Еврей Jew
79 47 11 13 2 - 1 2 3
Bulgar Болгарин Bulgarian
469 164 44 37 54 - - 162 8
Alta Другая Other
925 608 82 69 63 5 - 19 79

47
Numărul de căsătorii după luna încheierii, în 2008 Число браков по месяцам регистрации, в 2008году Number of marriages by month of registering, in 2008
2984
1194
1577 1669
1407
782
2665
2193
1730
3378 3397
3690
525720 774 710414
1177
1221997
20331818
1682
1297669
1687
857 895697
368
1488
972733
1345
1579
2008
0
500
1000
1500
2000
2500
3000
3500
4000
I II III IV V VI VII VIII IX X XI XII
Total / Всего / Total Urban / Город / Urban Rural / Село / Rural
Divorţuri după grupa de vîrstă a soţilor Разводы по возрасту супругов
Divorces by age group of spouses
Grupa de vîrstă a soţiei, ani Возрастная группа жены, лет
Age group of wife, years
Grupa de vîrstă a soţului,
ani Возрастная группа
мужа, лет Age group of husband,
years
Divorţuri –
total Всего раз-водов Total
divorces
sub до
under 20
20-24 25-29 30-34 35-39 40-44 45-49 50-54 55-59 60 + nedeclaratăне указанаnot stated
2001
Total / Всего / Total 10808 165 1801 2624 1931 1406 1211 767 432 109 178 184
Sub / до / under 20 28 8 14 5 1 – – – – – – –
20-24 787 97 531 112 34 8 4 – – – – 1
25-29 2412 47 958 1180 175 29 7 3 1 – – 12
30-34 2308 11 226 1027 869 132 26 4 1 – – 12
35-39 1750 1 39 209 664 665 134 27 – – – 11
40-44 1367 – 13 55 141 459 564 102 28 – 1 4
45-49 930 – 6 9 29 83 370 359 61 5 4 4
50-54 532 – 2 3 4 12 71 216 196 20 4 4
55-59 200 – 1 2 1 6 16 36 91 30 14 3
60 + 277 – – – 1 3 7 10 50 52 154 3
Nedeclarată Не указана / Not stated
217 1 11 22 12 9 12 10 4 2 1 130
2005
Total / Всего / Total 14521 211 2021 2880 2626 2038 1741 1390 747 299 177 391
Sub / до / under 20 37 11 16 8 2 – – – – – – –
20-24 933 117 606 154 40 9 3 2 – – – 2
25-29 2421 61 982 1097 207 41 8 4 3 – – 18
30-34 2853 16 315 1204 1080 174 35 8 4 – – 17
35-39 2382 1 49 295 980 827 161 34 13 2 – 20

48
Grupa de vîrstă a soţiei, ani Возрастная группа жены, лет
Age group of wife, years
Grupa de vîrstă a soţului,
ani Возрастная группа
мужа, лет Age group of husband,
years
Divorţuri –
total Всего раз-водов Total
divorces
sub до
under 20
20-24 25-29 30-34 35-39 40-44 45-49 50-54 55-59 60 + nedeclaratăне указанаnot stated
40-44 2064 3 27 52 229 772 765 179 17 9 2 9
45-49 1588 – 4 24 43 156 605 629 102 13 – 12
50-54 972 1 2 8 12 27 101 410 337 49 12 13
55-59 481 – 1 9 4 7 23 87 203 130 11 6
60 + 329 – 1 1 1 4 8 21 53 87 145 8
Nedeclarată Не указана / Not stated
461 1 18 28 28 21 32 16 15 9 7 286
2006
Total / Всего / Total 12594 160 1862 2606 2299 1618 1455 1126 681 331 164 292
Sub / до / under 20 31 12 9 8 2 – – – – – – –
20-24 859 86 538 179 41 13 1 – – – – 1
25-29 2209 50 943 1002 168 21 9 3 1 1 – 11
30-34 2473 8 272 1050 946 135 29 15 4 1 1 12
35-39 2019 1 44 250 857 685 127 33 5 3 – 14
40-44 1648 1 22 66 204 590 612 112 29 4 – 8
45-49 1381 1 9 22 40 127 544 508 98 19 5 8
50-54 853 – 2 7 16 19 83 350 300 68 4 4
55-59 447 – 2 2 4 10 27 79 164 136 17 6
60 + 325 – – 1 3 1 3 14 67 93 135 8
Nedeclarată Не указана / Not stated
349 1 21 19 18 17 20 12 13 6 2 220
2007
Total / Всего / Total 13923 163 1961 2905 2545 1836 1486 1310 794 338 188 397Sub / до / under 20 32 7 18 4 2 – 1 – – – – –
20-24 960 88 609 207 40 12 2 – – – – 2
25-29 2307 48 936 1072 180 47 13 2 1 2 – 6
30-34 2748 15 284 1176 1076 136 29 15 5 – – 12
35-39 2255 2 60 309 932 752 148 32 8 2 – 10
40-44 1811 − 15 67 223 687 619 161 24 6 2 7
45-49 1551 − 11 29 54 150 535 609 119 26 4 14
50-54 943 3 6 8 10 24 93 377 354 49 11 8
55-59 504 − 2 5 7 18 72 218 150 28 4
60 + 339 − − 3 3 3 9 25 57 96 139 4
Nedeclarată Не указана/Not stated
473 − 22 28 20 18 19 17 8 7 4 330
2008
Total / Всего / Total 12601 132 1878 2718 2215 1777 1394 1198 680 349 156 104Sub / до / under 20 25 3 13 7 1 1 − − − − −
20-24 880 75 568 190 31 11 2 3 − − − −
25-29 2193 39 901 1031 169 34 12 3 4 − − −30-34 2515 7 313 1080 897 159 37 15 3 2 − 2
35-39 2129 6 57 293 845 764 113 36 11 3 − 1
40-44 1629 1 13 70 190 612 577 139 15 9 − 3
45-49 1466 1 6 28 56 158 550 542 105 14 3 3
50-54 901 3 6 18 27 87 369 333 49 6 3
55-59 472 7 4 9 9 71 170 181 21
60 + 285 1 4 2 1 4 19 38 89 125 2
Nedeclarată Не указана /Not stated
106 3 2 2 2 2 1 1 2 1 90

49
Divorţuri după durata căsătoriei şi grupa de vîrstă a soţilor Разводы по продолжительности брака и возрасту супругов
Divorces by duration of marriage and age group of spouses
Durata căsătoriei, ani Продолжительность брака, лет
Duration of marriage, years Grupa de vîrstă, ani Возрастная группа, лет Age group, years
Divorţuri – total Всего
разводов Total divorces
sub до
under 5
5-9 10-14 15-19 20 + nedeclaratăне указанаnot stated
2005 Soţ / Mуж / Husband
Total / Всего / Total 14521 3772 3050 2818 1960 2920 1 Sub / до / under 16 - - - - - - - 16-19 37 37 - - - - - 20-24 933 887 46 - - - - 25-29 2421 1313 1037 71 - - - 30-34 2853 604 1169 1055 24 - 1 35-39 2382 304 358 1035 667 18 - 40-44 2064 207 162 308 836 551 - 45-49 1588 147 82 113 228 1018 - 50-54 972 106 58 66 67 675 - 55-59 481 47 34 34 40 326 - 60 + 329 40 28 33 25 203 - Nedeclarată Не указана Not stated
461 80 76 103 73 129 -
Soţie / Жена / Wife Total / Всего / Total 14521 3772 3050 2818 1960 2920 1
Sub / до / under 16 - - - - - - - 16-19 211 211 - - - - - 20-24 2021 1605 415 1 - - - 25-29 2880 902 1527 451 - - - 30-34 2626 396 584 1433 212 - 1 35-39 2038 210 198 484 1017 129 - 40-44 1741 155 110 172 420 884 - 45-49 1390 127 61 104 160 938 - 50-54 747 64 39 50 55 539 - 55-59 299 23 28 14 25 209 - 60 + 177 13 15 22 15 112 - Nedeclarată Не указана Not stated
391 66 73 87 56 109 -
2006 Soţ / Муж /Husband
Total / Всего / Total 12594 3607 2572 2302 1634 2479 − Sub / до / under 16 31 31 − − − − − 16-19 859 813 46 − − − − 20-24 2209 1307 855 47 − − − 25-29 2473 611 964 859 39 − − 30-34 2019 265 317 848 573 16 − 35-39 1648 187 127 257 656 421 − 40-44 1381 132 84 98 197 870 − 45-49 853 92 50 47 59 605 − 50-54 447 50 43 38 22 294 − 55-59 325 41 32 30 38 184 − 60 + 349 78 54 78 50 89 − Nedeclarată Не указана Not stated
Soţie / Жена / Wife Total / Всего / Total 12594 3607 2572 2302 1634 2479 −
Sub / до / under 16 160 160 − − − − − 16-19 1862 1514 348 − − − − 20-24 2606 972 1267 367 − − − 25-29 2299 364 504 1233 198 − − 30-34 1618 170 149 344 853 102 − 35-39 1455 125 100 137 349 744 − 40-44 1126 127 67 69 109 754 − 45-49 681 72 46 42 48 473 − 50-54 331 27 23 29 15 237 − 55-59 164 17 15 17 18 97 − 60 + 292 59 53 64 44 72 Nedeclarată Не указана Not stated

50
Durata căsătoriei, ani
Продолжительность брака, лет Duration of marriage, years Grupa de vîrstă, ani
Возрастная группа, лет Age group, years
Divorţuri – total Всего
разводов Total divorces
sub до
under5
5-9
10-14
15-19
20 +
nedeclaratăне указанаnot stated
2007 Soţ / Mуж / Husband
Total / Всего / Total 13923 4159 2768 2391 1872 2733 − Sub / до / under 16 − − − − − − − 16-19 32 32 − − − − − 20-24 960 916 44 − − − − 25-29 2307 1414 856 37 − − − 30-34 2748 727 1066 912 43 − − 35-39 2255 350 356 852 684 13 − 40-44 1811 219 158 245 720 469 − 45-49 1551 179 107 115 227 923 − 50-54 943 116 37 62 57 671 − 55-59 504 48 32 47 24 353 − 60 + 339 56 33 33 35 182 − Nedeclarată Не указана Not stated
473 102 79 88 82 122 -
Soţie / Жена / Wife Total / Всего / Total 13923 4159 2768 2391 1872 2733 −
Sub / до / under 16 − − − − − − − 16-19 163 163 − − − − − 20-24 1961 1626 335 − − − − 25-29 2905 1189 1387 329 − − − 30-34 2545 461 570 1268 246 − − 35-39 1836 184 184 390 961 117 − 40-44 1486 151 97 141 367 730 − 45-49 1310 144 53 102 133 878 − 50-54 794 104 38 45 47 560 − 55-59 338 38 22 24 27 227 − 60 + 188 19 13 22 14 120 − Nedeclarată Не указана Not stated
397 80 69 70 77 101 −
2008 Soţ / Mуж / Husband
Total / Всего / Total 12601 3926 2469 1967 1703 2536 − Sub / до / under 16 − − − − − − − 16-19 25 25 − − − − − 20-24 880 838 42 − − − − 25-29 2193 1394 771 28 − − − 30-34 2515 774 957 740 44 − − 35-39 2129 339 343 756 675 16 − 40-44 1629 195 140 198 655 441 − 45-49 1466 152 87 117 199 911 − 50-54 901 93 50 56 66 636 − 55-59 472 65 29 20 25 333 − 60 + 285 36 29 29 19 172 − Nedeclarată Не указана Not stated
106 15 21 23 20 27 −
Soţie / Жена / Wife Total / Всего / Total 12601 3926 2469 1967 1703 2536 −
Sub / до / under 16 − − − − − − − 16-19 132 131 − − 1 − − 20-24 1878 1576 302 − − − − 25-29 2718 1162 1265 290 1 − − 30-34 2215 426 473 1031 285 − − 35-39 1777 232 189 354 889 113 − 40-44 1394 130 73 118 316 757 − 45-49 1198 137 68 75 111 807 − 50-54 680 69 36 42 49 484 − 55-59 349 37 27 14 21 250 - 60 + 156 16 15 20 10 95 − Nedeclarată Не указана Not stated
104 10 21 23 20 30 −

51
Divorţuri după numărul copiilor comuni Разводы по числу общих детей
Divorces by number of common children
Numărul copiilor comuni Число общих детей
Number of common children Anii Годы Years
Divorţuri – total Всего
разводов Total divorces
Fără copii Без детей No children
Cu 1 copil С 1 ребенком
1 child
Cu 2 copii С 2 детьми
2 children
Cu 3 copii С 3 детьми
3 children
Cu 4 copii şi peste
С 4 детьми и более
4 children and more
Numărul copiilor comuni – totalЧисло общих детей – всего
Number of common
children – total
2001 10808 4556 4278 1706 221 47 8565
2002 12698 7226 3761 1444 215 52 7518
2003 14672 9221 3544 1590 264 53 7768
2004 14918 10169 3222 1294 188 45 6574
2005 14521 10078 3029 1173 195 46 6251
2006 12594 8961 2457 1013 128 35 5019
2007 13923 9258 3226 1245 157 37 6345
2008 12601 8855 2578 996 148 24 5119
Divorţuri după numărul copiilor comuni Разводы по числу общих детей
Divorces by number of common children
6252
5472 5451
47494443
3633
4665
3746
6251
5019
6345
5119
6574
7768
8565
7518
0
1000
2000
3000
4000
5000
6000
7000
8000
9000
2001 2002 2003 2004 2005 2006 2007 2008
Divorţuri cu copii
Разводы с детьми Divorces with children
Numărul copiilor comuni Число общих детей Number of common children

52
Divorţuri după numărul copiilor comuni, în profil teritorial, în 2008 Разводы по числу общих детей, в территориальном разрезе, в 2008 году
Divorces by number of common children, in territorial aspect, in 2008
Numărul copiilor comuni Число общих детей
Number of common children Denumirea U.A.T.
Наименование А.Т.Е. Denomination of A.T.U.
Divorţuri – totalВсего разводовTotal divorces Fără copii
Без детей No children
Cu 1 copil С 1 ребенком
1 child
Cu 2 copii С 2 детьми
2 children
Cu 3 copii şi peste
С 3 детьми и более
3 children and more
Numărul copiilor comuni – total Число общих детей – всего
Number of common children –
total
Total / Всего / Total 12601 8855 2578 996 172 5119
Mun. Chişinău 3075 2655 329 86 5 516
Nord / Север / North 3156 1906 878 322 50 1676
Mun. Bălţi 573 345 181 46 1 277
Briceni 196 100 72 20 4 124
Donduşeni 139 111 27 1 0 29
Drochia 293 110 129 46 8 246
Edineţ 239 217 16 5 1 30
Făleşti 276 257 12 6 1 27
Floreşti 312 146 106 52 8 235
Glodeni 176 103 48 19 6 104
Ocniţa 181 97 65 17 2 105
Rîşcani 179 79 59 34 7 148
Sîngerei 286 219 34 29 4 104
Soroca 306 122 129 47 8 247
Centru / Центр / Center 3399 2455 624 274 46 1326
Anenii Noi 455 312 100 37 6 193
Călăraşi 244 241 3 − 0 3
Criuleni 195 98 61 30 6 142
Dubăsari 9 7 − 2 0 4
Hînceşti 416 265 92 49 10 222
Ialoveni 284 280 2 1 1 7
Nisporeni 176 70 68 34 4 149
Orhei 426 386 22 15 3 61
Rezina 279 234 38 6 1 53
Străşeni 304 147 108 45 4 210
Şoldăneşti 118 70 31 14 3 72
Teleneşti 173 130 31 9 3 58
Ungheni 320 215 68 32 5 152
Sud / Юг / South 1691 969 447 220 55 1062
Basarabeasca 122 91 22 5 4 44
Cahul 336 158 110 55 13 261
Cantemir 235 112 70 43 10 188
Căuşeni 284 217 47 17 3 90
Cimişlia 191 106 58 23 4 117
Leova 163 74 54 24 11 138
Ştefan Vodă 236 146 50 35 5 137
Taraclia 124 65 36 18 5 87
U.T.A. Găgăuzia 892 710 112 56 14 269

53
Divorţuri după naţionalitatea soţilor, în 2008 Разводы по национальности супругов, в 2008 году
Divorces by nationality of spouses, in 2008
Naţionalitatea soţiei / Национальность жены / Nationality of wife Naţionalitatea soţului Национальность
мужа Nationality of husband
Total Всего Total
moldoveancă молдованка Moldavian
rusoaicăрусская Russian
ucraineancăукраинкаUkrainian
găgăuzăгагаузкаGagauz
belarusă беларускаBelarusian
evreică еврейка Jewess
bulgăroaicăболгарка Bulgarian
alta другая other
Total / Всего / Total 12601 6327 650 841 350 11 18 135 4269Moldovean Молдованин Moldavian
5799 4690 244 275 28 4 5 43 510
Rus Русский Russian
495 185 105 103 11 5 9 77
Ucrainean Украинец Ucrainian
764 304 101 243 2 4 3 8 99
Găgăuz Гагауз Gagauz
263 24 15 12 129 – – 13 70
Belarus Беларус Belarus
18 8 5 1 – – – – 4
Evreu Еврей Jew
26 15 5 4 – – – – 2
Bulgar Болгарин Bulgarian
96 23 14 10 6 – 1 19 23
Alta Другая Other
5140 1078 161 193 174 3 4 43 3484
Numărul divorţurilor după luna desfacerii căsătoriei, în 2008 Число разводов по месяцам расторжения брака, в 2008 году
Number of divorces by month of divorce, in 2008
1083 11
31 1170
871
980
855
788
1017
945 99
7 1021
147 18
8
160
147
129 16
1
152
132
138
134
149
1218
898
1059
1140
1002
917
1178
930
875
743778
751
1003
215
0
200
400
600
800
1000
1200
1400
I II III IV V VI VII VIII IX X XI XII
Total / Всего / Total Urban / Город / Urban Rural / Село / Rural

54
MIŞCAREA MIGRATORIE A POPULAŢIEI МИГРАЦИОННОЕ ДВИЖЕНИЕ НАСЕЛЕНИЯ
POPULATION MIGRATION
Numărul emigranţilor, imigranţilor şi repatriaţilor Численность эмигрантов, иммигрантов и репатриантов
Number of emigrants, immigrants and repatriates persoane / человек / persons
2001
2002 2003 2004 2005 2006 2007 2008
Emigranţi / Эмигранты / Emigrants 6446 6592 7376 7166 6827 6685 7172 6988
Imigranţi / Иммигранты / Immigrants 1293 1297 1620 1706 2056 1968 2070 2749
Repatriaţi / Репатрианты / Repatriates 1462 1614 1285 1816 1131 1608 1763 2023
Repartizarea imigranţilor conform cetăţeniei Распределение иммигрантов по гражданству
Distribution of immigrants by citizenship
persoane / человек / persons
2001
2002 2003 2004 2005 2006 2007 2008
Au sosit în Republica Moldova – total Прибыло в Республику Молдова – всего
Arrived in the Republic of Moldova – total
1293 1297 1620 1706 2056 1968 2070 2749
din care, cetăţenii ţărilor/
в том числе граждане /
of which, citizens of:
Bulgaria / Болгарии / Bulgaria 48 46 100 70 86 75 48 45
China / Китая / China 23 23 8 13 13 23 13 16
Iordania / Иордании / Jordan 112 73 39 52 33 20 9 13
Israel / Израиля / Israel 38 40 68 90 94 72 56 183
Kazahstan / Казахстана / Kazakhstan 31 14 22 23 26 19 9 21
Palestina / Палестины / Palestine 12 11 4 1 – 1 – –
România / Румынии / Romania 99 64 79 83 111 171 197 353
Rusia / России / Russia 52 73 121 152 168 182 256 300
Siria / Сирии / Syria 215 243 197 153 101 43 31 36
S.U.A. / США / USA 56 71 91 85 111 112 90 56
Sudan / Судана / Sudan 38 24 39 26 19 5 4 4
Turcia / Турции / Turkey 110 180 196 273 462 443 462 514
Ucraina / Украины / Ukraine 224 196 321 283 393 354 394 579
Altor ţări / Других стран / Other countries 235 239 335 402 439 448 501 629

55
Caracteristica sociodemografică a imigranţilor Социально-демографическая характеристика иммигрантов
Social-demographic characteristic of the immigrants persoane / человек / persons
2001 2002 2003 2004 2005 2006 2007
2008
Numărul imigranţilor – total Численность иммигрантов – всего Number of immigrants – total
1293 1297 1620 1706 2056 1968 2070 2749
din care: / в том числе: / of which:
bărbaţi / мужчины / men 955 963 1167 1224 1421 1320 1437 1876
femei / женщины / women 338 334 453 482 635 648 633 873
copii pînă la 16 ani / дети до 16 лет/ children under 16 years
22 45 18 20 45 43 20 43
pensionari /пенсионеры /pensioners 36 40 40 30 30 71 70 109
Scopul sosirii: Цель прибытия: Purpose of arrival:
imigraţie de familie /семейная иммиграция/ family immigration
323 313 429 551 648 695 847 1100
la studii / на учебу / for studies 679 620 686 615 672 445 221 513
la muncă / на работу / for work 291 364 505 540 731 828 1002 1136
alte motive / другие причины / other reasons – – – – 5 – − –
Nivelul de studii al imigranţilor: Уровень образования иммигрантов: Educational level of immigrants:
superioare/ высшее /higher education 356 400 424 475 556 601 693 903
medii de specialitate / среднее специальное secondary specialized
126 87 206 325 455 540 557 877
medii generale /среднее общее/secondary 767 763 901 793 948 717 672 810
medii incomplete /неполное среднее/ incomplete secondary
16 18 50 55 37 46 75 100
primare sau fără studii /начальное или без образования /primary or without education
28 29 39 58 60 64 73 59
Caracteristica imigranţilor după ţara de emigrare şi scopul sosirii, în 2008 Характеристика иммигрантов по странам эмиграции и цели прибытия, в 2008году Characteristic of the immigrants by country of emigration and purpose of arrival, in 2008
persoane / человек / persons Scopul sosirii / Цель прибытия / Purpose of arrival
Total Всего Total
la studii на учебу
for studies
la muncă на работу
for work
imigraţie de familie
семейная иммиграция
family immigration
Numărul imigranţilor Численность иммигрантов Number of immigrants
2749 513 1136 1100
din care, din: / в том числе из: / of which, from: Bulgaria / Болгарии / Bulgaria 45 34 10 1 China / Китая / China 16 5 11 - Iordania / Иордании / Jordan 13 3 3 7 Israel / Израиля / Israel 183 158 16 9 Kazahstan / Казахстана / Kazakhstan 21 7 4 10 România / Румынии / Romania 353 12 244 97 Rusia / России / Russia 300 38 40 222 Siria / Сирии / Syria 36 8 3 25 S.U.A. / США / USA 56 5 37 14 Sudan / Судана / Sudan 4 3 – 1 Turcia / Турции / Turkey 514 66 339 109 Ucraina / Украины / Ukraine 579 99 101 379 Alte ţări / Других стран / Other countries 629 75 328 226

56
Repatriaţi, pe ţări Репатрианты по странам
Repatriates, by countries persoane / человек / persons
2001
2002
2003
2004
2005
2006
007
2008
Total / Всего / Total 1462 1614 1285 1816 1131 1608 1763 2023
din care, din: / в том числе из: / of which, from: Rusia / Россия / Russia 559 801 643 880 728 830 923 977
Ucraina / Украина / Ukraine 475 541 294 484 239 409 469 651
Alte ţări / Другие страны / Other countries 428 272 348 452 164 369 371 395
Emigranţii conform ţării de destinaţie Эмигранты по странам предполагаемого места жительства
Emigrants by country of destination persoane / человек / persons
2001
2002
2003
2004
2005
2006
2007
2008
Plecaţi din Republica Moldova – total Bыехало из Республики Молдова – всего Left the Republic of Moldova – total
6446 6592 7376 7166 6827 6685 7172 6988
din aceştia, în: / из них в: / of which, to:
Australia / Австралию / Australia 4 2 5 2 3 0 1 –
Belarus / Беларусь / Belarus 110 123 140 128 184 222 187 122
Bulgaria / Болгарию / Bulgaria 3 1 4 1 5 2 4 14
Canada / Канаду / Canada 64 86 79 60 20 18 12 5
Germania / Германию / Germany 861 964 731 487 373 253 253 195
Israel / Израиль / Israel 482 290 235 218 220 201 140 137
Polonia / Польшу / Poland 2 1 1 – 5 8 4 3
România / Румынию / Romania 20 14 16 17 15 8 4 5
Rusia / Россию / Russia 2575 2913 3316 3252 3310 2890 3110 2663
S.U.A. / США / USA 941 627 1084 1082 568 612 695 588
Ucraina / Украину / Ukraine 1350 1531 1712 1853 2057 2350 2663 3163
Alte ţări / Другие страны / Other countries 34 40 53 66 67 121 99 93