Embed Size (px)
Citation preview

7
PONISSERIL SOMASUNDARAN, LEI HUANG, and AIXING FANNSF IUCR Center for Advanced Studies in Novel Surfactants, ColumbiaUniversity, New York, New York
213
214214216
229229239
251
251
I.
II.
m.
Introduction
FluorescenceA. Auorescence principlesB. Applications
ESR SpectroscopyA. Principle of electron spin resonanceB. Applications of ESR to the study of surfactants and polymers
Concluding Remarks
References
IV.
I. INTRODUCTION
Fluorescence and electron spin resonance (ESR) techniques have been widelyused for in situ characterization of the structure of organized surfactant andpolymer assemblies in solutions and in membranes [1-5], and more recently inthose of the adsorbed layers on solids in solutions [6-8]. The underlying principlein using these techniques is that the spectral responses of the fluorescent or para-magnetic species used as probes are highly environment dependent and as suchserve to characterize the environment in which they reside. fluorescence tech-niques can be used to procure information on polarity and viscosity of the mi-croenvironment, aggregation numbers, as well as solute partitioning and diffu-sion, while ESR spectral features can provide information on microenvironmentpolarity, probe orientation and mobility, segmental ordering of alk)d chains, etc.
213
214 Somasundaran et al.
Both fluorescence and ESR are sensitive techniques requiring only minuteamounts of the probe so that minimal distortion of the system occurs as a result ofthe presence of the probe.
In the following two sections of this chapter, fluorescence and ESR are dis-cussed. In each section, the basic principles of the spectroscopic techniques aredescribed first, followed by their major applications in surfactant and/or polymersystems.
II. FLUORESCENCE
A. Fluorescence Principles
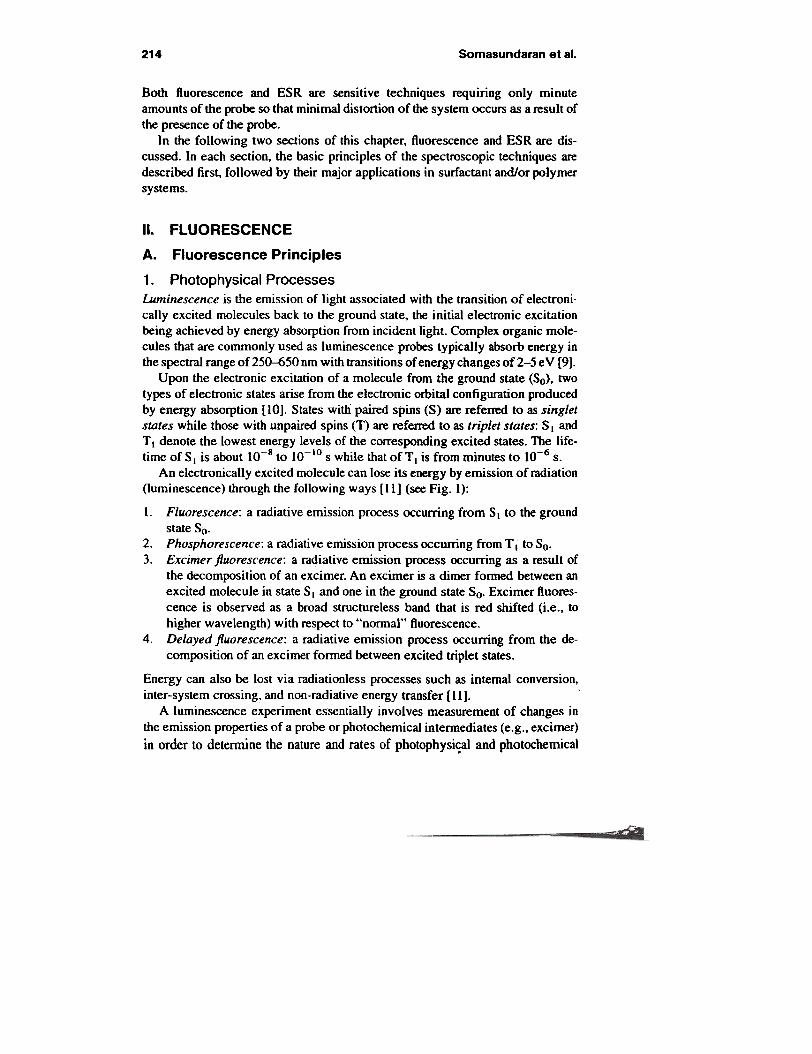
1. Photophysical ProcessesLuminescence is the emission of light associated with the transition of electroni-cally excited molecules back to the ground state, the initial electronic excitationbeing achieved by energy absorption from incident light. Complex organic mole-cules that are commonly used as luminescence probes typically absorb energy inthe spectral range of 250-650 nm with transitions of energy changes of 2-5 eV [9].
Upon the electronic excitation of a molecule from the ground state (So), twotypes of electronic states arise from the electronic orbital configuration producedby energy absorption [10]. States with paired spins (5) are referred to as singletstates while those with unpaired spins (1") are referred to as triplet states: 5 I andT I denote the lowest energy levels of the corresponding excited states. The life-time ofSI is about 10-8 to 10-10 s while that ofT. is from minutes to 10-6 s.
An electronically excited molecule can lose its energy by emission of radiation(luminescence) through the following ways [II] (see Fig. I):
I. Fluorescence: a radiative emission process occurring from SI to the groundstate So.
2. Phosphorescence: a radiative emission process occurring from T I to So.3. Excimer fluorescence: a radiative emission process occurring as a result of
the decomposition of an excimer. An excimer is a dimer formed between anexcited molecule in state S I and one in the ground state So. Excimer fluores-cence is observed as a broad structure less band that is red shifted (i.e., tohigher wavelength) with respect to "normar' fluorescence.
4. Delayed fluorescence: a radiative emission process occurring from the de-composition of an excirner formed between excited triplet states.
Energy can also be lost via radiationless processes such as internal conversion,inter-system crossing, and non-radiative energy transfer [II].
A luminescence experiment essentially involves measurement of changes inthe emission properties of a probe or photochemical intermediates (e.g., excimer)
in order to detennine the nature and rates of photophysi~al and photochemical

Fluorescence and ESR Spectroscopy 215
AG. 1 Energy state diagram showing important photophysical pnK:eSses following excitation of luminescent probe.
processes in the system. In this respect. fluorescence is a much more widely usedtechnique than phosphorescence in probing studies. The responses measured influorescence studies include spectral distribution, emission yields, lifetimes andemission polarization and the changes in them as a result of processes such asquenching (or sensitization), and energy transfer. These responses are sensitive tochanges in the microenvironment of the probe so that a luminescence probe indifferent microenvironments will display experimentally distinct luminescenceproperties that will uniquely characterize each microenvironment [12].
2. Fluorescence Techniques and InstrumentationThe two common measurements made in fluorescence experiments involve fluo-rescence spectra and/or emission lifetimes.(a) Fluorescence Spectra. A fluorescence spectrum is plot of fluorescence in-tensity (If) emitted by molecules versus wavelength (X). The fluorescence inten-sity (It) can be given using the Beer-Lambert law as [II]:
If = 10<1 - IO-EcI»r (1)
where 10 is the intensity of the incident light, E is the molar absorptivity (molecu-
lar extinction coefficient), C is the concentration of the solute (in moles per liter),

216 Somasundaran et 81
I is the path length of the sample (in centimeters), and <t>c is the quantum yield offluorescence.
The quantum yield of fluorescence is defined as the ratio of the number of flu-orescence quanta emitted to the number of quanta absorbed to fonn a singletexcited state. It is generally less than unity due to molecular processes thatcompete with ftuorescence. Usually it is measured relative to a standard, e.g.,quinine sulphate and quinine bisulpliate in 0.1 N H2SO4 <4»&), and the quantumyield of the unknown compound is detennined as follows [II]:
= Area of fluorescence emission CU1'\lt' of unknown X .I..(2)4»c A .I' jl . . if ndard '!'c. rea oJ uorescence emzsswn curve 0 sta
Auorescence spectropbotometers foc measuring spectral distribution typicaJlyconsist of a light source (xenon lamp), motorized scanning excitation and emis-sion monocbromators (diffraction gratings), a sample chamber, a photomultipliertube for detecting the signa], and the necessary electronics for recocding the fluo-rescence spectrum [13].
(b) Fluorescence Lifetimes. The unimolecular fluorescence lifetime (T) of anexcited state is defined as the time required foc the concentration of the moleculesin that state to decay to lIe of their initial value. The inherent radiative lifetime(To) is the lifetime obtained if no radiationJess processes occur [11]:
t~
~f TO = T (3)
Auorescence lifetimes can be detennined by measuring the fluorescence in-tensity following a pulsed excitation. In this case, the intensity decays accordingto a first-order rate equation [II]:
If = 1«0> e-tiT (4)
where 1(0) is the initial fluorescence intensity at time t = 0 and If is the ftuores:'cence intensity at time t
A single-photon counting method is widely used to measure lifetimes [13), i.e.,times between the excitation pulse (flash-lamp discharge) and the alTival of thefirst photon at the detection system (photomultiplier). This time is converted to aproportional voltage by a time-amplitude circuit (TAC) and the resultant pulseheight infonnation is stored in an appropriate location in a multi-cbannel ana-
lyzer.
B. ApplicationsA substantial amount of research has been directed towards the study of the struc-ture and dynamics of micelles using fluorescence techniques, and several excel-lent reviews have appeared on this topic [14-19]. It has also been extensivelyused to study surfactant-polymer systems [20]. Based on the same principles, thefluorescence technique has been adapted as a tool to ihvestigate the microstruc-

217Fluorescence and ESR Spectroscopy
ture of adsorbed layers of surfactants and polymer conformations on solids. Fol-lowing the independent works of Levitz et aI. [21] and Somasundaran et aI. [22J,much work has been done using fluorescence to characterize surfactant andpolymer layers at the solid-liquid interface. The fluorescence study of surfactantand polymer aggregates at the solid-liquid interface, which have been caIled sol-loids (surface colloids), is examined in this chapter.
Various probes have been used to detennine molecular properties such as po-larity, fluidity (or viscosity), and aggregation number of micelles and solloids, aswell as polymer conformation in solution and at the solid-liquid interface. Exam-ples of these are given in the following sections.
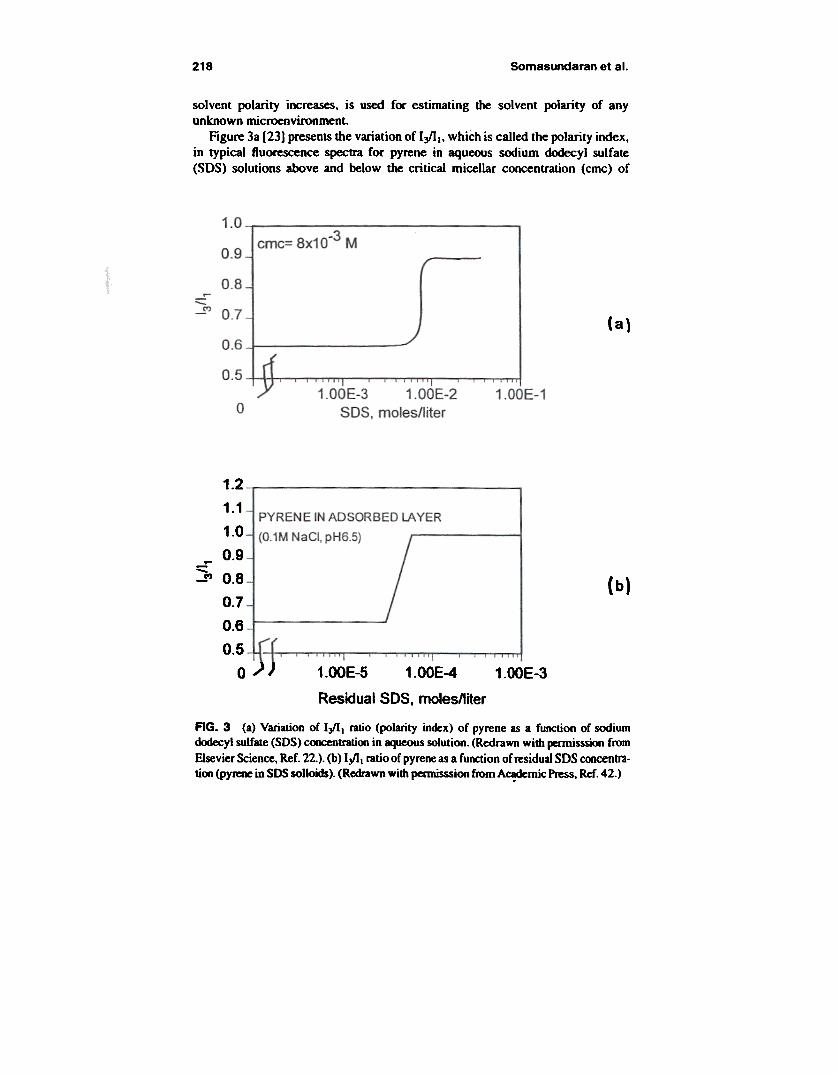
1. Micropolarityfluorescence probes afford a convenient method for characterizing the microen-vironment of micelles and solloids in tenDS of their polarity. In principle, any flu-orescence response that is solvent dependent may be used but steady-state emis-sion techniques are commonly used. The emission spectra of a particular probecan be determined in solvents of known polarity, and the polarity of the mediumunder investigation compared with diem.(a) Pyrene Fluorescence. Symmetrical aromatic molecules such as pyreneshow marked solvent dependence in the fine structure of their emission spectra, asillustrated in Fig. 2. The bands in the spectra, labeled I through V, are consideredto correspond to the transition of pi electrons from the excited state to the variousvibrational modes of the ground state. The changes in relative intensities of thefirst and third bands (lilt> which shows the greatest solvent dependency, are par-ticularly noted. Kalyanasundaram and Thomas (23J examined this variation in anumber of solvents and proposed an explanation in terms of the interaction of thesolvent dipoles with the excited singlet states of pyrene and suggested the ratio1111 as a measure of this interaction. Qualitatively, Ill., which decreases as the
~ Irtensi:y(arblraryris)~~-~ l~ensiy(albiraryW1ls)
~ (1m) ~A (1m)
AG. 2 Schematic diagram or solvent polarity effect on pyrene Ouorescence emissionspectrum. .
218 Somasundaran et al.
solvent polarity increases, is used for estimating the solvent polarity of anyunknown microenvironment.
Figure 3a [23] presents the variation of I ~ 1, which is called the polarity index,in typical fluorescence spectra for pyrene in aqueous sodium dodecyl sulfate(SDS) solutions above and below the critical micellar concentration (cmc) of
(a}
(b)
1.2
1.1
1.0
0.9.-~ 0.8
0.7
0.6
0.5 -J.J::'. . . . .. ... ... . .. ... . ...0 J J 1.00E-51.00E-4 - - -1-.00E-3
Residual 50S, moles/liter
AG. 3 (a) Variation of I~t ratio (polarity index) of pyrene as a function of sodiumd<Xtecyl sulfate (SOS) coocentrauoo in aqueous solution. (Redrawn with pennisssion from
Elsevier Science. Ref. 22.). (b) I~t ratio of pyrene as a function of residual 50S concentra-tion (pyrene in SOS sol~). (Redrawn with pennisssion from A~rnic ~ Ref. 42.)

219Fluorescence and ESR Spectroscopy
SOS. As the surfactant concentration exceeds the cmc. pyrene is preferentiallysolubilized in the relatively hydrophobic regions of the micelles with a corre-spondingly abrupt increase in the I~l ratio. This parameter can therefore be usedto monitor the onset of micelle formation.
lYpicai polarities for micellar systems are given in Table I [23J. In all cases.the polarity index of the micellar medium as monitored by the probe is observedto be between that of alkane hydrocarbons (1.65 for hexane and 1.67 for dode-cane) and water (0.63), suggesting that pyrene does report some water around it.This behavior could be due either to pyrene being located near the surface of themicelle, or to water penetration into the interior of the micelle. Evidenceseems to be in favor of pyrene solubilization in the inner layer of themicelle. For example. proton-NMR studies of cetyltrimethylammonium bromide(CH3(CHvIsN(CH3hBr) solutions show the CH3(CHVn protons to undergo themost significant chemical shift in the presence of solubilized pyrene suggestingthat pyrene is located towards the micelle interior [24 J. With the assumption of aninner layer solubilization site for pyrene in the micelle. the variation of I~ Ivalues for the various micellar systems presented in Table I was attributed to thedegree of water penetration in the micelle structure as permitted by the size of thepolar head group. The ratio is higher for micelles with compact head groups. in-dicating a smaller water penetration [23J.
The I~I values of pyrene have been used more recently also for studyingsolloid systems, the first being for the alumina/SOSIwater system (Fig. 3b) atconcentrations corresponding to various regions of the SOS adsorption isothermon alumina (Fig. 4) [22J. The I~I given in Fig. 3b is marked by an abrupt changein local polarity of the probe from that of an aqueous environment to a relativelynon-polar micellar type environment. It is to be noted that this change occurs in aregion that is well below the cmc and coincides with the concentration at whichhemimicellar solloids form. In the plateau region. the I~I value is similar to themaximum value for SOS micellar solutions. indicating full aggregation of the sur-factant species on the solid surface. It can also be seen that the polarity parameteris fairly constant throughout most of Region m (see Figs. 3b and 4) and above.and thus independent of surface coverage.
TABLE 1 I:tII. Ratio of ~ in Various MiceUea
0.95
0.88
0.77
0.74
0.73
0.76
'fDodecylammonium chloride (DDA)SOOium dodecyl sulfate (SDS)Cetyltrimethylammonium bromide (crAB)Cetyltrimethylammonium chloride (crAC)Dodecyltrirnethylammonium chloride (DTAC)TritonX-lOO
Sotur~ Ref. 23.

220 Somasundaran et al.
... , 0-'e~~..~Z 10-'00i=G..~0U) 10-11QC
a..I
~~ 10-'2.
~.~ ~SDS ONLY
6SDS WITHPYRENE
10-'41 0 0 0 :..10-5 10-4 10-3 10-2-
RESIDUAL DODECYLSULFATE. "'O1..JOllf.r
FIG. 4 Adsorption isOlherm of SOS 00 alumina. The numbers are surfactant aggregationnumbers detennined for various adsorption densities. (Reproduced with pennission fromAmerican Chemical Society, Ref. 41.)
Other surfactant/polymer systems at the solid-liquid interface studied usingpyrene as a probe include isomeric surfactants with changes in the position of thesulfonate and the methyl groups on the aromatic ring of alkylxylenesulfonates[25], anionic-nonionic mixed surfactants [26J, and Dapral (a polymer with multi-functional hydrophobic and hydrophilic groups) [27).
(b) Polarity Probes and Location in Micelles. Many other molecules showsolvent dependent changes and can effectively function as polarity prores. Forexample, the fluorescence spectrum of pyrenecarboxyaldehyde (PCHO) under-goes a red shift with increase in solvent polarity [28). It is a probe of particular in-terest in micellar studies because it is considered as a probe for the surface of themicelle [24,28-30]. NMR and ultraviolet (UV) studies have shown that aromaticcompounds with hydrophilic groups such as ketones, aldehydes, and alcohols aresolubilized in micelles with the hydrocarbon (aromatic) moiety oriented towardsthe interior and the hydrophilic groups protruding or anchored at the surface ofmicelles [31,32J. Proton NMR studies similar to that described above for pyrenehave confirmed this mode of solubilization for PCHO [24).
The preceding discussion on the probes, PCHO and pyrene, shows that infor-mation from different regions of the micelle can be obtained owing to the locationof these probes, i.e., micelle-water palisade interfacial layer for PCHO and theinner layer for pyrene. Turro et aI. synthesized indole detergents, which, becauseof their long hydrocarbon chain, can be incorporated in micelles with the indole
50S/ALUMINAO.1M NaCI. pH 6.~
u2u
1212
12149
In-'
~""g 10-13Q

221Fluorescence and ESR Spectroscopy
ftuorophore located in the micellar core [33,34]. Indole can thus serve as a probefor the micellar core. The fluorescence maximum of indole was found to be redshifted with increasing solvent polarity: 333 nm in dodecane and 372 nm in water.
Turro and Kuo [30] utilized this difference in spatial location of probes to de-scribe the changes in polarity from the surface to the interior for several micellarsystems. This concept is illustrated in Fig. 5 for the ethoxylated nonionic suffac-tant. ~hEO7 .5' The authors interpret the results in terms of the degree of waterpenetration into the micelles: while the surface and inner layers of the nonionicsurfactants appear to contain comparable amounts of water (as reported by the
probes PCHO and pyrene), the micellar core is relatively dry (as reported byindole). This conclusion is consistent with the general picture of the nonionicethoxylated micelles, in which the hydrated ethoxy groups make up the outer
Probes (Parameter)
PCHO
<>..PAF)
P
(I~1)
~
I(~11
I
~
In
().lnF>
FIG. 5 Polarity change (dielectric constant) from surface to interior of C9PhEO9.smicelle based on measured polarity response of probes located in different regions (A PAF'fluorescence maximum for pyrenecarboxyaldehyde; A Info ftuorescence maximum focindole; E, solvent dielectric constant). (Redrawn with pennission from Ametican Chemical
Society, Ref. 30.)

222 Somasundaran et al
layer of the micelle and the phenyl and alkyl chains form the core [35J. The aboveexample illustrates how manipulation of the probe structure can be used to studythe different regions of micelles.
When the medium is an organic solvent. a probe of appropriate hydrophobic-ity bas be to used. For example, a relatively hydrophobic molecule, 7-dimethylamin0-4-methylcoumarin. was used to probe the orientation of thepolymer, DapraI GE202 (maleic anhydride-a.-olefin copolymer with both hy-drophobic and hydrophilic side chains), at the alumina-toluene interface [27J.The spectrum in the absence of DapraI is similar to that obtained in water(maximum emission at 470 nm). This is attributed to the hydrophilicity of thebare alumina surface. With an increase in polymer adsorption, the maximumwavelength shifts towards the shorter wavelength range reaching the value forhydrocarbon solvents (390 nm). This observation suggested the mechanism ofpolymer adsorption to be through the interaction between the ethylene oxidechains and the hydroxyl groups on the alumina surface with the hydrocarbon sidechains dangling toward the solution and eventually fully covering the aluminaparticles.
2. Micelle Fluidity (Microviscosity)The fluidity of a probe molecule in a micelle can be substantially different fromthat in the bulk aqueous phase. Thus the "microviscosity" experienced by theprobe in the micelle will differ considernbly from the macroscopic viscosity ofthe micellar solution [12]. The concept of using fluorescence probes to determinethe effective microviscosity (or microfluidity) of a microenvironment such as amicelle or a solloid is based on the measurement of fluorescence properties thatdepend on the mobility of the probe in that environment. A commonly usedmethod in this regard involves the intramolecular excimer formation of bichro-mophoric probes [36-38], as discussed below.
The extent of excimer fonnation is dependent on the diffusional mobility ofthe probe reactants involved. This mobility is lower in a medium of high viscos-ity with the result that the extent of excimer formation is decreased with any in-crease in viscosity [9]. In homogeneous solvents, the efficiency of pyrene inter-molecular excimer formation can be utilized for the determination of viscosities[39]. This method, however, poses problems for studies in micellar systemsbecause probe distribution can affect the extent of excimer formation [40). A vari-ation of the excimer formation technique that circumvents this problem is the useof bichromophoric probes such as alkane diarenes that are capable of fonning in-tramolecular excimers [36]. The efficiency of intramolecular excimer formationdepends on the motion of the arene groups in order to achieve the excimer forma.,tion as shown in Fig. 6.
The excimer formation can be kept exclusively unimolecular by keeping theprobe concentration sufficiently low such that there is no probability of micelles

223Auorescence and ESR Spectroscopy
/ , Pt.au 01t""I
.AI' .AI" k*
Excimer (Ar- 2)Monomer (Ar*)
Probe 1: G = CH2' Ar = 1-pyrenyt
Probe 2: G = 0, Ar = 4-biphenyl
Probe 3: G = CH2' Ar = 1-naphthyl
AG. 6 Schematic representation of intra-molecular excimer formation of alkyldiarenes
containing more than one probe. Under these conditions therefore. only the vis-cosity of the micelle determines the extent of excimer formation. The monomer toexcimer ratios obtained for the probe in micelles can be compared to those in sol-vents of known viscosity and the effective microviscosity of the micelle deter-mined. Table 2 shows typical microviscosities obtained using the intramolecularexcimer formation technique for the listed probes (9]. In general. the micellar mi-croviscosities indicate that the micelle medium is more rigid (10-40 cP) than thehydrocarbons (1-2 cP) but still liquid-like. However. there also appears to be aneffect of probe size in that the smaller probes report larger microviscosities for thesame micelle. This would suggest comparison of microviscosities of differentsystems using the same probe.
The ratio of the monomer and excimer yield (I./Im) for 1.3-dinaphthyl propane(DNP) has been determined for the dodecyl sulfate solution and the adsorbed layerfor the various regions of the adsorption isotherm (42]. By comparing the IelImvalues of DNP in mixtures of ethanol and glycerol of known viscosities. a micro-viscosity of 90-120 cP was obtained for the dodecyl sulfate adsorbed layer while 8cP was obtained for its miceUes. A higher value of microviscosity of the solloid as
reported by DNP is indicative of a highly condensed surfactant assembly.

Somasundaran et al.224
TABLE 2 Micelle Microviscosity Measured by Intramolecular Excimer Fonnationof Alkyldiarenes
Viscosity, cP (WOC) ReferenceProbe Micelle
22191020429
3139
4138313131363636
SDS5DSSDScrACcrABSDScrACcrAB
2
3
s--: a.f. 9.
tl..i.,. ~
t:.~
ttJ
II,:ft.\
If!11
3. Aggregation SizeThe fluorescence method has been frequently used to determine the size of mi-croenvironments such as micelles [1.9.12] and solloids [42,43]. This essentiallyinvolves measurement of the extent and kinetics of specific photochemical reac-tions in the environment of interest Photochemical reactions followed in suchstudies are usually diffusion-controlled quenching reactions [9]. When a fluores-cence probe is excited by a short nanosecond pulse of light. its decay is enhancedin the presence of molecules that act as quenchers. The lifetime of the probe underquenching conditions would be determined by the concentrations of the quencherand the probe as well as the rate at which they diffuse and encounter each other.Kinetic analysis of the fluorescence decay profiles can therefore provide infOlD1a-tion on the local concentration of the reactants and hence the size of the local en-
vironment.A commonly used method for analysis of aggregation studies utilizes the
excimer formation tendency of aromatic molecules such as pyrene [44]. The pha-tophysics of pyrene can be represented as shown below:
P~P* ~ P+ hv
p + p* ~ P*2 ~ P + P + hv
In sufficiently dilute systems (with respect to the probe) only excitation and radia-tive decay of p* occurs. When the concentration of the probe is increased. p* c~interact with ground state P to form an excimer P*2' The decay of p* is thus en-hanced The unexcited probe serves as quencher of the fluorescence of P*. Theexcimer that forms is a distinct photochemical dimer that exists only in the excitedstate with its own characteristic fluorescence. For the c~ of pyrene. the excimerfluorescence can be readily observed as a broad spectral band centered around 480

Auorescence and ESR Spectroscopy 225
nm that is red-shifted with respect to the monomer emission (3r0-420 nm) [10].The extent and kinetics of the monomer (P*) and the excimer (P2.) can thus be in-dependently monitored. The dynamics of excimer formation can be used to obtaininformation on the characteristics of the environment in which it occurs.
In fragmented media composed of micelles, solloids, or other aggregates oflimited size in which pyrene is solubilized, the probability of the excited singletstate of pyrene (P*) leaving one aggregate and interacting with a ground state ofpyrene from another aggregate during its excited .lifetime is very low: the exit ofpyrene from micelles is a millisecond phenomenon compared to its nanosecondfluorescence [9J. Hence, the excimer formation of pyrene is essentially an intra-aggregate process. Only those aggregates that contain more than one pyrene at theinstant of flash excitation can give rise to excimers. On the time scale of the fluo-rescence, therefore, the micelles or solloids are considered as fixed solubilizationsites with pyrene randomly distributed among them. The system can ~ viewed asgroups of individual micelles or soUoids with probe occupancies of 0, 1,2,3, etc.The relative size of each group is determined by the total number of probes avail-able. This situation can be expressed mathematically by Poisson statistics [40,45Jas given below:
Pn = nn exP(-n)/n! (5)
where Po is the probability of micelles with n probes and n is the average numberof probes per aggregate.
The kinetic model to describe intra-micellar excimer fOlmation for the ensem-ble of micelles, MPo' where n = 1,2,3,. . ., is as follows [46J:
MP D ~ MP.P 0-1 excitation of ensemble
M~P.-1 ~MPD + hI! first-order radiative decay ofmonomer
first-order intra-micellar excimerformation
first-order radiative decay of excimer
(n - l'k:MP*Pn-1 ,- -'~~ MP*2Pn-2
MP*2Pn-2 ~ MPn + hv
where ko and kz are the reciprocal lifetimes of p* (in the absence of excimer for-mation) and P*z, respectively. In this scheme. intra-micellar excimer formation isfirst order with a rate that increases as the number of probes in the miceUe in-creases; ke expresses the intra-micellar encounter frequency of P* and P [alterna-tively, (n - I)kc is the rate at which a micelle, MP*P(n-IP converts to
MP*Zp(n-Z)J.This model yields the foUowing relation for the time dependence of monomer
emission [46J:
Im(t) = Im(O)exp[-kot + n(exp(-ket) - 1)] (6)

226 Somasundaran et al.
where ko and ke are as defined previously, Im(O) and Im(t) represent the intensityof monomer emissions at time zero and t, and It is the average occupation numberand is given by [2IJ:
n = [P]/[Agg] = [P] x N/[c. - cmc] for micelles= (P] X N/[C, - Ceq.J for solloids (7)
where [P] = total pyrene concentration, N = aggregation number, c. = total sur-factant concentration, [C, - cmc] = concentration of micellized surfactant, and[Ct - Ceq.J = concentration of solloidized surfactant.
Analysis of the monomer decay profiles using Eq. (4) can yield n, from whichthe surfactant aggregation number can be determined. Micelle aggregationnumbers determined using this technique have been found to be in agreementwith those obtained by techniques such as light scattering, osmometry, and cen-trifugation [9].
Inherent in the derivation of the above equation are several assumptions, in-cluding:
1. Complete solubilization of the probe2. Equal probability of occupation with no limit to occupation number for an
aggregate3. First-order kinetics to describe intra-micellar fonnation4. Negligible non-radiative dissolution of the excimer
Vi,-,tt0..f:i1 :~: ~
.'fI ;: ';'1:
~t ,,;
These assumptions have been shown to be valid [21,40,41,46].A kinetic analysis based on the above relation of the decay profiles of pyrene
in the adsorbed layers in different regions of the alumina/dodecyl sulfate adsorp-tion isotherm yielded the aggregation numbers shown in Fig. 4 for dodecyl sulfatesolloids [42]. These results exhibit a picture of the evolution of the adsorbedlayer. The aggregates in Region II appear to be of relatively uniform size while inRegion III a marked growth in the aggregate size occurs. In Region II, the surfaceis not fully covered and enough positive sites remain as adsoIption sites. Since theaggregation number is fairly constant in Region II, further adsoIption in thisregion can be considered to occur by the formation of more aggregates but of thesame size. The transition from Region II to III corresponds to the neutralization ofall positive charges on the mineral (isoelectric point of the mineral), and adsorp-tion in Region III is proposed to occur through the growth of existing aggregatesrather than the formation of new ones due to lack of positive adsorption sites. Thisis possible by the hydrophobic interaction between the hydrocarbon tails of thealready adsorbed surfactant molecule and the adsorbing ones. The new moleCulesadsorbing at the solid-liquid interface can be expected to orient with the ionichead towards the bulk water since the solid particles possess a net negative chargeunder these conditions. Solloid aggregation numbers were also determined for
.
.11.
i~

227Fluorescence and ESR Spectroscopy
tf
alkylxylene sulfonate surfactant with the sulfonate and the methyl groups locatedon different positions of the aromatic ring [25], and alkyl trimethylammoniumbromides of different chain lengths on alumina [43].
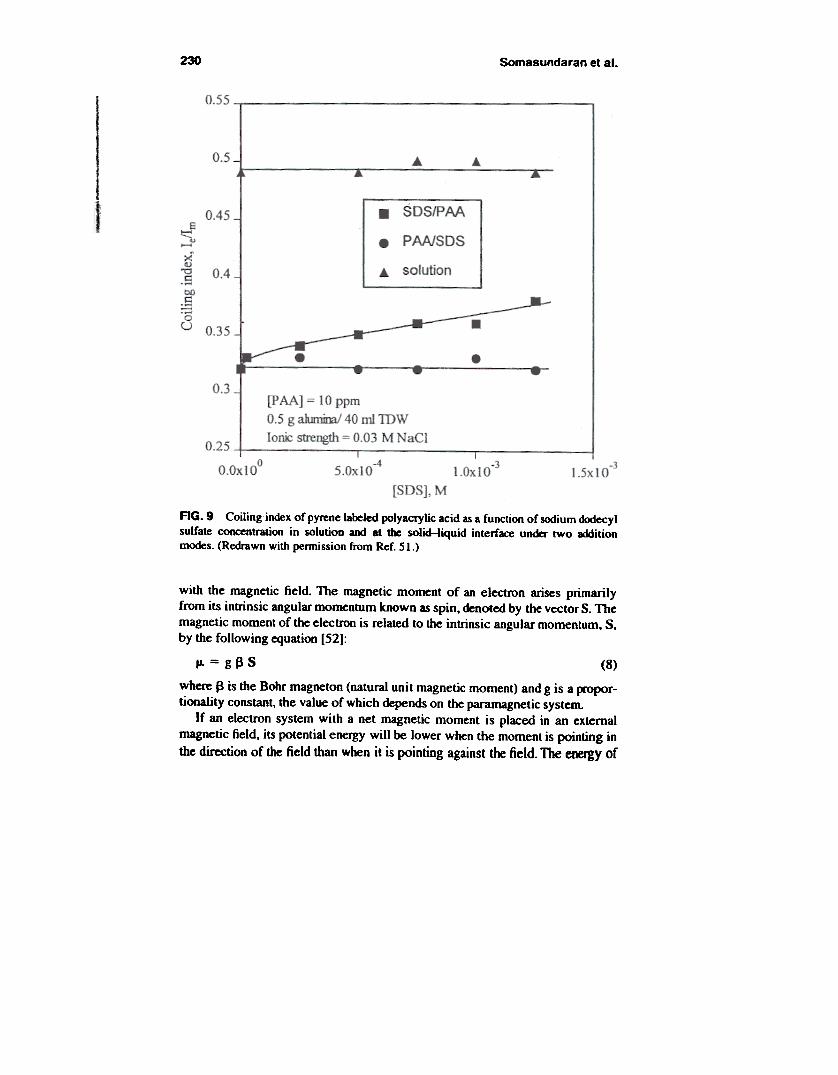
4. Polymer ConformationPolymers can exist in different conformations both in solutions and in the ad-sorbed states. Using a fluorescent labeled polymer and by monitoring the extentof excimer formation it has been shown that the polymer polyacrylic acid (PAA)can have stretched or coiled conformations in solution and at the alumina-liquidinterface depending on the solution conditions such as pH and salt concentration.As can be seen from Fig. 7, for polyacrylic acid, there is a higher probability forformation of intra-molecular excimers between pyrene groups at low pH whenthe polymer is in a favorable coiled conformation [47], and a lower probability athigh pH due to the stretched conformation as a consequence of the repulsionbetween the ionized carboxylate groups on the polymer chain. The ratio of the
~We-'e .
High pHLow pH
CH
I
COOH
~CH- ~.2
FIG. 7 Schematic representation of the conformation of polyacrylic acid (PAA) at high
and low pH values. .

228 Somasundaran et al.
excimer intensity to the monomer intensity, 1eIlm, is a measure of the extent ofpolymer coiling and has been called the "coiling index." pH dependent studieshave demonstrated that PAA adsorbed in the stretched fonn on alumina at highpH was essentially irreversible, while that adsorbed in coiled fonn at low pH wasamenable to stretching when the pH is raised [47J.
The Ouorescence technique has also been applied to more complex particlesystems involving polymeric flocculation [48,49]. In a special case of polymer
0.5
0.4
e:::;,'i.]00
.S~0
u
-\.
0.1 \10 ppmpy-PAA
0.1 MNaC~ pH= 8
I 0 J ..,. , " '. ".. ',.., 0 1 10 100
Concentration of cationic Perco1757, ppm
AG. 8 Coiling index of pyrene labeled polyacrylic acid as a function of cationicpolymer concentration in solution and at the solid-liquid interface under two additionmodes. (Redrawn with permission from Elsevier Science. Ref. -'9.)
fi11
0.3
0.2

229Fluorescence and ESR Spectroscopy
flocculation, combinations of oppositely charged polymers were used as floccu-lants. Using labeled polymer, polymer conformation was obtained and correlatedwith the flocculation response in an attempt to elucidate molecular mechanismscontrolling flocculation and thereby to develop a capability to control floccula-tion by manipulating polymer conformation. Figure 8 shows the change in thecoiling index of PAA due to the presence of a cationic polymer of much highermolecular weight [49]. By examining the coiling index under two additionmodes, sequential addition of the two polymers versus co-addition, the influenceof such modes on ftocculation was explained. Coiling index has been mea-sured also for polymer/surfactant/solid systems [50,51]. For the system ofPANSOS/alumina where both the polymer and the surfactant adsorb on aluminaparticles, good correlation was obtained between PAA coiling index and the sta-bility of alumina suspensions [51]. It can be seen from Fig. 9 that the additionmode is of critical importance to this system. When the polymer is added first,the surfactant molecules adsorbed subsequently are possibly masked by thepolymer loops and tails and hence have no impact on either the PAA coiling orsuspension stability. When SOS is added first, however, a continuous increase inPAA coiling with pre-adsorbed SOS is observed, and a less stable suspension is
obtained.
11III. ESR SPECTROSCOPYElectron spin resonance (ESR), also called electron paramagnetic resonance(EPR), is a fonn of spectroscopy that is widely used for studying molecular struc-ture and dynamics in micelles, membranes, and adsorbed films. An ESR spectrumrecords transitions between spin levels of molecular unpaired (paramagnetic)electrons in an external magnetic field in the form of absorption of microwave ra-diation. Since electron pairing in chemical bonding can cause cancellation ofspins, only transition metal ions and free radicals are capable of exhibiting ESR.The range of applications can be extended by spin labeling (or spin probing)methods whereby stable free radicals or transition metal ions are incorporatedinto syste~ of interest. In this section, first the physical principles of ESR in-cluding the spectral features observed, are discussed and then the application ofspin probing techniques for microenvironmental characterization is described
with examples.
A. Principle of Electron Spin Resonance1. Magnetic Moments, Resonance, and Zeeman SplittingThe electron spin resonance spectroscopic technique deals with transitionsinduced between Zeeman levels of a paramagnetic system situated in a staticmagnetic field. Only species with a magnetic moment are capable of interacting
230 Somasundaran et al.
AG. 9 Coiling index of pyrene labeled polyacrylic acid as a function of sodium dodecylsulfate concentration in solution and at the soIid-liquid interface under two additionmodes. (Redrawn with permission from Ref. 51.)
with the magnetic field. The magnetic moment of an electron arises primarilyfrom its intrinsic angular momentum known as spin, denoted by the vector S. Themagnetic moment of the electron is related to the intrinsic angular momentum, S,by the following equation [52):
fL = g 13 S (8)
where ~ is the Bohr magneton (natural unit magnetic moment) and g is a propor-tionality constant, the value of which depends on the paramagnetic system.
If an electron system with a net magnetic moment is placed in an externalmagnetic field, its potential energy will be lower when the moment is pointing inthe direction of the field than when it is pointing against the field. The energy of

Fluorescence and ESR Spectroscopy 231
the magnetic moment. E, depends on its projection along the magnetic field ac-cording to
E = JL . H (9)
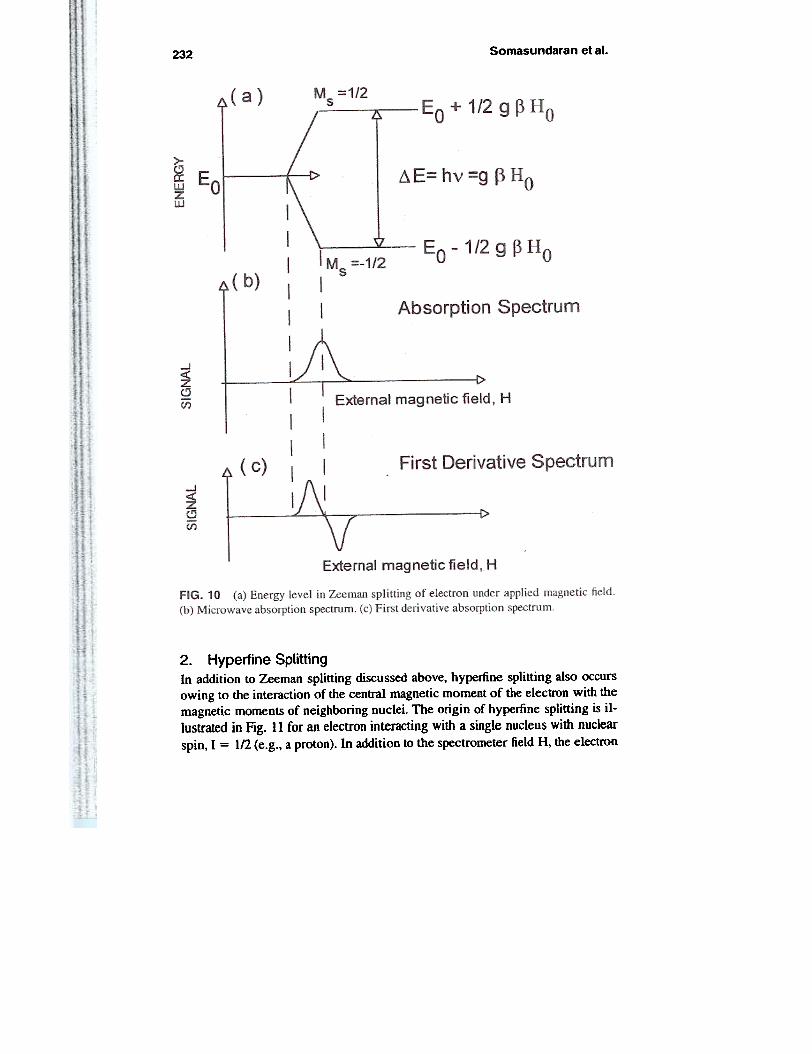
where JL is magnetic moment and H is the magnetic field.For a system with spin S = 1/2, as is the case for an unpaired electron, there
are only two allowed orientations corresponding to spin projections aligned (par-allel) or opposed (anti-parallel) to the magnetic field. These are given by c0mpo-nents of the spin angular momentum, Ms, which can take values of 1/2 (parallel)or -1/2 (anti-parallel). The application of the magnetic field causes the parallelorientation to have a lower energy and the anti-parallel orientation to have ahigher energy than in the absence of the field (Fig. 10). This phenomenon is calledZeeman splitting. The two Zeeman levels are given by
E = Eo :!: 1.'2 g ~ Ho (10)
Electromagnetic radiation (microwave) can provide the energy necessary foran electron to change its spin orientation from the lower to the higher energystate. The resonance for the spectroscopic transition between Zeeman levels is
given by
~E = h v = g P Ho (II)
ESR experiments are carried out at a fixed frequency and the resonance condi-tion is found by varying the intensity of the static magnetic field. If the sample isirradiated with an electromagnetic radiation of constant frequency v, energy ab-sorption will occur at a magnetic value of Ho = (h v)/(g ~). Most ESR spectrom-
eters operate with microwave field at 9.5 GHz (X-band) and 35 GHz (Q-band),the magnetic field at which resonance observed being around 3400 G and 12,500G, respectively. The ESR spectrum obtained with modem equipment is actuallydie first derivative of the absorption spectrum. [This type of spectrum is prefen'edbecause, in this case, the absorption peak position corresponds to the' baselinecrossover and the peak width-conventionaUy measured between the points ofmaximum slope-is given by the distance separating the two maxima of the firstderivative of the absorption peak (Fig. 10).)
The field position at which resonance occurs depends on the microwave fre-quency used. As a consequence, the absorption line is generally characterized byits g-value. This value is proportional to the magnetic moment of the electron,which depends not only on its spin but also on its orbital motion within the atom,molecule, or crystal. Thus the g-value of bound electrons can deviate significantlyfrom the value of a free spinning electron (g = 2.002319). In general, unpaired
electrons in free radicals are largely delocalized over the entire molecule and verysmall g-shifts are observed. The g-value of transition metals can, however, deviatemore significantly because of weU-defined orbital motion around the atoms.
Somasundaran et al.232
2. Hyperfine SplittingIn addition to Zeeman splitting discussed above, hyperfine splitting also occursowing to the interaction of the central magnetic moment of the electron with themagnetic moments of neighboring nuclei. The origin of hyperfine splitting is il-lustrated in Fig. 11 for an electron interacting with a single nucleus with nuclearspin, I = 1/2 (e.g., a proton). In addition to the spectrometer field H, the electron

233Fluorescence and ESR Spectroscopy
H
s
H
~..
FIG. 11 Hyperfineinteraction of electron spin, S, with nuclear spin of different orienta-tions. (Adapted with pennission from Academic Press. Ref. 52.)
spin S experiences a magnetic field HI due to the nuclear magnetic moment. For asystem with I = 1/2, HI can oppose or reinforce the spectrometer field as indi-cated in the figure. As a consequence, each of the two spin states <Ms = :t 1/2) are
split into two sublevels since the unpaired "elec.tron can effectively experi-ence either of the two magnetic fields (Fig. 12a). There are thus two possibletransition (indicated by arrows) allowed by the quantum mechanical selec-tion rules, i.e., M. = - 1/2 and M. = 1/2, which results in two absorption
peaks.The case for a single nucleus with spin I = 1 (e.g., 14N) is depicted in Fig. 12b.
Three orientations of the nuclear spin angular momen.tum relative to the magneticfield are possible, i.e., M. = -1, 0, I, which -result in three possible transitions
and correspondingly three absorption peaks. In general for a nucleus with spin I,
L.."" .,..


Fluorescence and ESR Spectroscopy 235
3. Relaxation Processes(a) Spin-Lattice Relaxatioll. Resonance absorption depicted as a spin transi-tion from the low-energy parallel orientation to a higher energy anti-parallel ori-entation is actually more involved. Electromagnetic radiation is equally effectivein causing spin flip transition in the opposite direction involving emission of radi-ation at the same frequency. Thus a net absorption of radiation will occur only ifthere ~ initially fewer spins in the upper than in the lower state. Under condi-tions of thermal equilibrium this is always the case, since it is energetically favor-able for the spins to be in the lower state. The populations in the two states aredictated by the Boltzmann distribution, given by
nj-;-:r- = exp (-gPHlkT) (12)
At room temperature, the energy splitting is very small, so that there is only aslight excess in population in the lower state, i.e., the ratio is almost unity. Never-theless, this excess is sufficient for maintaining a net absorption of radiation al-though sensitive detection systems are required.
When the system is undergoing electromagnetic transitions, it is no longernecessarily in thermal equilibrium. The population in the two states will soonequalize and no further net absorption would occur. This phenomenon is calledsaturation of the ESR signal. Under normal conditions of measurement, satura-tion is alleviated as a result of spin-lattice relaxation processes. Spin-lattice re-laxation is thus responsible for maintaining the "absorption condition" (inequal-ity of populations) and is a radiationless ~ by which the excess energy inthe higher spin state is lost as heat to atoms and molecules in the surrounding"lattice."
Spin-lattice relaxation depends upon how strongly the spin is "coupled" to thelattice and hence is dependent on the molecular environment. Relaxation timesare short in solids (fast relaxation) but relatively long (slow relaxation) in liquids.In the presence of a microwave field, the energy flows in the spin system at a rateproportional to the microwave power. If the microwave power is too high, thesystem does not have the time to release its extra energy to the lattice and the ab-sorption signal decreases because of saturation. Under conditions of low mi-crowave power where saturation and spin-lattice relaxation effects are minimum,other relaxation mechanisms produce modulation of the magnetic level withoutcausing transitions between them. This relaxation mechanism is known as trans-verse relaxation (in contrast to spin-lattice relaxation also known as longitudinal
relaxation).
(b) Li~ Broadening. The relaxation mechanism discussed previously can be
described by single exponential decays defined with a characteristic time calledthe relaxation time or lifetime, T. According to the Heisenberg uncertainty princi-

236 Somasundaran et al.
pie, the relationship between line width (dH) and relaxation times can be ratio-nalized by the following equation:
~ET - g J3 ~HoT - h (13)
where h is the Plank constant. Thus ifT is small (fast ~laxation) the spectral linesare broadened, and vice-versa. Linewidths are therefore an important feature ofESR since they provide infonnation on the chemical environment of the para-magnetic species present in the system.
(c) Spin-Spin Relaxation. Spin-,spin relaxation processes arise from the inter-action between electron magnetic moments that can result in mUtUal spin flips.This limits the lifetime of the spin in the upper state without changing the numberof spins in that state. As such, spin-spin relaxation, unlike spin-lattice relaxation,does not help to maintain the absorption conditions. It does however contribute tolifetime broadening (according to the uncertainty principle) of ESR lines. indeed,it is often the spin-spin relaxation time rather than spin-lattice relaxation timethat limits the observed line width. Such exchange is also the reason why ESRmeasurements are done with paramagnetically dilute systems in order to get well-resolved ESR lines.
4. Spectral AnisotropyA unique feature of ESR spectra is that the line positions and splitting depend onthe direction of die external magnetic field ~lative to the molecular axis. Thisphenomenon is called spectral anisotropy. Thus one of the advantages of ESRover other fonDS of spectroscopy is its ability to resolve differently oriented para-magnetic centers. The interaction of the magnetic field is dependent on the orbitalgeometry with respect to the direction of the magnetic field so that spectralanisotropy is observed for systems in which the unpaired electron is localizedwithin well-defined orbitals such as in transition metals. On the other hand,systems that are extensively delocalized do not exhibit anisotropy.
Spectral anisotropy is one of the fundamental features observed in spectra ofstable nitroxide free radicals that are used in spin labeling studies. The unpairedelectron is primarily localized in the p1r orbital of the nitrogen atom, as shownbelow:

Fluorescence and ESR Spectroscopy 237
The effects of anisotropy splitting and g-values as a result of the orientation of thespin group can be illustrated by considering spectra obtained for nitroxide radi-cals in the situations discussed below.
(a) Immobilized, Oriented Spectra (Single Crystals). When the nitroxide is in-corporated in a single crystal host. application of the magnetic field parallel to thethree mutually perpendicular axes of the spin group gives rise to the three differ-ent spectra shown in Fig. 13. lntennediate spectra are obtained for orientationbetween these principal axes. The spectral aniSotropy is completely specified byprincipal hyperfine constants. Au. Axx, and Ayy, and the principal g-values. gu.
l1
H
Hal'
2CGI ,
9' 2-00'36
AG. 13 Spectral anisotropy of tertiary butyl mtroxide spin label oriented in single
crystal host The principle axes are indicated. (Adapted with permission from AcademicPress, Ref. 52.)

238 Somasundaran et al.
gxx, and g"". The data for principal constants for many of the nitroxide probes canbe found in the literature [52,53]. For single crystals that are axially symmetric,the anisotropy is specified by g. (=guJ and gl. (=gu=g'f)')' and A. (=AzJ andAi (=Axx=A",,). For intermediate orientations, the g-value and hyperfine split-ting are dependent on the angle 8, which the magnetic field makes with the prin-cipal axes, and they vary in the following manner:
8.2 = 8,2COS20 + g.L 2 sinZO
Ae 2 = A.2COS20 + Ai 2 sin20
Il
(b) Immobilized, Randomly Oriented Spectra (Powder S~ctrum). A powderspectrum or frozen spectrum is obtained when the nitroxide is immobilized butrandomly oriented, e.g., in a frozen solution or in a polycrystalline powder. In thiscase, anisotropic contributions from all different directions are superimposedupon each other and a spectrum of the type depicted in Fig. 14 is obtained.Because of the spectral overlap, much of the detail is lost and only the largest hy-perfine splitting (Au) can be resolved.
(c) Motionally Averaged Anisotropic Spectra. The above anisotropic featuresare observed only for cases in which the nilroxide is essentially immobilized. Ifthe nitroxide molecule is rotating randomly in its environment, all the anisotropyis averaged out and a sharp three line spectrum is observed as in Fig. 14c. Thespectrum is independent of the magnetic field direction and hence calledisotropic. The g-values and the hyperfine splitting are in fact the mean of the prin-cipal axes values. These values are called the isotropic nitrogen hyperfine split-ting constants. AN and the isotropic g-value and are given by
AN = l/3(Au + Au + Ayy)
gN = 1/3(gzz + gxx + gyy)(16)
(17)
10 the case of axial symmetry,
AN = 1/3(A, + 2Al)gN = 1/3(g, + 2gi)
(18)
(19)
If the molecule rotates slowly, an intermediate spectrum between the powdf-fspectrum and the isotropic one is observed (Fig. 14b). Contained within theanisotropic features of these types of spectra is infom1ation on the rotation mobil-ity of the nitroxide label, which can be quantified in terms of rotational correla-tion times or order parameters. Such information forms the fundamental basis ofd~namic investigations using nitroxide radicals as spin probes. Illustrative exam-ples of such studies will be discussed in the subsequent section.

239Fluorescence and ESR Spectroscopy,
(c)
200-1OC
AG. 14 Spectral anisotropy of nitroxide spin label under various conditions of motion.(a) Powder spectrum from nitroxide randomly and rigidly oriented in frozen solution.(b) Liquid dispersion spectrum of nitroxide undergoing anisotropic motion in random ori-entation. (c) Isotropic spectra for nitroxide randomly tumbling in non-viscous solution.(Adapted with permission from Academic Press. Ref. 52.)
B. Applications of ESR to the Study of Surfactantsand Polymers
1 . The Spin Label MethodMost materials have complete electronic ?rbitals achieved, for example, by cova-lent bonding and therefore do not exhibit eith~r any paramagnetic center or ESR

240 Somasundaran et al.
signals. One of the techniques used involves addition of a reporter group to thesystem, the signal of which gives infomlation on its environment [54]. Thismethod has been successfully applied to investigate the molecular structure anddynamics of organized assemblies of amphipathic molecules including liquidcrystals [52], lipid bilayers, vesicles and biological membranes, micellar solu-tions [55,56], and polymers [57,58].
The paramagnetic species used as probe or label are almost exclusively stablenitroxide free radicals, although some interesting information has been obtainedusing transition metal ions as probes [59,60]. The nitroxide free radical is re-markably stable and inert because of the protective effect of the methyl group sur-rounding it. The ESR spectra of this class of compounds are characterized bythree sharp. well-resolved hyperfine lines (ht) corresponding to the coupling of anunpaired electron (8 = In) with the nitrogen nuclear spin (I = I). Some of themost commonly used nitroxides are shown in Fig. 15.
The most critical step of studies using a spin pl"obe is the selection of a probe.The ideal probe should report the properties of a system without disturbing it.Clearly, this ideal probe does not exist and one has always to be aware of thesystem perturbation induced by the probe. In order to limit these perturbations,the nitroxide radicals are usually attached to molecules or macromolecules of in-terest. thus providing probes that closely resemble the molecules that make up thebulk of the environment to be investigated. However. no matter how low its rela-tive concentiation is, the probe molecule detects only an environment constitutedby its nearest neighbors evidently perturbed by the presence of an alien nitroxideradical. It has also to be noted that the probe concentration should be limited so asto minimize spin-spin relaxations.
In the following sections. the use of the spin probing technique for microstruc-tural characterization will be described. Emphasis is on the methodologies andthe structural information that are accessible for ESR investigation and these areillustrated using literature data for microenvironments such as lipid bilayers andmicelles.
2. Hyperfine Splitting and Environment PolarityIt is well known that the overall size of the 14N hyperfine splitting of nitroxidefree radicals (and also to some extent g-values) is deJM:ndent on the polarity of theenvironment in which the nitroxide resides. This feature can be useful since it canreveal whether the probe is situated in the surface or hydrophobic interior regionof micelles. lipid bilayers. or other such microstructures. The overall hyperfinesplitting is characterized by the iso~ic splitting constants. AN. which can be de-tennined directly from the hyperfioe separation of isotropic spectra (Fig. 14) orusing Eqs. (16 and 17) for anisotropic spectra.
The influence of solvent polarity on AN can be viewed as resulting from

Fluorescence and ESR Spectroscopy 241
changes in the relative contributions of the two resonance structures of the naturalfree radical, as given below:
R\Rl "T -N- 00R( Q
1", ../N-Q
R2
'"
'"
I n
Polar solvents tend to stabilize the ionic structure II so that the increase in un-paired electron density on nitrogen results in an increase in the 14N splitting con-stant. On the other hand. non-polar solvents lower the unpaired electron densityon the nitrogen, and this is reflected by a lowering of the AN value. These effectsare clearly seen for AN of tertiary butyl nitroxide in solvents of different p>larities(Table 3). For example, this value is 17.16 G in water while it is 15.10 G inhexane.
The above solvent dependence of the hyperfine splitting, AN' has been used toinvestigate the microenvironmentalp>larity of lipid assembles such as micellesand bilayers [61-63]. Indeed the decrease in AN as a result of solubilization in mi-celles provides an additional spectroscopic method for detennining the onset ofmicellization properties. Attempts to probe different regions of the micelle were
TABLE 3 Nitrogen Hyperfine Splitting, AN. and g- Value for Tertiary Butyl Nib"oxidein Various Solvents
Solvent ~ (Gauss) I
15.1015.4015.4515.5215.6815.8715.8916.0516.6917.16
2.~12.~12.~12.~12.(XW)2.00592.00592.00592.00572.0056
HexanePiperdineEthyl acetateAcetoneAcetonilrilel-Decanol1-OctanoiI-PropanolEthanol-water (I: 1)Water
s"..,.". Ref. 52.

242 Somasundaran et al.
I0
(1). Tempo
-I"
0(2). 4-HydroXY- TEMPO
0(3). 4-Amino- TEMPO
L-",<
(C~)3 ~ -C N-OO<N-O
(4). Tempone
-DOC yk~N-O
(6). Tempyo-
+Rn(CH3)2 N -N-O N-O
(9). Rn- Tempo(8). CAT-no 0=12, 16
CH3-(C~)n>
CL :N-O'"
(10). n-Doxyl Stearic AcKl with different nitroxKle position mng dJe alkyl chain.
FIG. 15 Structure of stable free radicals and related spin probes typically used in ESR
probing experiments.
made using fatty acid with the nitroxide group at different positions of the alkylchain [64]. A common conclusion from such studies is that the nitroxide experi-ences a highly polar environment in micelles irrespective of the overall structureof the probe: The aqueous-like polarity experienced by spin probes has been in-terpreted by some workers as being due to water penetration into the micelle.More recent data on the structure of micelles and on the location of solubilizates

Fluorescence and ESR Spectroscopy 243
suggest that the high polarity is due to the hydrophilic nib"Oxide spending much ofits time near the micelle-water interface [65). This latter model considers theprobes as being sufficiently flexible so that they are capable of bending in themicelle thus enabling the hydrophilic moieties (carboxylate and nib"Oxide) toremain at the surface.
Polarity profiles using this type of fatty acid nitroxide probe have, however,been demonstrated in the case of lipid bilayers. Table 4 shows the data of Seeligand Hasselbach [66) for AN of stearic acid probes with the nib"Oxide attached todifferent carbon atoms along the stearic acid chain (numbered from the carboxy-late group) in a phospholipid bilayer.
It can be seen that AN decreases as the spin label group is moved down thestearic acid chain, corresponding to deeper penetration into the hydrophobic inte-rior of the bilayer. The higher values at the top of the chain reflect proximity to thewater-lipid interface.
3. Spectral Anisotropy, Microenvironment Auidity,and Structural Ordering
The relalionship belween speClral anisolropy and rolational mobilily was intro-duced in an earlier section. [n general, when lhe spin probe is moving rapidly andisolropically, lhe ESR signals consisl of lhree lines of approximalely equal heighl.This high degree of mobility is oblained for small spin labels freely rumbling in anon-viscous Solulion. Immobilization of lhe nitroxide leads lo differential linebroadening since rolalional reorientation is no longer fasl enough lo average oulanisolropies. Such immobilization gives lhe powder spectrum discussed previ-ously (for randomly orienled samples). The changes in the characteristics of theESR speclra of nilroxide wilh degree of immobilizalion can be demonstraledusing solvenls of increasing viscosily in elhanol-glycerol mixtures (Fig. 16). [lcan be seen lhal a decrease in lhe rate of molecular motion results in greater spec-tral anisotropy as a consequence of the increase in viscosity of lhe solvent
During lhe lasl 30 years, lheoretical developmenls have been made in an effortto extract quantitative infonnation from lbe spectra to describe the probe mobilityfrom the spectral lineshape. Basically two fundamental parameters-rolational
TABLE 4 Nitroxide Hyperfinc Splitting, AN, of Stearic Acid Spin Probes in LipidBilaycrs as a Function of Nitroxide Position
Nitroxide position AN (Gauss)
IC-4C-sC-8(-9C-IO
15.114.914.814.814.6
~,
J

Somasundaran et al.244
v:: C OOH
100% ETHANOL
'181cP
67% ETHANOL
'l8SCP
33% ETHANOL
"1.6ScP
20% ETHANOL
"1 .165 cP
9 % ETHANOL
'r1 8-300cP
AG. 16 Typical ESR spectra of oitroxide spin label as a fulx:tion of solution viscosity.(Reproduced with pennission from Academic Press. Ref. 52.)

Fluorescence and ESR Spectroscopy 245
correlation time and order parameter-have been used to characterize the DK>tionof the probe. This is briefly outlined in the next two sections.
(a) Rotational Correlation Tune Rotational correlation times are popularmeasures of isotropic motion. Depending on the probe motion rate, the analyticaldescription of these parameters from the spectrailinesbape varies.
For fast motion. the rotational correlation time is 5 X 10-11 < T < 10-9 s. Forvery fast motion (T < 5 X 10-11 s), the ESR spectrum of nitroxide radical is in-sensitive to the rate of molecular motion. In d1is time domain, the spectrum con-sists of ~ lines of equal intensity. For 5 X 10-11 < T < 10-9 s, the three hy-perfine lines becomes differentially broadened due to partial averaging of theanisotropies of the g and A tensors.
The three lines observed on an ESR spectrum correspond to the first derivativeof a spectrum composed of three energy absorption peaks that can be described,in the case of a fast isotropic motion, by Lorentzian functions for a transverse re-laxation process of relaxation time T 2- Each relaxation time T 2 can be obtainedfrom the width at half height of the absorption peaks, which is 2/f 2. Kivelson de-veloped a relationship between relaxation time T 2 and rotational correlation time[67J. In the case of the nitroxide radical, the dependence of the linewidth Iff 2 onthe nuclear quantum number M (M = -I, 0, + 1) can be described by
[T2(M)J-1 = A + BM + CM2 (20)
The so-called linewidth parameters A. 8, and C depend on the magnitude ofthe anisotropies and on the rate of the molecular orientation in the liquid. Replac-ing M by its value and operating substitutions, Eq. (20) can be rewritten asfollows:
rr2(O)]-I[T2(0)ff2(:tI)-I] = C :t B (21)
where B = 4/15 b ~Ho T. C = 1/8 b2 T. and b = 2'1T[Azz - 1/3(AKK + Ayy + Azz)].
For a Lorentzian function. the linewidth T 2 varies with the square root of thepeak-to-peak ratio of heights of the fust derivative. As a result. the ratios ofT 2(0)ff 2(:t I) can be obtained directly from the ratios of the square root of thepeak heights. In addition. the linewidth [T 2(0)] -I can be obtained from the peak-
to-peak distance of the central line. ~Ho.As can be s:een from the above equations. the relationship between linewidth
and rotational conelation time is system specific since the components of the gand A tensors vary from one probe to another. In the case of doxy I stearic ocid, thecorrelation time T of an isotropically tumbling nitroxide can be expressed by thetwo following relationships (see Fig. 17):
TB (s) = 625 X 10-10 ~Ho [(i<II-I)I/2 - (1<11+1)1/2]. (22)TC (s) = 5.88 X 10⁻¹⁰ ~Ho [<I<II+I>U2 + <1<11-1>1/2 - 2], (23)
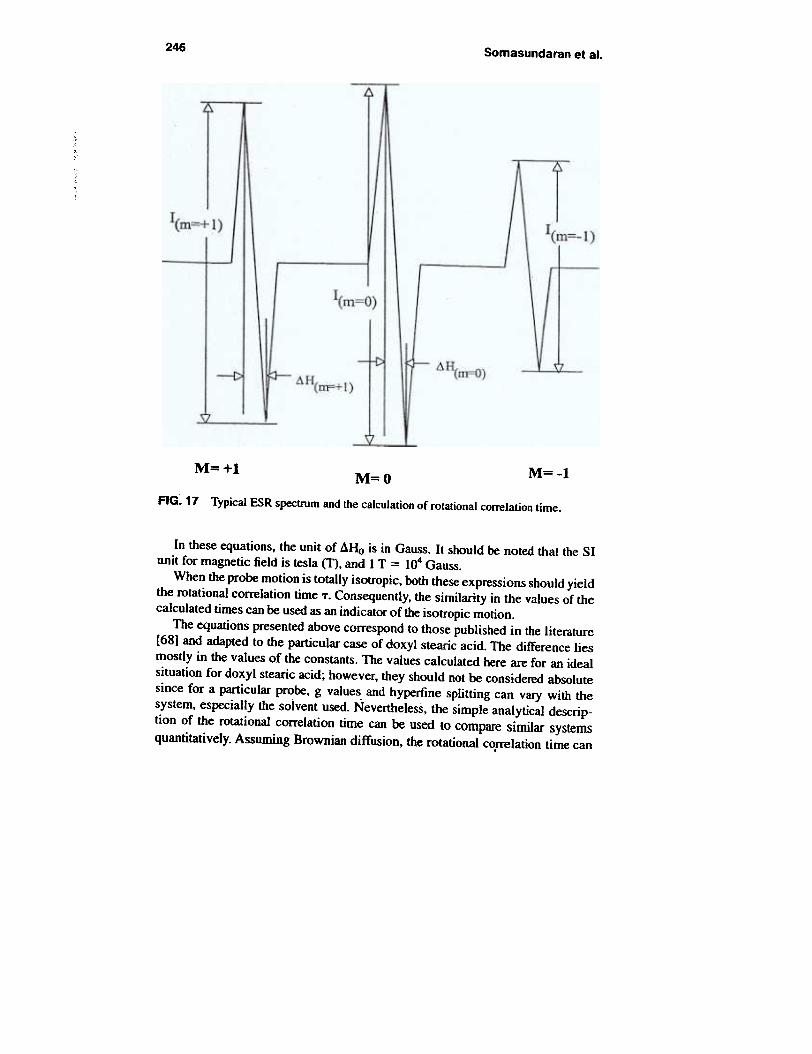
246 Somasundaran et al.
~
M=+l M=-lM=OFIG. 17 Typical ESR spectrum and the calculation of rotational correlation time.
In these equations, the unit of dHo is in Gau.~. It should be noted that the SIunit for magnetic field is tesla (T), and I T = 104 Gauss.
When the probe motion is totally isotropic, both these expressions should yieldthe rotational correlation time T. Consequently, the similarity in the values of thecalculated times can be used as an indicator of the isotropic motion..
The equations presented above correspond to those published in the literature[68] and adapted to the particular case of doxyl stearic acid. The difference liesmostly in the values of the constants. The values calculated here are for an idealsituation for doxyl stearic acid; however, they should not be considered absolutesince for a particular probe, g values- and hyperfine splitting can vary with thesystem, especially the solvent used. Nevertheless, the simple analytical descrip-tion of the rotational correlation time can be used to compare similar systems
quantitatively. Assuming Brownian diffusion, the rotational co,rrelation time can
Fluorescence and ESR Spectroscopy 247 II! I
be used to calculate apparent microviscosity of the medium according to the
Debye-Stokes-Einstein equation:T = (41T 11 R3)/(3kT) (24)
where R is the hydrodynamic radius of the probe, TJ is the microviscosity (assum-ing the probe to be I~er than the solvent molecule), k is Boltzmann's constant.and T is the temperature.
For slow motion, the rotational correlation time is 5 X 10⁻⁹ < T < 10-6 s. Theslow tumbling domain is characterized by an ESR spectrum that can no longer bedescribed by sutJerimposition of Lorentzian lines as in the case of the region offast motion. In the slow motion region, the spectra are affected in a complicatedmanner by both motion and magnetic spin interactions. As a result. the theoriesdeveloped to interpret spectra and rotational correlation times are complex and
require sophisticated computer simulations (53,69-71].
(b) Anisotropic Motion and Order Parametet: When spin labels are incorpo-rated into assemblies as micelles and lipid layers, the high structural order inthese microenvironments hinders the mobility of the spin label. The resultingspectra thus are determined by the anisotropic motion of the labels in these envi-ronments. The degree of immobilization of the spin labels provides 8 means forcharacterizing the fluidity of these environments. Such fluidity of environmentscan be compared on the basis of rotational correlation times. Alternatively, thespectra may be interpreted in terms of an effective microviscosity by comparisonwith spectra obtained in solvents of known viscosity. The microviscosity in thissense is related to the structural order of the microenvironment. i.e., the degree ofpacking of the molecules (surfactant. polymer, or phospholipids). For this reason,the spectral anisotropy is sometimes quantified in terms of an empirical order pa-
rameter, S, given by;
_All - AJ.
Au-Aus=
(25)
which is defined as the ratio of the observed hyperfine splitting to the maximumtheoretically obtainable splitting corresponding to the rigid or "frozen" situation.S = 1 for completely rigid order and S = 0 for the isotropic molecular motion.
Figure 18 shows the type of spectra that can be obtained for various S values fora fatty acid spin label.
A particularly interesting application of the order parameter involves the use oflong-chain spin probes, e.g., fatty acids, with the nitroxide group positioned atvarious points along the alkyl chain [61,72-74]. Such studies have shown that theorder parameter monotonically decreases as the nitroxide group is moved awayfrom the carboxylate moiety and hence away from the lipid-water interface.Thus, close to the lipid-water interface, the motion is highly an}sotropic, but

248 Somasundaran et al.
2~" .,-_p$-1.0 S &o.~
"'". . ,9. . .---
~ "',L
. . ~ .. . .-
5-0.4
I '!J:. . .. ~ .
S=0.8 $'0.3
~
/\SaO.7 5-0.2
; . .. . .
S-O.I
$:0s.o~ :\t ":""".--
. . .. . .
I ~G -4
IAG. 18 ~R spectra (calculated) of fany acid spin label at various values of the orderparameter, S. (Reproduced with permission from Academic Press, Ref. 52.)
~

249Fluorescence and ESR Spectroscopy
becomes more and more isotropic towards the bilayer interior. The spin probesthus detect well-ordered lipid chains near the polar surface. On the other hand. thelipid chains are disordered in the cenb"a1 part of the bilayer.
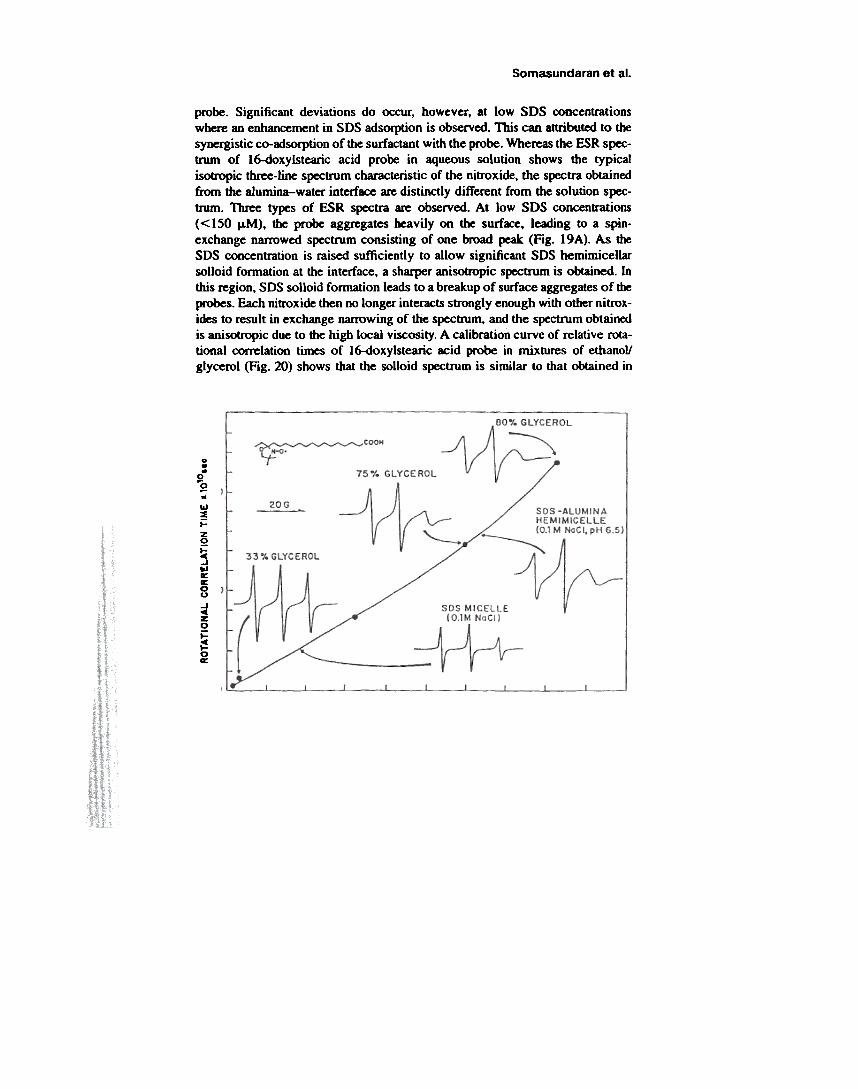
F$R spin labels and probes have been successfully applied in colloid chemicalstudies of surfactants, lipids and polymers for many years [75-77]. One examplefor the application of this technique is the study of the adsorbed layer of 5DS atthe alumina-water interface [62]. As shown in Fig. 19. the sha~ of the adsorptionisotherm of SD5 00 alumina with probe is similar to that in the absence of the
~
Somasundaran et al.
probe. Significant deviations do occur, however, at low SDS concentrationswhere an enhancement in SDS adsorption is observed. This can attributed to thesynergistic co-adsorption of the surfactant with the probe. Whereas the ESR spec-bUm of 16-doxylstearic acid probe in aqueous solution shows the typicalisotropic three-line spectrum characteristic of the nitroxide, the spectra obtainedfrom the alumina-water interface are distinctly different from the solution spec-trum. Three types of ESR spectra are observed At low SDS concentrations« 150 p.M), the probe aggregates heavily on the surf~, leading to a spin-exchange narrowed spectrum consisting of one broad peak (Fig. 19A). As theSDS concentration is raised sufficiently to allow significant SDS hemimicellarsolloid formation at the interface, a sharper anisotropic SpecbUm is obtained. Inthis region, SDS solloid formation leads to a breakup of surface aggregates of theprobes- Each nitroxide then no longer interacts strongly enough with other nitrox-ides to result in exchange narrowing of the spectrum, and the spectrum obtainedis anisotropic due to the high local viscosity. A calibration curve of relative rota-tional correlation times of 16-doxylstearic acid probe in mixtures of ethanoUglycerol (Fig. 20) shows that the solloid spectrum is similar to that obtained in
u..0-~M1&1~~
~5w~~0u
~0~~0~

Fluorescence and ESR Spectroscopy 251
75-80% glycerol. At higher SOS concentrations. the spectrum remains essen-tially unchanged (Fig. 190). This suggests that the aggregate structure does notchange appreciably as a function of SDS surface coverage. The work discussedabove is the first reported indication of variations in microviscosity within a sur-factant aggregate on a solid as estimated by any technique. Thus. ~R spec-troscopy with nitroxide spin probes is demonstrated to be a useful method forprobing the microenvironments of surfactants and polymers.
IV. CONCLUDING REMARKS
The fluorescence and ESR techniques are powerful, sensitive, and versatilemethods for probing on a molecular level the structure and organization of sur-factant aggregates, polymer layers, and biomembranes. Parameters such as peakratios and decay profiles in fluorescence and hyperfine splitting constants, rota-tional correlation time, and order parameter in ESR can be extracted from thespectra to characterize the microenvironmental properties of the systems. Thetime responses of the instruments make both of them ideal for monitoring eventsin situ. On the other hand, it must be noted that the information "collected" by theprobe reflects the properties of its environment, which is inherently disturbed bythe presence of the probe itself, no matter how low its concentration. Finally it isrecognized that a multipronged approach using several techniques on similarsystems along with relevant theoretical models can provide a comprehensive un-derstanding of the fundamental processes involved in interfacial processes. Fluo-rescence and ESR methods for the study of different systems are indeed in thisregard very useful for investigating interfacial phenomena. New probes and newmodes of their use can further enhance the study of micro- and DaDO-structures ofcolloidal systems.
ACKNOWLEDGMENTSThe National Science Foundation (crs-962278 1 and crS-9632479) and the En-vironmental Protection Agency (R823301-O1-O) are acknowledged for support ofthis work.
REFERENCES
2.
EL Wehry, ed., Modem Auo~scence Spectroscopy, Vol. 2. New York: Plenum Press,1976.JK Thomas, The Chemistry of Excitation at Interfaces, Wasbingtoo, D.C.: ACS, 1984.PF Knowles, D Marsh. HWE Rattle, Magnetic Resonance of Biomol~les: An 10-UOOucUoo 10 die Theory and Practice of NMR and ESR in Biological Systems, NewYork: John Wiley & Sons, 1976.

252 Somasundaran et 81
4. U Berliner, ed., Spin Labeling n: Theory and Applications, New York: Academic~s, 1979.
5. P Bagliooi, MF Ottaviani. G MaItini. E FaTani, In: KL Miual, B Undman, eds., Sur-factants in Solution, Vol. 2 New YOlk.: Plenum ~. 1984, p. 541.
6. PSomasundaran, rr Kunjappu. Colloid Surf 37:245. 1989.7. P Somasundaran, S Krishnakumar. Colloid Surf 93:79, 1994.8. P Somasundaran, S Krishoakumar, IT Kunjappu. In: R Shanna, cd, Surfactant Ad-
sorption and Surface Solubilization, ACS Symposium Series 615, Washington, D.C.,1995, p. 104.
9. LA Singer, In: KL Mittal, B Lindman. eds., Solution Behavior of Surfactants, Vol. I,New York: Plenum Press, 1982, p.73.
10. NJ TUrn>, Modem Molecular Photochemistry, Menlo Park, CA: Benjamin/Cummings, 1978.
11. IF Rabek, Experimental Methods in Polymer Qlemistry: (a) 0Iapcer; 16, EmissionSpectroscopy; (b) Chapter 21, Electron Paramagnetic Resonance Spectroscopy, NewYork: John Wiley.t:. SotlS, 1980.
12. NJTum>, M Gratzel, AM Braun. Angew Chern Int Ed Engl 19:675,1980.13. JR Lakowicz. Principles of Auorescence Spectroscopy, New York.: Plenum Press,
1983.14. K Kalyanasundaram, PIJOCochemistry in Micro-beterog~ Systems, New York:
Academic Press, 1987.15. JK Thomas, J Phys Chern 91:267,1987.16. JH Fendler, Chern Rev 87:877,1987.17. F Grieser, CJ Drummond, J Phys Chern 92:5580,1988.18. R Zaoa. In: R Zana, ed., Surfactants in Solution: New Methods of Investigation, Sur-
factant Science Series, Vol. 22. New York: Man:el Dekker, Inc., 1981.19. M Van de Auweraer, E Roelants, A Verbeeck, PC DeScbryver, In: KL Minai, ed.,
Surfactants in Solution, Vol. 7, New York: Plenum Press, 1989, p. 141.20. PM Winnik, STA Regismond, Colloid Surf A 118:1,1996.21. P Levitz, H van Damme, D Keravis, J Phys Chern 88:2228, 1985.22. P Somasundaran, NJ Turro. P Chandar, Colloid Surf 20: 145, 1986.23. K Kalyanasundaram, JK Thomas, J Am Chern Soc 99:2039, 1977.24. M Gratzel, K Kalyanasundaram, JK Thomas, J Am Chern Soc 96:7869. 1974.25. ASivakumar, P Somasundaran, Langmuir 10:131,1994.26. A Sivakumar, P Somasundaran, S Thach, Colloid Surf 70:69, 1993.27. P Somasundaran, X Yu. Colloid Surf 89:277, 1994.28. K Kalayansundaram, JKThomas, J Phys Chem 81:2176,1977.29. KP Ananthapadmanabhan, ED Goddard, PL KIlO. NJ Turro, Langmuir 1:352.
1985.30. NJ Tum>, PL Kuo, Langmuir 1: 170, 1985.31. JH Fendler, EJ Fendler, GA Infante, PS Shih. LK Patterson, J Am O»em Soc 97:89,
1975.32. JC Eriksson, G Gilberg, Acta Chern Scand 20:2019,1966.33. NE Shore, NJ Turro, J Am Chern Soc 97:2488, 1978.34. NJ Turro:Y Tanimoto, G Ga1xK; PhtXochem ~1 31 :257. 19*J.
~

Fluorescence and ESR Spectroscopy 253
35. WJ Dressik. BL Havenstein. TB Gilbert, NJ Demas. BA Depaff, J Pbys OIem88:3337.1984.
36. NJ Tum>. MAikawa. A Yetta, J Am 0Iem So<: 101:772. 1979.37. J Emen. C Behrens. M Goldenberg. JAm CbemSoc 101:771.1919.38. K Zachariasse. Chern Phys Leu 51:429, 1978.39. OJ Pownall. LC Smith, JAm 0Iem Sac 95:3136. 1973.40. PPInfelta. M Gratzel. J Pbys OleIn 70:179,1919.41. P Lianos. J Lang. C Strazielle. R ana. J Pbys OIem 86:1019.1982.42. P Somasundaran. P CIwIdar. NJ Turro, J Coli Interface Sci 111:31. 1987.43. A Fan. P Somasundaran, NJ Turro. Langmuir 13:506. 1997.44. m Birks, Photophysics of Aromatic Molecules. New Y<Xk: MacmiHan. 1970.45. A Yetta. MAikawa. NJ Turro, OIem Alys Leu 63:543. 1979.46. S Atit. M Nam. L Singer. Chern Phys Leu 67:15. 1919.47. P Q1andar. P Somasundaran. KC Warennan. NJ Turro, Langmuir 3:289. 1987.48. X Yu and P Somasundaran. J Coli Interface Sci 177:283. 1996.49. A Fan. NJ Thrro. P Somasundaran, Min Metall Proc J, in press.50. C Maltesh. P Somasundaran, R Ramachandran, J Applied Poly~ Sci 45:329. 1990.51. A Fan. P Somasundaran. NJ Turn>. unpublished data.52. U Berliner. ed., Spin Labeling I: Theory and Applications. New York: Academic
Press, 1976, p. 5.53. CP Poole, HA F~h. ed.. Handbook of Electron Spin Resonance. New York: Amer-
ican Institute of Alysics Press. 1994. p. 395.54. B Ranby. JF Rabek, Polymer/Propel1ies and Applications/FSR Spectroscopy in
Polymer Research. Berlin: Springer Verlag. 1971.55. C Taupin, M Dvolaitzky. In: R Zana. cd., Surfactant Solutions: New Method of In-
vestigation. Surfactant Science Series, Vol. 22, New York: Marcel Dekker. Inc..1981, p. 359.
56. P Somasuodaran. JT Kunjappu. Colloid Surf 31:245. 1989.51. H Hommel. Adv Colloid Interf Sci 54:209. 1995.58. J Pilar. J Labsky, Macromolecules. 27:3977. 1994.59. R Vasquez. J Avalos, F Volono. M Pineri, J AppI Polym Sci 28:1093.1983.60. S Ristori, G Martini. S Schlick. Adv Colloid Interf Sci 57:65. 1995.61. BH Robinson. AH Beth. Electr Spin Resonance 10:346, 1984.62. KC Waterman, NJ Turn>. P O1andar. P Somasundarao. J Pltys Q1Cm ~6828, 1986.63. Pa.aodar. PSomasundaran. KC Waterman. NJTum»,J Pltys Q1em 91:148. 1987.64. H Yoshioka, J Am Chern So<: 101:28. 1919.65. C Ramachandran. RA Pyter. P Mukerjee. J Phys Chern 86:3198. 1982.66. J Seelig. W Hasselbach. Eur J Biochem 21:11.1971.61. D Kivelson. J Chern Pbys 33:1094.1960.68. J Manini. J Michon, A Rassat, J Am Clem Sac 97: 1818. 1975.69. RC McCalley. EJ Dvolaitzky. C Taupin, Chern Phys Lett 13:115. 1972.70. SA Goldman. GV Bruno. JH Freed. J Pbys 01em 16: 1858. 1972.11. AI Vistnes. J Magnet Resonance 29:495. 1978.72. WL Hubbell. HM McConnell. Proc Natl Acad Sci USA. 64:~. 1969.73, WL Hubbell, 8M McConnell. J Am atem Sac 93:314.1971.

254 Somasundaran et al.
74. J Seelig, J Am Chern Sac 94:364, 1972.75. WG Miller, In: U Berliner, ed., Spin Labeling. n Theory and Applications, New
York: Academic Press, 1979, p. 173.76. AM Wasserman, Electron Spin Resonance 14A:112, 1995.77. GG Cameron, In: A Allen, JC Bevington, eds., Comprehensive Polymer Science, Vol.
I, Oxf()(d: Pergamon Press, 1989, p. 517.


![A Chemical and Photophysical Analysis of a Push …photophysical properties [3]. Carbazole compounds have also exhibited good charge transfer A Chemical and Photophysical Analyse of](https://img.dokumen.tips/doc/110x75/5f0e7d077e708231d43f7d64/a-chemical-and-photophysical-analysis-of-a-push-photophysical-properties-3-carbazole.jpg)