Embed Size (px)
Citation preview

Journal of Attention Disorders 1 –13© The Author(s) 2016Reprints and permissions: sagepub.com/journalsPermissions.navDOI: 10.1177/1087054716629215jad.sagepub.com
Article
Introduction
ADHD is a heterogeneous neurodevelopmental disorder that is characterized by a lack of attention, excessive motor activity, and high levels of impulsivity. These difficulties have a significant impact on familial, relational, and school functioning in more than one setting (Diagnostic and Statistical Manual of Mental Disorders, Fifth Edition [DSM-5]; American Psychiatric Association [APA], 2013). ADHD is a complex condition that affects 7.2% of children worldwide (Thomas, Sanders, Doust, Beller, & Glasziou, 2015; although the Italian average prevalence is about 1% according to the National Institute of Health, 2014), and its etiology is generally considered multifactorial. Although high heritability estimates suggest a critical role of genetic factors (Faraone & Mick, 2010), environmental variables are also important to understand the pathogenesis of the dis-order. In the last decades, a growing body of research has drawn attention to the role of diet in symptoms of children with ADHD as playing a potential role in the pathophysiol-ogy of the disorder and, therefore, as a possible coadjutant approach to pharmacological treatment. Several links between ADHD and nutritional factors have been reported
(Stevenson et al., 2014). Among these, the most intensively investigated issue is the role of polyunsaturated fatty acids (PUFAs).
Within long-chain PUFAs, docosahexaenoic acid (DHA; omega-3), its precursor eicosapentaenoic acid (EPA; omega-3), and arachidonic acid (AA; omega-6) are relevant components of all cell membranes, phospholipids, and precursors of eico-sanoids, the key mediators of biologic processes, thus influenc-ing the quality of growth and development (Janssen & Kiliaan, 2014). DHA, in particular, has a critical role in maintaining membrane integrity and fluidity, influencing inter-cell signal processes and the release of neurotransmitters (Schuchardt &
629215 JADXXX10.1177/1087054716629215Journal of Attention DisordersCrippa et al.research-article2016
1Scientific Institute, IRCCS Eugenio Medea, Lecco, Italy2Pediatric Clinic, Fondazione IRCCS Cà Granda—Ospedale Maggiore Policlinico, University of Milan, Italy3Villa San Benedetto Hospital, Hermanas Hospitalarias, FoRiPsi, Albese con Cassano, Italy
Corresponding Author:Alessandro Crippa, Child Psychopathology Unit, Scientific Institute, IRCCS Eugenio Medea, Associazione La Nostra Famiglia, v. Don Luigi Monza 20, 23842 Bosisio Parini, Lecco, Italy. Email: [email protected]
Polyunsaturated Fatty Acids Are Associated With Behavior But Not With Cognition in Children With and Without ADHD: An Italian study
Alessandro Crippa1, Carlo Agostoni2, Maddalena Mauri1, Massimo Molteni1, and Maria Nobile1,3
AbstractObjective: This study aimed to investigate the relationship between polyunsaturated fatty acids (PUFAs) status, cognitive, and behavioral traits of ADHD in school-aged children. Method: Seventy-three children with and without ADHD were assessed with cognitive tasks and behavioral rating scales including quality of life and global functioning at baseline of an intervention trial (clinicaltrials.gov NCT01796262). Correlation analyses were performed between the cognitive tasks/behavioral ratings and blood PUFA levels. Results: Children with ADHD had lower levels of DHA, omega-3 index, and total PUFA. PUFAs were positively associated with behavior but not consistently related to cognitive domains. Conclusion: The present study confirms that children with ADHD display abnormal fatty acid profiles within an Italian setting. Furthermore, PUFAs were associated with behavior but not with cognition. Accordingly, for the first time, lower blood levels of PUFA were associated not only with symptoms of ADHD but also with a poorer quality of life. (J. of Att. Dis. XXXX; XX(X) XX-XX)
KeywordsADHD, fatty acids, cognition, behavior, quality of life
at Istituto Eugenio Medea on February 10, 2016jad.sagepub.comDownloaded from

2 Journal of Attention Disorders
Hahn, 2011). With specific regard to the central nervous system, DHA and AA are the most abundant PUFAs in the brain. Although both DHA and AA appear to be essential to neuronal development and function (Uauy, Hoffman, Peirano, Birch, & Birch, 2001), they have divergent func-tions in respect to the inflammatory processes. More spe-cifically, AA produces eicosanoids with inflammatory and predominantly vasoconstrictor properties, whereas EPA―the DHA precursor―has more anti-inflammatory properties (see, for example, van Elst et al., 2014). Omega-6 fatty acids are the predominant PUFA in all diets, especially in Western countries. The excessive intake of omega-6 fatty acids produces an imbalance of omega-6 to omega-3 PUFAs, which potentially leads to an overproduction of the proinflammatory prostaglandins of the omega-6 series (Simopoulos, 2011). When diets are supplemented with omega-3, the latter partially replace the omega-6 fatty acids in the membranes of almost all cells.
Colquhoun and Bunday (1981) were the first to propose an association between blood PUFA levels and hyperactiv-ity in children on the basis of a systematic observation of symptoms of essential fatty acid deficiency in a large pedi-atric population. Since then, many clinical studies have investigated the efficacy of PUFA supplementation on ADHD symptoms and five meta-analyses have been carried out in the last few years. Three of them (Bloch & Qawasmi, 2011; Hawkey & Nigg, 2014; Sonuga-Barke et al., 2013) have suggested a small but significant effect of omega-3 supplementation, whereas Gillies, Sinn, Lad, Leach, and Ross (2012) did not report any relevant effect. Interestingly, another meta-analysis (Cooper, Tye, Kuntsi, Vassos, & Asherson, 2015) has indicated a small evidence of benefit limited to patients with low levels of omega-3 at baseline. Despite the amount of research on the effect of PUFA sup-plementation, only a few observational studies have consid-ered the baseline PUFA status in children with ADHD. Although the results are too heterogeneous to allow firm conclusions, some differences have been replicated in inde-pendent studies and seem to be constant in research. The more reliable finding indicates lower blood levels of omega-3 in ADHD children versus healthy, normally devel-oping, controls, as also confirmed by a recent meta-analysis (Hawkey & Nigg, 2014). Moreover, DHA levels are respon-sible for a major percentage of the difference in omega-3 profiles. Finally, case-control studies have indicated an increase in the omega-6/omega-3 ratio (Antalis et al., 2006; Stevens et al., 1995), or, inversely, a lower omega-3/omega-6 ratio in children with ADHD (Colter, Cutler, & Meckling, 2008). Furthermore, few observational studies have reported an inverse association between baseline omega-3 PUFA status, in particular DHA, and the rates of ADHD symptoms (Colter et al., 2008; Stevens, Zentall, Abate, Kuczek, & Burges, 1996; Stevens et al., 1995) in a general population that includes children with ADHD and
typically developing controls. A positive correlation between omega-6 PUFA, omega-6/omega-3 ratio, and behavioral problems has been described in ADHD (Colter et al., 2008), and, according to a more recent study (Gow et al., 2013), a significant association between anti-social traits in adolescent boys with ADHD and lower omega-3 levels has also been described.
To date, studies that investigate differences in PUFA lev-els by comparing school-aged children with ADHD with typically developing controls are lacking within an Italian setting. As mentioned, constant observations in different contexts may reinforce the biological plausibility of the hypothesis of the role of PUFA status. Furthermore, to the best of our knowledge, no studies have examined the asso-ciation between PUFA status and both cognition and behav-ior in children with and without ADHD, respectively. The aim of the present study is to check the PUFA status in ADHD patients and controls in Italian school-aged children by examining different cognitive domains (focused and sus-tained attention, inhibition, flexibility, reading) and behav-ioral symptoms in both study groups.
Method
The present work is a cross-sectional, observational study that reports baseline data from an ongoing placebo- controlled double-blind intervention trial investigating the efficacy of supplementation with DHA in children aged 7 to 14 with ADHD (the ‘The Effects of DHA on Attention Deficit and Hyperactivity Disorder (DADA)’ Study). The intervention trial was registered at clinicaltrials.gov as NCT01796262. A comparison group of typically developing children was included in this cross-sectional study and matched by gender, age, and full-scale IQ (the comparison group was not subsequently enrolled in the intervention trial). The study was explained to both children and their parent(s) or caregivers, and all of the participants’ legal guardians gave their informed written consent prior to the children’s participation. The research was approved by the ethics committee of our institute, in accordance with the Declaration of Helsinki. Data collection for the observa-tional study began in June 2012 and ended in October 2014.
Participants
Children aged 7 to 14 with ADHD were recruited from the Child Psychopathology Unit at our institute over a 22-month period. The study coordinator contacted approximately 120 families by phone to invite children and parents to partici-pate in the study protocol. Of these, 51 participants with ADHD and their parents agreed to participate and gave informed consent. The main reason for declining to partici-pate was the child’s refusal to have his or her blood sampled. All participants in the ADHD group had been previously
at Istituto Eugenio Medea on February 10, 2016jad.sagepub.comDownloaded from

Crippa et al. 3
diagnosed according to Diagnostic and Statistical Manual of Mental Disorders criteria (4th ed., text rev.; DSM-IV-TR; APA, 2000) by a child neuropsychiatrist with expertise in ADHD. The diagnoses were then confirmed independently by a child psychologist through direct observation and the administration of the semi-structured interview Development and Well-Being Assessment (DAWBA; Goodman, Ford, Richards, Gatward, & Meltzer, 2000). According to clinical diagnoses and interviews, 15.7% of children with ADHD had the inattentive subtype, 33.3% had the hyperactive–impulsive subtype, and 51% had the combined subtype.
Twenty-two healthy developing children were recruited as a control group by local pediatricians and from schools in the same areas of ADHD children, gender, age, and IQ matched to the clinical sample. Diagnoses according to DSM-IV TR were excluded in these children through the DAWBA parent diagnostic interview. Two subtests of the Wechsler Adult Intelligence Scale–III (WISC-III; vocabu-lary, block design; Wechsler, 2006) were administered to the children in the control group. The estimated Full Scale Intelligence Quotient (FSIQ) was used to match the two groups. The WISC subtests have a correlation of .93 to .95 with the FSIQ (Groth-Marnat, 1997). All participants were required to have FSIQ or estimated FSIQ scores of higher than 80 on the WISC-III or Wechsler Adult Intelligence Scale–IV (WISC-IV) scales (Wechsler, 2006, 2012). Exclusion criteria were the presence of suspected signs of social/communicative disorders, and major medical or neu-rological disorders. All participants were Caucasian, had normal or corrected-to-normal vision, and were drug-naïve. Moreover, no child had consumed omega-3/omega-6 sup-plements during the 3 months prior to the recruitment.
Procedure
All participants were assessed at our institute’s Child Psychopathology Unit after a minimum 1-hr fast. Measurement of clinical parameters included height with-out shoes, weight in light clothing, and blood pressure (sys-tolic and diastolic). Blood samples were obtained by collecting drops of blood from a fingertip.
Materials
The participants filled out the Pubertal Developmental Scale (Petersen, Crockett, Richards, & Boxer, 1988). Weekly frequency of fish consumption was then investi-gated. Last, data on parental employment were used as a measure of socioeconomic status (SES) and coded accord-ing to the Hollingshead 9-point scale for parental occupa-tion (Hollingshead, 1975).
Cognitive profile. An abbreviated battery of cognitive tests from the Amsterdam Neuropsychological Tasks (ANT; de
Sonneville, 2000) program was used to assess executive function domain. All participants completed four computer-ized tasks that were always administered in the same order; that is, Baseline speed, Focused attention 4 letters, Shifting attentional set–visual, and Sustained Attention. Baseline speed measures simple response times to stimulus presence; the dependent variables of this task were (a) median reac-tion time (RT) and (b) standard deviation (SD) of RTs. In the Focused attention test, participants had to respond (pressing the “yes” key) to one target letter among four let-ters presented on the screen at the same time, only when it was displayed in the relevant diagonal positions. Children were instructed to reject any other stimulus by using a dif-ferent response key. The dependent variables were as fol-lows: (a) RT for correct responses, (b) SD of RTs for correct responses, (c) misses, and (d) false alarms (Günther, Her-pertz-Dahlmann, & Konrad, 2010). The Visual set-shifting task is composed of three conditions and investigates three basic cognitive variables: vigilance, inhibition, and cogni-tive flexibility. The stimulus is a bar with a colored square, which may skip quickly from left to right or vice versa. Depending on the color of the square, participants had to press a key that corresponded with the side where the square jumped (Condition 1) or press opposite keys (Condition 2). Condition 3 requires the children to adjust their response sets according to the color of the square, which changed throughout the task. The dependent measures of this task were (a) mean response time inhibition (difference in RTs between Conditions 2 and 1), (b) mean response time flexi-bility (difference in RTs between Conditions 3 and 1), (c) number of errors on inhibition, and (d) number of errors on flexibility (Daams et al., 2012). Finally, the Sustained atten-tion assessed the fluctuation of attention over time. Children were shown 50 series of 12 different dot patterns. In each series, participants had to press a key whenever the target dot pattern appeared (4-dot pattern, 33% of the trials) or a different response key when a non-target (3- or 5-dot) pat-tern was presented. As dependent measure, (a) the sum of the 12 latencies per series (TEMPO × series), (b) SD of this sum across series, (c) misses, and (d) false alarms (Günther et al., 2010) were used. Moreover, (e) the coefficient of vari-ation (i.e., SD/M RT; Klein, Wendling, Huettner, Ruder, & Peper, 2006) was also registered. Reading skills were also assessed using word and non-word reading subtests from the Italian standardized “Battery for the Assessment of Devel-opmental Reading and Spelling Disorders” (Sartori, Job, & Tressoldi, 1995); both reading speed (syllables/seconds) and reading accuracy (number of errors) were registered.
Behavior profile. The parents completed Conners’ Parent Rating Scale–R (CPRS-R, 1997) and ADHD rating scale IV Parent Version–Investigator completed (ADHD-RS; DuPaul, Power, Anastopoulos, & Reid, 1998) to assess ADHD behaviors. For CPRS-R, the dependent measures
at Istituto Eugenio Medea on February 10, 2016jad.sagepub.comDownloaded from

4 Journal of Attention Disorders
included Hyperactivity as well Inattention scales, and were ADHD index, Conners’ Global Index restless–impulsive, Conners’ Global Index emotional lability, Conners’ Global Index total, DSM-IV inattentive, DSM-IV hyperactive–impulsive, and DSM-IV total. The Strengths and Difficulties Questionnaire (SDQ; Goodman, 1997) was then filled out by the parents to measure the emotional and behavioral dif-ficulties frequently associated with the disorder.
Functioning profile. To investigate the impact of ADHD on the quality of life, the Child Health Questionnaire–Parent Form 28 item (CHQ-PF28; Landgraf, Abetz, & Ware, 1996) was completed by the parents. CHQ is a well-validated mea-sure of quality of life, comprising an overall summary score for psychosocial functioning, as well as subscales that assess self-esteem, impact of the disorder on the parents, and participa-tion in family activities. The children’s global functioning was evaluated by a clinician using the Clinical Global Impression–severity (CGI; Busner & Targum, 2007) and the Children’ Global Assessment Scale (C-GAS; Shaffer et al., 1983).
Blood Collection and Fatty Acid Profiles Analysis
Whole blood samples were obtained from all participants to evaluate the fatty acid (FA) profile. The fatty acid analysis in whole blood has several advantages compared with the evaluation in other blood components. Whole blood is more easily obtainable than other components such as plasma and red blood cells; this represents a major benefit in observa-tional and in supplementation studies where a large number of participants is needed. Moreover, although the examina-tion of PUFA in red blood cells may provide a more reliable measurement of long-term accumulation of long-chain fatty acids, the whole blood fatty acid composition offers a more balanced picture about the status of circulating PUFA (both long- and short-chain fatty acids) in relation to fat dietary intakes (Agostoni et al., 2011; Risè et al., 2007). All the blood samples were collected on a strip of paper for chro-matography after a minimum 1-hr fast, through a puncture of the fingertip that was performed with an automatic lanc-ing device equipped with lancets. All samples were pre-served at 4°C until analyzed. The strips of paper were directly transmethylated using a well-validated protocol (Marangoni, Colombo, & Galli, 2004). Fatty acid methyl esters were analyzed after injection into a gas chromato-graph (GC-2014 Gas Chromatograph, Shimadzu, Japan) equipped with an SGE capillary column (30 m × 0.25mm, ID-BPX70 0.25 µm, SGE, Melbourne, Australia), Programmable Temperature Vaporizer (PTV) injector, Flame Ionization Detector (FID), and a dedicated data sys-tem. The analysis temperature started from 110, increased to 250°C at 5°C/min, and after 5 min, decreased to 220°C at the same rate. Peaks were identified by separated analysis of pure standards. Fatty acids from 14 to 24 carbons were
detected. Fatty acid values were then expressed as a per-centage of total fatty acids. We report single fatty acid data only for main omega-3 and omega-6, as these PUFAs are the focus of the present work. The AA/EPA and AA/DHA ratios are calculated as reliable indexes of the functional effects of long-chain PUFAs (Simopoulos, 2002). Last, the sum of EPA and DHA (the “omega-3 index”; Montgomery et al., 2013), and the sum of saturated (SFA), monounsatu-rated (MUFA), and polyunsaturated fatty acids (PUFA) are also reported. SFA is known to be positively associated with concentrations of inflammation markers in blood, whereas MUFA can lead to a decrease of inflammatory molecules (see, for example, van Dijk et al., 2009). In the present study, SFA included palmitic acid and stearic acid; MUFA, palmitoleic and oleic acid; and PUFA included linoleic acid, linolenic acid, eicosatrienoic acid, arachidonic acid, EPA, DHA, and docosapentaenoic acid.
Statistical Analysis
First, a visual and statistical assessment of data was carried out to check the assumptions of normality, linearity, inde-pendence of observations, and homogeneity of error vari-ance. These analyses revealed an outlier in terms of arachidonic acid (AA): EPA ratio (3 SDs from the next highest score) in the ADHD group. Although the reliability of this datum was verified, the participant’s data were excluded from all further analysis of the fatty acid profile. A chi-square analysis was then performed to examine group differences in gender distribution. Independent-samples t test was used to individually examine group differences in age and IQ. Next, comparisons between children with ADHD and typically developing controls were then con-ducted on clinical questionnaires, cognitive measures, and blood fatty acid levels using Mann–Whitney or indepen-dent-samples t test according to the distributional nature of the data. Differences across groups in fatty acid concentra-tions for fish consumption were assessed using the Kruskal–Wallis test. Last, bivariate Spearman’s rho correlations were conducted to determine associations between fatty acid lev-els, cognition, and behavior. Because this study was explor-atory, no correction was applied for family-wise error rate; however, 95% confidence intervals (CIs) for rho were cal-culated using bootstrapping methodology (based on 1,000 bootstrap resamples) to appropriately indicate the likely size of the population effect (Field, 2013).
Results
Demographic, Behavioral, and Cognitive Assessment
Data on the demographic, cognitive, and behavioral mea-sures of the participants are summarized in Tables 1, 2, and 3.
at Istituto Eugenio Medea on February 10, 2016jad.sagepub.comDownloaded from

Crippa et al. 5
The validity of gender, age, and full-scale IQ matching was confirmed (all p > 0.05); SES was also balanced between groups (p > .05). Fish consumption was different between groups, χ2(3) = 11.944, p = .008, with children who had ADHD consuming larger amounts of fish weekly, as reported by parents (not consuming fish at all: ADHD = 7.8%, controls = 4.5%; less than once a week: ADHD = 2%, controls = 27.3%; once a week: ADHD = 62.7%, controls = 54.5%; more than once a week: ADHD = 27.5%, controls = 13.7%). Several significant group differences in ADHD symptoms were found, based on both clinical scores and ques-tionnaires (CGI, C-GAS, CPRS, ADHD-RS; see Table 2), consistent with the diagnosis-based expectations. Moreover, children in the clinical group showed significantly more dif-ficulties that often co-occurring with ADHD, such as emo-tional or conduct problems or difficulties with peers (SDQ). There were also significant group differences in terms of quality of life, with children with ADHD having globally lower well-being indexes (see Table 2). As for reading abili-ties, children with ADHD performed significantly worse than healthy controls in word and non-word reading, in both speed and accuracy. For cognitive measures, the ADHD group showed more variability in simple response time to stimulus presence (Baseline speed) and more false alarms for irrelevant target (Focused attention task) than did the group with typical development. Children with ADHD made also more inhibition and flexibility errors (Set-shifting). Finally, the ADHD group showed difficulties in sustaining attention over time, as indicated by more vari-ability in reaction times and misses of target (Sustained attention; see Table 3).
Fatty Acid Analysis
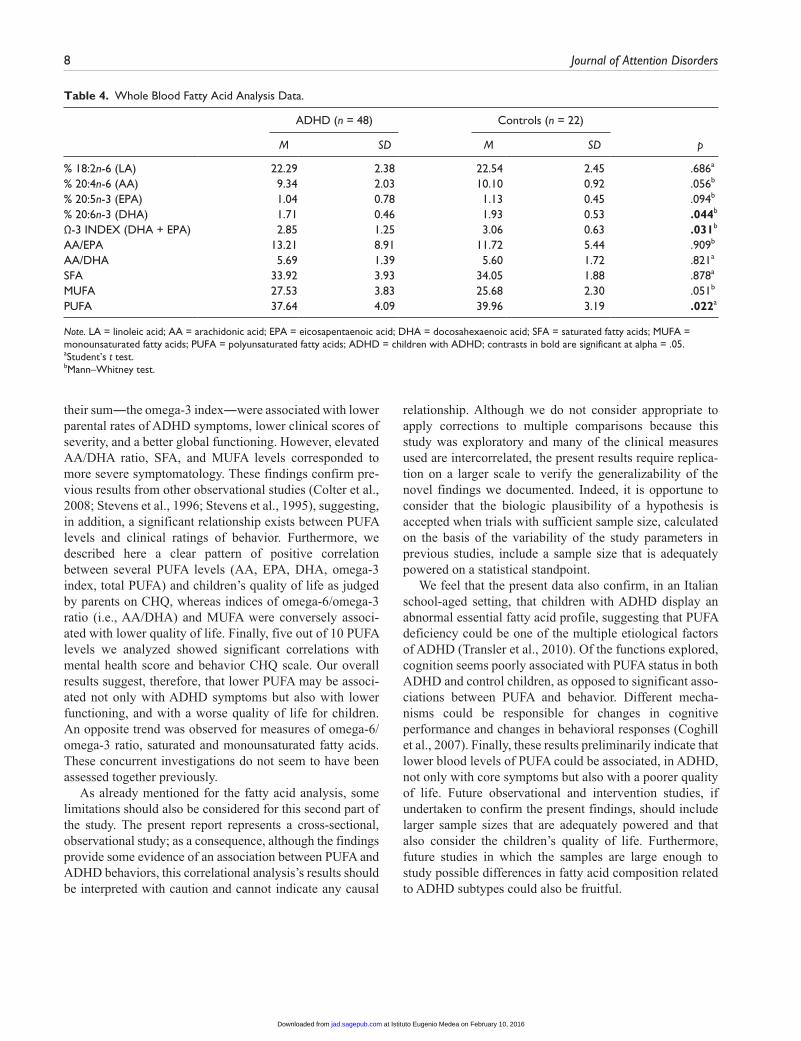
Data on the fatty acid profile of the participants are shown in Table 4. Two children (both in the ADHD group) among the 73 participants recruited could not be analyzed due to insufficiency of the absorbed blood sample.
When compared with typically developing participants, children with ADHD had significantly lower levels of DHA, omega-3 index, and total polyunsaturated fatty acids. No other difference was found. There were no significant
differences across groups in fatty acid concentrations for fish consumption, as reported by parents (p > .05).
Correlations Between Cognitive Measures and Fatty Acid Levels
The Spearman coefficients revealed a weak positive corre-lation between DHA and number of misses in the Focused attention task (ρ = .247, p < .05, 95% CI = [0.02, 0.48]), and a modest correlation between AA and mean response time of inhibition in Set-shifting (ρ = .301, p < .05, 95% CI = [0.06, 0.51]). No other significant correlations were found between cognition and fatty acid recorded.
Correlations Between Behavioral Data and Fatty Acid Levels
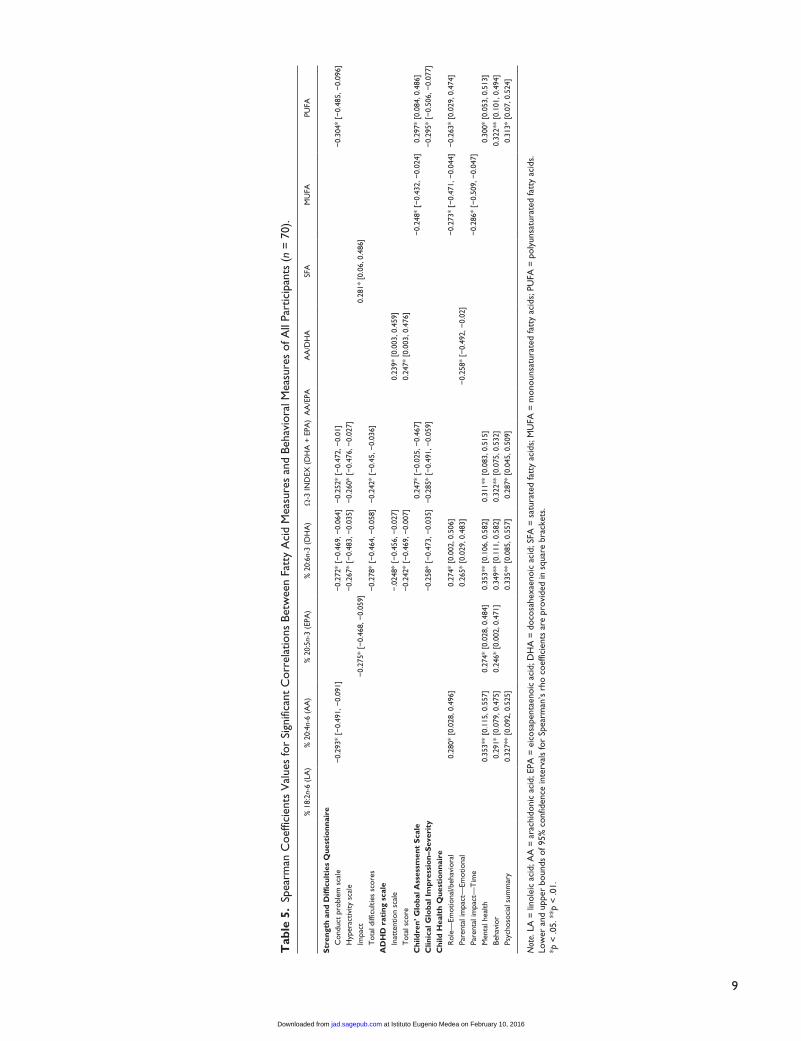
Significant correlations between behavioral scores and fatty acid levels of all participants (n = 70) are depicted in Table 5. No significant correlations were found between any CPRS scale and fatty acid levels (data of CPRS are not shown in the table).
ADHD symptoms as rated by parents (ADHD-RS) and clinical impression of severity (CGI) were negatively cor-related with DHA, omega-3 index, and PUFA, and were positively associated with AA/DHA ratio. Significant nega-tive associations were found between AA, EPA, DHA, PUFA, and many SDQ scores, while SFA correlated posi-tively with SDQ impact. C-GAS correlated positively with omega-3 index and PUFA, and negatively with MUFA. Several positive correlations were found also between the parent’s scores concerning the participants’ quality of life (CHQ) and AA, EPA, DHA, omega-3 index, and PUFA (see Table 5, Figures 1 and 2). In turn, AA/DHA ratio and MUFA were negatively correlated with measures of the children’s functioning at CHQ (see Table 5).
Discussion
The purpose of the present study was twofold. First, we aimed to examine, in an Italian school-aged sample, the blood PUFA profile of children with ADHD compared with their typically developing peers. To date, this is the first Italian study to compare the blood PUFA profile of children with and without ADHD. Second, we intended to describe the possible relationship between the PUFA percentages and both cognitive, behavioral traits and functioning that characterize ADHD, and represent the quality of life. To achieve these goals, we recruited two groups―children with a clinical diagnosis of ADHD between the ages of 7 and 14, and gender, age, and IQ-matched healthy controls.
With regard to the first goal of our study, we found sig-nificantly lower levels of DHA, omega-3 index (i.e., the sum of DHA and EPA; Montgomery et al., 2013), and total
Table 1. Demographics of the Participants.
ADHD Controls p
N 51 22 Females:males 4:47 1:22 0.262a .609Age 11.0 ± 1.6 11.4 ± 1.9 1.024b .309IQ 103.4 ± 13.4 109.6 ± 19.5 1.580b .119SES 53.8 ± 18.6 56.1 ± 18.3 0.490b .626
Note. ADHD = children with ADHD; SES = socioeconomic status.aChi-square test.bStudent’s t test.
at Istituto Eugenio Medea on February 10, 2016jad.sagepub.comDownloaded from

6 Journal of Attention Disorders
PUFA in children with ADHD compared with children with typical development. The whole blood PUFA analysis we report here therefore extends the previous findings of abnor-mal fatty acid percentages in ADHD children (Hawkey & Nigg, 2014) also to an Italian school-aged sample. Our find-ings do not yet support other results from case-control stud-ies, indicating an increased omega-6/omega-3 ratio (Antalis et al., 2006; Stevens et al., 1995), or a lower omega-3/omega-6 ratio (Colter et al., 2008) in ADHD. However, we observed a numerical, although not significant, difference in AA/EPA ratio in children with ADHD. Because the stan-dard deviation for this estimate was quite large, a larger sample size could have been able to detect this further sig-nificant difference. Indeed, a limitation of the present study is related to the small sample sizes of participant groups, in particular with respect to the healthy control group. A group difference emerged in weekly fish intake, with ADHD chil-dren consuming more fish than typically developing peers, as reported by parents. Nevertheless, we did not find any significant relationship between the amount of fish con-sumed and levels of PUFA circulating in blood, as opposed
to previous findings (e.g., Montgomery et al., 2013). Unfortunately, the quantity and quality of fish consumed were not collected with daily dietary recordings and other possible dietary sources of n-3 fatty acids (e.g., nuts or veg-etable oils, rich in alpha-linolenic acid) were not investi-gated. Future extensions of this work should include more objective measures of fish consumption and dietary nutri-ents on the whole to verify the well-documented relation between fish intakes and blood PUFA percentages. Besides these considerations, the role of the children’s genotype should be also taken into account as a significant factor in determining the PUFA status. Caspi and colleagues (2007), for instance, indicated an association between the child’s genotype for single nucleotide polymorphisms (SNP) rs174575 on FA desaturase (FADs) and his or her AA and DHA levels. In the last years, studies investigating the effi-cacy of FAs supplementation started to weigh these gene–diet interaction effects due to FADs polymorphism to explain the inter-individual variability in blood FA levels after supplementation (see, for example, Bouchard-Mercier et al., 2014).
Table 2. Group Means and Standard Deviations of Cognitive Measures of Participants.
ADHD (n = 51) Controls (n = 22) Mann–Whitney Test
M SD M SD U p
Reading abilities Word reading speed (syll/s) 2.85 1.08 3.93 1.09 276.5 .001 Word reading accuracy (errors) 4.98 4.46 1.68 1.55 287.5 .001 Non-word reading speed (syll/s) 1.70 0.64 2.30 0.79 302.0 .002 Non-word reading accuracy (errors) 6.63 5.46 3.82 3.20 373.5 .024ANT—Baseline speed RT (ms) 346.46 71.38 314.59 46.36 431.5 .147 SD of RT 132.9 81.74 88.59 23.44 355.5 .017ANT—Focused attention 4 letters RT correct responses (ms) 1,008.39 335.94 959.36 347.96 473.5 .293 SD of correct responses RT 436.44 241.38 343.38 186.72 441.0 .149 Misses 2.98 2.69 2.09 2.09 442.5 .148 False alarms relevant non-target 0.96 1.17 0.50 0.74 445.0 .128 False alarms irrelevant target 1.75 2.75 0.82 1.26 378.0 .022ANT—Visual set-shifting RT inhibition (ms) 350.61 258.42 405.73 279.98 491 .400 RT flexibility (ms) 639.14 294.30 789.64 365.40 441 .149 Number of errors inhibition 8.12 6.70 3.45 4.23 289 .001 Number of errors flexibility 18.61 12.42 14.45 14.40 398.5 .050ANT—Sustained attention date Tempo × Series 14.88 3.66 14.09 3.47 496.5 .438 SD 3.60 1.51 2.46 1.18 302.5 .002 Misses 35.98 25.22 19.27 18.35 282.5 .001 False alarms 23.59 17.15 18.86 18.46 418.5 .086 Coefficient of variation 0.24 0.07 0.17 0.05 244.0 <.001
Note. ADHD = children with ADHD; RT = reaction time; SD = standard deviation; ANT = Amsterdam Neuropsychological Task; contrasts in bold are significant at alpha = .05.
at Istituto Eugenio Medea on February 10, 2016jad.sagepub.comDownloaded from

Crippa et al. 7
With regard to the second aim of this study, we have con-currently investigated the relationship between PUFA and both cognition, behavior, and functioning in a sample of children with and without a medical diagnosis of ADHD. Regardless of diagnosis, we found in the present work a few puzzling findings when assessing PUFA percentages and performance on a cognitive test battery. Furthermore, we did not find any significant correlation between PUFA and reading. These results deviate from previous findings on children in mainstream primary schools (Montgomery et al., 2013), where an association between low omega-3 PUFA, and poor reading and working memory skills was
described. However, our data are in line with other negative findings on healthy children from the general population (Kirby et al., 2010). More interestingly, the present findings are also in agreement with recent suggestions from supple-mentation studies that PUFA could be not related to cogni-tion in either mixed samples of children with and without ADHD, or in children with ADHD and reading difficulties, or in healthy children (Cooper et al., 2015).
We found yet a greater number of weak, but significant, associations between PUFA status and both ADHD symp-toms and other difficulties often associated with the disor-der. Higher levels of PUFA, in particular EPA, DHA, and
Table 3. Group Means and Standard Deviations of Behavioral Measures of Participants.
ADHD (n = 51) Controls (n = 22) Mann–Whitney Test
M SD M SD U p
Strengths and Difficulties Questionnaire Emotional problem scale 2.90 2.20 1.27 1.12 285.5 .001 Conduct problem scale 3.65 1.67 0.91 1.15 91.5 <.001 Hyperactivity scale 7.88 2.53 1.27 1.49 7.5 <.001 Peer problems scale 2.75 3.45 1.05 1.46 337.0 .006 Prosocial scale 7.45 2.27 7.82 1.50 540.0 .802 Impact 2.94 2.55 0.09 0.29 163.0 <.001 Total difficulties scores 17.18 6.57 4.5 3.67 39.0 <.001ADHD rating scale Hyperactivity–Impulsivity scale 14.69 5.51 1.91 1.90 18.5 <.001 Inattention scale 15.53 5.86 2.68 3.00 24.0 <.001 Total 30.22 10.00 4.59 4.46 10.5 <.001Conners’ parents rating scales ADHD index 73.33 10.29 43.32 6.90 11.5 <.001 CGI: restless–impulsive 69.33 10.63 42.45 7.04 28.5 <.001 CGI: emotional lability 59.16 14.13 43.68 4.74 158.0 <.001 CGI: total 67.27 13.30 41.95 6.32 44.5 <.001 DSM-IV: inattentive 70.75 14.54 44.86 7.82 64.0 <.001 DSM-IV: hyperactive–impulsive 68.29 13.28 41.45 4.25 33.0 <.001 DSM-IV: total 72.06 12.51 42.50 6.27 34.5 <.001Child Health Questionnaire Physical functioning 0.25 0.77 0.40 0.51 504.0 .288 Role—Physical −0.93 1.84 0.29 0.52 355.0 .004 General health 0.83 0.78 1.20 0.52 396.5 .046 Bodily pain −0.01 1.05 0.24 0.82 497.0 .416 Role—Emotional/behavioral −0.88 1.84 0.49 0.00 319.0 <.001 Parental impact—Time −0.06 1.16 0.76 0.18 314.0 <.001 Parental impact—Emotional −0.59 0.92 0.47 0.83 199.0 <.001 Self-esteem −0.64 0.92 0.04 0.59 290.0 .001 Mental health −1.81 1.32 0.11 1.04 153.5 <.001 Behavior −1.31 0.91 0.48 0.82 88.0 <.001 Physical summary 0.36 0.75 0.72 0.46 401.0 .054 Psychosocial summary −1.30 1.00 0.35 0.54 74.0 <.001Children’ Global Assessment Scale 68.27 8.79 96.45 4.28 3.0 <.001Clinical Global Impression–Severity 3.92 0.89 1.14 0.35 1.5 <.001
Note. ADHD = children with ADHD; CGI = Conners’ Global Index; contrasts in bold are significant at alpha = .05.
at Istituto Eugenio Medea on February 10, 2016jad.sagepub.comDownloaded from
8 Journal of Attention Disorders
their sum―the omega-3 index―were associated with lower parental rates of ADHD symptoms, lower clinical scores of severity, and a better global functioning. However, elevated AA/DHA ratio, SFA, and MUFA levels corresponded to more severe symptomatology. These findings confirm pre-vious results from other observational studies (Colter et al., 2008; Stevens et al., 1996; Stevens et al., 1995), suggesting, in addition, a significant relationship exists between PUFA levels and clinical ratings of behavior. Furthermore, we described here a clear pattern of positive correlation between several PUFA levels (AA, EPA, DHA, omega-3 index, total PUFA) and children’s quality of life as judged by parents on CHQ, whereas indices of omega-6/omega-3 ratio (i.e., AA/DHA) and MUFA were conversely associ-ated with lower quality of life. Finally, five out of 10 PUFA levels we analyzed showed significant correlations with mental health score and behavior CHQ scale. Our overall results suggest, therefore, that lower PUFA may be associ-ated not only with ADHD symptoms but also with lower functioning, and with a worse quality of life for children. An opposite trend was observed for measures of omega-6/omega-3 ratio, saturated and monounsaturated fatty acids. These concurrent investigations do not seem to have been assessed together previously.
As already mentioned for the fatty acid analysis, some limitations should also be considered for this second part of the study. The present report represents a cross-sectional, observational study; as a consequence, although the findings provide some evidence of an association between PUFA and ADHD behaviors, this correlational analysis’s results should be interpreted with caution and cannot indicate any causal
relationship. Although we do not consider appropriate to apply corrections to multiple comparisons because this study was exploratory and many of the clinical measures used are intercorrelated, the present results require replica-tion on a larger scale to verify the generalizability of the novel findings we documented. Indeed, it is opportune to consider that the biologic plausibility of a hypothesis is accepted when trials with sufficient sample size, calculated on the basis of the variability of the study parameters in previous studies, include a sample size that is adequately powered on a statistical standpoint.
We feel that the present data also confirm, in an Italian school-aged setting, that children with ADHD display an abnormal essential fatty acid profile, suggesting that PUFA deficiency could be one of the multiple etiological factors of ADHD (Transler et al., 2010). Of the functions explored, cognition seems poorly associated with PUFA status in both ADHD and control children, as opposed to significant asso-ciations between PUFA and behavior. Different mecha-nisms could be responsible for changes in cognitive performance and changes in behavioral responses (Coghill et al., 2007). Finally, these results preliminarily indicate that lower blood levels of PUFA could be associated, in ADHD, not only with core symptoms but also with a poorer quality of life. Future observational and intervention studies, if undertaken to confirm the present findings, should include larger sample sizes that are adequately powered and that also consider the children’s quality of life. Furthermore, future studies in which the samples are large enough to study possible differences in fatty acid composition related to ADHD subtypes could also be fruitful.
Table 4. Whole Blood Fatty Acid Analysis Data.
ADHD (n = 48) Controls (n = 22)
M SD M SD p
% 18:2n-6 (LA) 22.29 2.38 22.54 2.45 .686a
% 20:4n-6 (AA) 9.34 2.03 10.10 0.92 .056b
% 20:5n-3 (EPA) 1.04 0.78 1.13 0.45 .094b
% 20:6n-3 (DHA) 1.71 0.46 1.93 0.53 .044b
Ω-3 INDEX (DHA + EPA) 2.85 1.25 3.06 0.63 .031b
AA/EPA 13.21 8.91 11.72 5.44 .909b
AA/DHA 5.69 1.39 5.60 1.72 .821a
SFA 33.92 3.93 34.05 1.88 .878a
MUFA 27.53 3.83 25.68 2.30 .051b
PUFA 37.64 4.09 39.96 3.19 .022a
Note. LA = linoleic acid; AA = arachidonic acid; EPA = eicosapentaenoic acid; DHA = docosahexaenoic acid; SFA = saturated fatty acids; MUFA = monounsaturated fatty acids; PUFA = polyunsaturated fatty acids; ADHD = children with ADHD; contrasts in bold are significant at alpha = .05.aStudent’s t test.bMann–Whitney test.
at Istituto Eugenio Medea on February 10, 2016jad.sagepub.comDownloaded from
9
Tab
le 5
. Sp
earm
an C
oeffi
cien
ts V
alue
s fo
r Si
gnifi
cant
Cor
rela
tions
Bet
wee
n Fa
tty
Aci
d M
easu
res
and
Beha
vior
al M
easu
res
of A
ll Pa
rtic
ipan
ts (
n =
70)
.
% 1
8:2n
-6 (
LA)
% 2
0:4n
-6 (
AA
)%
20:
5n-3
(EP
A)
% 2
0:6n
-3 (
DH
A)
Ω-3
IND
EX (
DH
A +
EPA
)A
A/E
PAA
A/D
HA
SFA
MU
FAPU
FA
Str
engt
h an
d D
iffic
ulti
es Q
uest
ionn
aire
C
ondu
ct p
robl
em s
cale
−0.
293*
[−
0.49
1, −
0.09
1]−
0.27
2* [
−0.
469,
−0.
064]
−0.
252*
[−
0.47
2, −
0.01
]−
0.30
4* [
−0.
485,
−0.
096]
H
yper
activ
ity s
cale
−0.
267*
[−
0.48
3, −
0.03
5]−
0.26
0* [
−0.
476,
−0.
027]
Impa
ct−
0.27
5* [
−0.
468,
−0.
059]
0.28
1* [
0.06
, 0.4
86]
Tot
al d
iffic
ultie
s sc
ores
−0.
278*
[−
0.46
4, −
0.05
8]−
0.24
2* [
−0.
45, −
0.03
6]
AD
HD
rat
ing
scal
e
Inat
tent
ion
scal
e−
.024
8* [
−0.
456,
−0.
027]
0.23
9* [
0.00
3, 0
.459
]
T
otal
sco
re−
0.24
2* [
−0.
469,
−0.
007]
0.24
7* [
0.00
3, 0
.476
]
Chi
ldre
n’ G
loba
l Ass
essm
ent
Sca
le0.
247*
[−
0.02
5, −
0.46
7]−
0.24
8* [
−0.
432,
−0.
024]
0.29
7* [
0.08
4, 0
.486
]C
linic
al G
loba
l Im
pres
sio
n–S
ever
ity
−0.
258*
[−
0.47
3, −
0.03
5]−
0.28
5* [
−0.
491,
−0.
059]
−0.
295*
[−
0.50
6, −
0.07
7]C
hild
Hea
lth
Que
stio
nnai
re
Rol
e—Em
otio
nal/b
ehav
iora
l0.
280*
[0.
028,
0.4
96]
0.27
4* [
0.00
2, 0
.506
]−
0.27
3* [
−0.
471,
−0.
044]
−0.
263*
[0.
029,
0.4
74]
Pa
rent
al im
pact
—Em
otio
nal
0.26
5* [
0.02
9, 0
.483
]−
0.25
8* [
−0.
492,
−0.
02]
Pare
ntal
impa
ct—
Tim
e−
0.28
6* [
−0.
509,
−0.
047]
Men
tal h
ealth
0.35
3**
[0.1
15, 0
.557
]0.
274*
[0.
028,
0.4
84]
0.35
3**
[0.1
06, 0
.582
]0.
311*
* [0
.083
, 0.5
15]
0.30
0* [
0.05
3, 0
.513
]
Beha
vior
0.29
1* [
0.07
9, 0
.475
]0.
246*
[0.
002,
0.4
71]
0.34
9**
[0.1
11, 0
.582
]0.
322*
* [0
.075
, 0.5
32]
0.32
2**
[0.1
01, 0
.494
]
Psyc
hoso
cial
sum
mar
y0.
327*
* [0
.092
, 0.5
25]
0.33
5**
[0.0
85, 0
.557
]0.
287*
[0.
045,
0.5
09]
0.31
3* [
0.07
, 0.5
24]
Not
e. L
A =
lino
leic
aci
d; A
A =
ara
chid
onic
aci
d; E
PA =
eic
osap
enta
enoi
c ac
id; D
HA
= d
ocos
ahex
aeno
ic a
cid;
SFA
= s
atur
ated
fatt
y ac
ids;
MU
FA =
mon
ouns
atur
ated
fatt
y ac
ids;
PU
FA =
pol
yuns
atur
ated
fatt
y ac
ids.
Low
er a
nd u
pper
bou
nds
of 9
5% c
onfid
ence
inte
rval
s fo
r Sp
earm
an’s
rho
coe
ffici
ents
are
pro
vide
d in
squ
are
brac
kets
.*p
< .0
5. *
*p <
.01.
at Istituto Eugenio Medea on February 10, 2016jad.sagepub.comDownloaded from

10 Journal of Attention Disorders
Figure 2. The relationship between PUFA and Children’s Global Assessment scale (upper panel), Child Health Questionnaire–mental health score (lower left panel), and Child Health Questionnaire–psychosocial summary (lower right panel).
Figure 1. The relationship between DHA shown as percentage of total fatty acids in the whole blood and Strength and Difficulties Questionnaire–total difficulties score (upper left panel), ADHD rating scale–total score (upper right panel), Child Health Questionnaire–mental health score (lower left panel), and Child Health Questionnaire–psychosocial summary (lower right panel).
at Istituto Eugenio Medea on February 10, 2016jad.sagepub.comDownloaded from

Crippa et al. 11
Acknowledgments
We acknowledge the work of Antonio Salandi, Sara Trabattoni, Silvana Bertella, and Catia Rigoletto in the diagnostic evaluation of participants with ADHD; Mariangela Perego for her help in recruiting healthy participants; Morena Achilli; and all nurses at Child Psychopathology Unit, Scientific Institute, Scientific Institute for Research, Hospitalization and Health Care (IRCCS) Eugenio Medea for their assistance with the collection of blood samples. We also thank Angelo Primavera, Ausilia Rausa, Erika Molteni, Stefania Conte, Alessandra Tesei, Veronica La Riccia, Silvia Busti Ceccarelli, and Silvia Colonna for their research assis-tance. Last, we are especially grateful to all the families of the children who took part in this study.
Authors’ Note
The funding source had no role in the study design, data collection and analysis, decision to publish, or preparation of the manuscript.
Declaration of Conflicting Interests
The author(s) declared no potential conflicts of interest with respect to the research, authorship, and/or publication of this article.
Funding
The author(s) disclosed receipt of the following financial support for the research, authorship, and/or publication of this article: This research has been funded by Dietetic Metabolic Food (http://www.dmfmetabolic.it/).
References
Agostoni, C., Galli, C., Riva, E., Risè, P., Colombo, C., Giovannini, M., & Marangoni, F. (2011). Whole blood fatty acid composi-tion at birth: From the maternal compartment to the infant. Clinical Nutrition, 30, 503-505.
American Psychiatric Association. (2000). Diagnostic and sta-tistical manual of mental disorders (4th ed., text rev.). Washington, DC: Author.
American Psychiatric Association. (2013). Diagnostic and sta-tistical manual of mental disorders (5th ed.). Arlington, VA: American Psychiatric Publishing.
Antalis, C. J., Stevens, L. J., Campbell, M., Pazdro, R., Ericson, K., & Burgess, J. R. (2006). Omega-3 fatty acid status in attention-deficit/hyperactivity disorder. Prostaglandins, Leukotrienes and Essential Fatty Acids, 75, 299-308.
Bloch, M. H., & Qawasmi, A. (2011). Omega-3 fatty acid supple-mentation for the treatment of children with attention-deficit/hyperactivity disorder symptomatology: Systematic review and meta-analysis. Journal of the American Academy of Child & Adolescent Psychiatry, 50, 991-1000.
Bouchard-Mercier, A., Rudkowska, I., Lemieux, S., Couture, P., & Vohl, M.-C. (2014). Polymorphisms in genes involved in fatty acid β-oxidation interact with dietary fat intakes to mod-ulate the plasma TG response to a fish oil supplementation. Nutrients, 6, 1145-1163.
Busner, J., & Targum, S. D. (2007). The Clinical Global Impressions Scale: Applying a research tool in clinical prac-tice. Psychiatry (Edgmont), 4, 28-37.
Caspi, A., Williams, B., Kim-Cohen, J., Craig, I. W., Milne, B. J., & Poulton, R. (2007). Moderation of breastfeeding effects on the IQ by genetic variation in fatty acid metabo-lism. Proceedings of the National Academy of Sciences of the United States of America, 104, 18860-18865.
Coghill, D. R., Rhodes, S. M., & Matthews, K. (2007). The neu-ropsychological effects of chronic methylphenidate on drug-naive boys with attention-deficit/hyperactivity disorder. Biological Psychiatry, 62, 954-962.
Colquhoun, I., & Bunday, S. (1981). A lack of essential fatty acids as a possible cause of hyperactivity in children. Medical Hypotheses, 7, 673-679.
Colter, A. L., Cutler, C., & Meckling, K. A. (2008). Fatty acid status and behavioural symptoms of attention deficit hyperac-tivity disorder in adolescents: A case-control study. Nutrition Journal, 7, 79-85.
Conners, C. K. (1997). Conners’ Rating Scales–Revised (Technical manual). Toronto, Ontario, Canada: Multi-Health Systems.
Cooper, R. E., Tye, C., Kuntsi, J., Vassos, E., & Asherson, P. (2015). Omega-3 polyunsaturated fatty acid supplementa-tion and cognition: A systematic review and meta-analysis. Journal of Psychopharmacology, 29, 753-763.
Daams, M., Schuitema, I., van Dijk, B. W., van Dulmen-den Broeder, E., Veerman, A. J., van den Bos, C., & de Sonneville, L. M. (2012). Long-term effects of cranial irradiation and intrathecal chemotherapy in treatment of childhood leukemia: A MEG study of power spectrum and correlated cognitive dysfunction. BMC Neurology, 12, 84.
de Sonneville, L. M. J. (2000). ANT 2.1—Amsterdam Neuropsychological Tasks. Amstelveen, The Netherlands: Sonar.
DuPaul, G. J., Power, T. J., Anastopoulos, A. D., & Reid, R. (1998). ADHD Rating Scale IV: checklists, norms, and clini-cal interpretation. New York, NY: Guilford.
Faraone, S. V., & Mick, E. (2010). Molecular genetics of attention deficit hyperactivity disorder. Psychiatric Clinics of North America, 33, 159-180.
Field, A. (2013). Discovering statistics using IBM SPSS statistics. London, England: Sage.
Gillies, D., Sinn, J. K. H., Lad, S. S., Leach, M. J., & Ross, M. J. (2012). Polyunsaturated fatty acids (PUFA) for attention deficit hyperactivity disorder (ADHD) in children and adoles-cents (review). The Cochrane Library, 7, CD007986.
Goodman, R. (1997). The Strengths and Difficulties Questionnaire: A research note. Journal of Child Psychology and Psychiatry, 38, 581-586.
Goodman, R., Ford, T., Richards, H., Gatward, R., & Meltzer, H. (2000). The development and well-being assessment: Description and initial validation of an integrated assessment of child and adolescent psychopathology. Journal of Child Psychology and Psychiatry, 41, 645-655.
Gow, R. V., Vallee-Tourangeau, F., Crawford, M. A., Taylor, E., Ghebremeskel, K., Bueno, A. A., . . . Rubia, K. (2013). Omega-3 fatty acids are inversely related to callous and unemotional traits in adolescent boys with attention deficit hyperactivity disorder. Prostaglandins, Leukotrienes and Essential Fatty Acids (PLEFA), 88, 411-418.
Groth-Marnat, G. (1997). Handbook of psychological assessment (3rd ed.). New York, NY: John Wiley and Sons.
at Istituto Eugenio Medea on February 10, 2016jad.sagepub.comDownloaded from

12 Journal of Attention Disorders
Günther, T., Herpertz-Dahlmann, B., & Konrad, K. (2010). Sex differences in attentional performance and their modula-tion by methylphenidate in children with attention-deficit/hyperactivity disorder. Journal of Child and Adolescent Psychopharmacology, 20, 179-186.
Hawkey, E., & Nigg, J. T. (2014). Omega-3 fatty acid and ADHD: Blood level analysis and meta-analytic extension of supple-mentation trials. Clinical Psychology Review, 34, 496-505.
Hollingshead, A. B. (1975). Four factor index of social status (Unpublished document). Yale University, New Haven, CT.
Italian National Institute of Health. (2014). Retrieved from http://www.iss.it/binary/adhd/cont/Newsletter_Registro_Italiano_dicembre_2014.pdf
Janssen, C. I., & Kiliaan, A. J. (2014). Long-chain polyunsatu-rated fatty acids (LCPUFA) from genesis to senescence: The influence of LCPUFA on neural development, aging, and neurodegeneration. Progress in Lipid Research, 53, 1-17. doi:10.1016/j.plipres.2013.10.002
Kirby, A., Woodward, A., Jackson, S., Wang, Y., & Crawford, M. A. (2010). Children’s learning and behaviour and the association with cheek cell polyunsaturated fatty acid levels. Research in Developmental Disabilities, 31, 731-742.
Klein, C., Wendling, K., Huettner, P., Ruder, H., & Peper, M. (2006). Intra-subject variability in attention-deficit hyperac-tivity disorder. Biological Psychiatry, 60, 1088-1097.
Landgraf, J. M., Abetz, L., & Ware, J. E. (1996). The CHQ user’s manual. Boston, MA: The Health Institute, New England Medical Center.
Marangoni, F., Colombo, C., & Galli, C. (2004). A method for the direct evaluation of the fatty acid status in a drop of blood from a fingertip in humans: Applicability to nutritional and epidemiological studies. Analytical Biochemistry, 326, 267-272.
Montgomery, P., Burton, J. R., Sewell, R. P., Spreckelsen, T. F., & Richardson, A. J. (2013). Low blood long chain omega-3 fatty acids in UK children are associated with poor cognitive performance and behavior: A cross-sectional analysis from the DOLAB study. PLoS ONE, 8, 1-11.
Petersen, A. C., Crockett, L., Richards, M., & Boxer, A. (1988). A self-report measure of pubertal status: Reliability, valid-ity, and initial norms. Journal of Youth and Adolescence, 17, 117-133.
Risè, P., Eligini, S., Ghezzi, S., Colli, S., & Galli, C. (2007). Fatty acid composition of plasma blood cells and whole blood: Relevance for the assessment of the fatty acid status in humans. Prostaglandins, Leukotrienes, and Essential Fatty Acids, 76, 363-369.
Sartori, G., Job, R., & Tressoldi, P. E. (1995). Batteria per la valu-tazione della dislessia e della disortografia evolutiva [Battery for the assessment of developmental dyslexia and spelling disorder]. Firenze, Italy: Organizzazioni Speciali.
Schuchardt, J. P., & Hahn, A. (2011). Influence of long-chain polyunsaturated fatty acids (LC-PUFAs) on cognitive and visual development. In D. Benton (Ed.), Lifetime nutritional influences on cognition, behaviour and psychiatric illness (pp. 32-78). Oxford: Woodhead Publishing.
Shaffer, D., Gould, M. S., Brasic, J., Ambrosini, P., Fisher, P., Bird, H., & Aluwahlia, S. (1983). A Children’s Global
Assessment Scale (CGAS). Archives of General Psychiatry, 40, 1228-1231.
Simopoulos, A. P. (2002). Omega-3 fatty acids in inflammation and autoimmune diseases. Journal of the American College of Nutrition, 21, 495-505.
Simopoulos, A. P. (2011). Evolutionary aspects of diet: The Omega-6/Omega-3 ratio and the brain. Molecular Neurobiology, 44, 203-215.
Sonuga-Barke, E. J. S., Brandeis, D., Cortese, S., Daley, D., Ferrin, M., Holtmann, M., . . . European ADHD Guidelines Group. (2013). Nonpharmacological interventions for ADHD: Systematic review and metaanalyses of random-ized controlled trials of dietary and psychological treatments. American Journal of Psychiatry, 170, 275-289.
Stevens, L. J., Zentall, S. S., Abate, M. L., Kuczek, T., & Burges, J. R. (1996). Omega-3 fatty acids in boys with behavior, learning, and health problems. Physiology & Behavior, 59, 915-920.
Stevens, L. J., Zentall, S. S., Deck, J. L., Abate, M. L., Watkins, B. A., Lipp, S. R., & Burgess, J. R. (1995). Essential fatty acid metabolism in boys with attention-deficit hyperactivity disorder. The American Journal of Clinical Nutrition, 62, 761-768.
Stevenson, J., Buitelaar, J., Cortese, S., Ferrin, M., Konofal, E., Lecendreux, M., . . . Sonuga-Barke, E. (2014). Research review: The role of diet in the treatment of attention- deficit/hyperactivity disorder: An appraisal of the evidence on efficacy and recommendations on the design of future studies. Journal of Child Psychology and Psychiatry, 55, 416-427.
Thomas, R., Sanders, S., Doust, J., Beller, E., & Glasziou, P. (2015). Prevalence of attention-deficit/hyperactivity disor-der: A systematic review and meta-analysis. Pediatrics, 135, e994-e1001.
Transler, C., Eilander, A., Mitchell, S., & van de Meer, N. (2010). The impact of polyunsaturated fatty acids in reducing child attention deficit and hyperactivity disorders. Journal of Attention Disorders, 14, 232-246.
Uauy, R., Hoffman, D. R., Peirano, P., Birch, D. G., & Birch, E. E. (2001). Essential fatty acids in visual and brain development. Lipids, 36, 885-895.
van Dijk, S. J., Feskens, E. J., Bos, M. B., Hoelen, D. W., Heijligenberg, R., Bromhaar, M. G., . . . Afman, L. A. (2009). A saturated fatty acid-rich diet induces an obesity-linked pro-inflammatory gene expression profile in adipose tissue of sub-jects at risk of metabolic syndrome. The American Journal of Clinical Nutrition, 90, 1656-1664.
van Elst, K., Bruining, H., Birtoli, B., Terreaux, C., Buitelaar, J. K., & Kas, M. J. (2014). Food for thought: Dietary changes in essential fatty acid ratios and the increase in autism spec-trum disorders. Neuroscience & Biobehavioral Reviews, 45, 369-378.
Wechsler, D. (2006). Wechsler Intelligence Scale for Children–III (WISC-III) Italian Edition. Florence, Italy: Organizzazioni Speciali.
Wechsler, D. (2012). Wechsler Intelligence Scale for Children–IV (WISC-IV) Italian Edition. Florence, Italy: Organizzazioni Speciali.
at Istituto Eugenio Medea on February 10, 2016jad.sagepub.comDownloaded from

Crippa et al. 13
Author Biographies
Alessandro Crippa is a research consultant in the Child Psychopathology Unit at Scientific Institute, IRCCS Eugenio Medea (Bosisio Parini, Italy). He received a certificate of psychotherapist on completion of the 4-year postgraduate course in psychotherapy, “A.N.Svi,” Academy of Developmental Neuropsychology (Parma, Italy).
Carlo Agostoni, MD, is a professor of pediatrics at the University of Milan, and chair of the Intermediate Care Pediatric Department at the IRCCS Policlinico, Ospedale Maggiore Ca’ Granda, in Milan.
Maddalena Mauri is a research assistant in the Child Psychopathology Unit at Scientific Institute, IRCCS Eugenio Medea (Bosisio Parini, Italy).
Massimo Molteni, MD, is the head of the Child Psychopathology Unit at Scientific Institute, IRCCS Eugenio Medea (Bosisio Parini, Italy).
Maria Nobile, MD, PhD, is a senior researcher in the Child Psychopathology Unit at Scientific Institute, IRCCS Eugenio Medea (Bosisio Parini, Italy). She is the chief of the Centre for Clinical Excellence in Adolescent Psychopathology at the Department of Clinical Neuroscience, Villa San Benedetto Hospital, Albese con Cassano (CO), Italy.
at Istituto Eugenio Medea on February 10, 2016jad.sagepub.comDownloaded from