Embed Size (px)
Citation preview
POLYPLOIDY, INBREEDING DEPRESSION, AND THE EVOLUTION OF
MATING SYSTEMS IN FLOWERING PLANTS
A Dissertation
Presented to the Faculty of the Graduate School
of Cornell University
In Partial Fulfillment of the Requirements for the Degree of
Doctor of Philosophy
by
Brian C. Barringer
January 2008
© 2008 Brian C. Barringer
POLYPLOIDY, INBREEDING DEPRESSION, AND THE EVOLUTION OF
MATING SYSTEMS IN FLOWERING PLANTS
Brian C. Barringer, Ph. D.
Cornell University 2008
Mating systems control the movement of genes through time and space,
making the evolution of mating systems a central question in evolutionary biology.
Some of the most persistent questions surrounding the evolution of mating systems in
plants are those that address the evolution of self-fertilization. A selfing individual
passes on three copies of its genome to offspring for every two copies passed on by an
outcrossing individual. This “cost of outcrossing” provides a 50% fitness advantage to
selfing variants, and, unless counteracted by some other selective force, results in
increased population selfing rates. Several non-mutually exclusive phenomena can
select against the evolution of selfing, including pollen discounting, temporal and
spatial variation in environmental conditions, gender specialization, and inbreeding
depression.
An interesting pattern noted by early plant biologists is the association between
genome duplication (polyploidy) and self-fertilization, with polyploids exhibiting
higher levels of self-fertilization than diploids. Although several phenomena might
influence the evolution of this pattern, reduced inbreeding depression among
polyploids relative to diploids could play a pivotal role. In this dissertation I (1)
evaluate the validity and strength of the association between polyploidy and self-
fertilization in flowering plants, (2) develop simulation-based models to explore the
relationship between polyploidy and inbreeding depression, and (3) conduct
experiments to compare levels of inbreeding depression in four species of annual
plants that vary in both mating system and ploidy.
I demonstrate that, on average, polyploid angiosperms exhibit higher levels of
self-fertilization than their diploid relatives. I then show that polyploid and diploid
populations differ in their response to selection and levels of inbreeding depression.
Although younger polyploids should exhibit less inbreeding depression than diploids,
older polyploids might exhibit the opposite pattern. Finally, I demonstrate that both
mating system and ploidy influence levels of inbreeding depression in the genus
Clarkia (Onagraceae). Selfing taxa exhibit less inbreeding depression than
outcrossing taxa, and polyploid taxa exhibit less inbreeding depression than diploid
taxa.
iii
BIOGRAPHICAL SKETCH
The author was born on November 25th, 1969, in Placerville; a relatively small
town located in the foothills of the Sierra Mountains of Northern California, U. S. A.
When he was nine years old he moved to Sacramento, a much larger city located in the
central valley of Northern California. His path to academics was unorthodox. After
leaving high school he worked in restaurants for two years before beginning work as a
laborer and carpenter’s apprentice, working for small construction companies on
projects throughout Northern California. He joined the United Brotherhood of
Carpenters when he was 20 years old, and worked full-time as a union carpenter for
five years, completing a four-year apprenticeship and earning his journeyman
carpenter credentials. Although he enjoyed his profession in many ways, the relative
lack of intellectual stimulation and job security in the construction industry caused
him to question his career choice. He returned to school when he was 26 years old,
attending Sacramento City College for two years before transferring to the University
of California at Davis. He graduated from UC Davis in 2000 with a Bachelor of
Science degree in Biology (Evolution and Ecology). He then moved to Ithaca, NY,
where he earned his Ph.D. in the Department of Ecology and Evolutionary Biology at
Cornell University. He leaves Cornell in January 2008 to begin postdoctoral research
in the Department of Biology at The University of Virginia.
iv
To my Father and Sara, my Mother and Mariano, and my brother Scott.
I did it. Thank you for always believing I could.
v
ACKNOWLEDGMENTS
This work would not have been possible without the patient guidance of
Monica Geber. Monica represents everything one could ever hope to have in a
graduate advisor, and, after spending over seven years in Monica’s lab, I continue to
be amazed by her incredible intelligence, her honest and humble approach to science,
and her sympathetic, kind, and generous nature. On the door to Monica’s office is the
phrase “under-commit and over-achieve.” During my time as her student she
encouraged me to do both, by asking very little of me in terms of commitments, yet
refusing to accept anything but my very best in the work that I conducted. Although it
was somewhat painful at times, Monica taught me more about how to do science than
I ever dreamed there was know. In the process she changed my life forever. I will
always be grateful.
I also owe a special thanks to my minor committee members, Jeff Doyle, Irby
Lovette, and Rick Harrison. Jeff welcomed me into his lab early on during my
graduate tenure, allowed me to play with his chemicals and micropipettes, and always
encouraged me to stop by his office to chat about my interests and my progress. I only
regret that I did not take advantage of his offers nearly enough. Irby Lovette helped
me with my research in several ways, though it was his contribution to my teaching
experience that I will remember and value the most. Irby acknowledged and nurtured
my passion for teaching by inviting me to lecture in his Evolutionary Biology course
and by requesting that I serve as his head teaching assistant during multiple semesters.
These experiences were invaluable to me, as they reinforced my growing desire to
make teaching a central part of my life, and gave me the confidence that I needed to
make that happen. Finally, Rick Harrison contributed to my education and growth as
a scientist in numerous ways. Rick is among the most brilliant men I’ve met, and his

vi
ability to think critically and clearly about complex problems is both astonishing and
inspiring. Perhaps more importantly, his office door was always open when I needed
to converse about my dissertation or my personal life. I will miss those conversations
greatly.
Several people outside of Cornell University also influenced my dissertation
research, and I thank them for their time, their encouragement, and their interest in my
work. Brian Husband hosted my visit to the University of Guelph, where he and his
lab group provided valuable feedback regarding my research plans and interests, and
Spencer Barrett (University of Toronto) and Chris Eckert (Queen’s University)
generously shared their plant selfing rate data with me, and offered much in the way of
meaningful advice.
My fellow graduate students influenced and enriched my life at Cornell in
many ways. In particular I thank Jill Anderson, Jesse Bellemare, Jason Boulanger,
Lauren Chan, Becky Doyle, Jennifer Fox, Robert Harris, David Moeller, Jeanne
Robertson, and Jennifer Shirk for their friendships, their camaraderie, and their
intellects. Kathy Mills and Mia Park were two of the best housemates a person could
ever wish to have; so much so, in fact, that they feel like family to me now. Finally,
Kendra Liddicoat put up with me during the last two years of my dissertation work, a
feat well beyond the abilities of most mere mortals. As I struggled through the last
tedious throes of dissertation writing, Kendra’s unwavering support and
encouragement were invaluable to me, and I don’t know that I would have made it
without her.
The Department of Ecology and Evolutionary Biology has provided an
unparalleled environment for me to grow as a scientist and a teacher, and, in addition
to its outstanding faculty and students, my success as a graduate student was
augmented by the wonderful atmosphere created by its caring and attentive staff. In
vii
particular I thank John Howell, Patty Jordan, Brian Mlodzinski, Janeen Orr, and Sandy
Smith for their invaluable help in all things. Whether finding me the perfect office
space, preparing student evaluations of my teaching, fixing my computer, helping me
to make photocopies, or engaging me in hundreds of fun and down to earth
conversations during the early hours of the morning, they made my sometimes tedious
life in Corson Hall somewhat more bearable.
Finally, my work was partially funded by The California Native Plant Society,
The Andrew W. Mellon Foundation, The Orenstein Fund, The Sigma Xi Grants-in-
Aid of Research Program, and the Department of Ecology and Evolutionary Biology
and the College of Agriculture and Life Sciences at Cornell University. I thank them
for their support.
viii
TABLE OF CONTENTS
Page
Biographical Sketch iii
Dedication iv
Acknowledgments v
List of Figures x
List of Tables xii
Chapter 1 Polyploidy and self-fertilization in flowering plants
Abstract 1
Introduction 2
Methods 7
Results 11
Discussion 13
Conclusions 18
Literature Cited 20
Chapter 2 Inbreeding depression and the response to selection in
polyploid and diploid plants
Abstract 26
Introduction 27
Methods 32
Results 34
Discussion 46
Conclusions 48
Literature Cited 50
ix
Page
Chapter 3 Mating system and ploidy influence levels of
inbreeding depression in Clarkia (Onagraceae)
Abstract 55
Introduction 56
Methods 60
Results 68
Discussion 73
Conclusions 76
Literature Cited 80

x
LIST OF FIGURES
Page
CHAPTER 1 Figure 1.1 Numbers of taxa represented in the dataset by each 9
combination of cytotype and life history Figure 1.2 Differences in levels of self-fertilization between 12
diploids and polyploids for each of the 32 phylogenetically-independent contrasts
Figure 1.3 Levels of self-fertilization for each combination of 14
cytotype and life history
CHAPTER 2 Figure 2.1 The effect of the interactions between ploidy and other 40
model parameters on the proportion of trials ending with fixation of the beneficial allele and, for allotetraploids only, the proportion of trials ending in permanent genomic heterozygosity
Figure 2.2 The influence of the interactions between population size 41
and selection and dominance and selection on the proportion of trials ending with fixation of the beneficial allele
Figure 2.3 The effect of the interactions between ploidy and other 42
model parameters on the number of generations required to fix beneficial alleles
Figure 2.4 The effect of the interactions between selfing rate and 44
population size, dominance, and selection on the number of generations required for populations to fix beneficial alleles
Figure 2.5 The effect of the interactions between population size and 45
both dominance and selection on the number of generations required for populations to fix beneficial alleles
Figure 2.6 The effect of the interactions between selection and both 45
population size and dominance on the proportion of trials ending in permanent genomic heterozygosity in allotetraploids
xi
Page
CHAPTER 3 Figure 3.1 Experimental (crossing) design 64 Figure 3.2 Components of fitness included in the two estimates 67
of cumulative fitness Figure 3.3 Estimated mean levels of inbreeding depression for 69
traits correlated with fitness in Clarkia
xii
LIST OF TABLES
Page
CHAPTER 1 Table 1.1 Results from the analysis of phylogenetically- 11
independent contrasts Table 1.2 Analysis of variance on the effects of ploidy, life 13
history, and their interaction on selfing rate in the cross-species analysis
Table 1.3 Least-squares means of selfing rates in the cross- 15
species analysis for diploids, polyploids, annuals, herbaceous perennials, and woody perennials
CHAPTER 2 Table 2.1 Model parameters and values used in simulations 31 Table 2.2 Fitness functions for each genotype 33 Table 2.3 P-values from analysis of variance on the effects of 35
different parameters and their two-way interactions on response variables
Table 2.4 LS means from analysis of variance of response 36
variables for all model parameters and two-way interactions
CHAPTER 3 Table 3.1 Denominator degrees of freedom and F-values 70
testing for the effects of ploidy, mating system, and their interaction on levels of inbreeding depression in Clarkia
Table 3.2 Estimated mean levels of inbreeding depression 71
for fitness components and cumulative fitness in Clarkia
Appendix Table 3.1 Clarkia species and populations used in this 78
study Appendix Table 3.2 Mean numbers of days to germination, first 79
flowering, and senescence for each species used in this study
1
CHAPTER 1
POLYPLOIDY AND SELF-FERTILIZATION IN FLOWERING PLANTS *
Abstract
Mating systems directly control the transmission of genes across generations,
and understanding the diversity and distribution of mating systems is central to
understanding the evolution of any group of organisms. This basic idea has been the
motivation for many studies that have explored the relationships between plant mating
systems and other biological and/or ecological phenomena, including a variety of
floral and environmental characteristics, conspecific and pollinator densities, growth
form, parity, and genetic architecture. In addition to these examples, a potentially
important but poorly understood association is the relationship between plant mating
systems and genome duplication, i.e., polyploidy. It is widely held that polyploid
plants self-fertilize more than their diploid relatives, yet a formal analysis of this
pattern does not exist. Data from 235 species of flowering plants were used to analyze
the association between self-fertilization and ploidy. Phylogenetically-independent
contrasts and cross-species analyses both lend support to the hypothesis that
polyploids self-fertilize more than diploids. Because polyploidy and self-fertilization
are so common among angiosperms, these results contribute not only to our
understanding of the relationship between mating systems and polyploidy in
particular, but more generally, to our understanding of the evolution of flowering
plants.
* Barringer, B. C. (2007). Polyploidy and self-fertilization in flowering plants. American Journal of Botany 94:1527-1533.
2
Introduction
The diversity and distribution of mating systems in plants have been of long-
standing interest, and it is widely acknowledged that mating systems can profoundly
influence the evolutionary trajectories and long-term success of taxa (Darwin 1859,
1876; Stebbins, 1950, 1957; Grant, 1981, Lande and Schemske 1985; Barrett and
Eckert, 1990; Barrett et al., 1996; Barrett, 2003). Because mating systems are
influenced and molded by environmental and genetic factors (Barrett and Eckert,
1990; Barrett, 2003) they are not simply static descriptors of a taxon’s life-history, but
are, rather, dynamic and evolving traits in and of themselves (Barrett and Eckert,
1990). For these reasons, a thorough understanding of the evolution of plant mating
systems and the patterns of their distributions is clearly fundamental to an
understanding of the evolution of flowering plants.
Some of the most persistent questions surrounding the evolution of plant
mating systems are those that address the evolution of self-fertilization. In the absence
of pollen discounting (the reduction due to selfing in the number of pollen grains
available for outcrossing (Harder and Wilson, 1998)), selfing is advantageous because
a selfing individual will pass on two copies of its genome for every copy passed on by
an outcrossing individual (Fisher, 1941). This “cost of outcrossing” provides a 50%
fitness advantage to selfing variants in otherwise outcrossing populations, and, unless
counteracted by some other selective force, will translate to increased population
selfing rates (Fisher, 1941; Charlesworth and Charlesworth, 1979). In addition, self-
fertilization may be advantageous as a reproductive assurance mechanism (Stebbins,
1950, 1957; Grant, 1981; Pannell and Barrett, 1998; Morgan and Wilson, 2005) or as a
means of fixing co-adapted gene complexes (Lande and Schemske, 1985).
In contrast to phenomena that might favor the evolution of selfing are a variety
of factors that may select for outcrossing, such as pollen discounting (Harder and
3
Wilson, 1998), temporal and spatial variation in environmental conditions (Maynard-
Smith, 1978; Lande and Schemske, 1985), and tradeoffs in the allocation of energy to
male and female functions resulting in gender specialization (Charnov et al., 1976;
Brunet, 1992; Thomson, 2006). In addition, inbreeding depression (the reduction in
fitness of inbred relative to non-inbred individuals) is often hypothesized to be strong
enough to overcome the selective cost to outcrossing (Charlesworth and Charlesworth,
1979, 1987; Lande and Schemske, 1985; Husband and Schemske, 1996, 1997). If
inbreeding depression leads to a 50% fitness reduction in selfed progeny relative to
outcrossed siblings, selfing may no longer be advantageous (Charlesworth and
Charlesworth, 1979, 1987; Lande and Schemske, 1985; but see Holsinger, 1988).
Despite the detrimental effects of inbreeding and the potential benefits of outcrossing,
however, high levels of self-fertilization have evolved repeatedly in many groups
(Stebbins, 1950; Johnston and Schoen, 1996).
The transition from outcrossing to selfing in plants is correlated with many
biological and ecological phenomena, including a variety of floral and environmental
characteristics, conspecific and pollinator densities, growth form, parity, and genetic
architecture (Darwin, 1876; Stebbins, 1950, 1957; Grant 1956, 1981; Charlesworth
and Charlesworth, 1979; Wyatt, 1984; Lloyd, 1992; Barrett et al., 1996; Pannell and
Barrett, 1998; Morgan, 2001; Barrett, 2003; Morgan and Wilson, 2005; Scofield and
Schultz, 2006). In addition to these examples, a potentially important though not well-
understood association is the relationship between self-fertilization and genome
duplication, i.e., polyploidy. Polyploids are organisms with more than two sets of
chromosomes (Grant, 1981; Soltis et al., 2004), and, although relatively rare in most
groups of animals (Otto and Whitton, 2000; Mable, 2004a; but see Legatt and Iwama,
2003), polyploidy is common in flowering plants (Soltis et al., 2004). The
relationship between polyploidy and self-fertilization in plants has been of interest for
4
many years, because it is widely held that polyploids have higher selfing rates than
their diploid relatives (Stebbins, 1950; Mable, 2004b). There are several non-mutually
exclusive reasons for why polyploidy might be associated with increased levels of
selfing in plants: First, polyploidy may facilitate the evolution of self-fertilization
because it results in a breakdown of self-incompatibility (SI) systems in many groups
of plants, especially those whose SI systems are gametophytic (Bateman, 1952;
Barrett, 1987; Mable, 2004b). Since SI systems reduce or eliminate the ability to self-
fertilize, it follows that some polyploids may exhibit increased levels of selfing
compared to their diploid relatives whose SI systems remain intact. Second, the
ability to self-fertilize may facilitate the evolution of polyploidy. Newly-arisen
polyploids (i.e., neopolyploids) are likely to co-occur with their diploid progenitors
(Levin, 1975; Jackson, 1976; Ramsey and Schemske, 1998), and since inter-cytotype
crosses often result in offspring with low fitness (Levin, 1975; Ramsey and Schemske,
1998), minority cytotypes are expected to experience negative frequency-dependent
selection, a phenomenon referred to as minority cytotype disadvantage (Levin, 1975).
The ability to self-fertilize should reduce the effects of minority cytotype disadvantage
by eliminating the need for a cytoplasmically-compatible mate, and for this reason it
may be that selfing taxa, on average, successfully produce more polyploids than do
outcrossing taxa (Grant, 1956, 1981; Stebbins, 1957; Levin, 1975; Ramsey and
Schemske, 1998). Finally, some theoretical work predicts that polyploids may exhibit
less inbreeding depression than diploids, owing to the presence of multiple gene
copies and the associated reduction in the rate of formation of homozygotes (Lande
and Schemske, 1985). The relationship between polyploidy and inbreeding depression
is complex, however, and levels of inbreeding depression in polyploids have been
shown to depend on many additional factors, including the level of dominance of
deleterious alleles, the number and lethality of genes involved, and the age of the
5
polyploid in question (Ronfort, 1999; Pannell et al., 2004; Rausch and Morgan, 2005).
Indeed, some studies predict that, under some circumstances, polyploids might exhibit
greater inbreeding depression than their diploid relatives (Busbice and Wilsie, 1966;
Bennett, 1976; Ronfort, 1999). In addition, polyploids differ in regard to the behavior
of their chromosomes during cell division, and although autopolyploids (polyploids
that possess only homologous chromosomes) may effectively mask deleterious alleles
better than diploids, allopolyploids (polyploids that possess homeologous
chromosomes) are expected to exhibit chromosomal behavior similar to that of
diploids, and may not exhibit increased tolerance to inbreeding (Bever and Felber,
1992; Ronfort, 1999; Soltis and Soltis, 2000; Comai, 2005). To date, theoretical work
has concentrated on autopolyploids, however, and no formal theoretical explorations
of inbreeding depression in allopolyploids exist (Pannell et al., 2004; but see Lande
and Schemske, 1985). Comparative data on inbreeding depression in closely-related
polyploid and diploid taxa are few (Ramsey and Schemske, 2002; Pannell et al.,
2004), however at least two studies indicate lower inbreeding depression in
autopolyploids relative to diploids (Husband and Schemske, 1997; Rosquist, 2001).
The ability to increase levels of selfing without suffering the detrimental consequences
of inbreeding depression should select for increased selfing rates among polyploids.
Despite increasing interest in both polyploid and plant mating system
evolution, there are surprisingly few studies that have carefully evaluated whether
polyploids do, in fact, self-fertilize more than diploids (Ramsey and Schemske, 1998;
Mable, 2004b). Among homosporous ferns, polyploids do tend to self-fertilize more
than diploids (Soltis and Soltis, 1987; Masuyama and Watano, 1990; Soltis and Soltis,
1990), and very limited support for this trend in gymnosperms also exists (Barringer,
B. C., unpublished data). Whether this pattern holds across the angiosperms remains
unknown, however, despite many anecdotal examples (e.g., Stebbins, 1950; Grant,
6
1956, 1981). One way to answer this question would be to compare the mating
systems of polyploid angiosperms and their immediate progenitor taxa (i.e., sister-
taxon comparisons), however the relationships between polyploids and their
progenitors are often unknown, and selfing rate estimates for those groups in which
such relationships are known do not generally exist (Husband and Schemske, 1997).
Both Stebbins and Grant describe several genera (e.g., Amsinckia, Bromus, Clarkia,
Gilia, Microseris, etc.) wherein polyploids self more than diploids (Stebbins, 1950;
Grant, 1956, 1981), and others have since documented this trend within specific
groups (Ross, 1981; Husband and Schemske, 1997; Cook and Soltis, 2000; Quarin et
al., 2001; Tate and Simpson, 2004; Guggisberg et al., 2006). The opposite pattern
occurs among diploid and polyploid species of Tragopogon (Asteraceae) (Cook and
Soltis, 1999), however, and although polyploidy might generally be associated with a
loss or breakdown of gametophytic SI systems, a recent review failed to find a
widespread association between polyploidy and self-compatibility, especially among
taxa that exhibit sporophytic or heteromorphic SI (Mable, 2004b). Finally, although
polyploidy has resulted in a breakdown of SI in the genus Lycium (Solanaceae), this
may have led to an increase in inbreeding depression as rates of self-fertilization
increased, which facilitated selection for higher outcrossing rates among polyploids
via the evolution of gender dimorphism (Miller and Venable, 2000).
Here I examine the association between ploidy and self-fertilization using data
from 235 species of flowering plants for which levels of self-fertilization have been
estimated. I report results from two separate analyses of these data: (1)
phylogenetically-independent contrasts (PICs), which control for phylogenetic
relationships among taxa, and (2) an analysis that does not control for phylogeny, but
instead treats each species as an independent data point (i.e., cross-species analysis).
In each analysis I ask whether polyploids exhibit higher levels of self-fertilization than

7
diploids. Annuals, herbaceous perennials, and woody perennials differ in their
average rates of self-fertilization (Barrett and Eckert, 1990; Barrett et al., 1996).
Accordingly, these three life-history categories are represented by the inclusion of an
additional independent variable (along with ploidy) in the second analysis (cross-
species analysis). In addition, the relationship between polyploidy and self-
fertilization might differ among major groups of angiosperms; therefore, in both
analyses the Monocotyledons, Rosids, and Asterids were analyzed on their own in
addition to the analysis of the entire dataset. Although within-family comparisons
might be a more informative and/or biologically meaningful way to analyze
angiosperm life history data, most families included in this study lack variation in
ploidy (among those species represented in the dataset), making within-family
comparative analysis impossible.
Methods
Selfing rate and ploidy database
Selfing rate estimates for angiosperm taxa were compiled from the primary
literature. S. C. H. Barrett provided a database of selfing rates from studies published
through 1995 (S. C. H. Barrett, personal communication). I gathered additional data
on selfing rates published since 1995 (through March, 2006) using the Science
Citation Index Expanded (SCI Expanded – Web of Science) online science literature
database. Only levels of selfing measured in natural populations (i.e., occurring in
their natural habitat and range) were included. Because most studies report population
outcrossing rates, the selfing rate for a given study population is equal to 1-t, where t
is the outcrossing rate. For studies reporting estimates of t > 1 (which may occur if
multiple loci are used and one or more assumptions of the model used to estimate
outcrossing rates are violated (Ritland and Jain 1981)), the selfing rate was set to zero.
8
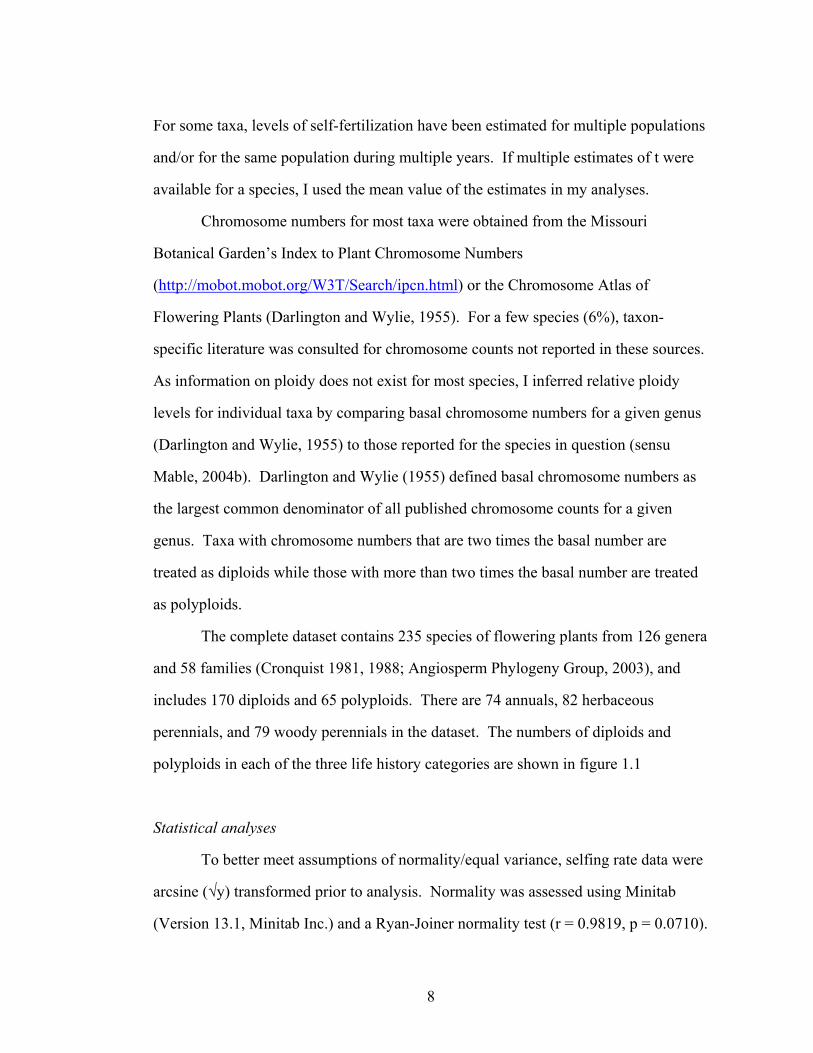
For some taxa, levels of self-fertilization have been estimated for multiple populations
and/or for the same population during multiple years. If multiple estimates of t were
available for a species, I used the mean value of the estimates in my analyses.
Chromosome numbers for most taxa were obtained from the Missouri
Botanical Garden’s Index to Plant Chromosome Numbers
(http://mobot.mobot.org/W3T/Search/ipcn.html) or the Chromosome Atlas of
Flowering Plants (Darlington and Wylie, 1955). For a few species (6%), taxon-
specific literature was consulted for chromosome counts not reported in these sources.
As information on ploidy does not exist for most species, I inferred relative ploidy
levels for individual taxa by comparing basal chromosome numbers for a given genus
(Darlington and Wylie, 1955) to those reported for the species in question (sensu
Mable, 2004b). Darlington and Wylie (1955) defined basal chromosome numbers as
the largest common denominator of all published chromosome counts for a given
genus. Taxa with chromosome numbers that are two times the basal number are
treated as diploids while those with more than two times the basal number are treated
as polyploids.
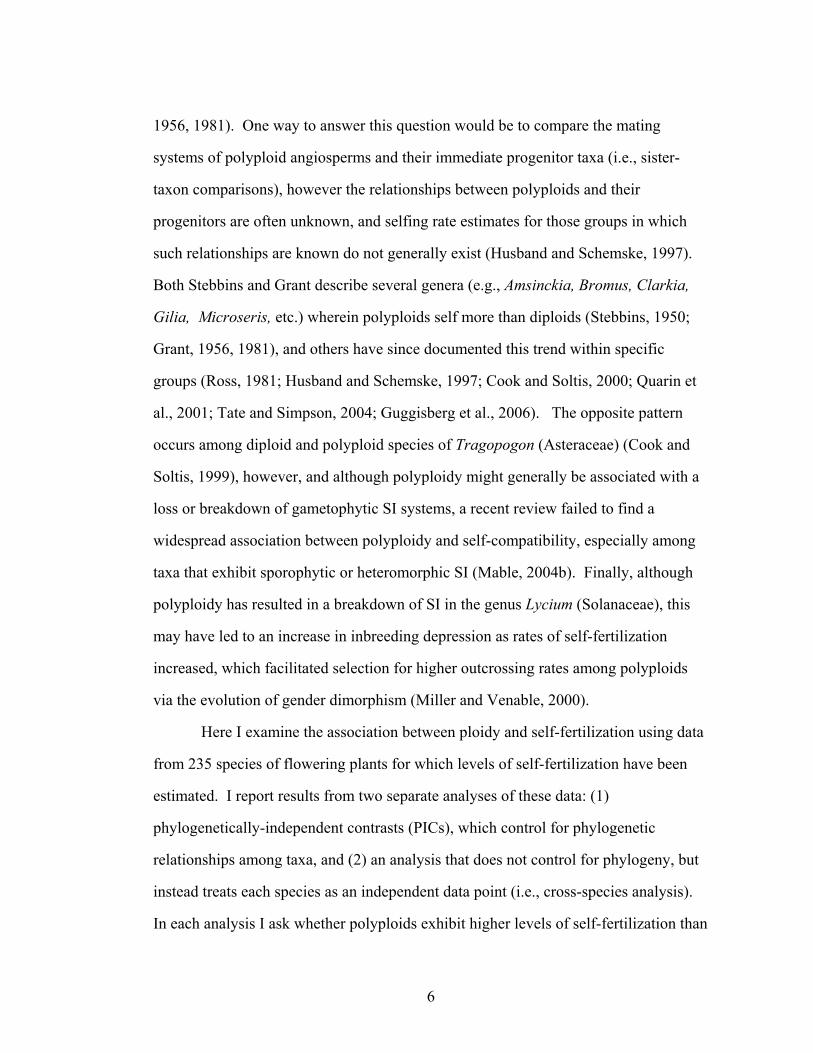
The complete dataset contains 235 species of flowering plants from 126 genera
and 58 families (Cronquist 1981, 1988; Angiosperm Phylogeny Group, 2003), and
includes 170 diploids and 65 polyploids. There are 74 annuals, 82 herbaceous
perennials, and 79 woody perennials in the dataset. The numbers of diploids and
polyploids in each of the three life history categories are shown in figure 1.1
Statistical analyses
To better meet assumptions of normality/equal variance, selfing rate data were
arcsine (√y) transformed prior to analysis. Normality was assessed using Minitab
(Version 13.1, Minitab Inc.) and a Ryan-Joiner normality test (r = 0.9819, p = 0.0710).

9
Figure 1.1. Numbers of taxa represented in the dataset by diploid annuals (Dip. ann.), polyploid annuals (Poly. ann.), diploid herbaceous perennials (Dip. h. per.), polyploid herbaceous perennials (Poly. h. per.), diploid woody perennials (Dip. w. per.), and polyploid woody perennials (Poly. w. per.).
Homogeneity of variance was assessed using Minitab and a Levene test (L = 1.127, p
= 0.341). For all analyses, results from the analysis of non-transformed data were
qualitatively the same.
Analysis 1 (phylogenetically-independent contrasts): Because plant mating
systems are distributed non-randomly with respect to phylogeny (Barrett and Eckert,
1990), PICs were constructed to control for phylogenetic relations among taxa
(Felsenstein, 1985). The MacClade software package (Maddison and Maddison,
1992) was used to build a phylogenetic tree containing all of the 235 species in the
dataset, based on Davies et al.’s (2004) phylogeny of flowering plants. Taxon-specific
literature was used to resolve relationships within families, however several genus-
10
and species-level polytomies remain in the finished tree, owing to a lack of available
data for some groups. The Comparative Analysis by Independent Contrasts (CAIC)
software package (Purvis and Rambaut, 1995) was then used to identify and calculate
PICs for four different trees: (1) the entire tree containing all 235 species, (2) a tree
that included Monocotyledons only (43 species), (3) a tree that included Rosids only
(92 species), and (4) a tree that included Asterids only (77 species). All branch
lengths were set equal; results from the analysis of trees for which branch lengths had
been estimated using the algorithm described by Grafen (1989) were qualitatively the
same. CAIC uses one of two different models to calculate PICs, CRUNCH (if all
variables in the analysis are continuous) or BRUNCH (if the analysis includes one or
more categorical variables) (Purvis and Rambaut, 1995). As ploidy is categorical the
BRUNCH model was used. When performing PICs, CAIC automatically investigates
potential violations in the assumptions of regression analysis
(http://www.bio.ic.ac.uk/evolve/software/caic/assumptions.html); no violations were
found.
Analysis 2 (cross-species analysis): Shifts between outcrossing and selfing as
well as changes in ploidy are very common among angiosperms (Barrett et al., 1996;
Soltis et al., 2004), and because mating systems and ploidy are evolutionarily labile
(relative to rates of speciation), phylogenetic correction may not be necessary
(Felsenstein, 1985; Westoby et al., 1995; Barrett et al., 1996; Ricklefs and Starck,
1996; Price, 1997; Larson and Barrett, 2000; Rheindt et al., 2004) (see discussion). In
addition, levels of self-fertilization among flowering plants correlate strongly with life
history; annuals tend to self more than herbaceous perennials, which in turn have
higher selfing rates than woody perennials (Barrett and Eckert, 1990; Barrett et al.,
1996). Therefore, for the cross-species analysis I included both ploidy and life history
(and their interaction) as independent variables in a two-way analysis of variance
11
(ANOVA) using PROC GLM in SAS (SAS Institute, 1999 – 2001). As in analysis 1,
the Monocotyledons, Rosids, and Asterids were analyzed separately in addition to the
overall analysis, which included all 235 species in the dataset.
Results
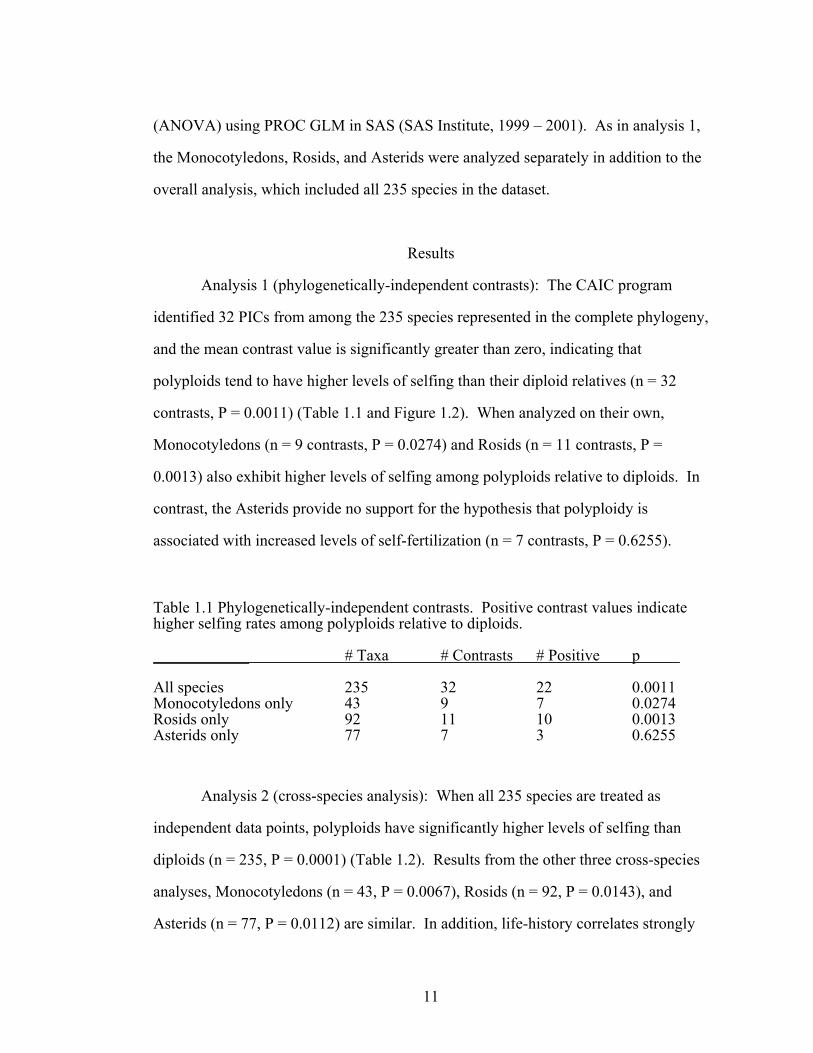
Analysis 1 (phylogenetically-independent contrasts): The CAIC program
identified 32 PICs from among the 235 species represented in the complete phylogeny,
and the mean contrast value is significantly greater than zero, indicating that
polyploids tend to have higher levels of selfing than their diploid relatives (n = 32
contrasts, P = 0.0011) (Table 1.1 and Figure 1.2). When analyzed on their own,
Monocotyledons (n = 9 contrasts, P = 0.0274) and Rosids (n = 11 contrasts, P =
0.0013) also exhibit higher levels of selfing among polyploids relative to diploids. In
contrast, the Asterids provide no support for the hypothesis that polyploidy is
associated with increased levels of self-fertilization (n = 7 contrasts, P = 0.6255). Table 1.1 Phylogenetically-independent contrasts. Positive contrast values indicate higher selfing rates among polyploids relative to diploids. ____________ # Taxa # Contrasts # Positive p All species 235 32 22 0.0011 Monocotyledons only 43 9 7 0.0274 Rosids only 92 11 10 0.0013 Asterids only 77 7 3 0.6255
Analysis 2 (cross-species analysis): When all 235 species are treated as
independent data points, polyploids have significantly higher levels of selfing than
diploids (n = 235, P = 0.0001) (Table 1.2). Results from the other three cross-species
analyses, Monocotyledons (n = 43, P = 0.0067), Rosids (n = 92, P = 0.0143), and
Asterids (n = 77, P = 0.0112) are similar. In addition, life-history correlates strongly
12
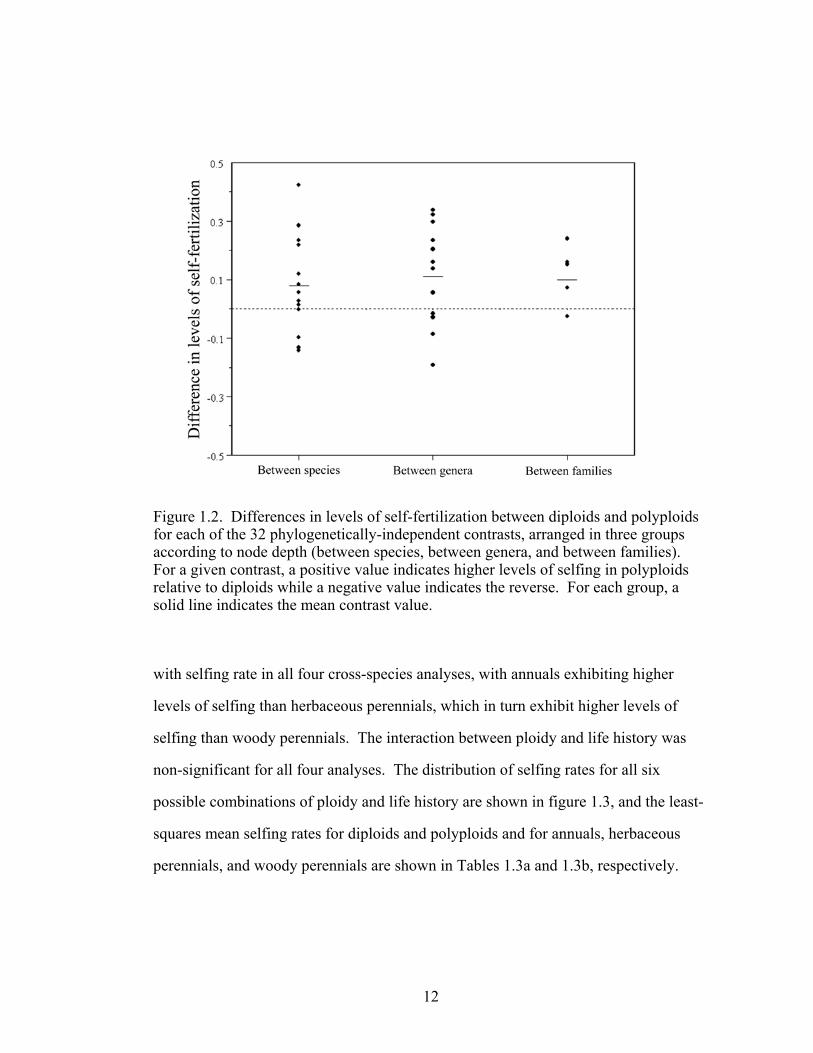
Figure 1.2. Differences in levels of self-fertilization between diploids and polyploids for each of the 32 phylogenetically-independent contrasts, arranged in three groups according to node depth (between species, between genera, and between families). For a given contrast, a positive value indicates higher levels of selfing in polyploids relative to diploids while a negative value indicates the reverse. For each group, a solid line indicates the mean contrast value.
with selfing rate in all four cross-species analyses, with annuals exhibiting higher
levels of selfing than herbaceous perennials, which in turn exhibit higher levels of
selfing than woody perennials. The interaction between ploidy and life history was
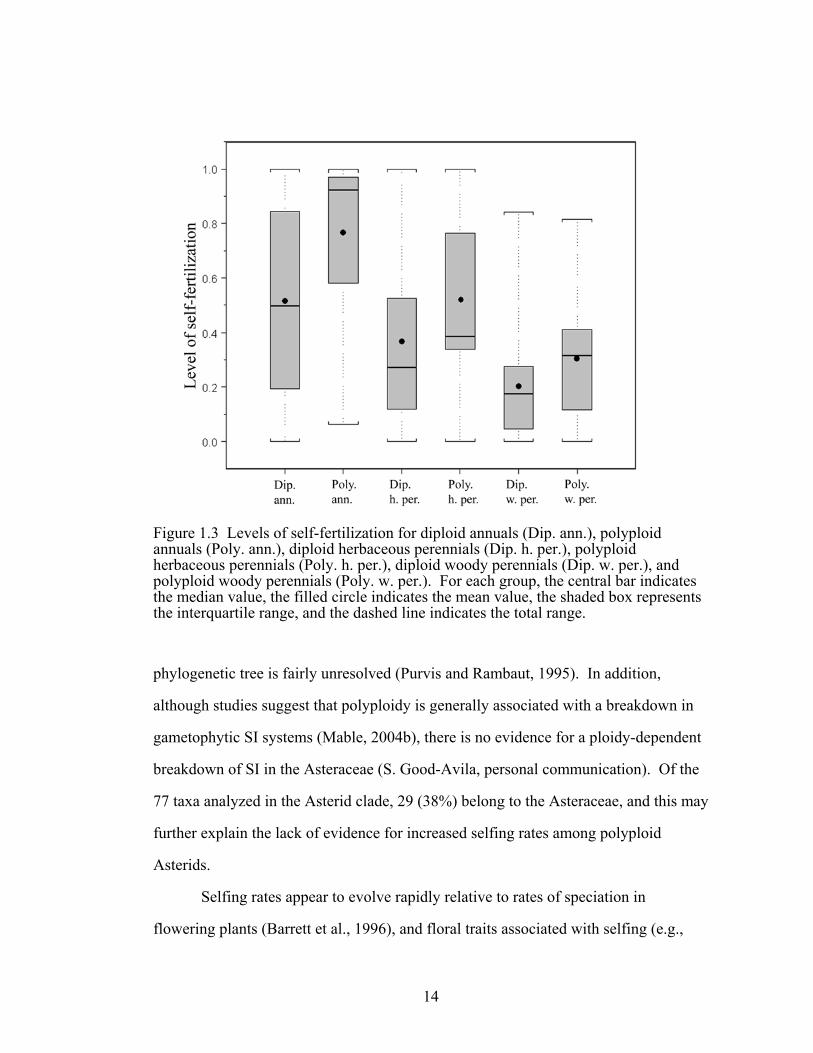
non-significant for all four analyses. The distribution of selfing rates for all six
possible combinations of ploidy and life history are shown in figure 1.3, and the least-
squares mean selfing rates for diploids and polyploids and for annuals, herbaceous
perennials, and woody perennials are shown in Tables 1.3a and 1.3b, respectively.
13
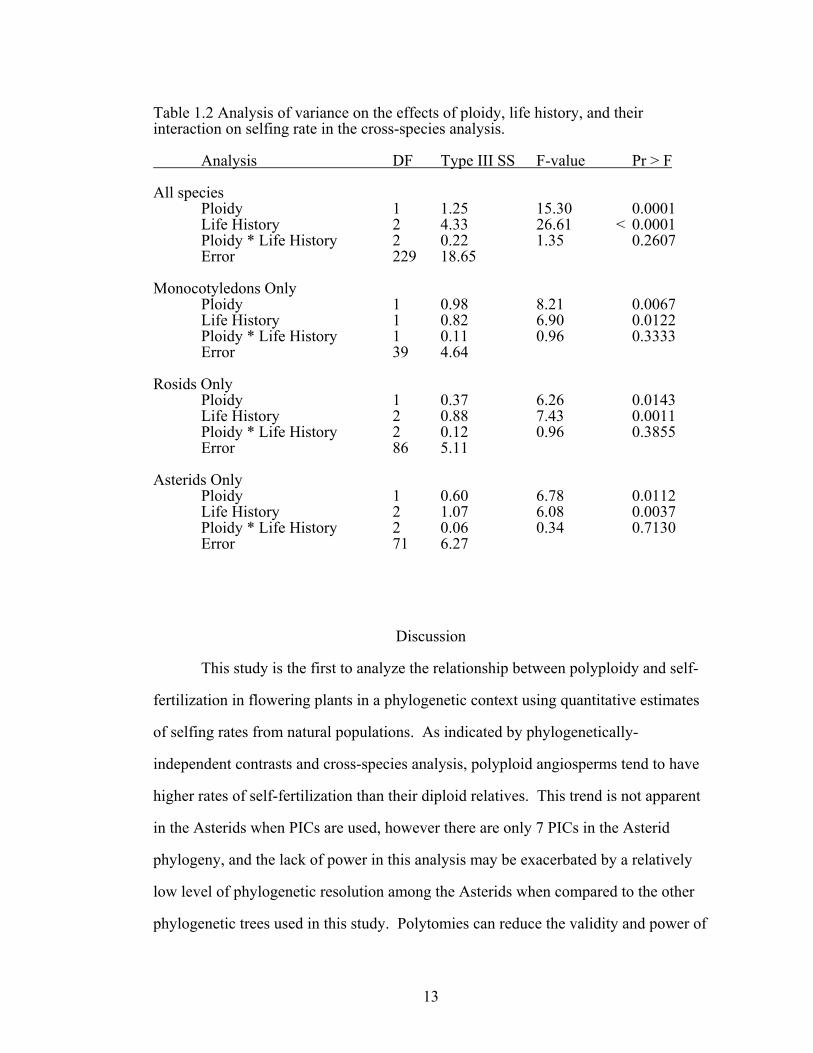
Table 1.2 Analysis of variance on the effects of ploidy, life history, and their interaction on selfing rate in the cross-species analysis. Analysis DF Type III SS F-value Pr > F All species Ploidy 1 1.25 15.30 0.0001 Life History 2 4.33 26.61 < 0.0001 Ploidy * Life History 2 0.22 1.35 0.2607 Error 229 18.65 Monocotyledons Only Ploidy 1 0.98 8.21 0.0067 Life History 1 0.82 6.90 0.0122 Ploidy * Life History 1 0.11 0.96 0.3333 Error 39 4.64 Rosids Only Ploidy 1 0.37 6.26 0.0143 Life History 2 0.88 7.43 0.0011 Ploidy * Life History 2 0.12 0.96 0.3855 Error 86 5.11 Asterids Only Ploidy 1 0.60 6.78 0.0112 Life History 2 1.07 6.08 0.0037 Ploidy * Life History 2 0.06 0.34 0.7130
Error 71 6.27
Discussion
This study is the first to analyze the relationship between polyploidy and self-
fertilization in flowering plants in a phylogenetic context using quantitative estimates
of selfing rates from natural populations. As indicated by phylogenetically-
independent contrasts and cross-species analysis, polyploid angiosperms tend to have
higher rates of self-fertilization than their diploid relatives. This trend is not apparent
in the Asterids when PICs are used, however there are only 7 PICs in the Asterid
phylogeny, and the lack of power in this analysis may be exacerbated by a relatively
low level of phylogenetic resolution among the Asterids when compared to the other
phylogenetic trees used in this study. Polytomies can reduce the validity and power of
14
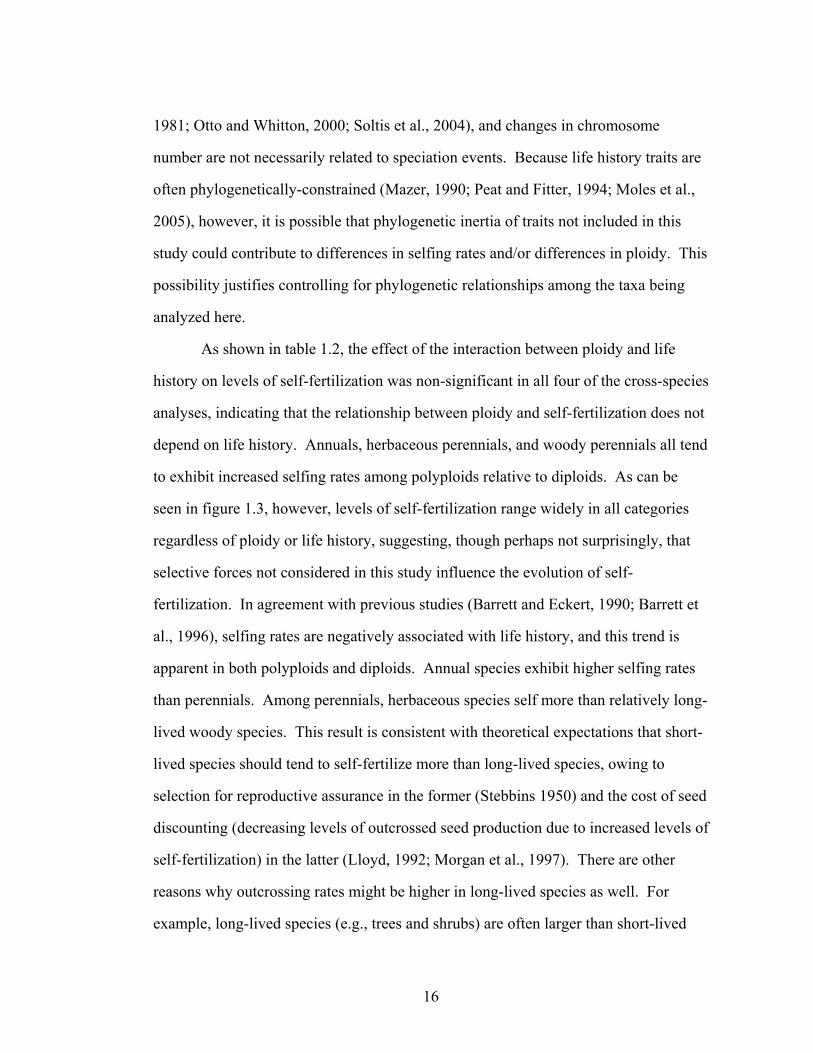
Figure 1.3 Levels of self-fertilization for diploid annuals (Dip. ann.), polyploid annuals (Poly. ann.), diploid herbaceous perennials (Dip. h. per.), polyploid herbaceous perennials (Poly. h. per.), diploid woody perennials (Dip. w. per.), and polyploid woody perennials (Poly. w. per.). For each group, the central bar indicates the median value, the filled circle indicates the mean value, the shaded box represents the interquartile range, and the dashed line indicates the total range.
phylogenetic tree is fairly unresolved (Purvis and Rambaut, 1995). In addition,
although studies suggest that polyploidy is generally associated with a breakdown in
gametophytic SI systems (Mable, 2004b), there is no evidence for a ploidy-dependent
breakdown of SI in the Asteraceae (S. Good-Avila, personal communication). Of the
77 taxa analyzed in the Asterid clade, 29 (38%) belong to the Asteraceae, and this may
further explain the lack of evidence for increased selfing rates among polyploid
Asterids.
Selfing rates appear to evolve rapidly relative to rates of speciation in
flowering plants (Barrett et al., 1996), and floral traits associated with selfing (e.g.,
15
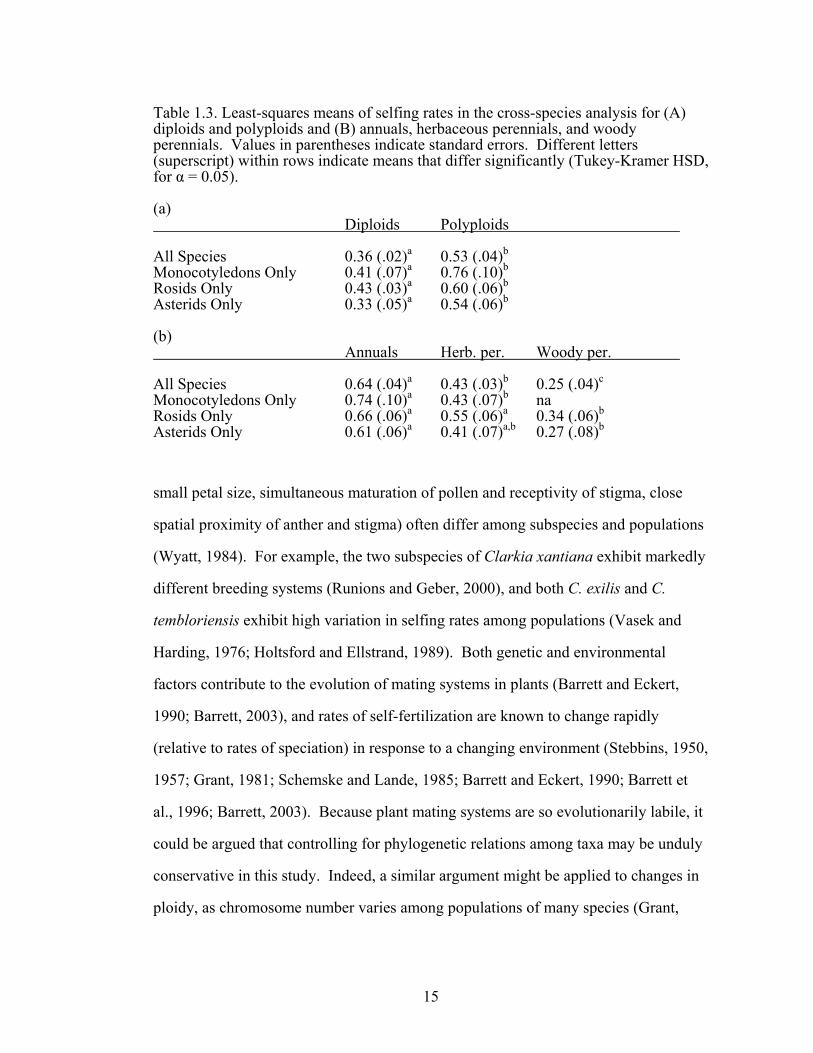
Table 1.3. Least-squares means of selfing rates in the cross-species analysis for (A) diploids and polyploids and (B) annuals, herbaceous perennials, and woody perennials. Values in parentheses indicate standard errors. Different letters (superscript) within rows indicate means that differ significantly (Tukey-Kramer HSD, for α = 0.05). (a) Diploids Polyploids All Species 0.36 (.02)a 0.53 (.04)b
Monocotyledons Only 0.41 (.07)a 0.76 (.10)b
Rosids Only 0.43 (.03)a 0.60 (.06)b
Asterids Only 0.33 (.05)a 0.54 (.06)b
(b) Annuals Herb. per. Woody per. All Species 0.64 (.04)a 0.43 (.03)b 0.25 (.04)c
Monocotyledons Only 0.74 (.10)a 0.43 (.07)b na Rosids Only 0.66 (.06)a 0.55 (.06)a 0.34 (.06)b
Asterids Only 0.61 (.06)a 0.41 (.07)a,b 0.27 (.08)b
small petal size, simultaneous maturation of pollen and receptivity of stigma, close
spatial proximity of anther and stigma) often differ among subspecies and populations
(Wyatt, 1984). For example, the two subspecies of Clarkia xantiana exhibit markedly
different breeding systems (Runions and Geber, 2000), and both C. exilis and C.
tembloriensis exhibit high variation in selfing rates among populations (Vasek and
Harding, 1976; Holtsford and Ellstrand, 1989). Both genetic and environmental
factors contribute to the evolution of mating systems in plants (Barrett and Eckert,
1990; Barrett, 2003), and rates of self-fertilization are known to change rapidly
(relative to rates of speciation) in response to a changing environment (Stebbins, 1950,
1957; Grant, 1981; Schemske and Lande, 1985; Barrett and Eckert, 1990; Barrett et
al., 1996; Barrett, 2003). Because plant mating systems are so evolutionarily labile, it
could be argued that controlling for phylogenetic relations among taxa may be unduly
conservative in this study. Indeed, a similar argument might be applied to changes in
ploidy, as chromosome number varies among populations of many species (Grant,
16
1981; Otto and Whitton, 2000; Soltis et al., 2004), and changes in chromosome
number are not necessarily related to speciation events. Because life history traits are
often phylogenetically-constrained (Mazer, 1990; Peat and Fitter, 1994; Moles et al.,
2005), however, it is possible that phylogenetic inertia of traits not included in this
study could contribute to differences in selfing rates and/or differences in ploidy. This
possibility justifies controlling for phylogenetic relationships among the taxa being
analyzed here.
As shown in table 1.2, the effect of the interaction between ploidy and life
history on levels of self-fertilization was non-significant in all four of the cross-species
analyses, indicating that the relationship between ploidy and self-fertilization does not
depend on life history. Annuals, herbaceous perennials, and woody perennials all tend
to exhibit increased selfing rates among polyploids relative to diploids. As can be
seen in figure 1.3, however, levels of self-fertilization range widely in all categories
regardless of ploidy or life history, suggesting, though perhaps not surprisingly, that
selective forces not considered in this study influence the evolution of self-
fertilization. In agreement with previous studies (Barrett and Eckert, 1990; Barrett et
al., 1996), selfing rates are negatively associated with life history, and this trend is
apparent in both polyploids and diploids. Annual species exhibit higher selfing rates
than perennials. Among perennials, herbaceous species self more than relatively long-
lived woody species. This result is consistent with theoretical expectations that short-
lived species should tend to self-fertilize more than long-lived species, owing to
selection for reproductive assurance in the former (Stebbins 1950) and the cost of seed
discounting (decreasing levels of outcrossed seed production due to increased levels of
self-fertilization) in the latter (Lloyd, 1992; Morgan et al., 1997). There are other
reasons why outcrossing rates might be higher in long-lived species as well. For
example, long-lived species (e.g., trees and shrubs) are often larger than short-lived
17
species (e.g., herbs), and since plant cells are not differentiated into distinct somatic
and germ cell lineages, mutations that occur during mitosis can contribute to the
genetic load carried by gametes. Because larger plants are expected to experience a
greater number of mitotic cell divisions between germination and the production of
gametes (relative to smaller plants), this may lead to profound inbreeding depression
and strong selection against selfing (Morgan, 2001; Scofield and Schultz, 2006).
Polyploids are known to experience diploidization, a process by which their
chromosomal behavior reverts back to that of a diploid, owing to a variety of
phenomena such as large-scale genomic rearrangements, gene silencing and/or loss,
and one or more copies of duplicated genes evolving novel functions (Wendel, 2000;
Wolfe, 2001; Soltis et al., 2004). Though some taxa that are treated as polyploids in
this study may behave cytogenetically as diploids, the methods used ensure that such
taxa have undergone a relatively recent polyploidization event because they were
compared to congeners that possess at least half as many chromosomes. The
assumption being made then is that the evolution of self-fertilization might be
associated with polyploidization regardless of the current cytogenetic behavior of a
given taxon.
Allopolyploids may not differ from diploids in terms of inbreeding depression
(Bever and Felber, 1992; Ronfort, 1999; Soltis and Soltis, 2000; Comai, 2005), and if
decreased inbreeding depression contributes to the evolution of higher selfing rates
among polyploids, it would be of interest to know whether this pattern occurs in both
allo- and autopolyploids, or is more prevalent in one group relative to the other.
Unfortunately, the category of ploidy is not known for the majority of polyploids
included in this study, and whether allo- and autopolyploids differ in terms of their
relationship with self-fertilization remains unknown. Autopolyploids were once
thought to be quite rare (Grant, 1981), however there is growing evidence that they are

18
much more common in nature than initially believed (Soltis et al., 2004). Since most
theoretical and empirical work has focused on autopolyploidy and it’s effects on the
evolution of self-fertlization (e.g., Husband and Schemske, 1997; Ronfort, 1999;
Rausch and Morgan, 2005), the results presented here suggest that either
autopolyploids are indeed more common (at least among those polyploids represented
in the dataset), or that the association between self-fertilization and polyploidy does
not differ between allo- and autopolyploids.
Conclusions
In agreement with other studies (e.g., Cook and Soltis, 2000; Quarin et al.,
2001; Tate and Simpson, 2004; Guggisberg et al., 2006), the data lend support to the
hypothesis that polyploid angiosperms have, on average, higher rates of self-
fertilization than their diploid relatives. Of continued interest are the evolutionary and
ecological phenomena that underlie this pattern, and they are likely both numerous and
varied. The ability to self-fertilize may increase the likelihood that newly-arisen
polyploids can establish successful populations, and it may be that selfing taxa give
rise to successful polyploid lineages more often than do outcrossing taxa. Decreased
levels of inbreeding depression in polyploids might also help to explain why
polyploids exhibit higher rates of self-fertilization than diploids. The relationship
between ploidy and inbreeding depression is complex, however, and has been shown
to depend on many factors, including the number and lethality of deleterious alleles,
the degree of dominance among alleles and epistasis among loci, and the age of the
polyploid in question (Ronfort, 1999; Pannell et al., 2004). More empirical studies
that compare mating systems and inbreeding depression in closely-related polyploids
and diploids are needed to further address these issues. In addition, auto- and
allopolyploids may differ in their response to inbreeding. Accordingly, models that

19
compare and explore further the evolution of inbreeding depression in polyploids and
diploids – especially those that differentiate between neopolyploids vs. older
polyploids and autopolyploids vs. allopolyploids – will be of value.
20
LITERATURE CITED Angiosperm Phylogeny Group (APG II). 2003. An update of the Angiosperm
Phylogeny Group classification for the orders and families of flowering plants: APG II. Botanical Journal of the Linnean Society 141: 399-436.
Barrett, S. C. H. 1987. The evolution, maintenance, and loss of self-incompatibility
systems. In J. Lovett-Doust and L. Lovett-Doust [eds.], Reproductive Strategies of Plants. Oxford University Press, Oxford, UK.
Barrett, S. C. H. 2003. Mating strategies in flowering plants: the outcrossing-selfing
paradigm and beyond. Philosophical Transactions of the Royal Society of London B Biological Sciences 358:991-1004.
Barrett, S. C. H., and C. G. Eckert. 1990. Variation and Evolution of Mating Systems
in Seed Plants. In S. Kawano (ed.) Biological Approaches and Evolutionary Trends in Plants. pp. 229-254. Academic Press, London, U.K.
Barrett, S. C. H., L. D. Harder, and A. C. Worley. 1996. The comparative biology of
pollination and mating in flowering plants. Philosophical Transactions of the Royal Society of London B Biological Sciences 351:1271-1280.
Bateman, A. J. 1952. Self-incompatibility systems in angiosperms. I. Theory. Heredity
6:285-310. Bennett, J. H. 1976. Expectations for inbreeding depression on self-fertilization of
tetraploids. Biometrics 32:449-452. Bever, J. D., and F. Felber. 1992. The theoretical population genetics of
autopolyploidy. Pp. 185-217 in J. Antonovics and D. Futuyma, eds. Oxford Surveys in Evolutionary Biology. Oxford Univ. Press, New York.
Brunet, J. 1992. Sex allocation in hermaphroditic plants. Tremds in Ecology and
Evolution 7:79-84. Busbice, T. H., and C. P. Wilsie. 1966. Inbreeding depression and heterosis in
autotetraploids with application to Medicago sativa L. Euphytica 15:52-67. Charlesworth, D., and B. Charlesworth. 1979. The evolutionary genetics of sexual
systems in flowering plants. Proceedings of the Royal Society of London B Biological Sciences 205:513-530.
Charlesworth, D. and B. Charlesworth. 1987. Inbreeding depression and its
evolutionary consequences. Annual Review of Ecology and Systematics 18:237-268.
Charnov, E. L., J. M. Smith, and J. J. Bull. 1976. Why be an hermaphrodite. Nature
263:125-126. Comai, L. 2005. The advantages and disadvantages of being polyploid. Nature
Reviews Genetics 6:836-846.
21
Cook, L. M., and P. S. Soltis. 1999. Mating systems of diploid and allotetraploid
populations of Tragopogon (Asteraceae). I. Natural populations. Heredity 82:237-244.
Cook, L. M., and P. S. Soltis. 2000. Mating systems of diploid and allotetraploid
populations of Tragopogon (Asteraceae). II. Artificial populations. Heredity 84:410-415.
Cronquist, A. 1981. An integrated system of classification of flowering plants.
Columbia University Press, New York, USA. Cronquist, A. 1988. The evolution and classification of flowering plants, 2nd ed. New
York Botanical Garden, Bronx, New York, USA. Darlington, C. D., and A. P. Wylie. 1955. Chromosome Atlas of Flowering Plants.
George Allen and Unwin Ltd, London. Darwin, C. D. 1859. The Origin of Species. Penguin Classics, London. Darwin, C. D. 1876. The Effects of Cross- and Self-Fertilization in the Vegetable
Kingdom. John Murray, London. Davies, T. J., T. G. Barraclough, M. W. Chase, P. S. Soltis, D. E. Soltis, and V.
Savolainen. 2004. Darwin's abominable mystery: Insights from a supertree of the angiosperms. Proceedings of the National Academy of Science 101:1904-1909.
Felsenstein, J. 1985. Phylogenies and the comparative method. American Naturalist
125:1-15. Fisher, R. A. 1941. Average excess and average effect of a gene substitution. Annals
of Eugenics 11:53-63. Grafen, A. 1989. The phylogenetic regression. Philosophical Transactions of the
Royal Society of London B Biological Sciences 326:119-157. Grant, V. 1956. The influence of breeding habit on the outcome of natural
hybridization in plants. American Naturalist 90:319-322. Grant, V. 1981. Plant Speciation. Columbia University Press, New York. Guggisberg, A., G. Mansion, S. Kelso, and E. Conti. 2006. Evolution of biogeographic
patterns, ploidy levels, and breeding systems in a diploid-polyploid species complex of Primula. New Phytologist 171:617-632.
Harder, L. D., and W. G. Wilson. 1998. A clarification of pollen discounting and its
joint effects with inbreeding depression on mating system evolution. American Naturalist 152:684-695.
Holsinger, K. E. 1988. Inbreeding depression doesn't matter: the genetic basis of
mating system evolution. Evolution 42:1235-1244.
22
Holtsford, T. P., and N. C. Ellstrand. 1989. Variation in outcrossing rate and
population genetic structure of Clarkia tembloriensis (Onagraceae). Theoretical and Applied Genetics 78:480-488.
Husband, B. C., and D. W. Schemske. 1996. Evolution of the magnitude and timing of
inbreeding depression in plants. Evolution 50:54-70. Husband, B. C., and D. W. Schemske. 1997. The effect of inbreeding in diploid and
tetraploid populations of Epilobium angustifolium (Onagraceae): implications for the genetic basis of inbreeding depression. Evolution 51:737-746.
Jackson, R. C. 1976. Evolution and systematic significance of polyploidy. Annual
Review of Ecology and Systematics 7:209-234. Johnston, M. O., and D. J. Schoen. 1996. Correlated evolution of self-fertilization and
inbreeding depression: An experimental study of nine populations of Amsinckia (Boraginaceae). Evolution 5:1478-1491.
Lande, R., and D. W. Schemske. 1985. The evolution of self-fertilization and
inbreeding depression in plants. I. genetic models. Evolution 39:24-40. Larson, B. M. H., and S. C. H. Barrett. 2000. A comparative analysis of pollen
limitation in flowering plants. Biological Journal of the Linnean Society 69:503-520.
Legatt, R. A. and G. K. Iwama. 2003. Occurrence of polyploidy in the fishes. Reviews
in Fish Biology and the Fisheries 13:237-246. Levin, D. A. 1975. Minority cytotype exclusion in local plant populations. Taxon
24:35-43. Lloyd, D. G. 1992. Self- and cross-fertilization in plants. I. The selection of self-
fertilization. International Journal of Plant Sciences 153:370-380. Mable, B. K. 2004a. Why polyploidy is rarer in animals than in plants: myths and
mechanisms. Biological Journal of the Linnean Society 82:453-466. Mable, B. K. 2004b. Polyploidy and self-compatibility: Is there an association? New
Phytologist 162:803-811. Mazer, S. J. 1990. Seed mass of Indiana Dune genera and families: taxonomic and
ecological correlates. Evolutionary Ecology 4:326-357. Maddison, W. P., and D. R. Maddison. 1992. MacClade: analysis of phylogeny and
character evolution, version 3.0. Sinauer, Sunderland, Massachusetts. Masuyama, S., and Y. Watano. 1990. Trends for inbreeding in polyploid
pteridophytes. Plant Species Biology 5:13-17. Maynard-Smith, J. 1978. The Evolution of Sex. Cambridge University Press,
Cambridge.

23
Miller, J. S., and D. L. Venable. 2000. Polyploidy and the evolution of gender
dimorphism in plants. Science 289:2335-2338. Moles, A. T., D. D. Ackerly, C. O. Webb, J. C. Tweddle, J. B. Dickie, and M.
Westoby. 2005. A brief history of seed size. Science 307:576-580. Morgan, M. T. 2001. Consequences of life history for inbreeding depression and
mating system evolution in plants. Proceedings of the Royal Society of London B 268:1817-1824.
Morgan, M. T., D. J. Schoen, and T. M. Bataillon. 1997. The evolution of self-
fertilization in perennials. The American Naturalist 150:618-638. Morgan, M. T., and W. G. Wilson. 2005. Self-fertilization and the escape from pollen
limitation in variable pollination environments. Evolution 59:1143-1148. Otto, S. P., and J. Whitton. 2000. Polyploid incidence and evolution. Annual Review
of Genetics 34:401-437. Pannell, J. R. and S. C. H. Barrett. 1998. Baker's law revisited: reproductive assurance
in a metapopulation. Evolution 52:657-668. Pannell, J. R., D. J. Obbard, and R. J. A. Buggs. 2004. Polyploidy and the sexual
system: what can we learn from Mercurialis annua? Biological Journal of the Linnean Society 82:547-560.
Peat, H. J. and A. H. Fritter. 1994. Comparative analysis of ecological characteristics
of British angiosperms. Biological Reviews 69:95-115. Price, T. 1997. Correlated evolution and independent contrasts. Philosophical
Transactions of the Royal Society of London B Biological Sciences 352:519-529.
Purvis, A., and A. Rambaut. 1995. Comparative analysis by independent contrasts
(caic): an Apple Macintosh application for analyzing comparative data. Computer Applications in the Biological Sciences 11:247-251.
Quarin, C. L., F. Espinoza, E. J. Martinez, S. C. Pessino, and O. A. Bovo. 2001. A rise
of ploidy level induces the expression of apomixis in Paspalum notatum. Sexual Plant Reproduction 13:243-249.
Ramsey, J., and D. W. Schemske. 1998. Pathways, mechanisms, and rates of polyploid
formation in flowering plants. Annual Review of Ecology and Systematics 29:467-501.
Ramsey, J., and D. W. Schemske. 2002. Neopolyploidy in flowering plants. Annual
Review of Ecology and Systematics 33:589-639. Rausch, J. H. and M. T. Morgan. 2005. The effect of self-fertilization, inbreeding
depression, and population size on autotetraploid establishment. Evolution 59:1867-1875.
24
Rheindt, F. E., T. U. Grafe, and E. Abouheif. 2004. Rapidly evolving traits and the
comparative method: how important is testing for phylogenetic signal? Evolutionary Ecology Research 6:377-396.
Ricklefs, R. E., and J. M. Starck. 1996. Applications of phylogenetically independent
contrasts: a mixed progress report. Oikos 77:167-172. Ritland, K. and S. Jain. 1981. A model for the estimation of outcrossing rate and gene-
frequencies using n independent loci. Heredity 47:35-52. Ronfort, J. 1999. The mutation load under tetrasomic inheritance and its consequences
for the evolution of the selfing rate in autotetraploid species. Genetical Research 74:31-42.
Rosquist, G. 2001. Reproductive biology in diploid Anthericum ramosum and
tetraploid A. liliago (Anthericaceae). Oikos 92:143-152. Ross, R. 1981. Chromosome counts, cytology, and reproduction in the Cactaceae.
American Journal of Botany 68:463-470. Runions, C. J., and M. A. Geber. 2000. Evolution of the self-pollinating flower in
Clarkia xantiana (Onagraceae). I. Size and development of floral organs. American Journal of Botany 87:1439-1451.
Scofield, D. G. and S. T. Schultz. 2006. Mitosis, stature and evolution of mating
systems: low-φ and high-φ plants. Proceedings of the Royal Society B: Biological Sciences 273:275-282.
Soltis, D. E., and P. S. Soltis. 1987. Polyploidy and breeding systems in homosporous
pteridophyta: A reevaluation. American Naturalist 130:219-232. Soltis, D. E., P. S. Soltis, and J. A. Tate. 2004. Advances in the study of polyploidy
since Plant Speciation. New Phytologist 161:173-191. Soltis, P. S., and D. E. Soltis. 1990. Evolution of inbreeding and outcrossing in ferns
and fern-allies. Plant Species Biology 5:1-11. Soltis, P. S., and D. E. Soltis. 2000. The role of genetic and genomic attributes in the
success of polyploids. Proceedings of the National Academy of Sciences of the United States of America 97:7051-7057.
Stebbins, G. L. 1950. Variation and Evolution in Plants. Columbia University Press,
New York. Stebbins, G. L. 1957. Self-fertilization and population variability in higher plants.
American Naturalist 41:337-354. Tate, J. A., and B. B. Simpson. 2004. Breeding system evolution in Tarasa
(Malvaceae) and selection for reduced pollen grain size in the polyploid species. American Journal of Botany 91:207-213.
25
Thomson, J. D. 2006. Tactics for male reproductive success in plants: contrasting insights of sex allocation theory and pollen presentation theory. Integrative and Comparative Biology 46:390-397.
Vasek, F. C., and J. Harding. 1976. Outcrossing in natural-populations. V. Analysis of
outcrossing, inbreeding, and selection in Clarkia exilis and Clarkia tembloriensis. Evolution 30:403-411.
Wendel, J. F. 2000. Genome evolution in polyploids. Plant Molecular Biology 42:225-
249. Westoby, M., M. R. Leishman, and J. M. Lord. 1995. On misinterpreting the
"phylogenetic correction". Journal of Ecology 83:531-534. Wolfe, K. H. 2001. Yesterday’s polyploids and the mystery of diploidization. Nature
Reviews Genetics 2:333-341. Wyatt, R. 1984. The evolution of self-pollination in granite outcrop species of
Arenaria (Caryophyllaceae). I. Morphological correlates. Evolution 38:804-816.
26
CHAPTER 2
INBREEDING DEPRESSION AND THE RESPONSE TO SELECTION IN
POLYPLOID AND DIPLOID PLANTS
Abstract
Population-level responses to natural selection depend on the strength of
selection, population size, and breeding system. In addition, for a given level of
polymorphism, the response to selective pressure depends on the effect of alternate
alleles on fitness, which is determined in part by the level of dominance of deleterious
mutations. Further, genome duplication (i.e., polyploidy) can affect the response to
selection because polyploids have more than two copies of each gene. For this reason,
polyploids may not respond to evolutionary pressures in the same manner as diploids.
We simulated the effects of selection on deleterious alleles segregating at a single
locus in diploid and autotetraploid, and two non-recombining loci in allotetraploid
populations of hermaphroditic plants with non-overlapping generations (e.g., annuals).
Model parameters included ploidy, population size, selfing rate, dominance, and
strength of selection. Our model differs from previous models in that small
populations of neopolyploids (rather than infinite populations of established
polyploids in mutation-selection balance) are considered. Further, our model is the
first to explore these issues in allopolyploids.
Our results suggest fundamental differences among all parameters in their
effects on responses to selection, including the likelihood of, and time to, fixation of
beneficial alleles. In particular, the diploid was more likely to fix the beneficial allele
and did so faster than polyploids, indicating that adaptive evolution is more efficient in
the former than the latter. Adaptive evolution was least effective in the allopolyploid
27
because it often fixes the beneficial allele at one locus and the deleterious allele at the
other locus (permanent heterozygosity) – an option not available to the other
cytotypes. As expected, the probability of fixing the beneficial allele increased in
larger populations and under stronger selection and dominance. Likewise the time to
fixation was reduced with stronger selection and dominance but increased with
population size.
Many two-way interactions among ploidy, population size, selfing, dominance
and selection had significant effects on one or more of the outcome variables. For
example, the effects of population size and dominance in increasing the probability of
fixing the beneficial allele were most pronounced in the autopolyploid, as were the
effect of dominance and selection in reducing the time to fixation. These responses
may derive from the fact that the genetic effective population size at the locus
common to all cytotypes is largest in the autopolyploid.
In sum, the results of our simulations indicate complex, though generally
intuitive, effects of model parameters on adaptive evolution, and that responses to
natural selection differ with ploidy.
Introduction
Inbreeding depression is the reduction in fitness associated with inbreeding and
is thought to be one of the most important phenomena influencing and shaping the
evolution of mating systems, especially among flowering plants (Charlesworth and
Charlesworth, 1979, 1987; Lande and Schemske, 1985; Husband and Schemske, 1996,
1997; Barrett 2002). The genetic basis of inbreeding depression is complex. Studies
suggest, however, that most inbreeding depression is caused by the expression of
recessive or partially recessive deleterious alleles (the partial dominance model of
inbreeding depression) (Charlesworth and Charlesworth 1999; Carr and Dudash
28
2003). Other phenomena that have been shown to influence levels of inbreeding
depression include a reduction in levels of heterozygosity (i.e., the overdominance
model of inbreeding depression), reduced numbers of interactions among loci (i.e.,
epistasis), and the number and relative proportions of deleterious alleles with small vs.
large effects on fitness (Charlesworth and Charlesworth 1987, Charlesworth and
Charlesworth 1999; Carr and Dudash 2003). These phenomena are not mutually
exclusive and may act in concert to affect the fitness of inbred individuals and
populations.
Closely related to inbreeding depression is a population’s ability to purge
deleterious alleles that are exposed to selection as genome-wide levels of
homozygosity increase with inbreeding, with the result that inbreeding depression is
highest immediately following an increase in selfing and very low many generations
later (Charlesworth and Charlesworth 1990; Crnokrak and Barrett 2002; but see
Charlesworth et al. 1990; Byers and Waller 1999). Indeed, predominantly selfing taxa
often show relatively little inbreeding depression (Husband and Schemske 1996). The
ability to purge maladapted alleles may be crucial in population persistence, especially
when populations are small or selection is strong (Gilpin and Soule 1986).
Polyploid angiosperms often exhibit higher rates of self-fertilization than their
diploid relatives, an interesting pattern noted by early plant biologists and more
recently explored in detail (Stebbins 1950, 1957, 1980; Grant 1956, 1981; Otto and
Whitton 2000; Mable 2004; Barringer 2007). Several ecological and evolutionary
forces are likely to contribute to the evolution and maintenance of this pattern,
including selection for reproductive assurance (Stebbins 1950; Grant 1956, 1981;
Levin 1975; Fowler and Levin 1984; Felber 1991; Rodriguez 1996; Ramsey and
Schemske 1998), a breakdown of self-incompatibility systems (Bateman 1952; Miller
and Venable 2000; Mable 2004), and reduced inbreeding depression (Lande and

29
Schemske 1985; Hedrick 1987; Ronfort 1999 but see Busbice and Wilsie 1966;
Bennett 1976).
The relationship between polyploidy and inbreeding depression has received
relatively little attention. The dearth of studies is surprising given that 30-80% of all
flowering plants are of polyploid origin (Stebbins 1938; Grant 1963; Goldblatt 1980;
Masterson 1994; Otto and Whitton 2000), changes in ploidy are responsible for 2-4%
of all speciation events among angiosperms (Otto and Whitton 2000), and the
successful establishment of polyploid populations can be negatively influenced by
inbreeding depression (Baack 2005; Rausch and Morgan 2005). Early theoretical
work suggested that autopolyploids might exhibit more inbreeding depression than
diploids (Busbice and Wilsie 1966; Bennett 1976); however, this conclusion was
based on the overdominance model, and very limited support for this hypothesis exists
(Charlesworth and Charlesworth 1999; Dudash and Carr 1998; Carr and Dudash
2003). In contrast, more recent theoretical explorations based on the partial
dominance model have suggested that autopolyploids should exhibit less inbreeding
depression than diploids (Lande and Schemske 1985). The reverse can be true,
however, depending on levels of dominance and the strength of selection (Ronfort
1999).
In empirical studies of agricultural species, inbreeding depression has been
found to be higher (Kalton et al. 1952; Busbice and Wilsie 1966; Dewey 1966;
Bingham and Groose 1994; Johnston and Schoen 1996; Auger et al. 2005) or lower
(Alexander 1960; Davies 1961; Townsend and Remmenga 1968; Dewey 1969) in
polyploids than diploids. Interpretation of these conflicting results is difficult given the
history of artificial breeding and manipulation in crops. At the same time, no
consistent outcome has emerged from the few studies of wild species; inbreeding
depression was lower in polyploids than diploids in three studies (Husband and
30
Schemske 1997; Rosquist 2001; Barringer 2008) but higher in a fourth study
(Johnston and Schoen 1996). While polyploids may benefit from reduced inbreeding
depression via the masking of deleterious alleles, the masking may also slow the
purging of deleterious alleles and contribute to higher genetic loads over the long term
as populations reach mutation-selection balance (Otto and Whitton 2000).
Clearly, the relationships among ploidy, inbreeding depression, and the
response to selection are complex, and although recent studies have shed light on this
issue (e.g., Lande and Schemske 1985; Ronfort 1999; Otto and Whitton 2000; Rausch
and Morgan 2005), all existing theoretical studies have addressed levels of inbreeding
depression in populations that are large and at (or near) mutation-selection
equilibrium. However, inbreeding depression in neopolyploids is also of interest
because high levels of self-fertilization might facilitate the initial establishment of
polyploid populations (Rausch and Morgan 2005), and levels of inbreeding depression
suffered by neopolyploids will influence the evolution of mating systems immediately
following genome duplication. Further, neopolyploids are likely to exist in small
populations where stochastic forces (i.e., genetic drift) may play a relatively large role
in shaping their genetic architecture. Yet, population size has rarely been considered
in studies of inbreeding depression in polyploids (but see Otto and Whitton 2000;
Rausch and Morgan 2005). Finally, the relationship between inbreeding depression
and the response to selection in allopolyploids has not been examined (Pannell et al.
2004; but see Lande and Schemske 1985), even though allopolyploid taxa are
common in nature (Grant 1981; Soltis et al. 2004). The successful establishment of
allopolyploid taxa might be influenced by their ability to combine the ecological traits
of two parental species in a state of permanent genomic heterozygosity (Stebbins
1984). For this reason, a better understanding of the relationships among
allopolyploidy, the response to selection, and the formation of permanent genomic

31
heterozygotes would be of value.
To further explore the relationships between cytotype (diploid, auto- and
allopolyploid) and inbreeding depression we simulated the effects of selection on
deleterious alleles segregating at a single locus in diploid and autotetraploid, and at
two non-recombining loci in allotetraploid populations of hermaphroditic plants with
non-overlapping generations (e.g., annuals). Model parameters included cytotype,
population size, selfing rate, dominance, and strength of selection (Table 2.1). For
Table 2.1. Model parameters and values used in simulations. ______Parameter Values
Ploidy diploid / autotetraploid / allotetraploid
Population size for diploids: 8 / 48 / 100
for polyploids: 10 / 50 / 100
Selfing rate 0.00 / 0.25 / 0.50 / 0.75 / 1.00
Dominance for diploids: 0.02 / 0.10 / 0.50
for polyploids: h1 = 0.01, h2 = 0.02, h3 = 0.03 h1 = 0.05, h2 = 0.10, h3 = 0.15 h1 = 0.25, h2 = 0.50, h3 = 0.75
Selection coefficient 0.02 / 0.10 / 0.50 / 1.00
each set of parameter values we compared the probability of, and time to, fixation of
the beneficial allele among populations of diploids, autotetraploids and allotetraploids.
For allotetraploids only, we also examined the effects of parameter values on the
probability and number of generations required for the beneficial allele to fix in one
genome and the deleterious allele in the other (i.e., permanent genomic
heterozygosity).
32
Methods
General model
The Matlab software package (The Mathworks Inc., Version 6.5 release 13,
2002) was used to simulate the effects of selection on deleterious alleles segregating at
a single locus in diploid and autotetraploid, and at two non-recombining loci in
allotetraploid populations of hermaphroditic plants with non-overlapping generations
(e.g., annuals). Source code is available from the authors on request. Model
parameters included ploidy (3 levels), selfing rate (5 levels), population size (3 levels),
dominance (3 levels), and strength of selection against deleterious alleles (4 levels)
(Table 1). Dominance was defined as the relative effect of deleterious alleles in
heterozygotes, such that completely recessive deleterious alleles would have a
dominance of 0. Fifty replicate simulations were performed for each unique
combination of parameter values. Simulations began with populations in Hardy-
Weinberg equilibrium (Haldane 1927; 1930). During each generation a number of
mating events (hereafter, “events”) equal to 10 times the initial population size were
conducted (i.e., each individual contributed genetic material to 10 zygotes, on
average). The probability that a given event was a selfing event was equal to the
selfing rate. Conversely, the probability that an event was an outcrossing event was
equal to 1 – (selfing rate). For each event, one randomly chosen gamete was taken
from each of two randomly chosen parents (if a selfing event, the same parent was
sampled twice, with replacement) to form a zygote. For simplicity we assumed that
the locus of interest was near the centromere and that no double reduction occurred
(Haldane 1930; Mather 1936; Parsons 1959; Crow and Kimura 1970; Bever and
Felber 1992) (see discussion). Ten percent of all zygotes were then randomly sampled
to create the next generation. This process resulted in the population size at the
beginning of each generation (i.e., before selection) being fixed and equal to the initial
33
population size, and also allowed for the incorporation of stochasticity (i.e., genetic
drift) into our simulations. Offspring were subjected to selection before reproducing,
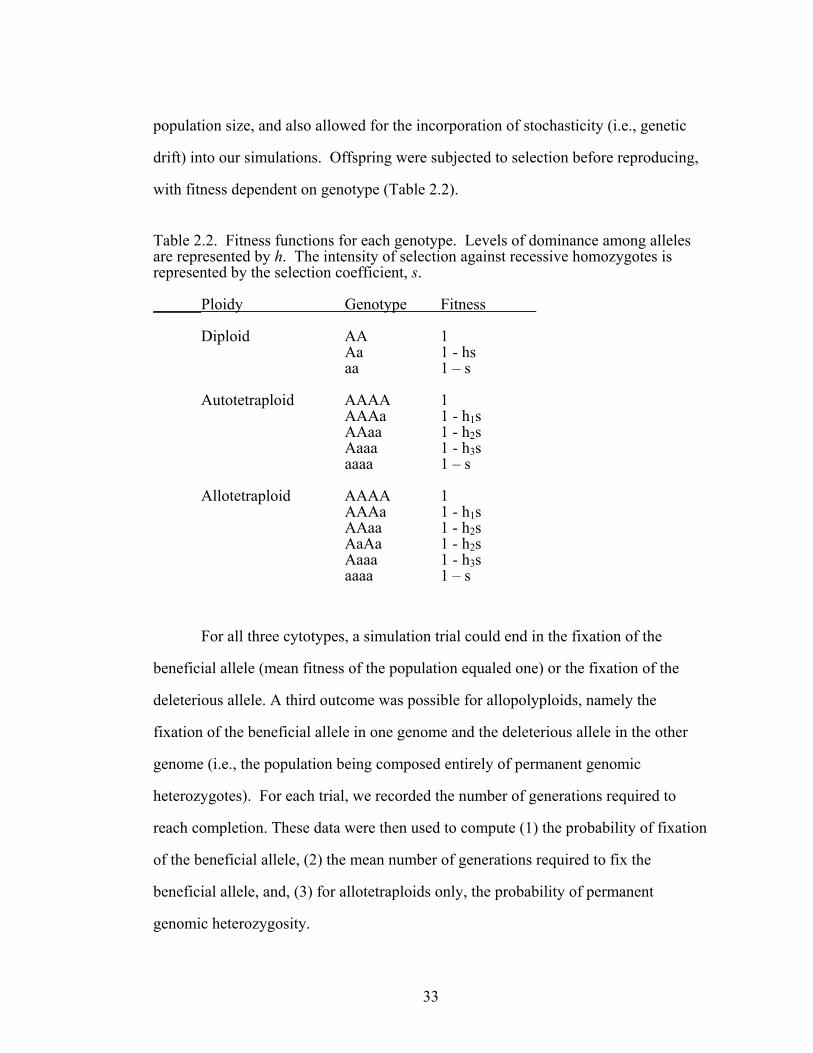
with fitness dependent on genotype (Table 2.2). Table 2.2. Fitness functions for each genotype. Levels of dominance among alleles are represented by h. The intensity of selection against recessive homozygotes is represented by the selection coefficient, s. ______Ploidy Genotype Fitness
Diploid AA 1 Aa 1 - hs aa 1 – s
Autotetraploid AAAA 1 AAAa 1 - h1s AAaa 1 - h2s Aaaa 1 - h3s aaaa 1 – s
Allotetraploid AAAA 1 AAAa 1 - h1s AAaa 1 - h2s AaAa 1 - h2s Aaaa 1 - h3s aaaa 1 – s
For all three cytotypes, a simulation trial could end in the fixation of the
beneficial allele (mean fitness of the population equaled one) or the fixation of the
deleterious allele. A third outcome was possible for allopolyploids, namely the
fixation of the beneficial allele in one genome and the deleterious allele in the other
genome (i.e., the population being composed entirely of permanent genomic
heterozygotes). For each trial, we recorded the number of generations required to
reach completion. These data were then used to compute (1) the probability of fixation
of the beneficial allele, (2) the mean number of generations required to fix the
beneficial allele, and, (3) for allotetraploids only, the probability of permanent
genomic heterozygosity.
34
Statistical analysis
Analysis of variance (Proc mixed, SAS 2003) was used to test the effects of
cytotype, selfing rate, population size, dominance, selection, and all two-way
interactions on the (1) probability of, and (2) time to, fixation of the beneficial allele,
and, (3) for allotetraploids, the probability of permanent genomic heterozygosity.
Results
The probability of fixation of the beneficial allele – With the exception of selfing rate,
all model parameters had significant effects on the fixation of the beneficial allele
(Tables 2.3 – 2.4). Diploids fixed beneficial alleles more often than polyploids, and
the autopolyploid, in turn, was more likely to fix beneficial alleles than the
allopolyploid (Figure 2.1). The probability of fixation of the beneficial allele was low
in allopolyploids because a substantial proportion of trials ended in permanent
genomic heterozygosity (Figure 2.1, see below). Population size, dominance, and
selection were all positively correlated with the likelihood that the beneficial allele
was fixed.
The interactions between ploidy and all other parameters significantly
influenced the probability of fixing the beneficial allele (Tables 2.3 – 2.4 and Figure
2.1). For example, while the selfing rate did not affect the probability of fixation in
diploid and autotetraploid populations, the beneficial allele was less likely to be fixed
as selfing increased in the allopolyploid.
Population size was positively correlated with the fixation of the beneficial
allele in all cytotypes, but the effect was strongest in the allotetraploid. The level of
dominance was positively correlated with the probability of fixing the beneficial allele
in the allotetraploid but had no significant effect in the diploid and autotetraploid.
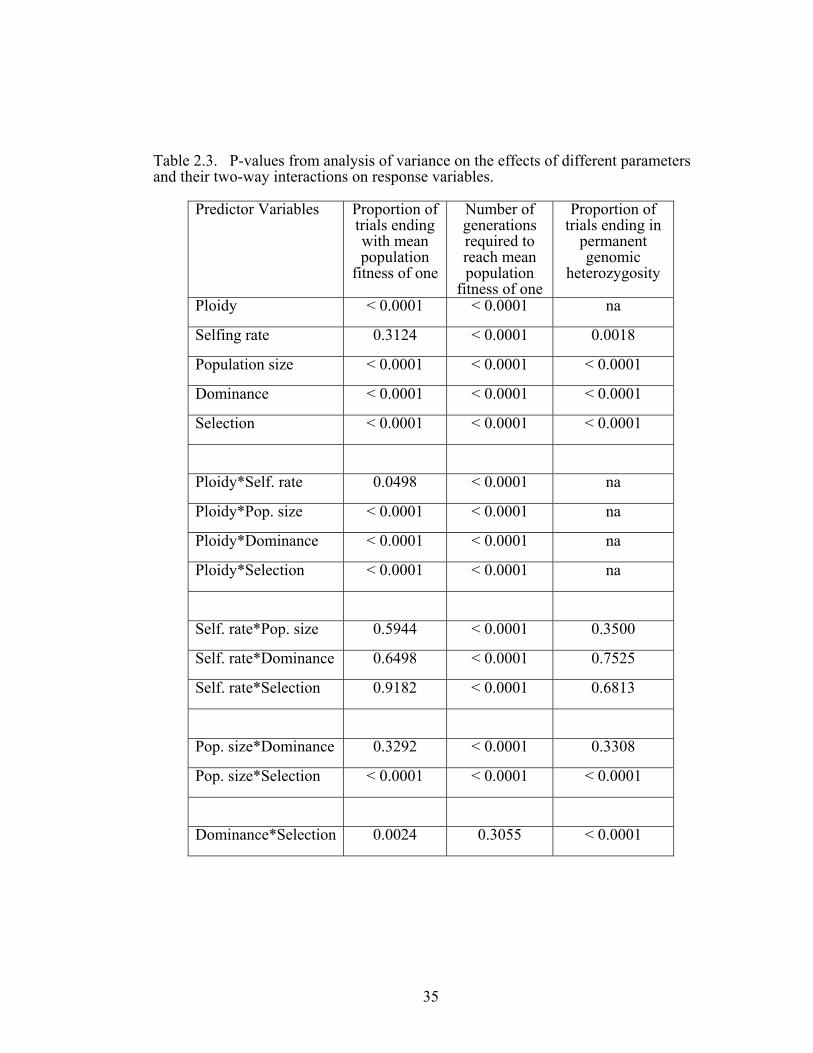
35
Table 2.3. P-values from analysis of variance on the effects of different parameters and their two-way interactions on response variables.
Predictor Variables Proportion of trials ending with mean population
fitness of one
Number of generations required to reach mean population
fitness of one
Proportion of trials ending in
permanent genomic
heterozygosity
Ploidy < 0.0001 < 0.0001 na
Selfing rate 0.3124 < 0.0001 0.0018
Population size < 0.0001 < 0.0001 < 0.0001
Dominance < 0.0001 < 0.0001 < 0.0001
Selection < 0.0001 < 0.0001 < 0.0001
Ploidy*Self. rate 0.0498 < 0.0001 na
Ploidy*Pop. size < 0.0001 < 0.0001 na
Ploidy*Dominance < 0.0001 < 0.0001 na
Ploidy*Selection < 0.0001 < 0.0001 na
Self. rate*Pop. size 0.5944 < 0.0001 0.3500
Self. rate*Dominance 0.6498 < 0.0001 0.7525
Self. rate*Selection 0.9182 < 0.0001 0.6813
Pop. size*Dominance 0.3292 < 0.0001 0.3308
Pop. size*Selection < 0.0001 < 0.0001 < 0.0001
Dominance*Selection 0.0024 0.3055 < 0.0001
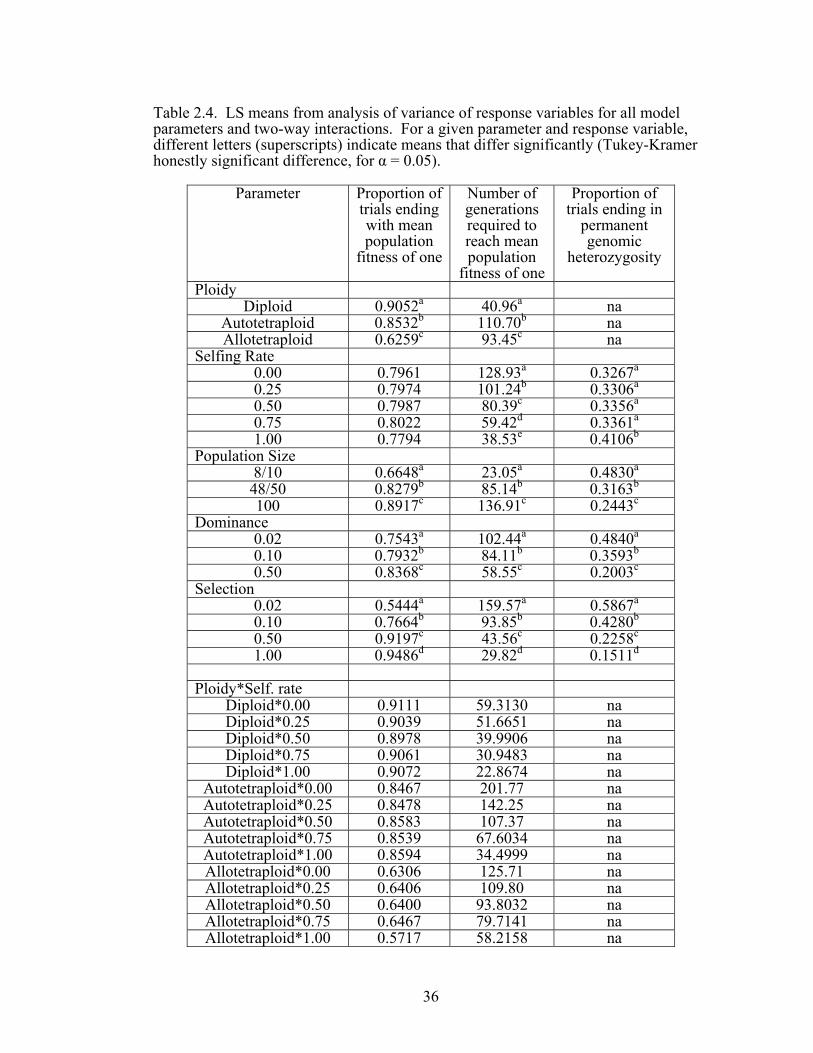
36
Table 2.4. LS means from analysis of variance of response variables for all model parameters and two-way interactions. For a given parameter and response variable, different letters (superscripts) indicate means that differ significantly (Tukey-Kramer honestly significant difference, for α = 0.05).
Parameter Proportion of trials ending with mean population
fitness of one
Number of generations required to reach mean population
fitness of one
Proportion of trials ending in
permanent genomic
heterozygosity
Ploidy Diploid 0.9052a 40.96a na
Autotetraploid 0.8532b 110.70b na Allotetraploid 0.6259c 93.45c na
Selfing Rate 0.00 0.7961 128.93a 0.3267a
0.25 0.7974 101.24b 0.3306a 0.50 0.7987 80.39c 0.3356a 0.75 0.8022 59.42d 0.3361a 1.00 0.7794 38.53e 0.4106b
Population Size 8/10 0.6648a 23.05a 0.4830a 48/50 0.8279b 85.14b 0.3163b 100 0.8917c 136.91c 0.2443c
Dominance 0.02 0.7543a 102.44a 0.4840a 0.10 0.7932b 84.11b 0.3593b 0.50 0.8368c 58.55c 0.2003c
Selection 0.02 0.5444a 159.57a 0.5867a 0.10 0.7664b 93.85b 0.4280b 0.50 0.9197c 43.56c 0.2258c 1.00 0.9486d 29.82d 0.1511d
Ploidy*Self. rate
Diploid*0.00 0.9111 59.3130 na Diploid*0.25 0.9039 51.6651 na Diploid*0.50 0.8978 39.9906 na Diploid*0.75 0.9061 30.9483 na Diploid*1.00 0.9072 22.8674 na
Autotetraploid*0.00 0.8467 201.77 na Autotetraploid*0.25 0.8478 142.25 na Autotetraploid*0.50 0.8583 107.37 na Autotetraploid*0.75 0.8539 67.6034 na Autotetraploid*1.00 0.8594 34.4999 na Allotetraploid*0.00 0.6306 125.71 na Allotetraploid*0.25 0.6406 109.80 na Allotetraploid*0.50 0.6400 93.8032 na Allotetraploid*0.75 0.6467 79.7141 na Allotetraploid*1.00 0.5717 58.2158 na
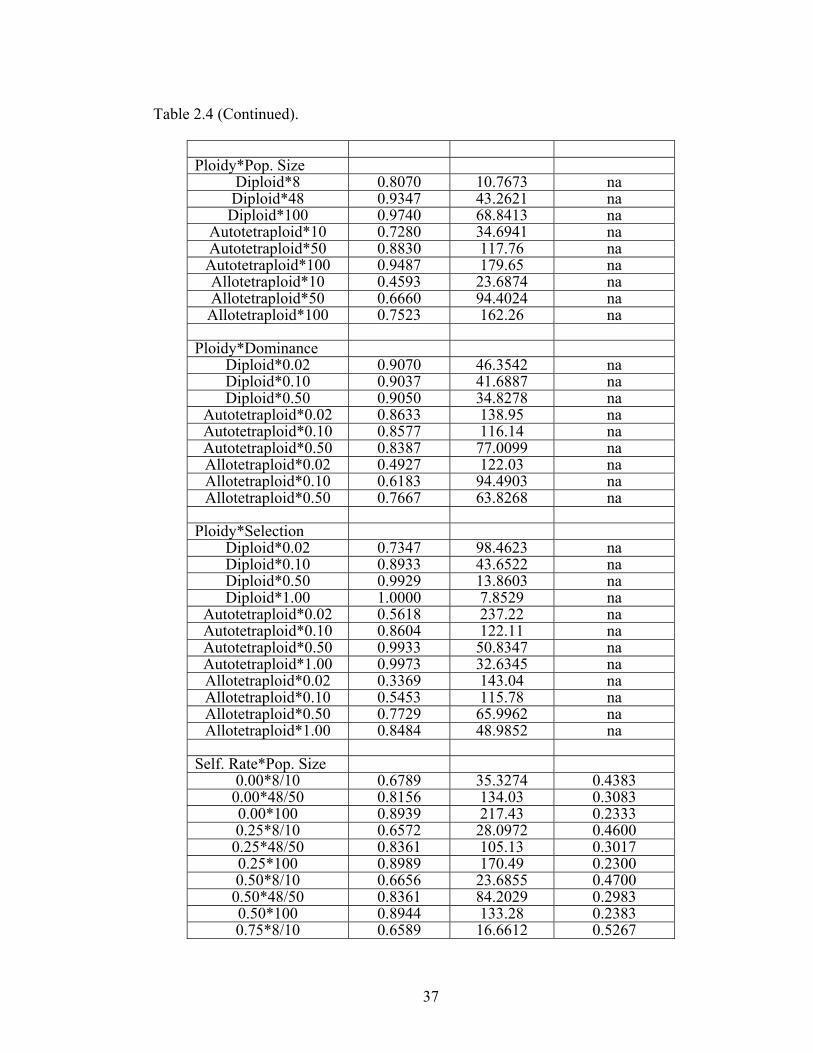
37
Table 2.4 (Continued).
Ploidy*Pop. Size
Diploid*8 0.8070 10.7673 na Diploid*48 0.9347 43.2621 na Diploid*100 0.9740 68.8413 na
Autotetraploid*10 0.7280 34.6941 na Autotetraploid*50 0.8830 117.76 na Autotetraploid*100 0.9487 179.65 na Allotetraploid*10 0.4593 23.6874 na Allotetraploid*50 0.6660 94.4024 na Allotetraploid*100 0.7523 162.26 na
Ploidy*Dominance
Diploid*0.02 0.9070 46.3542 na Diploid*0.10 0.9037 41.6887 na Diploid*0.50 0.9050 34.8278 na
Autotetraploid*0.02 0.8633 138.95 na Autotetraploid*0.10 0.8577 116.14 na Autotetraploid*0.50 0.8387 77.0099 na Allotetraploid*0.02 0.4927 122.03 na Allotetraploid*0.10 0.6183 94.4903 na Allotetraploid*0.50 0.7667 63.8268 na
Ploidy*Selection
Diploid*0.02 0.7347 98.4623 na Diploid*0.10 0.8933 43.6522 na Diploid*0.50 0.9929 13.8603 na Diploid*1.00 1.0000 7.8529 na
Autotetraploid*0.02 0.5618 237.22 na Autotetraploid*0.10 0.8604 122.11 na Autotetraploid*0.50 0.9933 50.8347 na Autotetraploid*1.00 0.9973 32.6345 na Allotetraploid*0.02 0.3369 143.04 na Allotetraploid*0.10 0.5453 115.78 na Allotetraploid*0.50 0.7729 65.9962 na Allotetraploid*1.00 0.8484 48.9852 na
Self. Rate*Pop. Size
0.00*8/10 0.6789 35.3274 0.4383 0.00*48/50 0.8156 134.03 0.3083 0.00*100 0.8939 217.43 0.2333 0.25*8/10 0.6572 28.0972 0.4600 0.25*48/50 0.8361 105.13 0.3017 0.25*100 0.8989 170.49 0.2300 0.50*8/10 0.6656 23.6855 0.4700 0.50*48/50 0.8361 84.2029 0.2983 0.50*100 0.8944 133.28 0.2383 0.75*8/10 0.6589 16.6612 0.5267

38
Table 2.4 (Continued).
0.75*48/50 0.8506 61.6400 0.2650 0.75*100 0.8972 99.9646 0.2167 1.00*8/10 0.6633 11.4766 0.5200 1.00*48/50 0.8011 40.6948 0.4083 1.00*100 0.8739 63.4118 0.3033
Self. Rate*Dominance
0.00*0.02 0.7611 170.73 0.4733 0.00*0.10 0.7994 130.12 0.3333 0.00*0.50 0.8278 85.9519 0.1733 0.25*0.02 0.7489 126.98 0.4617 0.25*0.10 0.8094 106.64 0.3350 0.25*0.50 0.8339 70.1010 0.1950 0.50*0.02 0.7589 95.6670 0.4617 0.50*0.10 0.7928 84.1325 0.3533 0.50*0.50 0.8444 61.3645 0.1917 0.75*0.02 0.7744 72.6733 0.4417 0.75*0.10 0.7933 60.7711 0.3583 0.75*0.50 0.8389 44.8213 0.2083 1.00*0.02 0.7283 46.1678 0.5817 1.00*0.10 0.7711 38.8801 0.4167 1.00*0.50 0.8389 30.5354 0.2333
Self. Rate*Selection
0.00*0.02 0.5430 246.14 0.5156 0.00*0.10 0.7585 149.75 0.4533 0.00*0.50 0.9304 73.6409 0.2022 0.00*1.00 0.9526 46.1956 0.1356 0.25*0.02 0.5319 198.03 0.6067 0.25*0.10 0.7719 119.25 0.4000 0.25*0.50 0.9230 53.0622 0.2089 0.25*1.00 0.9630 34.6120 0.1067 0.50*0.02 0.5496 161.58 0.5933 0.50*0.10 0.7600 92.1568 0.4156 0.50*0.50 0.9267 39.6265 0.2111 0.50*1.00 0.9585 28.1920 0.1222 0.75*0.02 0.5578 118.72 0.5689 0.75*0.10 0.7741 66.5650 0.4178 0.75*0.50 0.9281 30.4047 0.2044 0.75*1.00 0.9489 21.9931 0.1533 1.00*0.02 0.5400 73.3827 0.6489 1.00*0.10 0.7674 41.5157 0.4533 1.00*0.50 0.8904 21.0843 0.3022 1.00*1.00 0.9200 18.1283 0.2378
Pop. Size*Dominance
8/10*0.02 0.6360 27.5080 0.6100 8/10*0.10 0.6503 23.4828 0.5220
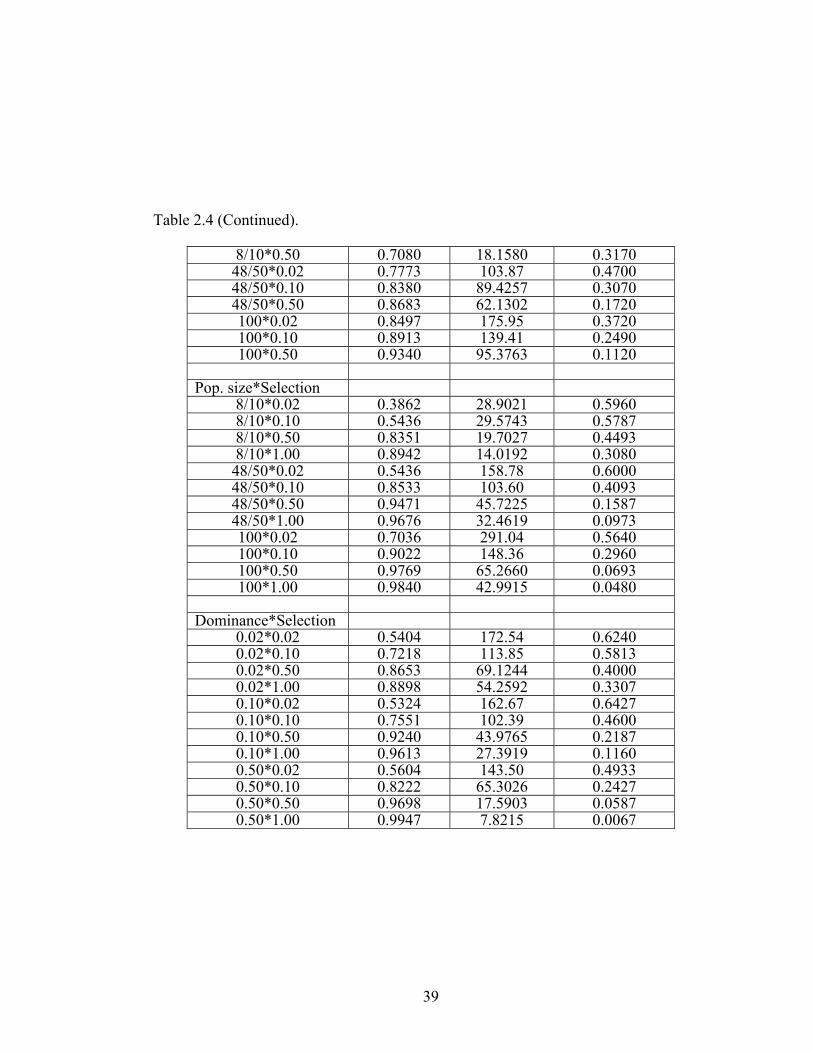
39
Table 2.4 (Continued).
8/10*0.50 0.7080 18.1580 0.3170 48/50*0.02 0.7773 103.87 0.4700 48/50*0.10 0.8380 89.4257 0.3070 48/50*0.50 0.8683 62.1302 0.1720 100*0.02 0.8497 175.95 0.3720 100*0.10 0.8913 139.41 0.2490 100*0.50 0.9340 95.3763 0.1120
Pop. size*Selection
8/10*0.02 0.3862 28.9021 0.5960 8/10*0.10 0.5436 29.5743 0.5787 8/10*0.50 0.8351 19.7027 0.4493 8/10*1.00 0.8942 14.0192 0.3080 48/50*0.02 0.5436 158.78 0.6000 48/50*0.10 0.8533 103.60 0.4093 48/50*0.50 0.9471 45.7225 0.1587 48/50*1.00 0.9676 32.4619 0.0973 100*0.02 0.7036 291.04 0.5640 100*0.10 0.9022 148.36 0.2960 100*0.50 0.9769 65.2660 0.0693 100*1.00 0.9840 42.9915 0.0480
Dominance*Selection
0.02*0.02 0.5404 172.54 0.6240 0.02*0.10 0.7218 113.85 0.5813 0.02*0.50 0.8653 69.1244 0.4000 0.02*1.00 0.8898 54.2592 0.3307 0.10*0.02 0.5324 162.67 0.6427 0.10*0.10 0.7551 102.39 0.4600 0.10*0.50 0.9240 43.9765 0.2187 0.10*1.00 0.9613 27.3919 0.1160 0.50*0.02 0.5604 143.50 0.4933 0.50*0.10 0.8222 65.3026 0.2427 0.50*0.50 0.9698 17.5903 0.0587 0.50*1.00 0.9947 7.8215 0.0067
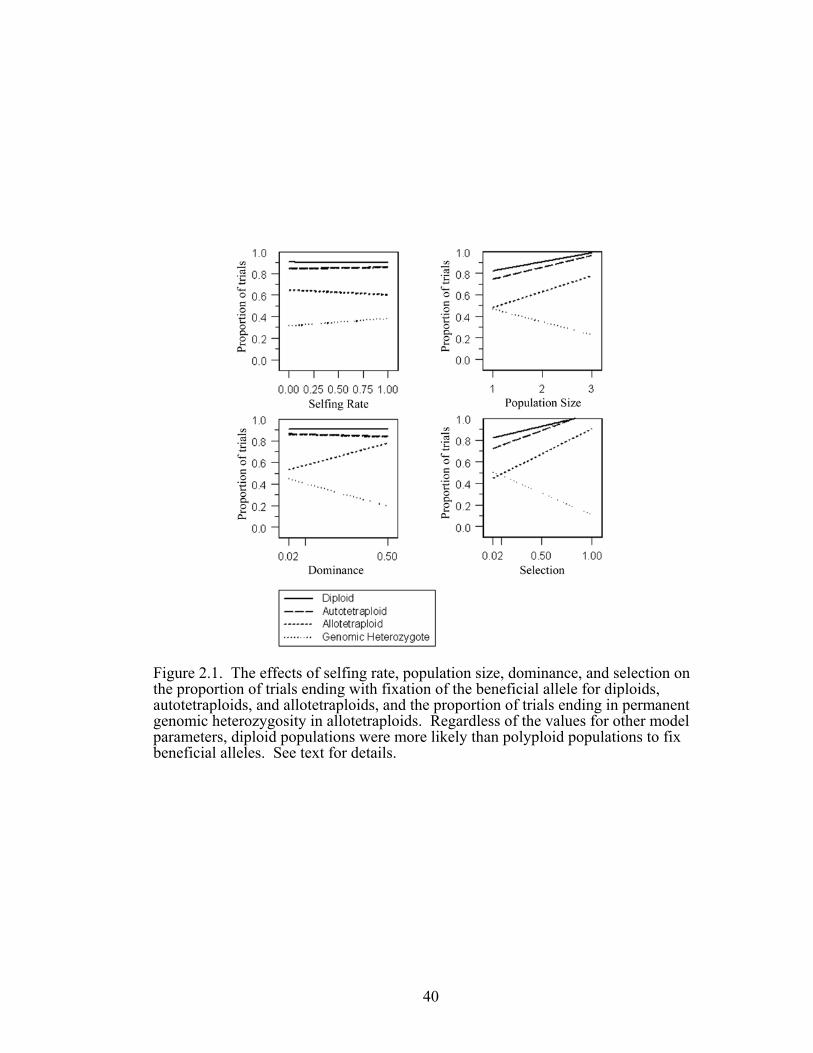
40
Figure 2.1. The effects of selfing rate, population size, dominance, and selection on the proportion of trials ending with fixation of the beneficial allele for diploids, autotetraploids, and allotetraploids, and the proportion of trials ending in permanent genomic heterozygosity in allotetraploids. Regardless of the values for other model parameters, diploid populations were more likely than polyploid populations to fix beneficial alleles. See text for details.

41
Finally, the level of selection was positively correlated with fixation of the beneficial
allele in all cytotypes but its effect was greater in the two polyploids than in the
diploid.
The probability of fixing the beneficial allele was also significantly influenced
by the interactions between selection and both population size and dominance (Figure
2.2). While stronger selection always increased the probability of fixing the beneficial
Figure 2.2. The influence of the interactions between (a) population size and selection and (b) dominance and selection on the proportion of trials ending with fixation of the beneficial allele. Increasing selection had a reduced effect in large populations, though it was augmented when levels of dominance were high. See text for details.
allele, the effect of increasing selection was weaker in large relative to small
populations. In addition, the effect of selection on allele fixation was stronger when
dominance was high.
The time to fixation of the beneficial allele – All model parameters affected the time to
fixation of the beneficial allele (Tables 2.3 – 2.4 and Figure 2.3). Fixation occurred
more rapidly in diploids than in polyploids, and faster in allopolyploids than in
autopolyploids. In addition, population size was positively correlated with the time to
fixation. Finally, selfing rate, dominance, and selection were all negatively correlated
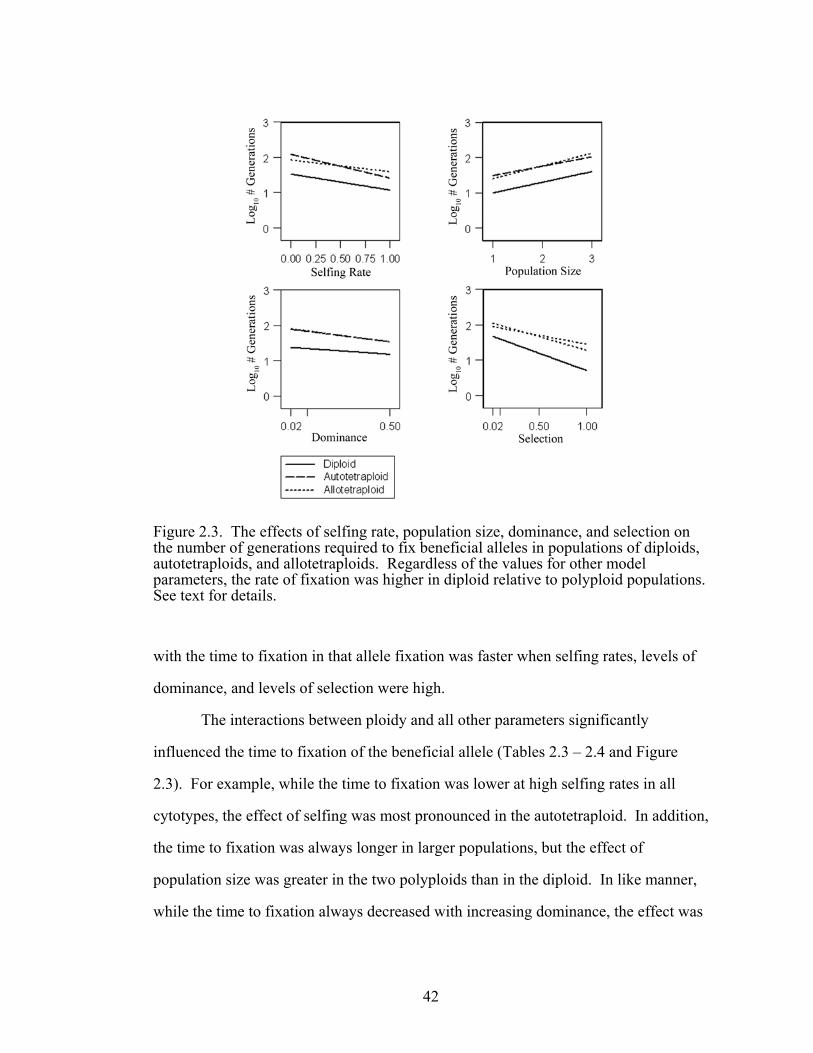
42
Figure 2.3. The effects of selfing rate, population size, dominance, and selection on the number of generations required to fix beneficial alleles in populations of diploids, autotetraploids, and allotetraploids. Regardless of the values for other model parameters, the rate of fixation was higher in diploid relative to polyploid populations. See text for details.
with the time to fixation in that allele fixation was faster when selfing rates, levels of
dominance, and levels of selection were high.
The interactions between ploidy and all other parameters significantly
influenced the time to fixation of the beneficial allele (Tables 2.3 – 2.4 and Figure
2.3). For example, while the time to fixation was lower at high selfing rates in all
cytotypes, the effect of selfing was most pronounced in the autotetraploid. In addition,
the time to fixation was always longer in larger populations, but the effect of
population size was greater in the two polyploids than in the diploid. In like manner,
while the time to fixation always decreased with increasing dominance, the effect was
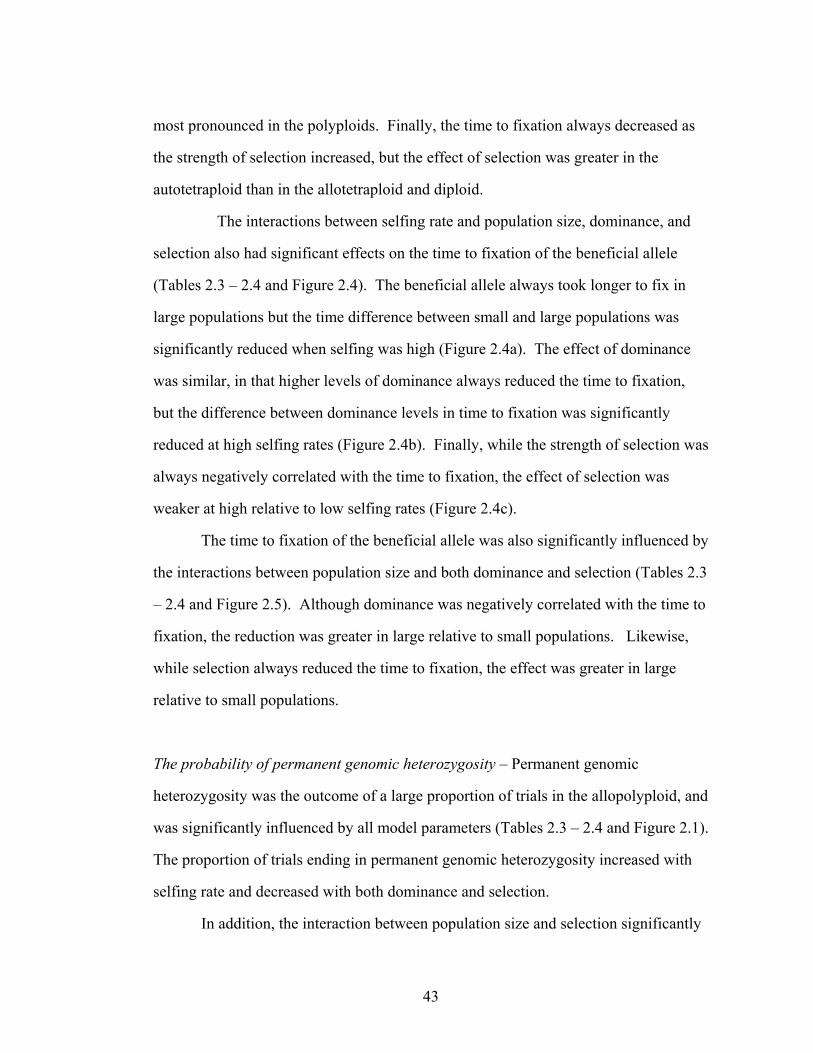
43
most pronounced in the polyploids. Finally, the time to fixation always decreased as
the strength of selection increased, but the effect of selection was greater in the
autotetraploid than in the allotetraploid and diploid.
The interactions between selfing rate and population size, dominance, and
selection also had significant effects on the time to fixation of the beneficial allele
(Tables 2.3 – 2.4 and Figure 2.4). The beneficial allele always took longer to fix in
large populations but the time difference between small and large populations was
significantly reduced when selfing was high (Figure 2.4a). The effect of dominance
was similar, in that higher levels of dominance always reduced the time to fixation,
but the difference between dominance levels in time to fixation was significantly
reduced at high selfing rates (Figure 2.4b). Finally, while the strength of selection was
always negatively correlated with the time to fixation, the effect of selection was
weaker at high relative to low selfing rates (Figure 2.4c).
The time to fixation of the beneficial allele was also significantly influenced by
the interactions between population size and both dominance and selection (Tables 2.3
– 2.4 and Figure 2.5). Although dominance was negatively correlated with the time to
fixation, the reduction was greater in large relative to small populations. Likewise,
while selection always reduced the time to fixation, the effect was greater in large
relative to small populations.
The probability of permanent genomic heterozygosity – Permanent genomic
heterozygosity was the outcome of a large proportion of trials in the allopolyploid, and
was significantly influenced by all model parameters (Tables 2.3 – 2.4 and Figure 2.1).
The proportion of trials ending in permanent genomic heterozygosity increased with
selfing rate and decreased with both dominance and selection.
In addition, the interaction between population size and selection significantly

44
Figure 2.4. The effect of the interaction between selfing rate and (a) population size, (b) dominance, and (c) selection on the number of generations required for populations to fix beneficial alleles. The differences between small and large populations, low and high levels of dominance, and weak and strong selection in the number of generations required to fix beneficial alleles was significantly reduced among populations with high levels of self-fertilization. See text for details.
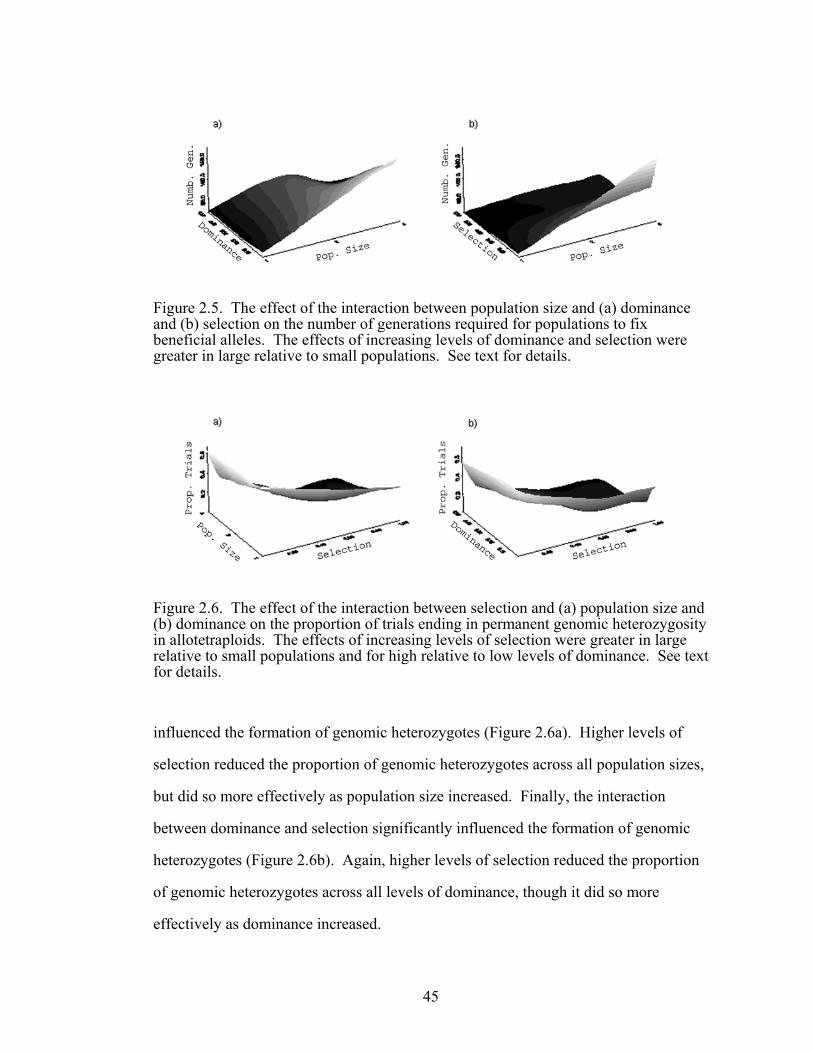
45
Figure 2.5. The effect of the interaction between population size and (a) dominance and (b) selection on the number of generations required for populations to fix beneficial alleles. The effects of increasing levels of dominance and selection were greater in large relative to small populations. See text for details.
Figure 2.6. The effect of the interaction between selection and (a) population size and (b) dominance on the proportion of trials ending in permanent genomic heterozygosity in allotetraploids. The effects of increasing levels of selection were greater in large relative to small populations and for high relative to low levels of dominance. See text for details.
influenced the formation of genomic heterozygotes (Figure 2.6a). Higher levels of
selection reduced the proportion of genomic heterozygotes across all population sizes,
but did so more effectively as population size increased. Finally, the interaction
between dominance and selection significantly influenced the formation of genomic
heterozygotes (Figure 2.6b). Again, higher levels of selection reduced the proportion
of genomic heterozygotes across all levels of dominance, though it did so more
effectively as dominance increased.
46
Discussion
Increasing the level of selection always increased the probability of fixation of
beneficial alleles, however the effect was not as strong in small relative to large
populations. This result suggests that the ability of selection to shape allele
frequencies may be reduced in populations of neopolyploids, which are likely to occur
in relatively small populations where stochastic forces (e.g., genetic drift) can be
profound and may be strong enough to overcome the role of selection (Fisher 1922,
1930; Wright 1931; Kimura 1983; Gillespie 1998). Selection was also more efficient
when levels of dominance were high, as high levels of dominance allow for the
selective elimination of deleterious alleles, even when such alleles are in the
heterozygous state.
It has been suggested that whether diploids evolve faster than polyploids
depends on the degree to which deleterious alleles are masked, and that under some
conditions polyploids can evolve faster than diploids (Otto 2007; and see Orr and Otto
1994). However, for a given set of parameter values, we found that diploids always
evolve faster than polyploids, as indicated by the mean number of generations required
to fix beneficial alleles. Allopolyploids tended to be intermediate in this regard, while
autopolyploids required the largest number of generations to fix beneficial alleles.
This result coincides directly with the efficiency of masking in our model, in that
deleterious alleles are exposed to selection more efficiently in diploids relative to
polyploids. A similar process occurs among polyploids, in that allopolyploids are
more efficient than autopolyploids at purging deleterious alleles.
The production of permanent genomic heterozygotes was influenced by all
model parameters. Self-fertilization increased their production because selfing leads
to increased homozygosity, and increased homozygosity, in turn, can promote the
fixation of alleles, even when such alleles are deleterious. In contrast, their production
47
was reduced in larger populations (where stochastic forces are weaker) and in
response to increases in levels of dominance or selection (when the selective
elimination of the deleterious allele is more efficient). Selection was negatively
correlated with the production of genomic heterozygotes; however, this effect was
more pronounced in small populations, where genetic drift augments the fixation of
deleterious alleles. Similarly, the effect of selection was more pronounced when
dominance was high, allowing for the selective elimination of deleterious alleles in the
heterozygous state.
The level of dominance among deleterious alleles varied in our model from h =
0.02 to h = 0.5. Relatively little is known about the levels of dominance exhibited by
deleterious alleles segregating in natural populations, though studies of Drosophila
melanogaster suggest extremely low levels of dominance (e.g., 0.00 < h < 0.05) for
lethals (Crow and Simmons 1983; Lynch et al. 1999), probably due to stronger
selection against more dominant mutations (Lande and Schemske 1985).
Interestingly, however, most lethal alleles are not completely recessive (Simmons and
Crow 1977; Lande and Schemske 1985). In contrast to levels of dominance for lethal
alleles, levels of dominance for mildly deleterious alleles can be relatively high
(Lynch et al. 1999). Therefore, for deleterious alleles with high selection coefficients
(i.e., s ≥ 0.5) our results may be most relevant to natural populations when levels of
dominance are low (i.e., h ≤ 0.1). However, for deleterious alleles with low selection
coefficients (i.e., s ≤ 0.1), any level of dominance might apply.
The selection coefficient represents the intensity of selection experienced by
individuals that are homozygous for the deleterious allele, and varied in our model
from s = 0.02 (mildly deleterious) to s = 1.00 (lethal). Most deleterious alleles
segregating in natural populations are only mildly deleterious (i.e., s ≤ 0.1) (Crow and
Simmons 1983; Lynch and Gabriel 1990; Lynch 1995), though studies suggest that
48
100 or more such alleles might be present within individuals (Lynch and Gabriel 1990;
Lynch 1995), such that their cumulative effects could be profound (Lynch 1995). In
contrast, strong selection against lethal mutations should keep their frequencies
relatively low in most populations. For this reason, the frequency of lethal alleles is
expected to be extremely low in populations of neopolyploids, which are likely to be
founded by one or a few individuals.
Conclusions and Future Directions
The results presented here suggest several lines of inquiry that merit further
study. First, populations of neopolyploids may be extremely small (i.e., only one or a
few individuals) and may not be in Hardy-Weinberg equilibrium. Small population
sizes can lead to decreased performance (e.g., Fischer and Matthies 1998) and
eventual extinction (Gilpin and Soule 1986; Matthies et al. 2004). All of the
populations we simulated were relatively small (≤ 100 individuals), however it would
be of interest to simulate the response to selection for populations composed of only
one (or a few) heterozygous individual(s). The purging of deleterious alleles should
occur extremely rapidly in such populations, though drift might cause the fixation of
deleterious alleles before this could occur, even under conditions of strong selection.
Second, the dominance coefficients and fitness functions used here represent only one
of several possibilities. For simplicity it was assumed that dosage effects in
polyploids were linear and additive (i.e., h1 < h2 < h3). However, it could be that
individuals with only one copy of a given deleterious allele are as (or nearly as) fit as
those lacking them entirely, and that significant fitness effects occur only with two or
more copies (i.e., h1 << h2 < h3) (cf. Ronfort 1999). In addition, we assigned genotypic
fitness as a function of the absolute number of deleterious alleles, regardless of how
such alleles were distributed among chromosomes (e.g., for allotetraploids we
49
assumed that AAaa individuals had the same fitness as AaAa individuals). However,
other possibilities exist. For example, a scenario worthy of exploration would be one
in which the fitness of an allotetraploid is determined by finding the average fitness of
the two homeologous genomes. In the specific case of h = 0.5 and linear dosage
effects this would yield results identical to those presented here. However, for other
levels of dominance and/or alternative dosage models the results could differ
significantly. Third, we assumed that the locus of interest was close to the centromere
and that double reduction in autotetraploids did not occur. However, double reduction
might occur in relatively high frequencies (as high as ~14% for loci located at distal
ends of the chromosome (Mather 1936; Parsons 1959; Bever and Felber 1992)) and
would cause autopolyploid populations to behave more like diploids by increasing the
proportion of homozygous gametes produced, a process that should lead to more
effective purging. Finally, polyploids are often categorized as autopolyploids or
allopolyploids, suggesting they contain either multiple sets of homologous
chromosomes (leading to multisomic inheritance patterns), or multiple sets of
nonhomologous chromosomes (leading to disomic inheritance patterns), respectively.
However, these conditions represent the extremes of what is likely a continuum, and
recombination between genomes can cause allopolyploids to exhibit multisomic
inheritance at some loci and disomic inheritance at others (Sybenga 1969; Grant 1981;
Jackson 1982; Jenkins and Rees 1991; Comai 2000; but see Sybenga 1996); so-called
segmental allopolyploids (Stebbins 1950). Indeed, it might be that genomic
allopolyploids (with no recombination between genomes) are relatively rare in nature
(Sybenga 1996). To the extent that this is true, studies that explore the effects of
intergenomic recombination in allopolyploids will be of value.

50
LITERATURE CITED Alexander, D. E. 1960. Performance of genetically induced corn tetraploids. Am. Seed
Trade Assoc. 15:68-74. Auger, D. L., A. D. Gray, T. S. Ream, A. Kato, E. H. Coe, Jr., and J. A. Birchler.
2005. Nonadditive gene expression in diploid and triploid hybrids of maize. Genetics 169:389-397.
Baack, E. J. 2005. To succeed globally, disperse locally: effects of local pollen and
seed dispersal on tetraploid establishment. Heredity 94:538-546. Barrett, S. C. H. 2002. The evolution of plant sexual diversity. Nature Reviews
Genetics 3:274-284. Barringer, B. C. 2007. Polyploidy and self-fertilization in flowering plants. American
Journal of Botany 94:1527-1533. Barringer, B. C. 2008. Chapter 3: Mating System and Ploidy Influence Levels of
Inbreeding Depression in Clarkia (Onagraceae). In Polyploidy, inbreeding depression, and the evolution of mating systems in flowering plants. Ph.D. Dissertation. Cornell University. Ithaca, NY. USA.
Bateman, A. J. 1952. Self-incompatibility systems in angiosperms. I. Theory. Heredity
6:285-310. Bennett, J. H. 1976. Expectations for Inbreeding Depression on Self-fertilization of
Tetraploids. Biometrics 32:449-452. Bever, J. D. and F. Felber. 1992. The theoretical population genetics of
autopolyploidy. Oxford Surveys in Evolutionary Biology 8:185-217. Bingham, E. T., and R. W. Groose. 1994. Complementary gene interactions in alfalfa
are greater in autotetraploids than diploids. Crop Sci. 34:823-829. Busbice, T. H., and C. P. Wilsie. 1966. Inbreeding Depression and Heterosis in
Autotetraploids With Application to Medicago Sativa L. Euphytica 15:52-67. Byers, D. L. and D. M. Waller. 1999. Do plant populations purge their genetic load?
Effects of population size and mating history on inbreeding depression. Ann. Rev. Ecol. Syst. 30:479-513.
Carr, D. E., and M. R. Dudash. 2003. Recent approaches into the genetic basis of
inbreeding depression in plants. Phil. Trans. R. Soc. Lond. B. 358:1071-1084. Charlesworth, B., M. T. Morgan, and D. Charlesworth. 1990. Genetic loads and
estimates of mutation rates in highly inbred plant populations. Nature 347:380-382.
Charlesworth, B., and D. Charlesworth. 1999. The genetic basis of inbreeding
depression. Genet. Res. 74:329-340.
51
Charlesworth, D., and B. Charlesworth. 1979. The evolutionary genetics of sexual systems in flowering plants. Proceedings of the Royal Society of London B Biological Sciences 205:513-530.
Charlesworth, D., and B. Charlesworth. 1987. Inbreeding depression and its
evolutionary consequences. Annual Review of Ecology and Systematics 18:237-268.
Charlesworth, D. and B. Charlesworth. 1990. Inbreeding depression with heterozygote
advantage and its effect on selection for modifiers changing the outcrossing rate. Evolution 44:870-888.
Comai, L. 2000. Genetic and epigenetic interactions in allopolyploid plants. Plant
Molecular Biology 43:387-399. Crnokrak, P. and S. C. H. Barrett. 2002. Perspective: Purging the genetic load: A
review of the experimental evidence. Evolution 56:2347-2358. Crow, J. F. and M. Kimura. 1970. An introduction to population genetics theory.
Harper and Row. New York, NY. Crow, J. F. and M. J. Simmons. 1983. The mutation load in Drosophila. In M.
Ashburner et al. (eds.) The genetics and biology of Drosophila, Vol 3c. Academic Press, New York, NY.
Davies, W. E. 1961. Herbage legume breeding: investigations on polyploid clovers. Report for the Welsh Plant Breeding Station, pp. 40-44.
Dewey, D. R. 1966. Inbreeding depression in diploid, tetraploid, and hexaploid crested wheatgrass. Crop Sci. 6:144-147.
Dewey, D. R. 1969. Inbreeding depression in diploid and induced-autotetraploid
crested wheatgrass. Crop Sci. 9:592-595. Dudash, M. R. and D. E. Carr. 1998. Genetics underlying inbreeding depression in
Mimulus with contrasting mating systems. Nature 393:682-684.
Felber, F. 1991. Establishment of a tetraploid cytotype in a diploid population: effect of relative fitness of cytotypes. Journal of Evolutionary Biology 4:194-207.
Fischer, M. and D. Matthies. 1998. Effects of population size on performance in the rare plant Gentianella germanica. Journal of Ecology 86:195-204.
Fisher, R. A. 1922. On the dominance ratio. Proceedings of the Royal Society of Edinburgh 42:321-341.
Fisher, R. A. 1930. The genetical theory of natural selection. Clarendon Press. Oxford, U. K.
Fowler, N. L., and D. A. Levin. 1984. Ecological constraints on the establishment of a novel polyploid in competition with its diploid progenitor. American Naturalist 124:705-711.
52
Gillespie, J. H. 1998. Population genetics: a concise guide. The John Hopkins University Press. Baltimore, MD.
Gilpin, M. E. and M. E. Soule. 1986. Minimum viable populations: the processes of
species extinctions. In Soule, M. E. (ed.) Conservation biology: the science of scarcity and diversity. Sinauer Associates Inc., Sunderland, MA.
Goldblatt, P. 1980. Polyploidy in angiosperms: Monocotyledons. In Lewis, W. H.
(ed.) Polyploidy: Biological relevance. Plenum Press, New York.
Grant, V. 1956. The influence of breeding habit on the outcome of natural hybridization in plants. American Naturalist 90:319-322.
Grant, V. 1963. The origin of adaptations. Columbia University Press, New York. Grant, V. 1981. Plant Speciation. Columbia University Press, New York. Haldane, J. B. S. 1927. A mathematical theory of natural selection and artificial
selection. Part 3. Proceedings of the Cambridge Philosophical Society 23:363-372.
Haldane, J. B. S. 1930. Theoretical genetics of autopolyploids. Journal of Genetics
22:359-372. Hedrick, P. W. 1987. Genetic load and the mating system in homosporous ferns.
Evolution 41:1282-1289. Husband, B. C. and D. W. Schemske. 1996. Evolution of the magnitude and timing of
inbreeding depression in plants. Evolution 50:54-70. Husband, B. C., and D. W. Schemske. 1997. The effect of inbreeding in diploid and
tetraploid populations of Epilobium angustifolium (Onagraceae): implications for the genetic basis of inbreeding depression. Evolution 51:737-746.
Jackson, R. C. 1982. Polyploidy and diploidy: new perspectives on chromosome
pairing and its evolutionary implications. American Journal of Botany 69:1512-1523.
Jenkins, G. and H. Rees. 1991. Strategies of bivalent formation in allopolyploid plants.
Proc. R. Soc. Lond. B. 243:209-214. Johnston, M. O., and D. J. Schoen. 1996. Correlated evolution of self-fertilization and
inbreeding depression: an experimental study of nine populations of Amsinckia (Boraginaceae). Evolution 50:1478-1491.
Kalton, R. R., A. G. Smit, and R. C. Leffel. 1952. Parent-inbred progeny relationships
of selected orchardgrass clones. Agron. J. 44:481-486. Kimura, M. 1983. The neutral theory of molecular evolution. Cambridge University
Press. Cambridge, U. K.
53
Lande, R., and D. W. Schemske. 1985. The evolution of self-fertilization and inbreeding depression in plants. I. genetic models. Evolution 39:24-40.
Levin, D. A. 1975. Minority cytotype exclusion in local plant populations. Taxon
24:35-43. Lynch, M. 1995. Inbreeding depression and outbreeding depression. NOAA Tech
Memo NMFS NWFSC-30. Lynch, M. and W. Gabriel. 1990. Mutation load and the survival of small populations.
Evolution 44:1725-1737. Lynch, M., J. Blanchard, D. Houle, T. Kibota, S. Schultz, L. Vassilieva, and J. Willis.
1999. Perspective: spontaneous deleterious mutation. Evolution 53:645-663. Mable, B. K. 2004. Polyploidy and self-compatibility: is there an association? New
Phytologist 162:803-811. Masterson, J. 1994. Stomatal size in fossil plants: Evidence for polyploidy in majority
of angiosperms. Science 264:421-423. Mather, K. 1936. Segregation and linkage in autotetraploids. Journal of Genetics
32:287-314. Matthies, D., I. Brauer, W. Maibom, and T. Tscharntke. 2004. Population size and the
risk of local extinction: empirical evidence from rare plants. Oikos 105:481-488.
Miller, J. S., and D. L. Venable. 2000. Polyploidy and the evolution of gender
dimorphism in plants. Science 289:2335-2338. Nagylaki, T. 1977. Selection in one- and two-locus systems. Springer-Verlag. New
York, NY. Orr, H. A. and S. P. Otto. 1994. Does diploidy increase the rate of adaptation?
Genetics 136:1475-1480. Otto, S. P. 2007. The evolutionary consequences of polyploidy. Cell 131:452-462. Otto, S. P., and J. Whitton. 2000. Polyploid Incidence and Evolution. Annual Review
of Genetics 34:401-437. Pannell, J. R., D. J. Obbard, and R. J. A. Buggs. 2004. Polyploidy and the sexual
system: What can we learn from Mercurialis annua? Biol. J. Linn. Soc. 82:547-560.
Parsons, P. A. 1959. Some problems in inbreeding and random mating in tetrasomics.
Agron. J. 51:465-467. Ramsey, J., and D. W. Schemske. 1998. Pathways, mechanisms, and rates of polyploid
formation in flowering plants. Annu. Rev. Ecol. Syst. 29:467-501.
54
Rausch, J. H. and M. T. Morgan. 2005. The effect of self-fertilization, inbreeding depression, and population size on autopolyploid establishment. Evolution 59:1867-1875.
Rodriguez, D. J. 1996. A model for the establishment of polyploidy in plants.
American Naturalist 147:33-46. Ronfort, J. 1999. The mutation load under tetrasomic inheritance and its consequences
for the evolution of the selfing rate in autotetraploid species. Genetical Research 74:31-42.
Rosquist, G. 2001. Reproductive biology in diploid Anthericum ramosum and
tetraploid A. liliago (Anthericaceae). Oikos 92:143-152. SAS Institute. 2003. Statistical analysis software, version 9.1. Cary, NC, USA. Simmons, M. J. and J. F. Crow. 1977. Mutations affecting fitness in Drosophila
populations. Annual Review of Genetics 11:49-78. Soltis, D. E., P. S. Soltis, and J. A. Tate. 2004. Advances in the study of polyploidy
since Plant Speciation. New Phytologist 161:173-191. Stebbins, G. L. 1938. Cytological characteristics associated with the different growth
habits in the dicotyledons. American Journal of Botany 25:189-198. Stebbins, G. L. 1950. Variation and evolution in plants. Columbia University Press,
New York, NY, USA. Stebbins, G. L. 1957. Self-fertilization and population variability in higher plants.
American Naturalist 41:337-354. Stebbins, G. L. 1980. Polyploidy in plants: unsolved problems and prospects in W. H.
Lewis (ed.) Polyploidy: Biological Relevance. Plenum Press, New York. Stebbins, G. L. 1984. Polyploidy and the distribution of the arctic alpine flora: new
evidence and a new approach. Botanica Helvetica 94:1-13. Sybenga, J. 1969. Allopolyploidization of autopolyploids I. possibilities and
limitations. Euphytica 18:355-371. Sybenga, J. 1996. Chromosome pairing affinity and quadrivalent formation in
polyploids: do segmental allopolyploids exist? Genome 39:1176-1184. Townsend, C. E., and E. E. Remmenga. 1968. Inbreeding in tetraploid alsike clover,
Trifolium hybridum L. Crop Sci. 8:213-217. Wright, S. 1931. Evolution in mendelian populations. Genetics 16:97-159.
55
CHAPTER 3
MATING SYSTEM AND PLOIDY INFLUENCE LEVELS OF INBREEDING
DEPRESSION IN CLARKIA (ONAGRACEAE)
Abstract
Inbreeding depression is the reduction in offspring fitness associated with
inbreeding and is one of the primary forces selecting against the evolution of self-
fertilization. Studies suggest that most inbreeding depression is caused by the
expression of recessive deleterious alleles in homozygotes whose frequency increases
as a result of self-fertilization or mating among close relatives. This process leads to
the selective elimination of deleterious alleles such that highly selfing species may
show remarkably little inbreeding depression. Genome duplication (polyploidy) has
been hypothesized to influence levels of inbreeding depression, with polyploids
expected to exhibit less inbreeding depression than diploids. We studied levels of
inbreeding depression in allotetraploid and diploid species of Clarkia (Onagraceae)
that vary in mating system (each cytotype was represented by an outcrossing and a
selfing species). The outcrossing species exhibited more inbreeding depression than
the selfing species for most fitness components and for two different measures of
cumulative fitness. In contrast, though inbreeding depression was generally lower for
the polyploid species than for the diploid species, the difference was statistically
significant only for flower number and one of the two measures of cumulative fitness.
Further, we detected no significant interaction between mating system and ploidy in
determining inbreeding depression. In sum, our results suggest that a taxon’s current
mating system is more important than ploidy in influencing levels of inbreeding
depression in natural populations of these annual plants.
56
Introduction
Inbreeding depression is the reduction in fitness of inbred relative to non-
inbred individuals and is thought to be one of the primary forces selecting against the
evolution of self-fertilization (Lande and Schemske 1985; Charlesworth and
Charlesworth 1987; Charlesworth and Charlesworth 1999; Husband and Schemske
1996, 1997; Carr and Dudash 2003). Although the genetic basis of inbreeding
depression is complex, studies suggest that most inbreeding depression is caused by
the unmasking of recessive (or partially recessive) deleterious alleles in homozygotes,
whose frequency increases upon selfing or mating between relatives (i.e., the partial
dominance model of inbreeding depression) (Charlesworth and Charlesworth 1987,
Charlesworth and Charlesworth 1999; Carr and Dudash 2003). Other phenomena
have been shown to influence levels of inbreeding depression, however, including a
reduction in levels of heterozygosity (i.e., the overdominance model of inbreeding
depression), reduced numbers of interactions among loci (i.e., epistasis), and the
number and relative proportions of deleterious alleles with small vs. large effects on
fitness (Charlesworth and Charlesworth 1987, Charlesworth and Charlesworth 1999;
Carr and Dudash 2003). These sources of inbreeding depression are not mutually
exclusive.
Interestingly, many plants that regularly self-fertilize exhibit very little
inbreeding depression (Husband and Schemske 1996 and references therein). This
seemingly paradoxical observation can be explained in the partial dominance model
because the unmasking of recessive deleterious alleles leads to their selective
elimination (purging). For this reason, inbreeding depression may be most severe
during the initial generations that follow an increase in self-fertilization and decline
over time (Darwin 1876; Lande and Schemske 1985; Husband and Schemske 1996;
Charlesworth and Charlesworth 1990; Crnokrak and Barrett 2002; but see

57
Charlesworth et al. 1990; Byers and Waller 1999. Further, inbreeding depression may
vary among different life stages, and the total amount of inbreeding depression
suffered by an inbred individual is a product of reduced fitness at all stages of life.
Therefore, in studies of inbreeding depression it is important to take into account the
current mating system (e.g., Carr and Dudash 1996) and to compare the performance
of inbred and outbred individuals throughout ontogeny (e.g., Husband and Schemske
1996).
It has been hypothesized, but rarely tested, that genome-wide changes in ploidy
can also affect levels of inbreeding depression, with polyploids expected to exhibit
less inbreeding depression than their diploid relatives (Lande and Schemske 1985;
Ronfort 1999). The paucity of empirical tests of this hypothesis is surprising because
predictions regarding inbreeding depression in diploids may not be applicable to
polyploids, which have more than two copies of each gene. Furthermore, 30 to 80%
of all flowering plants are thought to be polyploid (Stebbins 1938; Grant 1963;
Goldblatt 1980; Masterson 1994; Otto and Whitton 2000), and polyploids often
exhibit higher levels of self-fertilization than their diploid relatives (Stebbins 1950;
Grant 1956, 1981; Soltis and Soltis 1987; Masuyama and Watano 1990; Soltis and
Soltis 1990; Barringer 2007). Though several phenomena could contribute to the
association between polyploidy and selfing (e.g., the breakdown of self-
incompatibility systems [Mable 2004] and/or reproductive assurance [Rausch and
Morgan 2005]), reduced inbreeding depression in polyploids relative to diploids may
play a pivotal role. Finally, it is important in agricultural contexts to better understand
the relationship between inbreeding depression and polyploidy because most crop
species are polyploid (Stebbins 1950; Harlan and deWet 1975; Soltis and Soltis 2000),
and the development of pure-breeding lineages frequently involves self-fertilization
(Allard 1999).
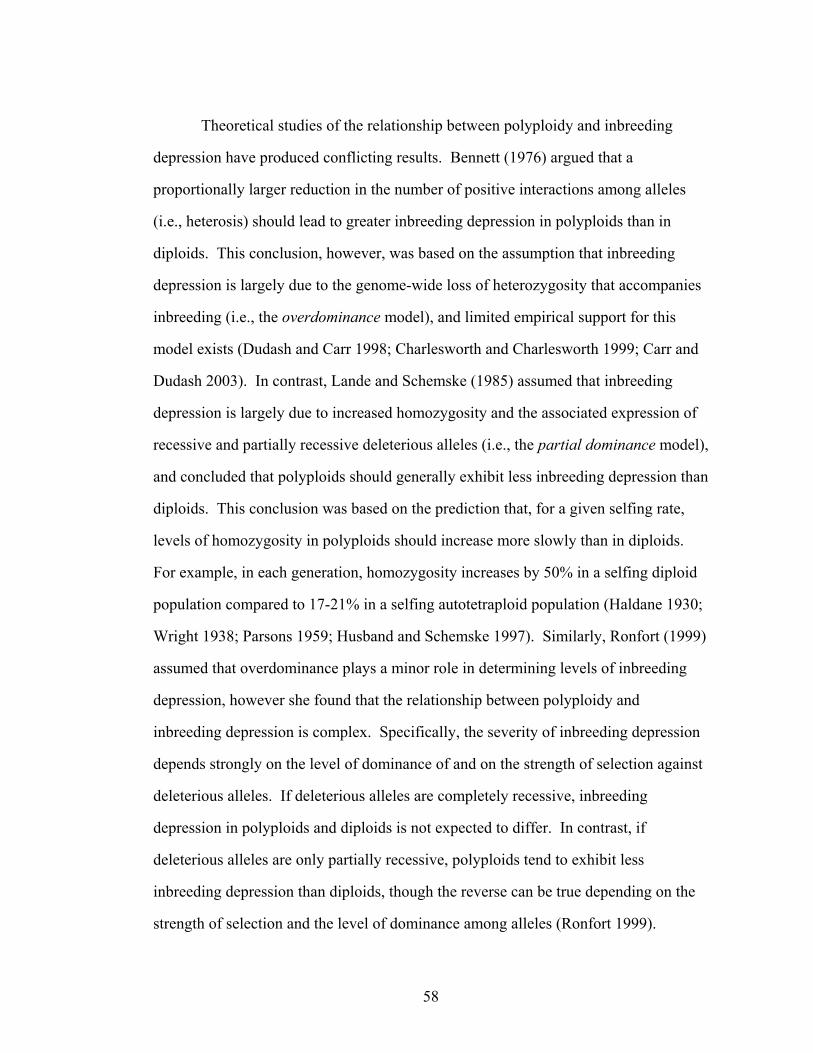
58
Theoretical studies of the relationship between polyploidy and inbreeding
depression have produced conflicting results. Bennett (1976) argued that a
proportionally larger reduction in the number of positive interactions among alleles
(i.e., heterosis) should lead to greater inbreeding depression in polyploids than in
diploids. This conclusion, however, was based on the assumption that inbreeding
depression is largely due to the genome-wide loss of heterozygosity that accompanies
inbreeding (i.e., the overdominance model), and limited empirical support for this
model exists (Dudash and Carr 1998; Charlesworth and Charlesworth 1999; Carr and
Dudash 2003). In contrast, Lande and Schemske (1985) assumed that inbreeding
depression is largely due to increased homozygosity and the associated expression of
recessive and partially recessive deleterious alleles (i.e., the partial dominance model),
and concluded that polyploids should generally exhibit less inbreeding depression than
diploids. This conclusion was based on the prediction that, for a given selfing rate,
levels of homozygosity in polyploids should increase more slowly than in diploids.
For example, in each generation, homozygosity increases by 50% in a selfing diploid
population compared to 17-21% in a selfing autotetraploid population (Haldane 1930;
Wright 1938; Parsons 1959; Husband and Schemske 1997). Similarly, Ronfort (1999)
assumed that overdominance plays a minor role in determining levels of inbreeding
depression, however she found that the relationship between polyploidy and
inbreeding depression is complex. Specifically, the severity of inbreeding depression
depends strongly on the level of dominance of and on the strength of selection against
deleterious alleles. If deleterious alleles are completely recessive, inbreeding
depression in polyploids and diploids is not expected to differ. In contrast, if
deleterious alleles are only partially recessive, polyploids tend to exhibit less
inbreeding depression than diploids, though the reverse can be true depending on the
strength of selection and the level of dominance among alleles (Ronfort 1999).

59
Finally, Otto and Whitton (2000) showed that, over time, polyploids can harbor
greater mutational loads than diploids because a lower frequency of homozygosity
leads to less effective purging in the former than the latter. Higher genetic loads
should result in greater levels of inbreeding depression in polyploids relative to
diploids.
Although theoretical models differ in several respects, there are at least two
important characteristics shared by all of them. First, the models all assume that
populations are at (or near) mutation-selection equilibrium and therefore of ancient
derivation, and might not apply to newly formed polyploids (i.e., neopolyploids)
(Pannell et al. 2004). Indeed, as Pannell and colleagues (2004) suggest, if the process
of diploidization (wherein the cytogenetic behavior of a polyploid reverts back to that
of a diploid owing to chromosomal rearrangements and gene silencing and/or loss) is
relatively rapid (e.g., Song et al. 1995; Kashkush et al. 2002), polyploids may never
reach mutation-selection equilibrium. Second, all models focus on autopolyploids that
have homologous chromosomes and generally exhibit polysomic inheritance. To date,
theoretical explorations of inbreeding depression in allopolyploids with homeologous
chromosomes and disomic inheritance do not exist (Pannell et al. 2004; but see Lande
and Schemske 1985), despite the fact that allopolyploids are common in nature (Grant
1981; Soltis et al. 2004).
The few empirical studies that have measured and compared levels of
inbreeding depression in natural populations of polyploids and closely related diploids
have produced discordant results. Husband and Schemske (1997) found lower levels
of inbreeding depression in autotetraploid compared to diploid populations of
Chamerion angustifolium (Onagraceae), as did Rosquist (2001) in allotetraploid vs.
diploid species of Anthericum (Anthericaceae). In contrast, Johnston and Schoen
(1996) found higher levels of inbreeding depression in allotetraploid than diploid
60
populations of Amsinckia (Boraginaceae). Accounting for these disparate results is
complicated by the fact that the three taxa differ in mating system. The populations of
C. angustifolium had a mixed mating system of outcrossing and selfing (Husband and
Schemske 1997), the populations of Anthericum appeared to be largely outcrossing
(Rosquist 2001), and the populations of Amsinckia ranged from highly outcrossing to
highly selfing (Johnston and Schoen 1996). To date, no study has compared
inbreeding depression in natural populations of diploids and allopolyploids of both
mating systems.
We studied inbreeding depression in closely related diploid and allotetraploid
species of Clarkia (Onagraceae), with each cytotype (diploid, allotetraploid)
represented by a selfing and an outcrossing species. Using seed stock harvested from
natural populations we generated self-fertilized and outcrossed half-siblings whose
performance was then compared at multiple life stages to address the following
questions: (1) Do outcrossing species exhibit higher levels of inbreeding depression
than their selfing relatives? (2) Do diploid taxa exhibit higher levels of inbreeding
depression than polyploid taxa? (3) Is there an interaction between ploidy and mating
system in determining levels of inbreeding depression? In particular, do outcrossing
diploids exhibit more inbreeding depression than outcrossing polyploids, and relative
to outcrossers, is the difference between cytotypes in levels of inbreeding depression
reduced among selfing taxa?
Methods
Study system
The genus Clarkia (Onagraceae) includes ~ 42 species and numerous
subspecies of self-compatible winter annuals with a center of distribution in
California, U.S.A. (Lewis and Lewis 1955). Although most species in the genus are
61
associated with well-drained soils in oak woodland and adjacent habitats, some taxa
occur in chaparral or lower montane forest communities, and two species occur
primarily on coastal dunes or bluffs (Lewis and Lewis 1955). Population sizes vary
greatly depending on species and locality, but often contain many hundred to several
thousand individuals (Lewis and Lewis 1955; Barringer, B. C. and M. A. Geber pers.
obs.). Mating systems within the genus range from highly selfing to highly
outcrossing, and can vary among subspecies and/or populations (Lewis and Lewis
1955; Vasek and Harding 1976; Holtsford and Ellstrand 1989, 1990; Runions and
Geber 2000). Although all Clarkia are self-compatible, many taxa are protandrous
and herkogamous, both of which facilitate outcrossing (Lewis and Lewis 1955;
Runions and Geber 2000). Among outcrossers, pollination is effected primarily by
specialist bees, though other insects, including generalist bees, butterflies, moths, and
cyrtid flies serve as primary or secondary pollinators in some taxa (MacSwain et al.
1973; Moeller 2005). Selfing taxa, in contrast, generally lack significant protandry
and herkogamy, and self-fertilization often occurs autogamously (Lewis and Lewis
1955). Finally, the genus is cytogenetically variable, and includes diploid,
allotetraploid, and allohexaploid taxa. Although most of the polyploid species are
highly selfing, several are outcrossing (Lewis and Lewis 1955).
We used two pairs of species of Clarkia, belonging to two separate sections of
the genus (Lewis and Lewis 1955; Gottlieb and Ford 1996). Each pair consisted of an
allotetraploid and a diploid. In the first pair (section Godetia), the tetraploid C. davyi
is selfing and the diploid C. williamsonii is outcrossing; the diploid parental species of
C. davyi within section Godetia have not been identified (Small et al. 1971). In the
second pair (section Rhodanthus), the tetraploid C. gracilis ssp. sonomensis is
outcrossing and the diploid C. lassenensis is selfing; C. lassenensis and C. amoena (a
species not included in this study) are the diploid parental species of C. gracilis (Small

62
et al. 1971). Appendix Table 3.1 includes section affiliations, population locations,
population sizes, base chromosome numbers, and mating systems for each focal
species.
The selfing species are smaller flowered than the outcrossing species (petal
size in C. davyi, 5-11 mm; C. lassenensis, 8-16 mm; C. williamsonii, 10-30 mm; C.
gracilis ssp. sonomensis, 8-40 mm [Lewis and Lewis 1955; Hickman 1993]). Clarkia
davyi is found on coastal dunes and sea bluffs in Northern California. Clarkia gracilis
ssp. sonomensis is found in open sites in the Coastal Mountain Range of Northern
California and Southern Oregon. Clarkia lassenensis is found in open sites in oak
woodland and coniferous forest in the interior of Northern California and in parts of
Nevada and Oregon. Finally, C. williamsonii is found in open sites in oak and
coniferous forests in the foothills of the Sierra Nevada Mountain Range of Northern
and Central California.
Seed collection
Seeds were harvested from two natural populations of each species in August
2005, however one population of C. williamsonii was misidentified in the field and
was subsequently dropped from the study. In each population, two mature fruits were
collected from each of ~ 50 maternal plants located along transects in the center and
along the periphery of the site. With this collection method we were able to obtain a
representative sample of genetic variation from a population and avoid collecting from
neighboring plants that could be close relatives. Fruits were placed in coin envelopes
(one maternal family per envelope) and stored with desiccant at 5 °C until used.
Production of selfed and outcrossed half-siblings
Inbreeding depression is estimated by comparing fitness components and

63
cumulative fitness between self-fertilized and outcrossed half-siblings (Charlesworth
and Charlesworth 1987; Johnston and Schoen 1994). To this end, we first generated
outbred families for each population. One adult plant was raised from field-collected
seed from each maternal plant, and randomly paired and reciprocally crossed to an
adult plant from a different mother (generation one). In generation two, one adult
from each of the outcrossed families produced in generation one was raised to
flowering, and flowers on each plant were selfed and outcrossed to produce inbred and
outbred half-siblings. We recorded the number and weight of seeds produced from all
crosses. During the third and final generation, we recorded seed germination rate,
survival of seedlings to flowering, flower number, and final plant biomass for inbred
and outbred half-siblings. We also recorded three phenological traits: the number of
days to germination, first flowering, and senescence. Finally, flowers on one inbred
and one outbred individual in ~12 randomly selected families per population were
selfed and outcrossed to provide estimates of seed set under both crossing regimes.
The experimental design is illustrated in Figure 3.1.
Generation one: For each maternal field plant, three seeds were haphazardly
selected and sown into a single 164 ml Ray Leach “Cone-tainer” (Stuewe and Sons,
Inc., Corvallis, OR, U.S.A.) filled with a 1:1 ratio of a peat-based potting soil and
fritted clay. The containers were arranged in racks in a growth chamber (12 hr days at
10 °C and 12 hr nights at 7 °C) and watered lightly from overhead twice/day.
Germination was close to 100%. One seedling in each container was then randomly
selected and the others were removed. Fourteen days after emergence the seedlings
were moved to the greenhouse (12 hr days at 27 °C and 12 hr nights at 16 °C) for the
duration of their life cycle. In the greenhouse, plants were watered from overhead
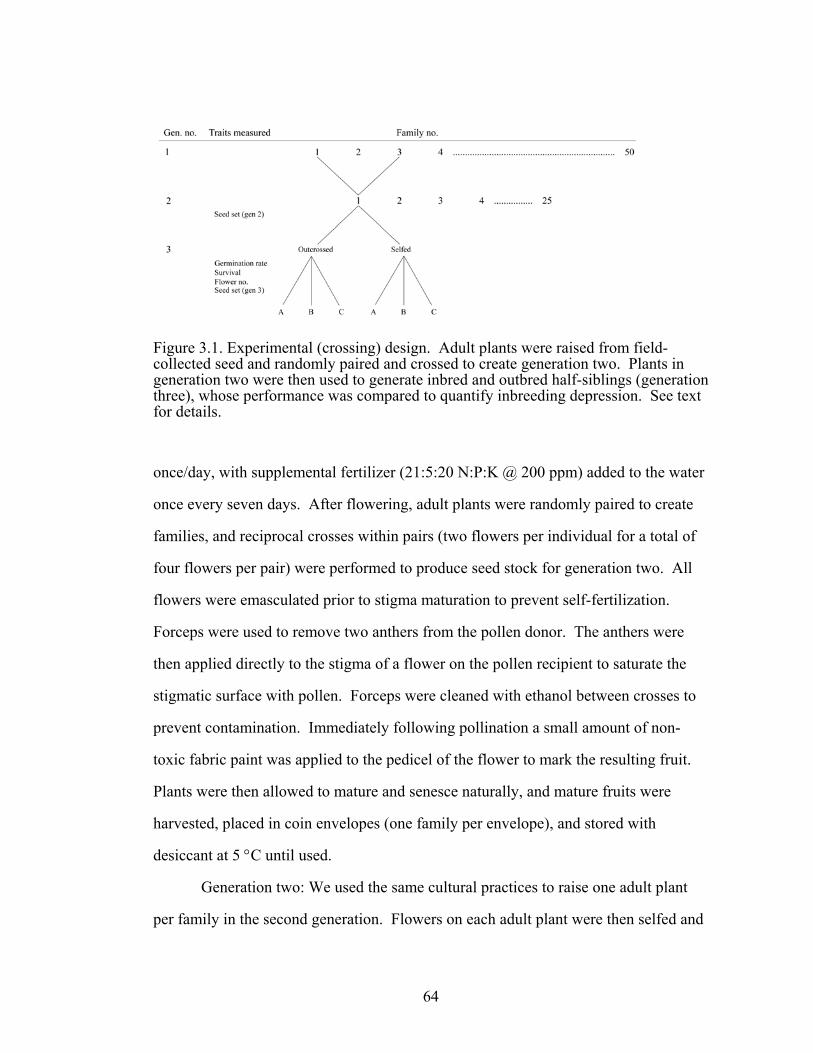
64
Figure 3.1. Experimental (crossing) design. Adult plants were raised from field-collected seed and randomly paired and crossed to create generation two. Plants in generation two were then used to generate inbred and outbred half-siblings (generation three), whose performance was compared to quantify inbreeding depression. See text for details.
once/day, with supplemental fertilizer (21:5:20 N:P:K @ 200 ppm) added to the water
once every seven days. After flowering, adult plants were randomly paired to create
families, and reciprocal crosses within pairs (two flowers per individual for a total of
four flowers per pair) were performed to produce seed stock for generation two. All
flowers were emasculated prior to stigma maturation to prevent self-fertilization.
Forceps were used to remove two anthers from the pollen donor. The anthers were
then applied directly to the stigma of a flower on the pollen recipient to saturate the
stigmatic surface with pollen. Forceps were cleaned with ethanol between crosses to
prevent contamination. Immediately following pollination a small amount of non-
toxic fabric paint was applied to the pedicel of the flower to mark the resulting fruit.
Plants were then allowed to mature and senesce naturally, and mature fruits were
harvested, placed in coin envelopes (one family per envelope), and stored with
desiccant at 5 °C until used.
Generation two: We used the same cultural practices to raise one adult plant
per family in the second generation. Flowers on each adult plant were then selfed and
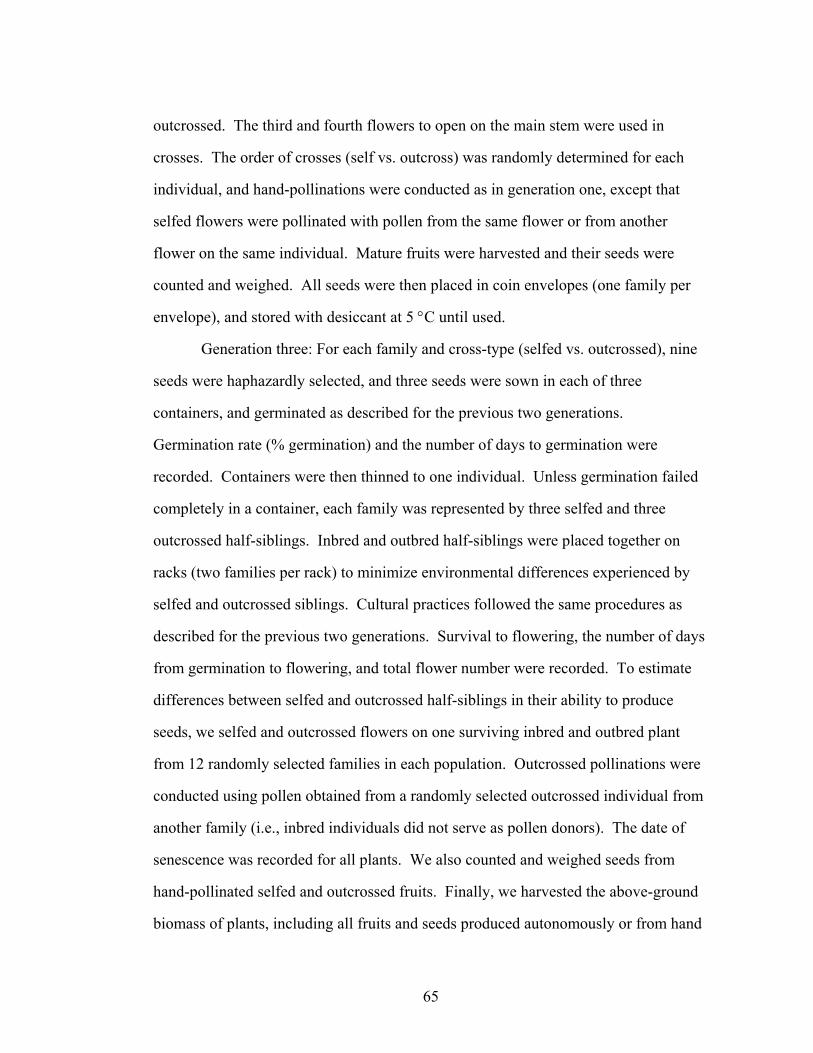
65
outcrossed. The third and fourth flowers to open on the main stem were used in
crosses. The order of crosses (self vs. outcross) was randomly determined for each
individual, and hand-pollinations were conducted as in generation one, except that
selfed flowers were pollinated with pollen from the same flower or from another
flower on the same individual. Mature fruits were harvested and their seeds were
counted and weighed. All seeds were then placed in coin envelopes (one family per
envelope), and stored with desiccant at 5 °C until used.
Generation three: For each family and cross-type (selfed vs. outcrossed), nine
seeds were haphazardly selected, and three seeds were sown in each of three
containers, and germinated as described for the previous two generations.
Germination rate (% germination) and the number of days to germination were
recorded. Containers were then thinned to one individual. Unless germination failed
completely in a container, each family was represented by three selfed and three
outcrossed half-siblings. Inbred and outbred half-siblings were placed together on
racks (two families per rack) to minimize environmental differences experienced by
selfed and outcrossed siblings. Cultural practices followed the same procedures as
described for the previous two generations. Survival to flowering, the number of days
from germination to flowering, and total flower number were recorded. To estimate
differences between selfed and outcrossed half-siblings in their ability to produce
seeds, we selfed and outcrossed flowers on one surviving inbred and outbred plant
from 12 randomly selected families in each population. Outcrossed pollinations were
conducted using pollen obtained from a randomly selected outcrossed individual from
another family (i.e., inbred individuals did not serve as pollen donors). The date of
senescence was recorded for all plants. We also counted and weighed seeds from
hand-pollinated selfed and outcrossed fruits. Finally, we harvested the above-ground
biomass of plants, including all fruits and seeds produced autonomously or from hand

66
pollinations, dried plants at 50 °C for 72 hours, and measured and recorded dry
weights.
Estimation of inbreeding depression
Inbreeding depression, δ, is traditionally measured as 1 – (ws/wo), where ws
and wo are the mean phenotypic values of inbred and outcrossed individuals,
respectively (e.g., Johnston and Schoen 1996; Husband and Schemske 1997;
Galloway et al. 2003; Galloway and Etterson 2007). This method, however, does not
yield a symmetrical distribution of δ around zero when inbred individuals outperform
their outcrossed relatives (i.e., outbreeding depression), as was observed in some cases
in our experiment. Therefore, we compared the fitness of inbred and outcrossed
individuals for each trait and family using a measure of relative performance (RP)
defined as RP = 1 – (ws/wo) when ws ≤ wo, and RP = (wo/ ws) – 1 when ws > wo (cf.
Agren and Schemske 1993; Dudash et al. 1997). This method gives estimates of
relative performance that are identical to traditional estimates of inbreeding depression
when outcrossed progeny have higher fitness than their inbred relatives, however it
applies equal weight to outcomes in which inbred individuals outperform their
outcrossed relatives (Agren and Schemske 1993; Dudash et al. 1997).
We estimated RP for all fitness components: seed number (generation two),
germination rate, survival to flowering, flower number, and seed number for hand-
pollinated fruits (generation three). Because successful seed production through
outcrossing vs. selfing can depend on the species’ mating system (e.g., outcrossing
taxa may set fewer seed from self- compared to outcross pollinations, whereas
crosstype may have little effect in selfing taxa), we estimated the RP of seed set in
generation three using three methods: (1) seed number from outcrossed flowers, (2)
seed number from selfed flowers, and (3) seed number from outcross pollinations in

67
outcrossing taxa and seed number from self-pollinations in selfing taxa. We did not
evaluate RP for seed weight in generation two because it was highly positively
correlated with seed number across inbred and outbred families in all taxa (Pearson
product moment correlation r = 0.76 – 0.93). Likewise, we did not evaluate the RP for
plant biomass because it was highly positively correlated with flower number in
generation three (Pearson product moment correlation r = 0.61 – 0.94).
Finally, we compared the mean number of days to germination, first flowering,
and senescence between inbred and outbred half-siblings to determine whether
inbreeding consistently advanced or delayed plant phenology.
Estimation of cumulative fitness
We estimated lifetime fitness in two ways (Figure 3.2). First, cumulative
fitness was calculated as the product of germination rate * survival * flower number *
seed set (generation 3, outcrosses) (method 1). However, because hand-pollinations
were only performed during generation three on a subset of 12 families per population,
fewer than half of all families (77 of 176) could be used in this estimate. We therefore
calculated a second measure of cumulative fitness for each family as the product of
seed set (generation 2) * germination rate * survival * flower number (method 2). Our
second estimate of cumulative fitness included data for all 176 families.
Figure 3.2. Components of fitness included in the two estimates of cumulative fitness.
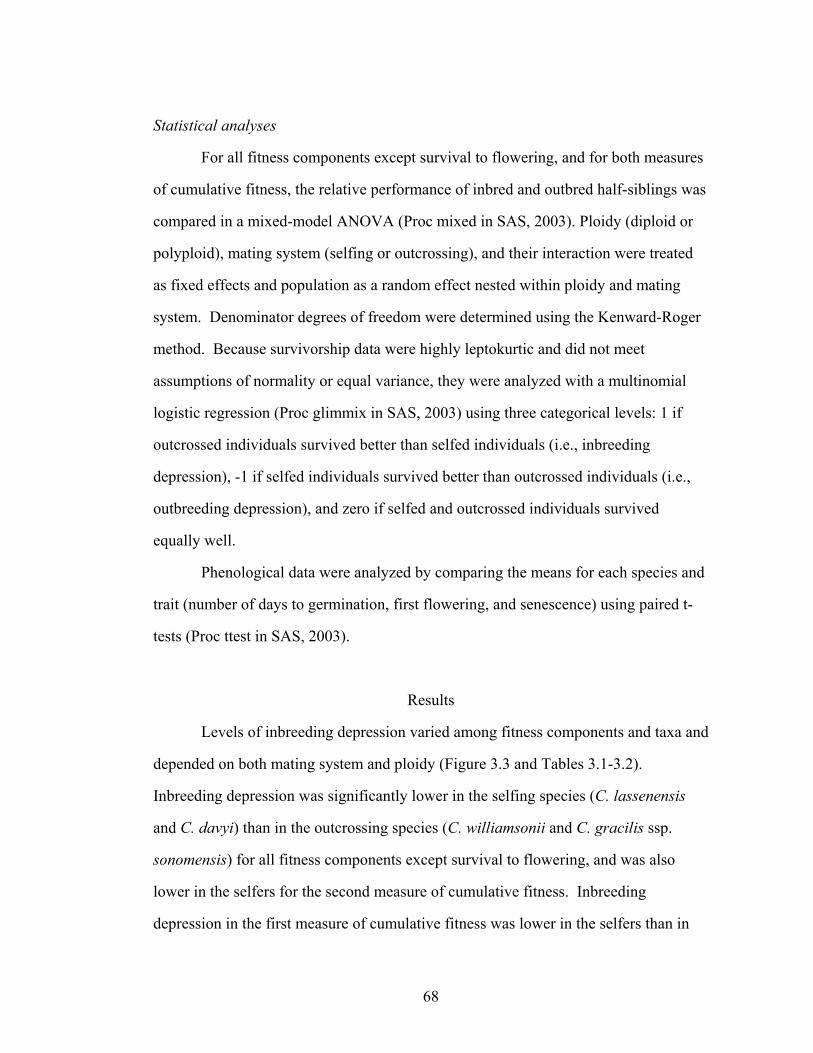
68
Statistical analyses
For all fitness components except survival to flowering, and for both measures
of cumulative fitness, the relative performance of inbred and outbred half-siblings was
compared in a mixed-model ANOVA (Proc mixed in SAS, 2003). Ploidy (diploid or
polyploid), mating system (selfing or outcrossing), and their interaction were treated
as fixed effects and population as a random effect nested within ploidy and mating
system. Denominator degrees of freedom were determined using the Kenward-Roger
method. Because survivorship data were highly leptokurtic and did not meet
assumptions of normality or equal variance, they were analyzed with a multinomial
logistic regression (Proc glimmix in SAS, 2003) using three categorical levels: 1 if
outcrossed individuals survived better than selfed individuals (i.e., inbreeding
depression), -1 if selfed individuals survived better than outcrossed individuals (i.e.,
outbreeding depression), and zero if selfed and outcrossed individuals survived
equally well.
Phenological data were analyzed by comparing the means for each species and
trait (number of days to germination, first flowering, and senescence) using paired t-
tests (Proc ttest in SAS, 2003).
Results
Levels of inbreeding depression varied among fitness components and taxa and
depended on both mating system and ploidy (Figure 3.3 and Tables 3.1-3.2).
Inbreeding depression was significantly lower in the selfing species (C. lassenensis
and C. davyi) than in the outcrossing species (C. williamsonii and C. gracilis ssp.
sonomensis) for all fitness components except survival to flowering, and was also
lower in the selfers for the second measure of cumulative fitness. Inbreeding
depression in the first measure of cumulative fitness was lower in the selfers than in
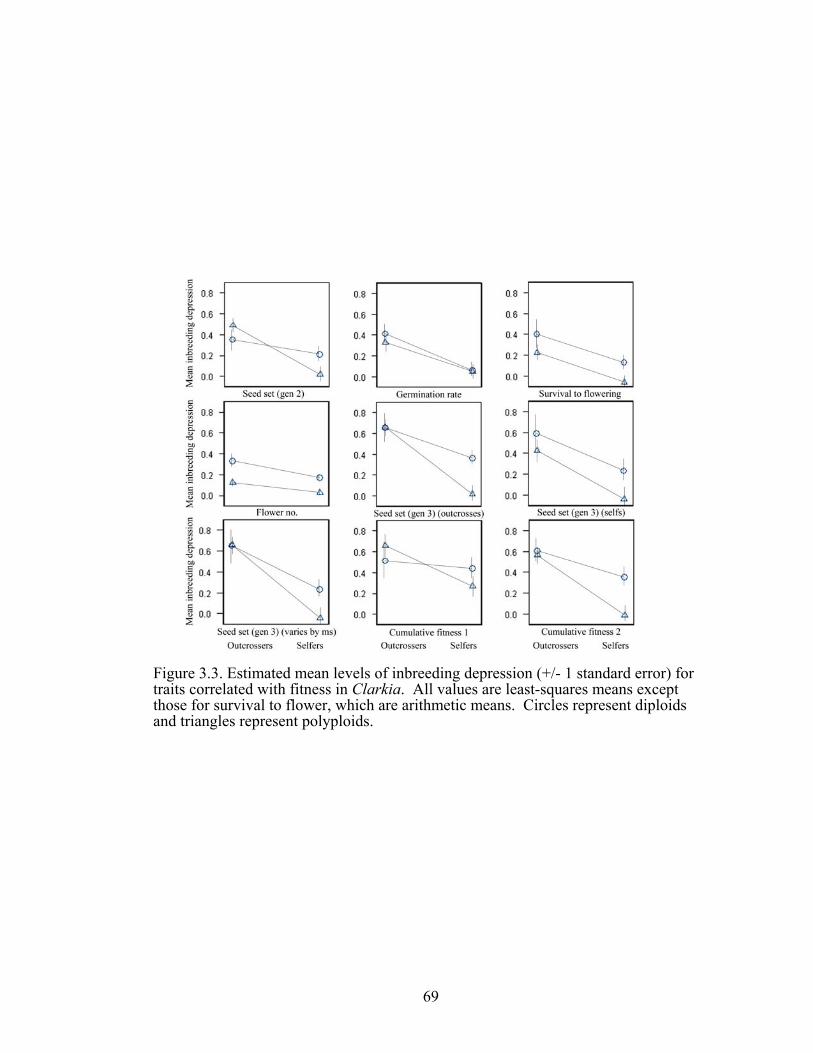
69
Figure 3.3. Estimated mean levels of inbreeding depression (+/- 1 standard error) for traits correlated with fitness in Clarkia. All values are least-squares means except those for survival to flower, which are arithmetic means. Circles represent diploids and triangles represent polyploids.
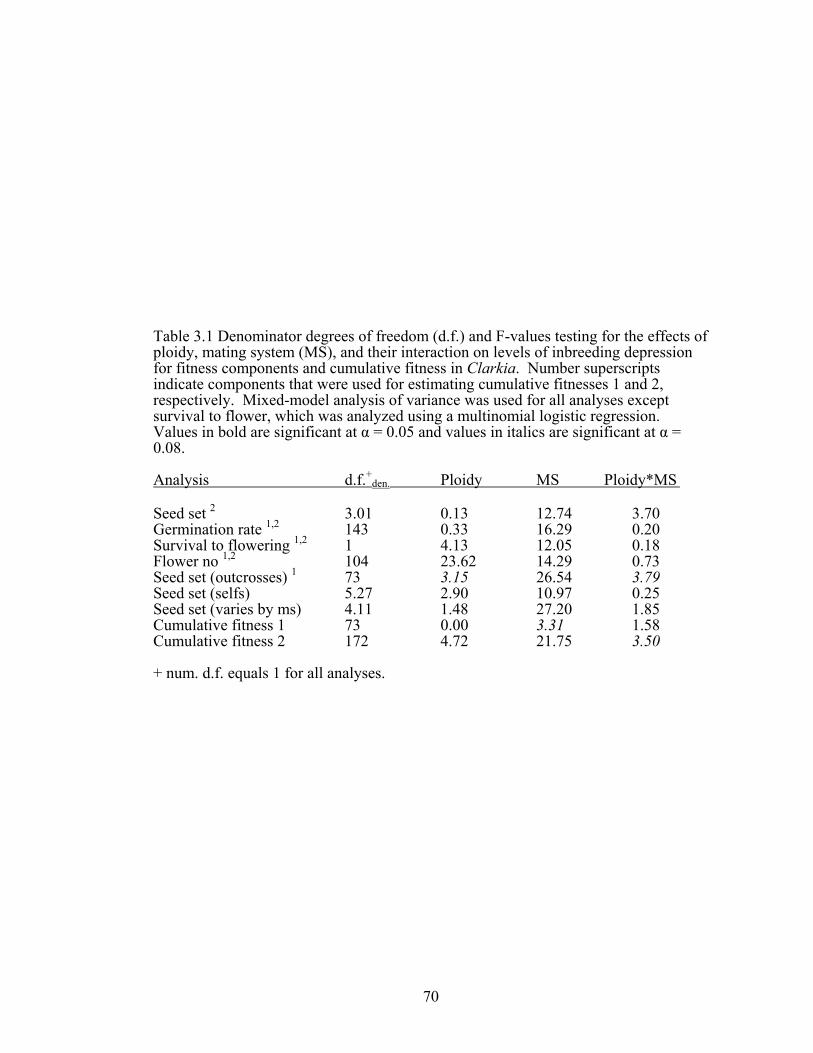
70
Table 3.1 Denominator degrees of freedom (d.f.) and F-values testing for the effects of ploidy, mating system (MS), and their interaction on levels of inbreeding depression for fitness components and cumulative fitness in Clarkia. Number superscripts indicate components that were used for estimating cumulative fitnesses 1 and 2, respectively. Mixed-model analysis of variance was used for all analyses except survival to flower, which was analyzed using a multinomial logistic regression. Values in bold are significant at α = 0.05 and values in italics are significant at α = 0.08. Analysis d.f.+den. Ploidy MS Ploidy*MS Seed set 2 3.01 0.13 12.74 3.70 Germination rate 1,2 143 0.33 16.29 0.20 Survival to flowering 1,2 1 4.13 12.05 0.18 Flower no 1,2 104 23.62 14.29 0.73 Seed set (outcrosses) 1 73 3.15 26.54 3.79 Seed set (selfs) 5.27 2.90 10.97 0.25 Seed set (varies by ms) 4.11 1.48 27.20 1.85 Cumulative fitness 1 73 0.00 3.31 1.58 Cumulative fitness 2 172 4.72 21.75 3.50 + num. d.f. equals 1 for all analyses.
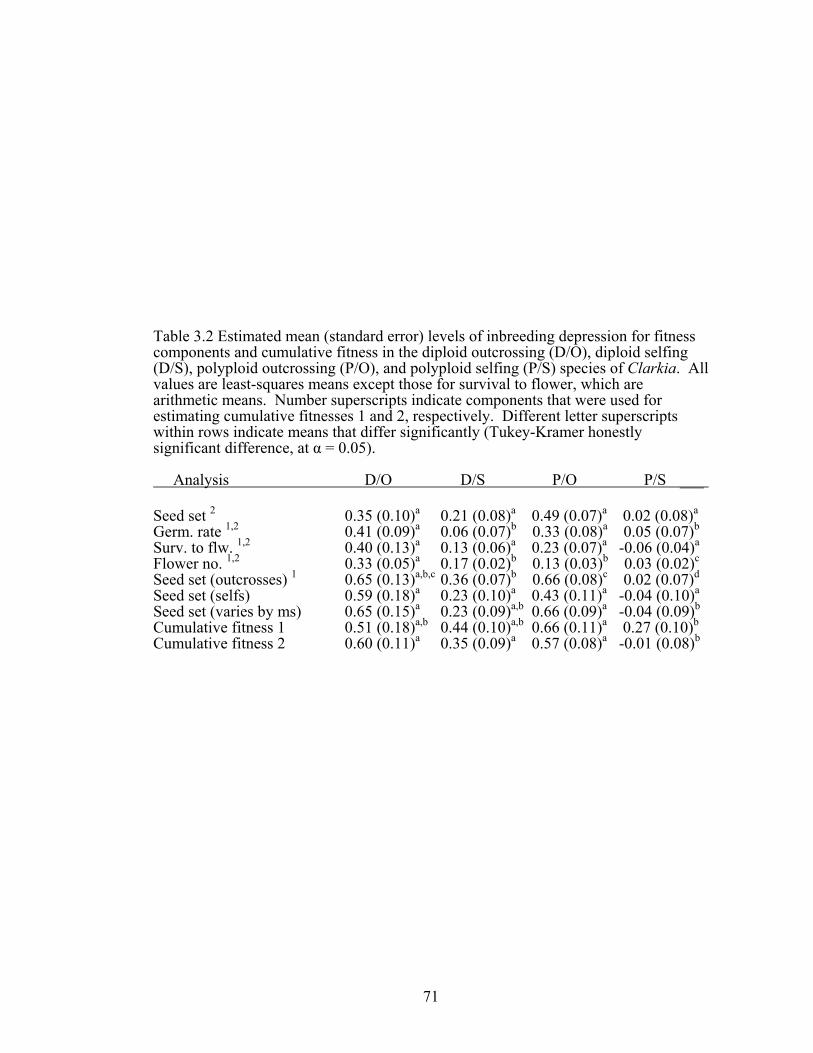
71
Table 3.2 Estimated mean (standard error) levels of inbreeding depression for fitness components and cumulative fitness in the diploid outcrossing (D/O), diploid selfing (D/S), polyploid outcrossing (P/O), and polyploid selfing (P/S) species of Clarkia. All values are least-squares means except those for survival to flower, which are arithmetic means. Number superscripts indicate components that were used for estimating cumulative fitnesses 1 and 2, respectively. Different letter superscripts within rows indicate means that differ significantly (Tukey-Kramer honestly significant difference, at α = 0.05).
Analysis D/O D/S P/O P/S ___ Seed set 2 0.35 (0.10)a 0.21 (0.08)a 0.49 (0.07)a 0.02 (0.08)a
Germ. rate 1,2 0.41 (0.09)a 0.06 (0.07)b 0.33 (0.08)a 0.05 (0.07)b
Surv. to flw. 1,2 0.40 (0.13)a 0.13 (0.06)a 0.23 (0.07)a -0.06 (0.04)a
Flower no. 1,2 0.33 (0.05)a 0.17 (0.02)b 0.13 (0.03)b 0.03 (0.02)c
Seed set (outcrosses) 1 0.65 (0.13)a,b,c 0.36 (0.07)b 0.66 (0.08)c 0.02 (0.07)d
Seed set (selfs) 0.59 (0.18)a 0.23 (0.10)a 0.43 (0.11)a -0.04 (0.10)a Seed set (varies by ms) 0.65 (0.15)a 0.23 (0.09)a,b 0.66 (0.09)a -0.04 (0.09)b
Cumulative fitness 1 0.51 (0.18)a,b 0.44 (0.10)a,b 0.66 (0.11)a 0.27 (0.10)b
Cumulative fitness 2 0.60 (0.11)a 0.35 (0.09)a 0.57 (0.08)a -0.01 (0.08)b

72
the outcrossers but the difference only approached statistical significance (P < 0.08,
Table 3.1). Similarly, inbreeding depression was generally lower for the polyploid
species (C. davyi and C. gracilis ssp. sonomensis) than for the diploid species (C.
lassenensis and C. williamsonii), though the difference was statistically significant
only for flower number and the second measure of cumulative fitness, and approached
significance for the number of seeds produced by outcrossed hand-pollinated flowers
(P < 0.08, Table 3.1).
There was no statistically significant interaction between mating system and
ploidy for any fitness measure, although the interaction approached significance for
the number of seeds produced by outcrossed hand-pollinated flowers and the second
measure of cumulative fitness (Table 3.1). However, even in these two cases, the
interaction was not the result of the diploid outcrosser having greater inbreeding
depression than the polyploid outcrosser. Rather, the diploid selfer had greater
inbreeding depression than the polyploid selfer (Figure 3.3).
The number of days to germination was not affected by inbreeding for any of
the species included in this study (Appendix table 3.2). In contrast, inbreeding
affected the timing of flowering and the timing of senescence for some taxa,
depending on the level of ploidy and the mating system of the species in question.
Inbred individuals flowered earlier than non-inbred individuals in the outcrossing
species (C. williamsonii and C. gracilis ssp. sonomensis) but not in the selfing species
(C. lassenensis and C. davyi). Similarly, inbred individuals senesced earlier than non-
inbred individuals in both of the outcrossing species and the diploid selfing species (C.
lassenensis). In contrast, inbred and non-inbred individuals did not differ in the
number of days to senescence in the polyploid selfer (C. davyi).
73
Discussion
Relatively low levels of inbreeding depression are expected among taxa that
regularly self-fertilize because self-fertilization increases genome-wide levels of
homozygosity and results in the purging of deleterious alleles (Darwin 1876; Lande
and Schemske 1985; Husband and Schemske 1996; Charlesworth and Charlesworth
1990; Crnokrak and Barrett 2002; but see Charlesworth et al. 1990; Byers and Waller
1999). Our results support this prediction, as the outcrossing species exhibited
significantly more inbreeding depression than the selfing species for all fitness
components except survival to flowering. Although the relationship between
polyploidy and inbreeding depression is complex and may differ for neo- vs. ancient
polyploids, most studies suggest that polyploids should exhibit less inbreeding
depression than diploids (e.g., Lande and Schemske 1985; Ronfort 1999; but see Otto
and Whitton 2000). Our results provide some limited support for this prediction:
inbreeding depression was generally lower for the polyploid species than for the
diploid species, although the difference was statistically significant only for flower
number and the second measure of cumulative fitness, and approached significance for
the number of seeds produced by outcrossed hand-pollinated flowers.
Self-compatible species that normally reproduce via outcrossing may have
reduced seed set after artificial self-pollination because of cryptic self-incompatibility
(e.g., Jones 1994; Eckert and Allen 1997) and/or early-acting inbreeding depression
(Charlesworth and Charlesworth 1987). Similarly, species that normally reproduce
via self-fertilization may have reduced seed set after artificial outcross pollination
because of outbreeding depression (e.g. Parker 1992). To evaluate differences in seed
production due to interactions between mating system and cross type, we quantified
levels of inbreeding depression using three measures of seed set (seed number from
outcrossed flowers on all taxa, seed number from selfed flowers on all taxa, and seed

74
number from outcross pollinations in outcrossing taxa and self-pollinations in selfing
taxa). All three measures indicate significant effects of mating system on levels of
inbreeding depression for the ability to set seed. In contrast, neither ploidy nor the
interaction between ploidy and mating system are significant for any of the three
analyses (though they both approach significance for the estimate of seed set based on
outcrosses). These results suggest that inbreeding depression for seed set does not
depend on the interaction of mating system and cross type, and that the ability to set
seed is reduced among inbred individuals regardless of how seed set is measured.
Levels of inbreeding depression for survival to flowering were not affected by
ploidy, mating system, or their interaction. Indeed, levels of inbreeding depression for
this trait were not significantly different from zero for most families. It is worth
noting that our measure of survival only includes that portion of ontogeny between
germination and the onset of flowering. It could be that survival is determined earlier
in life (i.e., before and/or during germination), and once an individual successfully
germinates it is likely to survive to flower. To the extent that this is true, a better
estimate of survival might be germination rate. Survival may also have been high in
our study because of the benign (if not optimal) conditions in the greenhouse.
Inbreeding depression can be more severe in natural settings (Jimenez et al. 1994;
Crnokrak and Roff 1999; Armbruster and Reed 2005; but see Armbruster et al. 2000).
Interestingly, the interaction between mating system and ploidy in determining
levels of inbreeding depression was not significant for any of the fitness traits
measured. Further, though the effect of the interaction approached statistical
significance for seed set (outcrossed) and the second measure of cumulative fitness, it
was not because the outcrossing diploid exhibited more inbreeding depression than the
outcrossing polyploid, as predicted by most models that compare inbreeding
depression in diploids and polyploids (e.g., Lande and Schemske 1985; Ronfort 1999).
75
Rather, the selfing diploid exhibited more inbreeding depression than the selfing
polyploid.
Because inbreeding depression may vary among different ontogenetic stages,
(Schemske 1983; Schoen 1983; Charlesworth and Charlesworth 1987; Husband and
Schemske 1995, 1996), the best metric with which to compare the effects of
inbreeding is cumulative fitness. We found that neither ploidy nor mating system (nor
their interaction) significantly affected levels of inbreeding depression for our first
measure of cumulative fitness (though the effect of mating system approached
statistical significance). However, both ploidy and mating system had significant
effects on levels of inbreeding depression for our second measure of cumulative
fitness (and the effect of the interaction between ploidy and mating system approached
significance as well). The different results from the two analyses are probably due to
differences in their sample sizes. Because we measured seed set for only a subset of
all families, our first measure of cumulative fitness was based on a much smaller
sample size than our second (77 families vs. 176 families, respectively).
Though phenology was not affected by inbreeding for any species during the
earliest life stage (days to germination), inbreeding tended to advance the timing of
phenological changes during later life stages (days to first flower and days to
senescence), especially in the two outcrossing species (C. williamsonii and C. gracilis
ssp. sonomensis). Interestingly, these results are generally in conflict with those found
in other studies, where inbreeding resulted in delayed germination and/or flowering
(e.g., Willis 1996; Shaw et al. 1998; Rao et al. 2002; Galloway et al. 2003; Ellmer and
Andersson 2004; Galloway and Etterson 2007). Of the four taxa in this study, the
polyploid selfer (C. davyi) showed no change in phenology in response to inbreeding.
76
Conclusions
Overall, the results presented here suggest that a taxon’s mating system is
more important than ploidy in terms of influencing levels of inbreeding depression.
These results are consistent with expectations in several ways: first, a rich body of
both theoretical and empirical work suggests that a species’ mating system can have
profound effects on levels of inbreeding depression (Lande and Schemske 1985;
Campbell 1986; Charlesworth and Charlesworth 1987; Charlesworth and
Charlesworth 1999; Charlesworth et al. 1990; Lande et al. 1994; Carr and Dudash
1996, 2003). Second, though some studies suggest that polyploids might exhibit less
inbreeding depression than diploids, most empirical and all theoretical studies have
concentrated on expectations of inbreeding depression in autopolyploids (Lande and
Schemske 1985; Husband and Schemske 1997; Ronfort 1999). To date, formal
theoretical explorations of inbreeding depression in allopolyploids do not exist
(Pannell et al. 2004; but see Lande and Schemske 1985), and empirical explorations
have produced conflicting results (e.g., Johnston and Schoen 1996; Rosquist 2001). It
could be that diploids and allopolyploids do not generally differ in regard to
inbreeding depression (Lande and Schemske 1985). In addition, although younger
polyploid taxa may exhibit reduced inbreeding depression relative to diploids, the
opposite may be true of older, more established polyploids (such as those included in
this study). Older polyploids, whose populations are at (or near) mutation-selection
equilibrium, are expected to harbor greater genetic loads than comparable diploids
(Otto and Whitton 2000), and this may lead to higher levels of inbreeding depression
in the former relative to the latter (Ronfort 1999; Pannell et al. 2004). Further, as
diploidization takes place over time, polyploids begin to behave (cytogenetically) as
diploids. The polyploids used in this study are relatively old and may harbor
substantial genetic loads and/or be partially or completely diploidized.
77
Though several studies have demonstrated that both mating systems and ploidy can
influence levels of inbreeding depression (e.g., Carr and Dudash 1996; Husband and
Schemske 1997), many questions remain to be answered. Polyploids are often
categorized as either auto- or allopolyploids, suggesting they contain either multiple
sets of homologous chromosomes (leading to multisomic inheritance patterns), or
multiple sets of nonhomologous chromosomes (leading to disomic inheritance
patterns), respectively. Yet these conditions represent the extremes of what is likely a
continuum, and many polyploids exhibit multisomic inheritance at some loci and
disomic inheritance at others (Sybenga 1969; Grant 1981; Jackson 1982; Jenkins and
Rees 1991; Comai 2000; but see Sybenga 1996); so-called segmental allopolyploids
(Stebbins 1950). To the extent that this is true, models that incorporate variation
among loci in terms of inheritance patterns will be of interest, and empirical studies
that address levels of inbreeding depression in segmental allopolyploids will be of
value. In addition, existing theoretical studies have modeled levels of inbreeding
depression in populations that are at (or near) mutation-selection equilibrium.
However, inbreeding depression in neopolyploids is also of interest because high
levels of self-fertilization might facilitate the initial establishment of polyploid
populations, and levels of inbreeding depression suffered by newly formed polyploids
will influence the evolution of mating systems immediately following genome
duplication. For this reason, models that explore and predict levels of inbreeding
depression in neopolyploids are needed. Given that the majority of plant taxa are
likely to have experienced one or more rounds of genome duplication at some point
during their evolutionary history (Soltis et al. 2003), such studies will continue to
contribute to our understanding of the evolution of plants and their mating systems.
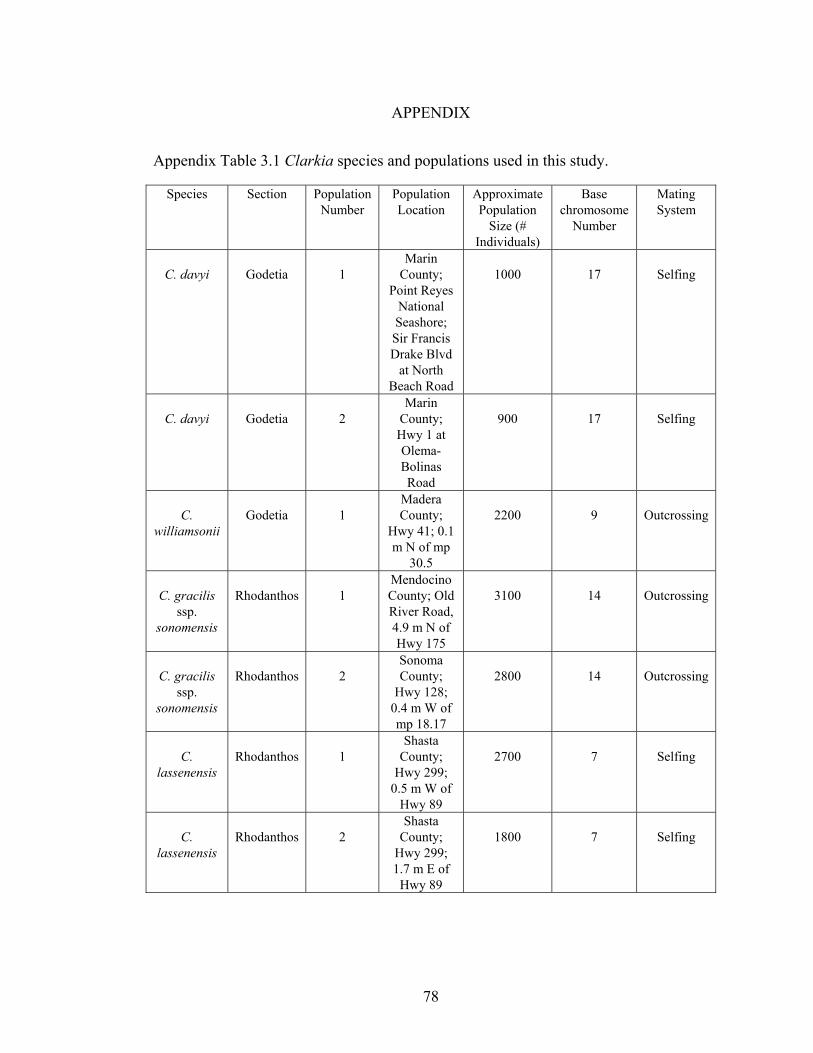
78
APPENDIX
Appendix Table 3.1 Clarkia species and populations used in this study.
Species Section Population Number
Population Location
Approximate Population
Size (# Individuals)
Base chromosome
Number
Mating System
C. davyi
Godetia
1
Marin County;
Point Reyes National Seashore; Sir Francis Drake Blvd
at North Beach Road
1000
17
Selfing
C. davyi
Godetia
2
Marin County; Hwy 1 at Olema-Bolinas Road
900
17
Selfing
C.
williamsonii
Godetia
1
Madera County;
Hwy 41; 0.1 m N of mp
30.5
2200
9
Outcrossing
C. gracilis
ssp. sonomensis
Rhodanthos
1
Mendocino County; Old River Road, 4.9 m N of Hwy 175
3100
14
Outcrossing
C. gracilis
ssp. sonomensis
Rhodanthos
2
Sonoma County;
Hwy 128; 0.4 m W of mp 18.17
2800
14
Outcrossing
C.
lassenensis
Rhodanthos
1
Shasta County;
Hwy 299; 0.5 m W of
Hwy 89
2700
7
Selfing
C.
lassenensis
Rhodanthos
2
Shasta County;
Hwy 299; 1.7 m E of
Hwy 89
1800
7
Selfing
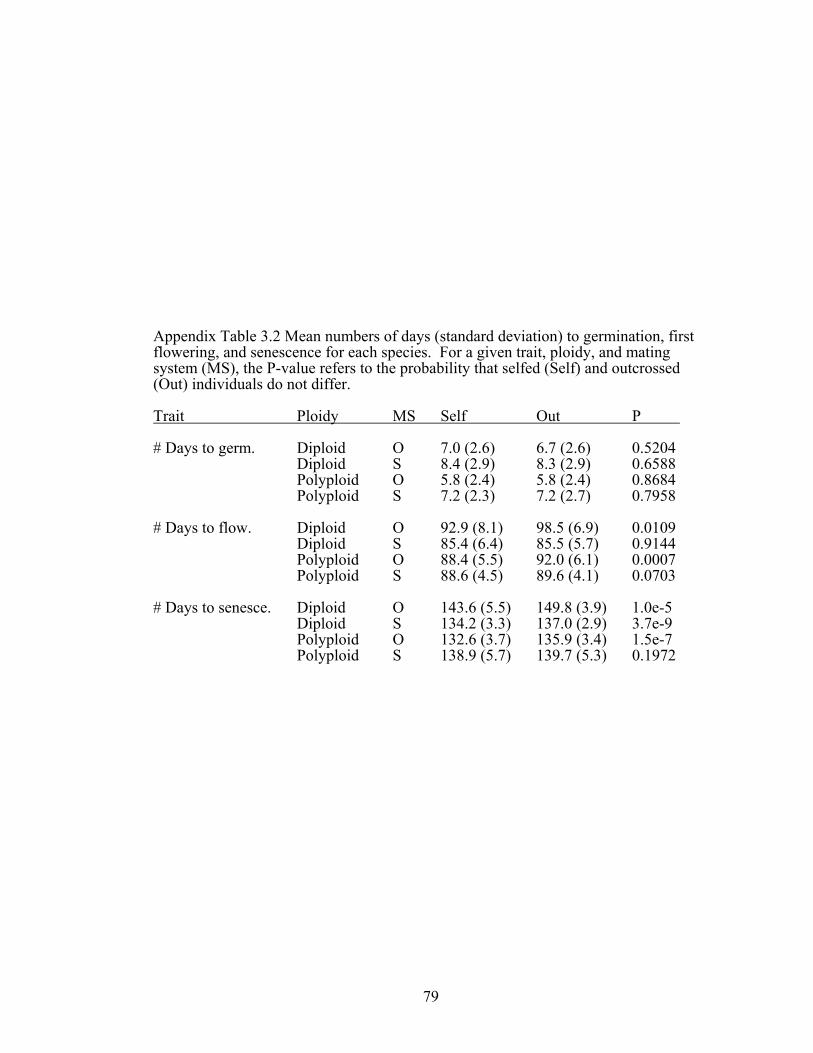
79
Appendix Table 3.2 Mean numbers of days (standard deviation) to germination, first flowering, and senescence for each species. For a given trait, ploidy, and mating system (MS), the P-value refers to the probability that selfed (Self) and outcrossed (Out) individuals do not differ. Trait Ploidy MS Self Out P # Days to germ. Diploid O 7.0 (2.6) 6.7 (2.6) 0.5204 Diploid S 8.4 (2.9) 8.3 (2.9) 0.6588 Polyploid O 5.8 (2.4) 5.8 (2.4) 0.8684 Polyploid S 7.2 (2.3) 7.2 (2.7) 0.7958
# Days to flow. Diploid O 92.9 (8.1) 98.5 (6.9) 0.0109 Diploid S 85.4 (6.4) 85.5 (5.7) 0.9144 Polyploid O 88.4 (5.5) 92.0 (6.1) 0.0007 Polyploid S 88.6 (4.5) 89.6 (4.1) 0.0703
# Days to senesce. Diploid O 143.6 (5.5) 149.8 (3.9) 1.0e-5 Diploid S 134.2 (3.3) 137.0 (2.9) 3.7e-9 Polyploid O 132.6 (3.7) 135.9 (3.4) 1.5e-7 Polyploid S 138.9 (5.7) 139.7 (5.3) 0.1972

80
LITERATURE CITED Agren, J. and D. W. Schemske. 1993. Outcrossing rate and inbreeding depression in
two annual monoecious herbs, Begonia hirsuta and B. semiovata. Evolution 47:125-135.
Allard, R. W. 1999. Principles of Plant Breeding. John Wiley and Sons, Inc., New
York, NY. Armbruster, P., R. A. Hutchinson, and T. Linvell. 2000. Equivalent inbreeding
depression under laboratory and field conditions in a tree-hole-breeding mosquito. Proc. R. Soc. Lond. B Biol. Sci. 267:1939-1946.
Armbruster, P. and D. H. Reed. 2005. Inbreeding depression in benign and stressful
environments. Heredity 95:235-242. Barringer, B. C. 2007. Polyploidy and self-fertilization in flowering plants. Am. J.
Bot. 94:1527-1533. Bennett, J. H. 1976. Expectations for inbreeding depression on self-fertilization of
tetraploids. Biometrics 32:449-452. Byers, D. L. and D. M. Waller. 1999. Do plant populations purge their genetic load?
Effects of population size and mating history on inbreeding depression. Ann. Rev. Ecol. Syst. 30:479-513.
Campbell, R. B. 1986. The interdependence of mating structure and inbreeding
depression. Theor. Popul. Biol. 30:232-244. Carr, D. E. and M. R. Dudash. 1996. Inbreeding depression in two species of Mimulus
(Scrophulariaceae) with contrasting mating systems. Am. J. Bot. 83:586-593. Carr, D. E. and M. R. Dudash. 2003. Recent approaches into the genetic basis of
inbreeding depression in plants. Philos. Trans. R. Soc. Lond. B Biol. Sci. 58:1071-1084.
Charlesworth, B., M. T. Morgan, and D. Charlesworth. 1990. Genetic loads and
estimates of mutation rates in highly inbred plant populations. Nature 347:380-382.
Charlesworth, B. and D. Charlesworth. 1999. The genetic basis of inbreeding
depression. Genet. Res. 74:329-340. Charlesworth, D. and B. Charlesworth. 1987. Inbreeding depression and its
evolutionary consequences. Ann. Rev. Ecol. Syst. 18:237-268. Charlesworth, D. and B. Charlesworth. 1990. Inbreeding depression with heterozygote
advantage and its effect on selection for modifiers changing the outcrossing rate. Evolution 44:870-888.
Comai, L. 2000. Genetic and epigenetic interactions in allopolyploid plants. Plant
Mol. Biol. 43:387-399.
81
Crnokrak, P. and S. C. H. Barrett. 2002. Perspective: Purging the genetic load: A
review of the experimental evidence. Evolution 56:2347-2358. Crnokrak, P. and D. A. Roff. 1999. Inbreeding depression in the wild. Heredity
83:260-270. Darwin, C. 1876. The effects of cross and self-fertilization in the vegetable kingdom.
John Murray, London. Dudash, M. R. and D. E. Carr. 1998. Genetics underlying inbreeding depression in
Mimulus with contrasting mating systems. Nature 393:682-684. Dudash, M. R., D. E. Carr, and C. B. Fenster. 1997. Five generations of enforced
selfing and outcrossing in Mimulus guttatus: inbreeding depression variation at the population and family level. Evolution 51:54-65.
Eckert, C. G. and M. Allen. 1997. Cryptic self-incompatibility in tristylous Decodon
verticillatus (Lythraceae). Am. J. Bot. 84:1391-1397. Ellmer, M. and S. Andersson. 2004. Inbreeding depression in Nigella degenii
(Ranunculaceae): fitness components compared with morphological and phenological characters. Int. J. Plant Sci. 165:1055-1061.
Galloway, L. F. and J. R. Etterson. 2007. Inbreeding depression in an autotetraploid
herb: a three generation field study. New Phytol. 173:383-392. Galloway, L. F., J. R. Etterson, and J. L. Hamrick. 2003. Outcrossing rate and
inbreeding depression in the herbaceous autotetraploid, Campanula Americana. Heredity 90:308-315.
Goldblatt, P. 1980. Polyploidy in angiosperms: Monocotyledons. In Lewis, W. H.
(ed.) Polyploidy: Biological relevance. Plenum Press, New York. Gottlieb, L. D. and V. S. Ford. 1996. Phylogenetic relationships among the sections of
Clarkia (Onagraceae) inferred from the nucleotide sequences of PgiC. Syst. Bot. 21:45-62.
Grant, V. 1956. The influence of breeding habit on the outcome of natural
hybridization in plants. Am. Nat. 90:319-322. Grant, V. 1963. The origin of adaptations. Columbia University Press, New York. Grant, V. 1981. Plant Speciation. Columbia University Press, New York, NY. Haldane, J. B. S. 1930. Theoretical genetics of autopolyploids. J. Genet. 22:359-372. Hamilton, W. D. 1966. The moulding of senescence by natural selection. J. Theor.
Biol. 12:12-45. Harlan, J. R. and J. M. J. deWet. 1975. On O. Winge and a prayer: the origins of
polyploidy. Bot. Rev. 41:361-389.
82
Hickman, J. C. (ed.). 1993. The Jepson Manual: Higher plants of California.
University of California Press. Berkeley, CA. Holtsford, T. P. and N. C. Ellstrand. 1989. Variation in outcrossing rate and
population genetic structure of Clarkia tembloriensis (Onagraceae). Theor. Appl. Genet. 78:480-488.
Holtsford, T. P. and N. C. Ellstrand. 1990. Inbreeding effects in Clarkia tembloriensis
(Onagraceae) populations with different natural outcrossing rates. Evolution 44:2031-2046.
Husband, B. C. and D. W. Schemske. 1995. Magnitude and timing of inbreeding
depression in a diploid population of Epilobium angustifolium (Onagraceae). Heredity 75:206-215.
Husband, B. C. and D. W. Schemske. 1996. Evolution of the magnitude and timing of
inbreeding depression in plants. Evolution 50:54-70. Husband, B. C. and D. W. Schemske. 1997. The effect of inbreeding in diploid and
tetraploid populations of Epilobium angustifolium (Onagraceae): Implications for the genetic basis of inbreeding depression. Evolution 51:737-746.
Jackson, R. C. 1982. Polyploidy and diploidy: new perspectives on chromosome
pairing and its evolutionary implications. Am. J. Bot 69:1512-1523. Jenkins, G. and H. Rees. 1991. Strategies of bivalent formation in allopolyploid plants.
Proc. R. Soc. Lond. B Biol. Sci. 243:209-214. Jimenez, J. A., K. A. Hughes, G. Alaks, L. Graham, and R. C. Lacy. 1994. An
experimental study of inbreeding depression in a natural habitat. Science 266:271-273.
Johnston, M. O. and D. J. Schoen. 1994. On the measurement of inbreeding
depression. Evolution 48:1735-1741. Johnston, M. O. and D. J. Schoen. 1996. Correlated Evolution of self-fertilization and
inbreeding depression: An experimental study of nine populations of Amsinckia (Boraginaceae). Evolution 50:1478-1491.
Jones, K. N. 1994. Nonrandom mating in Clarkia gracilis (Onagraceae): a case of
cryptic self-incompatibility. Am. J. Bot. 81:195-198. Kashkush, K., M. Feldman, and A. A. Levy. 2002. Gene loss, silencing, and activation
in a newly-synthesized wheat allotetraploid. Genetics 160:1651-1659. Lande, R. and D. W. Schemske. 1985. The evolution of self-fertilization and
inbreeding depression in plants. I. Genetic models. Evolution 39:24-40. Lande, R., D. W. Schemske, and S. T. Schultz. 1994. High inbreeding depression,
selective interference among loci, and the threshold selfing rate for purging recessive lethal mutations. Evolution 48:965-978.
83
Lewis, H. and M. E. Lewis. 1955. The genus Clarkia. University of California Press,
Berkeley, California. Mable, B. K. 2004. Polyploidy and self-compatibility: Is there an association? New
Phytol. 162:803-811. MacSwain, J. W., P. H. Raven, and R. W. Thorp. 1973. Comparative behavior of bees
and Onagraceae. IV. Clarkia bees of the western United States. Univ. Calif. Publ. Entomol. 70:1-80.
Masuyama, S. and Y. Watano. 1990. Trends for inbreeding in polyploid pteridophytes.
Plant Species Biol. 5:13-18. Masterson, J. 1994. Stomatal size in fossil plants: Evidence for polyploidy in majority
of angiosperms. Science 264:421-423. Moeller, D. A. 2005. Pollinator community structure and sources of spatial variation
in plant-pollinator interactions in Clarkia xantiana ssp. xantiana. Oecologia 142:28-37.
Otto, S. P. and J. Whitton. 2000. Polyploid incidence and evolution. Annu. Rev.
Genet. 34:401-437. Pannell, J. R., D. J. Obbard, and R. J. A. Buggs. 2004. Polyploidy and the sexual
system: What can we learn from Mercurialis annua? Biol. J. Linn. Soc. 82:547-560.
Parker, M. A. 1992. Outbreeding depression in a selfing annual. Evolution 46:837-
841. Parsons, P. A. 1959. Some problems in inbreeding and random mating in tetrasomics.
Agron. J. 51:465-467. Rao, G., B. Widen, and S. Andersson. 2002. Patterns of inbreeding depression in a
population of Brassica cretica (Brassicaceae): evidence from family-level analysis. Biol. J. Linn. Soc. 76:317:325.
Rausch, J. H. and M. T. Morgan. 2005. The effect of self-fertilization, inbreeding
depression, and population size on autopolyploid establishment. Evolution 59:1867-1875.
Ronfort, J. 1999. The mutation load under tetrasomic inheritance and its consequences
for the evolution of the selfing rate in autotetraploid species. Genet. Res. 74:31-42.
Rosquist, G. 2001. Reproductive biology in diploid Anthericum ramosum and
tetraploid A. liliago (Anthericaceae). Oikos 92:143-152. Runions, C. J. and M. A. Geber. 2000. Evolution of the self-pollinating flower in
Clarkia xantiana (Onagraceae). I. Size and development of floral organs. Am. J. Bot. 87:1439-1451.
84
SAS Institute. 2003. Statistical analysis software, version 9.1. Cary, NC, USA. Schemske, D. W. 1983. Breeding system and habitat effects on fitness components in
three neotropical Costus (Zingiberaceae). Evolution 37:523-539. Schoen, D. J. 1983. Relative fitnesses of selfed and outcrossed progeny in Gilia
achilleifolia (Polemoniaceae). Evolution 37:292-301. Shaw, R. G., D. L. Byers, and F. H. Shaw. 1998. Genetic components of variation in
Nemophila menziesii undergoing inbreeding: morphology and flowering time. Genetics 150:1649-1661.
Small, E., I. J. Bassett, C. W. Crompton, and H. Lewis. 1971. Pollen phylogeny in
Clarkia. Taxon 20:739-746. Soltis, D. E. and P. S. Soltis. 1987. Polyploidy and breeding systems in homosporous
pteridophyta: A reevaluation. Am. Nat. 130:219-232. Soltis, D. E., P. S. Soltis, and J. A. Tate. 2003. Advances in the study of polyploidy
since Plant speciation. New Phytol. 161:173-191. Soltis, P. S. and D. E. Soltis. 1990. Evolution of inbreeding and outcrossing in ferns
and fern-allies. Plant Species Biol. 5:1-11. Soltis, P. S. and D. E. Soltis. 2000. The role of genetic and genomic attributes in the
success of polyploids. Proc. Natl. Acad. Sci. U. S. A. 97:7051-7057. Song, K., P. Lu, K. Tang, and T. C. Osborn. 1995. Rapid genome change in synthetic
polyploids of Brassica and its implications for polyploid evolution. Proc. Natl. Acad. Sci. U. S. A. 92:7719-7723.
Stebbins, G. L. 1938. Cytological characteristics associated with the different growth
habits in the dicotyledons. Am. J. Bot. 25:189-198. Stebbins, G. L. 1950. Variation and evolution in plants. Columbia University Press,
New York. Sybenga, J. 1969. Allopolyploidization of autopolyploids I. possibilities and
limitations. Euphytica 18:355-371. Sybenga, J. 1996. Chromosome pairing affinity and quadrivalent formation in
polyploids: do segmental allopolyploids exist? Genome 39:1176-1184. Vasek, F. C. and J. Harding. 1976. Outcrossing in natural populations. V. Analysis of
outcrossing, inbreeding depression, and selection in Clarkia exilis and Clarkia tembloriensis. Evolution 30:403-411.
Williams, G. C. 1957. Pleiotropy, natural selection, and the evolution of senescence.
Evolution 11:398-411.
85
Willis, J. H. 1996. Measures of phenotypic selection are biased by partial inbreeding. Evolution 50:1501-1511.
Willis, J. H. 1999. The role of genes of large effect on inbreeding depression in
Mimulus guttatus. Evolution 53:1678-1691. Wolfe, K. H. 2001. Yesterday’s polyploids and the mystery of diploidization. Nat.
Rev. Genet. 2:333-341. Wright, S. 1938. The distribution of gene frequencies in populations of polyploids.
Proc. Natl. Acad. Sci. U. S. A. 24:372-377.