Embed Size (px)
Citation preview

Pergamon Prog. P&m. Sci., Vol. 21, 89 -149, 1996
Copyright Q 1996 Elsevier Science Ltd Printed in Great Britain. All rights reserved.
0079%6700/96 $32.00
0079-6700(95)00018-6
POLYMER SOLUTIONS IN CONFINING GEOMETRIES
IWAO TERAOKA
Department of Chemistry, Polytechnic University, Six MetroTech Center, Brooklyn, NY 11201. USA
Abbreviations - a monomer size, b segment length, b, root of J,(x) = 0, B baseline in the autocorre- lation function, Bi ith virial coefficient, c concentration (number density), c, concentration of cavities, ceq equilibrium concentration, ci polymer concentration in chamber i (i= 1,2), c, concentration of obstacles, cE polymer concentration exterior to a porous medium, cr polymer concentration in the interior of a porous medium, C* overlap concentration, c; overlap concentration in the interior of a porous medium, AC concentration difference, d period of the photoexcited pattern, db width of a bottleneck, d, side of a cubic cavity, & thickness of a membrane, dp pore diameter, d, spectral dimension, Dapp app arent diffusion coefficient, D, mutual diffusion coefficient, DmE mutual diffusion coefficient exterior to the pore, D,, mutual diffusion coefficient in the interior of the porous medium , D, tracer diffusion coefficient, DtE tracer diffusion coefficient exterior to the pore, D,, tracer diffusion coefficient in the interior of the porous medium, DE diffusion coefficient exterior to the pore, D, diffusion coefficient in the interior of the porous medium, DM membrane diffusion coefficient, E complete elliptic integral of the second kind, f universal function, fh fraction of a chain in the bottleneck, f, fraction of a chain in the cavity& number of arms of a star-shaped chain, fc coherence factor,fa autocorrelation function for scattering by the exterior solution,fi autocorrelation function for scattering by the interior of a porous medium, fCaSaSSa function for Casassa’s partition coefficient, F free energy of confinement per chain, K’ lag coefficient, E;;’ drag coefficient, g, autocorrelation function of the electric field of scattered light, g, autocorrelation function of light scattering intensity, G, probability density for a Gaussian chain, h function that gives the mean square end-to-end distance of a wormlike chain, h, monomer size in the pearl necklace model, II, hindrance factor for convection, Z-Id hindrance factor for diffusion, H,, Hamiltonian of the n chain system, I interaction, i universal integer, j universal integer, J flux, J,, Bessel function of the first kind and zeroth order, k universal variable, k, magnitude of the scattering vector, kmE concentration coefficient for &E, k,, concentration coefficient for DmI, kpi concentration coefficient for the partition coefficient, ktE concentration coefficient for DtE, k,, concentration coefficient for D,,, kB Boltzmann constant, kR concentration coefficient for the retention time, K partition coefficient, I& partition coefficient in the dilute solution limit, K0 partition coefficient of component p (,0 = H,L), K complete elliptic integral of the first kind, 1 contour of a flexible chain, 1, contour of a subchain (i= 1,2), /d deflection length, L length of a rodlike molecule, L, contour length, L, persistence length, LN length of a segment of the cylindrical cavity, m universal integer, m, cutoff for m, M molecular weight, M, number-average molecular weight, h4, weight-average molecular weight, II universal integer, ~1, refractive index of the solvent, N degree of polymerization, N, degree of polymerization for a short chain, Nd number of monomers in a subchain or a blob, N,, total number of pores, N, Avogadro’s number, Nfi degree of polymerization of component p (p = H,L), p probability, pa purity of component p (0 = H,L), P reduced osmotic pressure, r universal variable, r universal variable with three components, {rl} configuration of a polymer chain, R, radius of gyration, RF’ radius of gyration in the dilute limit, R$ radius of gyration of component /3 in the dilute limit, Rp pore radius, R, radius of a sphere, Stokes radius, R, end-to-end distance, RH hydrodynamic radius, RI, extension of a chain along the axis of a cylindrical pore, {R,} internal configuration of a polymer chain, s average density of planes, S entropy, SE configurational entropy of a chain in the exterior solution, S, configurational entropy of a chain in the interior solution, AS entropy change, AS,, entropy change if the whole chain is contained in the bottleneck, AS, entropy change if the whole
89

90 IWAO TERAOKA
chain is contained in the cavity, T absolute temperature, t time, universal variable, tb thickness of a bottleneck, td thickness of the depletion layer, tR retention time, tRO retention time for the zero concentration limit in the injected sample, u solute to pore size ratio, U, single chain potential, U,a single chain potential for the exterior solution, U,r single chain potential for the interior solution, U, binary interaction, U, potential for the chain end, u excluded volume interaction, V, solvent velocity, I’ volume, V, volume of a sphere, Vj volume of chamber j (j= 1, 2) VE exterior volume, V, interior volume, w weight concentration, w! weight concentration of component p, W,,,, weight concentration of matrix polymer in the exterior solution, wa weight concentration in the exterior solution, w, weight concentration in the interior solution, WE number of configurations available to a chain in the exterior solution, WI number of configurations available to a chain in the interior solution, X reduced concentration, Xa reduced concentration in the exterior solution, Xi reduced concentration in the interior solution, x universal variable, z universal variable, z, average number of cavities that contain a part of the chain, Z, partition function of n chain system, Z, single chain partition function, Z,, partition function of a single chain in the exterior solution, Zii partition function of a single chain in the pore, o = L/2R,, a, = 3.49; numerical coefficient, p component of a bimodal mixture of polymer, I decay rate, S universal variable, E numerical, n5 solvent viscosity, 8 angle, X activity, A,, wavelength, A, half of the reciprocal of persistence length of a tube, p chemical potential, pLg chemical potential of a reference state, puE chemical potential in the exterior, pi chemical potential in the interior, 6 correlation length, Er correlation length in the pore, z grand partition function, II osmotic pressure, oefi adjustable parameter for the chain dimension, 7 reciprocal of the decay constant, 7,s effective diffusion time, p density profile, ps porosity, 4 volume fraction, lint internal filling fraction, q& volume fraction of solutes in the exterior solution, $q volume fraction of solutes in the interior solution, 4 universal function, x0 intrinsic conductivity
CONTENTS
1. Introduction 91 2. Porous materials 95 3. Statics of geometrical confinement 97
3.1. 3.2.
3.3.
3.4
Statistical mechanics of confinement 97
Dilute solutions 98 3.2.1. Partition coefficient 98 3.2.2. Theory of the partition coefficient in a well-defined geometry 99
3.2.2.1. Hard sphere 99 3.2.2.2. Gaussian chain 101
3.2.2.3. Rodlike molecules 105 3.2.2.4. Excluded-volume chain 105
3.2.2.5. Semiflexible chain 108
3.2.2.6. Freely jointed chain 110 3.2.2.7. Other models 110
3.2.3. Partitioning in a random porous medium 110
3.2.4. Experiments 112 3.2.5. Simulations 113 Concentration effect on the partitioning 115
3.3.1. Theory 115 3.3.2. Simulations 117
3.3.2.1. Hard sphere 117
3.3.2.2. Linear chain 118
Partitioning of semidilute solutions 119 3.4.1. Theory 120
3.4.1.1. Scaling theory 120 3.4.1.2. Weak to strong penetration transition of short chains 121
3.4.2. Experiments 123

POLYMER SOLUTIONS IN CONFINING GEOMETRIES 91
3.5. Partitioning of a polydisperse polymer 3.5.1. Theory 3.5.2. Experiments
4. Dynamics of polymer chains in confining geometries 4.1. Theory
4.1.1. Membrane transport 4.1.2. Macroscopic diffusion in a network-structured porous medium
4.2. Diffusion experiments 4.2.1. Membrane transport 4.2.2. Transient diffusion 4.2.3. Dynamic light scattering
4.2.3.1. Scattering vector dependence 4.2.3.2. Molecular weight dependence 4.2.3.3. Chain architecture dependence 4.2.3.4. Mutual diffusion in the pore 4.2.3.5. Tracer diffusion in the pore 4.2.3.6. Short-time diffusion
4.2.4. Other experimental techniques 4.2.5. Simulations
5. Concluding remarks References
124 125 128 129 129 129 132 134 134 137 137 139 139 140 142 143 144 145 145 146 147
1. INTRODUCTION
Various structures naturally occur in all bulk polymer and polymer solution sys- tems. It is not an exaggeration to say that a wealth of structures in those systems has motivated prominent scientists to pursue their interest in polymer science. An isolated, solvated linear polymer chain has its own dimension that changes as a function of molecular weight. A correlation length becomes a dominant length scale as the con- centration increases and the polymer chains begin to overlap. Similar correlation lengths can be defined for a mixture of two polymers in a single phase. A polymer blend develops another characteristic size as it separates into two phases in either a spinodal decomposition or nucleation-growth process. The last decade has literally seen a surge in research activities on the structure formation in diblock copolymer systems that exhibit micro-phase separation.’
Physical properties of various polymer systems have been successfully described in terms of geometry, at least in the crudest approximation. An isolated polymer chain in a dilute solution is often replaced by a geometrical object of a flexible string. A variety of microstructures created in micro-phase separated diblock copolymers minimize the area of contact between the two microdomains, each consisting of a nearly pure block. A difference in the atomic sequence appears only as a parameter such as an excluded volume and a Flory-Huggins x parameter.
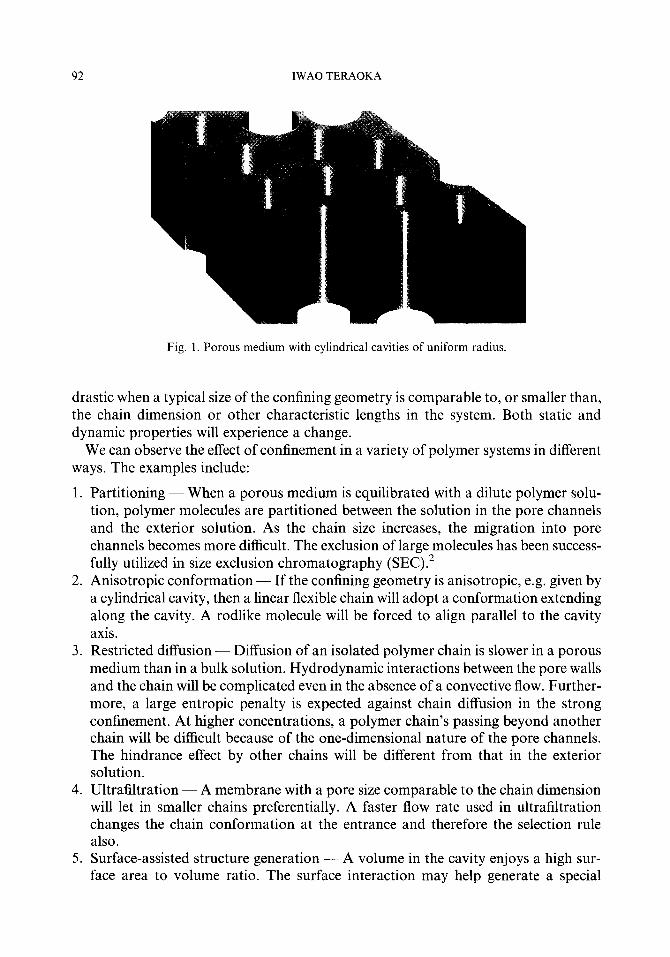
It is then natural to expect a change in these structures and other physical properties when the polymer chain is placed under a geometrical constraint. A confinement is typically provided by porous materials, schematically illustrated in Fig. 1. When a solution of polymer undergoes contact with a porous medium, some polymer chains migrate into the pore channels (see Fig. 2). The environment for the confined chain is very different from that for a free chain in the exterior solution. The change will be
92 IWAO TERAOKA
Fig. 1. Porous medium with cylindrical cavities of uniform radius.
drastic when a typical size of the confining geometry is comparable to, or smaller than, the chain dimension or other characteristic lengths in the system. Both static and dynamic properties will experience a change.
We can observe the effect of confinement in a variety of polymer systems in different ways. The examples include:
1.
2.
3.
4.
5.
Partitioning - When a porous medium is equilibrated with a dilute polymer solu- tion, polymer molecules are partitioned between the solution in the pore channels and the exterior solution. As the chain size increases, the migration into pore channels becomes more difficult. The exclusion of large molecules has been success- fully utilized in size exclusion chromatography (SEC).2 Anisotropic conformation - If the confining geometry is anisotropic, e.g. given by a cylindrical cavity, then a linear flexible chain will adopt a conformation extending along the cavity. A rodlike molecule will be forced to align parallel to the cavity axis. Restricted diffusion - Diffusion of an isolated polymer chain is slower in a porous medium than in a bulk solution. Hydrodynamic interactions between the pore walls and the chain will be complicated even in the absence of a convective flow. Further- more, a large entropic penalty is expected against chain diffusion in the strong confinement. At higher concentrations, a polymer chain’s passing beyond another chain will be difficult because of the one-dimensional nature of the pore channels. The hindrance effect by other chains will be different from that in the exterior solution. Ultrafiltration - A membrane with a pore size comparable to the chain dimension will let in smaller chains preferentially. A faster flow rate used in ultrafiltration changes the chain conformation at the entrance and therefore the selection rule also. Surface-assisted structure generation - A volume in the cavity enjoys a high sur- face area to volume ratio. The surface interaction may help generate a special

Fig.
2.
Por
ous
med
ium
in
con
tact
w
ith
a po
lym
er
solu
tion.
A
pol
ymer
ch
ain
can
ente
r th
e po
re,
alth
ough
th
ere
is a
n en
trop
ic
pena
lty.
In t
he
pore
, th
e ch
ain
adop
ts
an
elon
gate
d co
nfor
mat
ion.

94 IWAO TERAOKA
pattern. It was found that a binary polymer solution, poly(viny1 methyl ether) in water, exhibits various transient structures as it separates into two phases in a capillary tube.334
Investigation of the relationship between a polymer and its confining geometry may enrich our understanding of polymer solutions and other polymer systems in the bulk. We can use a porous medium with an inert surface as a probe to study these systems. For example, the porous medium may be able to gauge the dimension of a polymer chain at high concentrations. In nondilute polymer solutions and melts, a polymer chain is known to contract as a result of shielding of excluded volume.536 Since the confinement is size-specific, the polymer-to-pore relationship will give information on the chain dimension in those systems. Use of a porous medium as a probe is not limited to static phenomena. Studies of chain dynamics in porous materials may provide novel insights into various modes of motion in different time scales in the bulk solution, although technical problems have hindered this type of approach.
This review intends to look at developments in the area of polymer solutions in confining geometries during the past few years. Both statics and dynamics are considered. Older works will be reviewed when necessary. The confining geometries treated here are limited to those with solid pore walls such as controlled pore glasses, sol-gel processed porous materials, and membranes with straight pore channels. Physical gels and chemically cross-linked gels are not included, although in some cases they may provide a similar environment as solid porous materials. The surface of the pore walls is assumed to be inert. Experiments carried out under these conditions will be reviewed. Surface-specific interactions such as adsorption and long-range attractive interactions between polymer and pore walls are not covered.
The focus of this review is on the geometrical effect that restricts the conformational entropy available to an individual polymer chain. The size of confinement is assumed to be sufficiently large so that the confined chain retains a random coil conformation at least locally. The chain loses some of its conformational entropy upon confinement, but there are still many different conformations available to the chain, not just a tram
conformation, for example. The polymer inclusion complex that encloses a single polymer chain of an extended conformation in a straight channel of an atomic pore size7,* is therefore not included in this review. Also excluded is a more macroscopic confinement effect that is manifested in phase separated polymer systems. Accord- ingly, those phenomena mentioned in (5) will not be reviewed.
After a brief introduction into porous materials in Section 2, the following section reviews the static properties of a dilute solution of polymer equilibrated with a porous medium. The concepts and formulations described here are fundamental and are used throughout this review. Section 3 also includes a description of the concentration equilibria of semidilute solutions and a recently proposed application’ of porous materials for the separation of polymers. Section 4 is for the dynamics of polymer molecules confined in a porous medium, especially for various dynamic processes of these molecules explored by the recent application of the dynamic light scattering technique.“,’ ’

POLYMER SOLUTIONS IN CONFINING GEOMETRIES 95
2. POROUS MATERIALS
Many different types of porous materials exist naturally. Rocks and sand stones are porous in nature. This is why oil companies and oil exploration engineering companies have been engaged in intense research activities concerning the characterization of porous materials and the transport of single-phase and two-phase liquids through porous materials. Fractal structures have been hinted at in these porous materials.“.”
Industrial and commercial demands have motivated the development of man-made porous materials. Most of the applications take advantage of the large surface area per mass (zeolites and silica gels). Size-specific rejection by the pore is also widely used in filter applications. More recently, pores with a well-controlled cavity size in a regular arrangement have been manufactured. They are expected to provide a geometrically well-defined confinement of a mesoscopic size. Electroluminescent porous silicon is a negative’ version of the mesoscopic confinement: the solid portion left in the etching provides its electronic states with a confinement effect that otherwise difficult or expensive to obtain. Man-made porous materials, either organic or inorganic, are classified by structure as follows:
1. Straight cylindrical pore - Pore channels are straight and extending across the thickness of a porous membrane with no branching as illustrated in Fig. 1. Track- etched membranes, made by bombardment of cy particles followed by etching to enlarge the pore diameter, are typical of the porous materials that have straight cylindrical pores. The surface density of the pore and the pore size can be changed. The typical pore diameter ranges between 6 nm and 1 pm.14 Polycarbonate and polyester membranes are commercially available. Mica membranes have been widely used for transport experiments. For details of track-etched membranes, see reference15, for example. Membranes made in anodic oxidization have a similar structureI and are used as filters.
Nano-channel array glasses produced by a method similar to the manufacturing of optical fibers are promising porous materials.16 A cylindrical core glass is coated with another type of glass in a hexagonal shape. The glass rods are bundled into a regular hexagon and drawn at elevated temperatures. The hexagons are bundled and drawn again. By repeating this process, the original element becomes thinner. When the desired diameter of the core is reached, the glass rod is sliced and immersed into an etching solution to remove the core glass. The pores thus produced are arranged in a regular hexagonal array and have a circular opening with a uniform pore size (210 nm).
2. Tortuous pore channels - The pores are tortuous across the medium with many junctions and branches. They look like a mazelike network of short segments of a cylindrical pore. The solid phase and the empty space form a bicontinuous structure. Controlled pore glasses, manufactured in spinodal decomposition of a binary or ternary mixture of oxides (e.g. borosilicates) followed by leaching of one of the phases (borate-rich phase), have a relatively narrow distribution of pore diameters. The average pore diameter ranges from 7 to 300 nm. Fig. 3 was regenerated from a micrograph.i7 Silica gels and other gels prepared by sol-gel methods18 are widely used as a dehydrating agent and as active packing materials in

96 IWAO TERAOKA
Fig. 3. Scanning electron micrograph of a controlled pore glass. Reproduced by permission CPG Inc.
liquid chromatography columns that provide a large surface area. Pore sizes larger than 4 nm are available. Aerogels made of silica and polymer have been also made available recently. Manufactured via supercritical state of the solvent, aerogels provide ultra lightweight heat insulation.
3. Three-dimensional array of cavities - The pore structure has a crystallographic regularity with uniform cavities arranged at the three-dimensional lattice points.
Zeolites and other silicates belong to this category. Pore sizes are usually small ( 5 2 nm), but materials with a larger pore sizes are being made available.
4. Random deposit of fibers - Randomly deposited fibers provide a similar environ- ment as the solid pore walls in some circumstances. Glass fiber filters are widely used.
It is customary to characterize the pores in network-structured porous materials by the pore volume, the surface area, and the mean pore diameter.” The pore volume is defined as the total pore volume per unit mass of the solid phase of the porous material and is expressed in cm3 g-t. The surface area is defined, in a similar way, as the total surface area of the pore wall per unit mass of the solid phase and is expressed in m2 g-‘. Gas adsorption/desorption isotherms (BET method) and mercury intru- sion/extrusion are commonly used to obtain the surface area and the pore volume.”

POLYMER SOLUTIONS IN CONFINING GEOMETRIES 91
The former is suitable for small pores and the latter is useful for larger pores. They also provide information on the pore size distribution if we assume cylindrical pores. The experimental techniques and underlying theoretical models are well described in a textbook.” The mean pore diameter can depend slightly on the measurement method employed. Unlike porous materials with straight pore channels without branching, the pore diameter can only be ambiguously defined for the network-structured porous materials. As expected, junctions in the network provide an effectively larger pore size.
Porous materials made of oxides, especially silica, are widely used. The silica surface has a high density of hydroxyl moieties.20 Without appropriate modification, they serve as a strong adsorbent, a property used in normal phase liquid chromatography. As silica gels are standard column packing materials, various techniques to modify their hydroxyl moieties have been well established. Various sililation agents are com- mercially available.21 For statics and dynamics experiments of polymers in organic solvents in porous silica, chlorotrimethylsilane is widely used to substitute -OH with -OSi(CH&. This replacement is known to provide solvated polymers with an inert environment.22
3. STATICS OF GEOMETRICAL CONFINEMENT
3.1. Statistical mechanics of conjinement
When a porous medium with an inert surface is immersed into a solution of polymer, solvent molecules fill the pore channels. Some polymer chains migrate into the pore channels. Eventually, the solution in the interior of the porous medium reaches a concentration equilibrium with the exterior solution. The ratio of the interior polymer concentration cI to the exterior concentration cr is called the partition coefficient K:
K = CI / CE
In this section, we consider the partitioning and other static aspects of solvated poly- mer chains in the interior of a porous medium. It is convenient to treat the solution system in the grand canonical ensemble because the interior and the exterior solutions are open systems. The polymer chains can enter and exit from the confining geometry. Let us denote by {rl}i the contour of the ith polymer chain. The suffix 1 runs along all the monomers on the chain, and rl is the position of the monomer at distance I measured along the contour from the chain end. The configurational part of the Hamiltonian H, of the IZ chain system is written as
z7({rl)l> “‘, lr11~) = C ul (WJ + C u2({rlli, {rl)j)
i=l icj
where Ui({r,}J is the potential for a chain i with configuration {rl}i, and U2({rl}l, {rl}j) is the binary interaction between chains i and j. The interaction is assumed to be pairwise additive. The exclusion by the solid pore wall is included in U, for the YE chain system in the porous medium.
98 IWAO TERAOKA
The configurational part of the grand partition function E of the polymer chains of activity X in volume I/ is given by
4- x A”
Y- c ,Iz* n=o *
where the partition function 2, of the y2 chains is given by
z, = s s . . . d{rJ+W, eXP[-fb({rd1, . . . . {rl>n>/kBT] (4)
where kB is the Boltzmann constant and T the absolute temperature. Integration with respect to {rl} is carried out for all configurations of the chain. The concentration c = <n>/Vwhere < . . . > denotes the ensemble average, is calculated by
1 dins
C=ValnA (5)
separately for the exterior and the interior solutions, but with the same A.
3.2. Dilute solutions
3.2.1. Partition coeficient
When the concentration is low and therefore the binary interaction is negligible, eqn (3) is reduced to
‘= - exp(XZt) Y- (6)
where the partition function of a single chain, Z,, is now
Zt = d{rl) exp[-~t(kHlkJl s
(7)
The partition functions, ZrE and Zrt, are calculated for a chain in the exterior and the interior solutions, respectively. Since X is common to both exterior and interior solu- tions, the partition coefficient K. in the dilute solution limit is given by
K
0 zlE/vE
(8)
where V, and VI are the volumes of the exterior and the interior solution systems. The variable of integration {rl} in eqn (7) can be decomposed into rl and {R,}, where
RI E rl - rl denotes the contour local to each chain. For the exterior solution the single chain potential UIE depends only on the internal variable,
ZIE/VE = WE = d@d exP[-&({&))/‘bTl s
(9)
with &CM) = U’&RJ). S ince UIE is either 0 or cc, eqn (9) gives the number of configurations available to the chain, WE. The configurational entropy SE for a chain in the exterior solution is calculated as SE = kB In WE.

POLYMER SOLUTIONS IN CONFINING GEOMETRIES 99
In the absence of specific surface interactions other than the exclusion by the solid pore walls, rl can be anywhere in the interior volume V,. With UII({r,}) z U,(rJU~,({R,}) (U, = 0 for rl E VI, otherwise oo),
which gives Wi, the number of configurations of a polymer chain in the pore, averaged with respect to the position of the first monomer in Vi. If we define the entropy S, of a chain in the pore by St z kBlnW1, then K0 is expressed as
(11)
where A S = S, - S, is a change in the configurational entropy as the chain is brought into the confining geometry from the exterior bulk solution. Without exception, AS < 0 and therefore, K, < 1.
From eqn (11) we find the following: If a polymer chain is generated in the same way including the random positioning of the first monomer in available space, K0 is equal to the probability for the whole chain to be contained in the pore. This identity has been used to calculate K0 in theories and in computer simulations.
3.2.2. Theory of the partition coeficient in a well-defined geometry
Partition coefficients of isolated molecules have been calculated for various combi- nations of the shapes of the molecule and the confining geometry. The model porous medium considered for the concentration equilibrium has been most often a medium that has straight cylindrical cavities extending across its thickness without branching or crossing, as illustrated in Fig. 1. The confinement by the cylindrical cavity provides a simple boundary condition. The model is also substantiated by the fact that the network-structured porous materials such as controlled pore glasses and silica gels resemble hollow cylinders over a short distance. Cavities with non-circular cross sec- tion have essentially the same geometrical restriction: the difference is in the boundary condition only. In the following we show, for various molecular shapes and chain conformations, the results of the calculations of the partition coefficient mostly for cylindrical pores. Most of the work cited is old, but a comprehensive review is pre- sented here to facilitate an understanding of recent simulation results for the partition- ing and other theoretical estimates. The partitioning is also important in the transport of large molecules through a porous membrane.
3.2.2.1. Hard sphere In the crudest approximation, a polymer chain can be represented by an isotropic,
closed sphere. The partitioning of a hard sphere is very simple. Extension to non-dilute case is easier and can be more rigorously treated than it is for other shapes of mole- cules.
The configuration of a sphere is specified by its center position r. In the pore,

IWAO TERAOKA
Fig. 4. Cross section of a cylindrical pore of radius R,. The lightly shaded area is inaccessible to the center of a sphere of radius R,.
Uit(r) = co if the sphere overlaps with the pore wall. Otherwise U,,(r) = 0. Then,
K0 = k [volume accessible to the center] (12)
The ratio of the volume accessible to the solute to that for the small solvent molecules gives Ko_
The simplest case will be a spherical molecule of radius R, in equilibrium with a straight cylindrical pore of radius R,. In Fig. 4, depicting a cross-section of the pore, the center of mass of the sphere is limited to the unshaded circular area of radius R, - R,, whereas the solvent molecules retain access right next to the pore wall. The parti- tion coefficient is then given by
K. = (RP - R,)‘/R; 03)
for R, < R,, and vanishes for R, > R,. The simple law applies to the confining geometry in other dimensions. For a
POLYMER SOLUTIONS IN CONFINING GEOMETRIES 101
spherical cavity of radius R,, KO = (RP - RJ3/Ri. The partition coefficient of the sphere in a slit separated by 2R, is given by KO = (RP - R,) ,‘Rp.
3.2.2.2. Gaussian chain
A linear chain of radius of gyration R, follows a similar partitioning rule when R, << R,. Substitution of R, by R, gives K, approximately. The behavior of KO for large R, is, however, different, because a linear chain with R, > R, can be deformed to fit into a pore smaller than the chain dimension. Chronologically, the scaling theory was applied23 to the static properties of a confined ideal chain many years later than Casassa obtained the exact formula for the partitioning of a Gaussian chain.‘4 However, we first review the scaling theory.23,25
An ideal chain has a unique conformation in a confining geometry. The conforma- tion is simply folded back by the reflecting boundary at the pore wa11.26 This reflection principle applies only for the confining directions. The positions of monomers along the unconfined directions, such as along the axis of the cylindrical pore, do not experience any changes. As a result, the end-to-end distance decreases only slightly by the confinement. The exception is a cavity such as a spherical pore that restricts the conformation in all directions.
When the ideal chain that consists of N monomers of size TV is confined in a cylin- drical pore of diameter dr, the chain makes contact with the pore wall, dividing itself into subchains between adjacent contacts. The number of monomers Nd on the sub- chain is given by aNAl - dp. The whole chain now consists of N/iv, - N!a/dJ’ of independent subchains. Because there is no quantity with the dimension of energy other than kBT in the system and the relevant quantities are the pore diameter dr, and the chain dimension in the bulk solution UN’!* alone, the free energy F of the confine- ment must be expressed as F = kBTJ’(aN1’2/dp). Since each subchain is independently confined by the pore, F cx N. The functional form off is then obtained as,f(_y) N .x2. Therefore,
F N kBTN(a/dp)* (14)
When a solution containing ideal chains is in contact with the cavity, the partition coefficient KO is given by
In&, = -F/ksT N -N(a/dp)* (15)
The partition coefficient decreases exponentially with the chain length. As found in the derivation above, the scaling relation -In& - N(a/dJ” has nothing
to do with the shape of the cavity or its dimensionality. A spherical cavity and a slit impose the same partitioning rule. Linearity of -In& to N and the exponent -2 for the pore size originate from the equivalence of the ideal chain to a Gaussian process. In contrast, a rigid body in a cavity has a different partitioning rule.
The osmotic pressure II of a solution of a single ideal chain in a spherical cavity of diameter dp is given by 25
n=-dF N/Nd
dV --$-kBTNa2di5NkBTF
P (16)

102 IWAO TERAOKA
which is identical to the pressure of N/Nd non-interacting particles in volume I/. The relation II/ks T N (N/N,)/ V remains unchanged for slits or cylindrical cavities.
The scaling concept can provide rich physics about the confinements that do not depend on the specific geometry. The disadvantage is that it does not give numerical coefficients and the result is applicable only to a very long chain compared with the pore size. In practice, a formula expressed by a well defined function is more helpful.
Casassa24327 obtained an exact formula in 1967 for a linear Gaussian chain in cylin- drical and cubic pores and in a slit. He noted that the trajectory of a Gaussian chain in the bulk solution is equivalent to that of a three-dimensional Wiener process. The probability for the chain of length 1 and with one of its ends at r’ to have the other end in an infinitesimal volume dr at r, G&r, r’; I) dr, is the solution of the diffusion-type equation:
8% _ b ---V2G, al 6
(17)
where b is the segment length. The boundary condition of absorption at the pore wall is equivalent to imposing that the whole chain be contained in the pore. The solution G&r, r’; I) under the boundary condition is integrated over r to yield the probability of the chain with one end at r’ being completely contained in the pore. The result is further integrated with respect to r’ (the starting point is random in the cavity volume Vi) to produce the partition coefficient K,:
VI dr’G,(r, r’; 1) (18)
Thus K0 is equal to the probability for a Wiener process that starts at an arbitrary point in the cavity to survive after a certain time (= chain length) in the absorbing boundary condition. The result is expressed as a function of the ratio of R,, radius of gyration of the chain, to the radius R, of the cylindrical pore:
Ko = fcasassa &/Rp 1 = fcasassa (JhllhlR,) (19)
where the function_&,,,,,,(x) is defined as
.f oasassa(_x) = 4 2 b,2exp(-bkx’) (20) nz=l
with b, (m = 1,2,...) the mth root of the Bessel function of the first kind and the zeroth order, J,(x) = 0. For large R /R , K. E exp(-bf(R,/RJ2), where bl = 2.4048. Since R,
112 -aN , -In& oc N(a/R,)2,g wmch agrees with the scaling result. Casassa’s result, showing that K. is a function of RJR, only, has served for a long time as the only formula available for the exclusion chromatography of flexible chains. It is evident that K, is more sensitive to a Gaussian chain with a longer segment.
For a spherical cavity of radius R,, Casassa calculated K. in a similar way:
K. = -$ F$exp(-ir’m2(Rg/R,)2) m=l
(21)
Again -In& c( N(a/R,)2 in the long chain limit, reproducing the scaling result.

POLYMER SOLUTIONS IN CONFINING GEOMETRIES
A similar calculation for the cavity of a cube of side 2R, yields K,, as
K. = c --$exp(- (~rnR,/2R,)‘) ’ m:odd 1
103
(22)
Following the success, Casassa and Tagami27 extended the calculation of K0 to include a Gaussian star-shaped chain offA arms using
VI dr’G,(c, r'; I)
I (23)
They found that K. is an increasing function offA compared at the same mass of the star polymer, but is a decreasing function offA when R, of the polymer is held con- stant. As a compromise, they proposed to plot K0 as a function of ($!R,)(R,,,;,liR,)*” to produce K0 curves approximately independent of,f*, where Rg,lin is the radius of gyration of a linear chain of the same mass.
Casassa’s formulation allows us to calculate a monomer density profile across the pore cross section. For this purpose, we choose a point r in the pore, grow two independent chains of length Ii and l2 from that point, and collect those chains that did not hit the pore wall. The two end points at rl and r, are distributed with the joint probability density G&r,, r; I,) G&r?, r; 12), where GP satisfies eqn (17) with an appro- priate boundary condition. Since rl and r2 can be anywhere in the cavity, p(r; I,, A) defined by
Ar; 4, ld = s s drl Vl Vl
dr2Gp(r1, r; W,h r; h) (24)
gives the probability for a monomer at r = (x, y, z) to have two subchains of length Ii and l2 contained in the cavity. In a cavity of a slit extending in the x and y directions, the density profile in the z direction (0 <z 5 dp = 2R,), p(z;I,&) = Y-iJd.xfdy p(r;I,&, is a superposition of different wavelengths of density profile:
iexp(-(m211 + n212)n2h/6d~)sin~sin~ (25) P P
At any lengths of I, and 12, the density vanishes at the pore walls. In the long chain limit (/,, l2 > d$b), the ground state (m = n = 1) dominates,23 and p N sin”(nz/d,). The monomer density peaks at the center of the slit and decreases to zero toward the pore walls.
When the chain is not sufficiently long, the monomer density profile will be flat across the slit except for a depletion layer at the pore wall (see Fig. 5). The thickness td of the layer is obtained as follows. The summation in eqn (25) can be truncated when the argument in the ex onential function reaches a certain value, i.e. when m reaches an order of mt = dJ J- lib. The most frequently oscillating term in eqn (25) dominates the density profile near the pore walls. Starting from z = 0, it reaches maximum at z g dp/2m, = m/2. Between m/2 and dp - m/2, p(z) will be more or less flat, collecting contributions from different space frequencies. Thus, td - Jllb - R,. The existence of the depletion layer was verified in computer simulations.28~~30

104 IWAO TERAQKA

POLYMER SOLUTIONS IN CONFINING GEOMETRIES 105
Gaussian chain
Fig. 6. Partition coefficients K,, of a Gaussian chain and a rodlike molecule of radii of gyration R, in a cylindrical pore of radius R,, plotted as a function of R,/R,.
3.2.2.3. Rodlike molecules Mathematically tractable models of confinement are also found in rigid bodies with
simple geometry such as a rodlike molecule trapped in a cavity of simple geometry. Giddings et aL3’ calculated the partition coefficient for a spherocylinder (a cylinder with a hemispherical cap on each end). First they considered a thin rod of length L. When projected onto a plane perpendicular to the axis of the cylindrical cavity, the rod forms a line segment of length LsinB, where 0 is an angle between the cavity axis and the rod. Calculating the area in the circular cross section of the cylindrical pore where the center of the projected line segment is allowed to be contained in the pore and integrating it with respect to 0, they obtained the expression of KO as a function of a = L/2R,:
l-j&K 1 + cX2)E(cr) - (1 - c?)K(a)] (Q 5 1) KO =
1 - & [(l + cX2)E(1/a) + (1 - a’)K(l/a;)](cu 2 1)
(26)
where K(k) and E(k) are the complete elliptic integrals of the first and second kinds, respectively. In the limit of Q >>l, KO = 1/(8a2) = (R,/L)2/2. Fig. 6 compares the partition coefficients K, for a Gaussian chain and a rodlike molecule in a cylindrical pore of radius R,, plotted as a function of RJR,, where R, = L/(2J3) for the rodlike molecule with a uniform mass distribution along its contour. Apparently the rodlike molecule finds it easier to enter the pore than the Gaussian chain with the same R,, especially when R, is large. By a simple geometrical consideration, Giddings et aZ.31 extended the calculation to include the partition coefficient for a spherocylinder of a finite diameter.
3.2.2.4. Excluded-volume chain In contrast to the rigorous formulations for the partitioning of a Gaussian chain and

106 IWAO TERAOKA
some rigid-shape molecules, theories available for the partitioning of a linear flexible chain with excluded volume are unfortunately scarce. There was an early attempt to obtain an explicit expression of a perturbed chain (a Gaussian chain perturbed by the excluded volume; now outdated by the renormalization group theory) in a slit.32 Otherwise, the application of the scaling theory to the partitioning is the only theor- etical work available so far, although it is valid only for a very long chain. The theory predicts some features any other realistic models have to satisfy in the long chain limit. We note here that renormalization group theory has so far not been applied to the estimation of the partition coefficient.
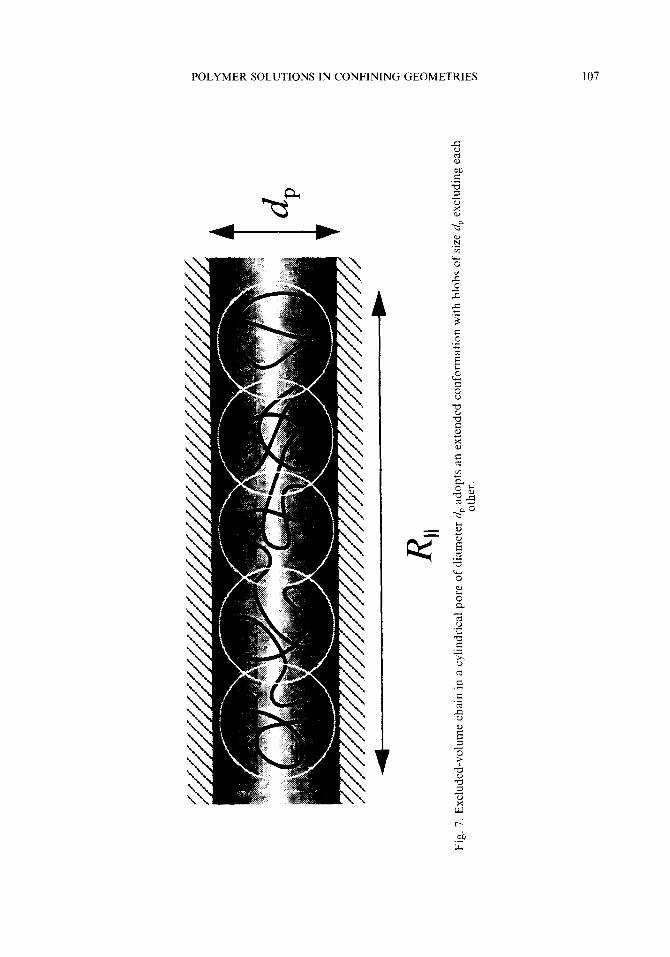
Daoud and de Gennes23,33 employed a blob picture to describe a polymer chain confined in a cylindrical pore. As shown in Fig. 7, the diameter of the blob was set equal to the pore diameter dp, which gives the number Nd of monomers in a blob as aNi’ - dp. A chain consists of N/N, blobs that exclude each other. Since there are only two length scales, dp and the exterior chain dimension aN3”, the free energy F of the confinement must be of a form
F/kB T N ,f(aN3’5/dp) (27)
where the functionf(x) satisfiesf(x) N .P as x -+ CY.Z . The requirement that F cx N/N,, cc N results in MZ = 5/3. Therefore the partition coefficient K0 is given as
lnK,, = -F/kBT N -N(a/dp)5/3 (28)
Later Chen and Muthukumar34 derived this scaling relation using the Edwards path integral.
The chain of the blobs has to adopt a ‘cigar-like’ conformation extending in one- dimensional pore. The chain dimension R,, along the pore is given as
R,, - (N/Nd)dp - Ndp(a/dp)5’3 N Na(a/dp)2’3 (29)
In contrast to a Gaussian chain, RI, is proportional to the molecular weight. In a similar discussion, Daoud and de Gennes33 calculated the partition coefficient
of an excluded-volume chain for a slit of separation dp and reached at the same result as in eqn (28). The end-to-end distance of the excluded volume chain trapped in the slit was calculated as
R,, - N3’4a(a/dp)l:”
When the solvent is a melt of short chains consisting of the same monomers as those of the long chains, an additional length scale becomes important. Brochard-Wyart and Raphael 35 considered a chain of N monomers in the melt of short chains of N, monomers. There is a screening of the excluded volume over the distance -aNs, where a is the monomer size. The confinement by a cylindrical pore of radius R,, therefore, has a different effect on the long chain between for R,> aNs and for R, < UN,. The former case is similar to the confinement of a swollen chain in good solvent, except that the chain is ideal for the distance < UN,. In the latter case, a blob, in which the chain is ideal, is elongated by the confinement. These blobs are packed one-dimensionally.
POLYMER SOLUTIONS IN CONFINING GEOMETRIES 107
108 IWAO TERAOKA
Halperin and Alexander36 considered a star polymer confined in a slit. Combining the scaling theory by Daoud and de Gennes33 and the theory for swollen star polymers by Daoud and Cotton,37 they obtained the size of the star in the slit, the monomer density profile as a function of the distance from the core of the star, and the free energy of confinement.
Treatment by Daoud and de Gennes was later extended3* to a flexible chain in 0 solvent, where the second virial coefficient disappears but the third virial coefficient is positive. They used Flory’s free energy theory. A chain trapped in a pore with a longitudinal dimension RI1 has a free energy F that consists of an elastic term and an interaction term:
F Rf B3N3
kBT - a2N + (R,,d,)” (31)
where L&-a6 is the third virial coefficient. Minimization of F with respect to RI, yields
RI1 N J%#,) (32)
and the minimum free energy
F/kBT N N(a/dJ2 (33)
Although there is a small difference in the exponent to a/d,, the proportionality to Nin the expressions of RI, and F/kBT is the same as in the excluded-volume chains.
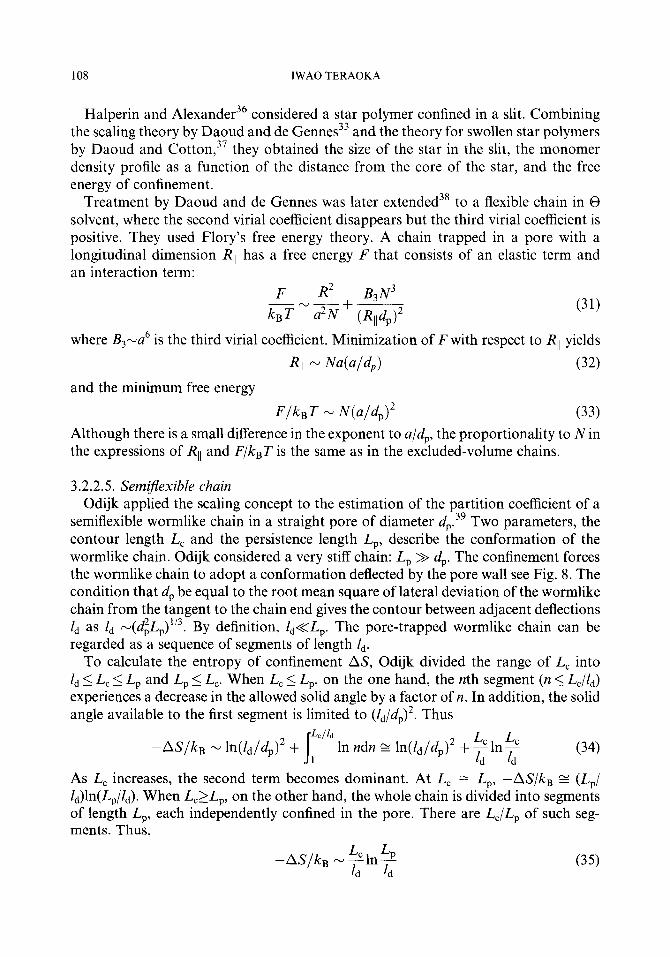
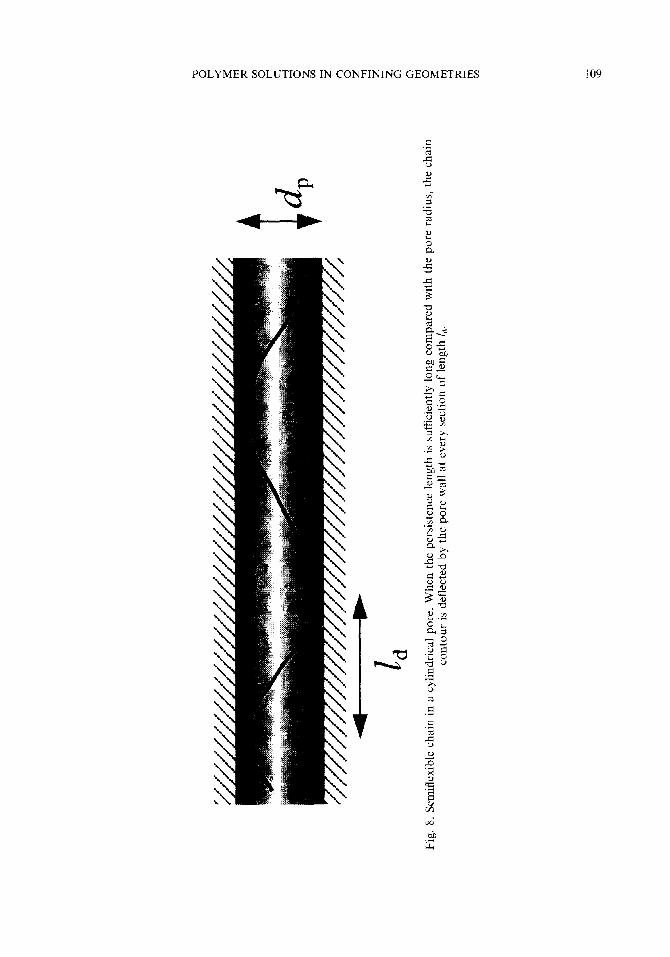
3.2.2.5. SemiJlexible chain Odijk applied the scaling concept to the estimation of the partition coefficient of a
semiflexible wormlike chain in a straight pore of diameter dp.39 Two parameters, the contour length L, and the persistence length L,, describe the conformation of the wormlike chain. Odijk considered a very stiff chain: L, >> dp. The confinement forces the wormlike chain to adopt a conformation deflected by the pore wall see Fig. 8. The condition that dp be equal to the root mean square of lateral deviation of the wormlike chain from the tangent to the chain end gives the contour between adjacent deflections ld as ld -(diL,)1’3. By definition, &XL,. The pore-trapped wormlike chain can be regarded as a sequence of segments of length Zd.
To calculate the entropy of confinement AS, Odijk divided the range of L, into Zd 5 L, 5 L, and L, 5 L,. When L, < L,, on the one hand, the nth segment (n 5 L,//J experiences a decrease in the allowed solid angle by a factor of n. In addition, the solid angle available to the first segment is limited to (ld/dJ2. Thus
-AS/kB - ln(&JdP)2 + J
f-,lld
1 In ndn E ln(ld/dP)2 + ?ln? (34)
As L, increases, the second term becomes dominant. At L, = L,, -AS/kB E (L,/ l,)ln(L,/Z,). When L,zL,, on the other hand, the whole chain is divided into segments of length L,, each independently confined in the pore. There are LJL, of such seg- ments. Thus,
-AS/ku (35)
d P
2 d
Fig.
8.
Sem
ifle
xibl
e ch
ain
in a
cyl
indr
ical
po
re.
Whe
n th
e pe
rsis
tenc
e le
ngth
is
suf
fici
ently
lo
ng
com
pare
d w
ith
the
pore
ra
dius
, th
e ch
ain
cont
our
is d
efle
cted
by
th
e po
re
wal
l at
eve
ry
sect
ion
of
leng
th
&.
110 IWAO TERAOKA
is proportional to the molecular weight, a result that agrees with the partitioning of a long Gaussian chain. As L, increases, AS shows a transition from the confinement entropy for the rigid rod to that of a Gaussian chain. The probability of the wormlike chain folding back in the pore was found to be prohibitingly 10w.~~ Because of deflec- tions, the chain extension along the pore is smaller by @(6L,) than ld for every section between adjacent deflections. The overall extension Ril is therefore given as Rii = L, - (L,/~)(c&,/LJ~‘~. Note that we do not have a theoretical estimation of the partition coefficient for more flexible chains that do not meet the condition Lp>>dp.
3.2.2.6. Freely jointed chain In presenting a model for hexagonal packing of linear polyethylene in a crystallite,
Priest4’ calculated the partition function Z, of a freely jointed chain of N segments trapped in a cylindrical pore of radius R,. For the segment length b, b > 2R, was assumed. Prohibiting the chain’s folding back onto itself, he applied the transfer matrix formulation and obtained, for N>>l,
Z, = b2Nq:
where q. is the largest eigenvalue of the integral equation for an eigenfunction $(x):
s dx1 d&~hI = PNx2) (37)
where the ith joint is at (Zi, xi) in the cylindrical coordinate system. The partition coefficient is then given as28
Ko = (q0/24N (38)
In the strong confinement limit, i.e. R,/b < 1, q. E n(R,/b)‘, and eqn (38) reproduces the result of the rigid rodlike molecule.
3.2.2.7. Other models Partition coefficients were calculated for an elastic dumbbell in various geometries of
confinement.41 The results are similar to those for a rodlike molecule with masses on the ends.
Vilgis42 applied the Flory’s free energy theory for a branched polymer that has a spectral dimension 4/3 in a cylindrical pore. From minimization of the free energy, he found that there is a minimum size dp,min of the pore that accommodates the polymer and that dp,min 0; NCds - 1)‘2ds, where N is the total degree of polymerization, and d, is its spectral dimension. This result shows that a linear chain (d, = 1) can enter a very small pore, although the energy penalty is high. In contrast, the branched polymer (d, = 4/3) cannot penetrate a cylindrical pore smaller than dp,min.
3.2.3. Partitioning in a random porous medium
The random pores treated by Giddings et aL31 are a random deposition of randomly oriented planes. These planes tessellate a volume into separated cells. The partition

POLYMER SOLUTIONS IN CONFINING GEOMETRIES Ill
coefficient K, of a rigid molecule of an arbitrary shape is, by definition, equal to the probability for the molecule, not to be cut by the bisecting planes. Using the property that bisecting points along a straight line follows a uniform distribution, Giddings et
al. obtained
K0 = exp(-sL/2) (39)
where s is the average number of the planes per unit length over all the orientations, and L is the mean length of the projection of the molecule along various directions. For a rodlike molecule, L = L/2, where L is its end-to-end distance.
Fanti and Glandt43 considered the partitioning of a sphere of radius R, in random, overlapping deposition of spherical cavities of radius R,. They applied the cluster expansion of the interaction between the spherical solute and the solid phase of the porous medium with respect to the concentration of the cavities. Thus, they could simplify the confinement by the overlapping cavities at the expense of overestimate of the geometrical restriction. Their expression for K, is
K
0 = 1 - exp [-pp( 1 - RJR,)‘]
1 - exP(-/+J (40)
where pp is the porosity defined by pp = (47r/3)R, C 3~ with c, the number of the random spherical cavities per volume. At low cavity densities, K0 = (1 -RJR,)‘, reproducing the result of partitioning of a spherical solute in a spherical cavity.
A random porous medium that interested many theoreticians consists of quenched random obstacles that may have been generated in site percolation algorithm. The conformations of a Gaussian chain and an excluded volume chain are strongly affected by the quenched obstacles.
Edwards and Muthukumar44 considered the dimension of a Gaussian chain of contour length 1 and Kuhn step length b. The potential energy by an obstacle was added to the Edwards Hamiltonian in a way similar to the binary, excluded volume interactions between segments. They calculated, in the limit of 1+ cc, the mean- square end-to-end distance Rg as
where C, is the average obstacle concentration, E is a numerical, and v expresses the magnitude of the effective excluded volume interaction between segments. This inter- action exists even in the absence of bare binary exclusion because the segments are excluded by the same obstacle. In the limit of z + 0, Rg + lb, and the chain becomes Gaussian. The asymptote for a large z yields Rc = I/(w’cib4). In the strong confine- ment, the chain dimension is independent of its contour, and is proportional to the reciprocal of the obstacle concentration. eqn (41) agreed with the simulation resultsa
To extend to above formulation to an excluded volume chain, Muthukumar46 added the bare binary interaction to the Edwards Hamiltonian and estimated Rfs. He found that the excluded volume interaction is screened by the obstacles. When the obstacle concentration is low, R$ N 16’5, as expected. As the concentration increases, it reaches a

112 IWAO TERAOKA
threshold beyond which a Gaussian chain-like dependence Rg - 1 is seen. At higher concentrations, Rg is given by eqn (41) the result obtained for a Gaussian chain. In reality, however, three body interaction will dominate, and the chain collapse will be avoided.
At around the same time, Honeycutt and Thirumalai47 studied the dimension, the distribution of the end-to-end distance, and the monomer density profile around the center of mass for a freely jointed chain and an excluded volume chain. They devel- oped a Flory’s free energy theory for these static properties. The results were, however, not in agreement with the more rigorous results they obtained47 in the formulation similar to that of Edwards and Muthukumar.44 In hoping to solve the contradiction, they performed a computer simulation.47-49 They found that the excluded volume chain contracts, adopting a globular conformation at high concentrations of obstacles. They fitted the distribution for the end-to-end coordinate x of one the Cartesian components by exp(- Ix/a,s16), with an adjustable parameter ueff that represents the width of the distribution, In the presence of obstacles, the excluded volume chain had 6 > 2, but the freely jointed chain resulted in 6 < 2.47,48
3.2.4. Experiments
The partition coefficient of a polymer chain as a function of the molecular weight determines the separation capability of SEC for a given column packed with porous materials. It has been important, from the inception of SEC, to estimate the partition coefficients experimentally.
The coefficients were estimated from the peak retention time in SEC with a low flow rate.50’51 A more direct method was also employed that compares the concentration of the exterior polymer solution after immersion of porous material with that before the immersion. Colton et a1.22 and Satterfield et aLs2 applied the second method to five fractions of polystyrene standards in a good solvent such as chloroform for controlled pore glasses of three different pore sizes. In addition to the usual measurement errors, these experiments suffer from the non-idealities of the porous materials used. The pore radius is ambiguous in the network-structured porous medium as discussed earlier.
Here we focus on the dilute solution limit. Figure 9, replotted from the original,52 combines the estimate of K. Yau et aL5’ obtained using SEC and the zero concentra- tion extrapolates of K by Satterfield et a1.52 The K. is plotted as a function of RJR,, where R, was estimated from BET curves. The data are well fitted by the Casassa’s theoretical estimate24 for a Gaussian chain with an equivalent R, in a cylindrical pore of radius R,, given by eqn (19) and eqn (20). The data, when plotted as a function of R,/R, using R, estimated by mercury porosimetry, were, however, systematically larger than the values for a Gaussian chain.
Recently, a micro Mach-Zhender interferometry was applied by Sernetz et a1.53354 to measure the porosity of a crosslinked polymer gel bead and the partition coefficient for several biomolecules. The method appears to have advantages over the method employed by Satterfield et aZ.52 Sernetz et al. were interested mainly in the fractal nature of the pore space in the porous gel. Unfortunately they did not measure K. for different fractions of a polymer.

POLYMER SOLUTIONS IN CONFINING GEOMETRIES 113
0.8 q Yau and Malone
___ Gaussian 0.6
KC, 0.4
0 0 0.2 0.4 0.6 0.8 1
%&
Fig. 9. Partition coefficient K,, of polystyrene fractions in the dilute solution limit, plotted as a function of RJR,. Two different sets of data are shown. The line represents theoretical
estimate of K,, for a Gaussian chain in a cylindrical pore. Replotted from the original.
3.2.5. Simulations
Computer simulations for the partitioning in the dilute solution limit have been attempted in some nontrivial cases. Some of the simulation results were mentioned earlier.
Casassa’s formula for a spherical cavity given by eqn (21) was verified by Dayantis and Sturm55 in simulation for ideal lattice chains on a cubic lattice with an absorbing boundary at the spherical wall. They also observed that the monomer density is depleted near the wall, and the ratio of the thickness of the depletion layer to the cavity radius increases as the cavity becomes smaller, a result predicted by the theory.23
Simulations for the partitioning of an excluded volume chain in a well-defined confining geometry has been scarce, although the importance is obvious. We do not have analytical results either. Cifra et ~1.~~ and Bleha et al.57 obtained K0 as the zero concentration limit of the partition coefficient for a finite number of athermal chains that avoid double occupancy at the lattice sites of system size dP x dP x dp; more detailed explanation of the procedure will be given in the next section. Figure 10 shows K, as a function of 2R,/d, for three different chain lengths (open circles). For compar- ison, K, for a Gaussian chain in the cubic pore, given by eqn (22), is shown by a solid line. Data were taken from the zero concentration extrapolates in the original figures. The simulation data show that the excluded volume chain can enter the restricting geometry more easily than the Gaussian chain of the same R,. Comparison with the scaling theory does not make sense, however, because the chain sizes used in the simulation are too small. Cifra et aL5’ also considered the effect of the binary inter- actions on the partitioning that in unbounded solution result in chain expansion, contraction, and collapse.
Simulations for the partitioning of a semiflexible chain with a cylindrical pore were attempted by Teraoka et a1.59 They specified a wormlike chain by the reduced chain length LJR, and the reduced persistence length L,/R,. The partition coefficient K0 was

114 IWAO TERAOKA
10-3
o Bleha, Cifra, & Karasz _ __ Gaussian
0 0.2 0.4 0.6 0.8 1
%PP
Fig. 10. Partition coefficient K0 in the dilute solution limit obtained in computer simulation for an excluded-volume chain in a cubic pore of side dp. The solid line is for a Gaussian chain
in the pore.
obtained as the probability of a wormlike chain, generated with a random position and orientation of the chain end, not to touch the pore wall. Figure 11 shows & as a function of L,/R, for different values of L,/R,. For reference, &, for a rodlike molecule (L,/R, = co ) is shown by a solid line. When the chain is flexible (L,/R, = 0.5, 1, and 2), & decreases exponentially as LJR, increases, in agreement with the result of a Gaussian chain. As the chain rigidity increases, the data points approach the solid line when the chain is short (L,/R, 5 4). As the chain becomes longer, the data points eventually deviate downward, resembling the behavior of a Gaussian chain. The slope of lnK,, vs. LJR, at large L,/R, becomes less steep as the chain stiffness increases. The range of LJR, studied, however, does not allow a comparison with the scaling theory of 0dijk.39
Another way to interpolate Casassa’s formula and Giddings’ formula is to investi- gate the partitioning of a freely jointed chain with a finite segment length b. In the vanishing limit of b while R, is held constant, the chain conformation approaches that of a Gaussian chain. A chain consisting of a single segment is a rodlike molecule of
__ rodlike molecule
VI -a 10-3 - 0 2 X
X 5 0 +
V + 10 X
10-4 c ' m ' m ' m ' p * 0 2 4 6 8 10 12
=,I$
Fig. 11. Partition coefficient K,, of a semiflexible chain of persistence length L, with a cylind- rical pore of radius I?,, plotted as a function of the contour length L,. The solid line repre-
sents K, for a rodlike molecule. Replotted from the original.

POLYMER SOLUTIONS IN CONFINING GEOMETRIES 115
lo-5 -B-- Davidson et al.
Fig. 12. Partition coefficient K, of a freely jointed chain of segment length b in a cylindrical pore of radius R,. Computer simulation rest&s are plotted in squares, analytical results by Priest are plotted in lozenges. The value of b/R, is indicated adjacent to each curve. For reference KO of a Gaussian chain and that of a rodlike molecule are shown. Replotted from
the original.
length b. Davidson et ~1.~ conducted computer simulations to study the effect of a finite b/f\‘, on &. Figure 12 is replotted from their original. Since they distributed mass on the chain ends and the joints, Giddings’ formula is plotted using the substitution of R, = L/2, making the disparity between Giddings’ and Casassa’s formulae loom large. The numbers adjacent to lines connecting symbols denote b/R,. For reference, analy- tical results obtained by Priest4’ for freely jointed chains with b/R, > 2 are shown. It is apparent that the finite segment length moves & upward considerably. Real polymer molecules classified as a linear flexible chain in good solvent have a segment length as large as 4 nm. Therefore, Davidson et al. argued, KO should be much larger for real chains than that estimated using Casassa’s formula.
3.3. Concentration eflect on the partitioning
The preceding section focused on a single chain. The expressions for the partition coefficient K. derived apply to only very dilute solutions. At non zero concentrations, the partition coefficient K deviates from K. linearly with respect to cs. The positive (~K/&&=O is the main reason why the peak retention times in SEC become longer as the concentration in the injected volume increases (overloading). Although SEC may not be operated at the thermodynamic equilibrium, it is imperative to consider the concentration effect on K before we argue any kinetic effects.
3.3.1. Theory
Several researchers developed a microscopic model to explain the deviation of K from KO. They obtained concentration coefficients k,i, kp2,... in
K = &( 1 + kpiCE + kp& + . ..) (421
116 IWAO TEFCAOKA
Historically, contraction of polymer chains at higher concentrations6’ was believed to be the main reason to increase K. 61-63 This explanation was for some time pursued by researchers including those of a Slovak group after they had seen a systematic shift of the peak retention time tR in SEC to a longer time as the concentration c of the injected volume increased. The change was approximated by tR = tRO(l+kRc). For example, Bleha et ~1.~~ estimated kR assuming Eizner’s and Yamakawa’s models for the chain contraction. Comparison of kR obtained in the experiments with those theoretical estimates showed that the shift in the experiments was larger. The group also tried to correlate kR with the osmotic second virial coefficients, for different polymers in various solvents.65
More recently, the increase in K was ascribed to repulsive interactions between solutes.66a67 The simplest system is a suspension of non-draining spheres of a uniform radius that interact via excluded volume only. This model system elucidates the inter- action effect on K without being compromised by the change in the solute size at higher solute concentrations.
The potentials Ui and U, in the Hamiltonian given by eqn (2) are either 0 or 00, because all the interactions are those of excluded volume. It is then straightforward to apply a cluster expansion to the grand partition function of the exterior solution as well as to that of the solution in the pore. Combination of these cluster expansions leads to the virial expansion of K. Anderson and Brannon considered a suspension of hard spheres of radius R, in equilibrium with a cylindrical pore of radius R,. They applied the Mayer cluster expansion to the interior and the exterior solutions up to the second order of X, the activity of the solute. They obtained kpI exactly, and, with the Percus-Yevick approximation,@ calculated kp2 numerically for different sphere sizes.
They found that k,,/V, is an increasing function of RJR, and maximizes at R, --+ R, with the maximum value of 2B,/V, = 8, where V, = (47r/3)Ri and B2 is the second virial coefficient of the bulk solution:
B2 = -i s
V(exp[-UZ(r)/kBT] - 1)dr = 41/,
They also estimated k,, for hard spheres in a slit with separation 2R, with or without a long-range electrostatic repulsion between pore walls and the solute spheres. In the whole range of K,, k,,/2B, was found to be approximated by
kpI/2B2 = 1 - 0.99Ko - 1.06K; + 1.05K; (44)
which applies to all the hard sphere-pore systems considered including systems with an electrostatic repulsion. For kp2, the plot of k,,/Vz as a function of K. = (1 - R,/RJ’ for hard spheres in a cylindrical pore shows that it is mostly positive, maximizes at K0 = 0, and decreases rapidly to settle around zero as K. increases to 0.3.
In a similar approach, Glandt67 calculated k,, and kp2 for a mutually excluding hard sphere fluid in equilibrium with a cylindrical and spherical cavity and a slit. His estimate of k,, was also exact and agreed with that obtained by Anderson and Brannon, and the estimate of kp2 assumed the Percus-Yevick approximation.@ He showed that K,k,,/l/, maximizes at RJR, = 0.43 (& is a decreasing function

POLYMER SOLUTIONS IN CONFINING GEOMETRIES 117
0.8
0.6 K
0.4
0 0 0.2 0.4 0.6 0.8 1
4 fR,
Fig. 13. Partition coefficient K of hard spheres of radius R, at finite concentrations in a cylindrical pore of radius A, are plotted as a function of RJR,. The volume fractions of the spheres in the external solution are indicated adjacent to the curves. Replotted from the
original.
and k,,/Vs is an increasing function of R,/R,). The overall partition coefficient K that includes k,! and k, terms was plotted as a function of RJR, at volume fractions
YsCE = 0, 0.2, and 0.4 in the exterior solution (see Fig. 13). He noted that the increase in K at higher V,c, and the shoulder observed for V,c, = 0.4 are due to the high osmotic pressure of the large solutes in the exterior. The high osmotic pressure drives the spherical solutes in the pore channels.
Glandt69 also considered the density profile p(r) of hard sphere solutes of radius I?, in a cylindrical pore of radius R, at finite concentrations as a function of r, the distance from the cylinder axis. They applied a Mayer’s cluster expansion to obtain p(r) in a virial expansion with respect to cE. He found that p(u) shows a peak at r = R, - R,. Later Post7* showed that even at higher concentrations p(r) exhibits multiple peaks, indicating that layer structures are formed by mutually excluding spheres. In another contribution, Post and Glandt” considered the effect of surface adsorption on p(v).
In this section, we will have a look at the simulations for the partitioning of hard spheres (mainly the concentration effect) and for the partitioning and other static properties of short linear chains, conducted in non-dilute conditions.
3.3.2.1. Hard sphere Fanti and Glandt43 considered the concentration effect on IT for spherical solutes in
a porous medium consisting of overlapping spherical cavities deposited randomly. They performed a computer simulation in the grand canonical ensemble. For different porosities and solute-to-pore size ratios, K increased as the exterior solute concentra- tion increased.

118 IWAO TERAOKA
1 /III,IIII,III(/,/I,(I,II 2Rfyd,= 0.15 0.25 0
0.8 - 0 LI
o -00 L-1 0.6 - 0.37 n K u 0 0
0 0.4 - 0 o
0 o
0.2 -x x x x x x x x x 0.49
1
0 0.05 0.1 0.15 0.2 0.25
@Fz
Fig. 14. Partition coefficient K of short chains with a cubic pore obtained in computer simulation, plotted as a function of the volume fraction C& of the exterior solution. The reduced chain size 2Rr’/d, is indicated adjacent to the plots. Replotted from the original.
3.3.2.2. Linear chain Computer simulation is a potentially powerful tool to evaluate the concentration
equilibrium of linear chain molecules at high concentrations. At present, however, simulation results are available only for short chains. There are interesting phenomena specific to short chains.
The concentration effect was pursued for some time by a Slovak group. Bleha and Cifra56,57 employed a cubic lattice model with side dP. After filling the lattice sites with athermal linear chains consisting of Nmonomers up to a given volume fraction 4, they counted the number W of possibilities of laying another chain of the same length without overlapping the filled sites. When the boundary condition is periodic, the counting gives the number W,(#J,) for the external solution with a polymer volume fraction &. Confinement by a cubic cavity was realized by imposing an absorbing boundary condition on all faces of the cube. A similar counting with this boundary condition applied to all the chains gives IV’, for the internal solution in equilibrium with the exterior solution with a volume fraction 4s. The partition coefficient K was then calculated using
K = WI(d)E)
WE(4E) = &(l + +#& + . ..) (45)
The solute concentration was increased by decreasing dp. Fig. 14 was reproduced from the original.57 The value of 2RCo’/d
P is indicated adjacent to each plot, where Rf’ is the radius of gyration in the dilite concentration limit. For all chain sizes studied, K increased linearly with +n. The linear coefficient Koklpl plotted as a function of 2Rr’/dp exhibited a peak as predicted for hard sphere solutions, but the peak was located at a value smaller than the prediction (Section 3.3.1). Although Fig. 14 and the other figures for different chain lengths show data points only for K 5 1, the available data points appear to approach values larger than unity when #n is further increased, at least for short chains such as those with 2Rr)/ dp < 0.3.
Another group that studied the statics of chain molecules in a pore is Yethiraj and
POLYMER SOLUTIONS IN CONFINING GEOMETRIES 119
K
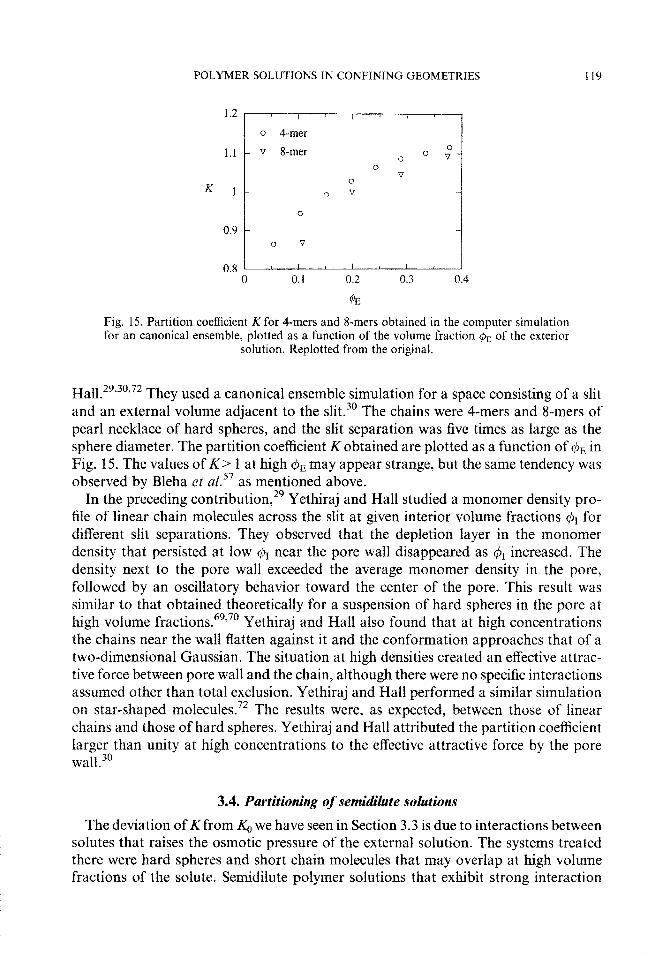
Fig. 15. Partition coefficient K for 4-mers and 8-mers obtained in the computer simulation for an canonical ensemble, plotted as a function of the volume fraction & of the exterior
solution. Replotted from the original.
I-Ia11.29*30~72 They used a canonical ensemble simulation for a space consisting of a slit and an external volume adjacent to the slit.30 The chains were 4-mers and 8-mers of pearl necklace of hard spheres, and the slit separation was five times as large as the sphere diameter. The partition coefficient Kobtained are plotted as a function of C& in Fig. 15. The values of K > 1 at high Cpn may appear strange, but the same tendency was observed by Bleha et al.57 as mentioned above.
In the preceding contribution,29 Yethiraj and Hall studied a monomer density pro- file of linear chain molecules across the slit at given interior volume fractions q5i for different slit separations. They observed that the depletion layer in the monomer density that persisted at low $i near the pore wall disappeared as #i increased. The density next to the pore wall exceeded the average monomer density in the pore, followed by an oscillatory behavior toward the center of the pore. This result was similar to that obtained theoretically for a suspension of hard spheres in the pore at high volume fractions.6g’70 Yethiraj and Hall also found that at high concentrations the chains near the wall flatten against it and the conformation approaches that of a two-dimensional Gaussian. The situation at high densities created an effective attrac- tive force between pore wall and the chain, although there were no specific interactions assumed other than total exclusion. Yethiraj and Hall performed a similar simulation on star-shaped molecules.72 The results were, as expected, between those of linear chains and those of hard spheres. Yethiraj and Hall attributed the partition coefficient larger than unity at high concentrations to the effective attractive force by the pore wa11.30
3.4. Partitioning of semidilute solutions
The deviation of Kfrom K, we have seen in Section 3.3 is due to interactions between solutes that raises the osmotic pressure of the external solution. The systems treated there were hard spheres and short chain molecules that may overlap at high volume fractions of the solute. Semidilute polymer solutions that exhibit strong interaction

120 IWAO TERAOKA
effects at low volume fractions of the solute are specific to long chain molecules. A drastic change in the partitioning will occur when the solution becomes semidilute. Studies of the partitioning using a well-defined confining geometry may provide detailed information on the nature of the chain-chain interactions in the bulk solutions.
3.4.1. Theory
As the concentration increases, the polymer solution begins to exhibit thermo- dynamic properties different from those of the dilute solution. The concentration at which the chains begin to overlap is called the overlap concentration c*. There are several definitions of c*, but here we employ the definition by de Cloizeaux:73
c* (&RF))‘= 1
This definition gives a value about twice as large as the reciprocal of the intrinsic viscosity. In the following, we will review theories on the concentration equilibrium of the semidilute solution, first for the long chain limit and then for relatively short chains with a dimension smaller than the pore size.
3.4.1.1. Scaling theory In the semidilute regime c > c*, the correlation length < of the monomer density
becomes smaller than R,. Net repulsions between solvated polymers increase the osmotic pressure II, although the volume fraction of the solute polymer is still low. Application of the scaling theory led to the famous relationships23,74 [ N aqfp3’4 - R(‘)(c/c*)-~‘~ and II N (kBT/a3)49’4 - &T(c/c*)~‘~ where 4 = a3Nc is the volume friction of the polymer with degree of polymerization N. As c increases, t decreases from RF’ to a. The polymer solution changes drastically as its constituents change their volume from (RF))’ to the monomer volume a3. The high osmotic pressure will alter the concentration equilibrium of the solute polymer with the porous medium. Daoud and de Gennes33 considered the equilibration of large solutes (R,>R,).
In the cylindrical pore, the chains begin to overlap when mutually excluding, ex- tended chains with dimension RI, along the pore occupy the entire pore volume. The overlap concentration c; in the pore is given by
(47)
where the dilute solution value was used for RI, (eqn (29)) and the exterior overlap concentration C* is given by eqn (46). Since RF’>> dp, c; is substantially larger than c*. At concentrations cI > c;, the correlation length & in the pore is smaller than dp, thereby allowing monomers to be negligent about the confinement. Over the length of dp, thermodynamic properties of the solution follow those of the bulk solution of concentration cI.
Subsequently, Brochard and de Gennes75 estimated the chain extension RI, in the cylindrical pore at high concentrations. They first evaluated the internal filling fraction

POLYMER SOLUTIONS IN CONFINING GEOMETRIES 121
+int, defined as the volume fraction of the chain in the volume of &RI,, as #iti,t - Na3j (~~~~,). Since at high concentrations the chain conformation is Gaussian, RI, N H”‘.
Thus, 4Sint N N1’2(a/&)2. This estimate is however valid only for $int < 1, i.e. for a large pore with ,$r > N1j4a. When dp < N”4a, the chain extends so that cj3int < 1. This condition yields Rii N Na’/di.
The partitioning at low concentrations is governed by the entropy reduction of a single chain, & = exp(AsjQ. Long chains can barely enter the pore. This situation drastically changes as the concentration increases in the exterior. At the highest possible concentration, i.e. for a melt, the polymer chains should be able to completely penetrate the pore, rendering K= 1. Daoud and de Gennes33 considered that a tran- sition from weak to strong penetration takes place as the correlation length in the exterior solution becomes comparable to the pore diameter.
3.4.1.2. Weak to strong penetration transition of short chains Although the concentration effect may not be as drastic as for long chains, the
partitioning for solute polymers of dimension smaller than or comparable to the pore size is more important for polymer-pore systems accessible by experiments, such as SEC. Teraoka et a1.76 considered the equilibrium of the solute polymers with R(O) < R g - P’
The weak-to-strong ~netration transition was discovered76 in the course of their studying the dynamics of solvated monodisperse polystyrene in the interior of a solid porous glass made of silica. A porous glass bead was equilibrated with the external solution. Dynamic light scattering was used to obtain the apparent diffusion coefficient & and DE of polystyrene molecules in the pore channels and in the exterior solution. When cE<< c*, L)r was identified as that of the center of mass diffusion of polymer molecules in the porous medium that decreased as the molecular weight increased. As cr increased and exceeded c*, DI rapidly increased. When cE > c*, D, depended little on the molecular weight but rather on the monomer concentration, a result indicating that the interior solution was semidilute and the dynamics of polymer molecules was the cooperative diffusion of entangled chains. Furthermore, a large difference between Q and DE that existed in the dilute solution regime became smaller at high concentra- tions, which suggested a nearly equal concentration between the interior and exterior. The increase in D, was more striking for a larger molecular weight sample that has expectedly a more dilute interior concentration.
The large increase could not have happened if the small partition coefficient had persisted to the highest concentrations measured. The drastic increase in the interior concentration cI was evident, although cI was not measured. To explain the transition, Teraoka et aE.76 investigated numerically the concentration equilibrium of a solvated monodisperse polymer with a cylindrical pore. Use of the Casassa’s formula (eqns (19) and (20)) of rC, for a Gaussian chain, assuming that the entropy reduction is a function of RJR, alone, regardless of the presence of the excluded volume interactions, allowed them to evaluate K numerically as a function of ca.
To calculate the chemical potential of a polymer chain in a wide range of concen- tration, they used an interpolation formula for the osmotic pressure of the semidilute
122 IWAO TERAOKA
polymer solution derived by Ohta and Oono. 77 In the reduced form, II is expressed as a function of X
& = P(X) = 1 -1 texp{ [l/X + (1 - l/X2)ln(X + 1)]/4} (48)
where X is a reduced concentration defined by
X G c&*, a!, G 3.49 (49)
This function satisfies P(0) = 1 and P(X) N X5j4 for X>>l as required. For the deriva- tion of the numerical CX~, see the reference.76 Eqn (48) agrees well with experimental data of the osmotic pressure.78 The chemical potential PE of a polymer chain exterior to the pore is then given as a function of the reduced concentration xr = c~&s/c*.
where p. is the chemical potential of a reference state, and I(X) is defined as
Z(X) E P(X) - 1 + .I “‘b- ‘dx 0 X
(50)
(51)
The osmotic pressure of the interior polymer solution will be also expressed by eqn (48). When the interior concentration cl increases and the chains begin to overlap, the correlation length & is already smaller than R,, because R, < R, by assumption, and <i E R,(c~/c*)-'~~ by the scaling theory. The expression for the chemical potential of a chain in the pore has an extra term:
(52)
where Xi is the reduced concentration in the pore, Xi=a,c,/c*. The change in the single-chain entropy &S is a function of confinement. Teraoka et LzZ.~~ put
exP@S/kB) =fcasassa&&) (53)
Note that R, is subject to change at high concentrations, because the chain contraction occurs by shielding of excluded volume interactions. For the chain contraction factor, another interpolation formula obtained by Ohta and 0ono77 was employed.
The condition pl = & gives the concentration equilibrium. By solving this equation self-consistently for a varying X,, the partition coefficient K = Xi/X, is calculated as a function of &. Fig. 16 shows, in double logarithmic scale, the results obtained for different chain sizes Rr)/Rp. For all chain sizes, the partition coefficient shows a transition from a weak penetration governed by the size exclusion to a strong penetration, K%l, at around the overlap concentration Xr = CX, E 3.49. Teraoka et a1.76 found that the large I(x) in eqns (50) and (52) is far more effective in forcing the chains to migrate into the pore channels at higher concentrations than the decrease in l&S] due to the chain contraction. As the concentration in the exterior solution increases and the osmotic pressure builds up, polymer chains are squeezed into narrow pore channels at the expense of reduced conformational entropy.

POLYMER SOLUTIONS IN CONFINING GEOMETRIES 123
Fig. 16. Partition coefficient K of excluded-volume chains with a cylindrical pore of radius R,, plotted as a function of the reduced exterior concentration Xs. The reduced radius of gyration Rr'/R, is indicated adjacent to each curve. The dashed line denotes the overlap
concentration of the exterior solution.
3.4.2. Experiments
Satterfield et al.52 measured the partition coefficients of five different molecular weights of monodisperse polystyrene in chloroform with three different pore sizes of controlled pore glasses. As described in Section 3.2.4, the concentration in the pore channels was estimated by comparing the concentrations in the exterior solution before and after the immersion of the porous glass. The concentration range was below 25 mg ml-‘. Fig. 17 was replotted from the original for the porous glass with R, = 23.4 nm. The Kis plotted as a function of the exterior weight concentration WE in the logarithmic scale, where WE = c&f/N, with A4 the molecular weight and NA the Avogadro’s number. The overlap weight concentrations (defined as w* E c*M/NJ for the five fractions of polystyrene are w* = 77, 32, 21, 1 .O and 8.0 mg ml-’ in the
x 498K 0 o ” q Om.h: 0.6 - A 670K q OXX _
K BOO# _
00 ox * 0.4 -
q .OY _ cl
0 sA
0.2 - 0 a” Xz5
x x
1 Rp= 23.4nm x ‘A 0 I
0.1 1
WE [mg/mLl
Fig. 17. Partition coefficient K for polystyrene fractions with controlled pore glass of pore radius 23.4 nm at various weight concentrations wn in the surrounding solution. Replotted
from the literature.

124 IWAO TERAOKA
increasing order of the molecular weight. Satterfield et al. found a large concentration effect on the partitioning for all combinations of polymer with pore. In particular, the effect was large for a large molecular weight polymer with small pores. A rapid increase in K certainly takes phCe as WE exceeds w*.
A similar method was employed by Brannon and Anderson79 to study the concen- tration dependence of K of water-soluble polymers, neutral dextran of three different molecular weights in an aqueous KC1 solution and bovine serum albumin in an aqueous buffer. Controlled pore glasses with three different pore sizes were used. Although the data have a large error bar, all the combinations of the polymers and the porous glasses showed an increase in K as cr increased. Their concern was to obtain k,, in eqn (42). The plot of KOkp,/BZ as a function of K0 showed a peaking as the theory expected,@ but the peak height was lower. The concentration range studied did not cover the high concentrations that would have made K close to unity.
Recently, Teraoka and Dubego used a Jamin interferometer to extend the concen- tration range. The interferometry measures the difference in the optical path between two coherent beams, one traveling the external solution and the other illuminating the porous glass bead of diameter ca. 2 mm immersed in the solution. The measurement was facilitated by the matching of refractive index between the solvent and silica, the solid phase of the porous medium. The difference in the optical path is a function of wI and WE, the weight concentrations of the polymer in the pore channels and in the surrounding solution, respectively. With the knowledge of W, and other experimental parameters, IV,, was determined. The interferometer is similar to the one used by Sernetz et a1.53354 to measure the porosity and the partition coefficient for a spherical porous gel (crosslinked polymer). The advantage of the interferometer is that the measurement is carried out in in situ condition, thereby allowing to measure the partition coefficient at high concentrations without being compromised by the high viscosity of the solution that otherwise needs to be transferred into a cell for the concentration measurement. Figure 18 shows the result for three different molecular weights of polystyrene (RF’/&, = 0.23, 0.3 1, and 0.44, respectively). The data contain a large error at low concentrations, because the estimate of the interior concentration relies on the difference from the measurement at zero concentration. The solid lines were calculated from the theory in the same way as in Fig. 16. Except for the fraction of the highest molecular weight, the data are close to the theoretical estimates.
3.5. Partitioning of a polydisperse polymer
Discussion in the preceding sections assumes that polymer in the solution is mono- disperse. As the partitioning depends sensitively on the molecular weight, a solution of polymer consisting of fractions of different molecular weights may exhibit partitioning and other static properties unexpected for the monodisperse systems. When the total concentration of the polymer is low, each fraction will be partitioned with the same coefficient as that for a pure solution of the fraction, because each polymer chain interacts independently with the confining geometry. At higher concentrations, how- ever, strong interactions between polymer chains may change the independence of the partitioning rule.
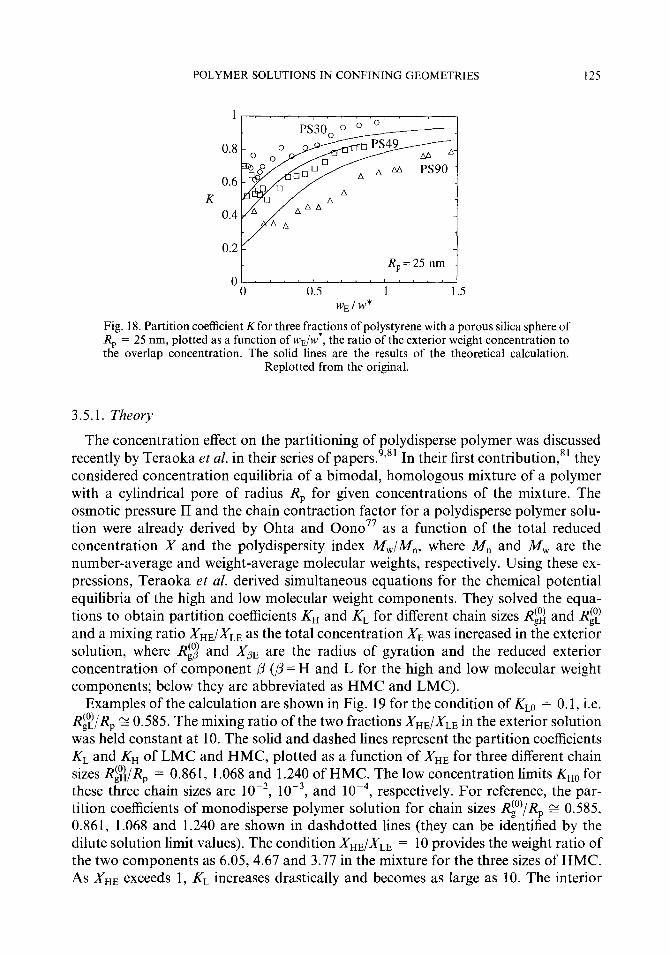
POLYMER SOLUTIONS IN CONFINING GEOMETRIES 125
0.8
0.6
K 0.4
R,=25 nm I ol”““‘-“““l
0 0.5 1 1.5 WE/w*
Fig. 18. Partition coefficient Kfor three fractions of polystyrene with a porous silica sphere of R, = 25 nm, plotted as a function of W&V*, the ratio of the exterior weight concentration to the overlap concentration. The solid lines are the results of the theoretical calculation.
Replotted from the original.
3.5.1. Theory
The concentration effect on the partitioning of polydisperse polymer was discussed recently by Teraoka et al. in their series of papers.9,8’ In their first contribution,” they considered concentration equilibria of a bimodal, homologous mixture of a polymer with a cylindrical pore of radius R, for given concentrations of the mixture. The osmotic pressure II and the chain contraction factor for a polydisperse polymer solu- tion were already derived by Ohta and 0ono77 as a function of the total reduced concentration X and the polydispersity index M,/M,, where M, and &I, are the number-average and weight-average molecular weights, respectively. Using these ex- pressions, Teraoka et al. derived simultaneous equations for the chemical potential equilibria of the high and low molecular weight components. They solved the equa- tions to obtain partition coefficients Ku and KL for different chain sizes RF4 and Rg and a mixing ratio X&X,, as the total concentration X, was increased in the exterior solution, where R$ and X0, are the radius of gyration and the reduced exterior concentration of component ,B (P=H and L for the high and low molecular weight components; below they are abbreviated as HMC and LMC).
Examples of the calculation are shown in Fig. 19 for the condition of Km = 0.1, i.e. Rg/R, z 0.585. The mixing ratio of the two fractions Xn,/X,, in the exterior solution was held constant at 10. The solid and dashed lines represent the partition coefficients KL and Kn of LMC and HMC, plotted as a function of Xn, for three different chain sizes RFJ/R, = 0.861, 1.068 and 1.240 of HMC. The low concentration limits KHO for these three chain sizes are lo-‘, 10-3, and 10P4, respectively. For reference, the par- tition coefficients of monodisperse polymer solution for chain sizes RF’/R, E 0.585, 0.861, 1.068 and 1.240 are shown in dashdotted lines (they can be identified by the dilute solution limit values). The condition Xn,/X,, = 10 provides the weight ratio of the two components as 6.05,4.67 and 3.77 in the mixture for the three sizes of HMC. As Xn, exceeds 1, KL increases drastically and becomes as large as 10. The interior
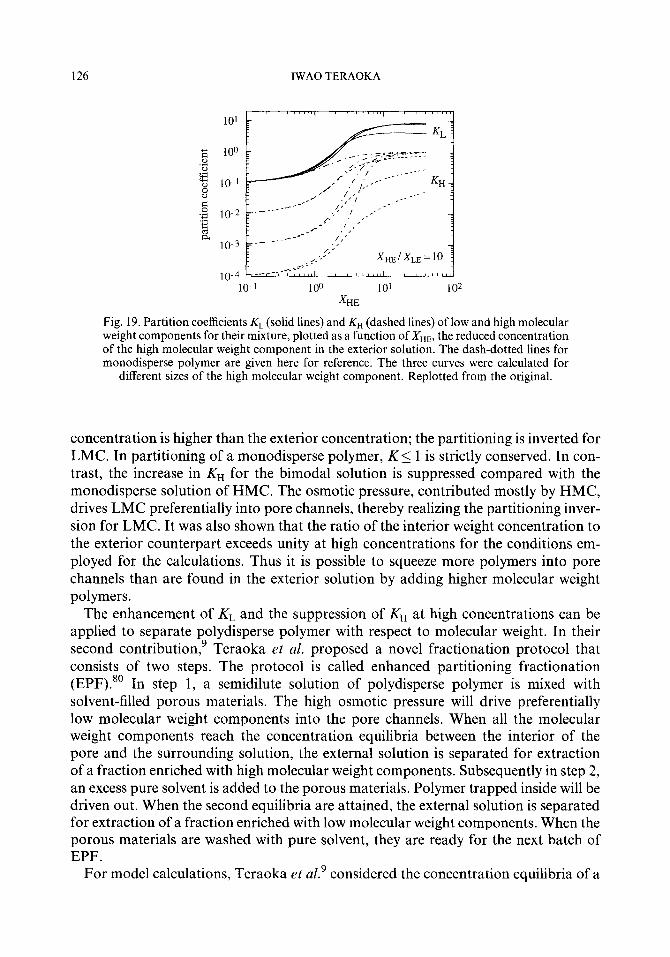
126 IWAO TERAOKA
10-l 100 IO’ 102 XHE
Fig. 19. Partition coefficients KL (solid lines) and KH (dashed lines) of low and high molecular weight components for their mixture, plotted as a function of Ius, the reduced concentration of the high molecular weight component in the exterior solution. The dash-dotted lines for monodisperse polymer are given here for reference. The three curves were calculated for
different sizes of the high molecular weight component. Replotted from the original.
concentration is higher than the exterior concentration; the partitioning is inverted for LMC. In partitioning of a monodisperse polymer, K 5 1 is strictly conserved. In con- trast, the increase in Ku for the bimodal solution is suppressed compared with the monodisperse solution of HMC. The osmotic pressure, contributed mostly by HMC, drives LMC preferentially into pore channels, thereby realizing the partitioning inver- sion for LMC. It was also shown that the ratio of the interior weight concentration to the exterior counterpart exceeds unity at high concentrations for the conditions em- ployed for the calculations. Thus it is possible to squeeze more polymers into pore channels than are found in the exterior solution by adding higher molecular weight polymers.
The enhancement of KL and the suppression of Kn at high concentrations can be applied to separate polydisperse polymer with respect to molecular weight. In their second contribution,’ Teraoka et al. proposed a novel fractionation protocol that consists of two steps. The protocol is called enhanced partitioning fractionation (EPF).” In step 1, a semidilute solution of polydisperse polymer is mixed with solvent-filled porous materials. The high osmotic pressure will drive preferentially low molecular weight components into the pore channels. When all the molecular weight components reach the concentration equilibria between the interior of the pore and the surrounding solution, the external solution is separated for extraction of a fraction enriched with high molecular weight components. Subsequently in step 2, an excess pure solvent is added to the porous materials. Polymer trapped inside will be driven out. When the second equilibria are attained, the external solution is separated for extraction of a fraction enriched with low molecular weight components. When the porous materials are washed with pure solvent, they are ready for the next batch of EPF.
For model calculations, Teraoka et al.’ considered the concentration equilibria of a
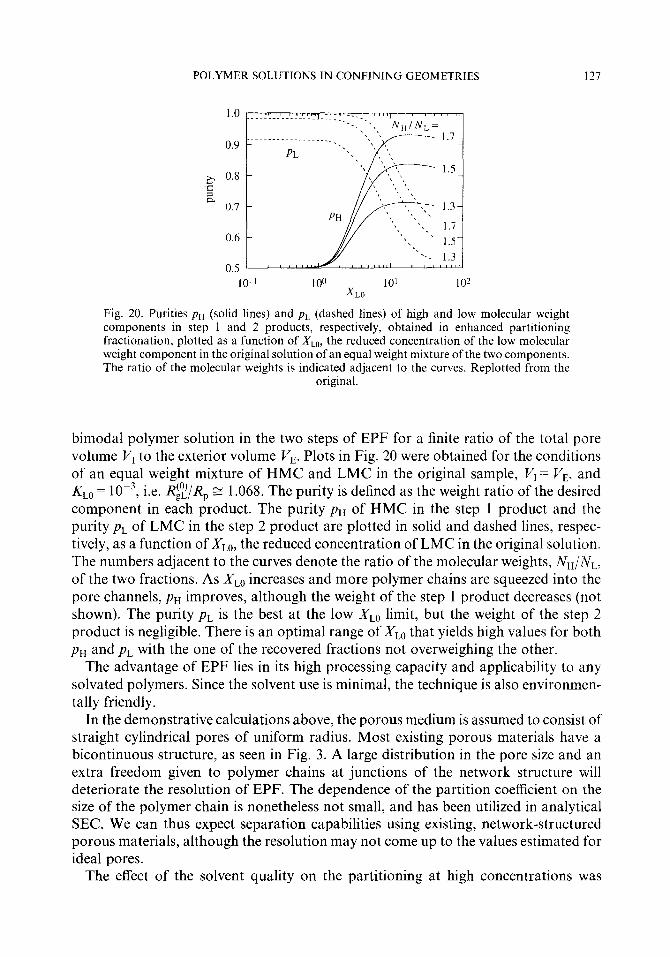
POLYMER SOLUTIONS IN CONFINING GEOMETRIES 127
p, 0.8 2 2.
0.7
0.6
0.5
IO-' 100 10’ 102 XL0
Fig. 20. Purities pH (solid lines) and pL (dashed lines) of high and low molecular weight components in step 1 and 2 products, respectively, obtained in enhanced partitioning fractionation, plotted as a function of /I’m, the reduced concentration of the low molecular weight component in the original solution of an equal weight mixture of the two components. The ratio of the molecular weights is indicated adjacent to the curves. Replotted from the
original.
bimodal polymer solution in the two steps of EPF for a finite ratio of the total pore volume I’, to the exterior volume Vs. Plots in Fig. 20 were obtained for the conditions of an equal weight mixture of HMC and LMC in the original sample, Vi = Vr, and KLO = 10p3, i.e. R!f/Rp g 1.068. The purity is defined as the weight ratio of the desired component in each product. The purity pn of HMC in the step 1 product and the purity pL of LMC in the step 2 product are plotted in solid and dashed lines, respec- tively, as a function of X L0, the reduced concentration of LMC in the original solution. The numbers adjacent to the curves denote the ratio of the molecular weights, Nu/NL, of the two fractions. As XL0 increases and more polymer chains are squeezed into the pore channels, pn improves, although the weight of the step 1 product decreases (not shown). The purity pL is the best at the low XL, limit, but the weight of the step 2 product is negligible. There is an optimal range of X,, that yields high values for both Pu and pL with the one of the recovered fractions not overweighing the other.
The advantage of EPF lies in its high processing capacity and applicability to any solvated polymers. Since the solvent use is minimal, the technique is also environmen- tally friendly.
In the demonstrative calculations above, the porous medium is assumed to consist of straight cylindrical pores of uniform radius. Most existing porous materials have a bicontinuous structure, as seen in Fig. 3. A large distribution in the pore size and an extra freedom given to polymer chains at junctions of the network structure will deteriorate the resolution of EPF. The dependence of the partition coefficient on the size of the polymer chain is nonetheless not small, and has been utilized in analytical SEC. We can thus expect separation capabilities using existing, network-structured porous materials, although the resolution may not come up to the values estimated for ideal pores.
The effect of the solvent quality on the partitioning at high concentrations was
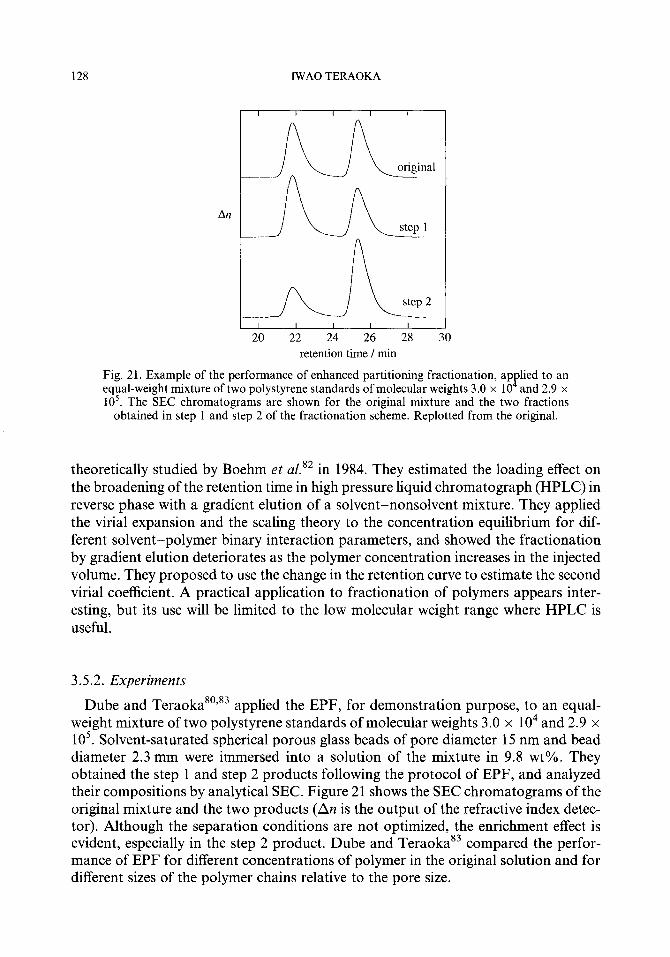
128 IWAOTERAOKA
An
20 22 24 26 28 30
retention time / min
Fig. 21. Example of the performance of enhanced partitioning fractionation, applied to an equal-weight mixture of two polystyrene standards of molecular weights 3.0 x 10 and 2.9 x 10⁵. The SEC chromatograms are shown for the original mixture and the two fractions
obtained in step 1 and step 2 of the fractionation scheme. Replotted from the original.
theoretically studied by Boehm et al.82 in 1984. They estimated the loading effect on the broadening of the retention time in high pressure liquid chromatograph (HPLC) in reverse phase with a gradient elution of a solvent-nonsolvent mixture. They applied the virial expansion and the scaling theory to the concentration equilibrium for dif- ferent solvent-polymer binary interaction parameters, and showed the fractionation by gradient elution deteriorates as the polymer concentration increases in the injected volume. They proposed to use the change in the retention curve to estimate the second virial coefficient. A practical application to fractionation of polymers appears inter- esting, but its use will be limited to the low molecular weight range where HPLC is useful.
3.5.2. Experiments
Dube and Teraokasos3 applied the EPF, for demonstration purpose, to an equal- weight mixture of two polystyrene standards of molecular weights 3.0 x lo4 and 2.9 x 10⁵. Solvent-saturated spherical porous glass beads of pore diameter 15 nm and bead diameter 2.3 mm were immersed into a solution of the mixture in 9.8 wt%. They obtained the step 1 and step 2 products following the protocol of EPF, and analyzed their compositions by analytical SEC. Figure 21 shows the SEC chromatograms of the original mixture and the two products (An is the output of the refractive index detec- tor). Although the separation conditions are not optimized, the enrichment effect is evident, especially in the step 2 product. Dube and Teraoka83 compared the perfor- mance of EPF for different concentrations of polymer in the original solution and for different sizes of the polymer chains relative to the pore size.

POLYMER SOLUTIONS IN CONFINING GEOMETRIES 129
4. DYNAMICS OF POLYMER CHAINS IN CONFINING GEOMETRIES
There is an excellent review on membrane transport by Deen.84 He compared existing theoretical calculations for the diffusive and convective transport coefficients of spherical solutes in a cylindrical pore. He also reviewed experimental data on membrane transport available in publications before 1987. This section therefore focuses on the publications not reviewed by Deen, unless it is necessary to refer to the previous works. First, theories will be reviewed, followed by recent experimental results. The ultrafiltration85-87 that separates small particles from large particles using a high rate of flow across a porous membrane are not reviewed here.
4.1. Theory
4.1.1. Membrane transport
A one-dimensional cylindrical pore has been most often used as a model for con- sidering transport phenomena of solute molecules through a porous medium. Membranes made by track-etching provide a nearly ideal cylindrical pore across the thickness. Two mechanisms for the transport, diffusion and convection, have been formulated.
In the absence of macroscopic flow of solvent, the flux J of the solutes through a pore is proportional to a concentration gradient AC/d,, where a small difference AC in the solute concentration is assumed between two chambers separated by length d, of the pore. The proportionality constant is the membrane diffusion coefficient D,, through the membrane:
AC J=DMo-
dm (54)
The suffix ‘0’ to a diffusion coefficient implies its value in the dilute solution limit. The diffusion coefficient &,, is already corrected for the finite coverage of the membrane surface by the pores, and is smaller than the diffusion coefficient DE0 in the exterior solution by a hindrance factor Hd:
D MO = f&d&o (55)
By definition, transport of small solutes satisfies Hd = 1. When the convective transport is dominant, the flux is proportional to the average
velocity V, of the solvent in the pore. We can define another hindrance factor H,:
J = H,v,c, (56)
where c, is the solute concentration in the high pressure chamber. This second hin- drance factor is important in the ultrafiltration.
As we have seen in Section 3.2, the center of a large solute is not uniformly dis- tributed across the cross section of the pore. The probability p of a solute being contained in the pore is a function of u, the ratio of the solute size to the pore radius, and, X, the ratio of the distance between the center of the solute and the pore center to

130 IWAO TERAOKA
the pore radius. The two hindrance factors are expressed microscopically as
Hd = 2 J lF~l(u,x)p(u,x)xdx 0
H, = 4 J &;x)p(U,X)(l - X2)XdX
(57)
where &’ is the drag by the pore wall, and the lag coefficient c’ expresses the ratio of the velocity of a particle to that of the Poiseuille flow of the solvent.
It is possible to separate the partition coefficient K,(u) from the expression for Hd:
6 = (&&V+$o(I*) (59)
where < . . . > x denotes
and by definition
(60)
K&A) = 2 J ;&x)xdx (61) The centerline approximation replaces Q’ in the integrands of eqn (59) by its value at x=0:
ffd = Fil (U, o)&(U) (62)
The measurement of the membrane diffusion coefficient yields the hindered, intrapore diffusion coefficient D,, always coupled with the partition coefficient:
DMO = DpOKO (63)
where
&IO = (&)I& (64)
The intrapore diffusion coefficient of an isolated polymer chain has not been calcu- lated. Often the molecule was substituted by a hard sphere of radius equal to the hydrodynamic radius RH of the polymer, and an equation for the sphere diffusion was used. For a sphere of radius R, in a cylindrical pore of R,, p(u, x) = 1 for x < 1 - u and 0 for x > 1 - u, where u z RJR,. Brenner and Gaydos88 calculated the average of the drag coefficient with respect to the position of the sphere from the cylinder center- line. In the absence of convection, their result reads
(Fzl)K= 1 + %ulnu - 1.539~ + 0(u2) (65)
This equation (we will call it the B-G equation) is correct in the small u limit, u 5 0.1.

POLYMER SOLUTIONS IN CONFINING GEOMETRIES 131
1 8 I ’ I * I ’
.--___. a,= 10
-. - a, = 60 -
- Renkin
0 I I I I I I,, _
0 0.2 0.4 0.6 0.8 1
RdRp
Fig. 22. Diffusive drag Fd for the intrapore transport of polymer, plotted as a function of RH/ R,, the polymer to pore size ratio. Davidson and Deen substituted the polymer chain with a porous body. The parameter (in expresses resistance to the flow through the porous body.
The Renkin equation is shown for comparison. Replotted from the original.
Another equation for the drag coefficient that has been often used is a so-called Renkin equation: 89
F;‘(u, 0) = (1 - 2.1044~ + 2.0888~~ - 0.948u5)/( 1 - ZL)~ (66)
which accurately gives the diffusion coefficient at the centerline for u < 0.5. Davidson and Deengo made the approximation one step closer to a real polymer
chain in a cylindrical pore, although it employs a centerline approximation. They placed the center of mass of a Gaussian chain at the centerline. The confined chain’s conformation was approximated by Gaussian distributions in the axial and radial directions independently. They replaced the chain by a porous body with a per- meability reciprocally proportional to the square of the segment density, and intro- duced a parameter an that expresses resistance to solvent flow through the porous body. For most polymer chains, op falls between 10 and 60. They solved numerically a set of equations for the stream function under a quiescent condition and a Poiseuille flow condition to obtain the enhanced drag F;;’ and the lag coefficient &‘. Their results for &’ are shown in Fig. 22 as a function of Rn/Rp for two values of au. They also calculated 6’ for ou = 34, but th e result was close to that for au= 60. Comparison with the Renkin equation reveals that it overestimates the drag by the pore wall for large RH/R,.
Pawar and Anderson” calculated < 6’ > for a hard sphere of radius R, in a slit separated by 2R,. As expected, their result
(&l)k== 1 +$lnu- l.19358U+o.159317U3 +O(u4) (67)
is similar to the B-G equation. They showed that eqn (67) agrees well with the reported simulation results,‘* and the centerline approximation does not work.

132 IWAO TERAOKA
In a different approach, Brochard and de Gennes presented23,93 a scaling theory on the diffusion of a polymer chain in a tubelike pore. Based on the similarity between the Oseen tensor and the Coulomb potential, they used the mirror-image method to calculate the linear transfer coefficients that connect the fluxes of the polymer and the solvent and forces acting on them. The intrapore diffusion coefficient D,,, of an isolated chain in the pore was found to follow
D kBT po - ~
QRll (68)
where RI, is given by eqn (29) for an excluded volume chain. Since R,, 0: N, D,, CC N-‘. The friction against translation along the pore is simply the sum of the friction each blob receives from the pore wall. The long-range hydrodynamic interactions between blobs are thus screened by the pore wall. The ratio of Dpo to DE0 is therefore simply expressed as
(69)
They also considered internal modes of the chain trapped in the pore and calculated the relaxation time for the density fluctuation.93
4.1.2. Macroscopic d@usion in a network-structured porous medium
Porous materials produced in sol-gel processes and spinodal decomposition do not have a straight path with uniform cross-section that has been assumed in the theories described above. Recent years have seen development of theories for diffusion of a polymer chain in the network-structured porous medium. There are two contribu- tions. The first one explains a possible very slow diffusion of a linear flexible chain in the porous medium with nonuniform pore size. The second one is for the diffusion of a semiflexible chain with persistence length comparable to the characteristic length of the porous medium.
To treat the effect of the pore size distribution on the diffusion of a polymer chain in the network-structured porous medium, Muthukumar and Baumgtirtner94 considered a three-dimensional array of cubic cavities of side d, connected by bottlenecks of width d,, and length tb to their six adjacent cavities (see Fig. 23). The polymer chain used was a pearl necklace of N spheres of diameter h, connected by bonds of length b. They developed a scaling theory for the macroscopic diffusion coefficient DIo of an isolated chain in the interior of the porous medium. Note that the interior diffusion coefficient is defined as the mean square displacement of the polymer chain in the medium in time t divided by 6t. The central assumption is the following: if the bottlenecks impose an additional entropy penalty AS on the chain conformation, then DIO decreases as
DIO/DIO:~ = eW(A~/b) (70)
where the denominator on the left hand side, DIo,C, is the macroscopic diffusion coeffi- cient in the absence of the bottlenecks. It is equal to DE0 in the scaling theory that pays attention solely to the bottleneck effect. By the same reason, the entropy prefactor K0 appears in the membrane transport of large molecules, as we have seen in eqn (63). In

POLYMER SOLUTIONS IN CONFINING GEOMETRIES 133
Fig. 23. Two-dimensional version of the three-dimensional model for a porous medium consisting of large cavities of size d, and bottlenecks of width d,, and length tb. A polymer chain was generated by a pearl necklace model that consists of N spheres of diameter h,
connected by bonds of length h.
the bottleneck model, AS for a chain partly being contained in the bottleneck is given as
AS =fbASb + (zL_‘(l -h) - l)ASc (71) wherefb is the fraction of monomers in the bottlenecks, z, is the average number of large cavities that contain a part of the chain, and AS, and AS, are the changes in the entropy of the chain when the whole chain is contained in a single long bottleneck and in a single large cavity, respectively, as opposed to the bulk solution state. From eqn
(2% -AS&B N N(b/d,J5j3 and -ASc/kB~N(b/dc)5’3. Hence,
N-‘ln(4dhd = -[hW4J5’3 + (zC’(l -.fb) - l)(h14~5'31 (72) If the bottleneck is sufficiently long or wide to accommodate the chain that now consists of blobs of size db and hence has a dimension of RI, = Nb(b/db)2’3 parallel to the bottleneck, then fb = 1. Otherwise the bottleneck can contain only a part of the chain, and fb= tb/Rll - N-1dt’3. Thus the plot of N-‘ln(D/D,) as a function of l/N will show a crossover from a straight line with a (negative) slope propor- tional to -d<’ [l -(db/dc)5’3/z,] to a constant as the chain becomes shorter. Because of the original assumption, their model is called entropy barrier model.
Diffusion processes of polymer chains in a mazelike porous medium are expected to be different from those of the spheres in a straight cylindrical pore. The difference will be significant for a chain that has a large dimension in the porous medium such as a semiflexible chain. We have seen in Section 3.2.2 that the chain rigidity forces the chain to adopt an extended conformation with RI, E L,, where Rli is the dimension along the

134 IWAO TERAOKA
pore channel. The porous medium can be modeled as a three-dimensional network of straight, hollow cylinders of average length LN jointed at nodes with several cylin- ders.59 When the persistence length L, of the chain is comparable or longer than the average pore radius R,, the long semiflexible chain will find itself in a winding tubelike region extended over more than one cylinders. The centerline of the tube is modeled as another wormlike chain with a persistence length (2X,)-’ that is determined by the pore structure, and (2X,))’ E LN. This second wormlike chain is in concept similar to the primitive chain (path) in the reptation theory.26 The end-to-end distance RF of the trapped semiflexible chain will then have the mean square average
R2F = (RI1 IJ$M2&RII > (73)
where RI, is now measured along the tortuous path of the tube, and the function h(x) is defined as
h(x) = 1 - $1 - exp(-_x)]
When L, < L,, the chain can choose its path at every joint of the hollow cylinders that hold it. Thus the semiflexible chain enjoys a larger partition coefficient compared with a chain with L, > LN does. Furthermore, the chain can select the next cylinder as the chain moves and its head or tail comes to one of the junctions. Teraoka et a1.59 applied the reptation dynamics to the motion of the semiflexible chain that slides along the contour of the tubelike region with the intrapore diffusion coefficient D,,. They cal- culated explicitly the mean square displacement of the center of mass of the chain as a function of time. The motion was found to be diffusional at long times. The macro- scopic diffusion coefficient DiO for long time limit becomes
1 40 = -D,o
h(2&RII 1
3 XPRII (75)
If the chain is sufficiently long, i.e. X,R,,>> 1, then Die = D,,/(3X,RII) cx K2. They also calculated mean square displacement of monomers that exhibit a crossover from fast motion characteristic of a wormlike chain to the reptation dynamics in the tortuous porous medium. Furthermore, they noted that, when L, % 2R,, their model may describe the diffusion of a polyelectrolyte molecule in a crosslinked polymer gel.
The theoretical results reviewed above are for the isolated polymer chain in the straight cylindrical pore or in a tortuous porous medium. There have been no theor- etical considerations about the effect of the solute concentration on the diffusion coefficient in the porous medium.
4.2. Difiwion experiments
4.2.1. Membrane transport
Until the mid 1980’s most of the measurements of the diffusion coefficients of polymer chains in a porous medium were conducted using a porous membrane that separates two chambers.95,96 Figure 24 shows a typical measurement system. A porous
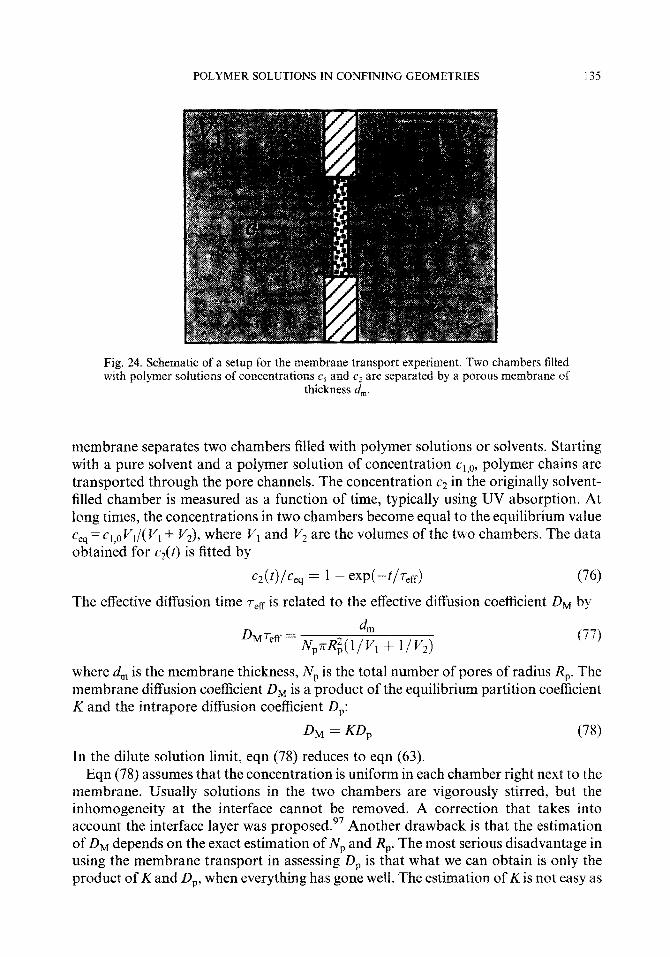
POLYMER SOLUTIONS IN CONFINING GEOMETRIES 135
Fig. 24. Schematic of a setup for the membrane transport experiment. Two chambers filled with polymer solutions of concentrations c, and q are separated by a porous membrane of
thickness d,,,.
membrane separates two chambers filled with polymer solutions or solvents. Starting with a pure solvent and a polymer solution of concentration c~,~, polymer chains are transported through the pore channels. The concentration c2 in the originally solvent- filled chamber is measured as a function of time, typically using UV absorption. At long times, the concentrations in two chambers become equal to the equilibrium value C = c, OV,/( V, + YJ, where P’r and V, are the volumes of the two chambers. The data o%ained for c2(t) is fitted by
~2wlcq = 1 - exp(-t/T,ff) (76)
The effective diffusion time T,~ is related to the effective diffusion coefficient D, by
(77)
where d, is the membrane thickness, Nr, is the total number of pores of radius R,. The membrane diffusion coefficient DM is a product of the equilibrium partition coefficient K and the intrapore di~usion coefficient L),:
D1, = KD,
In the dilute solution limit, eqn (78) reduces to eqn (63).
(78)
Eqn (78) assumes that the concentration is uniform in each chamber right next to the membrane. Usually solutions in the two chambers are vigorously stirred, but the inhomogeneity at the interface cannot be removed. A correction that takes into account the interface layer was proposed.97 Another drawback is that the estimation of DM depends on the exact estimation of NP and R,. The most serious disadvantage in using the membrane transport in assessing I), is that what we can obtain is only the product of Kand D,, when everything has gone well. The estimation of Kis not easy as

136 IWAO TERAOKA
we have seen before. At high concentrations, transport itself will be nonlinear, and eqn (78) will not be valid.
Most of the studies of the membrane transport have focused on the applicability of the B-G equation and the Renkin equation, derived for a hard sphere, to the diffusion of polymer chains smaller than the pore size. The review article by Deen84 examines the data for the hindrance factor Hd obtained for many different polymer-pore systems.
More recently, Kathawalla and Anderson 98 used track-etched mica membranes of five pore sizes to measure the diffusion coefficients DILl for five polystyrene fractions with RH/R, ranging from 0.034 to 0.48. In low concentration experiments, they found that & data were fitted better when RJR, was used for u in the partition coefficient & in eqn (66) in place of RH/R,. With this correction, the Renkin equation was still overestimating Hd for a small u. They tried to explain the disparity by the polydis- persity of the sample.
Davidson and Deen99 reported experiments on the transport of several water- soluble polymers through a track-etched polycarbonate membrane. Their results for &,/DE were mostly larger than the theoretical estimates given by themselves.” They ascribed the difference to the attractive interaction between polymers and the pore walls. More importantly, they compared existing results for D&D, obtained by several groups with their theoretical curve and the Renkin equation. The better agreement between experiments and the Davidson-Deen curve showed that their theoretical model that replaces a polymer chain with a porous sphere can well explain the enhanced drag for the diffusive transport.
Bohrer et al. loo studied the dependence of the membrane transport of polymer on its architecture. Polyisoprene off’ = 2 (linear), 8, 12, and 18 were used. The hindrance factor Hd, plotted as a function of RH/R,, was much smaller for star isoprenes than for linear isoprenes. They tried to explain the disparity by applying Casassa’s formula for the partition coefficient of star-shaped polymer. The results of the calculation for fA=2, 8, 12, and 18 h s owed, however, little dependence on f*. It appears that the large reduction in Hd is due to a decrease in F;' that results from a stronger hydro- dynamic interaction between pore walls and the packed monomers in star polymers.
The concentration dependence of &, was studied by Guillot97. He measured DM for different initial concentrations c1,o of two fractions of polystyrene (RH = 24 and 58 nm) through a track-etched polycarbonate membrane with a pore radius R, = 75 nm. A nonlinear effect was evident. As cl,0 increased, DILl increased, for the two polystyrene samples. The increase was larger for the longer chain of the polystyrene fractions that, in the dilute solution limit, has a smaller partition coefficient. The increase in D, was as large as 250 fold. He ascribed the huge increase in DM to the increase in K that resulted from equilibration in the chemical potential of the polystyrene fraction be- tween the chamber 1 and the pore channels, as theoretically considered by Daoud and de Gennes.33 The transport experiment was, however, carried out under a strong nonequilibrium condition. It was therefore difficult to develop quantitative discussion. Furthermore, the dependence of the intrapore diffusion coefficient D, on the concen- tration of polymer in the pore channels is not expected to be small.

POLYMER SOLUTIONS IN CONFINING GEOMETRIES 137
In the following contribution, Guillotlo’ extended his nonlinear transport experi- ments to a bimodal mixture of polystyrene fractions different in molecular weight. The shorter chains were labeled by spiropyran. He used UV-vis absorption and ultra- centrifuge to measure the percentage of the two polymers in each chamber. He observed slow transport of the long chains at low initial concentrations and accelera- tion of the transport at increased initial concentrations. Also he could observe a higher concentration of the short chains in chamber 2 at intermediate time scale. He explained these findings by the weak-to-strong penetration transition33 that results from the high osmotic pressure of the concentrated solution, but the discussion was qualitative.
4.2.2. Transient d@ision
It is possible to estimate the diffusion coefficient of polymer in the porous medium by measuring the concentration decrease in the exterior solution as a function of time after porous materials are immersed into the polymer solution. This method was employed by Colton et a1.22 Complications due to non uniformity of the porous materials and irregular material shapes made the interpretation of the transient diffu- sion data unreliable.
4.2.3. Dynamic light scattering
Introduction of dynamic light scattering (DLS) technique to the studies of dynamics of chain molecules in the interior of a porous medium in mid 1980’s has changed the situation. DLS has enabled to measure directly the diffusion coefficient D, in the porous medium.”
A laser beam was focused onto a single piece of porous silica glass (surface treated) placed at the center of a test tube that contained a polymer solution, and photons scattered only by a portion of the porous glass were collected, as shown in Fig. 25. Unlike the measurement of the transport coefficients of polymer chains through por- ous membranes, DLS measurements provided a direct account on the chain diffusion in the network-structured porous medium at equilibrium. There is no need for the knowledge of the partition coefficient. Another merit of the DLS setup is that by lowering the test tube it allows the measurement of the exterior diffusion coefficient DE in the equilibrium condition.
The application of DLS was initiated by Bishop et al. lo A solvent isorefractive with silica at easily accessible temperatures was used, typically 2-fluorotoluene (2FT); the exact matching temperature varied, depending on the minority components in the solid phase of the porous medium. The dissolved polymer was selected to have a non-zero differential refractive index with the solvent. Thus, the situation was realized in which the polymer was the only visible species in the interior of the porous medium as well as in the surrounding solution. However, even at the best index-matching condition, spatial fluctuations in the refractive index in the solid phase scattered photons. Those photons turned out to be overwhelming compared with photons

138 IWAO TERAOKA
laser
. interior
Fig. 25. Dynamic light scattering for the measurement of the diffusion coefficient of polymer molecules in a porous glass bead immersed in a polymer solution. By lowering the test tube,
the exterior diffusion coefficient can be readily measured.
scattered by the polymer chains in the pore channels. As the scattering of photons by the solid phase is elastic, they constitute a local oscillator for the photons scattered by the polymers in this unique heterodyne measurement. The autocorrelation function fi(t) of the intensity of light scattered by the interior of the porous medium is then expressed as fr(t) = B[l +fcg,(t)], w h ere B is the baseline level, f, is the coherence factor, and gi(t) is the baseline-subtracted, normalized electric-field autocorrelation function.‘02 A strong heterodyne conditionf, < 1 is assumed. In contrast, the scatter- ing from the external solution gives the autocorrelation function,fr(t) = B[l +f&(t)], where f, can be as large as 1.
The length scale explored in DLS is expressed by l/k,, where k, is the magnitude of the scattering vector. It is related with the system arrangement of DLS by k,= (4nn,/XO)sin(S/2), where ~1, is the solvent refractive index, X,, is the wavelength of light in vacuum, and 0 is the scattering angle. A proportionality of the average decay rate < l? > of g,(t) to ki implies that the density fluctuation follows a diffusion equation over the relevant distance. The apparent diffusion coefficient D app can then be defined by Dapp = < F > /kf. In the dilute solution limit, the diffusion coefficients Dapp measured for the exterior and the interior solutions are identified as those of isolated chains, DE0 and DIo, in the respective environments. Note that, in general, DIo CD,,,; D,,, is the diffusivity along the pore channel, whereas DIo is its isotropic average in the tortuous porous medium.
In a series of DLS experiments, a group led by Karasz and Langley studied various diffusion processes of polymer molecules in the interior of the porous medium (con- trolled pore glass) equilibrated with an external polymer solution for different polymer systems and conditions.“,’ 1,73103-109 A brief summary of the studies are given below.

POLYMER SOLUTIONS IN CONFINING GEOMETRIES 139
0 i I 8 I 0 0.1 0.2 0.3 0.4 0.5
RI&
Fig. 26. The interior to exterior diffusion coefficient ratio, D~~~~~~ platted as a function of RH/R,, the polymer to pore size ratio, for three different pore sizes. Replotted from the
original.
4.2.3.1. Scattering vector dependence A network-structured porous medium has a characteristic length R,. Autocorrela-
tion functions measured at k,R, < 1 and ksRp > 1 may exhibit a difference. Bishop et al. “Jo measured autocorrelation functionsfr(t) in a wide range of k,R,. At scattering angles k,R, 2 0.7,,f,(t) decayed with a single decay rate of D,,,kf to a baseline level. For all combinations of RH and RP, I),, < I&. At these low scattering angles, details of the tortuous pore, in which the solid phase and the pore channels are approximately alternating, are averaged, yielding a macroscopic diffusion coefficient III0 of the poly- mer in the solvent-filled space of the porous medium. As ksRP increased, g,(t) began to deviate from a single exponential decay. At higher scattering angles (but k,RH was still low), the broadness in the distribution in the decay rate r was again smaller, and the initial decay rate approached D,,-,kf. Thus Dapp was again able to be defined, and Dapp approached DEO. This result indicated that a di~usion over a distance smaller than the pore size is similar to the unrestricted diffusion in the exterior solution. The other DLS results shown below are mostly focused on low scattering angle measurements.
4.2.3.2. Molecular weight dependence Bishop et a1.‘03” also explored the dependence of III0 on the dimension of poly-
styrene standards in 2FT for R,/R, < 0.2. They observed that in the dilute regime LIE and II, depend similarly on the weight concentration WE of the external solution. Therefore Q/D, measured at l/S of the reciprocal of the intrinsic viscosity was con- sidered to be a good estimate of DIO/D,, and that concentration secured a reasonable signal level not embedded in the high baseline level. For all combinations of RH and R, studied, D,,/D,, decreased as RH/R, increased, indicating stronger hydrodynamic interactions between pore walls and the polymer chain, see Fig. 26. At the vanishing limit of RH/RP, ~~~/~~~ approached a value smaller than unity, a result ascribed to a tortuosity of the porous medium. The limiting value x0 is the intrinsic conductivity of the medium, and its reciprocal is the tortuosity. Bishop et al.” found that x0 depends on R, and the structure of the medium. They showed that the data points lie on a
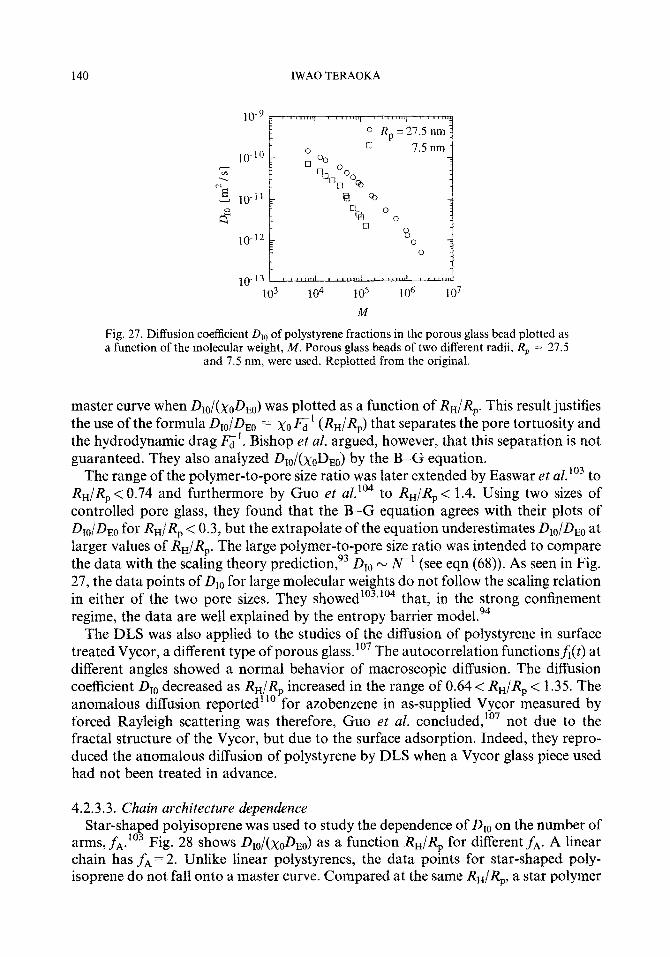
140 IWAO TERAOKA
Fig. 27. Diffusion coefficient D,, of polystyrene fractions in the porous glass bead plotted as a function of the molecular weight, M. Porous glass beads of two different radii, R, = 27.5
and 7.5 nm, were used. Replotted from the original.
master curve when D1o/(xOD,O) was plotted as a function of R,/R,. This result justifies the use of the formula &-JD E0 the hydrodynamic drag &‘.
= x0&’ (R,/R,) that separates the pore tortuosity and Bishop et al. argued, however, that this separation is not
guaranteed. They also analyzed ~~o~(xoD~*) by the B-G equation. The range of the polymer-to-pore size ratio was later extended by Easwar et do3 to
R,/R, -=I 0.74 and furthermore by Guo et ~1.“~ to RH/R, < 1.4. Using two sizes of controlled pore glass, they found that the B-G equation agrees with their plots of ~~o~~~o for RN/R, < 0.3, but the extrapolate of the equation underestimates ~~*~~~o at larger values of R,/R,. The large polymer-to-pore size ratio was intended to compare the data with the scaling theory prediction,93 Dto N N-’ (see eqn (68)). As seen in Fig. 27, the data points of Dto for large molecular weights do not follow the scaling relation in either of the two pore sizes. They showed 1039104 that, in the strong confinement regime, the data are well explained by the entropy barrier mode1.94
The DLS was also applied to the studies of the diffusion of polystyrene in surface treated Vycor, a different type of porous glass.lo7 The autocorrelation functionsfI(t) at different angles showed a normal behavior of macroscopic diffusion. The diffusion coefficient D,, decreased as RH/R, increased in the range of 0.64 < RH/R, < 1.35. The anomalous di~usion reported”’ for azobenzene in as-supplied Vycor measured by forced Rayleigh scattering was therefore, Guo et al. concluded,‘07 not due to the fractal structure of the Vycor, but due to the surface adsorption. Indeed, they repro- duced the anomalous diffusion of polystyrene by DLS when a Vycor glass piece used had not been treated in advance.
4.2.3.3. Chain architecture deperzdence Star-shaped polyisoprene was used to study the dependence of Die on the number of
arms, fA.‘03 Fig. 28 shows DIO/(xfiEO) as a function RH/R, for different fA. A linear chain has fA= 2. Unlike linear polystyrenes, the data points for star-shaped poly- isoprene do not fall onto a master curve. Compared at the same RH/R,, a star polymer

POLYMER SOLUTIONS IN CONFINING GEOMETRIES 141
0.6------J 0 0.02 0.04 0.06 0.08 0.1
RH’RP
Fig. 28. Diffusion coefficient D,,, reduced by its short chain limit x&, for linear poly- isoprene (Zarm) and 4- and 8-arm star polyisoprenes, plotted as a function of R,/R,, the
polymer to pore size ratio. Replotted from the original.
with more arms, and hence closer to a non-draining sphere, receives a larger hindrance from the pore walls. To fit the data to the B-G equation obtained for a hard sphere, Easwar et al. introduced an adjustable parameter K by R, = KRH, where R, is the Stokes radius to be used in the B-G equation. The best fit (solid lines in Fig. 28) resulted in K = 0.76,0.83, and 0.94 forfA = 2,4, and 8, respectively. They also showed that linear polystyrene has a larger 6 than polyisoprene does.
As a polymer molecule closer to a hard sphere, Guo et al. lo6 used a dendritic poly(amino amine) with end amines modified to be dissolved in organic solvents. In controlled pore glasses with different R, but with a similar structure, the B-G equation was best fitted to the DLS data for D,,,/(xODEo) with 6 = 0.98.
In another approach, the DLS study was conducted for polystyrene in near 0 solvent conditions.“’ They took advantage of trans-decahydronaphthalene (TD) being nearly isorefractive with silica and at the same time being a 0 solvent for polystyrene at around 20°C. The interior to exterior diffusion coefficient ratio, Or/ D,, was smaller for the measurement in TD than it was in 2FT, a good solvent, for four fractions of polystyrene studied. Figure 29 compares the reduced diffusion coeffi- cient, @t//Q’, in the two solvents, corrected for the solvent viscosity and the temperature. The plot is given as a function of RH/R,, the polymer to pore size ratio. Zhou et al. argued that the higher monomer density of polystyrene in 0 solvent resulted in the stronger hydrodynamic interactions with the pore walls. This result is in agreement with the results for star-shaped polyisoprene mentioned above.io3 Zhou et al. also measured the autocorrelation functions fI(t) as the tem- perature was raised and the solvent became better to polystyrene. The increase in Di was smaller than in D,. They ascribed the apparent larger friction against trans- lational motion of the chains in the porous medium to the increased interaction between chains at finite concentrations”‘,“* as their dimension increased at higher temperatures.
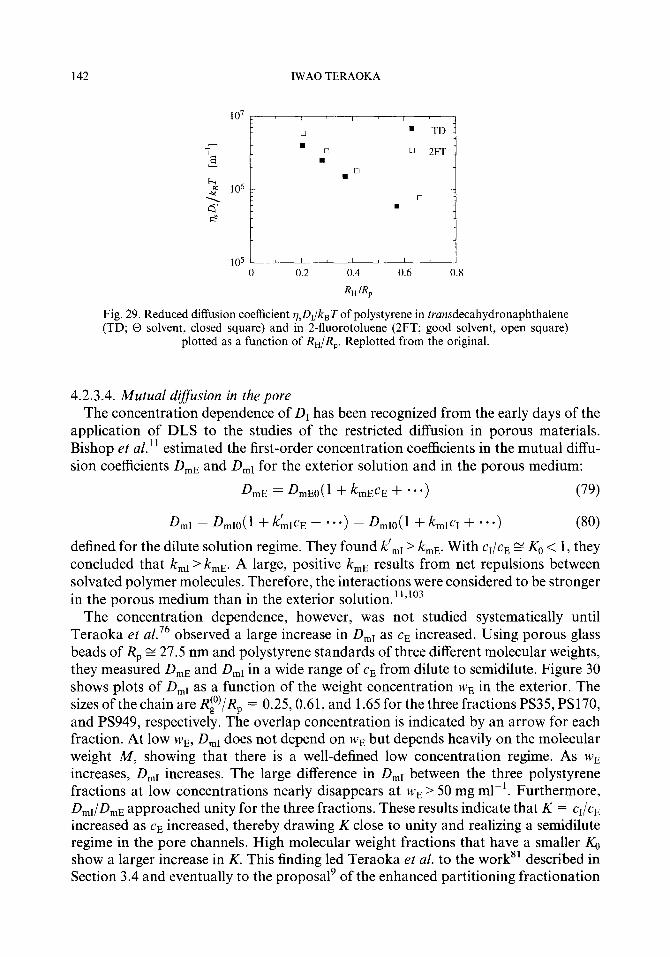
142 IWAO TERAOKA
‘O’ r- ’ , . TD
. 0
.
0 .
0 2l7r
105’ ’ / I I
0 0.2 0.4 0.6 0.8
hi /R,
Fig. 29. Reduced diffusion coefficient g,D,/k,T of polystyrene in transdecahydronaphthalene (TD; 0 solvent, closed square) and in 2-fluorotoluene (2FT; good solvent, open square)
plotted as a function of R,/R,. Replotted from the original.
4.2.3.4. Mutual d$%sion in the pore The concentration dependence of Dr has been recognized from the early days of the
application of DLS to the studies of the restricted diffusion in porous materials. Bishop et al.” estimated the first-order concentration coefficients in the mutual diffu- sion coefficients DmE and D,t for the exterior solution and in the porous medium:
D mE = &EO(~ + knECE + ‘-> (79)
DmI = D,to(l +&IQ + . ..) = DmIo(l + kmIcI + -) (80)
defined for the dilute solution regime. They found klmI > kmE. With cr/cE C% K. < 1, they concluded that k,t > I&. A large, positive kmE results from net repulsions between solvated polymer molecules. Therefore, the interactions were considered to be stronger in the porous medium than in the exterior solution.“,to3
The concentration dependence, however, was not studied systematically until Teraoka et a1.76 observed a large increase in D,, as cE increased. Using porous glass beads of R, E 27.5 nm and polystyrene standards of three different molecular weights, they measured D,, and DmI in a wide range of cE from dilute to semidilute. Figure 30 shows plots of Dm, as a function of the weight concentration WE in the exterior. The sizes of the chain are Rf’)/Rp = 0.25,0.61, and 1.65 for the three fractions PS35, PS170, and PS949, respectively. The overlap concentration is indicated by an arrow for each fraction. At low WE, D,, does not depend on WE but depends heavily on the molecular weight M, showing that there is a well-defined low concentration regime. As WE increases, DmI increases. The large difference in D,, between the three polystyrene fractions at low concentrations nearly disappears at WE > 50 mg ml-‘. Furthermore, DmI/DmE approached unity for the three fractions. These results indicate that K = cI/cE increased as cE increased, thereby drawing K close to unity and realizing a semidilute regime in the pore channels. High molecular weight fractions that have a smaller K. show a larger increase in K. This finding led Teraoka et al. to the work” described in Section 3.4 and eventually to the proposal’ of the enhanced partitioning fractionation
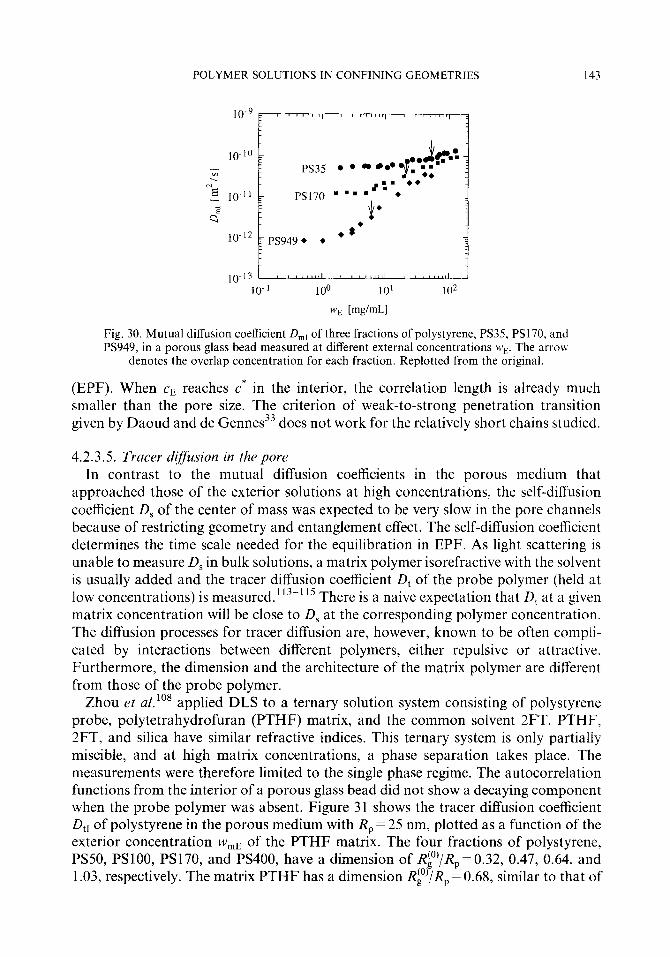
POLYMER SOLUTIONS IN CONFINING GEOMETRIES 143
PS35
PSI70
PS949 l l
lo-l3 3, IO-’ 100 10’ 102
wE [mg/mL]
Fig. 30. Mutual diffusion coefficient D,, of three fractions of polystyrene, PS35, PS170, and PS949, in a porous glass bead measured at different external concentrations wE. The arrow
denotes the overlap concentration for each fraction. Replotted from the original.
(EPF). When CE reaches C* in the interior, the correlation length is already much smaller than the pore size. The criterion of weak-to-strong penetration transition given by Daoud and de Gennes33 does not work for the relatively short chains studied.
4.2.3.5. Tracer d@usion in the pore In contrast to the mutual diffusion coefficients in the porous medium that
approached those of the exterior solutions at high concentrations, the self-diffusion coefficient D, of the center of mass was expected to be very slow in the pore channels because of restricting geometry and entanglement effect. The self-diffusion coefficient determines the time scale needed for the equilibration in EPF. As light scattering is unable to measure D, in bulk solutions, a matrix polymer isorefractive with the solvent is usually added and the tracer diffusion coefficient D, of the probe polymer (held <at low concentrations) is measured. ’ 13-’ I5 There is a naive expectation that D, at a given matrix concentration will be close to D, at the corresponding polymer concentration. The diffusion processes for tracer diffusion are, however, known to be often comph- cated by interactions between different polymers, either repulsive or attractive. Furthermore, the dimension and the architecture of the matrix polymer are different from those of the probe polymer.
Zhou et al.lo8 applied DLS to a ternary solution system consisting of polystyrene probe, polytetrahydrofuran (PTHF) matrix, and the common solvent 2FT. PTHF, 2FT, and silica have similar refractive indices. This ternary system is only partially miscible, and at high matrix concentrations, a phase separation takes place. The measurements were therefore limited to the single phase regime. The autocorrelation functions from the interior of a porous glass bead did not show a decaying component when the probe polymer was absent. Figure 31 shows the tracer diffusion coefficient D,, of polystyrene in the porous medium with R, = 25 nm, plotted as a function of the exterior concentration w,E of the PTHF matrix. The four fractions of polystyrene, PS50, PSlOO, PS170, and PS400, have a dimension of Rr’/Rp = 0.32, 0.47, 0.64, and 1.03, respectively. The matrix PTHF has a dimension Rr)/Rp = 0.68, similar to that of

144 IWAO TERAOKA
l *. . .
l * .
l *
PS50 :
PSlOO -
PS170 :
Fig. 3 1. Tracer diffusion coefficient D,r of four fractions of polystyrene, PS50, PSlOO, PSI 70, and PS400, in a porous glass bead measured at different external concentrations w,s of matrix polytetrahydrofuran. The arrow denotes the overlap concentration of the matrix.
Replotted from the original.
PS170, and has an overlap concentration of 11.7 mg ml-’ (indicated by an arrow in the figWe). III the dilute range of w&, D,i decreased rapidly. The decrease slowed down, especially for PS50, as the w,r increased and the exterior solution approached the cloud point. Zhou et al. noted a similarity between this result and the upturn in the tracer diffusion coefficient DtE observed in other bulk ternary polymer solutions.’ 16-’ l8
From the dilute regime measurements and the estimated small partition coefficient for PTHF in the concentration range, they estimated that the first-order concentration coefficient k,t is an order of magnitude larger than the exterior solution counterpart ktr, where ktE and ktl are defined in a way similar to eqn (79) and eqn (80) for DtE and
&I. The mutual diffusion coefficients and the tracer diffusion coefficients in the exterior
solution and in the porous medium are compared in Fig. 32 for PS170 and PTHF that have a similar dimension. The DmE and D,, are plotted as a function of WE, DtE and DtI are plotted as a function of w,&. At low external concentrations, the change in DtI is larger than in DtE and in D,,, suggesting a strong hindrance against diffusion by neighboring polymer chains in quasi one-dimensional pore channels. At higher con- centrations, a decrease in DtE is most striking. In contrast, DtI decreases relatively slowly, probably because of the repulsion between PS170 and PTHF.
4.2.3.6. Short-time d@usion Short-time diffusion processes in the porous medium were studied by Guo et a1.1o5
From gl(t) measured for k,R, around 0.8, they calculated the time dependent diffusion coefficient DI(t) that they defined by DI(t) G -a(lngl/k@. They found that, starting from DI(t) E DEO, DI(t) decreased monotonically to the long-time diffusion coefficient DIO. The transition time was in good agreement with the time necessary for the chain to diffuse the distance of R, with the bare diffusion coefficient DEO.

POLYMER SOLUTIONS IN CONFINING GEOMETRIES a45
LANAI I #A 0.1 1 IO
W&*, we&* [mg/mL]
Fig. 32. Mutual diffusion coefficients DmE and D,, (open symbols) and the tracer diffusion coefficients DtE and DtI (closed symbols) are compared as functions of the reduced poly- styrene concentration wE/w* and the reduced matrix PTHF concentration w,,/w~ in the
exterior solution.
4.2.4. Other experimental techniques
Other experimental techniques can be used to study diffusion processes in a porous medium. Pulsed field gradient NMR was used to measure the diffusion coefficient of small molecules in porous glasses.‘l’
Guo et ~1.‘~’ applied forced Rayleigh scattering to the studies of diffusion of dye- labeled polystyrene in thick suspensions of fumed silica particles. The surface of the silica was carefully modified to avoid adsorption of the polymer. The decay rate constant l/r was found to be proportional to ki, where k, is defined for forced Rayleigh scattering by k, = 2x/d with d the period of the photoexcited pattern. The diffusion coefficient calculated as l/(rkz) decreased as the volume fraction of the silica particles increased for two different molecular weights of polystyrene.
4.2.5. Simulations
To consider the effect of convection or flow field on transport of spherical particles through a membrane, Sahimi and Jue121 conducted a computer simulation. They modeled the membrane as a cubic network of cylindrical pores with nonuniform pore radius. Constructing equations for Laplace transformed node concentrations, they calculated the macroscopic diffusivity through the membrane under pressure difference across it. They found that the convection increases the macroscopic diffu- sivity, and the effect becomes larger as the sphere radius increases. They also noted that the B-G equation and the Renkin equation have a linear relationship between ln(D,/D,) and RJR,.
Muthukumar and Baumgartner45,94 performed a computer simulation using the model shown in Fig. 23. Their results stimulated theoretical works44,94 including their own entropy barrier model. They investigated the time evolution of the mean square displacement of the center of mass of the chain over several decades of time. Simulations were conducted for different chain lengths Nand the bottleneck widths d,,.
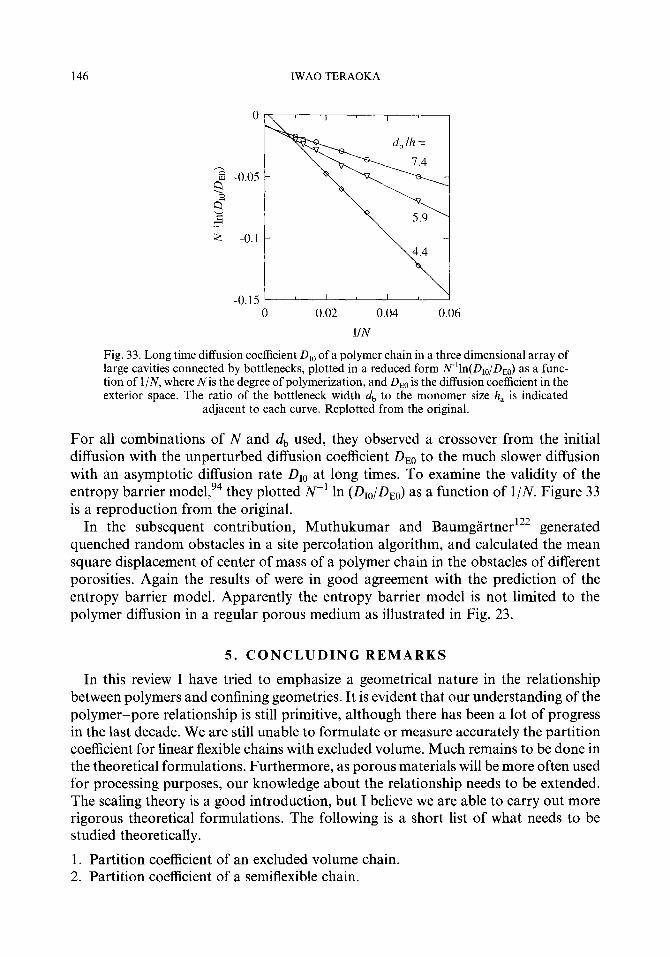
146 IWAO TERAOKA
-0.15 - 0 0.02 0.04 0.06
1IN
Fig. 33. Long time diffusion coefficient D,, of a polymer chain in a three dimensional array of large cavities connected by bottlenecks, plotted in a reduced form N~‘ln(D,,/D,) as a func- tion of l/N, where N is the degree of polymerization, and DE0 is the diffusion coefficient in the exterior space. The ratio of the bottleneck width db to the monomer size h, is indicated
adjacent to each curve. Replotted from the original.
For all combinations of N and d,, used, they observed a crossover from the initial diffusion with the unperturbed diffusion coefficient DE0 to the much slower diffusion with an asymptotic diffusion rate DrO at long times. To examine the validity of the entropy barrier mode1,94 they plotted N-i In (D,,/D,,) as a function of l/N. Figure 33 is a reproduction from the original.
In the subsequent contribution, Muthukumar and Baumgartner122 generated quenched random obstacles in a site percolation algorithm, and calculated the mean square displacement of center of mass of a polymer chain in the obstacles of different porosities. Again the results of were in good agreement with the prediction of the entropy barrier model. Apparently the entropy barrier model is not limited to the polymer diffusion in a regular porous medium as illustrated in Fig. 23.
5. CONCLUDING REMARKS
In this review I have tried to emphasize a geometrical nature in the relationship between polymers and confining geometries. It is evident that our understanding of the polymer-pore relationship is still primitive, although there has been a lot of progress in the last decade. We are still unable to formulate or measure accurately the partition coefficient for linear flexible chains with excluded volume. Much remains to be done in the theoretical formulations. Furthermore, as porous materials will be more often used for processing purposes, our knowledge about the relationship needs to be extended. The scaling theory is a good introduction, but I believe we are able to carry out more rigorous theoretical formulations. The following is a short list of what needs to be studied theoretically.
1. Partition coefficient of an excluded volume chain. 2. Partition coefficient of a semiflexible chain.

POLYMER SOLUTIONS IN CONFINING GEOMETRIES 147
3. Partitioning of polymer with a porous medium generated in spinodal decomposi- tion and leaching.
4. Weak-to-strong penetration transition of rodlike molecules and semiflexible chains. How does the isotropic-to-nematic phase transition affect the partitioning at high concentrations?
5. Diffusion of a polymer chain in a porous medium generated in spinodal decom- position and leaching.
6. Mutual diffusion and self-diffusion coefficients of hard spheres and polymer chains in a cylindrical pore.
7. Concentration equilibria of a ternary polymer solution that consists of two poly- mers and a common solvent. How does the binary interaction affect the equilibria?
As dynamic light scattering has brought a whole new range of studies on the diffu- sion processes in a porous medium, we need to develop experimental techniques that may revolutionize our knowledge about the polymer-pore relationship. Availability of porous materials with a better-de~ned geometry in a variety of pore shapes and with different solid phase materials will facilitate future experiments. Capabilities of com- puter simulation also need to be fully explored.
A strong thrust is expected in the separation techniques that use the high osmotic pressure of the semidilute polymer solution and the size exclusion by porous materials. The enhanced partitioning fractionation is just the beginning in an array of techniques that are being developed. Cost-effectiveness and environmental benignity will be the driving force. Practical application of these techniques to actual processing of various polymers will encourage fundamental research in the polymer-pore relationships as well as in the nondilute polymer solution systems in general.
1. 2. 3. 4. 5. 6. 7. 8.
9. 10. 11. 12.
13. 14.
15. 16. 17. 1%.
REFERENCES
F. S. Bates and G. H. Fredrickson, Ann. Rev. Phys. Chem. 41, 525 (1990). J. C. Giddings, Unified Separaf~on Science, John Wiley, New York (1991). H. Tanaka, Phys. Rev. Lelt. 70, 53 (1993). H. Tanaka, Whys. Rev. Lett. 70, 2770 (1993). S. F. Edwards, J. Phys. A8, 1670 (1975). S. F. Edwards and E. F. Jeffers, J. Chem. Sot. Farada?) Trans. 2 15, 1020 (1979). T. Halilojjlu and W. L. Mattice, Macromolecules 26, 3137 (1993). C. Howe, N. Vasanthan, C. MacClamrock, S. Sankar, 1. D. Shin, I. IS. Simonsen and A. E. Tonelli, Macromolecules 27,7433 (1994). I. Teraoka, Z. Zhou, K. H. Langfey and F. E. Karasz, Macromolecules 26,6081 (1993). M. T. Bishop, K. H. Langley and F. E. Karasz, Phys. Rev. Lett. 57, 1741 (1986). M. T. Bishop, K. H. Langley and F. E. Karasz, Macromolecules 22, 1220 (1989). K. K. Unger, J. Rouquerol, K. S. W. Sing and H. Kral (Eds.), Characterization of porous solids, Elsevier, Amsterdam (1988). J. M. Drake and J. Klafter, Physics Today 43,46 (1990). R. R. Bhave (Ed.), Znorganic membranes: Synthesis, characteristics, and applications, Van Nostrand Reinhold, New York (1991). G. Guillot and F. Rondelez, J. Appl. Phys. 52, 7155 (1981). R. J. Tonucci, B. L. Justus, A. J. Campillo and C. E. Ford, Science 258, 783 (1992). CPG Inc. “Controlled-pore glass”. C. J. Brinker and G. W. Scherer. Sol-gel science: The ph_vsics and chemistry ofso~-gel pro~es~~ing, Academic Press, San Diego (1990).
148 IWAO TERAOKA
19. S. Lowell and J. E. Shields, Powder surface area andporosity, Third Edition, Chapman and Hall, London (1991).
20. J. Zarzycki, Glasses and the vitreous state, Cambridge University Press, Cambridge (1991). 21. PCR Inc. (1992). 22. C. K. Colton, C. N. Satterfield and C.-J. Lai, AIChEJ. 21,289 (1975). 23. P. G. de Gennes, Scaling Concepts in Polymer Physics, Cornell Univ. Press, Ithaca (1979). 24. E. F. Casassa, J. Polym. Sci. Poly. Lett. Ed. 5, 773 (1967). 25. A. Y. Grosverg and A. R. Khokhlov, Statistical Physics of Macromolecules, American Institute of
Physics, New York (1994). 26. M. Doi and S. F. Edwards, The Theory of Polymer Dynamics, Clarendon Press, Oxford (1986). 27. E. F. Casassa and Y. Tagami, Macromolecules 2, 14 (1969). 28. M. G. Davidson, U. W. Suter, and W. M. Deen, Macromolecules 20, 1141 (1987). 29. A. Yethiraj and C. K. Hall, Macromolecules 23, 1865 (1990). 30. A. Yethiraj and C. K. Hall, Molec. Phys. 73, 503 (1991). 31. J. C. Giddings, E. Kucera, C. P. Russell, and M. N. Myers, J. Phys. Chem. 72, 4397 (1968). 32. R. J. Gaylord and D. L. Lohse, J. Chem. Phys. 65, 2779 (1976). 33. M. Daoud and P. G. de Gennes, J. Phys. (Paris) 38, 85 (1977). 34. Y. Chen and M. Muthukumar, Phys. Rev. B 33,6187 (1986). 35. F. Brochard-Wyart and E. Raphael, Macromolecules 23, 2276 (1990). 36. A. Halperin and S. Alexander, Macromolecules 20, 1146 (1987). 37. M. Daoud and J. P. Cotton, J. Phys. (Paris) 43, 531 (1982). 38. E. Raphael and P. Pincus, J. Phys. ZZ (Paris) 2, 1341 (1992). 39. T. Odijk, Macromolecules 16, 1340 (1983). 40. R. G. Priest, J. Appl. Phys. 52, 5930 (1981). 41. J. H. Aubert and M. Tirrell, J. Chem. Phys. 77, 553 (1982). 42. T. A. Vilgis, J. Phys. ZZ (Paris) 2, 2097 (1992). 43. L. A. Fanti and E. D. Glandt, AZChE J. 35, 1883 (1989). 44. S. F. Edwards and M. Muthukumar, J. Chem. Phys. 89,2435 (1988). 45. A. Baumgartner and M. Muthukumar, J. Chem. Phys. 87, 3082 (1987). 46. M. Muthukumar, J. Chem. Phys. 90,4594 (1989). 47. J. D. Honeycutt and D. Thirumalai, J. Chem. Phys. 90,4542 (1989). 48. J. D. Honeycutt, D. Thirumalai and D. K. Klimov, J. Phys. A 22, L169 (1989). 49. J. D. Honeycutt and D. Thirumalai, J. Chem. Phys. 93, 6851 (1990). 50. W. W. Yau, C. P. Malone and S. W. Fleming, J. Poly. Sci. Polym. Lett. Ed. 6, 803 (1968). 51. W. W. Yau, J. Poly. Sci. Part A2 7, 483 (1969). 52. C. N. Satterfield, C. K. Colton, B. de Turckheim and T. M. Copeland, AZChE J. 24,937 (1978). 53. M. Sernetz, H. R. Bittner, C. Baumhoer, S. Schwarz and H. Willems, Stud. Surt Sci. Catal. 39,461
(1987). 54. M. Sernetz, H. R. Bittner, H. Willems and C. Baumhoer, In The Fractal Approach to Heterogeneous
Chemistry (D. Avnir, Ed.), John Wiley, New York (1989). 55. J. Dayantis and J. Sturm, Polymer 26, 1631 (1985). 56. P. Cifra, T. Bleha and A. Romanov, Makromol. Chem., Rapid Commun. 9, 355 (1988). 57. T. Bleha, P. Cifra and F. E. Karasz, Polymer 31, 1321 (1990). 58. P. Cifra, T. Bleha and A. Romanov, Polymer 29, 1664 (1988). 59. I. Teraoka, K. H. Langley and F. E. Karasz, Macromolecules 25, 6106 (1992). 60. M. Fixman and J. M. Peterson, J. Amer. Chem. Sot. 86, 3524 (1964). 61. M. J. R. Cantow, R. S. Porter and J. F. Johnson, J. Polym. Sci. Poly. Lett. Ed. 4, 707 (1966). 62. A. Rudin, J. Polym. Sci. PartA- 9, 2587 (1971). 63. J. JanEa, Anal. Chem. 51, 637 (1979). 64. T. Bleha, J. Mlynek and D. Berek, Polymer 21, 798 (1980). 65. T. Bleha, T. Spychaj, R. Vondra and D. Berek, J. Polym. Sci. Polym. Phys. Ed. 21, 1903 (1983). 66. J. L. Anderson and J. H. Brannon, J. Polym. Sci. Polym. Phys. Ed. 19, 405 (1981). 67. E. D. Glandt, AZChE J. 27, 51 (1981). 68. J. K. Percus and G. J. Yevick, Phys. Rev. 110, 1 (1958). 69. E. D. Glandt, J. Colloid Interface Sci. 77, 512 (1980). 70. A. J. Post, J. Colloid Interface Sci. 129, 451 (1989). 71. A. J. Post and E. D. Glandt, J. Colloid Interface Sci. 108, 31 (1985).
POLYMER SOLUTIONS IN CONFINING GEOMETRIES 149
72. A. Yethiraj and C. K. Hall, ~~c~~5lecuZes 24,709 (1991). 73. J. des Cloizeaux and G. Jannink, Polymers in Solution: Their ModeZl~ng and Structure, Clarendon
Press, Oxford (1990). 74. M. Daoud, J. P. Cotton, B. Farnoux, G. Jannink, G. Sarma, H. Benoit, R. Duplessix, C. Picot and
P. G. de Gennes, Macromolecules 8, 804 (1975). 75. F. Brochard and P. G. de Gennes, J. Phys. (Paris) 40, L-399 (1979). 76. I. Teraoka, K. H. Langley and F. E. Karasz, ~acromo~eca~es 26,287 (1993). 77. T. Ohta and Y. Oono, Phys. Lebt. 89A, 460 (1982). 78. I. Noda, N. Kato, T. Kitano and M. Nagasawa, Mucromolecufes 14,668 (1981). 79. J. H. Brannon and J. L. Anderson, J. Polym. Sci. Pol.ym. Phys. Ed. 20, 857 (1982). 80. I. Teraoka and A. Dube, In Waters International GPC Symposium ‘94 (R. Nielson, Ed.), Waters
Corp., Milford (1994). 81. I. Teraoka, Z. Zhou, K. H. Langley and F. E. Karasz, Macromolecules 26, 3223 (1993). 82. R. E. Boehm, D. E. Martire, D. W. Armstrong and K. H. Bui, Macromolecules 17,400 (1984). 83. A. Dube and I. Teraoka, Macromolecules (in press). 84. W. M. Deen, AZChE J. 33, 1409 (1987). 85. T. D. Long and J. L. Anderson, J. Polym. Sci. Poly. Phys. Ed. 22, 1261 (1984). 86. R. P. Adamski and J. L. Anderson, J. Polym. Sci. Polym. Phys. Ed. 25,765 (1987). 87. R. P. Adamski and J, L. Anderson, macromolecules 24,3562 (1991). 88. H. Brenner and L. J. Gaydos, J. Colloid Znte~ace Sci. 58,312 (1977). 89. E. M. Renkin, J. Gen. Physiol. 38, 225 (1954). 90. M. G. Davidson and W. M. Deen, J. Membrane Sci. 35, 167 (1988). 91. Y. Pawar and J. L. Anderson, Znd. Eng. Chem. Res. 32, 743 (1993). 92. S. Weinbaum, Lect. Math. Life. Sci. 14, 119 (1981). 93. F. Brochard and P. G. de Gennes, J. Chem. Phys. 67,52 (1977). 94. M. Muthukumar and A. Baumg~rtner, Macromolecules 22, 1937 (1989). 95. D. S. Cannel1 and F. Rondelez, Macromolecules 13, 1599 (1980). 96. G. Guillot, L. Leger and F. Rondelez, Macromolecules I&2531 (1985). 97. G. Guillot, Macromolecules 20,260O (1987). 98. I. A. Kathawalla and J. L. Anderson, I and EC Res. 27, 866 (1988). 99. M. G. Davidson and W. M. Deen, Macromolecules 21, 3474 (1988).
100. M. P. Bohrer, L. J. Fetters, N. Grizzuti, D. S. Pearson and M. V. Tirrell, Macromolecules 20, 1827
101. 102. 103. 104. 105. 106. 107. 108. 109. 110. 111. 112. 113. 114. 115. 116. 117. 118.
119. J. Karger, J. Lenzner, H. Pfeifer, H. Schwabe, W. Heyer, F. Janowski, F. Wolf and S. P. Zdanov, J. Amer. Ceramic Sac. 66, 69 (1983).
120. Y. Guo, S. J. O’Donohue, K. H. Langley and F. E. Karasz, Phys. Rev. A 46, 3335 (1992). 121. M. Sahimi and V. L. Jue, Phys. Rev. Lett. 62,629 (1989). 122. M. Muthukumar and A. Baumg~rtner, Ma~rome~ecules 22, 1941 (1989).
(1987). G. Guillot, Macromelecules 20,2606 (1987). B. Chu, Laser Light Scattering, Academic Press, San Diego (1991). N. Easwar, K. H. Langley and F. E. Karasz, Macromelecules 23,738 (1990). Y. Guo, K. H. Langley and F. E. Karasz, Macromelecules 23,2022 (1990). Y. Guo, K. H. Langley and F. E. Karasz, J. Chem. Phys. 93,7457 (1990). Y. Guo, K. H. Langley and F. E. Karasz, Macrome~e~uIes 25,4902 (1992). Y. Guo, K. H. Langley and F. E. Karasz, Phys. Rev. B 50,340O (1994). Z. Zhou, I. Teraoka, K. H. Langley and F. E. Karasz, Macromelecules 27, 1759 (1994). Z. Zhou, I. Teraoka, K. H. Langley and F. E. Karasz, Macromelecules 27,7402 (1994). W. D. Dozier, J. M. Drake and J. Klafter, Phys. Rev. Lett. 56, 197 (1986). T. Nose and B. Chu, ~a~romele~u~es 12, 590 (1979). T. Nose and B. Chu, Macromele~u~es 12, 1122 (1979). T. P. Lodge, Macromelecules 16, 1393 (1983). T. P. Lodge and L. M. Wheeler, Macromelecules 19, 2983 (1986). T. P. Lodge, P. Markland and L. M. Wheeler, Macromelecules 22, 3409 (1989). W. Brown and P. Zhou, Macromelecules 23, 5097 (1990). W. Brown and P. Zhou, MacromeIe~u~es 24, 1820 (1991). W. Brown and T. Nicolai, In ~ynarni~ Light Stuttering (W. Brown, Ed.), Clarendon Press, Oxford (1993).