Embed Size (px)
Citation preview

POLYMER-SHELL BONDED PHASE FOR IMPROVING ONLINE LC-MS
ANALYSIS OF INTACT PROTEINS, MABS, AND ADCS
by
Tse-Hong Chen
A Dissertation
Submitted to the Faculty of Purdue University
In Partial Fulfillment of the Requirements for the degree of
Doctor of Philosophy
Department of Chemistry
West Lafayette, Indiana
August 2019

2
THE PURDUE UNIVERSITY GRADUATE SCHOOL
STATEMENT OF COMMITTEE APPROVAL
Dr. Mary J. Wirth, Chair
Department of Chemistry
Dr. Peter T. Kissinger
Department of Chemistry
Dr. Jonathan J. Wilker
Department of Chemistry
Dr. Julia Laskin
Department of Chemistry
Approved by:
Dr. Christine A. Hrycyna
Head of the Graduate Program

3
To my family and friends

4
ACKNOWLEDGMENTS
First and foremost, I would like to express my deepest gratitude to my research advisor
also mentor, Mary Wirth, for her continuous guidance throughout my PhD career. She taught me
how to develop critical thinking, design logical experiment, communicate with people, and give
attractive presentation, which turned me into a real scientist. It is my greatest honor to be a Dr.
Wirth’s student! I would like to thank my committee members, Prof. Peter Kissinger, Prof.
Jonathan Wilker and Prof. Julia Laskin, for valuable advices on my graduate research.
It is my pleasure to present my appreciation to Dr. Rui Zhang at Western Kentucky
University, mentor and advisor of Master’s degree, for his patience and moral support to my life
of studies. In particular, his kindness and devoted attitude inspire me greatly.
I would like to acknowledge Dr. Pei-Hsun Wei, who introduced Dr. Wirth lab to me and
convinced me to join Dr. Wirth group. Then, I am thankful to Dr. Ximo Zhang and Dr. Yiyang
Zhou for their strong support on scientific background and instrument at the beginning of my PhD
study. I am so grateful to have wonderful present group members: Edwin Alzate, Tyrel Wagner,
Charlie Bupp, Yang Yun, and Cameron Schwartz, and past group members: Jonathan Yasosky,
John Biechele-Speziale, Rachel Jacobson, and Alexis Huckabee, for their help, collaboration, and
time spent together. It is an enjoyable and recallable memories to finish PhD career.
I would like to further thank Dr. Zhaorui (Ray) Zhang and Dr. Thamara Janaratne both in
AbbVie, Dr. Cexiong Fu in Shire, and Dr. Bingchuan Wei in Genentech for industry-academia
collaborations to enrich and strengthen my pharmaceutical background.
I am sincerely and supremely appreciated my dad and mom for their generous support on
both mental and living aspects. I could not make it without my parents.
Finally, I would like to thank my friends in the U.S. and Taiwan as well as a special and
gorgeous girl in Wuhan, China, who offers me a lot of joy, encouragement and company. My thesis
and degree would not have been successfully completed without their ingenuities and supports.

5
TABLE OF CONTENTS
LIST OF TABLES .......................................................................................................................... 7
LIST OF FIGURES ........................................................................................................................ 8
LIST OF ABBREVIATIONS ....................................................................................................... 12
ABSTRACT .................................................................................................................................. 13
INTRODUCTION .............................................................................................. 14
1.1 Monoclonal antibodies and antibody-drug conjugates ..................................................... 14
1.2 Silanols on silica particles ................................................................................................. 15
1.3 Online LC/MS ................................................................................................................... 15
1.4 Research objectives ........................................................................................................... 17
1.5 References ......................................................................................................................... 17
NATIVE REVERSED-PHASE LIQUID CHROMATOGRAPHY: A
TECHNIQUE FOR LCMS OF INTACT ANTIBODY-DRUG CONJUGATES AND
PHARMACEUTICAL PROTEINS.............................................................................................. 25
2.1 Abstract ............................................................................................................................. 25
2.2 Introduction ....................................................................................................................... 26
2.3 Materials and methods ...................................................................................................... 28
2.3.1 Materals ..................................................................................................................... 28
2.3.2 UHPLC column preparation ...................................................................................... 28
2.3.3 UHPLC ...................................................................................................................... 29
2.3.4 LC-MS ....................................................................................................................... 30
2.4 Results and discussions ..................................................................................................... 31
2.5 Conclusions ....................................................................................................................... 36
2.6 Further studies ................................................................................................................... 37
2.7 References ......................................................................................................................... 39
POLYMER LAYER TO SHIELD SURFACE CHARGES: ALLOWING FOR
RPLC-MS WITH 0.5% FORMIC ACID AS ADDITIVE ........................................................... 58
3.1 Abstract ............................................................................................................................. 58
3.2 Introduction ....................................................................................................................... 58
3.3 Materials and methods ...................................................................................................... 60

6
3.3.1 Materials .................................................................................................................... 60
3.3.2 UHPLC column preparation ...................................................................................... 61
3.3.3 UHPLC ...................................................................................................................... 62
3.3.4 LC-MS ....................................................................................................................... 62
3.4 Results and discussions ..................................................................................................... 63
3.5 Conclusions ....................................................................................................................... 68
3.6 Further studies ................................................................................................................... 68
3.7 References ......................................................................................................................... 70
THE PHENOMENON OF HYDRODYNAMIC CHROMATOGRAPHY ....... 88
4.1 Abstract ............................................................................................................................. 88
4.2 Introduction ....................................................................................................................... 88
4.3 Materials and methods ...................................................................................................... 90
4.3.1 Materials .................................................................................................................... 90
4.3.2 UHPLC column preparation ...................................................................................... 90
4.3.2.1 Polymer column .................................................................................................... 90
4.3.2.2 C4C1 column ........................................................................................................ 91
4.3.3 UHPLC ...................................................................................................................... 92
4.4 Theory and design ............................................................................................................. 92
4.5 Results and discussions ..................................................................................................... 93
4.6 Conclusions and further plans ........................................................................................... 96
4.7 References ......................................................................................................................... 97
CONCLUSIONS AND FUTURE DIRECTIONS ............................................ 108
5.1 Conclusions ..................................................................................................................... 108
5.2 Future directions ............................................................................................................. 109
VITA ........................................................................................................................................... 110
PUBLICATIONS ........................................................................................................................ 111

7
LIST OF TABLES
Table 2.1. Summary of HPLC columns and their applications .................................................... 43

8
LIST OF FIGURES
Figure 1-1 Stypical structure of monoclonal antibody (mAb) ...................................................... 21
Figure 1-2 (Top panel ) Schematic representation of fully silylated silica surface, resulting a perfect
Guassian peak. (Bottom panel) The realistic silica surface with silanols, causing peak tailing (ref.
20). ................................................................................................................................................ 22
Figure 1-3 Depiction of silica surface with silanols (SiOH), dissociated silanols (SiO¯), modified
silanols and postulated mechanism of protein adsorption to dissociated silanol groups on silica.
The Si are drawn in black bonds and the mobile phase is drawn in pink to light blue. ................ 23
Figure 1-4 Depiction of silica surface coated with a polymer brush layer to keep proteins away
from silica surface to reduce charge interactions. ......................................................................... 24
Figure 2-1 Chemical structures of linker-drug combination for a) the AbbVie model ADC, Ab095-
PZ and b) brentuximab vedotin. Each drug or drug mimic part is in the red square, and its
hydrophobicity is expressed by log P, where P represents the octanol/water partition coefficient.
....................................................................................................................................................... 44
Figure 2-2 a) Sketches explain abbreviations for peak assignments. b) RPLC of the model ADC
after reduction with DTT. c) RPLC of the model ADC without DTT. d) HIC of the intact ADC
with tentative peak assignments. Condition are in supporting information.................................. 45
Figure 2-3 Raw mass spectra (right) and deconvoluted mass spectra (left) for each peak in the
chromatograms of Figure 2-2b. ..................................................................................................... 46
Figure 2-4 nRPLC of AbbVie model ADC with varying hydrophobicity of bonded phase, as
denoted by the structures. Gradient conditions are A: 50 mM NH4OAc, pH 7, B: 50 mM NH4OAc,
50% IPA, pH 7, 0-100 %B /40 min, 100 %B /5 min, 100 µL/min, 30 C. The same tentative labels
as for the HIC chromatogram of Figure 2-2d are made due to the similarity. .............................. 47
Figure 2-5 nRPLC chromatogram for varying PMMA growth time using the same non-denaturing
conditions as in, showing that the 70 min growth time is optimal with respect to resolution and
recovery. Polymer growth time is labeled in each panel. ............................................................. 48
Figure 2-6 a) nRPLC of the AbbVie model ADC Ab095-PZ, with peaks labeled based on the mass
spectra. Gradient: 0 to 4.5% IPA/water over 3 min., then 4.5 to 50% IPA/water over 20 min.
Detection at 280 nm. b) Raw mass spectra for peaks as labeled, with the molecular weight based
on deconvoluted mass spectra for peak ID. The blue lines show that extra peaks are from overlap.
....................................................................................................................................................... 49
Figure 2-7 Evidence that light chain dissociates in MS source for AbbVie model ADC. a) Full-
range raw mass spectra show large signals for light chain+drug, but no significant signals for ADC
minus light chain+drug. b) Chromatogram with UV detection (top) and EIC based on light
chain+drug (bottom). The blue arrows point to two peaks that changed intensities, and the inset
depicts the structures for the isomers consistent with these intensity changes. ............................ 50

9
Figure 2-8 HIC separation of a) model ADC and b) commercial ADC Brentuximab vedotin. The
dashed lines illustrate that the greater hydrophobicity of the mAb itself for Brentuximab vedotin.
Tosoh TSKgel Butyl-NPR, 4.6x35mm, 2.5 um. MPA: 1.5M ammonium sulfate, 25 mM sodium
phosphate pH 7.0; MPB: 25 mM sodium phosphate pH 7.0 with 25% IPA; Flow rate: 0.8 mL/min;
Column temp: 25 C ..................................................................................................................... 51
Figure 2-9 The comparison of drug-to-antibody ratio of model ADC. a) Orange bars were
integrated peak area from Figure 2-8a, HIC separation from Tosoh TSKgel Butyl-NPR column. b)
Blue bars were integrated peak area from Figure 2-6a, nRPLC separation from PMMA column.
....................................................................................................................................................... 52
Figure 2-10 nRPLC and mass spectra for commercial ADC: brentuximab vedotin. a) nRPLC with
detection at 280 nm. Conditions same as for Figure 2.6. b) Raw mass spectra for D2, D4(1,2,3),
D6, D8, with the molecular weight based on deconvoluted mass spectra. ................................... 53
Figure 2-11 a) LCMS data for brentuximab vedotin, analogous to Figure 5. a) Full-range raw mass
spectra show even stronger signals for light chain+drug than observed for the AbbVie model ADC.
b) Chromatogram for UV detection (top) approximately tracks that of EIC for signal of light
chain+drug, again indicating light chain+drug dissociated after separation. Again, the blue arrows
show two peaks that changed intensities, and the inset depicts the structures for the D4 isomers
that are consistent with these changes. ......................................................................................... 54
Figure 2-12 nRPLC of a) lysozyme, and b) α-chymotrypsinogen A using PMMA with the 70 min
growth time. Gradient conditions are A: 50 mM NH4OAc, pH 7, B: 50 mM NH4OAc, 50% IPA,
pH 7, 0-100 %B /10 min, 100 %B /5 min, 100 µL/min, 25 C. Injection amount is 3 µg.
Chromatograms are shown with baseline subtraction. ................................................................. 55
Figure 2-13 nRPLC of a) lysozyme, and b) α-chymotrypsinogen A using PBzMA with the 90 min
growth time. Gradient conditions are same as Figure 2-12. Chromatograms are shown with
baseline subtraction. ...................................................................................................................... 56
Figure 2-14 nRPLC of a) cytochrome C, and b) myoglobin using PBzMA with the 90 min growth
time. Gradient conditions are A: 50 mM NH4HCOO, pH 5.5, B: 50 mM NH4HCOO, 50% IPA,
pH 5.5, 0-100 %B /10 min, 100 %B /5 min, 100 µL/min, 25 C. Injection amount is 3 µg.
Chromatograms are shown with baseline subtraction. ................................................................. 57
Figure 3-1 Three major free thiol variants of Genentech IgG1. Theoretically, mass of (2) is equal
to mass of (1) + 2 Da and mass of (3) equals to (1) + 4 Da or (2) + 2 Da. ................................... 75
Figure 3-2 Chromatograms of IgG1 showing three main peaks: IgG1 with 0, 1 and 2 buried thiol
sites. From top to bottom panels are: a) Diphenyl at 50 C, b) Diphenyl at 75 C, c) PBzMA at 50
C, d) PMMA at 50 C. Gradients with 0.5% FA (blue) and 0.1% TFA (Red). For all
chromatograms: Δ 15%/ 50 min ACN in water, 0.1 mL/min, 2 g injected, detection at 280 nm.
....................................................................................................................................................... 76
Figure 3-3 Dependence of resolution and recovery on temperature for PMMA brush layer.
Chromatograms for temperatures from 30-70 °C for contact IgG1 separation on pMMA polymer-
shell column. The gradient was 19-28% ACN with 0.5% FA in 30 min. Chromatograms are of the
same t scale, but shifted along time axis to align the first peak. The dashed line indicates the
distance between two largest peaks in 30 °C chromatogram. ....................................................... 77

10
Figure 3-4 a) Plot of percent recovery, as determined from the chromatograms of Figure 3-3, in
comparison with published data for the diphenyl silane bonded phase. b) Plot of the distance
between peaks A and E, as a function of temperature. ................................................................. 78
Figure 3-5 a) Plot of the polymer thickness, as a function of polymer growth time. b) RPLC
chromatogram for varying PMMA growth time, showing that the 60 min growth time is optimal
with respect to resolution. Polymer growth time is labeled in each panel. The gradient for columns
of 20, 40, 60, and 80 min PMMA growth time were 20-29% ACN with 0.5% FA in 30 min, and
the gradient for the column without polymers was 20-35% ACN with 0.5% FA in 50 min. Q: 100
µL/min at 50 °C; amount injected: 2 µg. ...................................................................................... 79
Figure 3-6 TEM image to show polymer-shell grown on nonporous silica by ATRP ................. 80
Figure 3-7 Chromatograms of intact IgG1 in different FA concentration in polymer-shell column.
A gradient of 19-28% ACN in 30 min is used for polymer-shell column, 2 µg of intact IgG1 is
injected onto both columns with 100 µL/min flow rate and 50 °C column temperature. ............ 81
Figure 3-8 At constant pH 2.46 by increasing TFA and decreasing FA concentration. UV
chromatograms (left) and MS raw mass spectra (right). The gradient was 19-28% B in 30 min with
100 µL/min at 50 °C. 19-34% B in 50 min was used for 0.031% TFA instead because TFA ion
pairing made elution later than 28%. ............................................................................................ 82
Figure 3-9 LC resolution (left) and MS sensitivity (right) for RPLC-MS of intact IgG1 for different
acidic modifiers and combinations. The gradient was 9% B over 30 min, with a flow rate of 100
µL/min for first three RPLC methods and TFA method used 15% B over 50 min. Column
temperature was 50 °C. IgG1 injected amount was 2 µg.............................................................. 83
Figure 3-10 RPLC chromatograms of different PMMA growth time for separation of IgG1.
Gradients was 19-34% ACN/ 50 min in water, 0.1 mL/min, 2 g injected, detection at 280 nm. 84
Figure 3-11 Dependence of resolution and recovery on temperature for PMMA brush layer.
Chromatograms for temperatures from 40-80 °C for contact IgG1 separation on pMMA polymer-
shell column. The gradient was 26-35% ACN with 0.1% TFA in 30 min. Selectivity shows same
trace as Figure 3-4b, the higher temperature is, the lower peak distance. .................................... 85
Figure 3-12 Plot of total peak area as a function of temperature, determined from the
chromatograms of Figure 3-11. a) Before summation of the washing peak at the end of gradient b)
After summation of the washing peak at the end of gradient. ...................................................... 86
Figure 3-13 Dependence of resolution and recovery on temperature for Agilent AdvanceBio RP-
mAb Diphenyl. Chromatograms for temperatures from 40-80 °C for separation of IgG1. The
gradient was 31-46% ACN with 0.1% TFA in 50 min. Chromatograms are of the same t scale,
but shifted along time axis to align the first peak. The solid line indicates the distance between
three major peaks in 80 °C chromatogram. .................................................................................. 87
Figure 4-1 A depicted mechanism of hydrodynamic chromatography (HDC) separation. Arrows
indicate the direction of streamline flow. Longer arrows have higher velocity and shorter arrows
have relatively low velocity. A protein mixer flows laminarly with a parabolic flow profile. The
sample mixer contains a larger protein (orange), a smaller protein (green), and buffer solvent to
store protein (red). The larger protein stays the center of the flow, experiencing a faster velocity,

11
whereas the smaller protein experiences slower velocity. Buffer, in general, is composed of small
molecule, and thus flows near the walls. .................................................................................... 101
Figure 4-2 Grey sphere represents packing particles and black color lines are walls. Under laminar
flow (blue parabolic flow profile), each interstitial space from a well-packed stationary phase can
be considered as an open channel where HDC is performed. ..................................................... 102
Figure 4-3 HDC separation using 500 nm base silica particles packed in a 2.1 × 50 mm stainless
steel column. Blue chromatogram is lysozyme, red represents Eli Lilly intact IgG4, and black is
water injection. Separation condition was 100% H2O isocratically with 0.1% FA and a) 1% SDS
b) 0.1% SDS. C) 2% SDS. Flow rate was varied at 30 °C. Detection wavelength was 280 nm for
proteins and 230 nm for water injection in order to see a up-side down peak. The UV absorbances
are normalized by peak height to obtain a fair resolution comparison. ...................................... 103
Figure 4-4 1500 nm C4 column (2.1 × 50 mm stainless steel column) was used for HDC separation
under MS-compatible conditions. Lysozyme (blue), IgG4 (red), and water injection (black) were
examined. Separation condition was 50:50 H2O/ACN (v/v) isocratically with 0.5% FA at 30 °C.
Flow rate was varied from 20 µL/min to 60 µL/min. Detection wavelength was 280 nm for proteins
and 230 nm for water injection in order to see a up-side down peak. The UV absorbances are
normalized by peak height to obtain a fair resolution comparison. ............................................ 104
Figure 4-5 Different C4 particle sizes were packed in 2.1 × 50 mm stainless steel columns. In
addition, 1500 nm C4 particles were pack in stainless steel columns with length and inner diameter.
Elution method and order are same as Figure 4-4. The UV absorbances are normalized by peak
height to obtain a fair resolution comparison. ............................................................................ 105
Figure 4-6 750 nm C4 column (2.1 × 100 mm stainless steel column) was used for HDC separation.
Samples were the same as Figure 4-5. Separation condition was isocratic 50:50 H2O/ACN (v/v)
with 0.1% TFA at 30 °C. Otherwise noted. ................................................................................ 106
Figure 4-7 1500 nm BCC1 particle was packed in 2.1 × 50 mm stainless steel columns, then
modified with monomer dimethylacrylamide (DMA). Samples, elution method and order are same
as Figure 4-4. The UV absorbances are normalized by peak height to obtain a fair resolution
comparison. ................................................................................................................................. 107

12
LIST OF ABBREVIATIONS
ACN Acetonitrile
ADC Antibody-drug conjugate
mBC (Chloromethyl)phenyl)dimethylchlorosilane
mC1 Trimethylchlorosilane
mC4 n-Butyldimethylchlorosilane
DAR Drug-to-antibody ratio
DFA Difluoroacetic acid
DTT Dithiothreitol
FA Formic acid
HDC Hydrodynamic chromatography
HIC Hydrophobic interaction liquid chromatography
IgG Immunoglobulin G
IPA Isopropanol
mAb Monoclonal antibody
NH4OAc Ammonium acetate
nRPLC Native reversed phase liquid chromatography
Me6TREN Tris 2-(dimethylamino) ethyl amine
MS Mass Spectrometry
PDMA Polydimethylacrylamide
PEMA Polyethylmethacrylate
PMMA Polymethylmethacrylate
PPMA Polypropylmethacrylate
PBMA Polybutylmethacrylate
PBzMA Polybenzylmethacrylate
RPLC Reversed phase liquid chromatography
TEM Transmission electron microscope
TFA Trifluoroacetic acid
UHPLC Ultra-high performance liquid chromatography

13
ABSTRACT
Author: Chen, Tse-Hong (Aaron). PhD
Institution: Purdue University
Degree Received: August 2019
Title: Polymer-Shell Bonded Phase for Improving Online LC-MS Analysis of Intact Proteins,
mAbs, and ADCs
Committee Chair: Mary J. Wirth
LC-MS of protein drugs requires new ideas in bonded phase design rather than adapting bonded
phases from the realm of small-molecule drugs. The polymer-shell bonded phase is designed to
interact with larger molecules and to shield proteins from the silica substrate. The particles consist
of a core of solid silica and a shell of dense polymer brush. The polymer layer is thick enough to
protect the protein from interactions with silanols to reduce peak tailing. The polymer contains
multiple functional groups that introduce more selectivity. This design gives unprecedented LC
resolution and MS sensitivity. Our group has developed polymer shell bonded phases for
hydrophobic interaction chromatography (HIC-MS) of antibody-drug conjugates (ADCs),
hydrophilic interaction liquid chromatography (HILIC-MS) of glycoproteins, and reversed-phase
liquid chromatography (RPLC-MS) of monoclonal antibodies. Since HIC is not in-line compatible
with MS due to the high salt levels, it is laborious to identify the constituents of HIC peaks. An
MS-compatible alternative to HIC is reported here: native reversed phase liquid chromatography
(nRPLC). This employs a mobile phase 50 mM ammonium acetate for high sensitivity in MS, and
elution with a gradient of water/isopropanol. The nRPLC-MS data show that all ADC species,
ranging from drug-to-antibody ratios of 1 to 8, remained intact and native on the column. As we
adapt this concept to intact proteins, we find that lysozyme and α-chymotrypsinogen A are both
eluted in their native conformations. We also use the polymer-shell concept to resolve IgG1 free
thiol variants by RPLC-MS with 0.5% formic acid. Since there are always other variants besides
the intended ones, the need for high MS sensitivity is desired to distinguish subtle mass change
between disulfide bond and free thiols. Overall, MS sensitivity increases 10X relative while all of
the thiol variants are well resolved by the polymethylmethacrylate bonded phase.

14
INTRODUCTION
1.1 Monoclonal antibodies and antibody-drug conjugates
Monoclonal antibody (mAbs) are constructed of two heavy polypeptide chains (~50 kDa
each) and two light polypeptide chains (~25 kDa each), having molecular weight approximately
150 kDa, structure shown in Figure 1-1. Heavy chain contains approximately 450-550 amino acids
and light chain is 210-220 amino acids.1-3 mAbs are effective treatment for many chronic and
malignant diseases such as cancer therapy, immunotherapy, and solid tumor. In this regard, it is
also called immunoglobulin, which selectively binds with antigen binding sites by
complementarity-determining regions (CDRs). For example, rituximab has been approved to treat
Hodgkin's lymphoma, chronic lymphocytic leukemia, rheumatoid arthritis, etc, and trastuzumab
is used to treat breast cancer, which are both manufactured by Genentech. 4-8
Antibody-drug conjugates (ADCs) consist of recombinant monoclonal antibodies
convalently conjugated with highly potent agents (known as payloads or warheads) via a linker.
They exploit specific binding properties through CDRs to selectively deliver cytotoxic payloads
to cancer cells over non-malignant cells, resulting in maximized efficacy and minimized systemic
toxicity. The vast majority of the cytotoxic warheads of the ADCs currently in clinical trials are
conjugated to either lysine or cysteine residues on the antibody9-11. For instance, Genentech further
discovered that the function of emtansine, a small chemical drug, and conjugated it with
trastuzumab to increase the efficacy of the treatment on breast cancer12. There are three generations
of ADCs; lysine conjugate ADCs, cysteine conjugated ADCs, and site-specific ADCs.9, 13-15 In this
work, cysteine conjugated ADCs will be introduced in the next chapter, which involves the
conjugation through partially reduced cysteine groups to generate up to eight reactive free thiols
16-18, which results in heterogeneous mixture of antibody with drug population ranging from 0 to
8. As a result, drug-to-antibody ratio (DAR) is used to evaluate the discrepancy between the
number of cytotoxic small-molecule drugs covalently attached to an antibody and the mixture is
described as average DAR.

15
1.2 Silanols on silica particles
Chromatographic nonlinear peak tailing never goes away no matter how pure the silica is.
This situation causes the reduced efficiency of separation especially for proteins, presenting in
Figure 1-2. The phenomenon is attributed to dissociated silanols (SiO¯) or called active silanols.
Therefore, Dr. Wirth and her group members started doing single-molecule spectroscopy to track
separation pattern on C18/silica surfaces using AFM and fluorescence microscope.19-23 The cause
of peak tailing and peak asymmetry from silaonls (SiOH) and SiO¯ can be explained from bi-
Langmuir adsorption isotherm to understand the slower desorption kinetics.20 The experimental
results showed that the retention time of C18 surface is three order of magnitude shorter than the
retention time of active silanols. Moreover, the equilibrium constant of silanol sites are 500-fold
greater than the equilibrium constant of C18 sites. To be consideration of proteins and peptides,
tailing and broadening are more severe because of the hydrogen bonding between amine groups
and silanols on silica. As a result, hydroxylation of silica surface to construct hydrogen bonds to
each silanol is pivotal.
Two decades ago, Type B silica was invented to improve the quality of chromatographic
separation science by increasing the density of silanols, approximately 8 µmol/m2.24, 25 A high
density of silanols prefers to form hydrogen bond network better with each other rather than with
the analyte. Recently, annealing of silica has been studied to reduce the concentration of the
dissociated silanols and improves peak tailing in RPLC.26 For the chromatographic aspect,
additives, modifiers, and salts in mobile phases are applied to protonate silanol groups to avoid
analyte-silanol interaction.
1.3 Online LC/MS
Liquid chromatography (LC) coupled with mass spectrometry (MS) is a powerful
analytical tool to perform qualitative and quantitative analysis and characterization. Offline LC-
MS is performed by fractionating samples from LC, exchanging buffer for samples, and preparing
samples for MS. Those procedures are redundant and laborious, which normally take days to
achieve whole offline LC-MS analysis. Nonetheless, fraction collection and buffer exchange may
risk samples of temperature stress, pH stress, light stress, and so on. These situations will bias
results from analysis. Therefore, online LC-MS draws people attention since sample can be

16
separated by LC and directly analyzed by MS, which shorten the analysis time from days to hours
as well as reduced the deviation of analysis. However, there are several challenges in LC-MS
analysis. 27
• Insufficient dynamic range of LC separation since analyte may be poorly retained or
strongly retained.
• Some analytes with no UV absorbance will be missed by most commonly used UV detector
of LC.
• Analytes are complicated to cause co-elution with multiple components within one peak.
• In the aspect of small molecule separation, chiral compounds with multiple chiral centers
are complex.
• Matrix effects are associated with MS-incompatible mobile phases to prevent analyte from
analyzing by MS.
Matrix effects obstruct online LC-MS mainly since adducts in mobile phase result in MS
signal suppression by interference of ionization efficiency, and thus it affects MS characterization
and identification dramatically including deviation of mass accuracy or less ion abundance of false
negative results.28-30 For instance, sodium ion, a nonvolatile metal ion, has stronger ion paring
effect and causes vanish of charged droplet.31, 32 The common methods to overcome matrix effects
are solid-phase extraction, dilution, or purification by resin.33-35 Recently, multi-dimensional LC
are established to resolve the matrix effect from salt such as the first dimension LC is ion exchange
(IEX) or hydrophobic interaction chromatography (HIC) method, which require the use of salt; the
second dimension is reversed-phase liquid chromatography (RPLC) to desalt and directly couples
the second dimension to MS.36 In addition, trifluoroacetic acid (TFA) are a gold standard for RPLC
separation to introduce the highest RPLC resolution but also a well-known ion suppression acidic
modifier. New apparatus is invented by Regeneron Analytical group to modify the desolvation gas
from TFA to a MS-compatible acid vapor, propionic acid and isopropanol (IPA).37 Consequently,
better separation science to advance directly online LC-MS is required in both material and
instrumentation fields.

17
1.4 Research objectives
Traditionally, the better LC resolution is, the worse MS sensitivity is. With common pH
range of 2 to 8 for HPLC mobile phases, amino groups carry positive charges and isolated silanols
may be negatively charged since pKa of silanols is 4.5, so electrostatic interaction is absolutely
strong. A postulated mechanism of interaction between proteins and SiO¯ are shown in Figure 1-3.
Instead of improving silanol endcapping or exploring surface morphology, a dense and thick layer
of polymer is coated on silica surface to protect the protein from negatively charged interactions
with silanols to reduce peak tailing (Figure 1-4). In this thesis, I am going to introduce polymer-
shell technology to screen surface silanols and prevent proteins from the silica surface.
Furthermore, polymer envelops protein to increase selectivity. This idea enables the LC separation
using MS-compatible mobile phases to solve matrix effect from the LC and to improve online LC-
MS platform to alleviate laborious work, time consuming, and cost of material use. Overall
chromatographic resolution is better and most importantly, the design avoids trade-off between
LC resolution and MS sensitivity.
1.5 References
1. Janeway, C. A. J.; Travers, P.; Walport, M., Immunobiology: The Immune System in
Health and Disease. 5th edition. New York: Garland Science; 2001. The structure of a
typical antibody molecule. Garland Science: New York, 2001.
2. Rosati, S.; Yang, Y.; Barendregt, A.; Heck, A. J., Detailed mass analysis of structural
heterogeneity in monoclonal antibodies using native mass spectrometry. Nat Protoc 2014,
9 (4), 967-76.
3. Sukupolvi-Petty, S.; Austin, S. K.; Engle, M.; Brien, J. D.; Dowd, K. A.; Williams, K.
L.; Johnson, S.; Rico-Hesse, R.; Harris, E.; Pierson, T. C.; Fremont, D. H.; Diamond,
M. S., Structure and function analysis of therapeutic monoclonal antibodies against
dengue virus type 2. J Virol 2010, 84 (18), 9227-39.
4. Weiner, L. M.; Dhodapkar, M. V.; Ferrone, S., Monoclonal antibodies for cancer
immunotherapy. Lancet 2009, 373, 1033-1040.
5. Strome, S. E.; Sausville, E. A.; Mann, D., A mechanistic perspective of monoclonal
antibodies in cancer therapy beyond target-related effects. Oncologist 2007, 12 (9), 1084-
95.
6. Christiansen, J.; Rajasekaran, A. K., Biological impediments to monoclonal antibody–
based cancer immunotherapy. Molecular Cancer Therapeutics 2004, 11, 1493-1501.

18
7. Lipman, N. S.; Jackson, L. R.; Trudel, L. J.; Weis-Garcia, F., Monoclonal Versus
Polyclonal Antibodies: Distinguishing Characteristics, Applications, and Information
Resources. ILAR Journal 2005, 46, 258-268.
8. Scott, A. M.; Allison, J. P.; Wolchok, J. D., Monoclonal antibodies in cancer therapy.
Cancer Immunity 2012, 12, 14-22.
9. Tsuchikama, K.; An, Z., Antibody-drug conjugates: recent advances in conjugation and
linker chemistries. Protein Cell 2018, 9 (1), 33-46.
10. Flygare, J. A.; Pillow, T. H.; Aristoff, P., Antibody-drug conjugates for the treatment of
cancer. Chem. Biol. Drug. Des. 2013, 81 (1), 113-21.
11. Peters, C.; Brown, S., Antibody-drug conjugates as novel anti-cancer chemotherapeutics.
Biosci. Rep. 2015, 35 (4).
12. Barok, M.; Joensuu, H.; Isola, J., Trastuzumab emtansine: mechanisms of action and drug
resistance. Breast Cancer Research 2014, 16, 209-221.
13. Thomas, A.; Teicher, B. A.; Hassan, R., Antibody–drug conjugates for cancer therapy.
The Lancet Oncology 2016, 17 (6), e254-e262.
14. Flygare, J. A.; Pillow, T. H.; Aristoff, P., Antibody-drug conjugates for the treatment of
cancer. Chem Biol Drug Des 2013, 81 (1), 113-21.
15. Diamantis, N.; Banerji, U., Antibody-drug conjugates--an emerging class of cancer
treatment. Br J Cancer 2016, 114 (4), 362-7.
16. Behrens, C. R.; Ha, E. H.; Chinn, L. L.; Bowers, S.; Probst, G.; Fitch-Bruhns, M.;
Monteon, J.; Valdiosera, A.; Bermudez, A.; Liao-Chan, S.; Wong, T.; Melnick, J.;
Theunissen, J. W.; Flory, M. R.; Houser, D.; Venstrom, K.; Levashova, Z.; Sauer, P.;
Migone, T. S.; van der Horst, E. H.; Halcomb, R. L.; Jackson, D. Y., Antibody-Drug
Conjugates (ADCs) Derived from Interchain Cysteine Cross-Linking Demonstrate
Improved Homogeneity and Other Pharmacological Properties over Conventional
Heterogeneous ADCs. Mol. Pharmaceutics 2015, 12 (11), 3986-98.
17. Sanderson, R. J.; Hering, M. A.; James, S. F.; Sun, M. M. C.; Doronina, S. O.; Siadak,
A. W.; Senter, P. D.; Wahl, A. F., In vivo Drug-Linker Stability of an Anti-CD30
Dipeptide-Linked Auristatin Immunoconjugate. Clin. Cancer Res. 2005, 11, 843-852.
18. Sun, M. M. C.; Beam, K. S.; Cerveny, C. G.; Hamblett, K. J.; Blackmore, R. S.;
Torgov, M. Y.; Handley, F. G. M.; Ihle, N. C.; Senter, P. D.; Alley, S. C., Reduction-
Alkylation Strategies for the Modification of Specific Monoclonal Antibody Disulfides.
Bioconjugate Chem. 2005, 16, 1282-1290.
19. Ludes, M. D.; Wirth, M. J., Single-Molecule Resolution and Fluorescence Imaging of
Mixed-Mode Sorption of a Dye at the Interface of C18 and Acetonitrile/Water. Analytical
Chemistry 2002, 74, 386-393.

19
20. Wirth, M. J.; Legg, M. A., Single-Molecule Probing of Adsorption and Diffusion on Silica
Surfaces. Annual Review of Physical Chemistry 2007, 58 (1), 489-510.
21. Wirth, M. J.; Ludes, M. D.; Swinton, D. J., Spectroscopic Observation of Adsorption to
Active Silanols. Analytical Chemistry 1999, 71, 3911-3917.
22. Smith, E. A.; Wirth, M. J., pH dependence of tailing in reversed-phase chromatography of
a cationic dye: measurement of the strong adsorption site surface density. Journal of
Chromatography A 2004, 1060 (1-2), 127-134.
23. Wirth, M. J.; Smith, E. A.; Anthony, S. R., Measurement and simulation of tailing zones
of a cationic dye in analytical-scale reversed phase chromatography. Journal of
Chromatography A 2004, 1034 (1-2), 69-75.
24. Zhuravlev, L. T., The surface chemistry of amorphous silica. Zhuravlev model. Colloids
and Surfaces A: Physicochemical and Engineering Aspects 2000, 173, 1-38.
25. Kohler, J.; Kirkland, J. J., Improved Silica-Based Column Packings for High-Performance
Liquid Chromatography. Journal of Chromatography A 1987, 385, 125-150.
26. Newby, J. J.; Legg, M. A.; Rogers, B.; Wirth, M. J., Annealing of silica to reduce the
concentration of isolated silanols and peak tailing in reverse phase liquid chromatography.
J Chromatogr A 2011, 1218 (31), 5131-5.
27. Zhang, K.; Wang, J.; Tsang, M.; Wigman, L.; Chetwyn, N., Two-Dimensional HPLC in
Pharmaceutical Analysis. Am. Pharm. Rev. 2013, 16, 39-44.
28. Cappiello, A.; Famiglini, G.; Palma, P.; Trufelli, H., Matrix Effects in Liquid
Chromatography-Mass Spectrometry. Journal of Liquid Chromatography & Related
Technologies 2010, 33 (9-12), 1067-1081.
29. Srneraglia, J.; Baldrey, S. I.-.; Watson, D., Matrix Effects and Selectivity Issues in LC-
MS-MS. Chromatogaphia 2002, 55, S95-S99.
30. Zhou, W.; Yang, S.; Wang, P. G., Matrix effects and application of matrix effect factor.
Bioanalysis 2017, 9, 1839-1844.
31. Banerjee, S.; Mazumdar, S., Electrospray ionization mass spectrometry: a technique to
access the information beyond the molecular weight of the analyte. Int J Anal Chem 2012,
2012, 282574.
32. Panuwet, P.; Hunter, R. E., Jr.; D'Souza, P. E.; Chen, X.; Radford, S. A.; Cohen, J. R.;
Marder, M. E.; Kartavenka, K.; Ryan, P. B.; Barr, D. B., Biological Matrix Effects in
Quantitative Tandem Mass Spectrometry-Based Analytical Methods: Advancing
Biomonitoring. Crit Rev Anal Chem 2016, 46 (2), 93-105.

20
33. Chambers, E.; Wagrowski-Diehl, D. M.; Lu, Z.; Mazzeo, J. R., Systematic and
comprehensive strategy for reducing matrix effects in LC/MS/MS analyses. J Chromatogr
B Analyt Technol Biomed Life Sci 2007, 852 (1-2), 22-34.
34. Cappiello, A.; Famiglini, G.; Palma, P.; Pierini, E.; Termopoli, V.; Trufelli, H.,
Overcoming Matrix Effects in Liquid Chromatography-Mass Spectrometry. Analytical
Chemistry 2008, 80, 9343-9348.
35. Hall, T. G.; Smukste, I.; Bresciano, K. R.; Wang, Y.; McKearn, D.; Savage, R. E.,
Identifying and Overcoming Matrix Effects in Drug Discovery and Development. In
Tandem Mass Spectrometry - Applications and Principles, Prasain, J., Ed. InTech: Rijeka,
Croatia, 2012.
36. Valeja, S. G.; Xiu, L.; Gregorich, Z. R.; Guner, H.; Jin, S.; Ge, Y., Three dimensional
liquid chromatography coupling ion exchange chromatography/hydrophobic interaction
chromatography/reverse phase chromatography for effective protein separation in top-
down proteomics. Anal Chem 2015, 87 (10), 5363-5371.
37. Wang, S.; Xing, T.; Liu, A. P.; He, Z.; Yan, Y.; Daly, T. J.; Li, N., Simple Approach
for Improved LC-MS Analysis of Protein Biopharmaceuticals via Modification of
Desolvation Gas. Anal Chem 2019, 91 (4), 3156-3162.

21
Figure 1-1 Stypical structure of monoclonal antibody (mAb)

22
Figure 1-2 (Top panel ) Schematic representation of fully silylated silica surface, resulting a perfect
Guassian peak. (Bottom panel) The realistic silica surface with silanols, causing peak tailing (ref.
20).

23
Figure 1-3 Depiction of silica surface with silanols (SiOH), dissociated silanols (SiO¯), modified
silanols and postulated mechanism of protein adsorption to dissociated silanol groups on silica.
The Si are drawn in black bonds and the mobile phase is drawn in pink to light blue.
H+
Silica Particle
O-
O-
O-
OH
O-
O-

24
Figure 1-4 Depiction of silica surface coated with a polymer brush layer to keep proteins away
from silica surface to reduce charge interactions.
H+
Silica Particle
O-
O-
O-
OH
O-
O-
Polymer Brush Layer

25
NATIVE REVERSED-PHASE LIQUID
CHROMATOGRAPHY: A TECHNIQUE FOR LCMS OF INTACT
ANTIBODY-DRUG CONJUGATES AND PHARMACEUTICAL
PROTEINS
A version of this chapter has been published by Analytical Chemistry. Reprinted with permission
from Tse-Hong Chen, Yun Yang, Zhaorui Zhang, Cexiong Fu, Qunying Zhang, Jon D. Williams
and Mary J. Wirth, Native Reversed-Phase Liquid Chromatography: A Technique for LCMS of
Intact Antibody–Drug Conjugates. Analytical Chemistry 2019, 91 (4), 2805-2812. DOI:
10.1021/acs.analchem.8b04699. Copyright © 2019 American Chemical Society.
2.1 Abstract
The synthesis of antibody-drug conjugates (ADCs) using the interchain cysteines of the antibody
inherently gives a mixture of proteins with varying drug-to-antibody ratio. The drug distribution
profiles of ADCs are routinely characterized by hydrophobic interaction chromatography (HIC).
Since HIC is not in-line compatible with mass spectrometry (MS) due to the high salt levels, it is
laborious to identify the constituents of HIC peaks. An MS-compatible alternative to HIC is
reported here: native reversed phase liquid chromatography (nRPLC). This novel technique
employs a mobile phase 50 mM ammonium acetate for high sensitivity in MS, and elution with a
gradient of water/isopropanol. The key to the enhancement is a bonded phase giving weaker drug-
surface interactions compared to the noncovalent interactions holding the antibody-drug
conjugates together. The hydrophobicity of the bonded phase is varied and the least hydrophobic
bonded phase in the series, polymethylmethacrylate, is found to resolve the intact constituents of
a model ADC (Ab095-PZ) and a commercial ADC (brentuximab vedotin) under the MS-
compatible conditions. The nRPLC-MS data show that all species, ranging from drug-to-antibody
ratios of 1 to 8, remained intact in the column. Another desired advantage of the nRPLC is the
ability of resolving multiple positional isomers of ADC that are not well resolved in other
chromatographic modes This supports the premise that lower hydrophobicity of the bonded phase
is the key to enabling online nRPLC-MS analysis of antibody-drug conjugates.

26
2.2 Introduction
Antibody-drug conjugates (ADCs) are highly selective and potent chemotherapeutics for the
treatment of different types of cancer, inspired by Paul Ehrlich1. An ADC consists of a recombinant
monoclonal antibody (mAb) covalently conjugated with a drug via a hydrophilic linker. The
mechanism exploits specific binding of tumor-expressed antigens and delivers covalently
conjugated cytotoxic payloads to cancer cells selectively over non-malignant cells, resulting in
greater efficacy and minimized systemic toxicity. Four ADCs are currently on the market:
Adcetris (brentuximab vedotin) from Seattle Genetics for the treatment of relapsed Hodgkin’s
lymphoma and systemic anaplastic large-cell lymphoma, Kadcyla (trastuzumab emtansine),
from Genentech for the treatment of metastatic breast cancer2-4, Mylotarg (gemtuzumab
ozogamicin) from Pfizer for acute myeloid leukemia and Besponsa (inotuzumab ozogamicin)
also from Pfizer for acute lymphoblastic leukemia. More than 60 ADCs have been advanced into
clinical trials for cancer treatment,3 and there are currently more than 65 ADCs in clinical
evaluation to target different hematologic malignancies and solid tumors3, 5. The vast majority of
the cytotoxic warheads of the ADCs currently in clinical trials are conjugated to either lysine or
cysteine residues on the antibody,6-8 with most using cysteine residues.9 Drug loading in the ADCs
is an important design parameter that needs to be characterized.10
Liquid chromatography separation of cysteine-conjugated ADCs to characterize the drug
loading distribution is the topic of this paper. Taking IgG1, for example, a common conjugation
approach entails partial reduction of four interchain disulfide bonds to generate up to eight reactive
thiol groups.11-13 This conjugation scheme yields a mixture of species ranging from 0 to 8 drugs
per antibody, which is a broad distribution. The different drug loadings have been reported to affect
the pharmacokinetics, stability, and clearance of ADCs.14-18 Native SEC-MS is a rapid technique
for determining the distribution of drug loads, where the SEC serves to de-salt the sample rather
than separate the components and relies solely on MS for characterization and quantitation.19 The
technique skews the distribution toward lower drug load due to ion suppression and sub-optimal
recovery of species with higher drug load.20 Pretreatment by enzymatic cleavage of the
hydrophobic drug from the ADC, which leaves the hydrophilic linker attached as a tag, reduces
the skewing but does not eliminate it.21 Consequently, chromatographic separations are used for
quantitative ADC characterization. Reversed-phase liquid chromatography coupled to mass

27
spectrometry (RPLC-MS) is used to determine the average drug-to-antibody ratio (DAR) by
separating the denatured subunits of the reduced ADC,22 but this approach loses information about
the drug load distribution.23 Hydrophobic interaction chromatography (HIC) is a non-denaturing
separation24-26 that is currently the gold standard for resolving the drug distribution of ADCs.27 A
gradient of decreasing salt concentration is used for elution,28, 29 and the high initial concentration
and low volatility of the salts prevent its direct coupling to mass spectrometry for peak
identification.30-34
The Ge and Alpert groups were the first to show that HIC-MS of intact proteins is possible
with volatile salts.26, 35 In their papers, MS-compatible ammonium acetate salt was used, with a
gradient decreasing from 1 M to 20 mM, concurrent with a gradient of increasing acetonitrile in
water from 0 to 50%. Since NH4OAc has weaker kosmotropic properties than the typical HIC salts
of (NH4)2SO4 and Na2HPO4, they used a bonded phase with increased hydrophobicity, and their
results demonstrated that the proteins maintained their native forms. HIC-MS has not yet been
reported for intact ADCs.
The considerations for HIC-MS of ADCs are different from that of natural proteins. The
conjugated drug of an ADC is far more hydrophobic than the solvent-exposed surface of a native
protein, as demonstrated by the elution time increasing with increasing drug load in HIC of ADCs.
In light of this, the concept behind our work is that a fixed, low concentration of MS-compatible
salt, e.g., 50 mM NH4OAc, might give retention of ADCs on hydrophobic columns since less
salting-out would be needed. If so, the question then is whether a mild organic additive,
isopropanol, can be made to desorb the ADC from the stationary phase without dissociating the
noncovalently bound subunits of the antibody. The strategy is to decrease the hydrophobicity of
the bonded phase so that less organic component is needed for elution, thereby avoiding the
dissociation of the antibody into subunits 36. This is the opposite of the strategy used by Chen and
co-workers26, 35 since ADCs present a different problem than mAbs, which are more hydrophilic
than ADCs. The other difference from the prior work is that the salt concentration is fixed at low
level while the organic component is increased, which would make this a reversed-phase
separation. Hence the proposed new method is a non-denaturing version of reversed-phase liquid
chromatography (RPLC), and we refer to it as native reversed-phase liquid chromatography
(nRPLC).

28
The purpose of this work is to test the idea that a bonded phase with sufficiently low
hydrophobicity would enable a new technique, nRPLC-MS, for separating intact ADCs and
determining their molecular weights by in-line coupled mass spectrometry. The method is
evaluated using both a model ADC and a commercial ADC, where each ADC has a drug mimic
or drug coupled to cysteines of the mAb using a hydrophilic linker.
2.3 Materials and methods
2.3.1 Materals
Nonporous silica particles (1500 nm) were purchased from Superior Silica (Tempe, AZ).
Empty stainless-steel columns (2.1 mm I.D., 50 mm length), reservoirs (4.6 mm I.D., 150 mm),
and frits (0.5 µm pore diameter) were purchased from Isolation Technologies (Middleboro, MA).
Stainless-steel tubing, ferrules, and internal nuts were all purchased from Valco Instruments
(Houston, TX). Silanes, i.e., (chloromethyl)phenyl)dimethylchlorosilane (+99%) and
trimethylchlorosilane (+99%), were purchased from Gelest (Morrisville, PA). Methyl
methacrylate (MMA, 99%), sodium ascorbate (≥99%), butylamine (99.5%), NH4OAc (99.99%),
ammonium sulfate ((NH4)2SO4, ≥99%), sodium phosphate (Na3PO4, 96%), and ammonium
hydroxide were purchased from Sigma–Aldrich (St. Louis, MO). Other chemical used included
trifluoroacetic acid (TFA, 99%), difluoroacetic acid (DFA, 98%) and copper(II) chloride (CuCl2,
99%) from Acros Organics (Morris Plains, NJ), tris(2-dimethylaminoethyl)amine (Me6TREN,
+99%) from Alfa Aesar (Haverhill, MA), and formic acid (FA, 99.5%+, LC/MS grade),
acetonitrile (ACN), and 2-propanol (IPA) from Fisher Scientific (Hampton, NH). Ultrapure water
was obtained from a Milli-Q system (MilliporeSigma, Darmstadt, Germany.)
IgG1 Ab095 was conjugated with drug-linker mimic PZ in-house at AbbVie (North Chicago, IL)
as a model ADC. Brentuximab vedotin was obtained from Seattle Genetics. Both ADCs were
prepared at 1 mg/mL in NH4OAc or (NH4)2SO4 with final concentration 0.8–1.0 M.
2.3.2 UHPLC column preparation
The silica particles were modified as described earlier37. Briefly, the silica particles were
calcined at 600 °C for 12 h, then annealed at 1050°C for 3 h, and rehydroxylated overnight in 1.0
M HNO3. Particles were then rinsed in ultrapure water and dried in a 60 °C vacuum oven. SEM
29
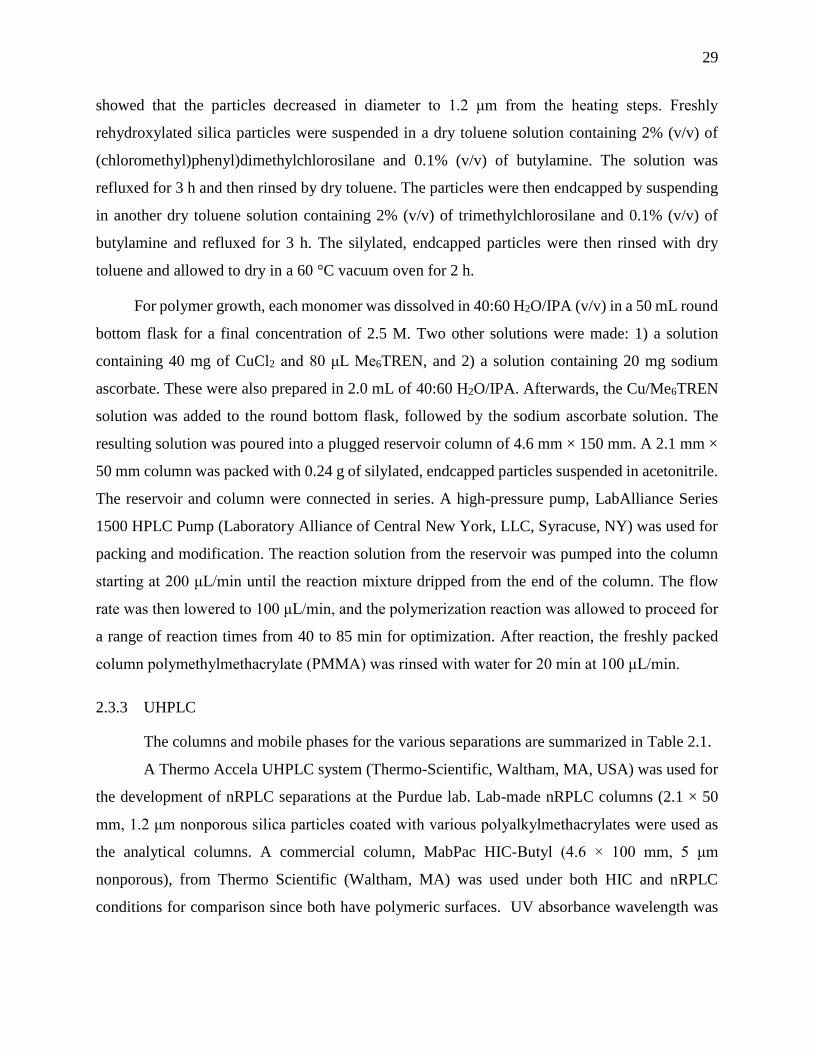
showed that the particles decreased in diameter to 1.2 μm from the heating steps. Freshly
rehydroxylated silica particles were suspended in a dry toluene solution containing 2% (v/v) of
(chloromethyl)phenyl)dimethylchlorosilane and 0.1% (v/v) of butylamine. The solution was
refluxed for 3 h and then rinsed by dry toluene. The particles were then endcapped by suspending
in another dry toluene solution containing 2% (v/v) of trimethylchlorosilane and 0.1% (v/v) of
butylamine and refluxed for 3 h. The silylated, endcapped particles were then rinsed with dry
toluene and allowed to dry in a 60 °C vacuum oven for 2 h.
For polymer growth, each monomer was dissolved in 40:60 H2O/IPA (v/v) in a 50 mL round
bottom flask for a final concentration of 2.5 M. Two other solutions were made: 1) a solution
containing 40 mg of CuCl2 and 80 μL Me6TREN, and 2) a solution containing 20 mg sodium
ascorbate. These were also prepared in 2.0 mL of 40:60 H2O/IPA. Afterwards, the Cu/Me6TREN
solution was added to the round bottom flask, followed by the sodium ascorbate solution. The
resulting solution was poured into a plugged reservoir column of 4.6 mm × 150 mm. A 2.1 mm ×
50 mm column was packed with 0.24 g of silylated, endcapped particles suspended in acetonitrile.
The reservoir and column were connected in series. A high-pressure pump, LabAlliance Series
1500 HPLC Pump (Laboratory Alliance of Central New York, LLC, Syracuse, NY) was used for
packing and modification. The reaction solution from the reservoir was pumped into the column
starting at 200 μL/min until the reaction mixture dripped from the end of the column. The flow
rate was then lowered to 100 μL/min, and the polymerization reaction was allowed to proceed for
a range of reaction times from 40 to 85 min for optimization. After reaction, the freshly packed
column polymethylmethacrylate (PMMA) was rinsed with water for 20 min at 100 μL/min.
2.3.3 UHPLC
The columns and mobile phases for the various separations are summarized in Table 2.1.
A Thermo Accela UHPLC system (Thermo-Scientific, Waltham, MA, USA) was used for
the development of nRPLC separations at the Purdue lab. Lab-made nRPLC columns (2.1 × 50
mm, 1.2 μm nonporous silica particles coated with various polyalkylmethacrylates were used as
the analytical columns. A commercial column, MabPac HIC-Butyl (4.6 × 100 mm, 5 μm
nonporous), from Thermo Scientific (Waltham, MA) was used under both HIC and nRPLC
conditions for comparison since both have polymeric surfaces. UV absorbance wavelength was

30
set to 280 nm. The flow rate was 100 μL/min for all cases. The column temperature was 30 °C and
the injection volume was 3 μL.
A TSKgel Butyl-NPR column (4.6 × 35 mm, 2.5 μm, Tosoh, King of Prussia, PA) was used
for HIC at the AbbVie site, with an Agilent 1200 HPLC (Agilent, Santa Clara, CA). The system
is routinely used for HIC separations of ADCs to calculate DAR. With the mobile phase given in
Table 1, the gradient started with 90% MPA, decreased to 75% MPA in 2 min followed by a
gradient to 0% MPA in 10 min and was held for 2 min before re-equilibrium. The flow rate was
0.8 mL/min and column temperature was set to 25 °C.
2.3.4 LC-MS
For RPLC-MS of the reduced ADC, this was generated in the Purdue lab by adding 1,4-
dithiothreitol (DTT), a Thermo Accela UHPLC was used with a Thermo MabPac RP column (2.1
x 50 mm, 4 um, supermacroporous polymer particles) (Thermo-Scientific, Waltham, MA, USA),
and the column was coupled to a Thermo LTQ Velos mass spectrometer (Thermo-Scientific,
Waltham, MA, USA). With the mobile phase given in Table 1, the gradient started with 27% with
MPB2, increased to 43% MPB2 in 15 min and returned to 27% MPB2 for re-equilibrium. Flow
rate was 0.2 mL/min and column temperature was 80 °C. Peak identities were assigned by
matching deconvoluted masses with theoretical masses.
For RPLC-MS of the non-reduced ADC (no DTT), a Supelco Bioshell A400 Protein C4
column (2.1 x 100 mm, 3.4 μm, Sigma-Aldrich, St. Louis, MO) was used in the AbbVie lab. With
the mobile phase given in Table 1, the the gradient started with 90% MPA3, ramped to 69% MPA3
in 1 min followed by a decrease to 52% MPA3 in 13 min and returned to original condition for re-
equilibrium. Flow rate was 0.3 mL/min and column temperature was 70 °C. The ADC samples
were analyzed using an Acquity UPLC H-Class coupled to a Synapt G2 Si mass spectrometer
(Waters, Milford, MA). Peak identities were assigned by matching deconvoluted masses with
theoretical masses.
For online nRPLC-MS analysis, the polymethylmethacrylate (PMMA) column made in the
Purdue lab was used at AbbVie, where the LC-MS system was a Waters Acquity UPLC H-Class
coupled to a Xevo G2 qTOF mass spectrometer (Waters, Milford, MA). With the mobile phase
given in Table 1, the gradient started with 0% MPB4, held for 2 min, ramped to 15% MPB4 in 3

31
min followed by a gradient to 50% MPB4 in 15 min and held at 50% MPB4 for 6 min before re-
equilibrium. Flow rate was reduced to 0.07 mL/min. Column temperature was 30 °C. For MS
condition, capillary voltage was 3.00 kV, Sample cone voltage was 85V, trap collision energy was
set to 60 V, source temperature was 140 °C and desolvation temperature was 500 °C. The high
sampling cone voltage was used to improve resolution and sensitivity in raw MS spectra, but this
more prone to cause in-source fragmentation.
2.4 Results and discussions
A model ADC was synthesized by AbbVie, with the chemical structure of the linker and
drug portions depicted in Figure 2-1a. The structure is similar to that of the commercial ADC,
Brentuximab, also studied here, with its structure depicted in Figure 2-1b. These are both cysteine-
conjugated ADCs using a similar, typical hydrophilic linker with coupling to the mAb cysteines
via the maleimide group. The figure shows that the drug mimic for the AbbVie model ADC and
the drug for brentuximab vedotin are quite hydrophobic, each with a log P in excess of 3, where P
is the partition coefficient for octanol/water.
ADCs can be characterized with respect to their average DAR by fully reducing the ADCs
with DTT and then separating the subunits by RPLC. Sketches to indicate labeling for intact ADCs
and the various subunits are given in Figure 2-2a. The RPLC chromatogram for the reduced
AbbVie model ADC Ab095-PZ is shown in Figure 2-2b. The mass spectrum of each peak (Figure
2-3) was used to assign each of the six peaks to the subunit, as labeled in the chromatogram. The
first two peaks are light chains without (L0) or with (L1) one drug+linker, and the latter four peaks
are heavy chains with 0, 1, 2 and 3 drug+linker attachment(s). The average DAR calculated from
the relative peak areas is 3.9. The RPLC chromatogram of Ab095-PZ without DTT reduction (i.e.,
non-reduced RPLC) is shown in Figure 2-2c. The peak assignments from MS show that the model
ADC was only partially reduced during the conjugation process, as expected. The results
demonstrate that in conventional RPLC, without interchain disulfide bond linkages, the ADC
dissociates into subunits. The value of this chromatogram is that it can be later compared to that
for native RPLC with DTT absent. The HIC chromatogram of Ab095-PZ, using a commercial
HIC-Butyl column and typical HIC salt gradient, is shown in Figure 2-2d. As is common practice,
an isopropanol gradient was superimposed on the salt gradient to attain full elution of the ADC

32
constituents. The species with higher drug loading gave multiple peaks, and this is shown later to
be due to partial resolution of positional isomers. Mass spectrometry cannot be used to identify the
peaks of Figure 2-2d because the conventional HIC salts suppress ionization and causes adduct
formation, as discussed earlier. One can make tentative peak assignments based on typical drug
loading profile for ADCs with an average DAR of 3.9, as indicated in Figure 2-2d.
The proposed strategy described earlier to enable native RPLC-MS is to use no more than
50 mM NH4OAc. This amount of salt is normally reached at the end of a salt gradient for online
HIC-MS;25, 26, 38 therefore, there is now little value in even running a salt gradient in RPLC mode.
Despite this low level of salt, the same commercial HIC column as used for the HIC of Figure 2-2d
(Thermo MabPac HIC-Butyl column) was found to give virtually no elution of the ADC; the
retention to the column is too strong for elution. This indicates that the lower kosmotropic power
of 50 mM NH4OAc gives more retention than the higher kosmotropic power of 50 mM sodium
phosphate of Figure 2-2d. The strong retention with 50 mM NH4OAc is attributed to irreversible
adsorption of the hydrophobic drug rather than to salting out of the intact ADC. The HIC stationary
phase, which is said to be made of butyl groups, is thus too hydrophobic for use with isocratic 50
mM NH4OAc, i.e., the hydrophobic interactions between ADC and bonded phase surface are
stronger than the intramolecular hydrophobic interactions within the ADC. This inspires the
proposed strategy to make the bonded phase less hydrophobic so that the free energy barrier for
protein desorption is lower than the free energy barrier for protein denaturation.
Native RPLC chromatograms of model ADC Ab095-PZ using isocratic 50 mM NH4OAc
with a gradient of 0-50% isopropanol are shown in Figure 2-4a-d for a series columns with
decreasing bonded phase hydrophobicity, including polymethyl-, polyethyl-, polypropyl- and
polybutylmethacrylate. The recovery and resolution are progressively higher with lower
hydrophobicity, consistent with less denaturation of the ADCs lower mobile phase strength.
Polymethylmethacrylate, with the lowest hydrophobicity, gives a chromatogram similar to that of
the native HIC chromatogram of Figure 2-2d, suggesting that intact ADCs are indeed eluted under
mild organic phase content without dissociation. The chromatogram is quite different from than
that of the denaturing RPLC case of Figure 2-2c, again arguing that the ADCs are not dissociated.
The downside of the nRPLC separation of the ADCs in Figure 2-4is that the native antibody, i.e.,
the species having no conjugated drug, D0, has low retention. This is an inherent outcome of the
nRPLC strategy, where the designed retention mechanism is based on the hydrophobic interaction

33
between the exposed/or partially exposed hydrophobic drug with the bonded phase. To increase
the retention of D0 species, some mixed-mode copolymer could potentially be used with minimal
effect on retention of the hydrophobic drug.
The results presented in Figure 2-4 used a reaction time of 70 min for polymer growth,
which was based on an optimization. The column performance with varying polymer growth time
is presented in Figure 2-5for polymethylmethacrylate, under the same chromatographic condition
as for Figure 2-4. The LC resolution and recovery reaches a maximum for 70 min reaction time. It
is not surprising that the bonded phase must reach certain thickness to diminish the undesired
electrostatic interactions with the surface, hence the initial improvement in separation with
thickness. Further increasing the reaction time to 85 min attains limited increase of resolution and
suffered from loss in protein recovery. One can speculate that polydispersity is beginning to effect
the separation for the long reaction time since termination occurs throughout the reaction. The
morphology of the bonded phase will eventually change from a brush-like layer to a loosely packed
polymer strands as the reaction time increases. Excessively long, isolated polymer chains could
cause protein denaturation. Overall, the nRPLC column performance is rather sensitive to the
polymer reaction time, and given that only a few reaction times were tested, it is possible that
higher peak resolution can be obtained by fine-tuning the reaction time. Optimization of other
reaction conditions, such as monomer concentration, copper (II) concentration, and temperature,
all of which affect growth rate and polydispersity of the polymer, could also give improved LC
performance.
Mass spectrometry is used to test whether the constituents of the ADC peaks are intact vs.
dissociated under nRPLC conditions for the column with polymethylmethacrylate grown for 70
min. Figure 2-6a shows the nRPLC chromatogram for the AbbVie model ADC using the
polymethylmethacrylate column, now with the gradient adjusted for faster elution. The peaks are
labeled in detail based on the mass of the most prevalent protein for each peak. The raw mass
spectral data are given in Figure 2-6b. By extracting high mass range (extracted in chromatogram
not shown), it was confirmed that the unconjugated species (D0) was barely retained and was
nearly co-eluting with the injection peak. The small peak in the chromatogram of Figure 2-6a
eluting at 10 min was identified as D1. In Figure 2-6b, the first mass spectrum assigned the peak
at 13 min as D2 based on deconvoluted mass, which gives the mass (149,380 Da) corresponding
to that expected for D2 (theoretical mass: 147,640+2x859). There are three peaks for D4, labeled
34
as D4(1), D4(2) and D4(3) in the order of elution, and Figure 2-2a showed that there are
theoretically four positional isomers for D4. Of note, the positional isomers of D4 that result from
conjugation of the upper vs lower cysteine pairs in the hinge region likely co-elute since they are
only subtly different in structure. Similarly, D6 gives two peaks when there are expected to be
three, but again, as illustrated in Figure 2-2a, two cases differ only by position on the heavy chain
(upper hinge cysteine conjugation vs. lower hinge cysteine conjugation). It is novel for a HIC
column to resolve different D4 and D6 isoforms from one another, and the separation on this
polymethylmethacrylate under nRPLC mode could be advantageous in process understanding and
quality control. The mass spectrum of the larger of the two D6 peaks is given in Figure 2-6b. It
shows some peak overlap with D4, as indicated by the light blue lines in Figure 2-6b. The mass
spectrum of the peak labeled D8 indicates it to be mainly D8 with some overlap from D5, D6 and
D7. No peaks due to fragments were observed. It is noteworthy that all ADC mass spectra
demonstrated a native-like charge envelope distribution with charge state from 24 to 33, which
further supports the conclusion of native RPLC.
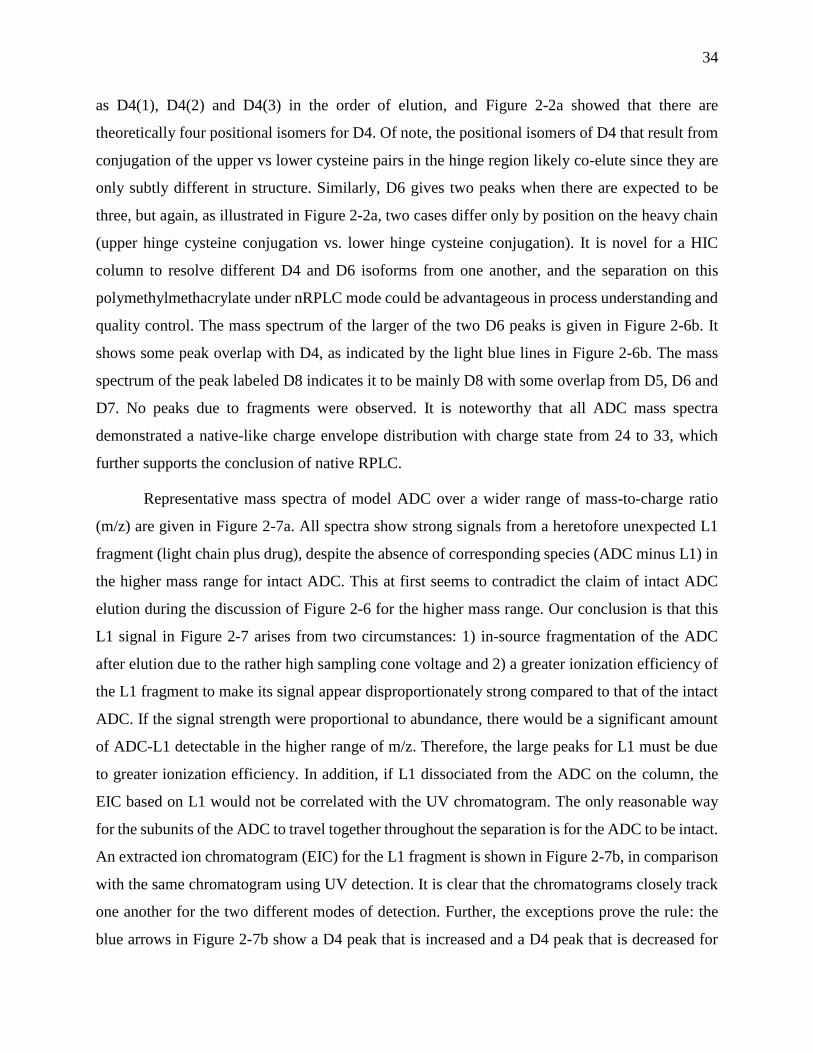
Representative mass spectra of model ADC over a wider range of mass-to-charge ratio
(m/z) are given in Figure 2-7a. All spectra show strong signals from a heretofore unexpected L1
fragment (light chain plus drug), despite the absence of corresponding species (ADC minus L1) in
the higher mass range for intact ADC. This at first seems to contradict the claim of intact ADC
elution during the discussion of Figure 2-6 for the higher mass range. Our conclusion is that this
L1 signal in Figure 2-7 arises from two circumstances: 1) in-source fragmentation of the ADC
after elution due to the rather high sampling cone voltage and 2) a greater ionization efficiency of
the L1 fragment to make its signal appear disproportionately strong compared to that of the intact
ADC. If the signal strength were proportional to abundance, there would be a significant amount
of ADC-L1 detectable in the higher range of m/z. Therefore, the large peaks for L1 must be due
to greater ionization efficiency. In addition, if L1 dissociated from the ADC on the column, the
EIC based on L1 would not be correlated with the UV chromatogram. The only reasonable way
for the subunits of the ADC to travel together throughout the separation is for the ADC to be intact.
An extracted ion chromatogram (EIC) for the L1 fragment is shown in Figure 2-7b, in comparison
with the same chromatogram using UV detection. It is clear that the chromatograms closely track
one another for the two different modes of detection. Further, the exceptions prove the rule: the
blue arrows in Figure 2-7b show a D4 peak that is increased and a D4 peak that is decreased for

35
EIC of L1. These are consistent with the expectation that one D4 should have two L1 species and
one should have none. The inset images in Figure 2-7b depict the structures of the positional
isomers. D4(2) has twice as many light chains with drug compared to D4(1), which would make
its signal increase for EIC of L1. Likewise, D4(3) has no light chain with drug, hence signal would
decreases for EIC of L1. The EIC supports the conclusion that L1 dissociated post-column and all
ADCs remained intact throughout the nRPLC separation. It is remarkable that D8, with fully
reduced interchain disulfide bonds between subunits, eluted intact.
The native RPLC-MS strategy was also tested for a commercial ADC, brentuximab vedotin,
which is a well-characterized commercial ADC, with an average DAR of 4.0, comparable to that
of the AbbVie model ADC.39 HIC was performed to compare DAR profiles of the two ADCs. The
results are provided in Figure 2-8, confirming that the DAR profiles of these two ADCs are
qualitatively similar. The chromatograms show that the D0 peak elutes later for brentuximab
vedotin, indicating that the brentuximab (mAb of brentuximab vedotin) sequence is more
hydrophobic than that of the AbbVie model ADC. This is offset by the drug of brentuximab
vedotin being less hydrophobic than the drug-linker of the AbbVie model ADC, with its lower
octanol/water partition coefficient, log P = 3.01, for MC-VC-MMAE compared to that of the
AbbVie model drug, log P = 3.35. The elution times of peaks with higher drug load in HIC are
similar in both chromatograms: 10 min.
The DAR values were calculated from the integration of peaks of the signal at 280 nm.
Figure 2-9 shows the DAR profiles comparison between HIC method from Figure 2-8a and nRPLC
method from Figure 2-6a. The average DAR are 3.80 and 3.84, respectively. The good agreement
on average DAR values indicates that nRPLC method is comparable. Furthermore, at similar target
DAR values point out the nRPLC is a promising technique for quantitative characterization of
ADC drug load distribution.
The nRPLC chromatogram for brentuximab vedotin, using the same
polymethylmethacrylate column and separation conditions as for the AbbVie model ADC, is given
in Figure 2-10a. The chromatogram is similar to that for the AbbVie model ADC, with differences
in relative peak heights and a small extra peak before D6. The D0 species is now slightly retained
in nRPLC, owing to the greater hydrophobicity of the mAb that was noted using HIC. All ADC
peaks elute somewhat earlier in nRPLC for brentuximab vedotin, consistent with the lower

36
hydrophobicity of the drug. The mass spectra, detailed in Figure 2-10b, show that the D2 peak and
the first D4 peak, D4(1), are intact, with no loss of L1. The other two D4 peaks, D4(2) and D4(3),
show some loss of one or two light chains with drug (D4-L1 and D4-2xL1), in addition to the intact
forms being observed. Overall, the results show that it is much easier to lose L1 from brentuximab
vedotin than it is from the AbbVie model ADC.
As was done with the AbbVie model ADC to distinguish on-column vs. in-source
dissociation, Figure 2-11a shows representative mass spectra over wider range of m/z for
brentuximab vedotin. The relative signals from the L1 fragment are much stronger than those of
the AbbVie model ADC, again illustrating the greater ease of loss of L1 for brentuximab vedotin.
To determine whether L1 dissociated on-column or in-source, the EIC for the L1 fragment is
shown in Figure 2-11b, in comparison with the same chromatogram using UV detection. As with
the case for the AbbVie model ADC, the UV and extracted ion chromatograms closely track one
another. The lack of an L1 background across the chromatogram confirms that all of the ADCs
remain intact throughout the course of the nRPLC separation. As with the AbbVie model ADC,
the L1 fragment signal is more pronounced in the D4(2) position than the latter peak D4(3),
indicated by the blue arrows. As with the case for the AbbVie model ADC, the relative abundances
of the L1 fragment peaks are likely associated with same two factors: a) the L1 molar ratio in the
positional isomer: 1, 2, 0, for D4(1), D4(2) and D4(3), respectively; and b) strength of the
noncovalent interaction between L1 and heavy chain in the MS source. These two factors reflect
on the L1 fragment peak abundance in the order of D4(2)>D4(1)>>D4(3). The Comparison of EIC
and UV chromatograms again supports the conclusion that nRPLC elutes intact brentuximab
vedotin species. The greater loss of L1 in the source for brentuximab vedotin relative to the AbbVie
model ADC indicates that the noncovalent interactions between light and heavy chains are weaker
for brentuximab vedotin than that of the AbbVie model ADC Ab095-PZ.
2.5 Conclusions
A novel protein chromatography technique intersecting HIC and RPLC modes was
developed, termed native reverse-phase liquid chromatography, nRPLC. nRPLC employs the
solvent elution model and MS compatibility of RPLC, while preserving the native form of protein
and ADC as in HIC. This new nRPLC technique is an alternative to HIC for ADCs when in-line

37
coupling of MS is desired by virtue of using only 50 mM NH4OAC. The nRPLC method eluted
intact ADCs for both a model ADC from AbbVie and a commercial ADC from Seattle Genetics.
Key to this chromatographic advance was lower hydrophobicity of the bonded phase to make drug-
surface hydrophobic interactions weaker than the intramolecular hydrophobic interactions that
maintain the noncovalent complexes. Inherent to this strategy of designing retention only for
interactions between the attached drug and chromatographic surface is that the D0 species has little
retention at this stage in column development. The column gives partial resolution of positional
isomers, thereby providing additional characterization beyond what is typically obtained using
HIC. The lesser number of peaks in HIC permits full resolution of the ADC based on drug loading,
which enables precise calculation of DAR. With its greater resolution of positional isomers that
currently overlap, nRPLC will be a companion rather than a replacement for HIC until resolution
is improved. Longer nRPLC columns, refinement of polymer growth conditions and optimization
of separation conditions could lead to sufficient resolution to determine DAR while also
characterizing positional isomers. To our knowledge, this is the first time that intact ADCs made
from reduced cysteines have been separated based on DAR using an MS-compatible mobile phase.
2.6 Further studies
nRPLC has been further studied for smaller proteins, for example, lysozyme, α-
chymotrypsinogen A (α-chymo. A), cytochrome C and myoglobin. PMMA column has been
applied for lysozyme and α-chymo. A under nRPLC condition. The gradients used for elution are
detailed along with the results. Figure 2-12a, b both chromatograms show non-retained peak of
lysozyme and α-chymo. A. This phenomenon is attributed to the native form of protein usually has
hydrophilic surface and buries hydrophobic part inside of the structure. The HIC separation
mechanism in this case differs from the mechanism in ADCs since ADCs perform hydrophobic
interaction with stationary phase via small and hydrophobic payloads. This result obviously
indicates that more hydrophobic surface is required. In order to investigate a suitable stationary
phase, with varying hydrophobicity of bonded phase has been tested same as Figure 2-4. However,
none of bonded phase in Figure 2-4 gives us an acceptable chromatogram. In this regard, the benzyl
methacrylate (BzMA) has been selected for nRPLC separation of proteins.

38
The polymerization of BzMA is similar as polymerization of MMA. The difference parts
are 1 M BzMA and 20:80 H2O/IPA were used. The reason to have changes on monomer
concertation and organic uses is BzMA is relatively more hydrophobic and the self-polymerization
and fast polymerization in reaction solution have been found. The lower monomer concentration
and higher organic are required to perform controllable polymerization. Figure 2-13 shows nRPLC
separation using PBzMA 90 min column. By calculating of time for stacking and gradient delay,
both lysozyme and α-chymo. A elute out at IPA approximate 30%. The deconvoluted mass spectra
show both proteins are intact and raw mass spectra show both proteins are native. The was mass
spectra are comparable with published article by Ying Ge’s group26.
Cytochrome C and myoglobin are then examined under nPRLC using PBzMA.
Cyctochrome C and myoglobin are proteins with heme-centered group. Those proteins are
relatively fragile due to an open environment of binding pocket for heme. The folding and
unfolding behavior of myoglobin has been studied40, which could be highly related to pH, resulting
in the difference solubility of heme in aqueous solution. The basic pH accelerates the release of
heme and directly interrupts the structure of heme-protein complex. Although at the low pH,
protein structure tends to be unfolded, in return, it prevents the dissociation of the heme from
protein and the heme-protein structure will be wholesome. In this regard, we use ammonium
formate at pH 5.5 instead of ammonium acetate at pH 7 for both cases of cytochrome C and
myoglobin. As we expected, we do see cytochrome C and myoglobin are denatured under certain
amount of organic use, shown in Figure 2-14. Cytochrome C in Figure 2-14a has a similar retention
time as lysozyme and α-chymo. A. however, the raw mass spectra show gradual denaturation along
with the peak from 10.5 min to 12 min. At 10.5 min, 5+ to 7+ demonstrates the charge states are
native, but in the same peak to 12 min, the charge states shift to down scale from 8+ to 12+, which
represents the cytochrome C is partially denatured41. The denaturing property results from the
intolerance of relatively high organic. Myoglobin in Figure 2-14b, is highly retained on PBzMA
and elutes at 50% IPA. Consequently, the raw mass spectrum also shows partially denatured form
of myoglobin from charge state from 1x+ to 1x+. Gratefully, the charge envelop well describes
that the myoglobin does not lose heme under nRPLC condition40.

39
2.7 References
1. Hughes, B., Antibody-drug conjugates for cancer: poised to deliver? Nature reviews. Drug
discovery 2010, 9 (9), 665-7.
2. Thomas, A.; Teicher, B. A.; Hassan, R., Antibody–drug conjugates for cancer therapy.
Lancet Oncol. 2016, 17 (6), e254-e262.
3. Beck, A.; Goetsch, L.; Dumontet, C.; Corvaia, N., Strategies and challenges for the next
generation of antibody-drug conjugates. Nature reviews. Drug discovery 2017, 16 (5),
315-337.
4. Polakis, P., Antibody Drug Conjugates for Cancer Therapy. Pharmacological reviews
2016, 68 (1), 3-19.
5. Lambert, J. M.; Berkenblit, A., Antibody-Drug Conjugates for Cancer Treatment. Annu.
Rev. Med. 2018, 69, 191-207.
6. Tsuchikama, K.; An, Z., Antibody-drug conjugates: recent advances in conjugation and
linker chemistries. Protein & cell 2018, 9 (1), 33-46.
7. Flygare, J. A.; Pillow, T. H.; Aristoff, P., Antibody-drug conjugates for the treatment of
cancer. Chemical biology & drug design 2013, 81 (1), 113-21.
8. Peters, C.; Brown, S., Antibody-drug conjugates as novel anti-cancer chemotherapeutics.
Bioscience reports 2015, 35 (4).
9. Jain, N.; Smith, S. W.; Ghone, S.; Tomczuk, B., Current ADC Linker Chemistry.
Pharmaceutical Research 2015, 32 (11), 3526-3540.
10. Hamblett, K. J.; Senter, P. D.; Chace, D. F.; Sun, M. M. C.; Lenox, J.; Cerveny, C. G.;
Kissler, K. M.; Bernhardt, S. X.; Kopcha, A. K.; Zabinski, R. F.; Meyer, D. L.;
Francisco, J. A., Effects of drug loading on the antitumor activity of a monoclonal
antibody drug conjugate. Clinical Cancer Research 2004, 10 (20), 7063-7070.
11. Behrens, C. R.; Ha, E. H.; Chinn, L. L.; Bowers, S.; Probst, G.; Fitch-Bruhns, M.;
Monteon, J.; Valdiosera, A.; Bermudez, A.; Liao-Chan, S.; Wong, T.; Melnick, J.;
Theunissen, J. W.; Flory, M. R.; Houser, D.; Venstrom, K.; Levashova, Z.; Sauer, P.;
Migone, T. S.; van der Horst, E. H.; Halcomb, R. L.; Jackson, D. Y., Antibody-Drug
Conjugates (ADCs) Derived from Interchain Cysteine Cross-Linking Demonstrate
Improved Homogeneity and Other Pharmacological Properties over Conventional
Heterogeneous ADCs. Molecular pharmaceutics 2015, 12 (11), 3986-98.
12. Sanderson, R. J.; Hering, M. A.; James, S. F.; Sun, M. M. C.; Doronina, S. O.; Siadak,
A. W.; Senter, P. D.; Wahl, A. F., In vivo Drug-Linker Stability of an Anti-CD30
Dipeptide-Linked Auristatin Immunoconjugate. Clin. Cancer Res. 2005, 11, 843-852.

40
13. Sun, M. M. C.; Beam, K. S.; Cerveny, C. G.; Hamblett, K. J.; Blackmore, R. S.;
Torgov, M. Y.; Handley, F. G. M.; Ihle, N. C.; Senter, P. D.; Alley, S. C., Reduction-
Alkylation Strategies for the Modification of Specific Monoclonal Antibody Disulfides.
Bioconjug. Chem. 2005, 16, 1282-1290.
14. Ducry, L., Antibody-Drug Conjugates. Humana Press: New York City, NY, 2013; Vol.
1045.
15. Shen, B. Q.; Xu, K.; Liu, L.; Raab, H.; Bhakta, S.; Kenrick, M.; Parsons-Reponte, K.
L.; Tien, J.; Yu, S. F.; Mai, E.; Li, D.; Tibbitts, J.; Baudys, J.; Saad, O. M.; Scales, S.
J.; McDonald, P. J.; Hass, P. E.; Eigenbrot, C.; Nguyen, T.; Solis, W. A.; Fuji, R. N.;
Flagella, K. M.; Patel, D.; Spencer, S. D.; Khawli, L. A.; Ebens, A.; Wong, W. L.;
Vandlen, R.; Kaur, S.; Sliwkowski, M. X.; Scheller, R. H.; Polakis, P.; Junutula, J. R.,
Conjugation site modulates the in vivo stability and therapeutic activity of antibody-drug
conjugates. Nat. Biotechnol. 2012, 30 (2), 184-9.
16. Adem, Y. T.; Schwarz, K. A.; Duenas, E.; Patapoff, T. W.; Galush, W. J.; Esue, O.,
Auristatin antibody drug conjugate physical instability and the role of drug payload.
Bioconjug. Chem. 2014, 25 (4), 656-64.
17. Boswell, C. A.; Mundo, E. E.; Zhang, C.; Bumbaca, D.; Valle, N. R.; Kozak, K. R.;
Fourie, A.; Chuh, J.; Koppada, N.; Saad, O.; Gill, H.; Shen, B. Q.; Rubinfeld, B.;
Tibbitts, J.; Kaur, S.; Theil, F. P.; Fielder, P. J.; Khawli, L. A.; Lin, K., Impact of drug
conjugation on pharmacokinetics and tissue distribution of anti-STEAP1 antibody-drug
conjugates in rats. Bioconjug. Chem. 2011, 22 (10), 1994-2004.
18. Lyon, R. P.; Bovee, T. D.; Doronina, S. O.; Burke, P. J.; Hunter, J. H.; Neff-LaFord, H.
D.; Jonas, M.; Anderson, M. E.; Setter, J. R.; Senter, P. D., Reducing hydrophobicity of
homogeneous antibody-drug conjugates improves pharmacokinetics and therapeutic
index. Nat. Biotechnol. 2015, 33 (7), 733-5.
19. Valliere-Douglass, J. F.; McFee, W. A.; Salas-Solano, O., Native Intact Mass
Determination of Antibodies Conjugated with Monomethyl Auristatin E and F at
Interchain Cysteine Residues. Analytical Chemistry 2012, 84 (6), 2843-2849.
20. Firth, D.; Bell, L.; Squires, M.; Estdale, S.; McKee, C., A rapid approach for
characterization of thiol-conjugated antibody-drug conjugates and calculation of drug-
antibody ratio by liquid chromatography mass spectrometry. Analytical biochemistry
2015, 485, 34-42.
21. Chen, J.; Yin, S.; Wu, Y. J.; Ouyang, J., Development of a Native Nanoelectrospray
Mass Spectrometry Method for Determination of the Drug-to-Antibody Ratio of
Antibody-Drug Conjugates. Analytical Chemistry 2013, 85 (3), 1699-1704.
22. Wiggins, B.; Liu-Shin, L.; Yamaguchi, H.; Ratnaswamy, G., Characterization of
cysteine-linked conjugation profiles of immunoglobulin G1 and immunoglobulin G2
antibody-drug conjugates. J. Pharm. Sci. 2015, 104 (4), 1362-72.
41
23. Fekete, S.; Veuthey, J. L.; Beck, A.; Guillarme, D., Hydrophobic interaction
chromatography for the characterization of monoclonal antibodies and related products.
Journal of pharmaceutical and biomedical analysis 2016, 130, 3-18.
24. J.Alpert, A., High-performance hydrophobic-interaction chromatography of proteins on a
series of poly(alkyl aspart-amide)-silicas. J. Chromatogr. A 1986, 359, 85-97.
25. Xiu, L.; Valeja, S. G.; Alpert, A. J.; Jin, S.; Ge, Y., Effective protein separation by
coupling hydrophobic interaction and reverse phase chromatography for top-down
proteomics. Anal. Chem. 2014, 86 (15), 7899-906.
26. Chen, B.; Peng, Y.; Valeja, S. G.; Xiu, L.; Alpert, A. J.; Ge, Y., Online Hydrophobic
Interaction Chromatography-Mass Spectrometry for Top-Down Proteomics. Anal. Chem.
2016, 88 (3), 1885-91.
27. Wiggins, B.; Liu-Shin, L.; Yamaguchi, H.; Ratnaswamy, G., Characterization of
Cysteine-Linked Conjugation Profiles of Immunoglobulin G1 and Immunoglobulin G2
Antibody-Drug Conjugates. Journal of Pharmaceutical Sciences 2015, 104 (4), 1362-
1372.
28. McCue, J. T., Theory and Use of Hydrophobic Interaction Chromatography in Protein
Purification Applications. Methods Enzymol. 2009, 463, 405-414.
29. J.A. Queiroz, C. T. T., J.M.S. Cabral, Hydrophobic interaction chromatography of
proteins. J. Biotechnol. 2001, 87 (143-159).
30. Géza Rippel, L. S., Hydrophobic interaction chromatography of proteins on an Alkyl-
Superose column. J. Chromatogr. A 1994, 664, 27-32.
31. Christine Machold, K. D., Rainer Hahn, Alois Jungbauer, Hydrophobic interaction
chromatography of proteins I. Comparison of selectivity. J. Chromatogr. A 2002, 972, 3-
19.
32. Xia, F.; Nagrath, D.; Garde, S.; Cramer, S. M., Evaluation of selectivity changes in HIC
systems using a preferential interaction based analysis. Biotechnology and bioengineering
2004, 87 (3), 354-63.
33. To, B. C.; Lenhoff, A. M., Hydrophobic interaction chromatography of proteins. II.
Solution thermodynamic properties as a determinant of retention. J. Chromatogr. A 2007,
1141 (2), 235-43.
34. Baca, M.; De Vos, J.; Bruylants, G.; Bartik, K.; Liu, X.; Cook, K.; Eeltink, S., A
comprehensive study to protein retention in hydrophobic interaction chromatography. J
Chromatogr. B. 2016, 1032, 182-188.
35. Chen, B. F.; Lin, Z. Q.; Alpert, A. J.; Fu, C. X.; Zhang, Q. Y.; Pritts, W. A.; Ge, Y.,
Online Hydrophobic Interaction Chromatography-Mass Spectrometry for the Analysis of
Intact Monoclonal Antibodies. Anal. Chem. 2018, 90 (12), 7135-7138.
42
36. Bobaly, B.; Beck, A.; Veuthey, J. L.; Guillarme, D.; Fekete, S., Impact of organic
modifier and temperature on protein denaturation in hydrophobic interaction
chromatography. Journal of pharmaceutical and biomedical analysis 2016, 131, 124-132.
37. Huang, X.; Wirth, M. J., Surface-Initiated Radical Polymerization on Porous Silica. Anal.
Chem. 1997, 69 (22), 4577-4580.
38. Valeja, S. G.; Xiu, L.; Gregorich, Z. R.; Guner, H.; Jin, S.; Ge, Y., Three dimensional
liquid chromatography coupling ion exchange chromatography/hydrophobic interaction
chromatography/reverse phase chromatography for effective protein separation in top-
down proteomics. Anal Chem 2015, 87 (10), 5363-5371.
39. Janin-Bussat, M. C.; Dillenbourg, M.; Corvaia, N.; Beck, A.; Klinguer-Hamour, C.,
Characterization of antibody drug conjugate positional isomers at cysteine residues by
peptide mapping LC-MS analysis. J. Chromatogr. B 2015, 981, 9-13.
40. Sogbein, O. O.; Simmons, S. A.; Konermann, L., Effects of pH on the Kinetic Reaction
Mechanism of Myoglobin Unfolding Studied by Time-Resolved Electrospray Ionization
Mass Spectrometry. J. Am. Soc. Mass Spectrom 2000, 11, 312-319.
41. May, J. C.; Jurneczko, E.; Stow, S. M.; Kratochvil, I.; Kalkhof, S.; McLean, J. A.,
Conformational Landscapes of Ubiquitin, Cytochrome c, and Myoglobin: Uniform Field
Ion Mobility Measurements in Helium and Nitrogen Drift Gas. Int J Mass Spectrom 2018,
427, 79-90.
42. McCalley, D. V., Effect of buffer on peak shape of peptides in reversed-phase high
performance liquid chromatography. Journal of Chromatography A 2004, 1038 (1-2), 77-
84.
43. McCalley, D. V., Study of overloading of basic drugs and peptides in reversed-phase high-
performance liquid chromatography using pH adjustment of weak acid mobile phases
suitable for mass spectrometry. Journal of Chromatography A 2005, 1075 (1-2), 57-64.

43
Table 2.1. Summary of HPLC columns and their applications
Column Application Mobile Phase A; B
Thermo MabPac RP RPLC, reduced ADC H2O+0.1% DFA; ACN + 0.1% DFA
Supelco Bioshell A400 RPLC, non-reduced ADC H2O+0.1% FA+0.015%TFA; ACN +
0.1% FA +0.015%TFA
Thermo-HIC butyl HIC, ADC (Purdue) 50 mM Na3PO4+1 M (NH4)2SO4, pH 7;
50 mM Na3PO4+30% IPA, pH 7
Tosoh TSKgel Butyl HIC, ADC (AbbVie) 25 mM Na3PO4+1.5 M (NH4)2SO4, pH
7; 25 mM Na3PO4+25% IPA, pH 7
PMMA, nonporous nRPLC, ADC 50 mM NH4OAc, pH 7; 50 mM
NH4OAc+50% IPA, pH7
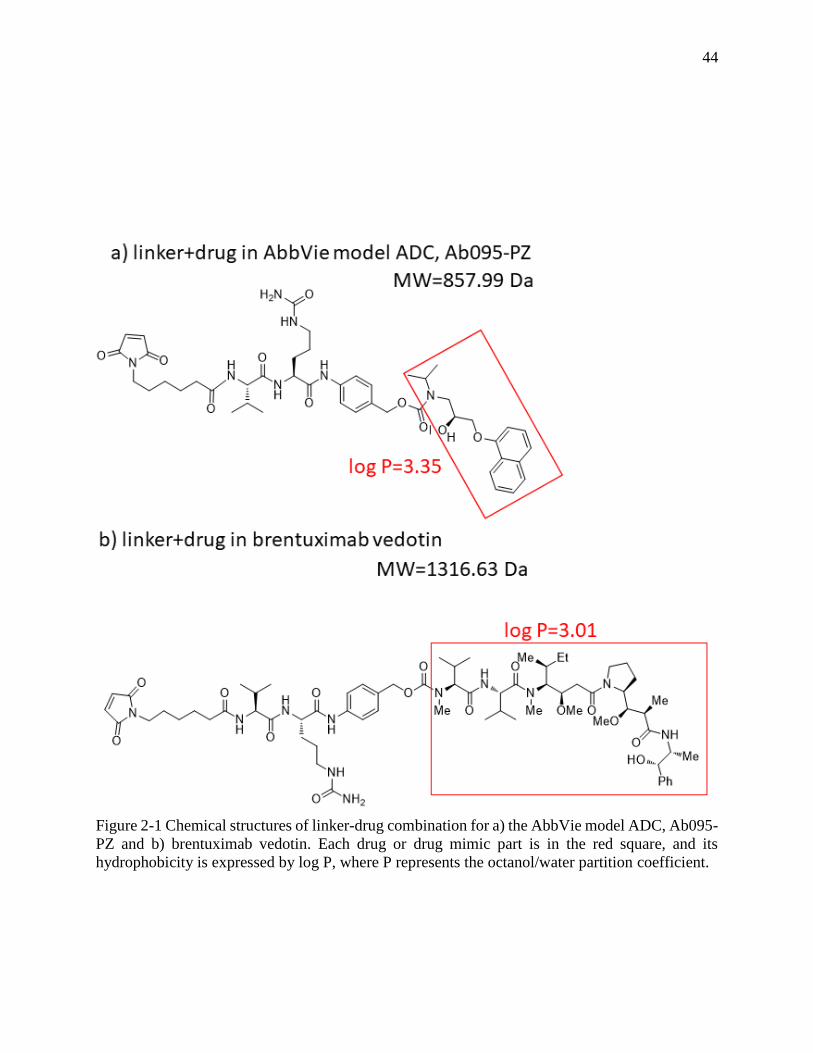
44
Figure 2-1 Chemical structures of linker-drug combination for a) the AbbVie model ADC, Ab095-
PZ and b) brentuximab vedotin. Each drug or drug mimic part is in the red square, and its
hydrophobicity is expressed by log P, where P represents the octanol/water partition coefficient.

45
Figure 2-2 a) Sketches explain abbreviations for peak assignments. b) RPLC of the model ADC
after reduction with DTT. c) RPLC of the model ADC without DTT. d) HIC of the intact ADC
with tentative peak assignments. Condition are in supporting information.

46
Figure 2-3 Raw mass spectra (right) and deconvoluted mass spectra (left) for each peak in the
chromatograms of Figure 2-2b.

47
Figure 2-4 nRPLC of AbbVie model ADC with varying hydrophobicity of bonded phase, as
denoted by the structures. Gradient conditions are A: 50 mM NH4OAc, pH 7, B: 50 mM NH4OAc,
50% IPA, pH 7, 0-100 %B /40 min, 100 %B /5 min, 100 µL/min, 30 C. The same tentative labels
as for the HIC chromatogram of Figure 2-2d are made due to the similarity.

48
Figure 2-5 nRPLC chromatogram for varying PMMA growth time using the same non-denaturing
conditions as in, showing that the 70 min growth time is optimal with respect to resolution and
recovery. Polymer growth time is labeled in each panel.

49
Figure 2-6 a) nRPLC of the AbbVie model ADC Ab095-PZ, with peaks labeled based on the mass
spectra. Gradient: 0 to 4.5% IPA/water over 3 min., then 4.5 to 50% IPA/water over 20 min.
Detection at 280 nm. b) Raw mass spectra for peaks as labeled, with the molecular weight based
on deconvoluted mass spectra for peak ID. The blue lines show that extra peaks are from overlap.

50
Figure 2-7 Evidence that light chain dissociates in MS source for AbbVie model ADC. a) Full-
range raw mass spectra show large signals for light chain+drug, but no significant signals for ADC
minus light chain+drug. b) Chromatogram with UV detection (top) and EIC based on light
chain+drug (bottom). The blue arrows point to two peaks that changed intensities, and the inset
depicts the structures for the isomers consistent with these intensity changes.

51
Figure 2-8 HIC separation of a) model ADC and b) commercial ADC Brentuximab vedotin. The
dashed lines illustrate that the greater hydrophobicity of the mAb itself for Brentuximab vedotin.
Tosoh TSKgel Butyl-NPR, 4.6x35mm, 2.5 um. MPA: 1.5M ammonium sulfate, 25 mM sodium
phosphate pH 7.0; MPB: 25 mM sodium phosphate pH 7.0 with 25% IPA; Flow rate: 0.8 mL/min;
Column temp: 25 C

52
Figure 2-9 The comparison of drug-to-antibody ratio of model ADC. a) Orange bars were
integrated peak area from Figure 2-8a, HIC separation from Tosoh TSKgel Butyl-NPR column. b)
Blue bars were integrated peak area from Figure 2-6a, nRPLC separation from PMMA column.
0
5
10
15
20
25
30
35
40
D0 D1 D2 D3 D4 D6 D8
Perc
enta
ge (
%)
Drug-to-antibody ratio (D)
DAR comparisions
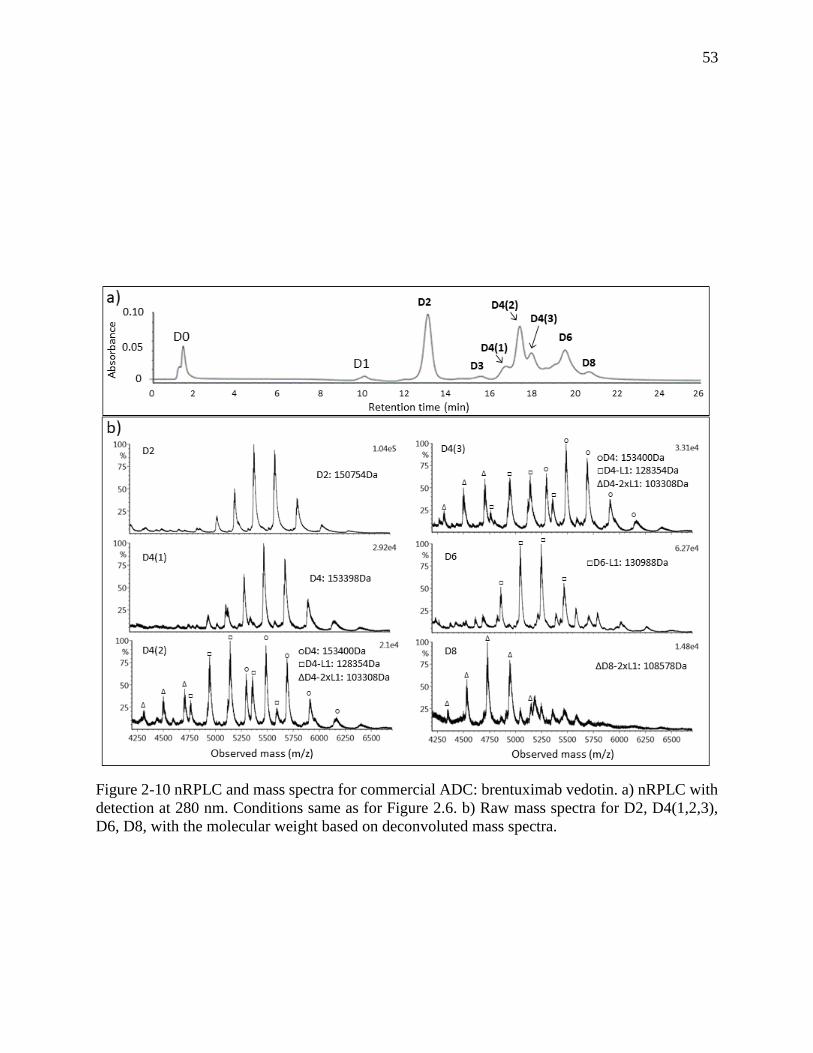
53
Figure 2-10 nRPLC and mass spectra for commercial ADC: brentuximab vedotin. a) nRPLC with
detection at 280 nm. Conditions same as for Figure 2.6. b) Raw mass spectra for D2, D4(1,2,3),
D6, D8, with the molecular weight based on deconvoluted mass spectra.

54
Figure 2-11 a) LCMS data for brentuximab vedotin, analogous to Figure 5. a) Full-range raw mass
spectra show even stronger signals for light chain+drug than observed for the AbbVie model ADC.
b) Chromatogram for UV detection (top) approximately tracks that of EIC for signal of light
chain+drug, again indicating light chain+drug dissociated after separation. Again, the blue arrows
show two peaks that changed intensities, and the inset depicts the structures for the D4 isomers
that are consistent with these changes.

55
Figure 2-12 nRPLC of a) lysozyme, and b) α-chymotrypsinogen A using PMMA with the 70 min
growth time. Gradient conditions are A: 50 mM NH4OAc, pH 7, B: 50 mM NH4OAc, 50% IPA,
pH 7, 0-100 %B /10 min, 100 %B /5 min, 100 µL/min, 25 C. Injection amount is 3 µg.
Chromatograms are shown with baseline subtraction.
0 5 10 15 20 25
0
100
200
300
400
500
600
mA
U
Time(min)
0 5 10 15 20 25
0
100
200
300
400
500
600
700
mA
U
Time(min)
a)
b)

56
Figure 2-13 nRPLC of a) lysozyme, and b) α-chymotrypsinogen A using PBzMA with the 90 min
growth time. Gradient conditions are same as Figure 2-12. Chromatograms are shown with
baseline subtraction.
a) b)
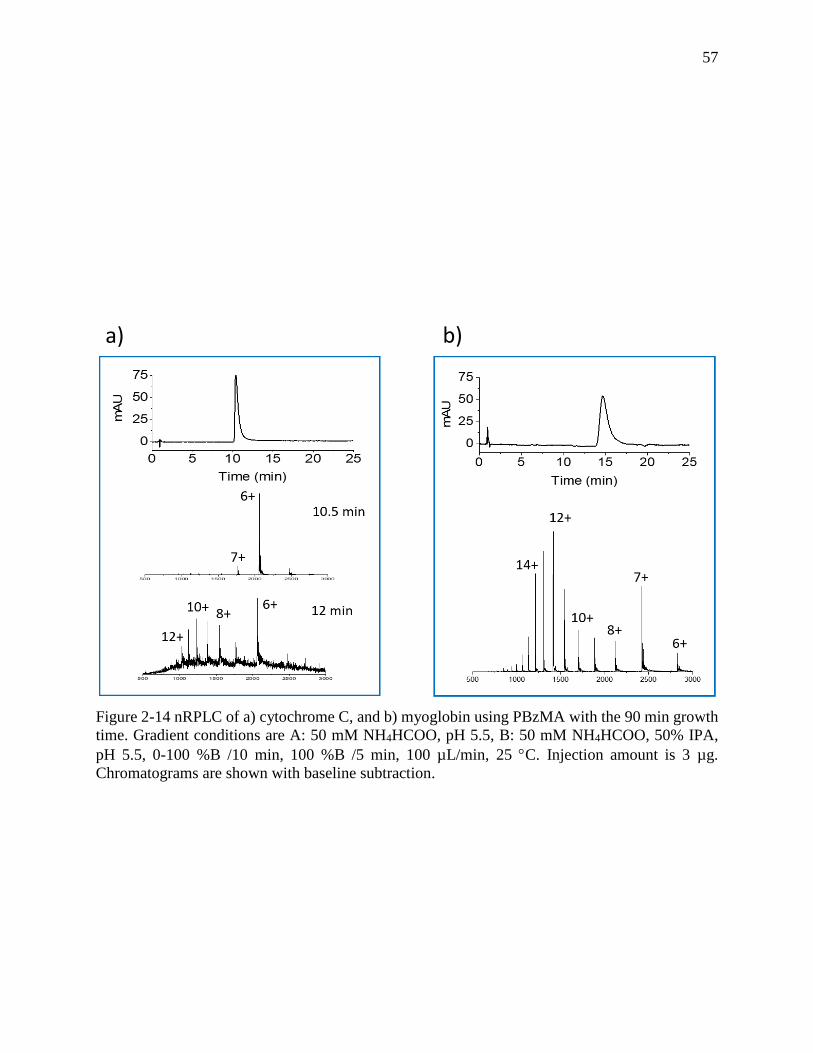
57
Figure 2-14 nRPLC of a) cytochrome C, and b) myoglobin using PBzMA with the 90 min growth
time. Gradient conditions are A: 50 mM NH4HCOO, pH 5.5, B: 50 mM NH4HCOO, 50% IPA,
pH 5.5, 0-100 %B /10 min, 100 %B /5 min, 100 µL/min, 25 C. Injection amount is 3 µg.
Chromatograms are shown with baseline subtraction.
a) b)
58
POLYMER LAYER TO SHIELD SURFACE CHARGES:
ALLOWING FOR RPLC-MS WITH 0.5% FORMIC ACID AS
ADDITIVE
3.1 Abstract
A polymethylmethacrylate bonded phase was studied for its ability to screen surface charge in
RPLC-MS for improving LC resolution with formic acid. The separation of IgG1 free thiol variants
was used to test LC resolution and MS sensitivity. For silane monolayers, LC resolution is shown
to decrease two-fold when using 0.5% formic acid place of 0.1% trifluroacetic acid, losing the
ability to resolve free thiol variants. The polymer behaves oppositely, resolving the free thiol
variants with 0.5% formic acid, but not with 0.1% trifluoroacetic acid. Chromatograms show that
increasing polymer thickness gives sharper peaks, supporting the notion of shielding surface
charge. The lower resolution for the polymer with trifluoroacetic acid is associated with marked
loss of protein recovery, which is indicated by decreasing recovery with increased ratio of
trifluoroacetic:formic acids at constant pH. This is attributed to wetting of the polymer by the
mobile phase when trifluoroacetic acid is used, as wetting makes the mobile and stationary phases
more similar. Overall, using 0.5% formic acid instead of 0.1% trifluoroacetic acid, MS sensitivity
increases 10X relative while all of the thiol variants are well resolved by the
polymethylmethacrylate bonded phase.
3.2 Introduction
The liquid chromatography coupled with mass spectrometry (LC-MS) is one of the most
powerful and reliable analytical technique for protein characterization in pharmaceutical industry.1,
2 Based on statistical data of the methods used for monoclonal antibody (mAb) from Food and
Drug Administration (FDA), LC-MS based workflow becomes a dominant implement for analysis
of biopharmaceuticals and biosimilars.3 Although the LC-MS platform has been improved, intact
protein separation from LC and mass analysis from MC are still challenging due to their large
molecule size, complicated structure, complex interactions with other molecular systems,
solubility, low ionization efficiency, sparse signal among charge states, which result in poor LC
resolution and MS sensitivity4, 5.

59
Monoclonal antibody therapies for cancer has dramatically increased since 1990 and global
sales revenue reaches $75 billion since 2013.6 There are over 300 mAb candidates currently in
pharmaceutical pipelines.6 One key factor comparing antibodies and small-molecule drugs is
specific targeting, which selectively target malignant cells with less toxic to biological system.7-9
In breast cancer, for example, the first approved mAb, trastuzumab from Genentech, showed
targeting specific HER-2 receptors to achieve clinical benefits.10 Another key factor is that mAb
is able to trigger immune responses against tumor cells to maximize therapeutic effects.7 By
blocking a PD-1/PD-L1 pathway to activate immunotherapy to battle tumors has been aggressively
studied recently. For instance, pembrolizumab from Merck has successfully triggered immune
system by inhibiting PD-1.11 Currently, immunoglobulin G1 (IgG1) is the most abundant and used
as mAb drugs effectively.12, 13
Structural heterogeneity of IgG1 causes different effector functions and its complexity
requires bioanalytical techniques severely under intact level.14 Thiol and disulfide variant of
cysteines are important post-translational modification (PTM) of IgG1. Free thiol could induce the
antibody aggregation, activity, and stability, which may significantly impact biological function15-
19. Multiple bioanalytical methods have been developed to identify free thiols: Ellman’s assay20,
fluorescent labeling21, 22, and sodium dodecyl sulfate polyacrylamide gel electrophoresis (SDS-
PAGE)23. However, those methods are strongly time-consuming and labor-intensive. Since
changes in disulfide bond and existence of free thiol could conduct protein conformational changes
and induce protein hydrophobicity changes, reversed-phase liquid chromatography (RPLC) could
thus be applied.24-27 Furthermore, RPLC method performs high selectivity and has become the
most common identification and quantification separation method to chemical modification of
mAbs at intact level28. Recently, Protein Analytical Chemistry Group in Genentech published
characterization and identification of free thiol variants and unpaired cysteines using RPLC-MS.
29-31 In these articles, 0.1% trifluoroacetic acid (TFA) was used to achieve baseline separation of
five peaks including three major thiol forms on complementarity determining regions (CDR) and
two minor thiol forms on other positions. However, TFA is not very MS-friendly due to strong ion
pairing effect, which suppresses ionization efficiency and reduce MS sensitivity enormously.5, 32,
33 Moreover, TFA can reduce protein recovery, lower chromatographic selectivity, and broaden
peak width because of ion pairing.34-36 On the contrary, formic acid (FA) has no ion pairing effect
and yields higher MS response37, 38. Nonetheless, FA inevitably reduces LC resolution and

60
sacrifices information from more hydrophilic components31, 39. By compromising the LC
resolution and MS ion response, a mixer of 0.1% FA and 0.025% TFA is an acceptable alternative
and offers similar LC resolution to 0.1% TFA only and better MS sensitivity. Due to only +2 Da
mass shift resulted from the reduction of disulfide to a pair of free thiols in the mAb, the
deconvoluted spectra did not show desirable mass difference from 2-4 Da.31 Although the N-tert-
butylmaleimide-alkylated free thiols allow the more obvious mass shift and provide additional
hydrophobicity to free thiol variants, 0.08% TFA is still required to get better baseline separation.30
Additionally, the observed mass is still not accurate and also alkylation the labeling degree and
conformational change may be concerned. As a result, it is an urgent need to develop a label-free
RPLC-MS method to characterize IgG1 free thiols with accomplishment of both LC resolution
and MS sensitivity.
In this study we report RPLC-MS using polymer-shell bonded phases for separating for free
thiol variants on intact IgG1 with 0.5% formic acid (FA) without the use of TFA, which baseline
resolves more free thiol variants and shows 1000X ion abundance higher than using TFA solely.
This polymer-shell technology allows LC directly coupled with MS. The polymer layer is thick
enough to screen surface charges from dissociated silanols. The polymer stationary phase is
evaluated using both MS-compatible and MS-incompatible mobile phases, where has the highest
LC resolution and greatest MS sensitivity using formic acid.
3.3 Materials and methods
3.3.1 Materials
Nonporous silica particles (1500 nm) were purchased from Superior Silica (Tempe, AZ).
Empty stainless-steel columns (2.1 mm I.D., 50 mm length), reservoirs (4.6 mm I.D., 150 mm),
and frits (0.5 µm pore diameter) were purchased from Isolation Technologies (Middleboro, MA).
Stainless-steel tubing, ferrules, and internal nuts were all purchased from Valco Instruments
(Houston, TX). Silanes, i.e., (chloromethyl)phenyl)dimethylchlorosilane (+99%) and
trimethylchlorosilane (+99%), were purchased from Gelest (Morrisville, PA). Methyl
methacrylate (MMA, 99%), benzyl methacrylate (BzMA, 98%) sodium ascorbate (≥99%),
butylamine (99.5%), and ammonium hydroxide were purchased from Sigma–Aldrich (St. Louis,
MO). Other chemical used included trifluoroacetic acid (TFA, 99%), difluoroacetic acid (DFA,

61
98%) and copper(II) chloride (CuCl2, 99%) from Acros Organics (Morris Plains, NJ), tris(2-
dimethylaminoethyl)amine (Me6TREN, +99%) from Alfa Aesar (Haverhill, MA), and formic acid
(FA, 99.5%+, LC/MS grade), isopropanol (IPA), and acetonitrile (ACN) from Fisher Scientific
(Hampton, NH). Ultrapure water was obtained from a Milli-Q system (MilliporeSigma, Darmstadt,
Germany.)
IgG1 sample was obtained by courtesy of Genentech, Inc. Before injected onto column,
the original 30 mg/mL IgG1 sample was diluted to 1 mg/mL with PBS 1x buffer (pH 7.2).
3.3.2 UHPLC column preparation
The silica particles were modified as described earlier40. Briefly, the 1.5 μm silica particles
were calcined at 600 °C for 12 h, then annealed at 1050°C for 3 h. SEM showed that the particles
decreased in diameter to 1.2 μm from the calcining and annealing steps. After heating steps, the
silica particles were rehydroxylated overnight in 10% HNO3, and then rinsed in ultrapure water
and dried in a 60 °C vacuum oven. Freshly rehydroxylated silica particles were suspended in a dry
toluene solution containing 2% (v/v) of (chloromethyl)phenyl)dimethylchlorosilane and 0.1% (v/v)
of butylamine. The solution was refluxed for 3 h and then 2% (v/v) of trimethylchlorosilane was
added for endcapping and refluxed for 3 h. The silylated, endcapped particles were then rinsed
with dry toluene and allowed to dry in a 60 °C vacuum oven for 2 h.
For packing a column, a 2.1 mm × 50 mm column was packed with 0.24 g of silylated,
endcapped particles suspended in acetonitrile. The reservoir (4.6 mm × 150 mm) and column were
connected in series. For polymer growth, methylmethacrylate monomer was dissolved in 40:60
H2O/IPA (v/v) in a 50 mL round bottom flask for a final concentration of 2.5 M. Two other
solutions were made in 2.0 mL of 40:60 H2O/IPA: 1) a solution containing 40 mg of CuCl2 and 80
μL Me6TREN, and 2) a solution containing 20 mg sodium ascorbate. Afterwards, the
Cu/Me6TREN solution was added to the round bottom flask, followed by the sodium ascorbate
solution. The resulting solution was poured into a plugged reservoir. A high-pressure pump,
LabAlliance Series 1500 HPLC Pump (Laboratory Alliance of Central New York, LLC, Syracuse,
NY) was used for packing and modification. The reaction solution from the reservoir was pumped
into the column starting at 200 μL/min until the reaction mixture dripped from the end of the
column. The flow rate was then lowered to 100 μL/min, and the polymerization reaction was
allowed to proceed for a range of reaction times from 0, 20, 40, 60 and 80 min for optimization.

62
After reaction, the freshly packed column PMMA was rinsed with IPA/water for 20 min at 100
μL/min.
For another bonded phase, the polymerization of benzyl methacrylate was conducted with
20:80 H2O/IPA (v/v) in a 50 mL round bottom flask for a final concentration of 1.0 M and polymer
growth time was 90 min or otherwise noted.
3.3.3 UHPLC
A Waters Acquity UPLC I-Class (Waters, Milford, MA) was used for the optimization of
RPLC separations. Lab-made RPLC columns (2.1 × 50 mm, 1.2 μm nonporous silica particles
coated with polymerization time varied PMMA) were used as the analytical columns. Mobile
phase A (MPA) and B (MPB) were water and acetonitrile, with different percentage of TFA, DFA,
and FA as acidic modifiers. The acidic modifiers and gradients used for elution are detailed along
with the results. UV absorbance wavelength was set to 280 nm. The optimal flow rate and column
temperature were investigated: 0.1 mL/min at 50 oC. The injection amount of IgG1 was 2 μg.
A commercially available AdvancedBio RP-mAb Diphenyl column (2.1 × 50 mm. 3.5 μm,
450 Å, Agilent, Santa, Clara, CA, USA) was used for comparison. Mobile phase A (MPA) and B
(MPB) were water and acetonitrile, with different percentage of FA as an acidic modifier. The
acidic modifiers and gradients used for elution are detailed along with the results. The optimized
flow rate was 100 µl/min and column temperature was 75 °C. The injection amount of IgG1 was
2 μg. The UV detection was 280 nm.
3.3.4 LC-MS
For online RPLC-MS, Waters Acquity UPLC I-Class was coupled directly to a Thermo
LTQ Velos mass spectrometer with electrospray interface. The electrospray ionization (ESI) spray
voltage was set in positive mode at 3.8 kV. Sheath and auxiliary gas pressure was 40 arb and 5 arb,
respectively. All spectra were obtained in the m/z range of 1000 – 3800, which included nearly all
of intact IgG1 charge envelope while excluding low m/z noise. The gradients and acidic modifiers
used for elution are detailed along with the results.

63
3.4 Results and discussions
Figure 3.1 shows the three major forms of free thiol variants on Genentech IgG1. To
distinguish such small mass shift from +2 Da and +4 Da by one pair or two pairs of free thiols
based on molecular mass of IgG, 150 kDa is absolutely challenging. Therefore, baseline resolved
RPLC separation and sufficient ion abundance MS sensitivity is highly required. Diphenyl
columns with wide pore are commonly used for RPLC separation for mAbs and free thiols26, 31.
Agilent AdvancedBio RP-mAb Diphenyl column (2.1 × 50 mm. 3.5 μm, 450 Å) has been selected
to make comparison of LC separation using different mobile phase composition in order to
evaluate our lab-made polymer-shell columns. Monoclonal antibody is a relatively large size
protein, which has around 11 nm by 11 nm in diameter. The larger pore size will be beneficial for
separation since it will not be trapped by smaller pore size. By running same condition (6% ACN/
3 min, 0.6 mL/min at 75 C), 450 Å pore size performs much better chromatographic resolution
than 300 Å pore size used in Liu’s article.31 In Figure 3-2a and b, the above mentioned Agilent
column was used for separations of Genentech IgG1 using 31-46% ACN within 50 min in both
0.5% FA (blue) and 0.1% TFA (red) systems in order to get fair comparison of peak width, protein
recovery, and peak selectivity. Additional 5% ACN is required to elute IgG1 out under TFA
condition in both Figure 3-2a and b because TFA ion pairing effect makes the protein more
hydrophobic, increasing elution time selectively41. In addition to retention time increase,
selectivity between two major peaks shows greater in TFA than in FA, which agrees with
increasing ion-pairing hydrophobicity increases selectivity42. Apparently, no matter acidic
modifier is FA or TFA, 75 C (Figure 3-2b) is better than 50 C (Figure 3-2a). This result further
proves that TFA has strong ion pair effect, which sometimes induces lower protein recovery and
thus, higher temperature is required34. With similar functional group, phenyl group,
polybenzylmethacrylate (PBzMA) was first selected to test IgG1 (Figure 3-2c). The gradient was
27 to 42% ACN within 50 min at 50 C in both TFA and FA conditions. Agilent diphenyl and
PBzMA both stationary phases have phenyl groups but former one performed ideal separation
under 75 C and later one is 50 C. This difference could be ascribed by faster mass transfer by
polymer shell due to owing to screening surface charges better and flexible polymer brush layer.
Again, due to affinity of TFA for hydrophobic sites on protein, retention is longer. In return, TFA
gives better peak selectivity. FA chromatogram of PBzMA is similar to FA chromatogram of
Agilent Diphenyl column with better resolving minor peaks. In contrast, PBzMA using TFA

64
resolves total 8 peaks comparing with 5 peaks in Liu’s article. Although the selectivity in Figure
3-2c is a little worse than in Figure 3-2b, most of peaks are still baseline resolved. PBzMA
performs extraordinary separation on Genentech IgG1, yet the LC condition is 0.1% TFA, MS-
unfriendly. According to previous published result, polymethylmethacrylate (PMMA) bonded-
phase has remarkable separations on antibody-drug conjugates using MS-friendly condition40.
Therefore, we further tested PMMA column for Genentech IgG1. The gradient slope is the same
as others, 15% ACN within 50 min and since methylmethacrylate is less hydrophobic than
benzylmethacrylate, 19-34% ACN was used. Surprisingly, under FA condition, PMMA column
resolves total 8 peaks shown in Figure 3-2d, which the peak assignment is comparable to PBzMA
column under TFA condition. It is seldom to have similar separation performance between FA and
TFA. Peaks are then broader with FA due to silanol dissociation.43 TFA result from PMMA on the
contrary gives low protein recovery and LC resolution. Based on the larger retention time shift
from FA to TFA than PBzMA and Agilent Diphenyl, speculation is that protein gets enmeshed
inside PMMA with TFA due to protein hydrophobicity. Overall, lower resolution (~ 2X lower)
and efficiency are generated when using FA instead of TFA. However, FA enables directly
coupled RPLC to MS. PMMA column is the selected candidate for extended investigations.
Apart from column evaluation, we valued systematically other chromatographic factors for
PMMA PMMA column. Previous works on IgG1 found out temperature plays a critical role to
significantly impact recovery and resolution31. Besides, other works discovered protein will
generally have a faster mass transfer between stationary phase and mobile phase at higher
temperature.44 So here we varied temperature in dependent of protein recovery and resolution.
Temperature has been varied from 30-70 °C with the identical separation condition detailed in
Figure 3-3. Chromatograms are of the same separation window time (Δt = 14 min), but shifted
along time axis to align the first major peak. Two vertical dashed lines indicate the distance
between two largest peaks in 30 °C chromatogram and horizontal dashed line on each
chromatogram points out the baseline shift before and after IgG1 elution. PMMA column displays
no issue on baseline shift even if temperature is 30 °C, which specifies PMMA surface is not sticky
to proteins, signaling a fast mass transfer at low temperatures. This is a big advantage to minimize
antibody on-column degradation at high temperature45. Figure 3-4a plots total protein recovery
along with the increase of temperature from 30 °C to 70 °C. The protein recovery is measured by
integral of all peaks and normalized by highest integral value, 50 °C. The normalized result shows

65
level-off after temperature reaches 50 °C. Figure 3-4b plots the distance between major peaks as a
function of temperature from 30 °C to 70 °C. Obviously, the distance is narrower, decreasing from
2.92 min (30 °C) to 2.00 min (70 °C). This observation suggests that higher temperature introduces
more hydrophobic conformation and relatively decreases hydrophobicity difference between
variants as the original hydrophobicity difference between free thiols is subtle. Although the
selectivity is worse with higher temperature, the overall chromatographic resolution is better with
higher temperature. In addition to resolution, protein recovery is another concern. In this regard,
50 °C for PMMA is a suitable temperature to maximize resolution as well as IgG1 recovery.
The IgG1 separation results using PMMA presented in Figure 3-2 and Figure 3-3 used a
reaction time of 60 min for polymer growth, which was based on optimizations. The RPLC
chromatogram for varying PMMA growth time is presented in Figure 3-5b and condition is
described in Figure 3-5. Polymer layer must be thick enough to diminish the undesired negatively
charged interactions from dissociated silanols on the surface with analytes. In accordance with he
LC resolution and recovery, 60 min reaction time is the ideal. If the bare silica modified with
BCC1 is used, there is no elution at all. Assumedly, IgG1 is trapped on column bonded phase since
strong interaction between analyte and silanols. As building thicker layer of polymer, the
resolution, peak width, peak shape, peak tailing are improved, indicating silanol effect is reduced.
Hence, the initial improvement in separation with thickness. Further increasing the reaction time
to 80 min worsens resolution and broadens peak width. One speculation is the polydispersity
happened with polymerization time affects the separation. Nevertheless, multidimensional
interactions will be introduced seriously with long polymer chains and cause tangling among
analyte and polymers. The backpressure increases with the increase of polymer thickness in view
of the decrease in porosity. The relation of backpressure and porosity can be calculated by the
Kozeny-Carman equation.
𝑃
𝐿=
180 ∙ 𝜂
𝑑𝑝2
∙(1 − 𝜀)2
𝜀3∙
𝑄
𝜋𝑟2
The porosity is 𝜀, the volume flow rate is 𝑄, the column radius is 𝑟, and all other variables have
their usual meanings. The 75:25 water/ACN (v/v) at 30 °C and Waters Acquity UPLC I-Class was
used to measure the column backpressure. The porosity before and after polymerization was
calculated by unretained peak, water injection. Then, the 𝑑𝑝 can be generated. The increase in 𝑑𝑝

66
and decrease in 𝜀 for the polymer growth can be used to estimate the polymer thickness through
the hydrodynmiac radius of the fluid channel corresponding to the particle size and porosity.
𝑟ℎ𝑦𝑑 =𝑑𝑝
3∙
𝜀
1 − 𝜀
The difference between before and after polymer growth, i.e. the initial hydrodynamic radius and
final hydrodynamic radius generates the polymer thickness. Figure 3-5a shows the calculated
polymer thickness with reaction time from 20 min to 80 min, which gives linear growth on
polymerization. Other optimizations of other reaction conditions, such as monomer concentration,
copper (II) concentration, solvent composition and temperature, all of which affect growth rate
and polydispersity of the polymer, could also give improved LC performance. Fine tunings on
reaction time may be needed to achieve even higher peak resolution. Figure 3-6 exhibits
transmission electron microscopy (TEM) image of PMMA particles. The black sphere represents
nonporous silica and grey area is polymer layers. The image was taken to show PMMA growth of
60 min on nonporous silica. The physical polymer thickness is approximately 30 nm, which is in
agreement with the calculated result on 60 min reaction.
Effect of pH modifiers was investigated, which is highly related to the density of
dissociated silanols, so that greatly impacts on the performance of column efficiency.44, 46 In Figure
3-7, the FA concentration is varied from 0.75% to 0.1% and hence the pH is increased from 2.37
to 2.81 measured by pH meter. The decrease of LC resolution occurs when pH is higher than 2.6
(0.5% FA). Peak tailing and broadening appear from strong electrostatic interactions between IgG1
and silica surface. When pH is lower 2.4, peak tailing and peak width are improved as a result of
less deprotonated silanols. Under 0.1% FA condition, PMMA column still resolves three major
free thiol variants with the loss of only minor thiols information. This is a big improvement
comparing to the result published using Agilent Diphenyl under 0.1% FA condition. They can
barely separate the first and second major peaks only (resolution < 0.5).31 It suggests that polymer-
shell bonded phase is capable of shielding charge interactions better and keeping protein away
from directly contact with silica surface.
After investigation on different FA concentration, pH has become a pivotal factor for
RPLC separation for the purpose of protonating silanols. On the other hand, ion pairing effect by
acidic modifier is another vital factor affecting RPLC separation. Hence, pH remains a constant in

67
this study to explore the function of ion pairing effect from TFA. Figure 3-7 signifies resolution
has limited improvement if pH is lower than 2.46, mobile phases with different ratio of TFA and
FA were adjusted at pH 2.46 carefully. The 0.5% FA and 0.031% TFA are both control
experiments to compare RPLC resolution and peak selectivity, shown in Figure 3-8. TFA at 0.01%
and 0.025% were blended in FA at 0.375% and 0.125%, respectively. The gradient method is same
as method in Figure 3-7, 19-28% ACN in 30 min. However, 0.031% TFA requires stronger organic
to elute IgG1 out of column (19-34% ACN in 50 min), recommending the increase of
hydrophobicity from ion-pairing. Blue double-headed arrows and brown rectangles are labeled on
chromatograms for peak selectivity measurement. (1) The shorter double-headed arrows stand for
the peak distance between the first and second major peaks. The arrow length is the same across
chromatograms. (2) The longer double-headed arrows measuring the peak distance of the first and
the last major peaks. Same as (1), the arrow length is indistinguishable across all chromatograms.
Both (1) and (2) point out the elevated concentration of TFA has negligible impact on
chromatographic selectivity under the same pH value. (3) Noteworthily, the first minor peak (the
peak right next to the first major peak) moves closer towards the first major peak from the top to
bottom of chromatograms, with higher amount of TFA present. This result reveals TFA possibly
masks the small hydrophobicity differences between peaks by reason of ion-pairing effect. With
increasing percent of TFA, IgG1 retention time shift later, also advising TFA ion pairs IgG1.
Notably, using PMMA bonded phase only requires 0.031% TFA for RPLC separation with neglect
loss of resolution. The raw ESI-mass spectra show charge envelops along with chromatograms in
the right column of Figure 3-8. Y-axis was normalized by the most intensive signal. The absolute
ion abundance was listed along with each raw mass spectra. This value descends 10-fold from 0%
to 0.031% TFA, which conveys how considerable ion suppression from TFA is. In this study, if
pH value is low enough, RPLC resolution will be maintained regardless the presence or absence
of TFA. Precisely, TFA makes RPLC separation worse in our cases.
There are less ion-pairing alternatives such as difluoroacetic acid (DFA) for protein
RPLC/MS47 for the sake of alleviating ion-suppression. Here we demonstrated some most common
acidic modifier compositions for RPLC separation of Genentech IgG1 using our lab-made
polymer-shell column online coupling with MS to differentiate ion abundance mass spectra. Figure
3-9 shows MS-compatible mobile phases from top to bottom: 0.5% FA, 0.125% FA + 0.025%
TFA, 0.1% DFA and 0.1% TFA accordingly with same gradient steepness, 9% MPB over 30 min

68
and 15% MPB over 50 min for TFA. The results presented in Figure 3-9 used optimized PMMA
column (60 min reaction time). 0.5% FA and 0.125% FA+0.025% TFA has similar LC resolution
but retention time shifts 12 min with 0.025% TFA, suggesting strong ion pairing effect.
Furthermore, TFA has a significant ESI suppression since ion abundance of 0.125% FA+0.025%
TFA is 1/4 of 0.5% FA alone. Considering of 0.1% DFA, a widely used MS-compatible acidic
modifier with relatively milder ion-pairing property gives good RPLC separation on intact IgG1
but again MS sensitivity is crucially lower than 0.5% FA. Also, DFA has 20% lower protein
recovery than 0.5% FA. Using conventional mobile phase, 0.1% TFA, apparently performs the
worst on intact IgG1 separation in terms of both LC resolution and MS sensitivity. Unsatisfactorily
low peak recovery, wide peak wide, and deficient resolution are carried out using 0.1% TFA. Ion
abundance of 0.1% TFA is three orders of magnitude lower than MS ion abundance of 0.5% FA.
Therefore, 0.5% FA has been well-studied as a satisfactory acidic modifier for PMMA bonded
phase.
3.5 Conclusions
In-house polymer-shell bonded phase performs extraordinarily online RPLC-MS analysis
for IgG1 free thiols using 0.5% FA with pleasant of LC resolution and MS sensitivity. pH value is
dominant to the reduction of detrimental electrostatic interaction between proteins and silanols on
silica. TFA, strong ion-pairing reagent, deteriorates LC resolution including protein recovery, peak
width, and peak shape. In our studies, pH is more important than ion-pairing. Therefore, it is
promising to apply polymer-shell bonded phase to other protein LC/MS separation mode, such as
HILIC/MS and HIC/MS.
3.6 Further studies
In Figure 3-2d, PMMA shows low protein recovery and wide peak width, which has
opposite behavior to PBzMA and Agilent Diphenyl shown in Figure 3-2b and c. Hydrophobicity
can be examined easily by water contact angle. Polymethyl methacrylate has water contact angle
approximate 70°.48, 49 Comparing to other popular RPLC surface, for example, C4 has contact
angle 100°, C8 is 104°, C18 gives 110°, and even polystyrene has 94°.50 Consequently,
polymethylmethacrylate is relatively hydrophilic and might be solvated with increase amount of

69
organic hypothetically. In this aspect, analytes ion-paired with TFA would have higher possibility
to be stuck into polymer brush. We tested PMMA columns with different reaction times, that is to
say to test different polymer chain length to find out whether thinner polymer layer has less
solvation effect or not and might improve LC resolution using TFA. However, PMMA thickness
from 20 min to 80 min reaction time does not show any difference on peak recovery and resolution,
shown in Figure 3-10.
Temperature is another key to improve protein recovery.51 The dependence of resolution
and recovery as a function of temperature from 40 °C to 80 °C was probed. 26-35% ACN over 30
min was used as the gradient, yet 60% ACN was added at the end of gradient to flush retained
analytes out of column. The RPLC resolution becomes better with higher temperature (Figure
3-11). At 60 degree Celsius, clear 8 peaks can be obtained, which agrees with the RPLC separation
using PBzMA under TFA in Figure 3-2c. In 40 and 50 °C chromatograms, the end of gradient (60%
ACN) shots out IgG1 residues, possessing 280 nm absorbance. At this point, the mass transfer at
lower temperature could be less efficient in the presence of TFA and hence IgG1 is trapped on the
stationary phase. Higher organic use is required to elute IgG1. Selectivity then preserves the same
trend as in Figure 3-3, lower temperature is, distinct peak distance is. As stated in Figure 3-12a,
the plot in total peak area versus temperature was made in the basis of the all integrated IgG1 peaks
from Figure 3-11 without the flushed protein residues. The trace flats out when temperature
reaches 60 °C and above. After summation of washed peak from the end of gradient, the total peak
areas across temperature from 40-70 °C are indistinguishable. This result further concludes higher
temperature is necessary on PMMA bonded phase using TFA as an acidic modifier to attain full
IgG1 recovery. As a consequence, 60 °C is the best option to balance resolution and recovery.
In comparison of temperature effect to Agilent column, the resolution and selectivity for
40 °C to 80 °C were evaluated in Figure 3-13. All chromatograms were selected the same time
window and shifted along X-axis to align the first major peak. Only temperature higher than 75 °C
gains the maximum protein recovery by Agilent Diphenyl. In contrast to PBzMA in Figure 3-2c,
50 °C reaches the greatest peak recovery, indicating that polymer results in faster mass transfer
under lower temperature. Repeatedly, higher temperature reduces peak distance because of
lessening difference in hydrophobicity by conformational changes.

70
3.7 References
1. Kaltashov, I. A.; Bobst, C. E.; Abzalimov, R. R.; Wang, G.; Baykal, B.; Wang, S.,
Advances and challenges in analytical characterization of biotechnology products: mass
spectrometry-based approaches to study properties and behavior of protein therapeutics.
Biotechnol Adv 2012, 30 (1), 210-22.
2. Beck, A.; Wurch, T.; Bailly, C.; Corvaia, N., Strategies and challenges for the next
generation of therapeutic antibodies. Nature reviews immunology 2010, 10 (5), 345.
3. Rogstad, S.; Faustino, A.; Ruth, A.; Keire, D.; Boyne, M.; Park, J., A Retrospective
Evaluation of the Use of Mass Spectrometry in FDA Biologics License Applications. J
Am Soc Mass Spectrom 2017, 28 (5), 786-794.
4. Wei, C.; Su, D.; Wang, J.; Jian, W.; Zhang, D., LC–MS Challenges in Characterizing
and Quantifying Monoclonal Antibodies (mAb) and Antibody-Drug Conjugates (ADC) in
Biological Samples. Current Pharmacology Reports 2018, 4 (1), 45-63.
5. Chen, J.; Liu, Z.; Wang, F.; Mao, J.; Zhou, Y.; Liu, J.; Zou, H.; Zhang, Y., Enhancing
the performance of LC-MS for intact protein analysis by counteracting the signal
suppression effects of trifluoroacetic acid during electrospray. Chem Commun (Camb)
2015, 51 (79), 14758-60.
6. Ecker, D. M.; Jones, S. D.; Levine, H. L., The therapeutic monoclonal antibody market.
MAbs 2015, 7 (1), 9-14.
7. Imai, K.; Takaoka, A., Comparing antibody and small-molecule therapies for cancer. Nat
Rev Cancer 2006, 6 (9), 714-27.
8. Morrow, T.; Felcone, L. H., Defining the difference: What makes biologics unique.
BIOTECHNOLOGY HEALTHCARE 2004, 1, 24-26, 28-29.
9. Hansel, T. T.; Kropshofer, H.; Singer, T.; Mitchell, J. A.; George, A. J., The safety and
side effects of monoclonal antibodies. Nat Rev Drug Discov 2010, 9 (4), 325-38.
10. Esteva, F. J., Monoclonal Antibodies, Small Molecules, and Vaccines in the Treatment of
Breast Cancer. The Oncologist 2004, 9, 4-9.
11. Zhan, M. M.; Hu, X. Q.; Liu, X. X.; Ruan, B. F.; Xu, J.; Liao, C., From monoclonal
antibodies to small molecules: the development of inhibitors targeting the PD-1/PD-L1
pathway. Drug Discov Today 2016, 21 (6), 1027-36.
12. Weiner, G. J., Building better monoclonal antibody-based therapeutics. Nature reviews.
Cancer 2015, 15 (6), 361-370.
13. Vidarsson, G.; Dekkers, G.; Rispens, T., IgG Subclasses and Allotypes: From Structure to
Effector Functions. Frontiers in Immunology 2014, 5, 520.

71
14. Rosati, S.; Yang, Y.; Barendregt, A.; Heck, A. J., Detailed mass analysis of structural
heterogeneity in monoclonal antibodies using native mass spectrometry. Nature protocols
2014, 9 (4), 967.
15. Liu, H.; Chumsae, C.; Gaza-Bulseco, G.; Hurkmans, K.; Radziejewski, C. H., Ranking
the susceptibility of disulfide bonds in human IgG1 antibodies by reduction, differential
alkylation, and LC− MS analysis. Analytical chemistry 2010, 82 (12), 5219-5226.
16. Liu, H.; May, K., Disulfide bond structures of IgG molecules. mAbs 2012, 4 (1), 17-23.
17. Hmiel, L. K.; Brorson, K. A.; Boyne, M. T., 2nd, Post-translational structural
modifications of immunoglobulin G and their effect on biological activity. Anal Bioanal
Chem 2015, 407 (1), 79-94.
18. Liu, H.; May, K., Disulfide bond structures of IgG molecules: structural variations,
chemical modifications and possible impacts to stability and biological function. MAbs
2012, 4 (1), 17-23.
19. Beck, A.; Wagner-Rousset, E.; Ayoub, D.; Van Dorsselaer, A.; Sanglier-Cianferani, S.,
Characterization of therapeutic antibodies and related products. Anal Chem 2013, 85 (2),
715-36.
20. Riener, C. K.; Kada, G.; Gruber, H. J., Quick measurement of protein sulfhydryls with
Ellman's reagent and with 4,4′-dithiodipyridine. Analytical and Bioanalytical Chemistry
2002, 373 (4), 266-276.
21. Chumsae, C.; Gaza-Bulseco, G.; Liu, H., Identification and localization of unpaired
cysteine residues in monoclonal antibodies by fluorescence labeling and mass
spectrometry. Analytical chemistry 2009, 81 (15), 6449-6457.
22. Xiang, T.; Chumsae, C.; Liu, H., Localization and Quantitation of Free Sulfhydryl in
Recombinant Monoclonal Antibodies by Differential Labeling with 12C and 13C Iodoacetic
Acid and LC-MS Analysis. Analytical Chemistry 2009, 81, 8101-8108.
23. Zhang, W.; Czupryn, M. J., Free sulfhydryl in recombinant monoclonal antibodies.
Biotechnology Progress 2003, 18, 509-513.
24. Dillon, T. M.; Ricci, M. S.; Vezina, C.; Flynn, G. C.; Liu, Y. D.; Rehder, D. S.; Plant,
M.; Henkle, B.; Li, Y.; Deechongkit, S.; Varnum, B.; Wypych, J.; Balland, A.;
Bondarenko, P. V., Structural and functional characterization of disulfide isoforms of the
human IgG2 subclass. J Biol Chem 2008, 283 (23), 16206-15.
25. Wypych, J.; Li, M.; Guo, A.; Zhang, Z.; Martinez, T.; Allen, M. J.; Fodor, S.; Kelner,
D. N.; Flynn, G. C.; Liu, Y. D.; Bondarenko, P. V.; Ricci, M. S.; Dillon, T. M.;
Balland, A., Human IgG2 antibodies display disulfide-mediated structural isoforms. J Biol
Chem 2008, 283 (23), 16194-205.

72
26. Ren, D.; Pipes, G. D.; Hambly, D. M.; Bondarenko, P. V.; Treuheit, M. J.; Brems, D.
N.; Gadgil, H. S., Reversed-phase liquid chromatography of immunoglobulin G molecules
and their fragments with the diphenyl column. J Chromatogr A 2007, 1175 (1), 63-8.
27. Newton, G. L.; Dorian, R.; Fahey, R. C., Analysis of Biological Thiols: Derivatization
with Monobromobimane and Separation by Reverse-Phase High-Performance Liquid
Chromatography. Analytical Biochemistry 1981, 114, 383-387.
28. Ren, D.; Pipes, G.; Xiao, G.; Kleemann, G. R.; Bondarenko, P. V.; Treuheit, M. J.;
Gadgil, H. S., Reversed-phase liquid chromatography-mass spectrometry of site-specific
chemical modifications in intact immunoglobulin molecules and their fragments. J
Chromatogr A 2008, 1179 (2), 198-204.
29. Zhang, T.; Zhang, J.; Hewitt, D.; Tran, B.; Gao, X.; Qiu, Z. J.; Tejada, M.; Gazzano-
Santoro, H.; Kao, Y. H., Identification and characterization of buried unpaired cysteines in
a recombinant monoclonal IgG1 antibody. Anal Chem 2012, 84 (16), 7112-23.
30. Cheng, Y.; Chen, M. T.; Patterson, L. C.; Yu, X. C.; Zhang, Y. T.; Burgess, B. L.;
Chen, Y., Domain-specific free thiol variant characterization of an IgG1 by reversed-phase
high-performance liquid chromatography mass spectrometry. Anal Biochem 2017, 519, 8-
14.
31. Liu, H.; Jeong, J.; Kao, Y.-H.; Zhang, Y. T., Characterization of free thiol variants of an
IgG1 by reversed phase ultra high pressure liquid chromatography coupled with mass
spectrometry. Journal of Pharmaceutical and Biomedical Analysis 2015, 109, 142-149.
32. Apffel, A.; Fischer, S.; Goldberg, G.; Goodley, P. C.; Kuhlmann, F. E., Enhanced
sensitivity for peptide mapping with electrospray liquid chromatography-mass
spectrometry in the presence of signal suppression due to trifluoroacetic acid-containing
mobile phases. Journal of Chromatography A 1995, 712 (1), 177-190.
33. Shou, W. Z.; Naidong, W., Simple means to alleviate sensitivity loss by trifluoroacetic
acid (TFA) mobile phases in the hydrophilic interaction chromatography-electrospray
tandem mass spectrometric (HILIC-ESI/MS/MS) bioanalysis of basic compounds. J
Chromatogr B 2005, 825 (2), 186-92.
34. Gilar, M.; Xie, H.; Jaworski, A., Utility of Retention Prediction Model for Investigation
of Peptide Separation Selectivity in Reversed-Phase Liquid Chromatography: Impact of
Concentration of Trifluoroacetic Acid, Column Temperature, Gradient Slope and Type of
Stationary Phase. Analytical Chemistry 2010, 82 (1), 265-275.
35. Nugent, K. D.; Burton, W. G.; Slattery, T. K.; Johnson, B. F.; Snyder, L. R., Separation
of proteins by reversed-phase high-performance liquid chromatography: II. Optimizing
sample pretreatment and mobile phase conditions. Journal of Chromatography A 1988,
443, 381-397.

73
36. Shibue, M.; Mant, C. T.; Hodges, R. S., The perchlorate anion is more effective than the
trifluoroacetate anion as an ion-pairing reagent for reversed-phase chromatography of
peptides. Journal of Chromatography A 2005, 1080 (1), 49-57.
37. Garc´ıa, M. C.; Hogenboom, A. C.; Zappeya, H.; Irth, H., Effect of the mobile phase
composition on the separation and detection of intact proteins by reversed-phase liquid
chromatography–electrospray mass spectrometry. journal of Chromatography A 2002,
957, 187-199.
38. Poll, D. J.; Harding, D. R. K., Formic acid as a milder alternative to trifluoroacetic acid
and phosphoric acid in two-dimensional peptide mapping. Journal of Chromatography A
1989, 469, 231-239.
39. Wang, S.; Xing, T.; Liu, A. P.; He, Z.; Yan, Y.; Daly, T. J.; Li, N., Simple Approach
for Improved LC-MS Analysis of Protein Biopharmaceuticals via Modification of
Desolvation Gas. Anal Chem 2019, 91 (4), 3156-3162.
40. Chen, T. H.; Yang, Y.; Zhang, Z.; Fu, C.; Zhang, Q.; Williams, J. D.; Wirth, M. J.,
Native Reversed-Phase Liquid Chromatography: A Technique for LCMS of Intact
Antibody-Drug Conjugates. Anal Chem 2019, 91 (4), 2805-2812.
41. Horvath, C.; Melander, W.; Molnar, I.; Molnar, P., Enhancement of Retention by Ion-
Pair Formation in Liquid Chromatography with Nonpolar Stationary Phases Analytical
Chemistry 1977, 49, 2295-2305.
42. Shibue, M.; Mant, C. T.; Hodges, R. S., Effect of anionic ion-pairing reagent
hydrophobicity on selectivity of peptide separations by reversed-phase liquid
chromatography. Journal of Chromatography A 2005, 1080 (1), 68-75.
43. Bobaly, B.; Toth, E.; Drahos, L.; Zsila, F.; Visy, J.; Fekete, J.; Vekey, K., Influence of
acid-induced conformational variability on protein separation in reversed phase high
performance liquid chromatography. J Chromatogr A 2014, 1325, 155-62.
44. Heinisch, S.; D'Attoma, A.; Grivel, C., Effect of pH additive and column temperature on
kinetic performance of two different sub-2 mum stationary phases for ultrafast separation
of charged analytes. J Chromatogr A 2012, 1228, 135-47.
45. Stackhouse, N.; Miller, A. K.; Gadgil, H. S., A high-throughput UPLC method for the
characterization of chemical modifications in monoclonal antibody molecules. J Pharm
Sci 2011, 100 (12), 5115-25.
46. McCalley, D. V., Effect of buffer on peak shape of peptides in reversed-phase high
performance liquid chromatography. Journal of Chromatography A 2004, 1038 (1-2), 77-
84.
47. Zhou, Y.; Zhang, X.; Fornelli, L.; Compton, P. D.; Kelleher, N.; Wirth, M. J.,
Chromatographic efficiency and selectivity in top-down proteomics of histones. Journal of
Chromatography B 2017, 1044, 47-53.

74
48. Briggs, D.; Chan, H.; Hearn, M. J.; McBriar, D. I.; Munro, H. S., The Contact Angle of
Poly(methyl methacrylate) Cast against Glass. Langmuir 1990, 6, 420-424.
49. Tokuda, K.; Ogino, T.; Kotera, M.; Nishino, T., Simple method for lowering poly(methyl
methacrylate) surface energy with fluorination. Polymer Journal 2014, 47 (1), 66-70.
50. Arkles, B., Hydrophobicity, Hydrophilicity and Silane Surface Modification. Gelest, Inc.:
Morrisville, PA, 2006.
51. Fekete, S.; Veuthey, J. L.; Guillarme, D., New trends in reversed-phase liquid
chromatographic separations of therapeutic peptides and proteins: theory and applications.
J Pharm Biomed Anal 2012, 69, 9-27.

75
Figure 3-1 Three major free thiol variants of Genentech IgG1. Theoretically, mass of (2) is equal
to mass of (1) + 2 Da and mass of (3) equals to (1) + 4 Da or (2) + 2 Da [Ref. 29].
(1) (2) (3)

76
0 10 20 30 40 50
0.000
0.005
0.010
0.015
Time (min)
A.U
.
0 10 20 30 40 50
0.000
0.005
0.010
0.015
A.U
.
0 10 20 30 40 50
0.000
0.005
0.010
0.015A
.U.
0 10 20 30 40 50
0.000
0.005
0.010
0.015
A.U
.
30% B
35% B
=4.1 =3.2
29% B
=2.4
34% B
=3.4
20% B
=2.5 28% B
=2.7
27% B
=2.2
=3.0
33% B
Figure 3-2 Chromatograms of IgG1 showing three main peaks: IgG1 with 0, 1 and 2 buried thiol
sites. From top to bottom panels are: a) Diphenyl at 50 C, b) Diphenyl at 75 C, c) PBzMA at 50
C, d) PMMA at 50 C. Gradients with 0.5% FA (blue) and 0.1% TFA (Red). For all
chromatograms: Δ 15%/ 50 min ACN in water, 0.1 mL/min, 2 g injected, detection at 280 nm.
(d)
(c)
(b)
(a)

77
6 8 10 12 14 16 18 20
Time (min)
2.92 min
5 mAU
30 ℃
40 ℃
50 ℃
60 ℃
70 ℃
Figure 3-3 Dependence of resolution and recovery on temperature for PMMA brush layer.
Chromatograms for temperatures from 30-70 °C for contact IgG1 separation on pMMA polymer-
shell column. The gradient was 19-28% ACN with 0.5% FA in 30 min. Chromatograms are of the
same t scale, but shifted along time axis to align the first peak. The dashed line indicates the
distance between two largest peaks in 30 °C chromatogram.

78
Figure 3-4 a) Plot of percent recovery, as determined from the chromatograms of Figure 3-3, in
comparison with published data for the diphenyl silane bonded phase. b) Plot of the distance
between peaks A and E, as a function of temperature.
30 40 50 60 702.0
2.2
2.4
2.6
2.8
3.0
Pe
ak d
ista
nce
(m
in)
Temperature (oC)
30 40 50 60 70
0.6
0.8
1.0N
om
aliz
ed a
rea
Temperature (oC)
a)
b)
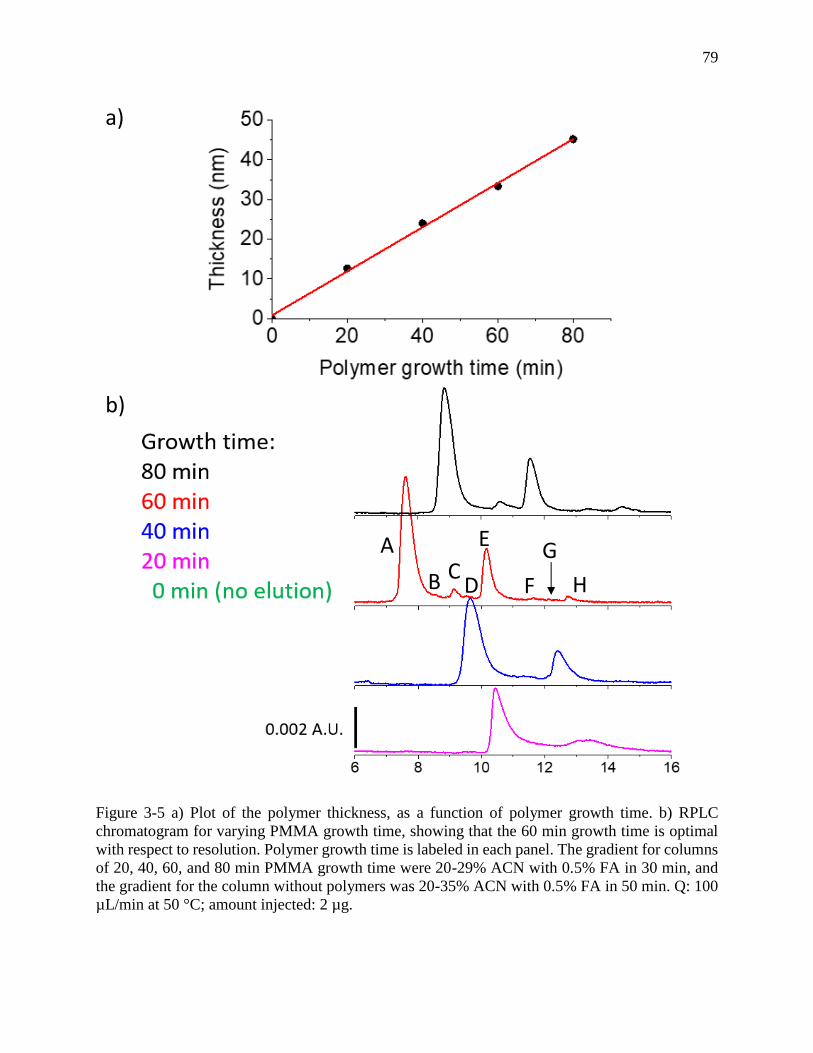
79
Figure 3-5 a) Plot of the polymer thickness, as a function of polymer growth time. b) RPLC
chromatogram for varying PMMA growth time, showing that the 60 min growth time is optimal
with respect to resolution. Polymer growth time is labeled in each panel. The gradient for columns
of 20, 40, 60, and 80 min PMMA growth time were 20-29% ACN with 0.5% FA in 30 min, and
the gradient for the column without polymers was 20-35% ACN with 0.5% FA in 50 min. Q: 100
µL/min at 50 °C; amount injected: 2 µg.
a)
b)
A
B C
D
E
F
G
H

80
Figure 3-6 TEM image to show polymer-shell grown on nonporous silica by ATRP
dp = 1.3 m
30 nm
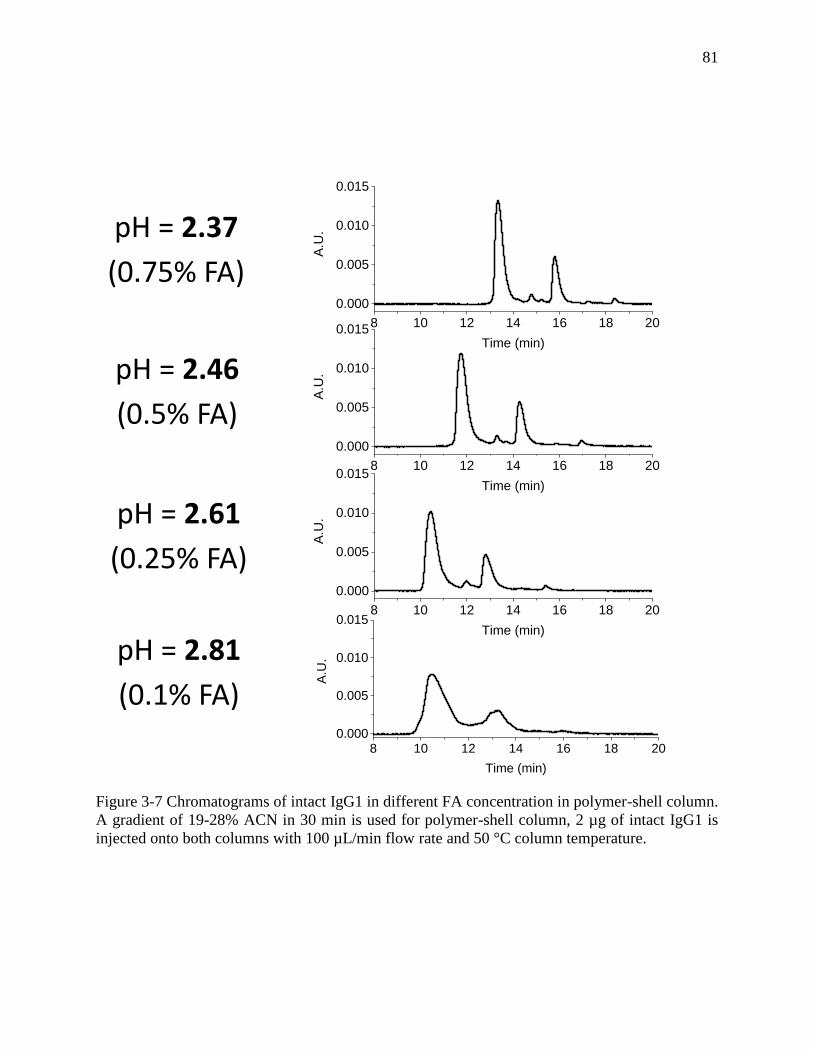
81
Figure 3-7 Chromatograms of intact IgG1 in different FA concentration in polymer-shell column.
A gradient of 19-28% ACN in 30 min is used for polymer-shell column, 2 µg of intact IgG1 is
injected onto both columns with 100 µL/min flow rate and 50 °C column temperature.
8 10 12 14 16 18 20
0.000
0.005
0.010
0.015
A.U
.
Time (min)
8 10 12 14 16 18 20
0.000
0.005
0.010
0.015A
.U.
Time (min)
pH = 2.61
(0.25% FA)
pH = 2.46
(0.5% FA)
pH = 2.81
(0.1% FA)
pH = 2.37
(0.75% FA)
8 10 12 14 16 18 20
0.000
0.005
0.010
0.015
A.U
.
Time (min)
8 10 12 14 16 18 200.000
0.005
0.010
0.015
Time (min)
A.U
.
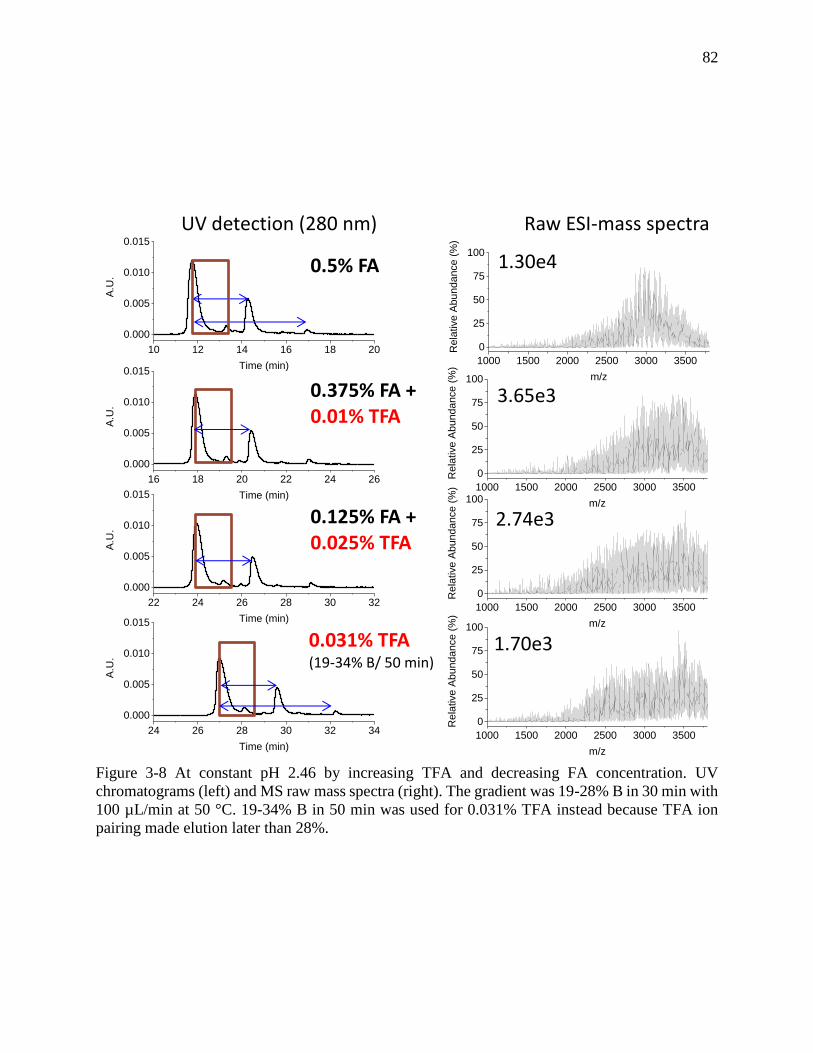
82
16 18 20 22 24 26
0.000
0.005
0.010
0.015
A.U
.
Time (min)
10 12 14 16 18 20
0.000
0.005
0.010
0.015
A.U
.
Time (min)
22 24 26 28 30 32
0.000
0.005
0.010
0.015
A.U
.
Time (min)
24 26 28 30 32 34
0.000
0.005
0.010
0.015
A.U
.
Time (min)
UV detection (280 nm)
1000 1500 2000 2500 3000 3500
0
25
50
75
100
Re
lative
Ab
un
da
nce
(%
)
m/z
0.5% FA
0.375% FA + 0.01% TFA
0.125% FA + 0.025% TFA
0.031% TFA (19-34% B/ 50 min)
1000 1500 2000 2500 3000 3500
0
25
50
75
100
Re
lative
Ab
un
da
nce
(%
)
m/z
1000 1500 2000 2500 3000 3500
0
25
50
75
100
Re
lative
Ab
un
da
nce
(%
)
m/z
1000 1500 2000 2500 3000 3500
0
25
50
75
100
Re
lative
Ab
un
da
nce
(%
)
m/z
1.30e4
3.65e3
2.74e3
1.70e3
Raw ESI-mass spectra
Figure 3-8 At constant pH 2.46 by increasing TFA and decreasing FA concentration. UV
chromatograms (left) and MS raw mass spectra (right). The gradient was 19-28% B in 30 min with
100 µL/min at 50 °C. 19-34% B in 50 min was used for 0.031% TFA instead because TFA ion
pairing made elution later than 28%.

83
10 12 14 16 18 20
0.000
0.005
0.010
0.015
A.U
.
Time (min)
22 24 26 28 30 32
0.000
0.005
0.010
0.015
A.U
.
Time (min)
22 24 26 28 30 32
0.000
0.005
0.010
0.015
A.U
.
Time (min)
36 38 40 42 44 46
0.000
0.005
0.010
0.015
A.U
.
Time (min)
0.5% FA
UV detection (280 nm)
1000 1500 2000 2500 3000 3500
0
25
50
75
100
Rela
tive A
bu
ndance (
%)
m/z
1000 1500 2000 2500 3000 3500
0
25
50
75
100
Rela
tive A
bund
ance
(%
)
m/z
0.1% TFA
1000 1500 2000 2500 3000 3500
0
25
50
75
100
Rela
tive A
bundance (
%)
m/z
0.125% FA + 0.025% TFA
Raw ESI-mass spectra
1.30e4
2.74e3
1.59e1
1000 1500 2000 2500 3000 3500
0
25
50
75
100
Rela
tive A
bundance
(%
)
m/z
0.1% DFA 2.42e3
Figure 3-9 LC resolution (left) and MS sensitivity (right) for RPLC-MS of intact IgG1 for different
acidic modifiers and combinations. The gradient was 9% B over 30 min, with a flow rate of 100
µL/min for first three RPLC methods and TFA method used 15% B over 50 min. Column
temperature was 50 °C. IgG1 injected amount was 2 µg.

84
30 35 40 45 50
0.000
0.002
0.004
0.006
A.U
.
30 35 40 45 50
0.000
0.002
0.004
0.006
A.U
.
30 35 40 45 50
0.000
0.002
0.004
0.006
A.U
.
30 35 40 45 50
0.000
0.002
0.004
0.006
A.U
.
TIme (min)
Polymer Growth time:
80 min
60 min
40 min
20 min
Figure 3-10 RPLC chromatograms of different PMMA growth time for separation of IgG1.
Gradients was 19-34% ACN/ 50 min in water, 0.1 mL/min, 2 g injected, detection at 280 nm.

85
Figure 3-11 Dependence of resolution and recovery on temperature for PMMA brush layer.
Chromatograms for temperatures from 40-80 °C for contact IgG1 separation on pMMA polymer-
shell column. The gradient was 26-35% ACN with 0.1% TFA in 30 min. Selectivity shows same
trace as Figure 3-4b, the higher temperature is, the lower peak distance.
0 10 20 30 40
0.000
0.005
0.010
0.015
A.U
. 0.00203 0.005896
0 10 20 30 40
0.000
0.005
0.010
0.015
A.U
. 0.007782
0 10 20 30 40
0.000
0.005
0.010
0.015
A.U
. 0.007875
0 10 20 30 40
0.000
0.005
0.010
0.015
Time (min)
A.U
. 0.007961
0 10 20 30 40
0.000
0.005
0.010
0.015
A.U
.0.001983
0.005968 40 ℃
50 ℃
60 ℃
70 ℃
80 ℃
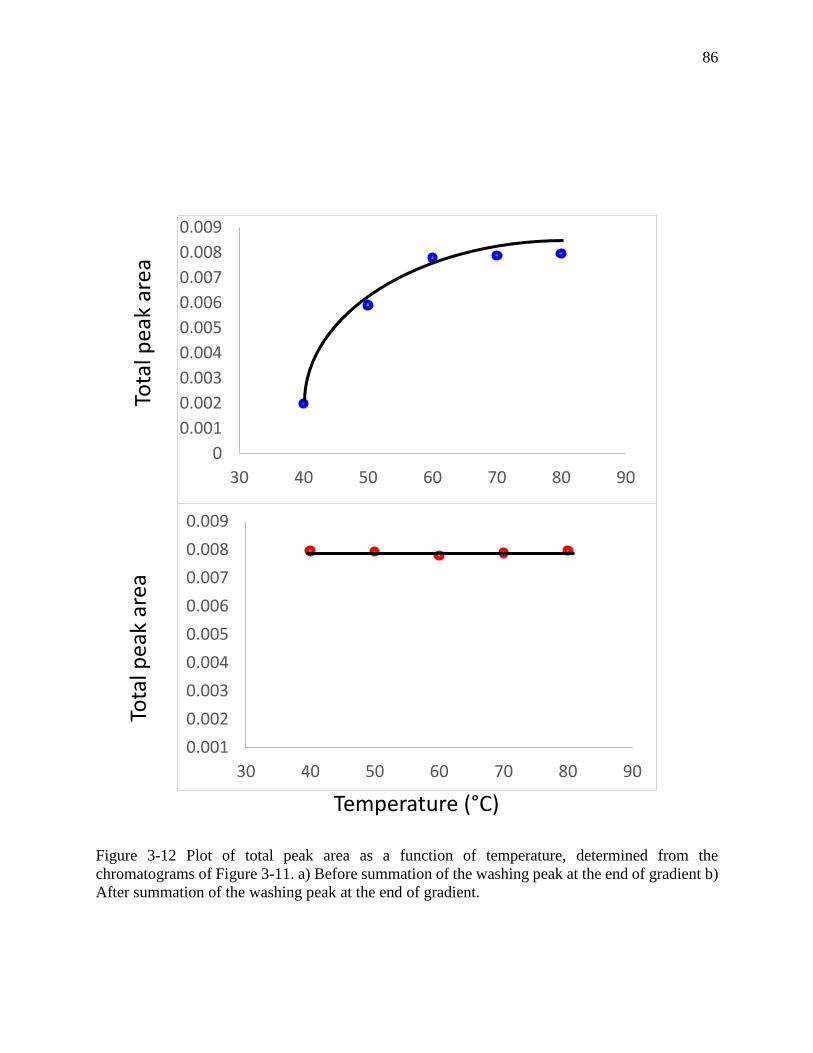
86
Figure 3-12 Plot of total peak area as a function of temperature, determined from the
chromatograms of Figure 3-11. a) Before summation of the washing peak at the end of gradient b)
After summation of the washing peak at the end of gradient.
0
0.001
0.002
0.003
0.004
0.005
0.006
0.007
0.008
0.009
30 40 50 60 70 80 90
0.001
0.002
0.003
0.004
0.005
0.006
0.007
0.008
0.009
30 40 50 60 70 80 90
Tota
l pea
k ar
ea
Temperature (°C)
Tota
l pea
k ar
ea

87
5 mAU
40 ℃ 0
60 ℃ 0.00555
50 ℃ 0.00113
70 ℃ 0.00778
75 ℃ 0.00844
80 ℃ 0.00849
Figure 3-13 Dependence of resolution and recovery on temperature for Agilent AdvanceBio RP-
mAb Diphenyl. Chromatograms for temperatures from 40-80 °C for separation of IgG1. The
gradient was 31-46% ACN with 0.1% TFA in 50 min. Chromatograms are of the same t scale,
but shifted along time axis to align the first peak. The solid line indicates the distance between
three major peaks in 80 °C chromatogram.
88
THE PHENOMENON OF HYDRODYNAMIC
CHROMATOGRAPHY
4.1 Abstract
Hydrodynamic chromatography (HDC) comes to the fore again recent years for size-based
separations on colloidal particle and polymer latex. The advantage of HDC is analytes have
experienced less shear force and hence have less potential to cause flow-induce degradation. At
this point, it is beneficial to apply HDC on protein separation since conformation would not change
via HDC method. In this chapter, we use protein samples to discuss essential theories and factors
on HDC including selection of stationary phase, particle size, column length, and column inner
diameter.
4.2 Introduction
Formulation development attracts drug makers’ attention aggressively and has become a key
process of biopharmaceutical drug development, which could have significant impacts on drug
stability, solubility, and tonicity1, 2. The control of drug aggregation is always a primary concern
during formulation process because it directly affects the shelf life and preservation of the drug.3
There are several factors induce aggregation. For instance, temperature, pH, drug concentration,
solvent, chemical modification, and structure of drug.4 In this respect, analytical technique for the
analysis of aggregation plays in a critical role.
There are several methods for the quantification and size-based characterization including
size-exclusion chromatography (SEC), sodium dodecylsulfate polyacrylamide gel electrophoresis
(SDS-PAGE), capillary electrophoresis (CE), light scattering, analytical ultracentrifugation (AUC)
and other spectroscopic methods.4, 5 Among mentioned analytical techniques, SEC is predominant
and widely used for the qualitative and quantitative evaluation of protein aggregates. Three main
advantages using SEC method: 1) It is a non-denaturing size-based separation method, which
keeps protein on original conformation and preserves its biological function with different sizes.5
2) It is relatively high throughput and easier for experimental preparation. SEC also has relatively
robustness on method validation.6 3) Peak fractions can be collected for extended
characterizations.7, 8 However, SEC has numbers of limitations. First of all, dynamic range is

89
limited, which has limitation of molecular mass that can be separated.6 Not many columns are
available for separating species larger than 300 kDa.9 Moreover, peak capacity is substantially low
since separation happens within one column volume.10 The design of SEC traditionally use at
higher flow rate, which conduct sample dilution substantially10 and shear (flow-induce)
degradation.11, 12
SEC is considered as a technique of separation by flow. Sharing with the same idea,
hydrodynamic chromatography (HDC) is now recognized.13 The theoretical foundation of HDC
was established by DiMarzio and Guttman in 1969-1971.14-17 They used polymer as a model to
explain HDC separation in an open tube. In 1974, Small published the first HDC experimental
result.18 Small employed 4 packed columns in total around 4 meter with relatively hydrophobic
packed materials to separate colloidal particles and polymer latexes on size based mechanism to
study effects of type and size of packing bed as well as ionic strength of mobile phase. Following
by the improvement of packing quality, the length of HDC column was shortened from 2-200
meters to 0.5-1 meter.19, 20 Generally, HDC application is still limited due to the use of extremely
long empty tube or compromising with packed bed but suffering from packing quality, and non-
specific binding. Until these 10 years, only very limited number publications using HDC
separation technique to nanoparticles or latex.21-24 The estimated number on published HDC
articles related to analyte separation based on size is probably less than 100 during these three
decades. However, HDC using packed column has advantages superior to SEC. For example,
packing bed in HDC in general uses non-porous particle, so back pressure is higher and only slower
flow rate can be used, which minimize shear stress to possibly destruct native form of analyte.
Traditionally, SEC separation time takes up to hours but HDC only requires few minutes, which
dramatically saves time especially under industrial manner.
In this chapter, we discuss simple theories of HDC separation, packing quality and packing
bed style effects including pore size and size of packing material, and mobile phase effect under
acidic, neutral, and surfactant conditions. Our analytes are proteins, which is the first HDC
separation on protein based on size. Also, analyte-surface interactions and limitations are
addressed.

90
4.3 Materials and methods
4.3.1 Materials
Nonporous silica particles (500, 750, 1000, and 1500 nm) were purchased from Superior
Silica (Tempe, AZ). Empty stainless-steel columns, 1.0 × 50 mm, 2.1 × 50 mm, 4.6 × 50 mm, 2.1
× 100 mm, reservoirs, 4.6 × 50 mm and 4.6 × 50 mm, and frits (0.5 µm pore diameter) were
purchased from Isolation Technologies (Middleboro, MA). Stainless-steel tubing, ferrules, and
internal nuts were all purchased from Valco Instruments (Houston, TX). Silanes, i.e.,
(chloromethyl)phenyl)dimethylchlorosilane (+99%), n-butyldimethylchlorosilane (+99%) and
trimethylchlorosilane (+99%), were purchased from Gelest (Morrisville, PA). Methyl
methacrylate (MMA, 99%), N,N-dimethylacrylamide (DMA), sodium dodecyl sulfate (≥99%),
sodium ascorbate (≥99%), butylamine (99.5%), and ammonium acetate (≥99.99) were purchased
from Sigma–Aldrich (St. Louis, MO). Other chemical used included copper(II) chloride (CuCl2,
99%) from Acros Organics (Morris Plains, NJ), tris(2-dimethylaminoethyl)amine (Me6TREN,
+99%) from Alfa Aesar (Haverhill, MA), and formic acid (FA, 99.5%+, LC/MS grade),
isopropanol (IPA), heptane, and acetonitrile (ACN) from Fisher Scientific (Hampton, NH).
Ultrapure water was obtained from a Milli-Q system (MilliporeSigma, Darmstadt, Germany.)
Lyophilized lysozyme from chicken egg white was purchased from Sigma–Aldrich (St.
Louis, MO). IgG4 were in-house made by Eli Lilly.
4.3.2 UHPLC column preparation
4.3.2.1 Polymer column
The silica particles were modified as described earlier25. Briefly, the silica particles were
calcined at 600 °C for 12 h, then annealed at 1050°C for 3 h, and rehydroxylated overnight in 10%
HNO3. Particles were then rinsed in ultrapure water and dried in a 60 °C vacuum oven. Freshly
rehydroxylated silica particles were suspended in a dry toluene solution containing 2% (v/v) of
(chloromethyl)phenyl)dimethylchlorosilane and 0.1% (v/v) of butylamine. The solution was
refluxed for 3 h and then 2% (v/v) of trimethylchlorosilane was added for endcapping and refluxed
for 3 h. The silylated, endcapped particles were then rinsed with dry toluene and allowed to dry in
a 60 °C vacuum oven for 2 h.

91
For polymer growth, N,N-dimethylacrylamide was dissolved in 50:50 H2O/IPA (v/v),
respectively in a 50 mL round bottom flask for a final concentration of 2.5 M. Two other solutions
were made: 1) a solution containing 40 mg of CuCl2 and 80 μL Me6TREN, and 2) a solution
containing 20 mg sodium ascorbate. These were also prepared in 2.0 mL of their individual solvent.
Afterwards, the Cu/Me6TREN solution was added to the round bottom flask, followed by the
sodium ascorbate solution. The resulting solution was poured into a plugged reservoir column of
4.6 mm × 150 mm. A 2.1 mm × 50 mm column was packed with 0.24 g of silylated, endcapped
particles suspended in acetonitrile. The reservoir and column were connected in series. A high-
pressure pump, LabAlliance Series 1500 HPLC Pump (Laboratory Alliance of Central New York,
LLC, Syracuse, NY) was used for packing and modification. The reaction solution from the
reservoir was pumped into the column starting at 170 μL/min until the reaction mixture dripped
from the end of the column and counted flow time for 5 min and stop the flow for the rest of
reaction time. Reaction time of N,N-dimethylacrylamide was total 60 min including 5 min flow
and 65 min stop flow After reaction, the freshly packed column polydimethylacrylamide (PDMA)
was rinsed with H2O/IPA and H2O/ACN for 20 min each at 100 μL/min.
4.3.2.2 C4C1 column
The heating step and rehydroxylation step were mentioned above. Freshly rehydroxylated
silica particles were suspended in a dry toluene solution containing 2% (v/v) of n-
butyldimethylchlorosilane (C4) and 0.1% (v/v) of butylamine. The solution was refluxed for 3 h
and then 2% (v/v) of trimethylchlorosilane (C1) was added for endcapping and refluxed for 3 h.
The silylated, endcapped particles were then rinsed with dry toluene and allowed to dry in a 60 °C
vacuum oven for 2 h.
For making C4C1 column, a 1.0 × 50 mm column was packed with 0.06 g; a 2.1 mm × 50
mm column was packed with 0.25 g; a 4.6 × 50 mm column was packed with 1.2 g; a 2.1 × 100
mm column was packed with 0.50 g of C4C1 particles. After weighing, C4C1 particles were
suspended in 30:70 heptane/IPA (v/v) and slurry was poured into a plugged reservoir column of
4.6 mm × 150 mm for 1.0 × 50 mm column and 2.1 mm × 50 mm column, and 4.6 mm × 250 mm
for 4.6 × 50 mm column and 2.1 mm × 100 mm column.

92
4.3.3 UHPLC
A Waters Acquity UPLC I-Class (Waters, Milford, MA) was used for hydrodynamic
chromatography with no salt condition. Lab-made columns (polymer columns and C4C1 columns)
were used as the analytical columns. Mobile phases and gradients used for elution were detailed
along with the results.
4.4 Theory and design
SEC has been applied with stationary phase with pores since aggregation would be
sterically hindered by pores and small analyte would be stagnant inside the pores.11 On the contrary,
HDC has been developed on non-porous stationary phase in order to maintain laminar flow.13, 26
HDC separation occurs in the parabolic or named Hagen–Poiseuille flow profile under laminar
flow conditions. The separation mechanism is shown in Figure 4-1. The liquid flow in the
interstitial void space generates Poiseuille flow profile due to interaction of wall/packing material
and mobile phase, which causes viscous forces. Therefore, mean velocity near wall/packing
material is diminished, whereas center has highest mean velocity. When analytes pass through the
limited void space, accessibility of this interface region becomes dominant and size-discriminating
happens spontaneously. Because of Brownian diffusion, smaller analytes are accessible to more
regions of void space and moves with relatively slower mean velocity. However, larger analytes
are rejected from the sluggish regions near the wall/packing material and migrate consequently
with the greater average velocity close to the center.19, 27, 28 Therefore, larger analytes elute earlier
than smaller analytes. Elution order in HDC is the same as in SEC. However, the separation
mechanisms are different. Preferential sampling in SEC separation depends on pore volume,
whereas preferential sampling in HDC is streamlines of flow (or to a preferential distribution of
analyte between fluid mechanical phases).
We use expanded Van Deemter equation to study possible challenges for HDC.
𝐻 = 𝐴 +𝐵
𝜈+ 𝐶𝑚𝜈 + 𝐶𝑝𝜈 + 𝐶𝑠𝑣
Where H represents plate height and 𝜈 is linear velocity. The A term can be considered as packing
quality, which corresponds to multiple pathways that a solute could find. The B term is longitudinal
diffusion, which describes a solute continuously diffuses away from their concentrated band center

93
along with the direction of flow travel. Solutes spend less time in the column, the less B term
occurs. C term relates to equilibrium time at millisecond scale of a solute required between mobile
phase and stationary phase, called resistance to mass transfer. C term is then expanded into three
factors, 𝐶𝑚, 𝐶𝑝, and 𝐶𝑠. Under easier way to understand the function of three C terms, the term 𝐶𝑚
accounts for the mass transfer in mobile and 𝐶𝑠 is in charge of the mass transfer in stationary phase.
The 𝐶𝑝 term only arises from porous or superficially porous particles, in which a solute passes in
and out from stationary pores. In our case, we are using non-porous particles, so the 𝐶𝑝 term is
zero. Our analytes are proteins that has negligible longitudinal diffusion, normally within a order
of 10-6 or 10-7. Hence, the B term can be neglect. The 𝐶𝑠 however is tricky owing to non-specific
interactions between proteins and stationary phase. Ideally, both SEC and HDC separations should
not have analyte-surface interaction to cause non-specific binding and restrict the separation
resolution. In the view of complexity of protein structures and large molecules, analyte-surface
interaction is inevitable.29-31 On those accounts, Van Deemter equation is re-written as following.
𝐻 = 𝐴 + 𝐶𝑚𝜈 + 𝐶𝑠𝑣
In Dr. Wirth lab, we have patented method of packing chromatographic columns.32 We are
able to uniformly pack columns with porosity ( 𝜀 ) lower than theoretical minimum (0.4) in
Giddings book.33 As scanning electron microscope (SEM) images and calculated porosity shown
in our publications34-38, the silica particles are well-arranged to form crystals with a face-center
cubic (FCC), which shows opalescence in blue color. Our lab invented packing method produces
porosity range typically 0.26 to 0.40. The average of porosity in our lab for stainless steel is
typically 0.36 and capillary gives even better packing to have 𝜀 lower than 0.3. In this point of
view, the A term ascribes to the increase of plate height can be minimized. In contrast to long open
tubes, well-packed stationary phase generates well-ordered pore sizes. The interstitial spaces from
packing medium can be considered as short channels, so a collection of all these channels could
be regarded as a long open tube in which HDC phenomenon arises (Figure 4-2).
4.5 Results and discussions
We solved the packing issue of the A term, now 𝐶𝑚 and 𝐶𝑠 terms are investigated using
different stationary phases and mobile phases. Recently, our group published a separation of large
proteins, up to 1.2 megaDalton by packed capillary electrophoresis (pCE) since pore sizes are well-

94
controlled.38 Proteins will not be trapped by small pores transiently from wide distribution of pore
sizes to slow down separation speed. Preferably, HDC should be explicated using packed capillary.
Nevertheless, sodium dodecyl sulfate (SDS) is not nanoLC-friendly, stainless steel column using
UHPLC system is an alternative. In the best scenario to generate similar results from packed
capillary to packed stainless steel column, 350 nm bare silica particles should be used. Because of
the limitation of packing quality and pore size on column frits (0.5 µm), 500 nm particle is the
smallest size we could use to pack a stainless-steel column Porosity was calculated by unretained
water injection peak in Figure 4-3, which gives 𝜀 = 0.37. The calculated 𝜀 is smaller than 0.4,
indicating uniformed packing was obtained. HDC phenomenon has been first proved by applying
capillary electrophoresis condition to liquid chromatography shown in Figure 4-3. In all cases
throughout this chapter, lysozyme (~14 kDa) and Eli Lilly IgG4 (~150 kDa) were used. Notebaly,
the elution order in Figure 4-3 gives IgG4 (red) first, lysozyme (blue), and the last water injection
(black), which exactly matches the elution order from large analytes to small analytes.
Nevertheless, the resolution is slightly less than 1, which shows not good resolution and low peak
capacity. According to the recoded video to calculate a physical peak width of protein ladder, the
average physical peak width using CE is approximately 0.8 mm. Then, physical peak width using
stainless steel column with UHPLC can be calculated in Figure 4-3 with subtraction of system
void volume, 8.2 µL, which yields the average physical peak width at approximation 5.0 mm. The
average physical peak width using stainless steel column with UHPLC is roughly 6-fold greater
than using CE due to larger void volume using a wider bore column and resulting in band
broadening. Undoubtedly, the limitation of HDC under stainless steel column with UHPLC system
will be peak capacity. Moreover, the wider peak width is, the lower resolution is.
Figure 4-3a shows HDC separation using 0.1% formic acid (FA) and 1% SDS under
different volumetric flow rate. Obviously, resolution is independent of flow rate that similar
resolution between lysozyme and IgG4 were attained from 20 µL/min to 60 µL/min. This result
agrees with an overview of HDC conditions published by Edam’s group.22 No matter lysozyme or
IgG4 peaks, full width of half maximum (FWHM) are slightly larger than FWHM of water
injection peak, attributing to undesired analyte-surface interaction. When SDS was reduced to
0.1%, lysozyme gets stuck on stationary phase and IgG4 elutes later than water injection (Figure
4-3b). Presumably, SDS pairs on protein surface by hydrophobic interactions and increases protein
hydrophobicity. In contrast to hydrophobic protein surface, bare silica particles are hydrophilic

95
due to high density of silanols, so hydrophobic proteins become slippery to hydrophilic stationary
phase. Moreover, negatively charged SDS turns protein net charge into negative, so negatively
charged proteins is repulsive from negatively charged silanols. Thus, 2% SDS was tested to prove
the role of SDS in HDC separation. Figure 4-3c gives slightly better resolution than Figure 4-3a.
Although peak width in 2% SDS is also slightly wider than 1% SDS, the resolution is improved
and approaches to 1. With increasing on flow rate, a second peak emerges. It could be due to
protein conformational change with increasing on back pressure.39, 40 However, mass spectrometry
(MS) characterization is not possible in this case because of in the presence of SDS. Fortunately,
HDC separation takes place using acidic modifier and SDS. Nonetheless, SDS is not compatible
with MS, substituted stationary phases and mobile phase modifiers need to further investigate.
On the purpose of removing SDS, proteins become relatively hydrophilic, so hydrophobic
stationary phase is an approach to avoid hydrogen bonding interactions or hydrophilic interactions.
Bare silica surface modified with butyl group (C4) was first applied to HDC separation. To
compromise back pressure limit by exploring effects of column length, column inner diameter,
and particle size, 1500 nm C4 stationary phase packed in a 2.1 × 100 mm was regarded as a
standard. In Chapter 3, we addressed that dissociated silanol is a crucial factor to retain proteins
on stationary phase. 0.5% FA was used to protonate silanols as much as possible. To further avoid
protein-surface interactions, 50% ACN was applied. Flow rate was first screened to study the
relation between protein peak shape and back pressure in Figure 4-4. The chromatographic result
is similar as Figure 4-3 that resolution does not improve by varying flow rate. Instead, resolution
shown in Figure 4-4 is actually worse than resolution shown in Figure 4-3 because FA is a weak
acid and a weak ionic strength acidic modifier. Silanols are dissociated and carries negative charge
to induce uninvited protein-silanol interactions. Likewise, a second peak shows up with increase
of flow rate. In spite of not acceptable resolution, at least, HDC occurs using C4 surface with MS-
compatible conditions.
C4 particle size, column length and inner diameter were then probed in Figure 4-5. HDC
chromatograms of 1500 nm C4, 750 nm C4, and 500 nm C4 give similar retention time in water
injection, addressing packing quality is consistent with different particle sizes. However, IgG4
peak gets closer to lysozyme peaks when smaller particle was used. Unfortunately, this result is
opposite to previous published article that smaller particle size achieves better resolution under CE
condition.38, 41 Hypothetically, greater surface area from smaller particle size contributes to

96
stronger undesired protein-surface interactions. Interestingly, protein peaks separate further away
from water injection while using smaller particle size. In this aspect, both mobile phase
composition and stationary phase have to investigate deeply. By decreasing void volume through
shorter and thinner columns, as expected, the resolution is worse. This consequence indicates that
HDC requires certain amount of void volume to yield better parabolic separation flow profile. In
this respect, wider column will be the next step to test rather than using even longer column due
to packing quality.
Formic acid has pKa (3.75) closes to silanols (pKa = 4.5), so isolated silanols are possibly
charged. Trifluoroacetic acid (TFA) replaces FA for examination on silanol effect and 2.1 × 100
mm packed with 750 nm C4 particles were applied. HDC chromatogram in Figure 4-6 reveals
peak width of lysozyme and IgG4 is comparable to peak width of water injection. Besides,
comparing to the same column under FA condtion shown in Figure 4-5, intact IgG4 under TFA
gives homogeneous structure with only one peak without split. Alike RPLC separation using
commercially alkyl column mentioned in Chapter 3, TFA has better LC resolution than FA.
TFA produced better peak shape, resolution, and narrower peak width using 750 nm C4
column, pointing out strong protein-surface interactions from C4 bonded phase. Throughout
Chapter 2 and 3, we expressed that polymer brush layer can keep protein away from silica surface
and shield electrostatic interaction from dissociated silanols. As a result, polydimethylacrylamide
(PDMA) was chosen to perform HDC separation instead. The preliminary result shown in Figure
4-7, describes a baseline resolution between lysozyme and water injection. Despite the resolution
between IgG4 and lysozyme is still smaller than 1, which is similar as the best resolution shown
in Figure 4-3. It is a good sign of using polymer-shell bonded phase.
4.6 Conclusions and further plans
In this work, HDC phenomenon is proved using lysozyme and IgG4. Even though none of
separation in this HDC chapter achieves baseline resolved, it is still a promising method that could
be possibly applied to protein separation based on size differences. What exciting aspect is there
is not yet any application of HDC on protein separations. One drawback in this discovery is all
separation methods denature proteins. Therefore, protein cannot preserve its sphere structure and
might experience longer time to pass through pores. The native state under salt condition may be

97
a potential direction to not only maintain protein non-denaturing structure but also reduce
undesired protein-silanol interactions.
4.7 References
1. Frokjaer, S.; Otzen, D. E., Protein drug stability: a formulation challenge. Nat Rev Drug
Discov 2005, 4 (4), 298-306.
2. Kamerzell, T. J.; Esfandiary, R.; Joshi, S. B.; Middaugh, C. R.; Volkin, D. B., Protein-
excipient interactions: mechanisms and biophysical characterization applied to protein
formulation development. Adv Drug Deliv Rev 2011, 63 (13), 1118-59.
3. Ohtake, S.; Kita, Y.; Arakawa, T., Interactions of formulation excipients with proteins in
solution and in the dried state. Adv Drug Deliv Rev 2011, 63 (13), 1053-73.
4. Mahler, H. C.; Friess, W.; Grauschopf, U.; Kiese, S., Protein aggregation: pathways,
induction factors and analysis. J Pharm Sci 2009, 98 (9), 2909-34.
5. Fekete, S.; Beck, A.; Veuthey, J. L.; Guillarme, D., Theory and practice of size exclusion
chromatography for the analysis of protein aggregates. J Pharm Biomed Anal 2014, 101,
161-73.
6. Arakawa, T.; Ejima, D.; Li, T.; Philo, J. S., The critical role of mobile phase composition
in size exclusion chromatography of protein pharmaceuticals. J Pharm Sci 2010, 99 (4),
1674-92.
7. Muneeruddin, K.; Thomas, J. J.; Salinas, P. A.; Kaltashov, I. A., Characterization of
small protein aggregates and oligomers using size exclusion chromatography with online
detection by native electrospray ionization mass spectrometry. Anal Chem 2014, 86 (21),
10692-9.
8. Boing, A. N.; van der Pol, E.; Grootemaat, A. E.; Coumans, F. A.; Sturk, A.;
Nieuwland, R., Single-step isolation of extracellular vesicles by size-exclusion
chromatography. J Extracell Vesicles 2014, 3.
9. Hong, P.; Koza, S.; Bouvier, E. S., Size-Exclusion Chromatography for the Analysis of
Protein Biotherapeutics and their Aggregates. J Liq Chromatogr Relat Technol 2012, 35
(20), 2923-2950.
10. Bouvier, E. S. P.; Koza, S. M., Advances in size-exclusion separations of proteins and
polymers by UHPLC. TrAC Trends in Analytical Chemistry 2014, 63, 85-94.
11. Barth, H. G.; Boyes, B. E.; Jackson, C., Size Exclusion Chromatography and Related
Separation Techniques. Analytical Chemistry 1998, 70, 251R-278R.
98
12. Barth, H. G.; Carlin, F. J., A Review of Polymer Shear Degradation in Size-Exclusion
Chromatography. Journal of Liquid Chromatography 2006, 7 (9), 1717-1738.
13. Striegel, A. M.; Brewer, A. K., Hydrodynamic chromatography. Annu Rev Anal Chem
(Palo Alto Calif) 2012, 5, 15-34.
14. DiMarzio, E. A.; Guttman, C. M., Separation by flow. POLYMER LETTERS 1969, 7, 267-
272.
15. Guttman, C.; DiMarzio, E., Seperation by Flow. II. Application to Gel Permeation
Chromatography. Macromolecules 1970, 3 (5), 681-691.
16. DiMarzio, E. A.; Guttman, C. M., Separation by Flow. Macromolecules 1970, 3 (2), 131-
146.
17. DiMarzio, E. A.; Guttman, C. M., Separation by flow and its application to gel permeation
chromatography. JOURNAL OF CHROMATOGRAPHY 1971, 55, 83-97.
18. H, S., Hydrodynamic Chromatography. Journal of Colloid and Interface Science 1974, 48,
147-161.
19. Small, H.; Langhorst, M. A., Hydrodynamic Chromatography. ANALYTICAL
CHEMISTRY 1982, 54, 892A-898A.
20. Revillon, A., Alternatives to Size Exclusion Chromatography. Journal of Liquid
Chromatography 1994, 17 (14-15), 2991-3023.
21. Brewer, A. K.; Striegel, A. M., Hydrodynamic chromatography of latex blends. J Sep Sci
2010, 33 (22), 3555-63.
22. Edam, R.; Eeltink, S.; Vanhoutte, D. J.; Kok, W. T.; Schoenmakers, P. J.,
Hydrodynamic chromatography of macromolecules using polymer monolithic columns. J
Chromatogr A 2011, 1218 (48), 8638-45.
23. Gray, E. P.; Bruton, T. A.; Higgins, C. P.; Halden, R. U.; Westerhoff, P.; Ranville, J. F.,
Analysis of gold nanoparticle mixtures: a comparison of hydrodynamic chromatography
(HDC) and asymmetrical flow field-flow fractionation (AF4) coupled to ICP-MS. Journal
of Analytical Atomic Spectrometry 2012, 27 (9).
24. Philippe, A.; Schaumann, G. E., Evaluation of hydrodynamic chromatography coupled
with UV-visible, fluorescence and inductively coupled plasma mass spectrometry
detectors for sizing and quantifying colloids in environmental media. PLoS One 2014, 9
(2), e90559.
25. Huang, X.; Wirth, M. J., Surface-Initiated Radical Polymerization on Porous Silica. Anal.
Chem. 1997, 69 (22), 4577-4580.

99
26. Guillaume, Y.-C.; Robert, J.-F.; Guinchard, C., A Mathematical Model for
Hydrodynamic and Size Exclusion Chromatography of Polymers on Porous Particles.
analytical Chemistry 2001, 73, 3059-3064.
27. Small, H.; Saunders, F. L.; Solc, J., Hydrodynamic chromatography - A new approach to
particle size analysis. Advances in Colloid end interface Science, 1976, 6, 237-266.
28. STEGEMAN, G.; KRAAK, J. C.; HOPPE, H., Hydrodynamic and size-exclusion
chromatography of polymers on porous particles. Journal of Chromatography 1991, 550,
721-739.
29. Lou, J.; Harinath, V., Effects of Molecular Weight and Flow Rate on Stress‐Induced
Migration of Polystyrene. Journal of Liquid Chromatography & Related Technologies
2009, 27 (18), 2819-2835.
30. Goyon, A.; Sciascera, L.; Clarke, A.; Guillarme, D.; Pell, R., Extending the limits of size
exclusion chromatography: Simultaneous separation of free payloads and related species
from antibody drug conjugates and their aggregates. J Chromatogr A 2018, 1539, 19-29.
31. Adrover, A.; Cerbelli, S.; Giona, M., Taming axial dispersion in hydrodynamic
chromatography columns through wall patterning. Physics of Fluids 2018, 30 (4).
32. Wirth, M. J.; Kodithuwakkuge, S. R.; Yerneni, C.; Birdsall, R. E.; Kodithuwakkuge, T.
R. Method of packing chromatographic columns. US9504936B2, 2016.
33. Giddings, J. C., Unified Separation Science. Wiley-Interscience: New York City, NY,
1991; p 65.
34. Huckabee, A. G.; Yerneni, C.; Jacobson, R. E.; Alzate, E. J.; Chen, T. H.; Wirth, M. J.,
In-column bonded phase polymerization for improved packing uniformity. J Sep Sci 2017,
40 (10), 2170-2177.
35. Wei, B.; Rogers, B. J.; Wirth, M. J., Slip flow in colloidal crystals for ultraefficient
chromatography. J Am Chem Soc 2012, 134 (26), 10780-2.
36. Wu, Z.; Wei, B.; Zhang, X.; Wirth, M. J., Efficient separations of intact proteins using
slip-flow with nano-liquid chromatography-mass spectrometry. Anal Chem 2014, 86 (3),
1592-8.
37. Njoya, N. K.; Birdsall, R. E.; Wirth, M. J., Silica colloidal crystals as emerging materials
for high-throughput protein electrophoresis. AAPS J 2013, 15 (4), 962-9.
38. Ragland, T. S.; Gossage, M. D.; Furtaw, M. D.; Anderson, J. P.; Steffens, D. L.; Wirth,
M. J., Electrophoresis of megaDalton proteins inside colloidal silica. Electrophoresis
2019, 40 (5), 817-823.

100
39. Mozhaev, V. V.; Heremans, K.; Frank, J.; Masson, P.; Balny, C., High Pressure Effects
on Protein Structure and Function. PROTEINS: Structure, Function, and Genetics 1996,
24, 81-91.
40. Engen, J. R., Analysis of protein conformation and dynamics by hydrogen/deuterium
exchange MS. Anal Chem 2009, 81 (19), 7870-5.
41. Birdsall, R. E.; Koshel, B. M.; Hua, Y.; Ratnayaka, S. N.; Wirth, M. J., Modeling of
protein electrophoresis in silica colloidal crystals having brush layers of polyacrylamide.
Electrophoresis 2013, 34 (5), 753-60.

101
Figure 4-1 A depicted mechanism of hydrodynamic chromatography (HDC) separation. Arrows
indicate the direction of streamline flow. Longer arrows have higher velocity and shorter arrows
have relatively low velocity. A protein mixer flows laminarly with a parabolic flow profile. The
sample mixer contains a larger protein (orange), a smaller protein (green), and buffer solvent to
store protein (red). The larger protein stays the center of the flow, experiencing a faster velocity,
whereas the smaller protein experiences slower velocity. Buffer, in general, is composed of small
molecule, and thus flows near the walls.

102
Figure 4-2 Grey sphere represents packing particles and black color lines are walls. Under laminar
flow (blue parabolic flow profile), each interstitial space from a well-packed stationary phase can
be considered as an open channel where HDC is performed.

103
Figure 4-3 HDC separation using 500 nm base silica particles packed in a 2.1 × 50 mm stainless
steel column. Blue chromatogram is lysozyme, red represents Eli Lilly intact IgG4, and black is
water injection. Separation condition was 100% H2O isocratically with 0.1% FA and a) 1% SDS
b) 0.1% SDS. C) 2% SDS. Flow rate was varied at 30 °C. Detection wavelength was 280 nm for
proteins and 230 nm for water injection in order to see a up-side down peak. The UV absorbances
are normalized by peak height to obtain a fair resolution comparison.
a)
b) c)

104
Figure 4-4 1500 nm C4 column (2.1 × 50 mm stainless steel column) was used for HDC separation
under MS-compatible conditions. Lysozyme (blue), IgG4 (red), and water injection (black) were
examined. Separation condition was 50:50 H2O/ACN (v/v) isocratically with 0.5% FA at 30 °C.
Flow rate was varied from 20 µL/min to 60 µL/min. Detection wavelength was 280 nm for proteins
and 230 nm for water injection in order to see a up-side down peak. The UV absorbances are
normalized by peak height to obtain a fair resolution comparison.

105
Figure 4-5 Different C4 particle sizes were packed in 2.1 × 50 mm stainless steel columns. In
addition, 1500 nm C4 particles were pack in stainless steel columns with length and inner diameter.
Elution method and order are same as Figure 4-4. The UV absorbances are normalized by peak
height to obtain a fair resolution comparison.

106
Figure 4-6 750 nm C4 column (2.1 × 100 mm stainless steel column) was used for HDC separation.
Samples were the same as Figure 4-5. Separation condition was isocratic 50:50 H2O/ACN (v/v)
with 0.1% TFA at 30 °C. Otherwise noted.
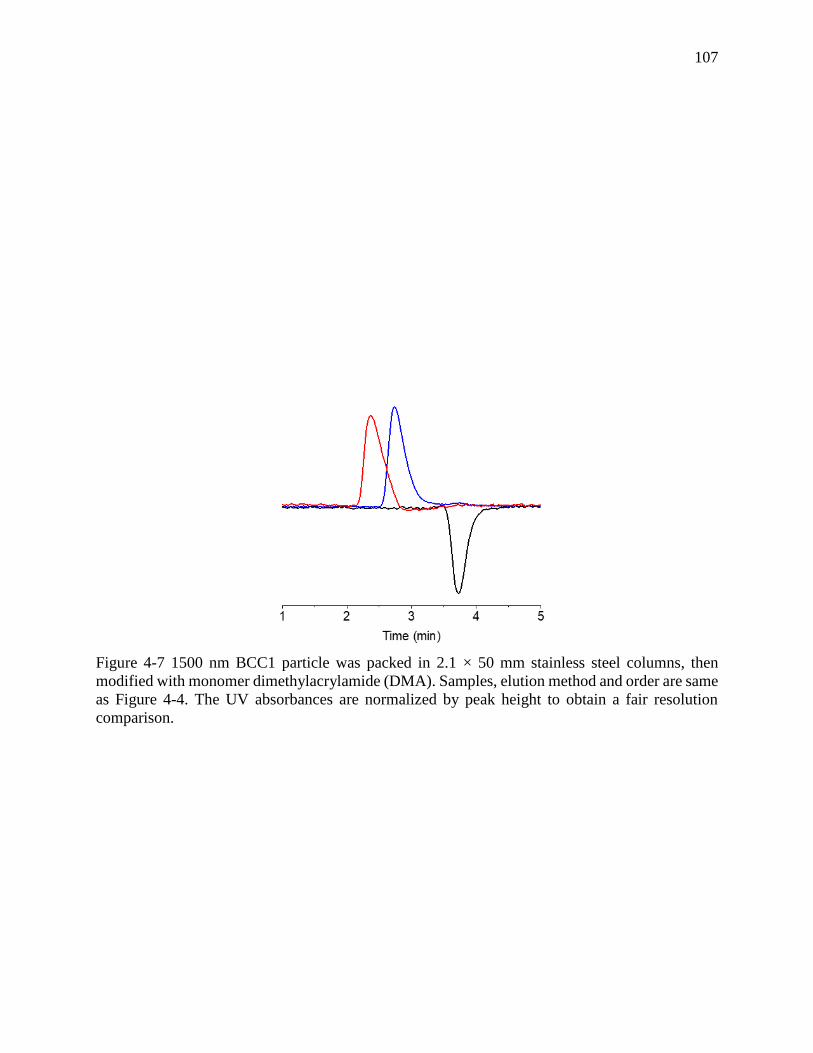
107
Figure 4-7 1500 nm BCC1 particle was packed in 2.1 × 50 mm stainless steel columns, then
modified with monomer dimethylacrylamide (DMA). Samples, elution method and order are same
as Figure 4-4. The UV absorbances are normalized by peak height to obtain a fair resolution
comparison.

108
CONCLUSIONS AND FUTURE DIRECTIONS
5.1 Conclusions
The most pivatol moment began with why liquid chromatograpy (LC) and mass
spectrometry (MS) stand on exclusive sides. Better chromatographic resolution is, worse mass
spectrometry sensitivity is. However, combining LC and MS becomes a marvelous analytical
technique. Therefore, we started improving chromatographic peak tailing and noticed that “active
silanols” plays a critical role on influencing LC separation. The interesting part is no actually
reasonable evidence to explain whether molecule-silanol interaction is good or bad until we saw
molecules got stuck, then desorbed and started eluting again monitored by fluorescence
microscopy. Afterwards, we decided to take a lot of time to study how to polish silica surface
including calcining, annealing, and rehydroxylating. Chromatogram confirmed that peak tailing
was remarkably reduced. Nevertheless, No matter how good the polishing process is, silanols
never go away. When analytes are shifted gear from small molecules to proteins even large proteins,
LC resolution becomes worse again due to strong electrostatic interactions from dissociated
silanols with amino groups on proteins. As a result, this dissertation discussed the development of
polymer-shell bonded phases, where a thick polymer brush layer is built on silica surface. Two
major reasons are adopted on this design: 1) High-dense polymer brush layer keeps proteins away
from silica surface to reduce protein exposure on silica surface as well as protein-silanol
interactions. 2) Electric field generated by negatively charged silanols will interfere elution.
Precisely, it increases protein retention time on the stationary phase. Therefore, thicker polymer
layer prevents proteins from sensing surface charges.
Our group has developed polymer-shell bonded phases for hydrophobic interaction
chromatography (HIC-MS) of prorteins and antibody-drug conjugates (ADCs), hydrophilic
interaction liquid chromatography (HILIC-MS) of glycoproteins, reversed-phase liquid
chromatography (RPLC-MS) of proteins and monoclonal antibodies (mAbs) including
immunoglobulin G (subclasses: IgG1, IgG2, and IgG4), and cation exchange chromatography
(CEX-MS) & anion exchange chromatography (AEX-MS) of proteins, mAbs, and ADCs. All
listed LC separation methods are undergoing and avoiding trade-off between LC resolution and

109
MS sensitivity. The polymer stationary phases perform extraordinarily using LC-MS analysis and
will be investigated more in the future for protein separations.
5.2 Future directions
In Chapter 2, we saw monoclonoal antibodies without drug (D0) is barely retained, which
proves that our polymethylmethacrylate bonded phase has negligible interaction with mAb, as our
expectation that designing retention only for attached drug and column surface. However, this
result could be pro and con. The pro is non-covalent bound mAbs from ADCs will not suffer from
adsorption-desorption processes, which avoid dissociating and denaturing. The con is D0 overlaps
with excipient, which affect MS quantification and calculation on average drug-to-antibody ratio.
We can design a copolymer bonded phase to increase retention time slightly or conjugate affinity
property to stationary phase to increase only interaction between mAb and chromatographic
surface to retain D0.
In Chapter 3, the RPLC application shows mainly on IgG1 separation. Actually, IgG2 has
more complicated disulfide bond scrambling. It is worthy to design polymer shell bonded phase to
distinguish IgG2 disulfides. In this regard, benzylmethacrylate monomer has been utilized for
IgG2 disulfide separation. However, it is about a new start on this monomer, a matter of time is
needed to optimize polymerization. If we could have IgG2 sample from industries, that will be
wonderful to understand what they concern about.
In Chapter 4, HDC is not a freshly new LC method, but due to its impractical applications
and limitations, people pay less attention on it. In this chapter, we just started exploring HDC and
proved HDC theory. Apparently, peak capacity and resolution are big concerns so far. The more
investigation on surface development is required. Another direction is our packed capillary
separated bovine serum albumin (BSA) using isocratic 25/75 ACN/water (v/v) with 0.1% TFA to
generate an unbelievable physical peak sigma only 20 µm (physical peak width, 80 µm). Hence,
if we pack a 5 cm capillary, based on 80 µm peak width, there will be tremendous peak capacity
and excellet resolution.

110
VITA
In 2008, Tse-Hong (Aaron) Chen was graduated in National Chuung Hsing with bachelor
degree major in Chemistry. In 2012, Aaron started Master’s career under Prof. Rui Zhang’s lab in
Department of Chemistry at Western Kentucky University. During this time, Aaron was inspired
by his advisor/mentor to further pursue a PhD degree.
In 2015, Aaron joined the PhD program under Prof. Mary Wirth’s research group in
Department of Chemistry at Purdue University and major in Analytical Chemistry. In Dr. Wirth’s
lab, Tse-Hong developed several polymer-shell bonded phases to improve online LC coupled with
MS and achieve high LC resolution and MS sensitivity. Furthermore, Aaron devoted his research
objectives to HPLC/UHPLC-MS method development to pharmaceutical proteins, monoclonal
antibodies, and antibody-drug conjugates. After graduation in 2019, Tse-Hong decided to work as
a scientist in Formulation Development Group at Regeneron and continue to pursue the science in
the field of chromatography and mass spectrometry.

111
PUBLICATIONS

112

113
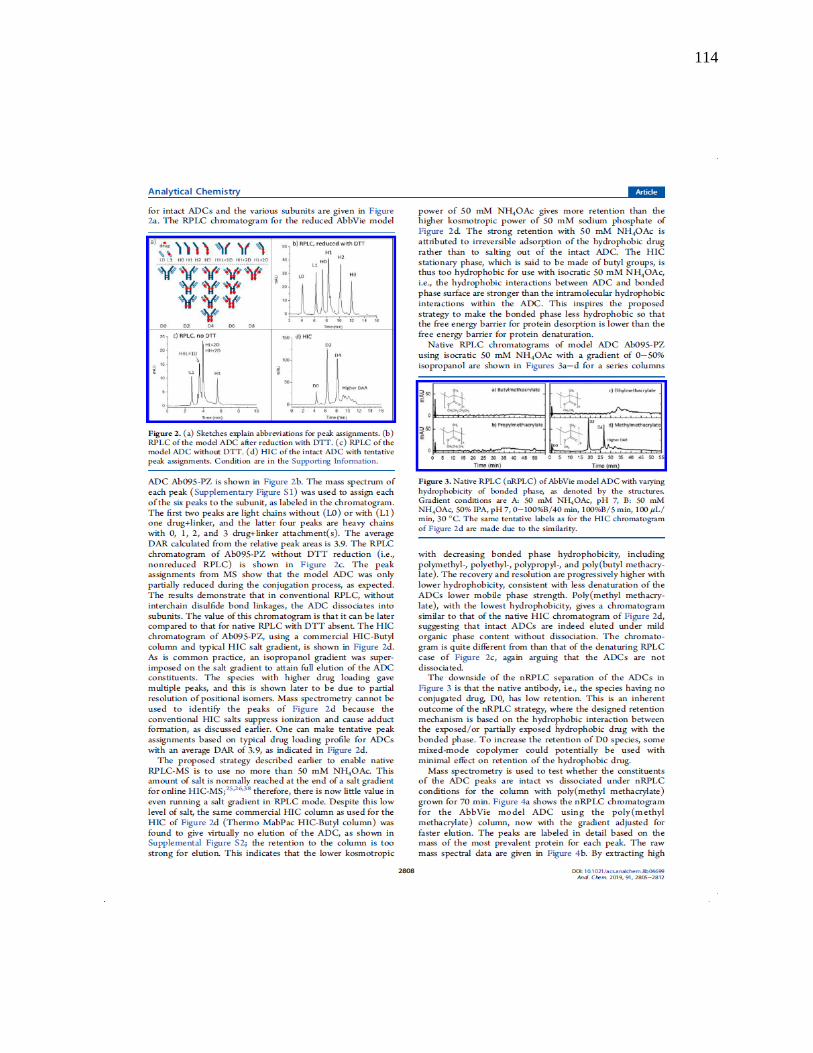
114

115
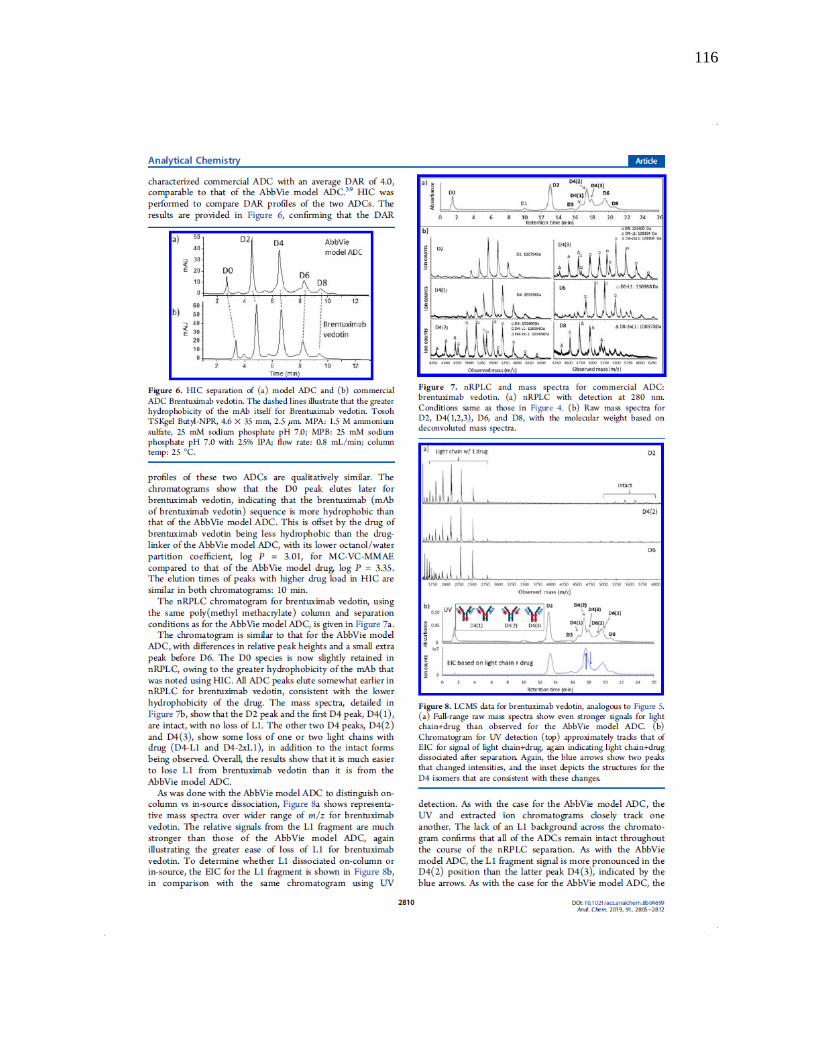
116

117

118


![Electrically tunable wettability of liquid crystal/polymer ...lcd.creol.ucf.edu/publications/2008/opt express lin.pdf · To fabricate the LC/polymer composite film [14-16], we mixed](https://img.dokumen.tips/doc/110x75/5f66a73011019810f0545716/electrically-tunable-wettability-of-liquid-crystalpolymer-lcdcreolucfedupublications2008opt.jpg)