Embed Size (px)
Citation preview

PO
LYM
ER
GR
OU
P,IN
C.
20
07
AN
NU
AL
RE
PO
RT
+GLOBAL
+OPERATIONALEXCELLENCE
+INNOVATION
+CUSTOMERSATISFACTION
PGI
2007 ANNUAL REPORT
PGICUSTOMER
PARTNERSHIP
2007 ANNUAL REPORT
MMEDICAL
WWIPES
HHYGIENE
ININDUSTRIAL
Corporate Contact InformationDennis NormanVice President, Strategic Planning& CommunicationPolymer Group, Inc.9335 Harris Corners ParkwaySuite 300Charlotte, NC 28269704.697.5186
www.polymergroupinc.com

PGI
CUSTOMER
PARTNERSHIP
+GLOBAL
+OPERATIONALEXCELLENCE
+INNOVATION
+CUSTOMERSATISFACTION
Management
Veronica HagenChief ExecutiveOfficer
Willis Moore, IIIChief FinancialOfficer
Mike HaleChief OperatingOfficer
Greg CrawfordVice President &General Manager,North America
Rolando DominguezVice President &General Manager,Latin America
William SpencerVice President &General Manager,Canada
Wuling ZhangVice President &General Manager,Asia
Bob DaleVice President,Research &Development
John HeironimusVice President,Chief MarketingOfficer
Dennis NormanVice President,Strategic Planning& Communication
Daniel RikardVice President,General Counseland Secretary
Mary TomaselloVice President,Global HumanResources
Board of Directors
William HewittChairman,Polymer Group, Inc.
Pedro AriasEPSA Engineering
Ramon BetolazaMatlinPattersonGlobal Advisers, LLC
Lap Wai ChanMatlinPattersonGlobal Advisers, LLC
Veronica HagenChief Executive Officer,Polymer Group, Inc.
Eugene LindenBennett Management
Wade NesmithLang Michener, LLP
James OvendenOTO Development, LLC
Charles VolpeRetired – KEMETCorporation
Shareholder InformationAs of March 5, 2008, therewere 19,412,118 common sharesoutstanding. Polymer Group,Inc.'s Class A and Class Bcommon stock are publiclytraded on the OTC BulletinBoard under the ticker symbolsPOLGA and POLGB, respectively.
Transfer AgentAmerican Stock Transfer& Trust Company59 Maiden Lane,Brooklyn, NY 11219800.937.5449

2
HHYGIENE
MMEDICAL
WWIPES
ININDUSTRIAL
A Winning Equation
At PGI, the highly engineered
materials and technology we
develop, manufacture and market
around the globe are only part of
the equation. Added to that is our:
+ global organization
+ operational excellence
+ innovation
+ customer satisfaction
Our partnerships with key customers
in the Hygiene, Medical,Wipes
and Industrial segments alsomake us stronger.
It all comes together to equal a
market-driven, customer-focused,
growing company well positioned
in the industry and ready to advance
to its next level.

PGI
3
Veronica HagenChief ExecutiveOfficer
Willis Moore, IIIChief FinancialOfficer
Mike HaleChief OperatingOfficer
Bob DaleVice President,Research &Development
John HeironimusVice President,Chief MarketingOfficer
Dennis NormanVice President,Strategic Planning& Communication
Daniel RikardVice President,General Counseland Secretary
Mary TomaselloVice President,Global HumanResources
GROWTH
From left to right: Veronica "Ronee" Hagen, Willis "Billy" Moore, Bob Dale, Mary Tomasello,Mike Hale, Daniel Rikard and Dennis Norman. Not pictured: John Heironimus.
Leadership Team

HHYGIENE
In my first annual message, I want
to highlight the inherent strengths
of PGI that attracted me to the
business. These include the company’s
legacy of innovation, operational
excellence, diverse technology base,
global footprint, and our relationships
with customers.
By building on our strengths, PGI will
achieve our goals of global leadership
in the hygiene and medical markets
and market-leading positions in the
industrial and wipes markets, where
we can deliver the most added value
and innovation.
For the third consecutive year, we
recorded our highest sales level in
the company’s history, with $1.06
billion in net sales. Going forward,
we are well positioned to reach higher
levels of growth and profitability.
As we mature, PGI is focused on
evolving from various operating
divisions focused on manufacturing
excellence and product diversity,
to being a true market-driven,
customer-responsive organization
committed to delivering outstanding
customer satisfaction.
This year’s annual report focuses on our
global markets, innovation, operational
excellence and commitment to customer
satisfaction. At the same time, we will
continue to listen to the market, focus
on selected segments, and align with
customers who are market leaders.
2007 Review
The estimated $20-plus billion
nonwovens industry continues to
grow and PGI’s story is also one of
growth. In 2007, we made significant
progress toward accomplishing our
strategic goals and positioning the
company for 2008 and beyond.
PGI continued the trend of top-line
growth and improved our manufac-
turing margin during the year. Our
gross profit increased more than 8
percent and the gross profit margin
increased by 65 basis points, despite
significant increases in raw material
costs. Additionally, we successfully
controlled costs during the year with
a $2.3 million reduction of selling,
general and administrative (SG&A)
expenses in 2007.
PGI’s performance in 2007 was
driven by the successful execution
of a number of strategic initiatives,
including:
• Ramping up manufacturing ofhigh-grade medical materials in
Suzhou, China in our new world-class
manufacturing facility
• Installing a new spunbond line inBuenos Aires, Argentina
• Introducing and commercializinga new category of nonwovens
fabrics made with our proprietary
technology, Spinlace™, in Benson,
North Carolina
• Introducing new product lines:MediSoft® Ultra™ advanced high-
performance fabric for medical
garments and other single-use
apparel; flame retardant (FR) fabrics
for mattresses; and moldable sub-
strates for the automotive industry
MMEDICAL
WWIPES
ININDUSTRIAL
4
To fellow shareholders, customers and employees:

PGIGROWTH
• Closing two plants in the U.S. andone in Germany, and transferring
certain business and equipment
to other sites.
The 2007 results were negatively
impacted by the over-arching
headwind of raw material cost
increases. This impacted PGI and
the industry as a whole, particularly
in the second half of the year.
Our oriented polymers division
also struggled with the exogenous
factors of the housing and lumber
segments in North America. Despite
these factors, we have plans firmly
in place to continue our positive
financial momentum going forward
and expect to benefit from the
initiatives we successfully put
into place in 2007.
Additionally, in 2007 we optimized
our organizational structure and
added new talent. We have strong
regional business units and are
supporting these businesses by
leveraging global functions in
operations, marketing, finance,
R&D, strategic sourcing and human
2. Global Strengths
PGI’s global footprint, with manufac-
turing in North America, Europe,
Latin America and Asia, puts us in
a unique position to leverage our
innovation capabilities around the
world with significant scale. It also
assures our global customers that they
can rely on PGI in their supply chain.
One of this company’s greatest
strengths is our ability to establish
ourselves early in emerging markets,
understand the local needs and
capitalize on this position.
We will continue to invest in strategic
markets, following our formula of
successful, predictable capacity
expansions supported by customer
demand. The investments we have
made will continue to drive our
growth in 2008 and we continue
to invest for the future with the
construction of a new spunmelt line
at our San Luis Potosi, Mexico plant.
This line is targeted to serve growing
hygiene markets in North America
with commercial production to
begin in 2009.
resources. We will build on our
core competencies, strengthen
the PGI brand and drive growth
by emphasizing:
1. InnovationInnovation has long been a component
of PGI’s strategic platform and part
of our core values. This innovation
platform focuses not only on new
products but also on the way we
operate and serve our customers,
as well as process innovation.
Our Spinlace™ technology exemplifies
PGI’s innovation capabilities. Not
only has this technology delivered
a game-changing product to the
market, it also has the benefit of
improving performance and extend-
ing the life of our assets.
Going forward, you’ll see PGI working
toward more open innovation and
collaborating even more closely
with end users, universities and
others in the market, while directing
increased efforts to platform
research and breakthrough
product inventions.
5

HHYGIENE
MMEDICAL
WWIPES
ININDUSTRIAL
2004 2005 2006 2007
2004 2005 2006 2007
GROSS PROFIT
2004 2005 2006 2007
CAPITAL INVESTMENT
2004 2005 2006 2007
$1,200
1,000
800
600
400
200
0
(($$MMMM’’ss))
$200
150
100
50
0
(($$MMMM’’ss))
$80
60
40
20
0
SALES
$14
12
10
8
6
4
2
0
R&D SPENDING
(($$MMMM’’ss))
(($$MMMM’’ss))
3. Customer Satisfaction
Our customers have always been
at the heart of what we do. As we
move toward being a more market-
facing organization, it is our goal
to become a leader in service and
value-added solutions. We are
committed to understanding,
tracking and delivering superior
customer satisfaction and developing
unique customer-centric processes
that will help our customers win.
PGI is working to offer the best value
proposition for target customers
and markets; provide world-class
innovation to meet customer needs;
continue to grow our proprietary
product offerings; and become the
preferred development partner,
upstream and downstream.
4. Operational Excellence
PGI’s operations are world class.
For customers and employees, this
means you’ll find consistent quality
standards and processes replicated
throughout our organization.
Our strategic goals include continu-
ously improving our operating costs
and creating an organizational and
cost structure that best positions
PGI in the markets we serve. We will
focus on making strategic sourcing
a competitive advantage and
leveraging our global scale.
Our Team
I am proud to be a part of this organi-
zation. There is great pride among
our 3,200 dedicated employees in
the value we deliver to our customers
and the innovation we bring to market
in products people use every day.
In closing, I would like to thank
our employees, customers and
shareholders who have welcomed
me to this company and industry,
embraced the positive changes,
and share my confidence for the
future. By building on our strengths
today, PGI will grow even stronger
tomorrow.
Veronica “Ronee” M. Hagen
Chief Executive Officer
6

7
PGI global operations
PGI Locations:
United States:Benson, North CarolinaCharlotte, North CarolinaClackamas, OregonClearfield, UtahGuntown, MississippiKingman, KansasLandisville, New JerseyMooresville, North CarolinaNorth Little Rock, ArkansasWaynesboro, Virginia
Europe:Bailleul, FranceCuijk, The Netherlands
Latin America:Buenos Aires, ArgentinaCali, ColombiaSan Luis Potosi, Mexico
Canada:Magog, QuebecNorth Bay, Ontario
Asia:Nanhai, ChinaSuzhou, China
PGI At A Glance
PGI is a leading global, technology-driven developer,manufacturer and marketer of non-wovens and otherhigh-performanceengineered materials.
Headquarters:Charlotte, North Carolina
Employees worldwide:More than 3,200
Sales: Over $1 billion
Sales by GeographicRegion:
43 percent United States19 percent Europe20 percent Latin America10 percent Canada8 percent Asia
UScanadaeuropeAsiaLatin Amer
PGIGLOBAL

HHYGIENE
MMEDICAL
WWIPES
ININDUSTRIAL
8

9
Market Growth + New Investments = Leadership in Hygiene
PGI is committed to being the global
leader in the hygiene market. As
developing regions of the world use
more diapers, adult incontinence
and feminine hygiene products,
PGI is growing along with its global
customers and strengthening its
leadership positions with new
capacity, products and technology.
PGI’s worldwide operations provide
consistency and reliability to global
customers. PGI also offers the
broadest range of product and tech-
nology capabilities to meet customers’
requirements. The company is working
with leading consumer goods manu-
facturers to provide next-generation
products with the latest features
consumers want, from diapers that
stay drier and fit better to ones with
colorful images. We are focused on
meeting these consumer demands
by focusing on delivering material
properties such as elasticity, barrier
properties, strength and opacity. In
certain markets, our product offering
includes printed materials for differ-
entiation and branding purposes.
The hygiene market is forecasted
to grow in excess of 5 percent on
a global basis, driven primarily by
growth in the developing regions
as diaper penetration rates continue
to increase concurrent with growth
in per capita income. Mature markets
are expected to continue to grow
at low single-digit rates, supported
by growth in the adult incontinence
sector as populations age.
PGI is the leader in the hygiene
market in Latin America and ideally
situated to take advantage of growth
in the region with its new capacity
installations. Additionally, the
company is the number two supplier
in China, where its advanced
chemical bonding line has allowed
PGI to expand its sublayer products
for hygiene products. The company
is well positioned to achieve growth
in the adult incontinence sector in
North America and Latin America,
where aging demographics and
a low penetration rate present a
market opportunity.
In 2007, PGI installed a state-of-
the-art spunbond line in Buenos
Aires, Argentina that is producing
high-quality fine denier top sheet
and other materials used in baby
diapers, and is meeting customers’
desires for even more value-added
products, such as cloth-like back
sheet for diapers.
Other investments PGI is making
to strengthen its position as the
leading hygiene supplier in Latin
America and North America, include:
• Beginning the installation of a newmulti-beam spunmelt line in 2008 at
its San Luis Potosi, Mexico plant, to
manufacture high-quality, lightweight,
strong fabrics used in back sheet, leg
cuffs and other diaper components
for customers in North America
• Expanding capabilities at theMexico plant to produce laminated
cloth-like back sheet for diapers, as
well as manufacturing its proprietary
Reticulon® apertured film products
used in feminine sanitary napkins.
PGIHYGIENE

MMEDICAL
WWIPES
ININDUSTRIAL
HHYGIENE
HHYGIENE
Product Applications
>Baby Diapers>Training Pants>Adult Incontinence Products>Feminine Napkins>Panty Liners>Tampons
10
Market Growth + New Investments = Leadership in Hygiene

Global Customers + Local Presence = Medical Market Leadership
When it comes to global leadership
in supplying the medical market with
high-performance barrier materials,
PGI is in an excellent position – both
strategically and geographically.
With its global business unit dedicated
to this growth segment, PGI matches
innovative products and a rich legacy
in the medical market with established
worldwide customer relationships.
PGI has a unique strategic position
to optimally serve the complex
medical products supply chain. Up to
60 percent of medical garments are
produced in Asia then shipped
to customers in North America and
Europe. PGI’s newest medical fabrics
plant in Suzhou, China, puts PGI next
to medical garment converting facilities
that require quality treated fabrics
for surgical gowns and drapes.
Manufacturing from this world-class,
ISO-certified location and being the
country’s only vertically integrated
company with finishing capabilities,
enables PGI to reduce turnaround
times and deliver greater value
solutions for its global customers.
Successfully ramped up in 2007, PGI’s
China operations are driving strong
growth in this segment, which had
record sales for the year, and comple-
ments PGI’s large market presences
in North America and Europe.
In Latin America, the company
expects to see growth as emerging
markets develop new disposable
medical products and key customers
reestablish supply chains in the
different countries in the region.
Innovative products are fueling
growth in the established markets
of North America and Europe, as
well as emerging regions.
Among the highlights are:
• MediSoft® Ultra™, an advancedhigh-performance fabric for medical
garments and other single-use
apparel, which PGI developed by
making proprietary advances in its
spunmelt process to achieve higher
barrier protection, greater comfort
and enhanced softness that the
market seeks
• New flame retardant (FR) fabricsfor protective coveralls designed
to meet new requirements in the
petrochemical industry for greater
employee safety. These nonwovens
fabrics, with a FR finishing treatment,
also can be used in pharmaceutical
laboratories and other new markets
• Growth in the central supply room (CSR) wrap segment, where
PGI’s nonwovens treated with special
properties are used to keep surgical
instruments sterile.
PGI expects to continue this
growth in 2008 and beyond with
more product innovations, exploring
healthcare market opportunities
and expanding its other capabilities
into the medical segment.
PGIMEDICAL
11

HHYGIENE
WWIPES
ININDUSTRIAL
MMEDICAL
MMEDICAL
Product Applications
>Surgical Gowns>Surgical Drapes>Wound Care>Face Masks>Head & Shoe Covers>Table & Tray Covers
Global Customers + Local Presence = Medical Market Leadership
12

New Spinlace™ Technology + New Consumer Markets = Bright Future in Wipes
A long-time leader and innovator in
supplying engineered materials for
the global wipes market, PGI sharply
focused its efforts in this growing
$2.5 billion market in 2007, investing
in areas where it can deliver the
most added value, innovation and
higher performance. PGI is targeting
market leadership in focused spaces
within the rolled and packaged
goods markets and more broadly
with the commercialization of its
unique Spinlace™ technology.
The company’s new Spinlace™
technology answers a critical market
need by bridging the gap between
performance and price in wipes.
Using a more efficient process that
eliminates manufacturing steps,
PGI is combining continuous
filament, pulp and its proprietary
Apex™ imaging technology to achieve
the performance attributes customers
want at cost-competitive prices.
This combination technology, which
incorporates spunmelt and airlaid
technology with three-dimensional
imaging, enables PGI to custom
design attributes from softness to
strength and liquid dispersability
right into its material at lower
weights to meet customers’ requests.
PGI’s broad expertise across multiple
technology platforms enables such
innovations to lead the market. This
unique strength provides opportuni-
ties for further process and product
development combining extrusion
processes with various raw materials
and bonding methodologies.
Making its debut in a leading
consumer brand of household
cleaning wipes in 2007, Spinlace®
fabric has demonstrated improved
cleaning in customer testing. In this
new wipe, the imaged design delivers
added strength, absorbency and
other performance characteristics.
From household cleaning to high-
volume commercial industrial wipes,
PGI sees a wide range of applications
for its Spinlace® materials. Additional
applications range from alcohol-prep
pads and disinfecting wipes used in
healthcare, to surface-prep wipes
used in the automotive industry.
Beyond Spinlace™ technology,
PGI continues to be the leader
in engineering wipes to work with
common sanitizers and disinfectants
for greater food safety. Within this
market sector, the company markets
its branded Chicopee food service
lineup, including Chix® Pro-Quat™,
Chix® Pro-Clor™ and Chix® with
Microban® antimicrobial protection
products. To support growth in
this segment, in 2008 the company
is investing in enhancements to
its manufacturing facility in North
Little Rock, Arkansas.
Other growing markets where PGI
is a leader in the U.S. and Europe
include clean rooms, automotive
surface-prep wipes and high-end
facial beauty pads, where its ability
to incorporate moisturizers and
cleaners in its spunlace materials
is driving growth.
PGIWIPES
13

MMEDICAL
HHYGIENE
ININDUSTRIAL
WWIPES
WWIPES
Product Applications
>Spinlace®>Chix®>Quick® Plus>Disinfecting Wipes>Cosmetic Wipes>Consumer Use>Industrial Use
New Spinlace™ Technology + New Consumer Markets = Bright Future in Wipes
14

Aligning with mega-market trends
and partnering with customers who
are leaders in their industries has led
to high-value innovative solutions
from PGI that are meeting needs in
a diverse array of end-use markets
within the industrial sector. PGI is
focused on establishing leading
positions in markets where the
company can build sufficient scale
on a global and regional basis.
Partnering closely with customers
who are market leaders, PGI develops
much more than just products, but
high-value solutions that help them
differentiate themselves. PGI draws
on its proprietary technologies, such
as its Apex™ imaging technology,
and broad process expertise to
develop highly engineered products
for industrial and specialty markets,
ranging from home construction,
furniture and bedding to automotive,
agriculture, landscaping, filtration
and cable wrap.
Among new products that PGI
commercialized in 2007 are:
• Acoustic Automotives – Meetingthe demand for improved acoustic
performance and lighter weight
vehicles that consume less fuel, PGI
commercialized new substrates for
moldable automotive components
made from recyclable materials used in
trunk and wheel-well liners, and trays.
Made from recyclable polypropylene
and polyethylene terephthalate (PET),
these substrates provide a barrier to
absorb sound and reduce noise in
the interior compartment of a vehicle
by up to 30 percent. Manufactured
using a unique one-step process,
PGI is delivering a more cost-effective
product that is also lighter and
more environmentally friendly than
traditional plastics in cars.
• Safer Sleeping – Helping mattressmanufacturers meet federal bed safety
standards, PGI has expanded its
flame retardant (FR) fabric offerings
that deliver a superior solution. These
stronger and heavier FR fabrics
feature enhanced tear and abrasion
resistance and three-dimensional
images can be imparted directly into
the fabric for improved performance.
PGI Innovation + Partnerships with Leaders = Industrial Market Success
PGI has partnered with a leading
distributor in the furniture and
bedding market to distribute the
FR fabric used as a facing material
on the bottom of no-flip mattresses.
Additionally, PGI has plans to expand
the use of its spunbond material
to coil wraps inside the mattress
in 2008.
• Filtration is an area where PGI hasdeveloped new products to meet
increased performance requirements.
Its bicomponent air filtration product
delivers higher efficiencies for industrial
and commercial heating, ventilation
and air conditioning (HVAC) applica-
tions under new Minimum Efficiency
Reporting Value (MERV) 8 standards.
Other industrial growth segments
include housewrap, where PGI provides
a strong, high-barrier material with
controlled breathability to a leading
manufacturer; and agriculture, where
its high-quality fabrics made in Latin
America are used in crop covers and
agricultural barriers to protect crops
against frost and insects, while helping
reduce the use of pesticides.
PGIINDUSTRIAL
15

MMEDICAL
HHYGIENE
WWIPES
ININDUSTRIAL
ININDUSTRIAL
Product Applications
>Housewrap>Landscape Fabric>Filtration>Automotive Acoustics>Crop Protection>Furniture and Bedding Materials>Water Blocking >Cable Wrap
16

HHYGIENE
MMEDICAL
WWIPES
ININDUSTRIAL
17

UNITED STATESSECURITIES AND EXCHANGE COMMISSION
Washington, D.C. 20549
FORM 10-K� ANNUAL REPORT PURSUANT TO SECTION 13 OR 15(d)
OF THE SECURITIES EXCHANGE ACT OF 1934For the fiscal year ended December 29, 2007, or
� TRANSITION REPORT PURSUANT TO SECTION 13 OR 15(d) OF THESECURITIES EXCHANGE ACT OF 1934
For the transition period from to
Commission file number 1-14330
POLYMER GROUP, INC.(Exact name of registrant as specified in its charter)
Delaware 57-1003983(State or other jurisdiction of (IRS Employer Identification No.)incorporation or organization)
9335 Harris Corners Parkway, Suite 300 28269Charlotte, North Carolina (Zip Code)
(Address of principal executive offices)
Registrant’s telephone number, including area code: (704) 697-5100Securities registered pursuant to Section 12(b) of the Act: None
Securities registered pursuant to Section 12(b) of the Act:
Title of Class
Class A common stockClass B common stock
Indicate by check mark if the registrant is a well-known seasoned issuer, as defined in Rule 405 of the SecuritiesAct. Yes � No �
Indicate by check mark if the registrant is not required to file reports pursuant to Section 13 or Section 15(d) of theAct. Yes � No �
Indicate by check mark whether the registrant: (1) has filed all reports required to be filed by Section 13 or 15(d) of theSecurities Exchange Act of 1934 during the preceding 12 months (or for such shorter period that the registrant wasrequired to file such reports) and (2) has been subject to such filing requirements for the past 90 days. Yes � No �
Indicate by check mark if disclosure of delinquent filers pursuant to Item 405 of Regulation S-K is not containedherein, and will not be contained, to the best of registrant’s knowledge, in definitive proxy or information statementsincorporated by reference in Part III of this Form 10-K or any amendment to this Form 10-K. �
Indicate by check mark whether the registrant is a large accelerated filer, an accelerated filer, a non-accelerated filer,or a smaller reporting company. See definitions of ‘‘large accelerated filer,’’ ‘‘accelerated filer,’’ and ‘‘smaller reportingcompany’’ in Rule 12b-2 of the Exchange Act. (Check one):
Large accelerated filer � Accelerated filer � Non-accelerated filer � Smaller reporting company �(Do not check if a smaller
reporting company)
Indicate by check mark whether the registrant is a shell company (as defined in Rule 12b-2 of the ExchangeAct). Yes � No �
The aggregate market value of the Company’s voting stock held by non-affiliates as of June 30, 2007 wasapproximately $163.3 million, based on the average of the closing bid and ask price of the Class A common stock on theOver-the-Counter Bulletin Board. Solely for the purposes of the foregoing calculation, affiliates are considered to beDirectors, Executive Officers and greater than 10% beneficial owners of the Registrant’s common equity. As of March 5,2008, there were 19,280,894 shares of Class A common stock, 106,905 shares of Class B common stock and 24,319shares of Class C common stock outstanding. No shares of Class D or Class E common stock were outstanding as ofsuch date. The par value for each class of common stock is $.01 per share.
Documents Incorporated By Reference
Portions of the Registrant’s Notice of 2008 Annual Meeting of Stockholders and Proxy Statement—Part III

POLYMER GROUP, INC.
FORM 10-K
For the Fiscal Year Ended December 29, 2007
INDEX
IMPORTANT INFORMATION REGARDING THIS FORM 10-K . . . . . . . . . . . . . . . . . . . . . . . . . 3
PART IItem 1. Business . . . . . . . . . . . . . . . . . . . . . . . . . . . . . . . . . . . . . . . . . . . . . . . . . . . . . . 5Item 1A. Risk Factors . . . . . . . . . . . . . . . . . . . . . . . . . . . . . . . . . . . . . . . . . . . . . . . . . . . . 16Item 1B. Unresolved Staff Comments . . . . . . . . . . . . . . . . . . . . . . . . . . . . . . . . . . . . . . . . 22Item 2. Properties . . . . . . . . . . . . . . . . . . . . . . . . . . . . . . . . . . . . . . . . . . . . . . . . . . . . . 23Item 3. Legal Proceedings . . . . . . . . . . . . . . . . . . . . . . . . . . . . . . . . . . . . . . . . . . . . . . . 24Item 4. Submission of Matters to a Vote of Security Holders . . . . . . . . . . . . . . . . . . . . . . . 24
PART IIItem 5. Market for Registrant’s Common Equity, Related Stockholder Matters and Issuer
Purchases of Equity Securities . . . . . . . . . . . . . . . . . . . . . . . . . . . . . . . . . . . . . 25Item 6. Selected Financial Data . . . . . . . . . . . . . . . . . . . . . . . . . . . . . . . . . . . . . . . . . . . 27Item 7. Management’s Discussion and Analysis of Financial Condition and Results of
Operations . . . . . . . . . . . . . . . . . . . . . . . . . . . . . . . . . . . . . . . . . . . . . . . . . . . 29Item 7A. Quantitative and Qualitative Disclosures About Market Risk . . . . . . . . . . . . . . . . . . 51Item 8. Financial Statements and Supplementary Data . . . . . . . . . . . . . . . . . . . . . . . . . . . 53Item 9. Changes in and Disagreements With Accountants on Accounting and Financial
Disclosure . . . . . . . . . . . . . . . . . . . . . . . . . . . . . . . . . . . . . . . . . . . . . . . . . . . 101Item 9A. Controls and Procedures . . . . . . . . . . . . . . . . . . . . . . . . . . . . . . . . . . . . . . . . . . 101Item 9B. Other Information . . . . . . . . . . . . . . . . . . . . . . . . . . . . . . . . . . . . . . . . . . . . . . . . 103
PART IIIItem 10. Directors, Executive Officers and Corporate Governance . . . . . . . . . . . . . . . . . . . . 103Item 11. Executive Compensation . . . . . . . . . . . . . . . . . . . . . . . . . . . . . . . . . . . . . . . . . . . 103Item 12. Security Ownership of Certain Beneficial Owners and Management and Related
Stockholder Matters . . . . . . . . . . . . . . . . . . . . . . . . . . . . . . . . . . . . . . . . . . . . 103Item 13. Certain Relationships and Related Transactions, and Director Independence . . . . . 104Item 14. Principal Accountant Fees and Services . . . . . . . . . . . . . . . . . . . . . . . . . . . . . . . . 104
PART IVItem 15. Exhibits and Financial Statement Schedules . . . . . . . . . . . . . . . . . . . . . . . . . . . . . 105
Signatures . . . . . . . . . . . . . . . . . . . . . . . . . . . . . . . . . . . . . . . . . . . . . . . . . . . . . 110
2

IMPORTANT INFORMATION REGARDING THIS FORM 10-K
Readers should consider the following information as they review this Form 10-K:
The terms ‘‘Polymer Group,’’ ‘‘Company,’’ ‘‘we,’’ ‘‘us,’’ and ‘‘our’’ as used in this Form 10-K refer toPolymer Group, Inc. and its subsidiaries.
Safe Harbor-Forward-Looking Statements
From time to time, we may publish forward-looking statements relative to matters such as,including, without limitation, anticipated financial performance, business prospects, technologicaldevelopments, new product introductions, cost savings, research and development activities andsimilar matters. The Private Securities Litigation Reform Act of 1995 provides a safe harbor for forward-looking statements. Forward-looking statements are generally accompanied by words such as‘‘estimate,’’ ‘‘project,’’ ‘‘predict,’’ ‘‘believe,’’ ‘‘expect,’’ ‘‘anticipate,’’ ‘‘intend,’’ ‘‘target’’ or other words thatconvey the uncertainty of future events or outcomes.
Various statements contained in this report, including those that express a belief, expectation orintention, as well as those that are not statements of historical fact are, or may be deemed to be, forward-looking statements within the meaning of Section 27A of the Securities Act of 1933, as amended, andSection 21E of the Securities Exchange Act of 1934, as amended. These forward-looking statementsrelate only to events as of the date on which the statements were made. Unless required by law, we donot undertake any obligation to update these statements and caution against any undue reliance onthem. These forward-looking statements are based on current expectations and assumptions aboutfuture events. While management considers these expectations and assumptions to be reasonable, theyare inherently subject to significant business, economic, competitive, regulatory and other risks,contingencies and uncertainties, most of which are difficult to predict and many of which are beyond ourcontrol. See Item 1A. ‘‘Risk Factors’’ below. There can be no assurance that these events will occur orthat our results will be as estimated.
Important factors that could cause actual results to differ materially from those discussed in suchforward-looking statements include:
• general economic factors including, but not limited to, changes in interest rates, foreign currencytranslation rates, consumer confidence, trends in disposable income, changes in consumerdemand for goods produced, and cyclical or other downturns;
• substantial debt levels and potential inability to maintain sufficient liquidity to finance ouroperations and make necessary capital expenditures;
• inability to meet existing debt covenants;
• information and technological advances;
• changes in environmental laws and regulations;
• achievement of objectives for strategic acquisitions and dispositions;
• cost and availability of raw materials, labor and natural and other resources and the inability topass raw material cost increases along to customers;
• changes to selling prices to customers which are based, by contract, on an underlying index;
• inability to achieve successful or timely start-up on new or modified production lines;
• domestic and foreign competition;
• reliance on major customers and suppliers; and
• risks related to operations in foreign jurisdictions.
3

Fiscal Year-End
Our fiscal year ends on the Saturday nearest to December 31. Fiscal 2007 ended December 29,2007 and included the results of operations for a fifty-two week period. Fiscal 2006 ended December 30,2006 and included the results of operations for a fifty-two week period. Fiscal 2005 ended December 31,2005 and included the results of operations for a fifty-two week period. References herein to ‘‘2007,’’‘‘2006,’’ and ‘‘2005,’’ generally refer to fiscal 2007, fiscal 2006 and fiscal 2005, respectively, unless thecontext indicates otherwise.
Additional Information
Our website is located at www.polymergroupinc.com. Through the website, we make available, freeof charge, our Annual Reports on Form 10-K, Quarterly Reports on Form 10-Q, Current Reports onForm 8-K, proxy statements and other reports filed or furnished pursuant to Section 13(a) or 15(d) underthe Securities Exchange Act. These reports are available as soon as reasonably practicable after theyhave been electronically filed with the Securities and Exchange Commission.
4

PART I
ITEM 1. BUSINESS
Polymer Group, Inc. is a leading global innovator, manufacturer and marketer of engineeredmaterials, focused primarily on the production of nonwovens. Nonwovens are high value-added, highperformance and low-cost alternative materials developed as an outgrowth of paper, textile andchemical technologies, with critical characteristics including absorbency, tensile strength, softness andbarrier properties. Our products, which typically comprise only a small percentage of the final product’stotal cost, are the critical substrates and components for disposable consumer applications such asbaby diapers, feminine hygiene products, household and personal wipes, disposable medicalapplications, such as surgical gowns and drapes, and for various durable industrial applicationsincluding furniture and bedding, filtration and protective apparel.
We have one of the largest global platforms in our industry, with 18 manufacturing and convertingfacilities throughout the world, and a presence in eight countries. We are strategically located near manyof our key customers in order to increase our effectiveness in addressing local and regional demand asmany of our products do not ship economically over long distances. We work closely with ourcustomers, which include well-established multi-national and regional consumer and industrial productmanufacturers, and use innovative technologies to provide engineered solutions to meet increasingconsumer demand for more sophisticated products. We are the #1 or #2 participant in the majority ofthe markets in which we compete and have, we believe, one of the broadest and most advancedtechnology portfolios in the industry.
We have been built through a series of capital expansions and business acquisitions that havebroadened our technology base, increased our product lines and expanded our global presence.Moreover, our worldwide resources have enabled us to better meet the needs of existing customers, toserve emerging geographic markets, and to exploit niche market opportunities through customer-drivenproduct development.
Recent Developments
In 2007, we continued our efforts to strengthen our balance sheet and reaffirm our global leadershipposition in the industry. These items are discussed in more detail throughout this report, with highlightspresented below to assist the reader:
• we strengthened our management team with the addition of Veronica Hagen as Chief ExecutiveOfficer and several other key additions throughout the businesses;
• we continued to expand our global business presence as we reached full sales capacity from ournew state-of-the-art spunbond lines in Cali, Colombia, Suzhou, China and Mooresville, NorthCarolina, retrofitted an existing hydroentanglement line at our Benson North Carolina facility toproduce Spinlace� products which started up early in the fourth quarter of 2007, substantiallycompleted construction of an additional spunmelt line in Argentina which initiated commercialproduction in the first quarter of fiscal 2008 and announced an additional spunmelt expansionproject in Mexico that is expected to begin commercial operations by the middle of fiscal 2009;and
• we continued the restructuring and reorganization of certain of our operations, especially in themore developed markets of the United States, Europe and Canada in an effort to lower operatingcosts and improve overall financial performance.
5

Industry Overview
We compete primarily in the worldwide nonwovens market. According to certain industry sources,this is approximately a $20.0 billion market with an expected 6.0-8.0% compound annual growth rate(CAGR) over the next five years. Demand in developing regions is forecasted to grow in excess of a10.0% CAGR over the same time period, driven primarily by increased penetration of disposableproducts as per capita income rises. Demand in developed regions (North America, Western Europeand Japan) over this period is expected to increase by a 3.0-5.0% CAGR, driven by increasedpenetration, the development of new applications for nonwovens and underlying market growth. Webelieve that future growth will depend upon the continuation of improvements in raw materials andtechnology, which should result in the development of high-performance nonwovens, leading to newuses and markets. We believe our unique global platform and technological leadership, with anincreasing presence in the high-growth developing regions, will allow us to achieve high growth andincreased profitability. However, our growth rate may differ from the industry averages depending uponthe regions and markets we choose to operate in and the technology that we develop.
Business Strategy
Our goal is to be the global leader in the hygiene and medical markets and to participate in theindustrial and wipes markets where we can build scale and a sustainable market leading position. Weplan to grow our core businesses while developing new technologies to capitalize on new productopportunities and expand in key geographic markets. We also strive to be a leading supplier in ourchosen markets by delivering high-quality products and services at competitive prices. We arecommitted to continuous improvements throughout our business to increase product value byincorporating new raw materials and operating capabilities that enhance or maintain performancespecifications. We also seek to expand our capabilities to take advantage of the penetration and growthof our core products internationally, particularly in emerging countries.
Our business strategy is to deliver to our customers the right product, at the right price, at the righttime and in the right location in order to be the leading manufacturer, innovator, and marketer ofengineered materials. To execute our strategy and drive continued success, we are focused on thefollowing:
Delivering innovation. We expect to continue to work with industry leading customers to develop newand innovative products. We intend to leverage our culture of innovation, our global organization and theefficiency of our research and development investments to deliver both innovative products that arecategory game changers as well as next generation products tailored to meet demanding and evolvingspecifications and address consumer preferences.
Grow with customers. We expect to continue to partner with our global customer base of leadingconsumer and industrial players to grow in the regions and markets where they are growing. We intendto continue to collaborate with our customers and strategically align our business focus to best addresscustomer demands. We intend to work closely with our customers to develop next-generation productsand provide innovative solutions to satisfy end user requirements.
Targeted global expansion. We expect to continue our successful strategy of adding capacity in bothdeveloped and developing regions to follow and grow with global, regional and local customers. Weintend to utilize our proven strategy of expanding in markets with attractive supply and demandcharacteristics through a detailed market assessment. Typically, through this assessment we endeavorto pre-sell our capacity before launching a project. Our strategic expansion projects target a return onour investment over a three to five-year period following the start up of the project. Additionally, we willselectively continue to evaluate strategic consolidation opportunities, focusing on companies,technologies and products that complement our business, competitive position and product offerings.
6

Operational excellence. We expect to continue to operate our facilities with manufacturing excellencecharacterized by best-in-class reliability performance, yield, product quality and consistency. We plan tocontinue to organize for success by leveraging our global platform through an interconnected globaland regional functional management structure in areas such as manufacturing, sales, marketing,procurement, finance and human resources. In addition, we will look for opportunities to reduce costsand streamline manufacturing operations and corporate functions.
We develop, manufacture and sell a broad array of products. Our sales are focused in two operatingdivisions: ‘‘Nonwovens’’ and ‘‘Oriented Polymers’’ that provide opportunities to leverage our advancedtechnology and substantial capacity. For financial information by business segment and geographicarea, see Item 7, ‘‘Management’s Discussion and Analysis of Financial Condition and Results ofOperations’’ and Note 16 to the Consolidated Financial Statements included in Item 8 of Part II to thisAnnual Report on Form 10-K.
Nonwovens segment
The Nonwovens segment develops and sells products in various consumer and industrial markets,including hygiene, medical, industrial, and wiping. Nonwovens segment sales were approximately$885.7 million, $848.3 million and $763.7 million of our consolidated net sales for fiscal 2007, 2006 and2005, respectively, and represented approximately 84%, 83% and 80% of our consolidated net sales ineach of those years.
Nonwovens are categorized as either disposable (estimated to be approximately 50% to 55% ofworldwide industry sales) or durable (estimated to be approximately 45% to 50% of worldwide industrysales). We primarily compete in disposable products, which account for approximately 70% of our totalnonwoven sales. We believe that disposable products are non-cyclical and will grow rapidly in the future,driven primarily by the increasing adoption of these materials in developing economies due to rising percapita income and population growth. We sell a diverse array of durable products to a variety of nicheindustrial end markets. Our products are a mix of roll goods and downstream and integrated finishedproducts. We endeavor to add value to our products through our printing, laminating and small rollconverting capabilities and, in some instances, convert product ourselves and sell directly to the endconsumer. With this downstream presence we are a more valuable supplier to our customers with amore efficient distribution chain and knowledge of the ultimate end product consumer.
Hygiene applications. In the hygiene market, our substrates are the critical components providingsuperior absorbency, barrier strength, fit and softness in diapers, training pants, feminine sanitaryprotection and adult incontinence products. Our broad product offerings provide customers with a fullrange of these specialized and highly engineered components, including top sheet, transfer layer,backsheet fabric, leg cuff fabric, sanitary protective facings, absorbent pads for incontinence guard,panty shield, and absorbent core applications. In developing regions, such as certain parts of LatinAmerica and Asia, where penetration rates for nonwoven hygiene products such as disposable diapersare low (less than 50%), growth is expected to be driven by increased disposable product penetrationresulting from growth of per capita income and increasing standards of living. We believe that we arewell-positioned to participate in this growth through our global presence in these markets and as a resultof our recent expansions in Cali, Colombia, Buenos Aires, Argentina and our recently announcedexpansion in San Luis Potosi, Mexico (addressing growth in the U.S. and Mexican markets).
In developed regions, growth is expected to be driven by our customers’ continued demand forenhanced functionality and greater sophistication in their end-products. We frequently partner withselect, industry-leading manufacturers to jointly develop leading-edge products to meet changingconsumer demands. Examples of recent innovation in the hygiene market are our new cost effective andlighter weight core materials supplied to private label diaper producers.
7

Medical applications. Our medical products are the principal, high-performance materials that areused in disposable surgical packs, apparel such as operating room gowns and drapes, face masks,shoe covers and wound care sponges and dressings. Nonwovens feature characteristics specificallyaddressing properties around barrier performance, breathability, strength and softness. Recently, welaunched our innovative Medisoft� Ultra� line, which delivers enhanced softness and comfort, as well asdrapability and breathability, combined with higher protection and superior cost effectiveness thantraditional medical nonwovens. Our well-respected position in the industry is rooted in our acquisition ofJohnson & Johnson’s medical nonwovens business in 1995. We maintain the second largest globalmarket position in nonwoven-based medical fabrics. Growth in the United States is expected to bedriven by demand for improved barrier properties and enhanced protection due to new regulations,such as those imposed by the Association for the Advancement of Medical Instrumentation. In Europe,where the nonwoven medical penetration rate of 35% is significantly lower than that of North America,growth is expected to be driven by increased use of disposable products as end-use customers switchto nonwovens from less breathable and poorer barrier materials. Medical products, whose finalproduction steps are labor intensive, are increasingly being converted and manufactured in low laborcost regions such as China. We are uniquely positioned to participate in the growth from this trendthrough our proximity to regional medical converters and the finishing capabilities of our new plant inSuzhou, China.
Industrial applications. Our industrial business serves a diverse collection of niche end markets thatincludes cable wrap, furniture and bedding, home furnishings, filtration, automotive components andlandscape and agricultural applications. We compete in applications where there is a demand for highlyengineered and tailored materials which can be addressed by our technological capabilities and whereour customers place significant value. Growth in industrial products is driven by category-specificdemand dynamics, such as increased nonwovens consumption as a result of applicable EPAregulations for filtration applications and the United States’ more stringent standards for flame-retardantfabrics in mattresses, for which we have been able to utilize our proprietary APEX� technology.Additionally, we are taking advantage of numerous opportunities to utilize nonwovens in newapplications where they have never before been utilized, such as in the roofing, packaging, andacoustical insulation markets. One example of such a new application, which we recently introduced forthe automotive market, is a moldable substrate for use as wheel well liners and trunk liners, whichprovides superior acoustic properties versus comparative products while providing savings toautomakers.
Wiping applications. We produce nonwoven products for the consumer wipes market, which includespersonal care and facial wipes (in-market examples, including those that we do not supply, consist ofwipes from Olay� and Neutrogena�), baby wipes and household wipes (in-market examples, includingthose that we do not supply, consist of Clorox� and Lysol� disinfectant wipes and Swiffer� and Pledge�dry dusting wipes). We also market a converted line of wipes under our own industry-leading Chix�brand directly to industrial, foodservice, and janitorial markets. Wipes producers rely on nonwovens toprovide features that enable product performance demanded by consumers such as abrasiveness andliquid dispensability. For example, our proprietary APEX� technology enables us to impart three-dimensional images, which enhance performance by creating ridges for dust collection and increaseabrasiveness, as well as improve branding and customer appeal. The consumer wipes market isexpected to grow significantly as a result of increased sales of these value-added consumer productsand continued innovations such as the additions of lotions, exfoliates, and skin cleansing deliverysystems to the wipes. Recently, we introduced a new family of products based upon our uniqueSpinlace� technology that meet customers’ demand for products that are a better value and offerimproved functionality, such as improved strength and absorbency at lower weights.
8

Oriented Polymers segment
The Oriented Polymers segment provides flexible packaging products that utilize coated anduncoated oriented polyolefin fabrics. Oriented Polymers segment sales were approximately$174.0 million, $173.3 million and $185.1 million for fiscal 2007, 2006 and 2005, respectively, andrepresented approximately 16%, 17% and 20% of our consolidated net sales in each of those years.
The Oriented Polymers segment utilizes extruded polyolefin processes and woven technologies toproduce a wide array of products for industrial packaging, building products, agriculture and protectiveapparel markets. These include concrete fiber, housewrap, lumberwrap, fiberglass packaging tubes,balewrap, steel wrap, coated bags for specialty chemicals and mineral fibers, performance fabrics forfiremen turnout gear and other performance fabrics. Our woven slit film component of the businessprimarily competes in niche markets, delivering more complex products versus supplying uncoatedmarkets such as carpet backing fabric, geotextiles and bags. The industrial packaging markets in whichwe compete include applications such as lumberwrap, steel wrap and fiberglass packaging. Thebuilding products applications encompass structural concrete reinforcement fiber, as well ashigh-strength protective coverings and specialized components that are integrated into a variety ofindustrial products (e.g., roofing substrates and flame-retardant fabric). We maintain leading marketpositions in this segment, as evidenced by our #2 position in North America in concrete fiber and flame-retardant performance fabrics. We are focusing efforts on diversifying away from large volume,commodity products within this division through the continued innovation of building and constructionproducts to meet evolving customer requirements and the replacement of steel reinforcement with theless costly concrete fiber.
Competitive strengths
Our competitive strengths are a function of our global footprint and leading technology platform thatenable us to participate most effectively in the growth of the nonwovens market.
Global footprint with access to growing end markets
We are differentiated from our competition through having developed a global footprint, whichenables us to broadly serve both global consumer and industrial leaders and local and regional players,in both developed and high-growth developing regions. With manufacturing and converting operationsin 18 locations around the globe and a presence in eight countries on four continents, we have built thebroadest global asset base of any of our competitors, providing us with a leading market position. Webelieve that we will participate in the significant growth of the nonwovens market as a result of our globalfootprint, which gives us superior access to growing regions. Our global presence also allows us toprovide consistent product from similar manufacturing equipment across the world to large, globalconsumer and industrial leaders. We have completed five expansions in the past three years includingthree in high growth regions in Latin America and Asia. An additional international expansion for a newline in San Luis Potosi, Mexico is expected to be fully installed by the middle of 2009. Our Asianheadquarters are located at our new facility in Suzhou, China, which is strategically located to satisfy theincreasing demand from local converters of medical products such as gowns and drapes destined forNorth American and European markets. Future expansion will focus on high growth regions andpotentially new markets for us, such as Eastern Europe and India, where there is needed capacity giventhe low nonwoven penetration rates.
Technology innovation platform
We believe that we are the industry leading, technology-driven developer and innovator ofnonwovens and engineered materials. We have the broadest nonwovens technology base of any of ourcompetitors, underscored by an array of proprietary technologies. We also maintain a comprehensive
9

R&D program, which gives us a significant competitive advantage and ability to grow. Our R&D effortshave yielded such product innovations as flame retardant materials, moldable substrates, and theMediSoft� Ultra� and Spinlace� families of products. We hold over 350 trademarks and pendingtrademark registrations worldwide and over 800 patents and pending patent applications worldwide.
We expect to continue with our technology initiatives through further investment in existing assets toupgrade their capabilities to produce innovative and technologically superior products. Recentinvestments into existing hydroentanglement infrastructure have resulted in the introduction of a newSpinlace� material, an entirely new category of high-performance, cost-effective engineered materialsfor wipes and other uses that we expect will be the cornerstone of future product development. We arealso constantly developing innovative next-generation products throughout our portfolio, such as ourpast work with The Procter & Gamble Company on the development of their Swiffer� product and thesubsequent innovative next-generations. Additional examples of successful development initiativesinclude our ability to generate next-generation substrates for diapers, for which we have been able todevelop products that offer customers cost-effective, lighter-weight core materials.
Strong customer relationships with leading manufacturers
We have cultivated strong, collaborative relationships with a diverse set of global, regional and localcustomers who are among the technology and market leaders in the hygiene, medical, and industrialmarkets. We frequently work on leading-edge products as a development partner with our customers toensure that we are providing the best level of service to meet their standards of global scale, consistencyand highly technical product specifications. Our customers typically have stringent qualifications andprocess standards that create significant challenges for less advanced competitors. Through ourrelationships, we have become integral to the product development cycles of our customers, whichgives us insight into end market trends. Our marketing and research and development teams workclosely with these customers in the development of next generation products. This technical supporthelps to ensure that our products will continue to be incorporated into our customers’ future productdesigns.
Marketing and Sales
We sell to customers in the domestic and international marketplace. Approximately 43%, 20%, 19%,10% and 8% of our 2007 net sales were from manufacturing facilities in the United States, Latin America,Europe, Canada and Asia, respectively. The Procter & Gamble Company, which is our largest customer,accounted for 12%, 13% and 14% of our net sales in 2007, 2006 and 2005, respectively. Sales to our top20 customers represented approximately 49%, 51% and 51% of our net sales in 2007, 2006 and 2005,respectively.
We generally employ direct sales representatives who are active in our new product developmentefforts and are strategically located in the major geographic regions in which our products are utilized.The oriented polyolefin products are sold primarily through a well-established network of converters anddistributors. Converters add incremental value to our products and distributors service the small ordersize requirements typical of many end users.
Manufacturing Processes
General. Our competitive strengths include high-quality manufacturing processes and a broadrange of process technologies, which allow us to offer our customers the best-suited product for eachrespective application. Additionally, we have made significant capital investments in modern technologyand have developed proprietary processes and manufacturing techniques. We believe that we exceedindustry standards in productivity, reduction of variability and delivery lead-time. We have a wide rangeof manufacturing capabilities that allow us to produce specialized products that, in certain cases, cannot
10

be reproduced in the market. Substantially all of our manufacturing sites have plant-wide real timecontrol and monitoring systems that constantly monitor key process variables using a sophisticatedclosed loop system of computers, sensors and custom software.
Nonwovens. We have a comprehensive array of nonwoven manufacturing technologies thatencompass capabilities spanning the entire spectrum of nonwoven technologies. Nonwoven rollgoodstypically have three process steps: web formation, web consolidation or bonding, and finishing. Webformation is the process by which previously prepared fibers, filaments or films are arranged into looselyheld networks called webs, batts or sheets. In each process, the fiber material is laid onto a forming orconveying surface, which may be dry or molten. The dry-laid process utilizes fiber processingequipment, called ‘‘cards,’’ that have been specifically designed for high-capacity nonwovenproduction. The carding process converts bales of entangled fibers into uniform oriented webs that thenfeed into the bonding process. In a molten polymer-laid process, extrusion technology is used totransform polymer pellets into filaments, which are laid on a conveying screen and interlocked bythermal fusion. In this process, the fiber formation, web formation and web consolidation are generallyperformed as a continuous simultaneous operation, making this method very efficient from amanufacturing and cost perspective.
Web consolidation is the process by which fiber or film are bonded together using mechanical,thermal, chemical or solvent means. The bonding method greatly influences the end products’ strength,softness, loft and utility. The principal bonding processes are thermal bond, resin or adhesive bond,hydroentanglement or spunlace, binder fiber or through-air bond, calender, spunbond, meltblown, SMS(spunbond-meltblown-spunbond), ultrasonic bond and needlepunch. Thermal bond utilizes heatedcalender rolls with embossed patterns to point bond or fuse the fibers together. In the resin bondprocess, an adhesive, typically latex, is pad rolled onto the web to achieve a bond. Spunlace, orhydroentanglement, uses high pressure water jets to mechanically entangle the fibers. Through-airbonding takes place through the fusion of bi-component fibers in a blown hot air drum. Spunbond andmeltblown take advantage of the melt properties of the resins and may use thermal fusion with the aid ofcalender rolls. SMS and SMMS (spunbond-meltblown-meltblown-spunbond) are integrated processesof combining spunbond and meltblown sheets in a laminated structure, creating very strong, lightweightand uniform fabrics. Ultrasonic bonding utilizes high-frequency sound waves that heat the bonding sites.Needlepunch is a mechanical process in which beds of needles are punched through the web,entangling the fibers.
We recently developed a Spinlace� fabric, which is targeted as a high-performance, cost-effectiveengineered material for the wipes and other markets. The fabric is made through an internally developedprocess that combines spunbonding, airlaid and hydroentanglement techniques without the use ofcards. This nonwoven material is stronger, more absorbent and can incorporate three-dimensionalimages at lower weights and with a better value proposition than traditional manufacturing methods.
Special Films and Composite Structures. We have a proprietary continuous process formanufacturing unique reticulated films. These highly engineered films have unique capabilities due tothe way precision holes are imparted during the process of forming the film. Since these films can becomposed of two or more layers of different polymers, the functionality can be different on one sideversus the other. These films are typically customized for each customer and are especially popular inAsia as a component for premium feminine hygiene products. The Company also manufacturescomposites which are combinations of different nonwoven and /or film structures where each structurelends its properties or attributes to the end product. An example is house wrap. House wrap is the resultof mating an especially strong spunbond fabric with a highly engineered film. The resulting fabric is verystrong, economical, and has excellent wind barrier properties while allowing humidity to pass throughthe fabric.
11

Finishing, or post-treatment, adds value and functionality to the product and typically includessurface treatments for fluid repellency, aperturing, embossing, laminating, printing and slitting. Spunlaceand resin bond systems also have a post-treatment drying or curing step. Certain products also gothrough an aperturing process in which holes are opened in the fabric, improving absorbency.
Oriented Polyolefins. The oriented/film process begins with plastic resin, which is extruded into athin plastic film or into monofilament strands. The film is slit into narrow tapes. The slit tapes ormonofilament strands are then stretched or ‘‘oriented,’’ the process through which it derives its highstrength. The tapes are wound onto spools that feed weaving machines or twisters. In the finishingprocess, the product is coated for water or chemical resistance, ultraviolet stabilization and protection,flame retardancy, color and other specialized characteristics. In the twisting process, either oriented slittapes or monofilament strands are twisted and packaged on tightly spooled balls for distribution asagricultural and commercial twine. We operate coating lines that have been equipped with the latesttechnology for gauge control, print treating, lamination, anti-slip finishes and perforation. We alsolaminate oriented products to paper and have the additional capability of printing multiple colors on awide-width printing press located in North America.
Competition
Our primary competitors in our nonwoven product markets are E.I. du Pont de Nemours & Co.,Fiberweb plc, Avgol LTD., First Quality Enterprises, Inc., Grupo Providencia and Mitsui Chemicals, Inc.Japan. Our primary competitors in the oriented polymers products markets are Intertape PolymerGroup Inc. and Propex Fabrics, Inc. Generally, product innovation and performance, quality, service,distribution and cost are the primary competitive factors, with technical support being highly valued bythe largest customers.
Raw Materials
The primary raw materials used to manufacture most of our products are polypropylene resin,polyester fiber, polyethylene resin and, to a lesser extent, rayon and tissue paper. These primary rawmaterials are available from multiple sources and we purchase such materials from a variety of globalsuppliers. The prices of polypropylene, polyethylene and polyester are a function of, among otherthings, manufacturing capacity, demand and the price of crude oil and natural gas liquids. Historically,the prices of polypropylene and polyethylene resins and polyester fibers have fluctuated. We have nothistorically hedged the exposure to raw material increases, but have attempted to move more customerprograms to contracts containing price escalation clauses which would allow us to pass-through costincreases in raw materials, although there is often a delay between the time we are required to pay theincreased raw material cost and the time we are able to pass the increase on to our customers. To theextent we are not able to pass along all or a portion of such increased prices of raw materials, our cost ofgoods sold would increase and our operating income would correspondingly decrease. By way ofexample, if the price of polypropylene were to rise $.01 per pound and we were not able to pass alongany of such increase to our customers, we would realize a decrease of approximately $4.3 million on anannualized basis in our reported pre-tax operating income.
The prices of raw materials in the North American market rose substantially in the fourth quarter of2005 as a direct result of the hurricanes that impacted the Gulf Coast. The raw material prices in theNorth American markets decreased slightly since late December 2005 through the end of fiscal 2006 asthe refineries and chemical processing sites returned to more normal production levels. During fiscal2007, the North American costs have trended higher, especially in the fourth quarter. Additionally, on aglobal basis, raw material costs continue to fluctuate in response to certain global economic factors,including the regional supply versus demand dynamics for the raw materials and the volatile price of oil.Nonetheless, there can be no assurance that the prices of polypropylene, polyethylene and polyesterwill not substantially increase in the future, or that we will be able to pass on any increases to our
12

customers not covered by contracts with price escalation clauses. Material increases in raw materialcosts that cannot be passed on to customers could have a material adverse effect on our results ofoperations and financial condition. See ‘‘Management’s Discussion and Analysis of Financial Conditionand Results of Operations’’ included in Item 7 of Part II to this Annual Report on Form 10-K and ‘‘RawMaterial and Commodity Risks’’ included in Item 7A of Part II to this Annual Report on Form 10-K foradditional discussion of the impact of raw material costs on our operations in 2007, 2006 and 2005.
We believe that the loss of any one or more of our suppliers would not have a long-term materialadverse effect on us because other manufacturers with whom we conduct business would be able tofulfill our requirements. However, the loss of certain of our suppliers could, in the short-term, adverselyaffect our business until alternative supply arrangements were secured or alternative suppliers werequalified with customers. We have not experienced, and do not expect, any significant disruptions insupply as a result of shortages in raw materials.
Environmental
We are subject to a broad range of federal, foreign, state and local laws and regulations relating tothe pollution and protection of the environment. Among the many environmental requirementsapplicable to us are laws relating to air emissions, wastewater discharges, the handling, disposal andrelease of solid and hazardous substances and wastes and remediation of soil, surface andgroundwater contaminations. We believe our operations are currently in substantial compliance withapplicable environmental requirements. However, there can be no assurance that newly-discoveredinformation or changes in existing requirements or their enforcement will not result in materialenvironmental liabilities in the future.
We are also subject to laws, such as the Comprehensive Environmental Response, Compensation,and Liability Act (‘‘CERCLA’’), that may impose liability retroactively and without regard to fault forreleases or threatened releases of hazardous substances at on-site or off-site locations.
Patents and Trademarks
We consider our patents and trademarks, in the aggregate, to be important to our business andseek to protect this proprietary know-how in part through United States and foreign patent andtrademark registrations. We have over 350 trademarks and pending trademark registrations worldwide,over 800 patents and pending patent applications worldwide and maintain certain trade secrets forwhich, in order to maintain the confidentiality of such trade secrets, we have not sought patentprotection.
Inventory and Backlogs
Inventories at December 29, 2007 were $139.7 million, an increase of $8.0 million from inventories of$131.7 million at December 30, 2006. We had inventory representing approximately 56 days of cost ofsales on hand at December 29, 2007 compared to 54 days of cost of goods sold on hand atDecember 30, 2006. The increase in total inventory during 2007 versus 2006 primarily related to foreigncurrency exchange. Additionally, inventory changes in 2007 were affected by raw material costincreases, increases in inventories to effectively service the growth in sales, inventory builds to transitionthe medical fabric finishing from the U.S. to China and to facilitate other plant consolidation efforts.Unfilled orders as of December 29, 2007 and December 30, 2006 amounted to approximately$72.5 million and $80.5 million, respectively. The level of unfilled orders is affected by many factors,including the timing of orders and the delivery time for the specific products. Consequently, we do notconsider the amount of unfilled orders a meaningful indicator of levels of future sales.
Research and Development
Our investment in research and development approximated $13.7 million, $12.5 million and$11.5 million during 2007, 2006 and 2005, respectively.
Seasonality
Use and consumption of our products do not fluctuate significantly due to seasonality.
13

Employees
As of December 29, 2007, we had approximately 3,210 employees. Of this total, approximately 37%of our employees are represented by labor unions or trade councils that have entered into separatecollective bargaining agreements with us. Approximately 23% of our labor force is covered by collectivebargaining agreements that will expire within one year. There were no known unionizing attempts duringfiscal 2007. We believe that we generally have good relationships with both our union and non-unionemployees.
Business Restructuring
Our restructuring and plant realignment activities in fiscal 2007 and 2006 are discussed in Note 3‘‘Special Charges, Net’’ to the Consolidated Financial Statements included in Item 8 of Part II to thisAnnual Report on Form 10-K.
In fiscal 2007 our restructuring and plant realignment efforts were principally associated with (a) theclosure of certain U.S. Nonwoven facilities and consolidation of production and centralization ofbusiness process, for which we recognized employee severance, equipment relocation and otherassociated costs of approximately $11.6 million; (b) costs associated with the continued reorganizationand consolidation of our European businesses of $9.6 million associated with employee severance,equipment removal and relocation and plant exit costs; (c) settlement of employee benefit plans at a netcost of $0.6 million, primarily attributable to the Canadian restructuring initiatives; and (d) otherrelocation and restructuring initiatives amounting to $1.7 million in the U.S. associated with the corporaterelocation to Charlotte, North Carolina initiated in fiscal 2006 and severance and outplacement costs forthe Oriented Polymers operations.
In fiscal 2006 we recognized restructuring and plant realignment costs principally associated with(a) our restructuring and consolidation plan for Europe, which included termination benefits provided toone of our executive officers, pursuant to Dutch law, in the amount of $2.1 million and costs associatedwith the closure of the Sweden plant, which resulted in the reduction of nineteen employees and acharge of $1.1 million; (b) costs related to the relocation of the corporate headquarters to Charlotte,North Carolina in the amount of $3.0 million; (c) downsizing certain Canadian operations resulting inseverance costs of $0.6 million associated with the reduction of 26 employees; and (d) costs in theamount of $0.3 million related to exiting the leased facilities at Gainesville, Georgia.
Our strategy with respect to the consolidation efforts in the U.S. and Europe is focused on theelimination of cash fixed costs at the closed plant sites, and the transfer of business and equipment tosites in regions with lower variable costs and which are closer to our customers, as necessary andpractical, to retain the existing business with the potential to expand sales volumes.
We review our business on an ongoing basis relative to current and expected market conditions,attempting to match our production capacity and cost structure to the demands of the markets in whichwe participate, and strive to continuously streamline our manufacturing operations consistent withworld-class standards. Accordingly, in the future we may or may not decide to undertake certainrestructuring efforts to improve our competitive position, especially in the more mature markets of theU.S., Europe and Canada. In such mature markets, the prices for commodity roll goods continue tofluctuate based on supply and demand dynamics relative to the assets employed in that geographicregion. We actively and continuously pursue initiatives to prolong the useful life of our long-lived assetsthrough product and process innovation. In some instances we may decide, as was the case with ourcurrent plans to consolidate operations in the U.S. and Europe, as further described in Note 3 ‘‘SpecialCharges, Net’’ to our Consolidated Financial Statements included in Item 8 of Part II to this AnnualReport on Form 10-K, that our fixed cost structure will be enhanced through consolidation. To the extentfurther decisions are made to improve our long-term performance, such actions could result in the
14

incurrence of cash restructuring charges and asset impairment charges associated with theconsolidation, and such charges could be material.
Debt Structure and Refinancing
On November 22, 2005, we refinanced our then outstanding bank debt with a new Credit Facility(the ‘‘Credit Facility’’) and entered into Amendment No. 1, dated as of December 8, 2006, to the CreditFacility, which provided us with additional financial flexibility. Our Credit Facility consists of a$45.0 million secured revolving credit facility that matures on November 22, 2010 and a $410.0 millionfirst-lien term loan that matures on November 22, 2012. See ‘‘Liquidity Summary’’ in ‘‘Management’sDiscussion and Analysis of Financial Condition and Results of Operations’’ included in Item 7 of Part II tothis Annual Report on Form 10-K for additional details.
Recent Expansion Initiatives
We have completed five expansions in the past three years, including three in high growth regionssuch as Latin America and Asia to address growing demand for regional hygiene and global medicalproducts. Capital expenditures during the three-year period ended December 29, 2007 totaled$207.8 million and consisted of four newly installed spunmelt facilities, a retrofitted hydroentanglementline to produce Spinlace� products that was substantially completed by the end of fiscal 2007,maintenance capital spending and certain other smaller projects. The new capacity installations haveresulted in improvements in both sales and profitability.
The Cali, Colombia line, which was installed in the latter part of fiscal 2005, has performed atexpected levels since the second quarter of fiscal 2006 following a brief period during which the lineoperated below targeted operating rates due to certain equipment-related issues that have since beenresolved.
The Mooresville, North Carolina line, which began production in the latter part of the second quarterof fiscal 2006, has performed at expected levels since its start up. The Suzhou, China line beganoperations in the latter part of the third quarter of fiscal 2006. Despite the fact that the qualificationprocess with customers on the Suzhou line for high grade finished medical fabric took longer thananticipated, the process was substantially completed by the end of the third quarter of fiscal 2007,allowing for the transition from hygiene and lower grades of medical fabrics to a more profitable mix offinished medical fabric sales.
Additionally, in fiscal 2007, we were engaged in two major capital projects: (i) the retrofit of anexisting hydroentanglement line at our Benson, North Carolina facility to produce Spinlace� products,which started up early in the fourth quarter of fiscal 2007; and (ii) construction of a new spunmelt line atour facility near Buenos Aires, Argentina, which initiated commercial production in the first quarter offiscal 2008. The Spinlace� project marginally contributed to sales during fiscal 2007 and the spunmeltline in Argentina did not contribute to sales and profitability during fiscal 2007.
We have also announced installation of a state-of-the-art spunmelt line in San Luis Potosi, Mexico toserve hygiene and other customers in the U.S. and Mexico, which is expected to commence commercialproduction by the middle of 2009.
15

ITEM 1A. RISK FACTORS
Set forth below are some of the risks and uncertainties that, if they were to occur, could materiallyadversely affect our business or that could cause actual results to differ materially from the resultscontemplated by the forward-looking statements contained in this report and other public statementsmade by us.
Shareholders and prospective investors should carefully consider and evaluate all of the risk factorsdescribed below. These risk factors may change from time to time and may be amended, supplemented,or superceded by updates to the risk factors contained in periodic reports on Form 10-Q and Form 10-Kthat we file with the Securities and Exchange Commission in the future.
Risks Related to the Company’s Business
Because the specialized markets in which we sell our products are highly competitive, wemay have difficulty growing our business year after year.
The markets for our products are highly competitive. The primary competitive factors includetechnical support, product innovation and performance, quality, service, distribution and cost. Inaddition, we compete against a small number of competitors in each of our markets. Some of thesecompetitors are much larger companies that have greater financial, technological, manufacturing andmarketing resources than us. A reduction in overall demand, a significant increase in market capacity orincreased costs to design and produce our products would likely further increase competition and thatincreased competition could cause us to reduce our prices, which could lower our profit margins andimpair our ability to grow from year to year.
We must continue to invest significant resources in developing innovative products in order tomaintain a competitive edge in the highly specialized markets in which we operate.
Our continued success depends, in part, upon our ability to maintain our technological capabilitiesand to continue to identify, develop and commercialize innovative products for the nonwoven andoriented polyolefin industries. We must also protect the intellectual property rights underlying our newproducts to realize the full benefits of our efforts. If we fail to continue to develop products for our marketsor to keep pace with technological developments by our competitors, we may lose market share, whichcould reduce product sales, lower our profits and impair our financial condition.
The loss of only a few of our large volume customers could reduce our revenues and profits.
A significant amount of our products are sold to a relatively small number of large volumecustomers. For example, sales to The Procter & Gamble Company represented approximately 12% ofour net sales in fiscal 2007. Sales to our top 20 customers represented approximately 49% of our netsales in fiscal 2007. As a result, a decrease in business from, or the loss of, any large volume customersuch as The Procter & Gamble Company could materially reduce our product sales, lower our profitsand impair our financial condition.
Increases in prices for raw materials or the unavailability of raw materials could reduce ourprofit margins.
The primary raw materials used to manufacture most of our products are polypropylene resins,polyester fiber, polyethylene resin and, to a lesser extent, rayon and tissue paper. The prices ofpolypropylene, polyethylene and polyester are a function of, among other things, manufacturingcapacity, demand and the price of crude oil and natural gas liquids. To the extent that we are able to passalong at least a portion of raw material price increases to some of our customers, there is often a delaybetween the time we are required to pay the increased raw material price and the time we are able to
16

pass the increase on to our customers. To the extent we are not able to pass along all or a portion of suchincreased prices of raw materials, our cost of goods sold would increase and our operating incomewould correspondingly decrease. By way of example, as of December 29, 2007, if the price ofpolypropylene were to rise $0.01 per pound and we were not able to pass along any of such increase toour customers, we would realize a decrease of approximately $4.3 million on an annualized basis in ourreported pre-tax operating income. There can be no assurance that the prices of polypropylene,polyethylene and polyester will not increase in the future or that we will be able to pass on any increasesto our customers. Material increases in raw material prices that cannot be passed on to customers couldhave a material adverse effect on our profit margins, results of operations and financial condition. Inaddition, the loss of any of our key suppliers in the short-term could disrupt our business until we securealternative supply arrangements or alternative suppliers were qualified with customers.
Reductions in our selling prices to customers, pursuant to contractual requirements, couldreduce our profit margins.
In cases where changes in our selling prices to customers are determined via contract based onchanges in an underlying index, such as the index for polypropylene, and the index decreases, saleswould decrease and our operating income would correspondingly decrease if we are not able to obtaincorresponding reductions in our raw material costs, which decreases in operating income could bematerial. There can be no assurance that the index used in such contracts will not decrease in the futureor that we will be able to obtain corresponding reductions in our raw material costs.
In response to changing market conditions, we may decide to restructure certain of ouroperations resulting in additional cash restructuring charges and asset impairmentcharges.
We review our business on an ongoing basis relative to current and expected market conditions,attempting to match our production capacity and cost structure to the demands of the markets in whichwe participate, and strive to continuously streamline our manufacturing operations consistent withworld-class standards. Accordingly, in the future we may or may not decide to undertake certainrestructuring efforts to improve our competitive position, especially in the more mature markets of theU.S., Europe and Canada. In such mature markets, the prices for commodity roll goods continue tofluctuate based upon supply and demand dynamics relative to the assets employed in that geographicregion. We actively and continuously pursue initiatives to prolong the useful life of our long-lived assetsthrough product and process innovation. To the extent further decisions are made to improve ourlong-term performance, such actions could result in the incurrence of cash restructuring charges andasset impairment charges associated with the consolidation, and such charges could be material.
Our substantial indebtedness could harm our ability to react to changes in business or marketdevelopments and prevent us from fulfilling our obligations under our indebtedness.
As of December 29, 2007, our consolidated indebtedness outstanding was approximately$427.0 million and for fiscal 2007, our interest expense, net plus capitalized interest costs amounted to$34.7 million. Our substantial level of indebtedness, as well as any additional indebtedness we may drawunder the unused portions of our Credit Facility, combined with a potential downturn in business due toeconomic or other factors beyond our control, increases the possibility that we may be unable togenerate cash sufficient to pay, when due, the principal of, interest on or other amounts due in respect ofour indebtedness. Our substantial debt could increase our vulnerability to general economic downturnsand adverse competitive and industry conditions by limiting our flexibility to plan for, or to react to,changes in our business and in the industry in which we operate. This limitation could place us at acompetitive disadvantage compared to competitors that have less debt and more cash to insulate theiroperations from market downturns and to finance new business opportunities.
17

Our variable rate indebtedness subjects us to interest rate risk, which could cause our debtservice obligations to increase significantly.
In accordance with the terms of our Credit Facility, we have maintained a cash flow hedge to lessenour exposure to interest rate fluctuations. However, approximately 39% of our exposure to variableinterest rates under our Credit Facility is not hedged and bears interest at floating rates. As a result, amodest interest rate increase could result in a substantial increase in interest expense.
To service our indebtedness and fund our capital expenditures, we will require a significantamount of cash. Our ability to generate cash depends on many factors beyond ourcontrol.
Our ability to make payments on our indebtedness and to fund our operations and capitalexpenditures will depend on our ability to generate cash in the future. However, our business may notgenerate sufficient cash flow from operations for a variety of reasons, including general downturns in theeconomy, delays in the start-up of expansion projects, changes in the currency exchange rates incountries in which we operate, local laws restricting the movement of cash between our subsidiaries andthe parent and many other potential reasons. If we cannot generate sufficient cash to service our debt,we will have to take such actions as reducing or delaying capital investments, selling assets,restructuring or refinancing our debt or seeking additional equity capital. Any of these actions may notbe affected on commercially reasonable terms, or at all. In addition, the credit agreement with respect toour Credit Facility may restrict us from adopting any of these alternatives.
Non-compliance with covenants contained in our Credit Facility, without waiver or amendmentfrom our lenders, could adversely affect our ability to borrow under the Credit Facility andrender all outstanding borrowings immediately due and payable.
Our Credit Facility contains certain financial covenants, including a leverage ratio and an interestexpense coverage ratio, certain of which covenants adjust automatically on March 29, 2008 and at theend of each of the March quarters in fiscal 2009 and 2010, and will be more difficult to meet. We may notbe able to satisfy these ratios, especially if operating results fall below management’s expectations. Abreach of any of these covenants or our inability to comply with the required financial ratios could resultin a default under the Credit Facility, unless we are able to remedy any default within the allotted cureperiod or obtain the necessary waivers or amendments to the Credit Facility. In the event that a default isnot waived, and subject to appropriate cure periods as provided for in the Credit Facility, the lendersunder the Credit Facility could elect to not lend any additional amounts to us and could elect to declareall outstanding borrowings, together with accrued interest and other fees, to be immediately due andpayable. If we are unable to repay the borrowings with respect to the credit facility when due, the lenderscould proceed against their collateral, which consists of (i) a lien on substantially all of our assets and theassets of our domestic subsidiaries and certain of our non-domestic subsidiaries, (ii) a pledge of all or aportion of the stock of our domestic subsidiaries and certain of our non-domestic subsidiaries and (iii) apledge of certain secured intercompany notes.
Because a significant number of our employees are represented by labor unions or tradecouncils and work under collective bargaining agreements, any employee slowdown orstrikes or the failure to renew our collective bargaining agreements could disrupt ourbusiness.
As of December 29, 2007, approximately 37% of our employees are represented by labor unions ortrade councils and work under collective bargaining agreements. Approximately 23% of our labor forceis covered by collective bargaining agreements that expire within one year. We may not be able tomaintain constructive relationships with these labor unions or trade councils. We may not be able tosuccessfully negotiate new collective bargaining agreements on satisfactory terms in the future. The loss
18

of a substantial number of these employees or a prolonged labor dispute could disrupt our business.Any such disruption could in turn reduce our revenues from sales, increase our costs to bring productsto market and result in significant losses.
We generate most of our revenue from the sale of manufactured products that are used in awide variety of consumer and industrial applications and the potential for product liabilityexposure could be significant.
We manufacture a wide variety of products that are used in consumer and industrial applications,such as disposable diapers, baby wipes, surgical gowns, wound dressings, carpet backing andindustrial packaging. As a result, we may face exposure to product liability claims in the event that thefailure of our products results, or is alleged to result, in bodily injury and/or death. In addition, if any of ourproducts are, or are alleged to be, defective, we may be required to make warranty payments or toparticipate in a recall involving those products.
The future costs associated with defending product liability claims or responding to productwarranties could be material and we may experience significant losses in the future as a result. Asuccessful product liability claim brought against us in excess of available insurance coverage or arequirement to participate in any product recall could substantially reduce our profitability and cashgenerated from operations.
We rely on a limited number of suppliers to provide significant machinery and componentsused in our production facilities. A material interruption in supply could prevent or limitour ability to accept and fill orders for our products.
We currently depend upon a limited number of outside unaffiliated suppliers for key machinery andcomponents used in our manufacturing and converting facilities. We cannot produce most of ournonwoven and oriented polyolefin products within the specifications required by our customers withoutsuch key machinery and components. If any of our suppliers cease to provide new machinery andcomponents or replacement parts for existing machinery and components in sufficient quantity to meetour needs, there may not be adequate alternative sources of supply. To date, we have been able toobtain the required machinery and components to allow us to expand our business and supply productsto our customers within their required specifications without any significant delays or interruptions.Obtaining alternative sources of such machinery and components could involve significant delays andother costs and these supply sources may not be available to us on reasonable terms or at all. In somecases, we expect that it would take several months, or longer, for a new supplier to begin providingmachinery and components to specification. Any disruption of machinery and component suppliescould result in lost or deferred sales which could adversely affect our business and financial results.
Our international operations pose risks to our business that are not present with our domesticoperations.
Our manufacturing facilities in the United States accounted for 43% of net sales for fiscal 2007, withfacilities in Europe, Latin America, Canada and Asia accounting for 57%. As part of our growth strategy,we may expand operations in existing or other foreign countries. Our foreign operations are, and anyfuture foreign operations will be, subject to certain risks that are unique to doing business in foreigncountries. These risks include fluctuations in foreign currency exchange rates, inflation, economic orpolitical instability, shipping delays, changes in applicable laws, reduced protection of intellectualproperty in some countries outside of the United States and regulatory policies and various traderestrictions. All of these risks could have a negative impact on our ability to deliver products to customerson a competitive and timely basis. This could reduce or impair our net sales, profits, cash flows andfinancial position. We have not historically hedged our exposure to foreign currency risk.
19

We could incur substantial costs to comply with environmental laws, and violations of suchlaws may increase costs or require us to change certain business practices.
We use and generate a variety of chemicals in our manufacturing operations. As a result, we aresubject to a broad range of federal, state, local and foreign environmental laws and regulations. Theseenvironmental laws govern, among other things, air emissions, wastewater discharges, the handling,storage and release of wastes and hazardous substances and cleanup of contaminated sites. Weregularly incur costs to comply with environmental requirements, and such costs could increasesignificantly with changes in legal requirements or their interpretation or enforcement. For example,certain local governments have adopted ordinances prohibiting or restricting the use or disposal ofcertain plastic products, such as certain of the plastic wrapping materials that we produce. Widespreadadoption of such prohibitions or restrictions could adversely affect demand for our products and therebyhave a material effect upon us. In addition, a decline in consumer preference for plastic products due toenvironmental considerations could have a material adverse effect upon us. We could incur substantialcosts, including clean-up costs, fines and sanctions and third-party property damage or personal injuryclaims, as a result of violations of environmental laws. Failure to comply with environmentalrequirements could also result in enforcement actions that materially limit or otherwise affect ouroperations at our manufacturing facilities involved. We are also subject to laws, such as CERCLA, thatmay impose liability retroactively and without fault for releases or threatened releases of hazardoussubstances at on-site or off-site locations.
If we are unable to adequately protect our intellectual property, we could lose a significantcompetitive advantage.
Our success depends, in part, on our ability to protect our unique technologies and productsagainst competitive pressure and to defend our intellectual property rights. If we fail to adequatelyprotect our intellectual property rights, competitors may manufacture and market similar products,which could adversely affect our market share and results of operations. We consider our patents andtrademarks, in the aggregate, to be important to our business and seek to protect our proprietaryknow-how in part through United States and foreign patent and trademark registrations. We have over350 trademarks and pending trademark registrations worldwide and over 800 patents and pendingpatent applications worldwide, and maintain certain trade secrets for which, in order to maintain theconfidentiality of such trade secrets, we have not sought patent protection. We may not receive patentsfor all our pending patent applications, and existing or future patents or licenses may not providecompetitive advantages for our products. Our competitors may challenge, invalidate or avoid theapplication of any existing or future patents, trademarks, or other intellectual property rights that wereceive or license. In addition, patent rights may not prevent our competitors from developing, using orselling products that are similar or functionally equivalent to our products. The loss of protection for ourintellectual property could reduce the market value of our products, reduce product sales, lower ourprofits, and impair our financial condition.
Due to the particular industry in which we operate, the loss of our senior management coulddisrupt our business.
Our senior management is important to the success of our business because there is significantcompetition for executive personnel with experience in the nonwoven and oriented polyolefin industries.As a result of this need and the competition for a limited pool of industry-based executive experience, wemay not be able to retain our existing senior management. In addition, we may not be able to fill newpositions or vacancies created by expansion or turnover or attract additional senior managementpersonnel. The loss of any member of our senior management team without retaining a suitablereplacement (either from inside or outside our existing management team) could restrict our ability to
20

enhance existing products in a timely manner, sell products to our customers or manage the businesseffectively.
The success of our business depends, in part, on achieving our objectives for strategicacquisitions and dispositions.
We may pursue acquisitions or joint ventures as part of our long-term business strategy. Thesetransactions may involve significant challenges and risks including that the transaction does notadvance our business strategy, that we do not realize a satisfactory return on the investment made, orthat we experience difficulty in the integration of new operations, employees, business systems, andtechnology, or diversion of management’s attention from our other businesses. These factors couldadversely affect our operating results or financial condition.
We may, as part of our long-term business strategy, evaluate the potential disposition of assets andbusinesses that may no longer be in alignment with our strategic direction. When we decide to sellassets or a business, we may encounter difficulty finding buyers or alternative exit strategies onacceptable terms in a timely manner, which could delay the accomplishment of strategic objectives, orwe may dispose of a business at a price or on terms, which are less than optimal. In addition, there is arisk that we sell a business whose subsequent performance exceeds expectations, in which case thedecision would have potentially sacrificed enterprise value. Correspondingly, we may be too optimisticabout a particular business’s prospects, in which case we may be unable to find a buyer at anacceptable price and, therefore, may have potentially sacrificed enterprise value.
Risks Related to our Class A Common Stock
The nature of the stock market in general, and our Class A Common Stock in particular, couldminimize the use of equity markets as a source of capital to fund future capital spendingor acquisitions.
The stock market in general, and the market for industrial product manufacturing companies inparticular, have experienced extreme price and volume fluctuations that have often been unrelated ordisproportionate to the operating performance of those companies. These broad market and industryfactors may adversely affect the market price of our Class A Common Stock, regardless of our actualoperating performance. These trading price fluctuations may also make it more difficult for us to use ourClass A Common Stock as a means to make acquisitions or to use our equity-based incentive plans toattract and retain employees. In addition, in the past, following periods of volatility in the overall marketand the market price of a company’s securities, securities class action litigation has often been institutedagainst these companies. This litigation, if instituted against us, could result in substantial costs and adiversion of our management’s attention and resources.
Because we have no plans to pay any dividends for the foreseeable future, investors must looksolely to stock appreciation for a return on their investment in us. Additionally, as the trading volume inour Class A Common Stock has not been significant, making our stock relatively illiquid, an investor maynot be able to resell the investment in a desired timeframe.
21

Our amended and restated certificate of incorporation and amended and restated by-lawscontain provisions that could delay or discourage takeover attempts that stockholdersmay consider favorable and adversely affect the trading price of our Class A CommonStock.
Provisions in our amended and restated certificate of incorporation and amended and restatedby-laws may have the effect of delaying or preventing a change in control or changes in ourmanagement. These provisions include the following:
• in the event another person acquires all or substantially all of our assets or more than 51% of ourvoting capital stock, our various classes of common stock may be subject to certain distributionprivileges;
• the right of the board of directors to elect a director to fill a vacancy created by the expansion ofthe board of directors or due to the resignation or departure of an existing board member;
• the prohibition of cumulative voting in the election of directors, which would otherwise allow lessthan a majority of stockholders to elect director candidates;
• the requirement for the advance notice of nominations for election to the board of directors or forproposing matters that can be acted upon at a stockholders’ meeting;
• the ability of our board of directors to alter our by-laws without obtaining stockholder approval;and
• the ability of the board of directors to issue, without stockholder approval, shares of preferredstock with terms set by the board of directors, which rights could be senior to those of our Class ACommon Stock.
A significant stockholder has the ability to substantially influence us and its interests mayconflict with or differ from your interests as a stockholder.
MatlinPatterson Global Opportunities Partners, L.P. and certain of its affiliates, which we refer tocollectively as the GOF Parties, beneficially owns approximately 70% of our outstanding Class ACommon Stock. Pursuant to a Shareholders’ Agreement, the GOF Parties have the ability to affect thecomposition of our Board of Directors and the voting of the shares held by them with respect to thenomination, election and removal of directors. In addition, the GOF Parties have the ability to, subject toapplicable law, substantially influence actions to be taken by us and our Board of Directors, includingamendments to our amended and restated certificate of incorporation and amended and restatedby-laws and approval of significant corporate transactions, including mergers and sales of substantiallyall of our assets. For example, the concentration of ownership held by the GOF Parties could delay, deferor prevent a change of control of our company or impede a merger, takeover or other businesscombination. In addition, a sale of a substantial number of shares of stock in the future by funds affiliatedwith the GOF Parties could cause our stock price to decline in the future.
Our amended and restated certificate of incorporation includes a provision stating that we haveelected not to be governed by Section 203 of the Delaware General Corporation Law, which would haveimposed additional requirements regarding mergers and other business combinations with significantstockholders. Section 203 would have offered stockholder protection by requiring prior Board orstockholder approval for mergers and other business combinations with significant stockholders, butbecause we have opted out of Section 203, this pre-approval protection is not available, including withrespect to future acquisitions of our Class A Common Stock by the GOF Parties.
ITEM 1B. UNRESOLVED STAFF COMMENTS
None
22

ITEM 2. PROPERTIES
The Company and its subsidiaries operate the following principal manufacturing plants and otherfacilities, all of which are owned, except as noted. All of the Company’s owned properties are subject toliens in favor of the lenders under the Company’s Credit Facility. The Company believes that its facilitiesare generally well-maintained, in good condition and adequate for its current needs.
Location Principal Function
Nonwovens U.S.North Little Rock, Arkansas . . . Manufacturing and WarehousingLandisville, New Jersey . . . . . . Manufacturing and WarehousingBenson, North Carolina . . . . . . Manufacturing, Warehousing and Research and DevelopmentMooresville, North Carolina . . . Manufacturing and Research and DevelopmentWaynesboro, Virginia . . . . . . . . Manufacturing, Warehousing and Research and DevelopmentWaynesboro, Virginia(1) . . . . . . Warehousing
Nonwovens EuropeBailleul, France . . . . . . . . . . . . Manufacturing, Marketing, Warehousing, Research and
Development and AdministrationCuijk, The Netherlands . . . . . . Manufacturing, Sales, Marketing, Warehousing and Research and
Development
Nonwovens Latin AmericaBuenos Aires, Argentina(2) . . . Manufacturing, Sales, Marketing, Warehousing and AdministrationCali, Colombia . . . . . . . . . . . . Manufacturing, Sales, Marketing, Warehousing and AdministrationSan Luis Potosi, Mexico . . . . . Manufacturing, Sales, Warehousing, Marketing and Administration
Nonwovens AsiaNanhai, China(3) . . . . . . . . . . . Manufacturing, Sales, Marketing, Warehousing and AdministrationSuzhou, China . . . . . . . . . . . . Manufacturing, Sales, Marketing, Warehousing and Administration
Oriented Polymers DivisionKingman, Kansas . . . . . . . . . . Manufacturing, Marketing, Warehousing and AdministrationGuntown, Mississippi(1) . . . . . . Converting and WarehousingPortland (Clackamas), Oregon . ManufacturingClearfield, Utah(1) . . . . . . . . . . Manufacturing, Marketing and WarehousingNorth Bay, Ontario . . . . . . . . . Manufacturing, Marketing, Warehousing and AdministrationMagog, Quebec . . . . . . . . . . . Manufacturing, Marketing, Warehousing and AdministrationMontreal, Quebec(1) . . . . . . . . Sales, Marketing and Administration
Corporate OfficesCharlotte, North Carolina(1) . . . Sales, Marketing and Administration
(1) Leased.
(2) 60% interest in a joint venture/partnership-type arrangement (Dominion NonwovensSudamerica S.A.) with Guillermo Enrique Kraves.
(3) Primarily an 80% interest in a joint venture/partnership-type arrangement (Nanhai NanxinNon-Woven Co. Ltd.) with Nanhai Chemical Fiber Enterprises Co.
Capacity utilization during 2007 varied by geographic location and manufacturing capabilities.However, it can be generally stated that most of the facilities operated moderately below capacity.
23
ITEM 3. LEGAL PROCEEDINGS
We are not currently a party to any pending legal proceedings other than routine litigation incidentalto the business of the Company, none of which are deemed material.
We are subject to a broad range of federal, foreign, state and local laws and regulations relating topollution and protection of the environment. We believe that we are currently in substantial compliancewith applicable environmental requirements and do not currently anticipate any material adverse effecton our operations, financial or competitive position as a result of our efforts to comply with environmentalrequirements. Some risk of environmental liability is inherent, however, in the nature of our business and,accordingly, there can be no assurance that material environmental liabilities will not arise.
On July 5, 2007, we received a call from the Division of Enforcement of the United States Securitiesand Exchange Commission (the ‘‘SEC’’) regarding the investigation in fiscal 2006 by our AuditCommittee into certain transactions between us and an equipment supplier and related matters. TheSEC requested documents related to the Audit Committee’s investigation. We have furnisheddocuments to the SEC in response to this request. In addition, we have met with the SEC to explain theAudit Committee’s process and to otherwise respond to any questions. We intend to comply with anyadditional requests, if any, from the SEC.
ITEM 4. SUBMISSION OF MATTERS TO A VOTE OF SECURITY HOLDERS
No matters were submitted to a vote of security holders during the fourth quarter of fiscal 2007.
24

PART II
ITEM 5. MARKET FOR THE REGISTRANT’S COMMON EQUITY, RELATED STOCKHOLDERMATTERS AND ISSUER PURCHASES OF EQUITY SECURITIES
Since March 5, 2003, our Class A and Class B Common Stock have been trading on theOver-the-Counter Bulletin Board (the ‘‘OTCBB’’) under the symbols ‘‘POLGA’’ and ‘‘POLGB,’’respectively. Our common stock is divided into five classes: Class A, Class B, Class C, Class D andClass E. The Class A and Class B Common Stock trade on the OTCBB. No shares of Class D or Class ECommon Stock are outstanding. There is no established trading market for the Class C Common Stockand, as such, no ticker symbol has been assigned to the Class C Common Stock. The Class B CommonStock is convertible to Class A Common Stock and, accordingly, the Class B Common Stock trades on acomparable basis to the Class A Common Stock. The following table sets forth for fiscal 2007 and 2006the high and low bids for the Company’s Class A Common Stock as reported on the OTCBB for theperiods indicated:
2007 2006High Low High Low
First Quarter . . . . . . . . . . . . . . . . . . . . . . . . . . . . $26.10 $22.50 $27.30 $22.25Second Quarter . . . . . . . . . . . . . . . . . . . . . . . . . 31.00 26.00 28.50 24.95Third Quarter . . . . . . . . . . . . . . . . . . . . . . . . . . . 30.00 23.25 26.00 21.06Fourth Quarter . . . . . . . . . . . . . . . . . . . . . . . . . . 28.00 19.00 26.50 25.30
We did not pay any dividends on our Class A Common Stock during fiscal years 2007 or 2006. Wecurrently intend to retain our future earnings, if any, to finance the further expansion and continuedgrowth of our business. In addition, our Credit Facility limits restricted payments, which includesdividends payable in cash, to $5.0 million in the aggregate since the effective date of the Credit Facility.
As of March 5, 2008, there were 61 registered holders of record of our Class A Common Stock, 333registered holders of record of our Class B Common Stock and one registered holder of record of ourClass C Common Stock.
25

6MAR200820181832
PERFORMANCE GRAPH
The following graph compares the Company’s cumulative total stockholder return since April 2,2003 (the Company emerged from bankruptcy on March 5, 2003 and data regarding the Company’sstock price was not available until April 2, 2003) with the Russell 2000 Index and with selectedcompanies that the Company believes are similar to the Company (the ‘‘Peer Group’’). The Company’sPeer Group is comprised of the following companies: Intertape Polymer Group, Inc., Lydall Corporation,Millipore Corporation, Pall Corporation and Buckeye Technologies, Inc.
COMPARISON OF CUMULATIVE TOTAL RETURNAMONG POLYMER GROUP,
RUSSELL 2000 INDEX AND PEER GROUP INDEX(1)
4/02/03
6/30/03
9/30/03
300
250
200
150
100
POLYMER GROUP PEER GROUP INDEX RUSSELL 2000 INDEX
50
012/31/03
3/31/04
6/30/04
9/30/04
12/31/04
3/31/05
6/30/05
9/30/05
12/29/07
9/29/07
6/30/07
3/31/2007
12/30/06
9/29/06
6/30/06
3/31/06
12/31/05
DO
LL
AR
S
(1) Assumes $100 invested on April 2, 2003, all dividends reinvested and all fiscal years ending onDecember 31.
4/02/2003 6/30/2003 9/30/2003 12/31/2003 3/31/2004 6/30/2004
POLYMER GROUP . . . . . . . . . 100.00 50.00 46.25 62.50 112.50 109.17PEER GROUP INDEX . . . . . . . 100.00 119.57 124.57 137.63 133.49 147.56RUSSELL 2000 INDEX . . . . . . 100.00 122.99 133.78 152.77 161.93 162.96
9/30/2004 12/31/2004 3/31/2005 6/30/2005 9/30/2005 12/31/2005
POLYMER GROUP . . . . . . . . . 95.83 158.33 199.58 213.75 212.50 199.92PEER GROUP INDEX . . . . . . . 133.91 151.82 137.40 159.16 155.96 158.74RUSSELL 2000 INDEX . . . . . . 157.84 179.50 169.44 176.22 183.97 185.46
3/31/2006 6/30/2006 9/29/2006 12/30/2006 3/31/2007 6/30/2007
POLYMER GROUP . . . . . . . . . 224.17 212.25 214.58 212.92 209.17 245.92PEER GROUP INDEX . . . . . . . 179.41 157.79 165.46 183.45 201.33 228.80RUSSELL 2000 INDEX . . . . . . 210.78 199.76 200.01 217.12 219.66 228.70
9/29/2007 12/29/2007
POLYMER GROUP . . . . . . . . . . . . . . . . . . . . . . . . . . . . . . . . . . . . . . . . . . . . 229.25 175.00PEER GROUP INDEX . . . . . . . . . . . . . . . . . . . . . . . . . . . . . . . . . . . . . . . . . . 206.56 206.68RUSSELL 2000 INDEX . . . . . . . . . . . . . . . . . . . . . . . . . . . . . . . . . . . . . . . . . 217.02 206.40
26

ITEM 6. SELECTED FINANCIAL DATA
The following table sets forth certain selected historical consolidated financial information forperiods both before and after we emerged from the Chapter 11 process on March 5, 2003. Foraccounting purposes, the financial statements reflect the reorganization as if it was consummated onMarch 1, 2003. Therefore, the Consolidated Balance Sheets and related information as of December 29,2007, December 30, 2006, December 31, 2005, January 1, 2005 and January 3, 2004 and theConsolidated Statement of Operations and related information for the fiscal years ended December 29,2007, December 30, 2006, December 31, 2005, January 1, 2005 and the ten months ended January 3,2004 are referred to as ‘‘Successor’’ and reflect the effects of the reorganization and the principles offresh start accounting. Periods presented prior to March 1, 2003 have been referred to as‘‘Predecessor’’. The statement of operations data for each of the periods presented in the five yearsended December 29, 2007 and the balance sheet data as of December 29, 2007, December 30, 2006,December 31, 2005, January 1, 2005 and January 3, 2004 have been derived from audited consolidatedfinancial statements, except for the balance sheet data as of March 1, 2003, which is unaudited. Thetable should be read in conjunction with ‘‘Management’s Discussion and Analysis of Financial Conditionand Results of Operations’’ included in Item 7 of Part II to this Annual Report on Form 10-K and ourConsolidated Financial Statements and related notes thereto included in Item 8 of Part II to this AnnualReport on Form 10-K.
27

Successor PredecessorTen Months Two MonthsFiscal Year Ended Ended Ended
December 29, December 30, December 31, January 1, January 3, March 1,2007 2006 2005 2005 2004 2003
(In Thousands, Except Per Share Data)Statement of Operations:Net sales . . . . . . . . . . . . . . . . . . . $1,059,663 $1,021,608 $948,848 $844,734 $644,893 $ 132,895Cost of goods sold . . . . . . . . . . . . 890,800 865,405 787,369 691,272 531,390 111,110
Gross profit . . . . . . . . . . . . . . . . . 168,863 156,203 161,479 153,462 113,503 21,785Selling, general and administrative
expenses . . . . . . . . . . . . . . . . . 108,122 110,406 104,545 99,163 78,682 15,955Special charges (credits), net:
Asset impairment charges . . . . . . . 37,445 26,434 — 2,253 1,207 —Other . . . . . . . . . . . . . . . . . . . . 24,289 12,249 9 (11,245) 6,802 4
Foreign currency (gain) loss, net . . . . (554) 1,229 671 2,027 2,773 1,343
Operating income (loss) . . . . . . . . . (439) 5,885 56,254 61,264 24,039 4,483Other expense (income):
Interest expense, net . . . . . . . . . . 32,377 29,248 32,617 40,252 49,036 10,665Write-off of loan acquisition costs . . — — 4,008 5,022 — —Foreign currency and other (gain)
loss, net . . . . . . . . . . . . . . . . (2,494) 517 (948) 667 3,032 (200)Reorganization gain . . . . . . . . . . . . — — — — — (540,479)
Income (loss) before income taxexpense and minority interests . . . . (30,322) (23,880) 20,577 15,323 (28,029) 534,497Income tax expense . . . . . . . . . . 8,838 8,457 10,885 8,816 2,928 1,692Minority interests, net of tax . . . . . . 1,986 2,195 2,695 1,775 2,028 441
Net income (loss) . . . . . . . . . . . . . (41,146) (34,532) 6,997 4,732 (32,985) 532,364Accrued and paid-in-kind dividends on
PIK Preferred Shares . . . . . . . . . . — — 27,998 5,566 — —
Income (loss) applicable to commonshareholders . . . . . . . . . . . . . . . $ (41,146) $ (34,532) $ (21,001) $ (834) $ (32,985) $ 532,364
Per Share Data:Income (loss) per share applicable to
common shareholders—basic . . . . $ (2.13) $ (1.79) $ (1.60) $ (0.09) $ (3.81) $ 16.63Income (loss) per share applicable to
common shareholders—diluted . . . $ (2.13) $ (1.79) $ (1.60) $ (0.09) $ (3.81) $ 16.63Cash dividends . . . . . . . . . . . . . . . $ — $ — $ — $ — $ — $ —
Operating and other data:Cash provided by (used in) operating
activities . . . . . . . . . . . . . . . . . . $ 40,042 $ 66,760 $ 70,932 $ 69,896 $ 33,213 $ (12,901)Cash provided by (used in) investing
activities . . . . . . . . . . . . . . . . . . (53,831) (64,268) (77,604) (23,144) (33,909) 8,820Cash provided by (used in) financing
activities . . . . . . . . . . . . . . . . . . 12,719 (1,934) (2,488) (28,133) (10,887) (14,669)Gross margin (a) . . . . . . . . . . . . . . 15.9% 15.3% 17.0% 18.2% 17.6% 16.4%Depreciation and amortization . . . . . $ 58,199 $ 60,663 $ 57,550 $ 53,230 $ 42,620 $ 8,812Capital expenditures . . . . . . . . . . . . 60,720 68,167 78,902 24,791 36,675 3,062
Balance sheet data (at end ofperiod):
Cash and cash equivalents andshort-term investments . . . . . . . . . $ 32,766 $ 32,104 $ 30,963 $ 41,296 $ 21,336 $ 31,783
Working capital . . . . . . . . . . . . . . . 175,957 159,447 173,447 187,338 119,106 172,501Total assets . . . . . . . . . . . . . . . . . 750,671 741,290 765,001 754,558 719,062 745,221Long-term debt, less current portion . 415,514 402,416 405,955 403,560 440,992 480,050Minority interests . . . . . . . . . . . . . . 19,745 16,654 16,611 14,912 14,151 12,12316% Series A convertible pay-in-kind
preferred shares . . . . . . . . . . . . . — — — 58,286 — —Total shareholders’ equity . . . . . . . . 98,532 109,096 131,482 73,849 59,200 73,390
Note to Selected Consolidated Financial Data(a) Gross margin represents gross profit as a percentage of net sales.
28

ITEM 7. MANAGEMENT’S DISCUSSION AND ANALYSIS OF FINANCIAL CONDITION ANDRESULTS OF OPERATIONS
The following discussion and analysis provides information which management believes is relevantto an assessment and understanding of our consolidated results of operations and financial condition.The discussion should be read in conjunction with the Consolidated Financial Statements and notesthereto contained in Item 8 of Part II to this Annual Report on Form 10-K. In addition, it should be noted thatour gross profit margins may not be comparable to other companies since some entities classify shippingand handling costs in cost of goods sold and others, including us, include such costs in selling, generaland administrative expenses. Similarly, some entities, including us, include foreign currency gains andlosses resulting from operating activities as a component of operating income, and some entities classifyall foreign currency gains and losses outside of operating income.
We have completed five expansions in the past three years, including three in high growth regionssuch as Latin America and Asia to address growing demand for regional hygiene and global medicalproducts. Capital expenditures during this period totaled $207.8 million and consisted of threecommercially operating spunmelt facilities and another spunmelt facility that initiated commercialproduction during the first quarter of fiscal 2008, a retrofitted hydroentanglement line to produceSpinlace� products, maintenance capital spending and certain other smaller projects. The new capacityinstallations have resulted in improvements in both sales and profitability.
The Cali, Colombia line, which was installed in the latter part of fiscal 2005, has performed atexpected levels since the second quarter of fiscal 2006 following a brief period during which the lineoperated below targeted operating rates due to certain equipment-related issues that have since beenresolved.
The Mooresville, North Carolina line, which began production in the latter part of the second quarterof fiscal 2006, has performed at expected levels since its start up. The Suzhou, China line beganoperations in the latter part of the third quarter of fiscal 2006. Despite the fact that the qualificationprocess with customers on the Suzhou line for high grade finished medical fabric took longer thananticipated, the process was substantially completed by the end of the third quarter of fiscal 2007,allowing for the transition from hygiene and lower grades of medical fabrics to a more profitable mix offinished medical fabric sales.
Additionally, in fiscal 2007, we were engaged in two major capital projects: (i) the retrofit of anexisting hydroentanglement line at our Benson, North Carolina facility to produce Spinlace� products,which started up early in the fourth quarter of fiscal 2007; and (ii) construction of a new spunmelt line atour facility near Buenos Aires, Argentina, which initiated commercial production during the first quarterof fiscal 2008. The Spinlace� project marginally contributed to sales during fiscal 2007 and the spunmeltline in Argentina did not contribute to sales and profitability during fiscal 2007.
We have also announced installation of a state-of-the-art spunmelt line in San Luis Potosi, Mexico toserve hygiene and other customers in the U.S. and Mexico, which is expected to commence commercialproduction by the middle of fiscal 2009.
As discussed herein, in fiscal 2007 we incurred special charges, net of $61.7 million, includingrestructuring and plant realignment costs of $23.5 million, non-cash asset impairment charges of$37.4 million, primarily associated with our restructuring initiatives and our evaluation of our long-livedassets for recoverability, and other costs of $0.8 million.
We review our businesses on an ongoing basis relative to current and expected market conditions,attempting to match our production capacity and cost structure to the demands of the markets in whichwe participate, and strive to continuously streamline our manufacturing operations consistent withworld-class standards. We announced three plant consolidation plans in the U.S. and Europe that wereinitiated in fiscal 2007 and will be completed in early fiscal 2008 to better align our cost structure. Our
29

strategy with respect to the consolidation efforts in the U.S. and Europe is focused on the elimination ofcash fixed costs at the closed plant sites, and the transfer of business and equipment to sites in regionswith lower variable costs and which are closer to our customers, as necessary and practical, to retain theexisting business with the potential to expand sales volumes.
In the future, we may or may not decide to undertake certain restructuring efforts to improve ourcompetitive position, especially in the more mature markets of the U.S., Europe and Canada. In suchmature markets, the prices for commodity roll goods continue to fluctuate based on supply and demanddynamics relative to the assets employed in that geographic region. We actively and continuouslypursue initiatives to prolong the useful life of our long-lived assets through product and processinnovation. In some instances we may decide, as was the case with our plans to consolidate operationsin the U.S. and Europe, and as further described in Note 3 ‘‘Special Charges, Net’’ to the ConsolidatedFinancial Statements included in Item 8 of Part II to this Annual Report on Form 10-K, that our fixed coststructure will be enhanced through consolidation. To the extent further decisions are made to improveour long-term performance, such actions could result in the incurrence of cash restructuring chargesand asset impairment charges associated with the consolidation, and such charges could be material.
Results of Operations
The following table sets forth the percentage relationships to net sales of certain ConsolidatedStatement of Operations items for fiscal 2007 in comparison with such items for the 2006 and 2005 fiscalyears:
2007 2006 2005
Net sales . . . . . . . . . . . . . . . . . . . . . . . . . . . . . . . . . . . . . . . . . . . . . . . . 100.0% 100.0% 100.0%Cost of goods sold:
Material . . . . . . . . . . . . . . . . . . . . . . . . . . . . . . . . . . . . . . . . . . . . . . . . 54.1 53.9 51.2Labor . . . . . . . . . . . . . . . . . . . . . . . . . . . . . . . . . . . . . . . . . . . . . . . . . 7.7 8.1 8.5Overhead . . . . . . . . . . . . . . . . . . . . . . . . . . . . . . . . . . . . . . . . . . . . . . . 22.3 22.7 23.3
84.1 84.7 83.0
Gross profit . . . . . . . . . . . . . . . . . . . . . . . . . . . . . . . . . . . . . . . . . . . . . . . 15.9 15.3 17.0Selling, general and administrative expenses . . . . . . . . . . . . . . . . . . . . . . . 10.2 10.8 11.0Special charges, net . . . . . . . . . . . . . . . . . . . . . . . . . . . . . . . . . . . . . . . . 5.8 3.8 —Foreign currency loss, net . . . . . . . . . . . . . . . . . . . . . . . . . . . . . . . . . . . . — 0.1 0.1
Operating income (loss) . . . . . . . . . . . . . . . . . . . . . . . . . . . . . . . . . . . . . . (0.1) 0.6 5.9Other expense (income):
Interest expense, net . . . . . . . . . . . . . . . . . . . . . . . . . . . . . . . . . . . . . . 3.0 2.9 3.4Write-off of loan acquisition costs . . . . . . . . . . . . . . . . . . . . . . . . . . . . . — — 0.4Foreign currency and other (gain) loss, net . . . . . . . . . . . . . . . . . . . . . . (0.2) 0.1 (0.1)
Income (loss) before income tax expense and minority interests . . . . . . . . . (2.9) (2.4) 2.2Income tax expense . . . . . . . . . . . . . . . . . . . . . . . . . . . . . . . . . . . . . . . . . 0.8 0.8 1.2Minority interests, net of tax . . . . . . . . . . . . . . . . . . . . . . . . . . . . . . . . . . . 0.2 0.2 0.3
Net income (loss) . . . . . . . . . . . . . . . . . . . . . . . . . . . . . . . . . . . . . . . . . . (3.9) (3.4) 0.7Accrued and paid-in-kind dividends on PIK preferred shares . . . . . . . . . . . . — — 2.9
Loss applicable to common shareholders . . . . . . . . . . . . . . . . . . . . . . . . . (3.9)% (3.4)% (2.2)%
30

Comparison of Fiscal Years Ended December 29, 2007 and December 30, 2006
Our reportable segments consist of our two operating divisions, Nonwovens and OrientedPolymers. For additional information regarding segment data, see Note 16 ‘‘Segment Information’’ to theConsolidated Financial Statements included in Item 8 of Part II to this Annual Report on Form 10-K. Thefollowing table sets forth components of the Company’s net sales and operating income (loss) byoperating division for the fiscal year ended December 29, 2007, the fiscal year ended December 30,2006 and the corresponding change from 2006 to 2007 (in millions):
2007 2006 Change
Net salesNonwovens . . . . . . . . . . . . . . . . . . . . . . . . . . . . . . . . . . . . . . . . $ 885.7 $ 848.3 $ 37.4Oriented Polymers . . . . . . . . . . . . . . . . . . . . . . . . . . . . . . . . . . . 174.0 173.3 0.7
$1,059.7 $1,021.6 $ 38.1
Operating income (loss)Nonwovens . . . . . . . . . . . . . . . . . . . . . . . . . . . . . . . . . . . . . . . . $ 79.4 $ 66.6 $ 12.8Oriented Polymers . . . . . . . . . . . . . . . . . . . . . . . . . . . . . . . . . . . 0.1 4.3 (4.2)Unallocated Corporate, net of eliminations . . . . . . . . . . . . . . . . . . (18.2) (26.3) 8.1
61.3 44.6 16.7Special charges, net . . . . . . . . . . . . . . . . . . . . . . . . . . . . . . . . . . (61.7) (38.7) (23.0)
$ (0.4) $ 5.9 $ (6.3)
The amounts for special charges, net have not been allocated to our reportable business divisionsbecause our management does not evaluate such charges on a division-by-division basis. Divisionoperating performance is measured and evaluated before such items.
Net sales
Net sales were $1,059.7 million in 2007, an increase of $38.1 million, or 3.7%, over 2006 net sales of$1,021.6 million. Net sales for fiscal 2007 improved in the Nonwovens segment over comparable 2006results by 4.4%, and net sales in fiscal 2007 in the Oriented Polymers segment increased 0.4% from 2006results. A reconciliation of the change in net sales between 2006 and 2007 is presented in the followingtable (in millions):
OrientedNonwovens Polymers Total
Net sales—2006 . . . . . . . . . . . . . . . . . . . . . . . . . . . . . . . . . . . . $848.3 $173.3 $1,021.6Change in sales due to:Volume . . . . . . . . . . . . . . . . . . . . . . . . . . . . . . . . . . . . . . . . . . . 17.0 (0.6) 16.4Price/mix . . . . . . . . . . . . . . . . . . . . . . . . . . . . . . . . . . . . . . . . . . 3.1 (0.8) 2.3Foreign currency translation . . . . . . . . . . . . . . . . . . . . . . . . . . . . 17.3 2.1 19.4
Net sales—2007 . . . . . . . . . . . . . . . . . . . . . . . . . . . . . . . . . . . . $885.7 $174.0 $1,059.7
As raw material costs have increased, we have attempted to pass raw material costs along to ourcustomers, where allowable by contract terms and where acceptable based on market conditions. Ingeneral, with respect to contracted business, there is usually a one-quarter lag between the change inraw material cost and the change in sales price.
A significant component of the $37.4 million increase in Nonwovens sales was due to volumegrowth, primarily generated in Latin America and Asia. The increases in Asian sales are attributable tosales from our new spunmelt facility in Suzhou, China, which commenced production in the fourth
31

quarter of fiscal 2006. The Latin America region also experienced improvement in sales volume, whichwas paced by year-over-year growth in hygiene sales. The aforementioned increases in sales and thesales from the new spunmelt line at Mooresville, North Carolina, which initiated operations in the latterpart of the second quarter of fiscal 2006 were partially offset by decreases associated with businessexited during fiscal 2007. Oriented Polymers’ net sales for 2007 increased $0.7 million from fiscal 2006.Oriented Polymers’ sales volumes and selling prices continue to be negatively impacted by reducedhousing starts affecting their industrial business and imported commodity products affectinglumberwrap volumes, as well as raw material supply interruptions that negatively affected the protectiveapparel markets.
The Canadian dollar, the Chinese renminbi and the Euro were stronger against the U.S. dollarduring 2007 compared to 2006. As a result, net sales increased $19.4 million due to the favorable foreigncurrency translation. Further discussion of foreign currency exchange rate risk is contained in Item 3‘‘Quantitative and Qualitative Disclosures About Market Risk’’ included below.
Gross margin
Gross margin in fiscal 2007 improved to 15.9% from 15.3% in fiscal 2006, driven by improved salesvolumes and mix of sales and improved manufacturing costs, which offset the impact of higher rawmaterial costs during fiscal 2007. The raw material component of the cost of goods sold as a percentageof net sales increased from 53.9% in 2006 to 54.1% in 2007. On the strength of improved sales and theinitial benefits from certain of the consolidation and restructuring initiatives as well as the generation ofadditional sales from the new spunmelt lines, our labor and overhead components of the cost of goodssold decreased as a percentage of net sales from fiscal 2006 to fiscal 2007. As a percentage of sales,labor decreased from 8.1% to 7.7%, or 0.5%, and overhead decreased from 22.7% to 22.3%, or 0.2%.
Operating income
A reconciliation of the change in operating income between fiscal 2006 and fiscal 2007 is presentedin the following table (in millions):
Operating income—2006 . . . . . . . . . . . . . . . . . . . . . . . . . . . . . . . . . . . . $ 5.9Change in operating income due to:
Price/mix . . . . . . . . . . . . . . . . . . . . . . . . . . . . . . . . . . . . . . . . . . . . . 9.9Higher raw material costs . . . . . . . . . . . . . . . . . . . . . . . . . . . . . . . . . (15.8)Volume . . . . . . . . . . . . . . . . . . . . . . . . . . . . . . . . . . . . . . . . . . . . . . . 5.5Lower manufacturing costs . . . . . . . . . . . . . . . . . . . . . . . . . . . . . . . . 7.6Foreign currency . . . . . . . . . . . . . . . . . . . . . . . . . . . . . . . . . . . . . . . . 2.2Lower depreciation and amortization expense . . . . . . . . . . . . . . . . . . . 2.5Higher special charges . . . . . . . . . . . . . . . . . . . . . . . . . . . . . . . . . . . (23.0)Decreased share-based compensation costs . . . . . . . . . . . . . . . . . . . . 2.3All other . . . . . . . . . . . . . . . . . . . . . . . . . . . . . . . . . . . . . . . . . . . . . . 2.5
Operating loss—2007 . . . . . . . . . . . . . . . . . . . . . . . . . . . . . . . . . . . . . . $ (0.4)
Consolidated operating loss was $0.4 million in fiscal 2007 as compared to operating income of$5.9 million in 2006, which comparison was significantly affected by $23.0 million of increased specialcharges, net during the 2007 period and higher raw material costs of $15.8 million, of which a significantpercentage was experienced in the fourth quarter of 2007 and only partially offset by sales price/miximprovements of $9.9 million. These higher raw material costs were primarily attributable topolypropylene, rayon and polyester fiber increases in fiscal 2007 compared to fiscal 2006. Operatingincome was positively impacted by the volume gains in the nonwovens markets, lower noncashcompensation costs related to share-based awards made under our stock option and restricted stock
32

plans, lower depreciation and amortization expense, favorable foreign currency movement and lowermanufacturing costs, which were primarily attributable to the improvement in manufacturing efficienciesand absorption of costs associated with the spunmelt lines operating closer to full manufacturingcapacity.
Special charges, net in fiscal 2007 were $61.7 million, representing an increase of $23.0 million overthe comparable period of fiscal 2006. In fiscal 2007, special charges, net included (i) noncash charges of$37.4 million associated with the writedown of assets, primarily in our Canadian, U.S. and Europeanoperations, (ii) restructuring and plant realignment costs of $23.5 million related to the closure of two ofour plants and the consolidation of production and centralization of business processes in the U.S., theclosure of our plant in Neunkirchen, Germany and the relocation of equipment to another facility in Cuijk,The Netherlands and other lesser restructuring initiatives, and (iii) other costs of $0.8 million. Furtherdiscussion of special charges, net is contained in Note 3 ‘‘Special Charges, Net’’ to the ConsolidatedFinancial Statements included in Item 8 of Part II of this Annual Report on Form 10-K.
During fiscal 2007, we recorded non-cash impairment charges totaling $37.4 million comprised of:(i) a write-down of $4.1 million relating to assets of our Nonwoven segment production facilities locatedin the U.S. which experienced a decline in profits and cash flows resulting from market declines and fromour global repositioning of production capacity, and from certain other nonwovens assets which wereremoved from service, (ii) a write-down of $2.9 million associated with our plans to reorganize andconsolidate certain of our Nonwoven segment operations in Europe, which plans called for the closureof our Neunkirchen, Germany plant, and the subsequent transfer of certain of the business andequipment to our plant in Cuijk, The Netherlands, and (iii) a write-down of approximately $30.4 million,relating to assets in the Oriented Polymers segment, to estimated fair value as a result of continuedweakening of sales, earnings and cash flows, and in consideration of our continuing negotiations with athird party whereby the third party has offered to purchase certain business units in the OrientedPolymers segment at amounts less than their current carrying values.
We expect that depreciation expense will be approximately $8.7 million lower in fiscal 2008 andapproximately $7.8 million lower in fiscal 2009, as a result of the aforementioned non-cash impairmentcharges recognized in fiscal 2007.
In fiscal 2007 our restructuring and plant realignment efforts were principally associated with (a) theclosure of certain U.S. Nonwoven facilities and consolidation of production and centralization ofbusiness process, for which we recognized employee severance, equipment relocation and otherassociated costs of approximately $11.6 million; (b) costs associated with the continued reorganizationand consolidation of our European businesses of $9.6 million associated with employee severance,equipment removal and relocation and plant exit costs; (c) settlement of employee benefit plans at a netcost of $0.6 million, primarily attributable to the Canadian and U.S. restructuring initiatives; and (d) otherrelocation and restructuring initiatives amounting to $1.7 million in the U.S. associated with the corporaterelocation to Charlotte, North Carolina initiated in fiscal 2006 and severance and outplacement costs forthe Oriented Polymers operations.
Selling, general and administrative expenses decreased $2.3 million, from $110.4 million in 2006 to$108.1 million in 2007, primarily due to lower noncash stock-based compensation costs describedearlier, partially offset by higher incentive compensation costs and costs associated with increased salesvolumes during 2007. Selling, general and administrative costs as a percent of net sales improved from10.8% in 2006 to 10.2% in 2007.
Interest and other expense
Net interest expense increased $3.2 million, from $29.2 million during fiscal 2006 to $32.4 millionduring fiscal 2007. The increase in net interest expense was largely due to the lower interestcapitalization of approximately $0.8 million, with respect to major capital expenditure projects, in fiscal
33

2007 compared to fiscal 2006 and higher interest costs on our long-term debt, impacted by the effects ofthe interest rate swap agreements, discussed below, partially offset by reduced levels of borrowingsunder the revolving credit facility.
During fiscal 2007, we entered into a new cash flow hedge agreement, effective May 8, 2007 andmaturing on June 29, 2009, which effectively converted $240.0 million of notional principal amount ofdebt from a variable LIBOR rate to a fixed LIBOR rate of 5.085%. This new agreement replaced the cashflow hedge agreement originally entered into in fiscal 2004, which agreement terminated on May 8, 2007and effectively converted $212.5 million of notional principal amount of debt from a variable LIBOR rateto a fixed LIBOR rate of 3.383%.
Foreign currency and other (gain) loss, net improved by $3.0 million, from a loss of $0.5 million infiscal 2006 to a gain of $2.5 million in fiscal 2007. Improvements in Foreign currency and other (gain)loss, net in 2007 are primarily attributable to the cash recovery of approximately $1.8 million from aminority shareholder of our Argentine subsidiary of legal and other costs associated with a prior periodlegal action and net gains of $2.8 million on the sale of certain property and equipment.
Income tax expense
We recognized income tax expense of $8.8 million for fiscal 2007 on a consolidated loss beforeincome taxes of $30.3 million for such period. The tax expense is significantly different than suchexpense determined at the U.S. federal statutory tax rate primarily due to losses in the U.S. and certainforeign jurisdictions for which no income tax benefits were recognized or where recognition was limitedto the extent of existing deferred tax liabilities. Additionally, the income tax expense was impacted byforeign withholding taxes, for which tax credits are not anticipated, U.S. state income taxes and foreigntaxes calculated at statutory rates less than the U.S. federal statutory rate. During fiscal 2006, werecognized an income tax expense of $8.5 million on a consolidated pre-tax loss of $23.9 million. Thisincome tax expense is significantly different than the U.S. federal statutory rate primarily due to losses inthe U.S. and certain foreign jurisdictions for which no income tax benefits were recognized or whererecognition was limited to the extent of existing deferred tax liabilities. Additionally, the income taxexpense was impacted by foreign withholding taxes, for which tax credits are not anticipated, U.S. stateincome taxes, and foreign taxes calculated at statutory rates less than the U.S. federal statutory rate.
Net loss
As a result of the above, we recognized a net loss of $41.1 million, or $2.13 per share, for fiscal 2007compared to a net loss of $34.5 million, or $1.79 per share, for fiscal 2006.
Comparison of Fiscal Years Ended December 30, 2006 and December 31, 2005
Our reportable segments consist of our two operating divisions, Nonwovens and OrientedPolymers. For additional information regarding segment data, see Note 16 ‘‘Segment Information’’ to theConsolidated Financial Statements included in Item 8 of Part II to this Annual Report on Form 10-K. Thefollowing table sets forth components of our net sales and operating income (loss) by operating division
34

for the fiscal year ended December 30, 2006, the fiscal year ended December 31, 2005 and thecorresponding change from 2005 to 2006 (in millions):
2006 2005 Change
Net salesNonwovens . . . . . . . . . . . . . . . . . . . . . . . . . . . . . . . . . . . . . . . . . $ 848.3 $763.7 $ 84.6Oriented Polymers . . . . . . . . . . . . . . . . . . . . . . . . . . . . . . . . . . . . 173.3 185.1 (11.8)
$1,021.6 $948.8 $ 72.8
Operating income (loss)Nonwovens . . . . . . . . . . . . . . . . . . . . . . . . . . . . . . . . . . . . . . . . . $ 66.6 $ 66.2 $ 0.4Oriented Polymers . . . . . . . . . . . . . . . . . . . . . . . . . . . . . . . . . . . . 4.3 10.6 (6.3)Unallocated Corporate, net of eliminations . . . . . . . . . . . . . . . . . . . (26.3) (20.5) (5.8)
44.6 56.3 (11.7)Special charges, net . . . . . . . . . . . . . . . . . . . . . . . . . . . . . . . . . . . (38.7) — (38.7)
$ 5.9 $ 56.3 $(50.4)
The amounts for special charges (credits), net have not been allocated to our reportable businessdivisions because our management does not evaluate such special charges, net on adivision-by-division basis. Division operating performance is measured and evaluated before suchitems.
Net Sales
Net sales were $1,021.6 million in 2006, an increase of $72.8 million, or 7.7%, over net sales for 2005of $948.8 million. Net sales for 2006 improved in the Nonwovens segment over comparable 2005 resultsby 11.1%, and net sales in 2006 in the Oriented Polymers segment decreased 6.4% versus 2005 results.A reconciliation of the change in net sales between 2005 and 2006 is presented in the following table (inmillions):
OrientedNonwovens Polymers Total
Net sales—2005 . . . . . . . . . . . . . . . . . . . . . . . . . . . . . . . . . . . . $763.7 $185.1 $ 948.8Change in sales due to:
Volume . . . . . . . . . . . . . . . . . . . . . . . . . . . . . . . . . . . . . . . . . 64.8 (24.3) 40.5Price/mix . . . . . . . . . . . . . . . . . . . . . . . . . . . . . . . . . . . . . . . . 19.1 7.5 26.6Foreign currency translation . . . . . . . . . . . . . . . . . . . . . . . . . . 0.7 5.0 5.7
Net sales—2006 . . . . . . . . . . . . . . . . . . . . . . . . . . . . . . . . . . . . $848.3 $173.3 $1,021.6
The increase in net sales during 2006 was due primarily to volume gains and price/miximprovements. Substantially all of the volume gains occurred in the United States, Latin American andAsian nonwovens markets. The price/mix improvement primarily reflects increases in sales price in aneffort to pass along raw material cost increases to customers. As raw material costs have increased, wehave attempted to pass raw material costs along to our customers, where allowable by contract termsand where acceptable based on market conditions.
35

A significant component of the $40.5 million increase in sales in 2006 due to volume growth wasgenerated in the Latin American region with the addition of the spunmelt line at the Cali, Colombiafacility, which initiated operations in the fourth quarter of fiscal 2005. The Latin America region’simprovement in sales was paced by significant year-over-year increases in hygiene and industrial sales.Our U.S. nonwovens business was also a contributor to the growth in sales, partially attributable to thestart-up of the new spunmelt facility at Mooresville, North Carolina in the latter part of the second quarterof fiscal 2006 and general improvements in the U.S. hygiene and consumer markets. Nonwoven salesvolumes also increased marginally in Asia, with most of the increase due to the initial shipments from theCompany’s new spunmelt facility in Suzhou, China, which commenced production in the latter part ofthe third quarter of fiscal 2006 as well as productivity improvements experienced in our operations inNanhai, China. Oriented Polymers’ net sales for 2006 decreased $11.8 million from the 2005 amount, asimprovements in price/mix of sales and a favorable foreign currency translation impact were more thanoffset by sales volume declines affecting net sales by $24.3 million. Oriented Polymers’ sales volumeshave been negatively impacted in fiscal 2006 by reduced housing starts affecting their industrialbusiness, imported commodity products affecting lumberwrap volumes and reduced agricultural sales.
Both the Canadian dollar and the Euro were stronger against the U.S. dollar during 2006 comparedto 2005. As a result, net sales increased $5.7 million due to the favorable foreign currency translation.Further discussion of foreign currency exchange rate risk is contained in ‘‘Quantitative and QualitativeDisclosures About Market Risk’’ included in Item 7A of Part II to this Annual Report on Form 10-K.
Gross Margin
Gross margin in 2006 declined to 15.3% from 17.0% in 2005, despite improved sales volumes andproduct mix, primarily due to the impact of the higher raw materials as a percentage of net sales, theeffect of raw material cost increases which were not able to be passed along to the customer and otherincreased manufacturing costs including depreciation, during 2006. The raw material component of thecost of goods sold as a percentage of net sales increased from 51.2% in 2005 to 53.9% in 2006.Additionally, depreciation expense in 2006 was $3.8 million higher than such costs in 2005.
Operating income
A reconciliation of the change in operating income between the 2005 and 2006 is presented in thefollowing table (in millions):
Operating income—2005 . . . . . . . . . . . . . . . . . . . . . . . . . . . . . . . . . . . . $ 56.3Change in operating income due to:
Price/mix . . . . . . . . . . . . . . . . . . . . . . . . . . . . . . . . . . . . . . . . . . . . . 26.6Higher raw material costs . . . . . . . . . . . . . . . . . . . . . . . . . . . . . . . . . (28.5)Volume . . . . . . . . . . . . . . . . . . . . . . . . . . . . . . . . . . . . . . . . . . . . . . . 15.4Increased manufacturing costs . . . . . . . . . . . . . . . . . . . . . . . . . . . . . . (14.4)Foreign currency . . . . . . . . . . . . . . . . . . . . . . . . . . . . . . . . . . . . . . . . (0.7)Higher depreciation and amortization expense . . . . . . . . . . . . . . . . . . (3.8)Higher special charges . . . . . . . . . . . . . . . . . . . . . . . . . . . . . . . . . . . (38.6)Increased share-based compensation costs . . . . . . . . . . . . . . . . . . . . (2.7)All other, primarily higher SG&A costs . . . . . . . . . . . . . . . . . . . . . . . . . (3.7)
Operating income—2006 . . . . . . . . . . . . . . . . . . . . . . . . . . . . . . . . . . . . $ 5.9
Consolidated operating income was $5.9 million in 2006 as compared to $56.3 million in 2005. Weexperienced higher raw material costs that were substantially offset by price/mix improvements.Operating income was positively impacted by the volume gains in the nonwovens markets, partiallyoffset by volume declines in the oriented polymers markets, as noted above in the discussion of net
36

sales. The net decline in operating income was significantly impacted by higher special charges of$38.6 million primarily consisting of asset impairment charges, restructuring and plant realignment costsand abandoned acquisition costs. Summary explanations for such items are included in the fiveparagraphs following this paragraph. For further details on such charges, see Note 3 ‘‘Special Charges,Net’’ to the Consolidated Financial Statements included in Item 8 of Part II to this Annual Report onForm 10-K. Other items contributing to the decline in operating income were increased manufacturingcosts of $14.4 million, affecting both the Nonwoven and Oriented Polymer operating results as well asincreased non-cash compensation costs of $2.7 million attributable to share-based awards madeprimarily under our restricted stock plans and higher depreciation and amortization charges of$3.8 million. The increased manufacturing costs are primarily attributable to higher energy costs andstart-up costs for certain new lines in the Nonwovens segment, coupled with increased variances in theOriented Polymers segment resulting from volume declines. The increase in depreciation andamortization charges during fiscal 2006 is primarily related to the new spunmelt production facilities inLatin America and the United States.
We experienced a continued weakening of earnings and cash flows in certain of our Canadianoperations, components of the Oriented Polymers segment. As a result, the Company, during thesecond quarter of fiscal 2006, evaluated such assets for impairment, consistent with the provisions ofStatement of Financial Accounting Standards No. 144, ‘‘Accounting for the Impairment or Disposal ofLong-Lived Assets,’’ and recorded a non-cash impairment charge associated with the write-down ofsuch assets to estimated fair value in the amount of approximately $5.5 million. Additionally, during thesecond quarter of fiscal 2006, we initiated the restructuring and consolidation strategy for the Europeanoperations, which included the closure of the facilities in Sweden. Accordingly, we recognized animpairment charge, with respect to such assets in the amount of $2.3 million, resulting in a total assetimpairment charge in the second quarter of fiscal 2006 of $7.8 million.
During the fourth quarter of fiscal 2006, we recorded an impairment charge in the amount ofapproximately $18.6 million associated with the write-down of assets located in certain facilities in theUnited States and Europe to estimated fair values. Of that total, $7.2 million related to a manufacturingline located in The Netherlands, which write-down was attributed to the expected shutdown of the line infiscal 2007 due to the loss of certain low-margin business platforms which were produced on the assetduring fiscal 2006 as the market price for the products moved to a level resulting in unacceptablemargins. The remaining $11.4 million related to the write-down of the assets in the United States,including facilities for which we announced closure plans, as further discussed in Note 3 ‘‘SpecialCharges, Net’’ to the Consolidated Financial Statements included in Item 8 of Part II to this Annual Reporton Form 10-K, as well as an impairment charge taken with respect to another facility, for which projectedfuture cash flows have been negatively impacted by the loss of a major automotive platform and theanticipated loss of certain business for which the market prices have recently declined to a level resultingin such unacceptable returns that we elected not to participate in such business going forward.
The 2006 restructuring and plant realignment costs of $7.1 million are principally associated with(a) our restructuring and consolidation plan for Europe, which included termination benefits provided toan executive officer, pursuant to Dutch law, in the amount of $2.1 million and costs associated with theclosure of the Sweden plant, which resulted in the reduction of 19 employees and a charge of$1.1 million; (b) costs related to the relocation of the corporate headquarters to Charlotte, North Carolinain the amount of $3.0 million; (c) downsizing certain Canadian operations resulting in severance costs of$0.6 million associated with the reduction of 26 employees; and (d) costs in the amount of $0.3 millionrelated to exiting the leased facilities at Gainesville, Georgia for which a planned closure has beenannounced.
During the first five months of fiscal 2006, we actively pursued a potential acquisition. In conjunctionwith this effort, we incurred approximately $4.0 million of costs, which are primarily comprised of third-party professional fees. During the second quarter of fiscal 2006, the negotiations with respect to the
37

potential acquisition reached an impasse and we abandoned efforts to consummate the acquisition,with such costs charged to operating income in that period.
During June 2006, we and an equipment supplier negotiated the resolution of a dispute and enteredinto two settlement agreements, which documented the terms of the resolution. During the second andthird quarters of fiscal 2006, we and the Audit Committee of the Board of Directors, with assistance fromspecial counsel, conducted an investigation which focused on a review of the settlement agreementsand the relationship of these agreements with certain equipment purchase contracts and serviceagreements, which were negotiated between us and the equipment supplier in or about the same timeframe. As a result of these actions, we concluded that the economic substance of the settlementagreements and the equipment purchase contracts and service agreements were substantiallyinterdependent. On September 21, 2006, the Board of Directors asked the Chief Executive Officer andthe Vice President, Global Purchasing to resign and, pending receipt of their resignations, relieved themof their duties as officers of the Company. Shortly thereafter, we entered into termination agreementswith both executives. As a result of these events, we incurred costs with respect to the investigation,termination benefits and ancillary costs in the amount of $1.1 million.
Selling, general and administrative expenses increased $5.9 million, from $104.5 million in 2005 to$110.4 million in 2006, primarily due to the non-cash compensation costs related to the share-basedawards made under our restricted stock plans, as well as increased costs due to higher sales volumes,with such increased costs partially offset by reduced incentive compensation.
Interest and Other Expense
Net interest expense decreased $3.4 million, from $32.6 million during 2005 to $29.2 million during2006. The decrease in net interest expense was primarily due to the lower interest rates obtained byrefinancing our long-term debt in November 2005. Additionally, during 2006, we capitalized, with respectto our major capital expenditure projects, interest in the amount of $3.1 million, compared to $2.2 millionin 2005.
The Consolidated Statement of Operations for 2005 included a charge of $4.0 million, with respectto loan acquisition cost write-offs related to the refinancing of our debt in November 2005.
Foreign currency and other (gain) loss, net changed by $1.4 million, from a gain of $0.9 million in2005 to a loss of $0.5 million in 2006. The change was primarily due to foreign currency movements onintercompany loan balances, at certain of the Company’s international operations, denominated incurrencies other than their functional currency, generally the U.S. dollar.
Income Tax Expense
During 2006, we recognized an income tax expense of $8.5 million on a consolidated pre-tax loss of$23.9 million. The income tax expense is significantly different than such expense determined at the U.S.federal statutory rate primarily due to losses in the U.S. and certain foreign jurisdictions for which noincome tax benefits were recognized. Additionally, the income tax expense was impacted by foreignwithholding taxes, for which tax credits are not anticipated, U.S. state income taxes, and foreign taxescalculated at statutory rates less than the U.S. federal statutory rate. We recognized income tax expenseof $10.9 million on consolidated pre-tax income of $20.6 million in 2005. The income tax expense issignificantly higher than such expense determined at the U.S. federal statutory tax rate primarily due tolosses in the U.S. and certain foreign tax jurisdictions for which no tax benefits were recognized.Additionally, the income tax expense is impacted by foreign withholding taxes, for which tax credits arenot anticipated, U.S. state income taxes and foreign taxes calculated at statutory rates less than the U.S.federal statutory rate.
38

Net Income (Loss)
As a result of the above, we recognized a net loss of $34.5 million during 2006 compared to netincome of $7.0 million in 2005.
Accrued and Paid-in-Kind Dividends on PIK Preferred Shares
Dividends on the PIK Preferred Shares accrued at an annual rate of 16.0% and were payablesemi-annually in arrears on each January 1 and July 1, commencing with July 1, 2004. Such dividendswere payable at our option; (i) through the issuance of additional shares of PIK Preferred Stock; (ii) incash; or (iii) in a combination thereof. Accordingly, we accrued dividends at the stated rate of 16.0% untilsuch time as the form of the dividend was declared by our Board of Directors. If the dividend waspaid-in-kind through the issuance of additional shares of PIK Preferred Stock, we recognized thedividend at the estimated fair value of the shares issued in excess of the amounts previously accrued.
We accrued dividends at 16% on our PIK Preferred Shares during the quarter ended April 2, 2005 inthe amount of $2.4 million. Additionally, on January 14, 2005, our Board of Directors declared thatdividends accrued on the PIK Preferred Shares from the date of issuance through December 31, 2004, inthe amount of $5.6 million, would be paid in the form of PIK Preferred Shares. We recorded the value ofthe additional PIK Preferred Shares declared as a dividend on January 14, 2005, the date the Board ofDirectors declared that the accrued dividends were to be paid in the form of additional PIK PreferredShares, rather than cash, reduced by the amount of dividends previously recorded at the stated 16.0%rate. Using the estimated market value of our Class A Common Stock of $18.50 per share, the fair valueof the 5,540 additional PIK Preferred Shares issued in lieu of cash payment was approximately$14.1 million, which exceeded the amount previously accrued by us of $5.6 million, based on the statedrate of 16.0%, by approximately $8.5 million. We accrued dividends at 16% on its PIK Preferred Sharesduring the quarter ended July 2, 2005 in the amount of $2.4 million. On August 3, 2005, our Board ofDirectors declared that dividends accrued on the PIK Preferred Shares from January 1, 2005 throughJune 30, 2005, in the amount of $4.7 million, would be paid in the form of PIK Preferred Shares. Werecorded the value of the additional PIK Preferred Shares declared as a dividend on August 3, 2005, thedate the Board of Directors declared that the accrued dividends were to be paid in the form of additionalPIK Preferred Shares, rather than cash, reduced by the amount of dividends previously recorded at thestated 16.0% rate. Using the estimated market value of our Class A Common Stock of $27.70 per share,the fair value of the 4,660 additional PIK Preferred Shares issued in lieu of cash payment wasapproximately $17.7 million, which exceeded the amount previously accrued by us of $4.7 million,based on the stated rate of 16.0%, by approximately $13.0 million. In addition, we accrued a charge fordividends of $1.8 million for the period from July 2, 2005 through the date that the PIK Preferred Shareswere redeemed for, or converted to, shares of our Class A Common Stock. Accordingly, total accruedand paid-in-kind dividends amounted to $28.0 million in 2005. As a result of all of the PIK PreferredShares being redeemed for, or converted to, shares of our Class A Common Stock by September 15,2005, no such dividends were recorded in 2006.
Loss Applicable to Common Shareholders
As a result of the above, we recognized a loss applicable to common shareholders of $34.5 million,or $1.79 per share, for 2006 compared to a loss applicable to common shareholders of $21.0 million, or$1.60 per share, for 2005.
Liquidity and Capital Resources
Our principal sources of liquidity for operations and expansions are currently funds generated fromoperations and borrowing availabilities under the Credit Facility, consisting of a revolving credit facility of$45.0 million and a first-lien term loan of $410.0 million. The revolving credit portion of the Credit Facility
39
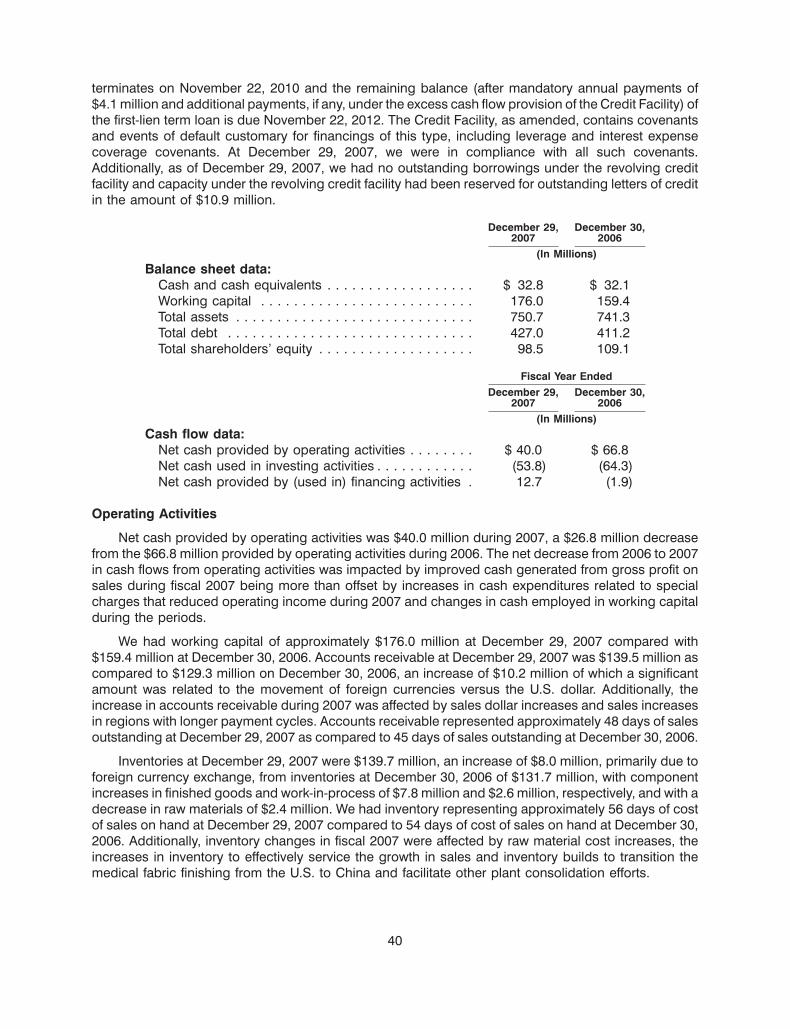
terminates on November 22, 2010 and the remaining balance (after mandatory annual payments of$4.1 million and additional payments, if any, under the excess cash flow provision of the Credit Facility) ofthe first-lien term loan is due November 22, 2012. The Credit Facility, as amended, contains covenantsand events of default customary for financings of this type, including leverage and interest expensecoverage covenants. At December 29, 2007, we were in compliance with all such covenants.Additionally, as of December 29, 2007, we had no outstanding borrowings under the revolving creditfacility and capacity under the revolving credit facility had been reserved for outstanding letters of creditin the amount of $10.9 million.
December 29, December 30,2007 2006
(In Millions)Balance sheet data:
Cash and cash equivalents . . . . . . . . . . . . . . . . . . $ 32.8 $ 32.1Working capital . . . . . . . . . . . . . . . . . . . . . . . . . . 176.0 159.4Total assets . . . . . . . . . . . . . . . . . . . . . . . . . . . . . 750.7 741.3Total debt . . . . . . . . . . . . . . . . . . . . . . . . . . . . . . 427.0 411.2Total shareholders’ equity . . . . . . . . . . . . . . . . . . . 98.5 109.1
Fiscal Year EndedDecember 29, December 30,
2007 2006(In Millions)
Cash flow data:Net cash provided by operating activities . . . . . . . . $ 40.0 $ 66.8Net cash used in investing activities . . . . . . . . . . . . (53.8) (64.3)Net cash provided by (used in) financing activities . 12.7 (1.9)
Operating Activities
Net cash provided by operating activities was $40.0 million during 2007, a $26.8 million decreasefrom the $66.8 million provided by operating activities during 2006. The net decrease from 2006 to 2007in cash flows from operating activities was impacted by improved cash generated from gross profit onsales during fiscal 2007 being more than offset by increases in cash expenditures related to specialcharges that reduced operating income during 2007 and changes in cash employed in working capitalduring the periods.
We had working capital of approximately $176.0 million at December 29, 2007 compared with$159.4 million at December 30, 2006. Accounts receivable at December 29, 2007 was $139.5 million ascompared to $129.3 million on December 30, 2006, an increase of $10.2 million of which a significantamount was related to the movement of foreign currencies versus the U.S. dollar. Additionally, theincrease in accounts receivable during 2007 was affected by sales dollar increases and sales increasesin regions with longer payment cycles. Accounts receivable represented approximately 48 days of salesoutstanding at December 29, 2007 as compared to 45 days of sales outstanding at December 30, 2006.
Inventories at December 29, 2007 were $139.7 million, an increase of $8.0 million, primarily due toforeign currency exchange, from inventories at December 30, 2006 of $131.7 million, with componentincreases in finished goods and work-in-process of $7.8 million and $2.6 million, respectively, and with adecrease in raw materials of $2.4 million. We had inventory representing approximately 56 days of costof sales on hand at December 29, 2007 compared to 54 days of cost of sales on hand at December 30,2006. Additionally, inventory changes in fiscal 2007 were affected by raw material cost increases, theincreases in inventory to effectively service the growth in sales and inventory builds to transition themedical fabric finishing from the U.S. to China and facilitate other plant consolidation efforts.
40

Accounts payable and accrued liabilities at December 29, 2007 were $150.4 million as compared to$143.5 million at December 30, 2006, an increase of $6.9 million, with a significant component of suchincrease attributable to foreign currency movements. Accounts payable and accrued liabilitiesrepresented approximately 60 days of cost of sales outstanding at December 29, 2007 compared to59 days of cost of sales outstanding at December 30, 2006. The increase in accounts payable andaccrued liabilities from December 30, 2006 to December 29, 2007 was impacted by the effects ofcurrency movements, construction in progress, accruals with respect to incentive compensation plansand the ramp-up of our new line in Suzhou, China, partially offset by the closure of three of our plants infiscal 2007, faster payment of trade payables, including acceptance of vendor discounts, and changes interms regarding purchases of raw materials from certain vendors, as well as the movement of certainpurchases of raw materials, for which there is limited availability, to vendors that have required us to paycash prior to delivery.
Our restructuring and plant realignment activities in fiscal 2007 and 2006 are discussed in Note 3‘‘Special Charges, Net’’ to the Consolidated Financial Statements included in Item 8 of Part II to thisAnnual Report on Form 10-K.
In fiscal 2007, restructuring and plant realignment activities, and related costs, include:
(i) reorganization and consolidation initiatives in North America. In January 2007, wecommunicated a plan to affected employees that we planned to close two of our plants in theUnited States, with the planned transfer of certain of the business and equipment to our otherfacilities in North America and Asia. With respect to the plant closures, for which manufacturingceased effective July 31, 2007, approximately 170 production and administrative staff positionswere eliminated. As a result of the restructuring, we recognized employee severance,equipment relocation and other associated costs of approximately $8.9 million during the year.Additionally, in December 2007, the Company approved a plan to restructure certain of itsNonwoven operations in the U.S. resulting in the centralization of certain business processes,the integration of certain operations and the elimination of certain positions. Based on theabove plans, which are expected to be implemented throughout fiscal 2008, we recognized acharge for severance and other associated costs of approximately $2.7 million;
(ii) initiation of certain restructuring activities in 2007 pertaining to Oriented Polymers operationslocated in the United States, for which we have incurred restructuring costs of approximately$0.9 million, primarily comprised of severance and outplacement costs;
(iii) costs related to the relocation of our corporate headquarters to Charlotte, North Carolina,originally undertaken in fiscal 2006, in the amount of $0.8 million;
(iv) continued reorganization and consolidation of certain of our operations in Europe. In late June2007, we announced a plan to close our Neunkirchen, Germany plant, which wascommunicated to affected employees in July 2007. The plant closure will include the reductionof approximately 72 positions when such consolidation efforts are completed in early fiscal2008. During fiscal 2007, approximately $6.3 million of employee severance costs wererecognized related to this plant closure, for which production activities ceased as ofSeptember 29, 2007. We also incurred approximately $3.3 million related to plant shut-downcosts and equipment removal and relocation costs associated with the transfer of theequipment to our plant in Cuijk, The Netherlands; and
(v) settlement of employee benefit plans. During the first quarter of fiscal 2006, as part of ourrestructuring and related cost reduction measures, we negotiated certain changes with theunion representing the employees of one of our Canadian operations, including a partialcurtailment of a defined benefit pension plan. No gain or loss was incurred as a result of thepartial curtailment in fiscal 2006. However, based on elections made by plan participants during
41

the second quarter of fiscal 2006, and as approved by Canadian regulatory authorities onJanuary 16, 2007, we have incurred a settlement loss associated with employees who haveexited the plan. The loss of $3.8 million was recognized in the first quarter of fiscal 2007commensurate with governmental approval of the terms of the settlement and upon fulfillmentby us of our funding requirements. Additionally, during fiscal 2007 we recognized a gain of$3.3 million on the settlement of certain postretirement benefit plans in the U.S.
We expect to make future cash payments of approximately $7.3 million associated with currentrestructuring and relocation initiatives, of which $5.9 million has been accrued as of December 29, 2007.In fiscal 2007, we received approximately $7.5 million from the sale of idled facilities and equipment andcurrently anticipate future proceeds of an additional $6.0 million in fiscal 2008.
In fiscal 2006 we recognized restructuring and plant realignment costs principally associated with(a) our restructuring and consolidation plan for Europe, which included termination benefits provided toone of our executive officers, pursuant to Dutch law, in the amount of $2.1 million and costs associatedwith the closure of the Sweden plant, which resulted in the reduction of nineteen employees and acharge of $1.1 million; (b) costs related to the relocation of the corporate headquarters to Charlotte,North Carolina in the amount of $3.0 million; (c) downsizing certain Canadian operations resulting inseverance costs of $0.6 million associated with the reduction of 26 employees; and (d) costs in theamount of $0.3 million related to exiting the leased facilities at Gainesville, Georgia.
Our strategy with respect to the consolidation efforts in the U.S. and Europe is focused on theelimination of cash fixed costs at the closed plant sites, and the transfer of business and equipment tosites in regions with lower variable costs and which are closer to our customers, as necessary andpractical, to retain the existing business with the potential to expand sales volumes.
We review our business on an ongoing basis relative to current and expected market conditions,attempting to match our production capacity and cost structure to the demands of the markets in whichwe participate, and strive to continuously streamline our manufacturing operations consistent withworld-class standards. Accordingly, in the future we may or may not decide to undertake certainrestructuring efforts to improve our competitive position, especially in the more mature markets of theU.S., Europe and Canada. In such mature markets, the prices for commodity roll goods continue tofluctuate based on supply and demand dynamics relative to the assets employed in that geographicregion. We actively and continuously pursue initiatives to prolong the useful life of our long-lived assetsthrough product and process innovation. In some instances we may decide, as was the case with ourcurrent plans to consolidate operations in the U.S., as further described in Note 3 ‘‘Special Charges,Net’’ to our consolidated financial statements included in Item 8 of Part II to this Annual Report onForm 10-K, that our fixed cost structure will be enhanced through consolidation. To the extent furtherdecisions are made to improve our long-term performance, such actions could result in the incurrence ofcash restructuring charges and asset impairment charges associated with the consolidation, and suchcharges could be material.
42

Investing and Financing Activities
Net cash used for investing activities amounted to $53.8 million and $64.3 million in 2007 and 2006,respectively. Capital expenditures during 2007 totaled $60.7 million, a decrease of $7.5 million fromcapital spending of $68.2 million in 2006. A significant portion of the capital expenditures in 2007 relatedto the construction of a new spunmelt line at our facility near Buenos Aires, Argentina and the retrofit ofan existing hydroentanglement line at our Benson, North Carolina facility to produce Spinlace�products. A significant portion of the capital expenditures in 2006 related to the construction of newspunmelt manufacturing facilities in Suzhou, China and Mooresville, North Carolina, as well as theinstallation of additional capacity in Nanhai, China. Investing activities during 2007 and 2006 includedproceeds from the sale of assets of $7.8 million and $4.3 million, respectively. We estimate our annualminimum sustaining capital expenditure to be $10.0 million to $15.0 million.
Net cash provided by financing activities amounted to $12.7 million in 2007 compared to net cashused by financing activities of $1.9 million in 2006. In 2007, we borrowed, on a net basis, $15.5 million ofdebt, primarily to fund the capital expansion in Argentina, whereas we repaid, on a net basis, $4.1 millionof debt during 2006. Additionally, in 2007, we repaid the remaining balance of $2.8 million related to anadvance we received from an equipment supplier, which advance was received in 2006. Also, we paidloan acquisition and other financing costs of $0.6 million during 2006.
Dividends
Our Board of Directors has not declared a dividend on our common stock since we emerged fromChapter 11 bankruptcy proceedings on March 5, 2003.
The Credit Facility limits restricted payments to $5.0 million, including cash dividends, in theaggregate since the effective date of the Credit Facility. We do not currently have any plans to paydividends on our common stock.
Contractual Obligations
A schedule of the required payments under existing debt agreements, the amounts due underoperating leases that have initial or non-cancellable lease terms in excess of one year as ofDecember 29, 2007 and purchase commitments as of December 29, 2007, are presented in tabular formbelow (in millions):
Payments Due by PeriodContractual Obligations Total 2008 2009 2010 2011 2012 Thereafter
Debt, including short-term borrowings . . . . . . . . . . $427.0 $11.4 $8.2 $8.2 $8.2 $376.9 $14.1
Obligations under third party/nonaffiliate operatinglease agreements . . . . . . . . . . . . . . . . . . . . . . . $ 10.7 $ 3.9 $2.7 $1.4 $1.1 $ 0.7 $ 0.9
Purchase commitments (see below) . . . . . . . . . . . $ 73.1 $73.1 — — — — —
Additionally, we expect to contribute approximately $4.0 million to our pension plans in 2008.Contributions in subsequent years will be dependent upon various factors, including actual return onplan assets, regulatory requirements and changes in actuarial assumptions such as the discount rate onprojected benefit obligations.
As noted in the table above, we have approximately $427.0 million of debt outstanding as ofDecember 29, 2007. We have fixed the interest rate on $240.0 million of the Credit Facility debt throughJune 2009 through the use of a cash flow hedge. Assuming the rate of interest remains unchanged fromDecember 29, 2007, cash interest payments would be approximately $31.2 million, $30.1 million,$29.2 million, $28.5 million and $28.0 million for 2008, 2009, 2010, 2011 and 2012, respectively.
43

The first-lien term loan requires mandatory payments of approximately $1.0 million per quarter andrequires us to use a percentage of proceeds from excess cash flows, as defined by the Credit Facilityand determined based on year-end results, to reduce our then outstanding balances under the CreditFacility. Excess cash flows required to be applied to the repayment of the Credit Facility are generallycalculated as 50.0% of the net amount of our available cash generated from operations adjusted for thecash effects of interest, taxes, capital expenditures, changes in working capital and certain other items.There are no additional amounts due currently under the excess cash flow provisions of the CreditFacility and we have included the mandatory payments of approximately $1.0 million per quarter and theapplication of the remaining proceeds in the amount of approximately $1.0 million expected to bereceived from the sale of certain property and equipment, in Current portion of long-term debt line item inour Consolidated Balance Sheet as of December 29, 2007 included in Item 8 of Part II to this AnnualReport on Form 10-K. We may, in our discretion and based on projected operating cash flows andanticipated cash requirements, elect to make additional repayments of debt under the Credit Facility inexcess of the mandatory debt repayments and excess cash flow payments.
We lease certain manufacturing, warehousing and other facilities and equipment under operatingleases. The leases on most of the properties contain renewal provisions. Rent expense (net of sub-leaseincome), including incidental leases, approximated $5.7 million, $4.3 million and $3.9 million in 2007,2006 and 2005, respectively. Rental income approximated $0.2 million in 2005. There was no rentalincome in 2007 or 2006. The expenses are recognized on a straight-line basis over the life of the lease.
At December 29, 2007, we had commitments of approximately $73.1 million related to the purchaseof raw materials, maintenance, converting services and capital projects which are expected to result incash payments during 2008. In addition, we had outstanding letters of credit at December 29, 2007 ofapproximately $10.9 million. None of these letters of credit have been drawn on at December 29, 2007.
We may be required to make significant cash outlays related to our unrecognized tax benefits.However, due to the uncertainty of the timing of future cash outflows associated with our unrecognizedtax benefits, we are unable to make reasonably reliable estimates of the period of cash settlement, if any,with the respective taxing authorities. Accordingly, unrecognized tax benefits of $14.3 million as ofDecember 29, 2007 have been excluded from the contractual obligations table above. For furtherinformation related to unrecognized tax benefits, see Note 10 to the Consolidated Financial Statementsincluded in Item 8 of Part II to this Annual Report on Form 10-K.
Liquidity Summary
As discussed more fully in Note 9 to our Consolidated Financial Statements included in Item 8 ofPart II to this Annual Report on Form 10-K, we have a Credit Facility, which we entered into onNovember 22, 2005 and amended as of December 8, 2006, which consists of a $45.0 million securedrevolving credit facility maturing in 2010 and a $410.0 million first-lien term loan that matures in 2012.
All borrowings under the Credit Facility are U.S. dollar denominated and are guaranteed, on a jointand several basis, by each and all of our direct and indirect domestic subsidiaries. The Credit Facility andthe related guarantees are secured by (i) a lien on substantially all of our assets, our domesticsubsidiaries and certain of our non-domestic subsidiaries, (ii) a pledge of all or a portion of the stock ofour domestic subsidiaries and of certain of our non-domestic subsidiaries, and (iii) a pledge of certainsecured intercompany notes. Commitment fees under the Credit Facility are equal to 0.50% of the dailyunused amount of the revolving credit commitment. The Credit Facility limits restricted payments to$5.0 million, including cash dividends, in the aggregate since the effective date of the Credit Facility. TheCredit Facility contains covenants and events of default customary for financings of this type, includingleverage and interest expense coverage covenants. The Credit Facility requires that we maintain aleverage ratio of not more than 4.50:1.00, as of December 29, 2007, with decreases over time, with thenext change occurring March 29, 2008, at which time the leverage ratio requirement will be 4.00:1:00.
44

The interest expense coverage ratio requirement at December 29, 2007 was not less than 2.50:1.00, withincreases over time, with the next change occurring March 31, 2008, at which time the requirement willbe 2.75:1.00. On December 29, 2007, our leverage ratio was 3.60:1.00 and our interest expensecoverage ratio was 3.87:1.00. Therefore, we were in compliance with the debt covenants under theCredit Facility at December 29, 2007. However, as noted above, these ratios adjust automatically,effective March 29, 2008. These ratios are calculated on a trailing four-quarter basis. As a result, anydecline in our future operating results will negatively impact our coverage ratios. While we intend toremain in compliance with these covenant requirements, the automatic adjustments as of March 29,2008 narrow the margin by which we are able to comply with the covenant requirements. Our failure tocomply with these financial covenants, without waiver or amendment from our lenders, could have amaterial adverse effect on our liquidity and operations, including limiting our ability to borrow under theCredit Facility.
The first-lien term loan requires mandatory payments of approximately $1.0 million per quarter andrequires us to use a percentage of proceeds from excess cash flows, as defined by the Credit Facilityand determined based on year-end results, to reduce our then outstanding balances under the CreditFacility. Excess cash flows required to be applied to the repayment of the Credit Facility are generallycalculated as 50.0% of the net amount of our available cash generated from operations adjusted for thecash effects of interest, taxes, capital expenditures, changes in working capital and certain other items.There are no additional amounts due currently under the excess cash flow provisions of the CreditFacility and we have included the mandatory payments of approximately $1.0 million per quarter and theapplication of the remaining proceeds in the amount of approximately $1.0 million expected to bereceived from the sale of certain property and equipment, in Current portion of long-term debt line item inour Consolidated Balance Sheet as of December 29, 2007 included in Item 8 of Part II to this AnnualReport on Form 10-K. We may, in our discretion and based on projected operating cash flows andanticipated cash requirements, elect to make additional repayments of debt under the Credit Facility inexcess of the mandatory debt repayments and excess cash flow payments.
The interest rate applicable to borrowings under the Credit Facility is based on three-month LondonInterbank Offered Rate (‘‘LIBOR’’) plus a specified margin. The applicable margin for borrowings underboth the first-lien term loan and the revolving credit facility is 225 basis points. We may, from time to time,elect to use an alternate base rate for our borrowings under the revolving credit facility based on thebank’s base rate plus a margin of 75 to 125 basis points based on our total leverage ratio. We had nooutstanding borrowings at December 29, 2007 under the revolving credit facility. As of December 29,2007, we had outstanding letters of credit in the amount of $10.9 million. None of these letters of credithave been drawn on at December 29, 2007. Average borrowings under the revolving credit facility, whichwere largely LIBOR-based borrowings, for the period from December 31, 2006 to December 29, 2007were $2.1 million at an average rate of 9.50%.
Additionally, in accordance with the terms of the Credit Facility, we maintained our position in a cashflow hedge, effectively converting $240.0 million of notional principal amount of debt from a variableLIBOR rate to a fixed LIBOR rate of 5.085%. The cash flow hedge agreement, which became effectiveMay 8, 2007, terminates on June 29, 2009. Previously, we had maintained a position in a cash flow hedgeagreement, which matured on May 8, 2007, which effectively converted $212.5 million of notionalprincipal amount of debt from a variable LIBOR rate to a fixed LIBOR rate of 3.383%.
Also, we have incurred additional debt in fiscal 2007 to finance the ongoing installation of our newspunmelt line in Argentina. As of December 29, 2007, this debt amounted to $32.1 million and we expectprincipal and interest payments to begin in June 2008 with the loans maturing in March 2016.
We have entered into factoring agreements to sell without recourse, certain of our U.S. andnon-U.S.company-based receivables to unrelated third party financial institutions. Under the terms of thefactoring agreement related to the sale of U.S. company-based receivables, the maximum amount of
45

outstanding advances at any one time is $20.0 million, which limitation is subject to change based on thelevel of eligible receivables, restrictions on concentrations of receivables and the historical performanceof the receivables sold. Under the terms of the factoring agreement related to the sale of non-U.S.company-based receivables, the maximum amount of outstanding advances at any one time is$10.0 million, which limitation is subject to change based on the level of eligible receivables, restrictionson concentrations of receivables and the historical performance of the receivables sold. The sale ofthese receivables accelerated the collection of our cash, reduced credit exposure and lowered our netborrowing costs. The Credit Facility entered into during November 2005 provides us the availability toincrease the sale of non-U.S. based receivables, under factoring agreements, to $20.0 million.
With respect to the restructuring and plant realignment activities discussed in Note 3 ‘‘SpecialCharges, Net’’ to our Consolidated Financial Statements included in Item 8 of Part II to this AnnualReport on Form 10-K, we expect to make future cash payments of approximately $7.3 million, of which$5.9 million has been accrued as of December 29, 2007. Additionally, we currently anticipate futureproceeds of approximately $6.0 million from the sale of idled facilities and equipment.
As discussed in Note 18, ‘‘Commitments and Contingencies’’ to our Consolidated FinancialStatements included in Item 8 of Part II to this Annual Report on Form 10-K, we have several majorcommitted capital projects, including the construction of a new spunmelt line at our facility near BuenosAires, Argentina and the retrofit of an existing hydroentanglement line at our Benson, North Carolinaplant to produce Spinlace� products, which projects are substantially complete at fiscal year-end, andthe installation of a new spunmelt line in San Luis Potisi, Mexico. Total remaining payments due related tothese three expansion projects as of December 29, 2007 amounted to approximately $52.5 million,which is expected to be substantially expended through the first half of fiscal 2009. As discussed morefully in Note 9 ‘‘Debt’’ to our Consolidated Financial Statements included in Item 8 of Part II to this AnnualReport on Form 10-K, we obtained local financing to fund a substantial portion of the capital expansion inArgentina. Additionally, we expect to obtain local financing subsequent to December 29, 2007 to supporta significant portion of the capital cost of the expansion in Mexico.
Based on the ability to generate positive cash flows from our operations and the financial flexibilityprovided by the Credit Facility, as amended, we believe that we have the financial resources necessaryto meet our operating needs, fund our capital expenditures and make all necessary contributions to ourretirement plans in the foreseeable future.
Off-Balance Sheet Arrangements
We do not have any off-balance sheet arrangements.
Effect of Inflation
Inflation generally affects us by increasing the costs of labor, overhead, and equipment. The impactof inflation on our financial position and results of operations was minimal during 2007, 2006 and 2005.However, we continue to be impacted by rising raw material costs. See ‘‘Quantitative and QualitativeDisclosures About Market Risk’’ included in Item 7A of Part II of this Annual Report on Form 10-K.
New Accounting Standards
In September 2006, the Financial Accounting Standards Board (‘‘FASB’’) issued SFAS No. 157,‘‘Fair Value Measurements’’ (‘‘SFAS No. 157’’). This standard defines fair value, establishes a frameworkfor measuring fair value and also provides guidance for an expanded set of disclosure requirementsrelated to fair value. SFAS No. 157 is effective in the first quarter of fiscal 2008. In February 2008, theFASB issued FASB Staff Position (‘‘FSP’’) 157-2 to defer SFAS No. 157’s effective date for all nonfinancialassets and liabilities, except those items recognized or disclosed at fair value on an annual or morefrequently occurring basis, until years beginning after November 15, 2008. We currently do not expect
46

the adoption of SFAS No. 157 to have a significant impact on the Consolidated Financial Statements;however, the prospective application of the provisions of SFAS No. 157 could materially impact ourfuture Consolidated Financial Statements.
In February 2007, the FASB issued SFAS No. 159, ‘‘The Fair Value Option for Financial Assets andFinancial Liabilities, including an amendment of FASB Statement No. 115’’ (‘‘SFAS No. 159’’). SFASNo. 159 permits companies to choose to measure certain financial instruments and other items at fairvalue, with unrealized gains and losses on items for which the fair value option has been electedreported in earnings at each subsequent reporting date. We do not expect this new accounting standardto have a significant impact on the Consolidated Financial Statements.
In December 2007, the FASB issued SFAS No. 141 (revised 2007), ‘‘Business Combinations’’(‘‘SFAS No. 141 (R)’’). SFAS No. 141(R) changes how an entity accounts for the acquisition of abusiness. While it retains the requirement to account for all business combinations using the acquisitionmethod, the new rule will apply to a wider range of transactions or events and requires, in general,acquisition-date fair value measurement of identifiable assets acquired, liabilities assumed andnoncontrolling ownership interests held in the acquiree, among other items. We are beginning to reviewthe provisions of SFAS No. 141(R)), which applies prospectively to business combinations with anacquisition date on or after the beginning of our 2009 fiscal year.
In December 2007, the FASB issued SFAS No. 160, ‘‘Noncontrolling Interests in ConsolidatedFinancial Statements: an amendment of ARB No. 51’’ (‘‘SFAS No. 160’’). SFAS No. 160 replaces the termminority interests with the newly-defined term of noncontrolling interests and establishes this line item asan element of stockholders’ equity, separate from the parent’s equity. SFAS No. 160 also includesexpanded disclosure requirements regarding the interests of the parent and its noncontrolling interest.We are continuing to review the provisions of SFAS No. 160, which is effective the first quarter of fiscal2009, and currently do not expect this new accounting standard to have a significant impact on theConsolidated Financial Statements.
No other new accounting pronouncement issued or effective during the fiscal year has had or isexpected to have a material impact on the Consolidated Financial Statements.
Critical Accounting Policies And Other Matters
The analysis and discussion of our financial position and results of operations is based upon ourconsolidated financial statements that have been prepared in accordance with accounting principlesgenerally accepted in the United States (‘‘U.S. GAAP’’). The preparation of financial statements inconformity with U.S. GAAP requires the appropriate application of certain accounting policies, many ofwhich require management to make estimates and assumptions about future events that may affect thereported amounts of assets, liabilities, revenues and expenses, and the disclosure of contingent assetsand liabilities. Since future events and their impact cannot be determined with certainty, the actual resultswill inevitably differ from the estimates. We evaluate these estimates and assumptions on an ongoingbasis including, but not limited to, those related to revenue recognition, accounts receivable, includingconcentration of credit risks, inventories, income taxes, impairment of long-lived assets, stock-basedcompensation and restructuring. Estimates and assumptions are based on historical and other factorsbelieved to be reasonable under the circumstances. The impact and any associated risks related toestimates, assumptions, and accounting policies are discussed within ‘‘Management’s Discussion andAnalysis of Financial Condition and Results of Operations,’’ as well as in the notes to the consolidatedfinancial statements, if applicable, where such estimates, assumptions, and accounting policies affectour reported and expected results.
47

We believe the following accounting policies are critical to our business operations and theunderstanding of results of operations and affect the more significant judgments and estimates used inthe preparation of our consolidated financial statements:
Revenue recognition: Revenue from product sales is recognized when title and risks of ownershippass to the customer. This is generally on the date of shipment to the customer, or upon delivery to aplace named by the customer, dependent upon contract terms and when collectibility is reasonablyassured and pricing is fixed or determinable. Revenue includes amounts billed to customers for shippingand handling. Provision for rebates, promotions, product returns and discounts to customers isrecorded as a reduction in determining revenue in the same period that the revenue is recognized. Webase our estimate of the expense to be recorded each period on historical returns and allowance levels.We do not believe the likelihood is significant that materially higher deduction levels will result based onprior experience.
Accounts receivable and concentration of credit risks: Accounts receivable potentially expose usto a concentration of credit risk, as defined by Statement of Financial Accounting Standards No. 105,‘‘Disclosure of Information about Financial Instruments with Off-Balance Sheet Risk and FinancialInstruments with Concentration of Credit Risk.’’ We provide credit in the normal course of business andperform ongoing credit evaluations on our customers’ financial condition as deemed necessary, butgenerally do not require collateral to support such receivables. We also establish an allowance fordoubtful accounts based upon factors surrounding the credit risk of specific customers, historical trendsand other information. Also, in an effort to reduce our credit exposure to certain customers, as well asaccelerate our cash flows, we sell, on a non-recourse basis, certain of our receivables pursuant tofactoring agreements. At December 29, 2007, a reserve of $5.6 million has been recorded as anallowance against trade accounts receivable. We believe that the allowance is adequate to coverpotential losses resulting from uncollectible accounts receivable and deductions resulting from salesreturns and allowances. While our credit losses have historically been within our calculated estimates, itis possible that future losses could differ significantly from these estimates.
Inventory reserves: We maintain reserves for inventories valued using the first in, first out (FIFO)method. Such reserves for inventories can be specific to certain inventory or general based onjudgments about the overall condition of the inventory. General reserves are established based onpercentage write-downs applied to inventories aged for certain time periods, or for inventories that areslow-moving. Specific reserves are established based on a determination of the obsolescence of theinventory and whether the inventory value exceeds amounts to be recovered through the expected salesprice of such inventories, less selling costs. Estimating sales prices, establishing markdownpercentages and evaluating the condition of the inventories require judgments and estimates, whichmay impact the inventory valuation and gross profits. The actual amount of obsolete or unmarketableinventory has been materially consistent with previously established reserves. We believe, based on ourprior experience of managing and evaluating the recoverability of our slow moving or obsolete inventory,that such established reserves are materially adequate. If actual market conditions and product saleswere less favorable than we have projected, additional inventory writedowns may be necessary.
Income taxes: We record an income tax valuation allowance when, based on the weight of theevidence, it is more likely than not that some portion, or all, of the deferred tax asset will not be realized.The ultimate realization of the deferred tax asset depends on our ability to generate sufficient taxableincome of the appropriate character in the future and in the appropriate taxing jurisdictions. In assessingthe realization of the deferred tax assets, consideration is given to, among other factors, the trend ofhistorical and projected future taxable income, the scheduled reversal of deferred tax liabilities, thecarryforward period for net operating losses and tax credits, as well as tax planning strategies availableto us. Additionally, we have not provided U.S. income taxes for undistributed earnings of certain foreignsubsidiaries that are considered to be retained indefinitely for reinvestment. Certain judgments,
48
assumptions and estimates are required in assessing such factors and significant changes in suchjudgments and estimates may materially affect the carrying value of the valuation allowance anddeferred income tax expense or benefit recognized in our consolidated financial statements.
We adopted FASB Interpretation No. 48, ‘‘Accounting for Uncertainty in Income Taxes, anInterpretation of FASB Statement No. 109’’ (‘‘FIN 48’’) effective December 31, 2006, the first day of fiscal2007. In accordance with FIN 48, we recognize a tax benefit associated with an uncertain tax positionwhen, in our judgment, it is more likely than not that the position will be sustained upon examination by ataxing authority. For a tax position that meets the more-likely-than-not recognition threshold, we initiallyand subsequently measure the tax benefit as the largest amount that we judge to have a greater than50% likelihood of being realized upon ultimate settlement with a taxing authority. The liability associatedwith unrecognized tax benefits is adjusted periodically due to changing circumstances, such as theprogress of tax audits, case law developments and new or emerging legislation. Such adjustments arerecognized entirely in the period in which they are identified. The effective tax rate includes the netimpact of changes in the liability for unrecognized tax benefits and subsequent adjustments asconsidered appropriate by management.
A number of years may elapse before a particular matter for which a liability related to anunrecognized tax benefit is audited and finally resolved. The number of years with open tax audits variesby jurisdiction. While it is often difficult to predict the final outcome or the timing of resolution of anyparticular tax matter, we believe our liability for unrecognized tax benefits is adequate. Favorableresolution of an unrecognized tax benefit could be recognized as a reduction in the effective tax rate inthe period of resolution. Unfavorable settlement of an unrecognized tax benefit could increase theeffective tax rate and may require the use of cash in the period of resolution. Accordingly, our futureresults may include favorable or unfavorable adjustments due to the closure of tax examinations, newregulatory or judicial pronouncements, changes in tax laws or other relevant events.
Additionally, consistent with the provisions of SOP 90-7, recognition of tax benefits frompreconfirmation net operating loss carryforwards and other deductible temporary differences notpreviously recognized will be applied to reduce goodwill to zero, then to reduce intangible assets thatexisted at the date of emergence from bankruptcy with any excess tax benefits credited directly toAdditional Paid-in Capital.
Impairment of long-lived assets: Long-lived assets, excluding goodwill, are reviewed forimpairment whenever events or changes in circumstances indicate that the carrying amounts may notbe recoverable. For assets held and used, an impairment may occur if projected undiscounted cashflows are not adequate to cover the carrying value of the assets. In such cases, additional analysis isconducted to determine the amount of the loss to be recognized. The impairment loss is determined bythe difference between the carrying amount of the asset and the fair value measured by futurediscounted cash flows. The analysis, when conducted, requires estimates of the amount and timing ofprojected cash flows and, where applicable, judgments associated with, among other factors, theappropriate discount rate. Such estimates are critical in determining whether any impairment chargeshould be recorded and the amount of such charge if an impairment loss is deemed to be necessary. Inaddition, future events impacting cash flows for existing assets could render a writedown necessary thatpreviously required no writedown.
For assets held for disposal, an impairment charge is recognized if the carrying value of the assetsexceeds the fair value less costs to sell. Estimates are required of fair value, disposal costs and the timeperiod to dispose of the assets. Such estimates are critical in determining whether any impairmentcharge should be recorded and the amount of such charge if an impairment loss is deemed to benecessary. Actual cash flows received or paid could differ from those used in estimating the impairmentloss, which would impact the impairment charge ultimately recognized. As of December 29, 2007, basedon our current operating performance, as well as future expectations for the business, we do not
49

anticipate any material writedowns for long-lived asset impairments. However, conditions coulddeteriorate, which could impact our future cash flow estimates, and there exists the potential for furtherconsolidation and restructuring in the more mature markets of the U.S., Europe and Canada, either ofwhich could result in an impairment charge that could have a material effect on our consolidatedfinancial statements.
Stock-based compensation: We account for stock-based compensation related to our employeeshare-based plans in accordance with the methodology defined in Statement of Financial AccountingStandards No. 123(R), ‘‘Share-Based Payment’’ (‘‘SFAS No. 123(R)’’). The compensation costsrecognized subsequent to the adoption of SFAS No. 123(R) related to all new grants and any unvestedportion of prior grants have been measured based on the grant-date fair value of the award. Consistentwith the provisions of SFAS No. 123(R), awards are considered granted when all required approvals areobtained and when the participant begins to benefit from, or be adversely affected by, subsequentchanges in the price of the underlying shares and, regarding awards containing performanceconditions, when we and the participant reach a mutual understanding of the key terms of theperformance conditions. Additionally, accruals for compensation costs for share-based awards withperformance conditions are based on the probability of the achievement of such performanceconditions.
We have estimated the fair value of each stock option grant by using the Black-Scholes option-pricing model. Under SFAS No. 123(R) and the option pricing model, the estimate of fair value is basedon the share price and other pertinent factors at the grant date (as defined pursuant to SFAS No. 123(R)),such as expected volatility, expected dividend yield, risk-free interest rate, forfeitures and expected lives.Assumptions are evaluated and revised, as necessary, to reflect market conditions and experience.Although we believe the assumptions are appropriate, differing assumptions would affect compensationcosts.
Restructuring: Accruals have been recorded in conjunction with our restructuring actions. Theseaccruals include estimates primarily related to facility consolidations and closures, census reductionsand contract termination costs. Actual costs may vary from these estimates. Restructuring-relatedaccruals are reviewed on a quarterly basis, and changes to the restructuring actions are appropriatelyrecognized when identified.
Environmental
We are subject to a broad range of federal, foreign, state and local laws and regulations relating tothe pollution and protection of the environment. We believe that we are currently in substantialcompliance with applicable environmental requirements and do not currently anticipate any materialadverse effect on our operations, financial or competitive position as a result of our efforts to comply withenvironmental requirements. Some risk of environmental liability is inherent, however, in the nature ofour business and, accordingly, there can be no assurance that material environmental liabilities will notarise.
50

ITEM 7A. QUANTITATIVE AND QUALITATIVE DISCLOSURES ABOUT MARKET RISK.
We are exposed to market risks for changes in foreign currency rates and interest rates and we haveexposure to commodity price risks, including prices of our primary raw materials. The overall objective ofour financial risk management program is to seek a reduction in the potential negative earnings impactof changes in interest rates, foreign exchange and raw material pricing arising in our business activities.We manage these financial exposures, where possible, through operational means and by using variousfinancial instruments. These practices may change as economic conditions change.
Long-Term Debt and Interest Rate Market Risk
Our long-term borrowings under the Credit Facility are variable interest rate debt. As such, to theextent not protected by interest rate hedge agreements, our interest expense will increase as interestrates rise and decrease as interest rates fall. It is our policy to enter into interest rate derivativetransactions only to meet our stated overall objective. We do not enter into these transactions forspeculative purposes. To that end, as further described in Notes 9 and 14 to the Consolidated FinancialStatements included in Item 8 of Part II to this Annual Report on Form 10-K, we have entered into aninterest rate swap contract which effectively converts $240.0 million of our variable-rate debt to fixed-ratedebt. The interest rate swap contract matures on June 29, 2009. Hypothetically, a 1% change in theinterest rate affecting all of our financial instruments not protected by the interest rate swap contractwould change interest expense by approximately $1.9 million.
The estimated fair value of the Company’s debt at December 29, 2007 was approximately$427.0 million, which approximated its carrying value.
Foreign Currency Exchange Rate Risk
We manufacture, market and distribute certain of our products in Europe, Canada, Latin Americaand Asia. As a result, our results of operations could be significantly affected by factors such as changesin foreign currency rates in the foreign markets in which we maintain a manufacturing or distributionpresence. However, such currency fluctuations have much less effect on local operating results becausewe, to a significant extent, sell our products within the countries in which they are manufactured. During2007 and 2006, certain currencies of countries in which we conduct foreign currency denominatedbusiness moved against the U.S. dollar and had a significant impact on sales, with a lesser effect onoperating income. See ‘‘Management’s Discussion and Analysis of Financial Condition and Results ofOperations’’ included in Item 7 of Part II to this Annual Report on Form 10-K.
We have not historically hedged our exposure to foreign currency risk. However, in most foreignoperations, there is a partial natural currency hedge due to similar amounts of costs of materials andproduction as revenues in such local currencies. Also, we periodically review our hedge strategy withrespect to our U.S. dollar exposure on certain foreign currency-based obligations such as firmcommitments related to certain capital expenditure projects. We are also subject to political risk incertain of our foreign operations and have utilized insurance programs in certain circumstances tomitigate our political risk.
Raw Material and Commodity Risks
The primary raw materials used in the manufacture of most of our products are polypropylene resin,polyester fiber, polyethylene resin, and, to a lesser extent, rayon and tissue paper. The prices ofpolypropylene, polyethylene and polyester are a function of, among other things, manufacturingcapacity, demand and the price of crude oil and natural gas liquids. We have not historically hedged ourexposure to raw material increases, but have attempted to move more customer programs to contractswith price escalation provisions which would allow us to pass-through any cost increases in rawmaterials, although there is often a delay between the time we are required to pay the increased raw
51

material price and the time that we are able to pass the increase on to our customers. Raw materialprices as a percentage of sales have increased from 53.9% in 2006 to 54.1% for 2007.
The prices of raw materials in the North American market rose substantially in the fourth quarter of2005 as a direct result of the hurricanes that impacted the Gulf Coast. The raw material prices in theNorth American markets decreased slightly since late December 2005 through the end of fiscal 2006 asthe refineries and chemical processing sites returned to more normal production levels. During fiscal2007, the North American costs have trended higher, especially in the fourth quarter. Additionally, on aglobal basis, raw material costs continue to fluctuate in response to certain global economic factors,including the regional supply versus demand dynamics for the raw materials and the volatile price of oil.
To the extent we are not able to pass along price increases of raw materials, or to the extent any suchprice increases are delayed, our cost of goods sold would increase and our operating profit wouldcorrespondingly decrease. By way of example, if the price of polypropylene were to rise $.01 per pound,and we were not able to pass along any of such increase to our customers, we would realize a decreaseof approximately $4.3 million, on an annualized basis, in our reported pre-tax operating income. Materialincreases in raw material prices that cannot be passed on to customers could have a material adverseeffect on our results of operations and financial condition. See ‘‘Management’s Discussion and Analysisof Financial Condition and Results of Operations’’ included in Item 7 of Part II to this Annual Report onForm 10-K.
52

ITEM 8. FINANCIAL STATEMENTS AND SUPPLEMENTARY DATA
Report of Grant Thornton LLP, Independent Registered Public Accounting Firm . . . . . . . . . . . 54Consolidated Balance Sheets as of December 29, 2007 and December 30, 2006 . . . . . . . . . . 55Consolidated Statements of Operations for the fiscal years ended December 29, 2007,
December 30, 2006 and December 31, 2005 . . . . . . . . . . . . . . . . . . . . . . . . . . . . . . . . . . 56Consolidated Statements of Changes in Shareholders’ Equity and Comprehensive Income
(Loss) for the fiscal years ended December 29, 2007, December 30, 2006 andDecember 31, 2005 . . . . . . . . . . . . . . . . . . . . . . . . . . . . . . . . . . . . . . . . . . . . . . . . . . . . 57
Consolidated Statements of Cash Flows for the fiscal years ended December 29, 2007,December 30, 2006 and December 31, 2005 . . . . . . . . . . . . . . . . . . . . . . . . . . . . . . . . . . 58
Notes to Consolidated Financial Statements for the fiscal years ended December 29, 2007,December 30, 2006 and December 31, 2005 . . . . . . . . . . . . . . . . . . . . . . . . . . . . . . . . . . 59
53

REPORT OF GRANT THORNTON LLP, INDEPENDENT REGISTERED PUBLIC ACCOUNTING FIRM
To the Board of Directors and Shareholders ofPolymer Group, Inc.
We have audited the accompanying consolidated balance sheets of Polymer Group, Inc. (aDelaware corporation) and subsidiaries (the Company) as of December 29, 2007 and December 30,2006, and the related consolidated statements of operations, changes in shareholders’ equity andcomprehensive income (loss) and cash flows for each of the three years in the period endedDecember 29, 2007. Our audits of the basic financial statements included the financial statementschedule listing in the index appearing under Item 15(a)(2). These financial statements and financialstatement schedule are the responsibility of the Company’s management. Our responsibility is toexpress an opinion on these financial statements and financial statement schedule based on our audits.
We conducted our audits in accordance with the standards of the Public Company AccountingOversight Board (United States). Those standards require that we plan and perform the audit to obtainreasonable assurance about whether the financial statements are free of material misstatement. An auditincludes examining, on a test basis, evidence supporting the amounts and disclosures in the financialstatements. An audit also includes assessing the accounting principles used and significant estimatesmade by management, as well as evaluating the overall financial statement presentation. We believe thatour audits provide a reasonable basis for our opinion.
In our opinion, the consolidated financial statements referred to above present fairly, in all materialrespects, the financial position of Polymer Group, Inc. and subsidiaries as of December 29, 2007 andDecember 30, 2006, and the results of their operations and their cash flows for each of the three years inthe period ended December 29, 2007, in conformity with accounting principles generally accepted in theUnited States of America. Also, in our opinion, the related financial statement schedule, whenconsidered in relation to the basic financial statements taken as a whole, presents fairly, in all materialrespects, the information set forth therein.
As discussed in the notes to consolidated financial statements, effective December 31, 2006, theCompany adopted the provisions of Financial Accounting Standards Board (FASB) InterpretationNo. 48, ‘‘Accounting for Uncertainty in Income Taxes-An Interpretation of FASB Statement No. 109’’,effective December 30, 2006, the Company adopted the provisions of FASB Statement No. 158,‘‘Employers’ Accounting for Defined Benefit Pension and Other Retirement Plans: an amendment ofFASB Statements No. 87, 88, 106, and 132(R)’’, and effective January 1, 2006, the Company adopted theprovisions of Financial Accounting Standards Board (FASB) Statement No. 123 (revised 2004), ‘‘Share-Based Payment’’.
We also have audited, in accordance with the standards of the Public Company AccountingOversight Board (United States), the effectiveness of Polymer Group, Inc. and subsidiaries’ internalcontrol over financial reporting as of December 29, 2007, based on criteria established in InternalControl—Integrated Framework, issued by the Committee of Sponsoring Organizations of the TreadwayCommission (COSO), and our report dated March 11, 2008, expressed an unqualified opinion on theeffectiveness of the Company’s internal control over financial reporting.
/s/ GRANT THORNTON LLPColumbia, South CarolinaMarch 11, 2008
54

POLYMER GROUP, INC.
CONSOLIDATED BALANCE SHEETS(In Thousands, Except Share Data)
December 29, December 30,2007 2006
A S S E T SCurrent assets:
Cash and cash equivalents . . . . . . . . . . . . . . . . . . . . . . . . . . . . . . . . . . $ 32,766 $ 32,104Accounts receivable, net . . . . . . . . . . . . . . . . . . . . . . . . . . . . . . . . . . . . 139,505 129,287Inventories . . . . . . . . . . . . . . . . . . . . . . . . . . . . . . . . . . . . . . . . . . . . . . 139,726 131,723Deferred income taxes . . . . . . . . . . . . . . . . . . . . . . . . . . . . . . . . . . . . . 2,371 2,787Other current assets . . . . . . . . . . . . . . . . . . . . . . . . . . . . . . . . . . . . . . . 25,467 19,531
Total current assets . . . . . . . . . . . . . . . . . . . . . . . . . . . . . . . . . . . . . . 339,835 315,432Property, plant and equipment, net . . . . . . . . . . . . . . . . . . . . . . . . . . . . . . . 395,394 411,054Intangibles and loan acquisition costs, net . . . . . . . . . . . . . . . . . . . . . . . . . . 9,225 10,206Deferred income taxes . . . . . . . . . . . . . . . . . . . . . . . . . . . . . . . . . . . . . . . 41 555Other assets . . . . . . . . . . . . . . . . . . . . . . . . . . . . . . . . . . . . . . . . . . . . . . 6,176 4,043
Total assets . . . . . . . . . . . . . . . . . . . . . . . . . . . . . . . . . . . . . . . . . . . $ 750,671 $741,290
L I A B I L I T I E S A N D S H A R E H O L D E R S’ E Q U I T YCurrent liabilities:
Short-term borrowings . . . . . . . . . . . . . . . . . . . . . . . . . . . . . . . . . . . . . . $ 3,654 $ 4,570Accounts payable and accrued liabilities . . . . . . . . . . . . . . . . . . . . . . . . . 150,365 143,506Income taxes payable . . . . . . . . . . . . . . . . . . . . . . . . . . . . . . . . . . . . . . 2,069 3,445Deferred income taxes . . . . . . . . . . . . . . . . . . . . . . . . . . . . . . . . . . . . . — 294Current portion of long-term debt . . . . . . . . . . . . . . . . . . . . . . . . . . . . . . 7,790 4,170
Total current liabilities . . . . . . . . . . . . . . . . . . . . . . . . . . . . . . . . . . . . . 163,878 155,985Long-term debt . . . . . . . . . . . . . . . . . . . . . . . . . . . . . . . . . . . . . . . . . . . . 415,514 402,416Deferred income taxes . . . . . . . . . . . . . . . . . . . . . . . . . . . . . . . . . . . . . . . 20,185 34,616Other noncurrent liabilities . . . . . . . . . . . . . . . . . . . . . . . . . . . . . . . . . . . . . 32,817 22,523
Total liabilities . . . . . . . . . . . . . . . . . . . . . . . . . . . . . . . . . . . . . . . . . . 632,394 615,540Minority interests . . . . . . . . . . . . . . . . . . . . . . . . . . . . . . . . . . . . . . . . . . . 19,745 16,654Shareholders’ equity:
Preferred stock—0 shares issued and outstanding . . . . . . . . . . . . . . . . . . . — —Class A common stock—19,274,415 and 19,133,728 shares issued and
outstanding at December 29, 2007 and December 30, 2006, respectively . . 193 191Class B convertible common stock—107,805 and 135,721 shares issued and
outstanding at December 29, 2007 and December 30, 2006, respectively . . 1 2Class C convertible common stock—24,319 and 24,319 shares issued and
outstanding at December 29, 2007 and December 30, 2006, respectively . . — —Class D convertible common stock—0 shares issued and outstanding . . . . . — —Class E convertible common stock—0 shares issued and outstanding . . . . . — —Additional paid-in capital . . . . . . . . . . . . . . . . . . . . . . . . . . . . . . . . . . . . 190,147 173,368Retained earnings (deficit) . . . . . . . . . . . . . . . . . . . . . . . . . . . . . . . . . . . (136,442) (89,352)Accumulated other comprehensive income . . . . . . . . . . . . . . . . . . . . . . . . 44,633 24,887
Total shareholders’ equity . . . . . . . . . . . . . . . . . . . . . . . . . . . . . . . . . . 98,532 109,096
Total liabilities and shareholders’ equity . . . . . . . . . . . . . . . . . . . . . . . $ 750,671 $741,290
See accompanying notes to Consolidated Financial Statements.
55

POLYMER GROUP, INC.
CONSOLIDATED STATEMENTS OF OPERATIONS(In Thousands, Except Per Share Data)
Fiscal Year EndedDecember 29, December 30, December 31,
2007 2006 2005
Net sales . . . . . . . . . . . . . . . . . . . . . . . . . . . . . . . . . . . $1,059,663 $1,021,608 $948,848Cost of goods sold . . . . . . . . . . . . . . . . . . . . . . . . . . . . 890,800 865,405 787,369
Gross profit . . . . . . . . . . . . . . . . . . . . . . . . . . . . . . . . . 168,863 156,203 161,479Selling, general and administrative expenses . . . . . . . . . 108,122 110,406 104,545Special charges, net . . . . . . . . . . . . . . . . . . . . . . . . . . . 61,734 38,683 9Foreign currency (gain) loss, net . . . . . . . . . . . . . . . . . . (554) 1,229 671
Operating income (loss) . . . . . . . . . . . . . . . . . . . . . . . . (439) 5,885 56,254Other expense (income):
Interest expense, net . . . . . . . . . . . . . . . . . . . . . . . . . 32,377 29,248 32,617Write-off of loan acquisition costs . . . . . . . . . . . . . . . . — — 4,008Foreign currency and other (gain) loss, net . . . . . . . . . (2,494) 517 (948)
Income (loss) before income tax expense and minorityinterests . . . . . . . . . . . . . . . . . . . . . . . . . . . . . . . . . . (30,322) (23,880) 20,577
Income tax expense . . . . . . . . . . . . . . . . . . . . . . . . . . . 8,838 8,457 10,885Minority interests, net of tax . . . . . . . . . . . . . . . . . . . . . . 1,986 2,195 2,695
Net income (loss) . . . . . . . . . . . . . . . . . . . . . . . . . . . . . (41,146) (34,532) 6,997Accrued and paid-in-kind dividends on PIK preferred
shares . . . . . . . . . . . . . . . . . . . . . . . . . . . . . . . . . . . — — 27,998
Loss applicable to common shareholders . . . . . . . . . . . $ (41,146) $ (34,532) $ (21,001)
Loss per common share—Basic:Average common shares outstanding . . . . . . . . . . . . . 19,361 19,295 13,098Loss per common share . . . . . . . . . . . . . . . . . . . . . . $ (2.13) $ (1.79) $ (1.60)
Loss per common share—Diluted:Average common shares outstanding . . . . . . . . . . . . . 19,361 19,295 13,098Loss per common share . . . . . . . . . . . . . . . . . . . . . . $ (2.13) $ (1.79) $ (1.60)
See accompanying notes to Consolidated Financial Statements.
56

POLYMER GROUP, INC.
CONSOLIDATED STATEMENTS OF CHANGES IN SHAREHOLDERS’ EQUITY
AND COMPREHENSIVE INCOME (LOSS)
For the Fiscal Years Ended December 29, 2007, December 30, 2006 and December 31, 2005
(In Thousands)
AccumulatedAdditional Retained OtherCommon Stock Paid-in Earnings Comprehensive Comprehensive
Shares Amount Capital (Deficit) Income (Loss) Total Income (Loss)
Balance—January 1, 2005 . . . . . . . . . . . 10,378 $104 $ 77,219 $ (33,819) $30,345 $ 73,849Net income . . . . . . . . . . . . . . . . . . . . — — 6,997 — 6,997 $ 6,997Accrued dividends on PIK preferred shares — 23,349 (27,998) — (4,649) —Cash flow hedge adjustment, net of
reclassification adjustment . . . . . . . . . — — — 3,545 3,545 3,545Compensation recognized on share-based
awards . . . . . . . . . . . . . . . . . . . . . 46 — 2,243 — — 2,243 —Conversion and redemption of PIK
preferred shares to Class A commonstock . . . . . . . . . . . . . . . . . . . . . . 8,629 86 62,841 — — 62,927 —
Minimum pension liability, net of tax . . . . . — — — (1,592) (1,592) (1,592)Currency translation adjustments, net of tax . — — — (11,838) (11,838) (11,838)
Balance—December 31, 2005 . . . . . . . . 19,053 190 165,652 (54,820) 20,460 131,482$ (2,888)
Net loss . . . . . . . . . . . . . . . . . . . . . . — — (34,532) — (34,532) $(34,532)Cash flow hedge adjustment, net of
reclassification adjustment . . . . . . . . . — — — (2,370) (2,370) (2,370)Compensation recognized on share-based
awards . . . . . . . . . . . . . . . . . . . . . 289 3 4,914 — — 4,917 —Surrender of shares to satisfy employee
withholding tax obligations . . . . . . . . . (48) — (1,266) — — (1,266) —Adjustment to initially apply FASB
Statement No. 158, net of tax . . . . . . . — — — 2,724 2,724 —Minimum pension liability, net of tax . . . . . — — — (9,093) (9,093) (9,093)Recognition of tax benefits from utilization
of preconfirmation net operating losscarryforwards and other tax attributes . . — 4,068 — — 4,068 —
Currency translation adjustments, net of tax . — — — 13,166 13,166 13,166
Balance—December 30, 2006 . . . . . . . . 19,294 $193 $173,368 $ (89,352) $24,887 $109,096$(32,829)
Net loss . . . . . . . . . . . . . . . . . . . . . . — — (41,146) — (41,146) $(41,146)Cash flow hedge adjustment, net of
reclassification adjustment . . . . . . . . . — — — (5,759) (5,759) (5,759)Compensation recognized on share-based
awards . . . . . . . . . . . . . . . . . . . . . 126 1 2,652 — — 2,653 —Surrender of shares to satisfy employee
withholding tax obligations . . . . . . . . . (13) — (294) — — (294) —Adjustment to initially apply FASB
Interpretation No. 48 . . . . . . . . . . . . . — 13,078 (5,944) — 7,134 —Amortization of unrecognized actuarial
losses, prior service cost and transitionobligation, net of tax . . . . . . . . . . . . . — — — 6,034 6,034 6,034
Recognition of tax benefits from utilizationof preconfirmation net operating losscarryforwards and other tax attributes . . — 1,343 — — 1,343 —
Currency translation adjustments, net of tax . — — — 19,471 19,471 19,471
Balance—December 29, 2007 . . . . . . . . 19,407 $194 $190,147 $(136,442) $44,633 $ 98,532
$(21,400)
See accompanying notes to Consolidated Financial Statements.
57

POLYMER GROUP, INC.
CONSOLIDATED STATEMENTS OF CASH FLOWS
(In Thousands)
Fiscal Year EndedDecember 29, December 30, December 31,
2007 2006 2005
Operating activities:Net income (loss) . . . . . . . . . . . . . . . . . . . . . . . . . . . $(41,146) $(34,532) $ 6,997
Adjustments to reconcile net income (loss) to netcash provided by operating activities:Asset impairment charges . . . . . . . . . . . . . . . . . . 37,445 26,434 —Investment and other gains . . . . . . . . . . . . . . . . . (3,462) (734) (1,298)Settlement of employee benefit plans (gain) loss,
net . . . . . . . . . . . . . . . . . . . . . . . . . . . . . . . . . 546 — —Deferred income taxes . . . . . . . . . . . . . . . . . . . . 3,368 (1,728) 7,228Write-off of loan acquisition costs . . . . . . . . . . . . . — — 4,008Depreciation and amortization . . . . . . . . . . . . . . . 58,199 60,663 57,550Noncash compensation . . . . . . . . . . . . . . . . . . . . 2,653 4,917 2,243
Changes in operating assets and liabilities:Accounts receivable, net . . . . . . . . . . . . . . . . . (3,746) (5,942) (11,632)Inventories . . . . . . . . . . . . . . . . . . . . . . . . . . . 26 (9,236) (16,413)Other current assets . . . . . . . . . . . . . . . . . . . . (5,936) 3,170 15,383Accounts payable and accrued liabilities . . . . . . (4,293) 24,111 16,767Other, net . . . . . . . . . . . . . . . . . . . . . . . . . . . . (3,612) (363) (9,901)
Net cash provided by operating activities . . . . . . . . . . 40,042 66,760 70,932
Investing activities:Purchases of property, plant and equipment . . . . . . . . (60,720) (68,167) (78,902)Proceeds from sale of assets . . . . . . . . . . . . . . . . . . . 7,841 4,306 1,298Acquisition of intangibles and other . . . . . . . . . . . . . . (952) (407) —
Net cash used in investing activities . . . . . . . . . . . . . . (53,831) (64,268) (77,604)
Financing activities:Proceeds from borrowings . . . . . . . . . . . . . . . . . . . . . 62,514 67,827 471,824Repayment of borrowings . . . . . . . . . . . . . . . . . . . . . (46,989) (71,952) (470,575)Advances from / (to) equipment supplier . . . . . . . . . . . (2,792) 2,792 —Other, net . . . . . . . . . . . . . . . . . . . . . . . . . . . . . . . . . (14) (601) (3,737)
Net cash provided by (used in) financing activities . . . . 12,719 (1,934) (2,488)
Effect of exchange rate changes on cash . . . . . . . . . . . . 1,732 583 (1,173)
Net increase (decrease) in cash and cash equivalents . . 662 1,141 (10,333)Cash and cash equivalents at beginning of period . . . . . 32,104 30,963 41,296
Cash and cash equivalents at end of period . . . . . . . . . . $ 32,766 $ 32,104 $ 30,963
See accompanying notes to Consolidated Financial Statements.
58

POLYMER GROUP, INC.
NOTES TO CONSOLIDATED FINANCIAL STATEMENTS
Note 1. Background and Basis of Consolidation
Background
Polymer Group, Inc. (the ‘‘Company’’) is a publicly-traded, leading global innovator, manufacturerand marketer of engineered materials, focused primarily on the production of nonwoven products. TheCompany has one of the largest global platforms in the industry, with 18 manufacturing and convertingfacilities throughout the world, and a presence in eight countries. The Company’s main sources ofrevenue are the sales of primary and intermediate products to the medical, hygiene, wipes, industrialand specialty markets.
The Company, upon having its Modified Plan, as defined (the ‘‘Modified Plan’’), approved by theBankruptcy Court on January 16, 2003, emerged from Chapter 11 bankruptcy proceedings effectiveMarch 5, 2003 (the ‘‘Effective Date’’). For accounting purposes the Company recognized the emergenceon March 1, 2003, which was the end of the February 2003 accounting period. In accordance with AICPAStatement of Position 90-7, ‘‘Financial Reporting of Entities in Reorganization under the BankruptcyCode (‘‘SOP 90-7’’), the Company adopted fresh-start accounting as of March 1, 2003, and theCompany’s emergence from Chapter 11 resulted in a new reporting entity. The reorganization value ofthe Company has been allocated to the underlying assets and liabilities based on their respective fairvalues at the date of emergence.
Basis of Consolidation
The accompanying Consolidated Financial Statements include the accounts of Polymer Group, Inc.and all majority-owned subsidiaries after elimination of all significant intercompany accounts andtransactions. The accounts of all foreign subsidiaries have been included on the basis of fiscal periodsended on the same dates as the accompanying Consolidated Financial Statements. All amounts arepresented in United States (‘‘U.S.’’) dollars, unless otherwise noted.
Note 2. Accounting Policies and Financial Statement Information
Fiscal Year
The Company’s fiscal year ends on the Saturday nearest to December 31. Fiscal 2007 endedDecember 29, 2007, fiscal 2006 ended December 30, 2006 and fiscal 2005 ended December 31, 2005.Each of these periods included the results of operations for a fifty-two week period.
Reclassifications
Certain amounts previously presented in the Consolidated Financial Statements for prior periodshave been reclassified to conform with the current year classification.
Use of Estimates
The preparation of financial statements in conformity with accounting principles generally acceptedin the U.S. requires management to make estimates and assumptions that affect the amounts reported inthe financial statements and accompanying notes. The accounting estimates that requiremanagement’s most significant judgments include the valuation of allowances for accounts receivableand inventory, the assessment of recoverability of long-lived assets, the recognition of severance-relatedliabilities, the recognition and measurement of current and deferred income tax assets and liabilities andrecognition of share-based compensation. These estimates are reviewed periodically to determine if achange is required. Actual results could differ from those estimates.
59

POLYMER GROUP, INC.
NOTES TO CONSOLIDATED FINANCIAL STATEMENTS—(Continued)
An allowance for doubtful accounts is established by the Company based upon factors includingthe credit risk of specific customers, the age of the receivables, historical trends and other information.Management believes that the allowance is adequate to cover potential losses resulting fromuncollectible accounts. Additionally, sales returns and allowances, a component of net sales, arerecorded in the period in which the related sales are recorded. Management bases its estimate of theexpense to be recorded each period on historical return and allowance levels.
The Company maintains reserves for inventories valued primarily using the first in, first out (‘‘FIFO’’)method. Such reserves for inventories can be specific to certain inventory or based on age or judgmentsabout the overall condition of the inventory. General reserves are established based on percentagewrite-downs applied to inventories aged for certain time periods or for inventories which are consideredslow-moving. Specific reserves are established based on a determination of the obsolescence of theinventory and whether the inventory value exceeds amounts to be recovered through expected salesprice, less selling costs. Estimating sales prices, establishing write-down percentages and evaluatingthe condition of the inventories require judgments and estimates, which may impact the inventoryvaluation and gross profits.
Long-lived assets are reviewed for impairment whenever events or changes in circumstancesindicate that the carrying amounts may not be recoverable. For assets held and used, an impairmentmay occur if projected undiscounted cash flows are not adequate to cover the carrying value of theassets. In such cases, additional analysis is conducted to determine the amount of the loss to berecognized. The impairment loss is determined by the difference between the carrying amount of theasset and the fair value of the asset, primarily measured by future discounted cash flows and otherindicators of fair value. The analysis, when conducted, requires estimates of the amount and timing ofprojected cash flows and, where applicable, judgments associated with, among other factors, theappropriate discount rate. Such estimates are critical in determining whether any impairment chargeshould be recorded and the amount of such charge if an impairment loss is deemed to be necessary. Inaddition, future events impacting the amount, and/or timing, of cash flows for existing assets couldrender a write-down necessary that previously required no write-down.
For assets held for disposal, an impairment charge is recognized if the carrying value of the assetsexceeds the fair value less costs to sell. Estimates are required of fair value, disposal costs and the timeperiod to dispose of the assets. Such estimates are critical in determining whether any impairmentcharge should be recorded and the amount of such charge if an impairment loss is deemed to benecessary. Actual cash flows received could differ from those used in estimating the impairment loss,which would impact the impairment charge ultimately recognized.
In fiscal 2005 the Company recorded the accretion of dividends on the 16% Series A ConvertiblePay-in-kind Preferred Shares (the ‘‘PIK Preferred Shares’’) based on the stated rate of 16.0% in the PIKPreferred Shares. If the Company’s Board of Directors, at the date of any dividend declaration, elected tosatisfy the dividend obligation by payment-in-kind, the Company recognized an additional dividendcharge for the excess, if any, of the fair value of the additional PIK Preferred Shares issued, at thedividend declaration date, over the amounts previously accrued at the stated rate. As the Company’s PIKPreferred Shares were not traded on an active market, determination of the fair value of the securities, atthe date of dividend declaration, required estimates and judgments, which may have impacted thevaluation of the dividends paid-in-kind. Based on the fact that the PIK Preferred Shares were deep-in-themoney, the Company estimated the fair value of the PIK Preferred Shares using the number of shares ofthe Company’s Class A Common Stock into which the PIK Preferred Shares were convertible at thethen-current share price of the Company’s Class A Common Stock. While the Company believes its
60

POLYMER GROUP, INC.
NOTES TO CONSOLIDATED FINANCIAL STATEMENTS—(Continued)
estimates of the fair value of the PIK Preferred Shares are reasonable, the utilization of differentassumptions could produce materially different fair value estimates.
The Company has pension and postretirement plans with costs and obligations which aredependent on assumptions used by actuaries in calculating such amounts. These assumptions includediscount rates, inflation rates, salary growth percentages, long-term return on plan assets, retirementrates, mortality rates and other factors. While the Company believes that the assumptions used areappropriate, significant differences in actual experience or significant changes in assumptions wouldaffect its pension and postretirement costs and obligations.
The Company estimates the fair value of stock option grants for measuring compensation costsusing the Black-Scholes option-pricing model, which model is dependent on certain assumptions.These assumptions are evaluated and revised, as necessary, to reflect market conditions andexperience and include expected dividend yield, expected volatility, risk-free interest rate, forfeitures andexpected lives. Although the Company believes the assumptions utilized are appropriate, differingassumptions would affect compensation costs.
The Company has estimated the fair values of financial instruments as required by Statement ofFinancial Accounting Standards (‘‘SFAS’’) No. 107, ‘‘Disclosures about Fair Value of FinancialInstruments,’’ using available market information and appropriate valuation methodologies. However,considerable judgment is required in interpreting market data to develop estimates of fair value fornon-traded financial instruments. Accordingly, such estimates are not necessarily indicative of theamounts that the Company would realize in a current market exchange. The carrying amount of cashand cash equivalents, accounts receivable, inventories, other current assets and accounts payable andaccrued liabilities are reasonable estimates of their fair values. Fair value of the Company’s debt wasestimated using interest rates at those dates for issuance of such financial instruments with similar terms,credit ratings and remaining maturities. The estimated fair value of debt, based on such valuationmethodologies, at December 29, 2007 and December 30, 2006 was $407.0 million and $411.2 million,respectively.
Revenue Recognition
Revenue from product sales is recognized when title and risks of ownership pass to the customer.This is generally on the date of shipment to the customer, or upon delivery to a place named by thecustomer, dependent upon contract terms and when collectibility is reasonably assured and pricing isfixed or determinable. Revenue includes amounts billed to customers for shipping and handling.Provision for rebates, promotions, product returns and discounts to customers is recorded as areduction in determining revenue in the same period that the revenue is recognized.
Cash Equivalents
Cash equivalents are defined as short-term investments having an original maturity of three monthsor less. Interest income is presented as a reduction of Interest expense, net in the accompanyingConsolidated Statements of Operations and consists primarily of income from highly liquid investmentsources. Interest income approximated $0.7 million, $0.5 million and $1.0 million during fiscal years2007, 2006 and 2005, respectively.
Accounts Receivable and Concentration of Credit Risks
Accounts receivable potentially expose the Company to a concentration of credit risk, as defined bySFAS No. 105, ‘‘Disclosure of Information about Financial Instruments with Off-Balance Sheet Risk and
61

POLYMER GROUP, INC.
NOTES TO CONSOLIDATED FINANCIAL STATEMENTS—(Continued)
Financial Instruments with Concentration of Credit Risk.’’ The Company provides credit in the normalcourse of business and performs ongoing credit evaluations on its customers’ financial condition, asdeemed necessary, but generally does not require collateral to support such receivables. Customerbalances are considered past due based on contractual terms and the Company does not accrueinterest on the past due balances. Also, in an effort to reduce its credit exposure to certain customers, aswell as accelerate its cash flows, the Company has sold on a non-recourse basis, certain of itsreceivables pursuant to factoring agreements. The provision for losses on uncollectible accounts isdetermined principally on the basis of past collection experience applied to ongoing evaluations of theCompany’s receivables and evaluations of the risk of repayment. The allowance for doubtful accountswas approximately $5.6 million and $7.6 million at December 29, 2007 and December 30, 2006,respectively, which management believes is adequate to provide for credit losses in the normal course ofbusiness, as well as losses for customers who have filed for protection under bankruptcy laws. Oncemanagement determines that the receivables are not recoverable, the amounts are removed from thefinancial records along with the corresponding reserve balance. With respect to the $2.0 milliondecrease in the allowance for doubtful accounts from December 30, 2006 to December 29, 2007,$1.3 million of such decrease related to the write-off of specifically identified uncollectible accountsreceivable and the corresponding reserves. Sales to The Procter & Gamble Company (‘‘P&G’’)accounted for 12%, 13% and 14% of the Company’s sales in fiscal years 2007, 2006 and 2005,respectively.
Inventories
Inventories are stated at the lower of cost or market primarily using the FIFO method of accounting.
Long-Lived Assets
Property, plant and equipment is stated at cost less accumulated depreciation. Depreciation iscomputed for financial reporting purposes on the straight-line method over the estimated useful lives ofthe related assets. The estimated useful lives established for building and improvements range from 5 to31 years, and the estimated useful lives established for machinery, equipment and other fixed assetsrange from 2 to 15 years. Costs of repairs and maintenance are charged to expense as incurred. Costs ofthe construction of certain long-lived assets include capitalized interest that is amortized over theestimated useful life of the related asset. The Company capitalized approximately $2.3 million,$3.1 million and $2.2 million of interest costs during fiscal years 2007, 2006 and 2005, respectively.
Derivatives
The Company records all derivative instruments as either assets or liabilities on the balance sheet attheir fair value in accordance with SFAS No. 133, ‘‘Accounting for Derivative Financial Instruments andHedging Activities’’, as amended (‘‘SFAS No. 133’’). Changes in the fair value of a derivative arerecorded each period in current earnings or other comprehensive income, depending on whether aderivative is designated as part of a hedge transaction and, if it is, depending on the type of hedgetransaction. Ineffective portions, if any, of all hedges are recognized in current period earnings.
As more fully described in Note 14 to the Consolidated Financial Statements, the Company, in thenormal course of business, periodically enters into derivative financial instruments, principally swapsand forward contracts, with high-quality counterparties as part of its risk management strategy. Thesefinancial instruments are limited to non-trading purposes and are used principally to manage marketrisks and reduce the Company’s exposure to fluctuations in foreign currency and interest rates. Most
62

POLYMER GROUP, INC.
NOTES TO CONSOLIDATED FINANCIAL STATEMENTS—(Continued)
interest rate swaps and foreign exchange forward contracts are designated as cash flow hedges ofvariable rate debt obligations or fair value hedges of foreign currency-denominated transactions.
The Company documents all relationships between hedging instruments and hedged items, as wellas the risk-management objective and strategy for undertaking various hedge transactions and themethodologies that will be used for measuring effectiveness and ineffectiveness. This process includeslinking all derivatives that are designated as cash flow or fair value hedges to specific assets andliabilities on the balance sheet or to specific firm commitments. The Company then assesses, both at thehedge’s inception and on an ongoing basis, whether the derivatives that are used in hedgingtransactions are expected to be highly effective in offsetting changes in fair values or cash flows ofhedged items. Such assessments are conducted in accordance with the originally documented riskmanagement strategy and methodology for that particular hedging relationship.
For cash flow hedges, the effective portion of recognized derivative gains and losses reclassifiedfrom other comprehensive income is classified consistent with the classification of the hedged item. Forexample, derivative gains and losses associated with hedges of interest rate payments are recognized inInterest expense, net in the Consolidated Statements of Operations.
For fair value hedges, changes in the value of the derivatives, along with the offsetting changes inthe fair value of the underlying hedged exposure are recorded in earnings each period in Foreigncurrency and other (gain) loss, net in the Consolidated Statements of Operations.
Income Taxes
The provision for income taxes and corresponding balance sheet accounts are determined inaccordance with the liability method. Tax provisions and credits are recorded at statutory rates fortaxable items included in the Consolidated Statements of Operations regardless of the period for whichsuch items are reported for tax purposes. Additionally, federal income taxes are provided on that portionof the income of foreign subsidiaries that is expected to be remitted to the U.S. and be taxable. Deferredtax liabilities and assets are determined based upon temporary differences between the basis of certainassets and liabilities for income tax and financial reporting purposes. A valuation allowance isestablished when it is more likely than not that some portion of a deferred tax asset will not be realized inthe future. Valuation allowances are reviewed each period on a tax jurisdiction by jurisdiction basis toanalyze whether a change in circumstances has occurred to provide enough evidence to support achange in the judgment about the realization of the related deferred tax asset in future years. Consistentwith the provisions of SOP 90-7, recognition of tax benefits from preconfirmation net operating losscarryforwards and deductible temporary differences and other tax attributes not recognized at theEffective Date are applied to reduce goodwill to zero, then reduce intangible assets that existed at theEffective Date with any excess tax benefits credited directly to Additional Paid-in Capital.
On December 31, 2006, the first day of fiscal 2007, the Company adopted the provisions of FinancialAccounting Standards Board (‘‘FASB’’) Interpretation No. 48, ‘‘Accounting for Uncertainty in IncomeTaxes, an Interpretation of FASB Statement No. 109’’ (‘‘FIN 48’’) and FASB Staff Position No. FIN 48-1,‘‘Definition of Settlement in FASB Interpretation No. 48.’’ FIN 48 clarifies the accounting for uncertainty inincome taxes recognized in an enterprise’s financial statements in accordance with FASB StatementNo. 109, ‘‘Accounting for Income Taxes,’’ by prescribing a recognition threshold and measurementattribute for the financial statement recognition and measurement of a tax position taken or expected tobe taken in a tax return. Under FIN 48, the financial statement effects of a tax position should initially berecognized when it is more likely than not, based on the technical merits, that the position will besustained upon examination. A tax position that meets the more-likely-than-not recognition threshold
63

POLYMER GROUP, INC.
NOTES TO CONSOLIDATED FINANCIAL STATEMENTS—(Continued)
should initially and subsequently be measured as the largest amount of tax benefit that has a greaterthan 50% likelihood of being realized upon ultimate settlement with a taxing authority.
As a result of the implementation of FIN 48, the Company increased the liability for unrecognized taxbenefits by $5.9 million and reduced retained earnings by $5.9 million for the cumulative effect ofapplying the standard. Additionally, with respect to pre-emergence tax positions, consistent with theprovisions of AICPA Statement of Position 90-7 ‘‘Financial Reporting of Entities in Reorganization underthe Bankruptcy Code’’ (‘‘SOP 90-7’’), the Company increased the liability for unrecognized tax benefits,included in Other noncurrent liabilities in the Consolidated Balance Sheet, by $2.4 million, decreaseddeferred tax liabilities by $15.4 million, increased deferred tax assets by $0.1 million and increasedadditional paid-in capital by $13.1 million. With respect to the net $8.3 million liability recorded forunrecognized tax benefits upon the adoption of FIN 48, $5.0 million represents penalties and interest.
Additionally, during fiscal 2007, the Company increased its unrecognized tax benefits by$4.6 million, which included $1.5 million of interest and penalties. Accordingly, of the total unrecognizedtax benefits of $14.3 million, $10.5 million represents the amount of unrecognized tax benefits that, ifrecognized, would affect the effective tax rate in future periods. There have not been any decreases orreductions in the unrecognized tax benefits, since the adoption of FIN 48, relating to settlements withtaxing authorities or as a result of a lapse of the applicable statute of limitations.
The major jurisdictions where the Company files income tax returns include the United States,Canada, China, The Netherlands, France, Germany, Mexico, Colombia, and Argentina. The U.S. federaltax returns have been examined through fiscal 2004 and the foreign jurisdictions generally remain openand subject to examination by the relevant tax authorities for the tax years 2001 through 2007.
The Company continues to recognize interest and/or penalties related to income taxes as acomponent of income tax expense.
Stock-Based Compensation
The Company accounts for stock-based compensation related to its employee share-based plansin accordance with the methodology defined in Statement of Financial Accounting StandardsNo. 123(R), ‘‘Share-Based Payment’’ (‘‘SFAS No. 123(R)’’), using the modified prospective transitionmethod. The compensation costs recognized subsequent to the adoption of SFAS No. 123(R) related toall new grants and any unvested portion of prior grants are measured based on the grant-date fair valueof the award. Consistent with the provisions of SFAS No. 123(R), awards are considered granted whenall required approvals are obtained and when the participant begins to benefit from, or be adverselyaffected by, subsequent changes in the price of the underlying shares and, regarding awards containingperformance conditions, when the Company and the participant reach a mutual understanding of thekey terms of the performance conditions. Additionally, accruals for compensation costs for share-basedawards with performance conditions are based on the probability of the achievement of suchperformance conditions.
The Company has estimated the fair value of each stock option grant by using the Black-Scholesoption-pricing model. Assumptions are evaluated and revised, as necessary, to reflect market conditionsand experience. See Note 12 to the Consolidated Financial Statements for assumptions utilized in theestimation of grant date fair value pursuant to SFAS No. 123(R).
64

POLYMER GROUP, INC.
NOTES TO CONSOLIDATED FINANCIAL STATEMENTS—(Continued)
Prior to fiscal 2006, the Company accounted for stock options granted under the Polymer Group, Inc.2003 Stock Option Plan (‘‘2003 Option Plan’’) in accordance with the intrinsic value method asprescribed by Accounting Principles Board Opinion No. 25 ‘‘Accounting for Stock Issued to Employees’’(‘‘APB No. 25’’), which generally measured compensation cost as the excess, if any, of the quotedmarket price of the stock at the date of grant over the amount an employee must pay to acquire thestock. Certain options issued under the 2003 Option Plan contain performance conditions which providethat the number of shares that an employee is entitled to receive is dependent upon the Company’sachievement of certain performance criteria. Accordingly, the Company accounted for these grants asawards under a variable plan and, consistent with the provisions of APB No. 25, recognizedcompensation expense each period from the date of grant to the date of measurement based on thequoted market price of the Company’s Class A Common Stock at the end of each reporting period, lessthe amount that the employee was required to pay. The pro forma effect of utilizing SFAS No. 123(R) onthe financial results for the fiscal year ended December 31, 2005 was as follows (in thousands, exceptper share data):
2005
Net income (loss):As reported . . . . . . . . . . . . . . . . . . . . . . . . . . . . . . . . . . . . . . . . . . $ 6,997Add: stock-based employee compensation expense, net of tax,
included in reported net income (loss) . . . . . . . . . . . . . . . . . . . . . 2,202Deduct: stock-based employee compensation expense, net of tax,
determined under SFAS No. 123(R) . . . . . . . . . . . . . . . . . . . . . . . (975)
Pro forma . . . . . . . . . . . . . . . . . . . . . . . . . . . . . . . . . . . . . . . . . . . $ 8,224
Income (loss) applicable to common shareholders:As reported . . . . . . . . . . . . . . . . . . . . . . . . . . . . . . . . . . . . . . . . . . $(21,001)Add: stock-based employee compensation expense, net of tax,
included in reported net income (loss) . . . . . . . . . . . . . . . . . . . . . 2,202Deduct: stock-based employee compensation expense, net of tax,
determined under SFAS No. 123(R) . . . . . . . . . . . . . . . . . . . . . . . (975)
Pro forma . . . . . . . . . . . . . . . . . . . . . . . . . . . . . . . . . . . . . . . . . . . $(19,774)
Loss per common share applicable to common shareholders—basic:As reported . . . . . . . . . . . . . . . . . . . . . . . . . . . . . . . . . . . . . . . . . . $ (1.60)Pro forma . . . . . . . . . . . . . . . . . . . . . . . . . . . . . . . . . . . . . . . . . . . (1.51)
Loss per common share applicable to common shareholders—diluted:As reported . . . . . . . . . . . . . . . . . . . . . . . . . . . . . . . . . . . . . . . . . . $ (1.60)Pro forma . . . . . . . . . . . . . . . . . . . . . . . . . . . . . . . . . . . . . . . . . . . (1.51)
Weighted average exercise price per option granted. . . . . . . . . . . . . . $ 6.00Weighted average fair value per option granted . . . . . . . . . . . . . . . . . . $ 17.95
Research and Development Costs
The cost of research and development is charged to expense as incurred and is included in Selling,general and administrative expenses in the Consolidated Statements of Operations. The Companyincurred approximately $13.7 million, $12.5 million and $11.5 million of research and developmentexpense during fiscal years 2007, 2006 and 2005, respectively.
65

POLYMER GROUP, INC.
NOTES TO CONSOLIDATED FINANCIAL STATEMENTS—(Continued)
Shipping and Handling Costs
Shipping and handling costs include costs to store goods prior to shipment, prepare goods forshipment and physically move goods from the Company’s sites to the customers’ premises. The cost ofshipping and handling is charged to expense as incurred and is included in Selling, general andadministrative expenses in the Consolidated Statements of Operations. The Company incurred$26.0 million, $25.6 million and $24.7 million of shipping and handling costs during fiscal years 2007,2006 and 2005, respectively.
Special Charges
The Company records severance-related expenses once they are both probable and estimable inaccordance with the provisions of SFAS No. 112, ‘‘Employers’ Accounting for PostemploymentBenefits,’’ (‘‘SFAS No. 112’’), for severance provided under an ongoing benefit arrangement. One-time,involuntary benefit arrangements and disposal costs, contract termination costs and other exit costs areaccounted for under the provisions of SFAS No. 146, ‘‘Accounting for Costs Associated with Exit orDisposal Activities’’ (‘‘SFAS No. 146’’). The Company evaluates impairment of long-lived assets underthe provisions of SFAS No. 144, ‘‘Accounting for the Impairment or Disposal of Long-Lived Assets’’(‘‘SFAS No. 144’’).
Foreign Currency Translation
The Company accounts for, and reports, translation of foreign currency transactions and foreigncurrency financial statements in accordance with SFAS No. 52, ‘‘Foreign Currency Translation.’’ Allassets and liabilities in the balance sheets of foreign subsidiaries whose functional currency is other thanthe U.S. dollar are translated at period-end exchange rates, while income, expenses and cash flows aretranslated at average exchange rates during the period. Translation gains and losses are not included indetermining net income, but are presented as a separate component of accumulated othercomprehensive income (loss). In addition, foreign currency transaction gains and losses are included inthe determination of net income (loss).
Accumulated Other Comprehensive Income
Accumulated other comprehensive income of $44.6 million at December 29, 2007 consisted of$50.8 million of currency translation gains (net of income taxes of $10.6 million), $1.9 million of transitionnet assets, gains or losses and prior service costs not recognized as components of net periodic benefitcosts (net of income taxes of $1.3 million) and $4.3 million of cash flow hedge losses. Accumulated othercomprehensive income of $24.9 million at December 30, 2006 consisted of $31.4 million of currencytranslation gains (net of income taxes of $6.9 million), $8.0 million of transition net assets, gains or lossesand prior service costs not recognized as components of net periodic benefit costs (net of income taxesof $1.9 million) and $1.5 million in cash flow hedge gains. Comprehensive loss for fiscal years 2007,2006 and 2005 is net of a reclassification adjustment pertaining to the cash flow hedge adjustment of$1.8 million, $3.7 million and ($0.1) million, respectively.
Comprehensive income (loss) is reported in accordance with the SFAS No. 130, ‘‘ReportingComprehensive Income’’ (‘‘SFAS No. 130’’). SFAS No. 130 requires unrealized actuarial gains andlosses, unrealized gains or losses on the Company’s available for sale securities and foreign currencytranslation adjustments, to be included in other comprehensive income.
Income (Loss) Per Common Share
Basic earnings per share exclude any dilutive effects of share-based awards and convertiblesecurities and are computed by dividing income (loss) applicable to common shareholders by the
66

POLYMER GROUP, INC.
NOTES TO CONSOLIDATED FINANCIAL STATEMENTS—(Continued)
weighted-average number of common shares outstanding for the period. Diluted earnings per sharereflect the potential dilution from common shares potentially issuable through share-based awards andconvertible securities and is computed by dividing income (loss) applicable to common shareholders,as adjusted for the effects of the conversion to common stock, by the weighted-average number ofcommon and common equivalent shares outstanding for the period. Shares issuable pursuant to stockoption plans represent common equivalent shares if the average market price for the reporting periodexceeds the strike price of the option. A reconciliation of the amounts included in the computation ofincome (loss) per share for fiscal years 2007, 2006 and 2005 is presented in the following table (inthousands):
2007 2006 2005
Income (loss):Net income (loss) . . . . . . . . . . . . . . . . . . . . . . . . . . . . . . . . . . $(41,146) $(34,532) $ 6,997Less: dividends on PIK Preferred Shares . . . . . . . . . . . . . . . . . — — 27,998
Loss applicable to common shareholders . . . . . . . . . . . . . . . . . (41,146) (34,532) (21,001)Effect of dilutive securities—convertible securities and share-
based awards . . . . . . . . . . . . . . . . . . . . . . . . . . . . . . . . . . . — — —
Loss applicable to common shareholders with assumedconversions . . . . . . . . . . . . . . . . . . . . . . . . . . . . . . . . . . . . . . $(41,146) $(34,532) $(21,001)
Outstanding shares:Weighted average common shares outstanding . . . . . . . . . . . . 19,361 19,295 13,098Effect of dilutive securities—convertible securities and share-
based awards . . . . . . . . . . . . . . . . . . . . . . . . . . . . . . . . . . . — — —Weighted average common shares outstanding—assuming
dilution . . . . . . . . . . . . . . . . . . . . . . . . . . . . . . . . . . . . . . . . 19,361 19,295 13,098
For fiscal years 2007, 2006 and 2005, the effect of potentially dilutive securities such as convertiblesecurities and share-based awards are not considered in the above table as the effects are anti-dilutive.As of December 29, 2007, the potential dilutive effect related to the exchange of such potentially dilutivesecurities would amount to 141,119 shares.
Recent Accounting Standards
In September 2006, the FASB issued SFAS No. 157, ‘‘Fair Value Measurements’’ (‘‘SFAS No. 157’’).This standard defines fair value, establishes a framework for measuring fair value and also providesguidance for an expanded set of disclosure requirements related to fair value. SFAS No. 157 is effectivein the first quarter of fiscal 2008. In February 2008, the FASB issued FASB Staff Position (‘‘FSP’’) 157-2 todefer SFAS No. 157’s effective date for all nonfinancial assets and liabilities, except those itemsrecognized or disclosed at fair value on an annual or more frequently occurring basis, until yearsbeginning after November 15, 2008. The Company currently does not expect the adoption of SFASNo. 157 to have a significant impact on the Consolidated Financial Statements; however, the prospectiveapplication of the provisions of SFAS No. 157 could materially impact the Company’s futureConsolidated Financial Statements.
In February 2007, the FASB issued SFAS No. 159, ‘‘The Fair Value Option for Financial Assets andFinancial Liabilities, including an amendment of FASB Statement No. 115’’ (‘‘SFAS No. 159’’). SFASNo. 159 permits companies to choose to measure certain financial instruments and other items at fairvalue, with unrealized gains and losses on items for which the fair value option has been elected
67

POLYMER GROUP, INC.
NOTES TO CONSOLIDATED FINANCIAL STATEMENTS—(Continued)
reported in earnings at each subsequent reporting date. The Company does not expect this newaccounting standard to have a significant impact on the Consolidated Financial Statements.
In December 2007, the FASB issued SFAS No. 141 (revised 2007), ‘‘Business Combinations’’(‘‘SFAS No. 141 (R)’’). SFAS No. 141(R) changes how an entity accounts for the acquisition of abusiness. While it retains the requirement to account for all business combinations using the acquisitionmethod, the new rule will apply to a wider range of transactions or events and requires, in general,acquisition-date fair value measurement of identifiable assets acquired, liabilities assumed andnoncontrolling ownership interests held in the acquiree, among other items. The Company is beginningto review the provisions of SFAS No. 141(R)), which applies prospectively to business combinations withan acquisition date on or after the beginning of its fiscal year 2009.
In December 2007, the FASB issued SFAS No. 160, ‘‘Noncontrolling Interests in ConsolidatedFinancial Statements: an amendment of ARB No. 51’’ (‘‘SFAS No. 160’’). SFAS No. 160 replaces the termminority interests with the newly-defined term of noncontrolling interests and establishes this line item asan element of stockholders’ equity, separate from the parent’s equity. SFAS No. 160 also includesexpanded disclosure requirements regarding the interests of the parent and its noncontrolling interest.The Company is continuing to review the provisions of SFAS No. 160, which is effective the first quarterof fiscal 2009, and currently does not expect this new accounting standard to have a significant impacton the Consolidated Financial Statements.
Note 3. Special Charges, Net
The Company’s operating income includes special charges (credits), net resulting from corporate-level decisions or Board actions, such as to consolidate and relocate its corporate offices, restructurecertain operations or pursue certain transaction opportunities. Additionally, the Company evaluates itslong-lived assets for impairment whenever events or changes in circumstances, including thoseaforementioned, indicate that the carrying amounts may not be recoverable. A summary of suchcharges (credits), net is presented in the following table (in thousands):
2007 2006 2005
Asset impairment charges . . . . . . . . . . . . . . . . . . . . $37,445 $26,434 $ —Restructuring and plant realignment costs . . . . . . . . . 23,543 7,135 9Other costs . . . . . . . . . . . . . . . . . . . . . . . . . . . . . . . 746 1,143 —Abandoned acquisition costs . . . . . . . . . . . . . . . . . . — 3,971 —
$61,734 $38,683 $ 9
Asset impairment charges
The Company reviews long-lived assets for impairment whenever events or changes incircumstances indicate that the carrying values may not be recoverable from future undiscounted cashflows. If the carrying amounts are not recoverable the Company, consistent with the provisions of SFASNo. 144, records a non-cash charge associated with the write-down of such assets to estimated fairvalue. Fair value is estimated based on the present value of expected future cash flows, appraisals andother indicators of value.
During fiscal 2007, the Company recorded non-cash impairment charges totaling $37.4 millioncomprised of: (i) a write-down of $4.1 million relating to assets of the Company’s Nonwoven segmentproduction facilities located in the U.S. which experienced a decline in profits and cash flows resultingfrom market declines and from the Company’s global repositioning of production capacity, and fromcertain other nonwovens assets which were removed from service, (ii) a write-down of $2.9 million
68

POLYMER GROUP, INC.
NOTES TO CONSOLIDATED FINANCIAL STATEMENTS—(Continued)
associated with the Company’s plans to reorganize and consolidate certain of its Nonwoven segmentoperations in Europe, which plans called for the closure of the Company’s Neunkirchen, Germany plant,and the subsequent transfer of certain of the business and equipment to the Company’s plant in Cuijk,The Netherlands, and (iii) a write-down of approximately $30.4 million, relating to assets in the OrientedPolymers segment, to estimated fair value as a result of continued weakening of sales, earnings andcash flows, and in consideration of the Company continuing negotiations with a third party whereby thethird party has offered to purchase certain business units in the Oriented Polymers segment at amountsless than their current carrying values.
The Company expects that depreciation expense will be approximately $8.7 million lower in fiscal2008 and approximately $7.8 million lower in fiscal 2009, as a result of the aforementioned non-cashimpairment charges recognized in fiscal 2007.
During fiscal 2006, the Company recorded non-cash impairment charges totaling $26.4 millioncomprised of (i) a write-down of $11.4 million for assets in the U.S., including facilities for which theCompany had announced closure plans, as well as an impairment charge taken with respect to anotherfacility, for which projected future cash flows had been negatively impacted by the loss of a majorautomotive platform and the anticipated loss of certain other business, (ii) a write-down of $7.2 millionassociated with a manufacturing line located in The Netherlands due to the expected shutdown of theline due to the loss of certain low-margin business platforms, (iii) a write-down of $5.5 million based onan impairment evaluation, consistent with the provisions of SFAS No. 144, of certain of the Company’sCanadian assets, triggered by a weakening of sales, earnings and cash flows experienced during earlyfiscal 2006, and (iv) a write-down of $2.3 million related to the initiation of the restructuring andconsolidation strategy for the European operations, which included the closure of the facility in Sweden.
Restructuring and plant realignment costs
Accrued costs for restructuring efforts are included in Accounts payable and accrued liabilities in theConsolidated Balance Sheets. These costs generally arise from restructuring initiatives intended toresult in lower working capital levels and improved operating performance and profitability through:(i) reducing headcount at both the plant and corporate levels; (ii) improving manufacturing productivityand reducing corporate costs; and (iii) rationalizing certain assets, businesses and employee benefitprograms. The following table summarizes the components of the accrued liability for fiscal years 2007,2006 and 2005 (in thousands):
2007 2006 2005
Balance accrued at beginning of year . . . . . . . . . . . $ 2,044 $ 163 $ 561Restructuring and plant realignment costs:
First Quarter . . . . . . . . . . . . . . . . . . . . . . . . . . . . 6,207 1,633 4Second Quarter . . . . . . . . . . . . . . . . . . . . . . . . . 3,068 2,740 5Third Quarter . . . . . . . . . . . . . . . . . . . . . . . . . . . 8,175 692 —Fourth Quarter . . . . . . . . . . . . . . . . . . . . . . . . . . 6,093 2,070 —
Total . . . . . . . . . . . . . . . . . . . . . . . . . . . . . . . . . . 23,543 7,135 9
Cash payments . . . . . . . . . . . . . . . . . . . . . . . . . . . (19,371) (5,284) (375)Loss on settlement of employee benefit plans, net . . (546) — —Adjustments . . . . . . . . . . . . . . . . . . . . . . . . . . . . . . 233 30 (32)
Balance accrued at end of year . . . . . . . . . . . . . . . . $ 5,903 $ 2,044 $ 163
69

POLYMER GROUP, INC.
NOTES TO CONSOLIDATED FINANCIAL STATEMENTS—(Continued)
The restructuring and plant realignment activities during fiscal 2007 primarily relate to:(i) restructuring activities in the U.S., including the Company’s closure of two plants, which wascommunicated to affected employees in January 2007, and other realignment initiatives, (ii) the closure,communicated to affected employees in July 2007, of the Neunkirchen, Germany facility, (iii) therestructuring of certain pension and other postretirement benefit plans in the U.S. and Canada, and(iv) the restructuring of certain of the Company’s Oriented Polymers operations.
In January 2007, the Company communicated a plan to affected employees that it planned to closetwo of its Nonwoven plants in the U.S., with the planned transfer of certain of the business andequipment to other Company facilities in North America and Asia. The plant closures included thereduction of approximately 170 production and administrative staff positions. As a result of therestructuring, the Company recognized employee severance, equipment relocation and otherassociated costs of approximately $8.9 million during fiscal 2007. Manufacturing activities ceased at thetwo plants as of July 31, 2007.
In October 2007, the Company communicated to its U.S. based employees a new severance planfor certain U.S. salaried employees. The plan basically provides that solely in the event that an employeeis involuntarily terminated, the employee is entitled to certain severance pay based on years of service.Also, in December 2007, the Company approved a plan to restructure certain of its Nonwovenoperations in the U.S. resulting in the centralization of certain business processes, the integration ofcertain operations and the elimination of certain positions. Based on the above plans, which areexpected to be implemented throughout fiscal 2008, the Company, consistent with the provisions ofSFAS No. 112, recognized employee severance and other associated costs of approximately$2.7 million in the fourth quarter of fiscal 2007.
In June 2007, the Company announced a plan to close its Neunkirchen, Germany plant, a facility inthe Nonwovens segment. The plant closure will include the reduction of approximately 72 positionswhen such consolidation efforts are completed in early fiscal 2008. As the details of the severancepackages were communicated to, and agreed to by, the affected employees in July 2007, the Company,consistent with the provisions of SFAS No. 146, recognized the liability for certain of such severancecosts in the second half of fiscal 2007 relating to this planned closure. During fiscal 2007, approximately$6.3 million of employee severance costs were recognized related to this plant closure, for whichproduction activities ceased as of September 29, 2007. The Company also recorded approximately$1.9 million of equipment removal and relocation costs associated with the transfer of certain equipmentto the Company’s plant in Cuijk, The Netherlands and $1.4 million of other shut-down costs related tothis plant closure in fiscal 2007.
During the first quarter of fiscal 2006, as part of its restructuring and related cost reduction initiativesfor the Oriented Polymers segment, the Company negotiated certain changes with the unionrepresenting the employees of one of the Company’s Canadian operations, including a partialcurtailment of a defined benefit pension plan. No net gain or loss was incurred as a result of the partialcurtailment. However, based on elections made by plan participants during the second quarter of fiscal2006, and as approved by Canadian regulatory authorities on January 16, 2007, the Company incurred asettlement loss associated with employees who have exited the plan. The loss incurred as a result of thepartial settlement of the defined benefit pension plan, consisting of the recognition of previouslyunamortized actuarial losses in the amount of approximately $3.8 million, was recognized in the firstquarter of fiscal 2007 commensurate with governmental approval of the terms of the settlement andupon fulfillment by the Company of its funding requirements in February 2007. Additionally, theCompany approved amendments to various postretirement benefit plans in the U.S. which curtailed oreliminated defined benefits previously available under the plans. The amendments, as adopted,
70

POLYMER GROUP, INC.
NOTES TO CONSOLIDATED FINANCIAL STATEMENTS—(Continued)
eliminated the postretirement benefit for all current retirees of the Company, and substantially all activeemployees, as of the end of fiscal 2007. In accordance with SFAS No. 106 ‘‘Employers’ Accounting forPostretirement Benefits Other Than Pensions’’ (as amended), the Company recognized a gain in thefourth quarter of fiscal 2007 of approximately $3.3 million on the settlement of such plans.
The Company has initiated certain restructuring initiatives pertaining to Oriented Polymersoperations located in the U.S. During fiscal 2007, the Company recognized costs relating to suchinitiatives of approximately $0.9 million, primarily comprised of severance and outplacement costs.Additionally, during fiscal 2007 the Company incurred approximately $0.8 million of costs related to thecorporate headquarters relocation initially undertaken in fiscal 2006 and other U.S. initiatives.
The restructuring and plant realignment costs for fiscal 2006 were principally associated with (i) theCompany’s restructuring and consolidation plan for Europe, which included termination benefitsprovided to an executive officer of the Company, pursuant to Dutch law, in the amount of $2.1 million andcosts associated with the planned closure of the Sweden plant of $1.1 million, (ii) costs related to therelocation of the corporate headquarters to Charlotte, North Carolina in the amount of $3.0 million,(iii) downsizing certain Canadian operations resulting in severance costs of $0.6 million, and (iv) costs inthe amount of $0.3 million related to exiting leased facilities in Gainesville, Georgia.
Other costs
During fiscal 2006, the Company and the Audit Committee of the Board of Directors of theCompany, with assistance from special counsel, conducted an investigation which focused on a reviewof two settlement agreements and the relationship of these agreements with certain equipmentpurchase contracts and service agreements, which were negotiated between the Company and anequipment supplier in or about the same time frame. As a result of these actions, the Companyconcluded that the economic substance of the settlement agreements and the equipment purchasecontracts and service agreements were substantially interdependent. On September 21, 2006, theBoard of Directors of the Company asked the Chief Executive Officer and the Vice President, GlobalPurchasing to resign, and pending receipt of their resignations, relieved them of their duties as officers ofthe Company. Shortly thereafter, the Company entered into termination agreements with bothexecutives. As a result of these events, the Company has incurred costs with respect to the investigation,termination benefits and other costs in the amount of $1.1 million during fiscal 2006 and an additional$0.7 million during fiscal 2007.
Abandoned acquisition costs
During fiscal 2006, the Company incurred $4.0 million of costs, which were primarily comprised ofthird-party professional fees, in connection with a potential acquisition. When the negotiations with theacquisition target reached an impasse in the second quarter of fiscal 2006, the Company abandoned itsefforts to consummate the acquisition and, accordingly, charged all costs with respect to the acquisitionto the Consolidated Statement of Operations.
Note 4. Accounts Receivable Factoring Agreements
The Company has entered into a factoring agreement to sell without recourse or discount, certainU.S. company-based receivables to an unrelated third-party financial institution. Under the current termsof the factoring agreement, the maximum amount of outstanding advances at any one time is$20.0 million, which limitation is subject to change based on the level of eligible receivables, restrictionson concentrations of receivables and the historical performance of the receivables sold. Additionally, theCompany has entered into a factoring agreement to sell, without recourse or discount, certain non-U.S.company-based receivables to an unrelated third-party financial institution. Under the terms of the
71

POLYMER GROUP, INC.
NOTES TO CONSOLIDATED FINANCIAL STATEMENTS—(Continued)
factoring agreement, the maximum amount of outstanding advances at any one time is $10.0 million,which limitation is subject to change based on the level of eligible receivables, restrictions onconcentrations of receivables and the historical performance of the receivables sold.
Approximately $186.7 million, $190.2 million and $130.0 million of receivables have been sold underthe terms of the factoring agreements during fiscal years 2007, 2006 and 2005, respectively. The sale ofthese receivables accelerated the collection of the Company’s cash, reduced credit exposure andlowered the Company’s net borrowing costs. Such sales of accounts receivable are reflected as areduction of Accounts receivable, net in the Consolidated Balance Sheets as they meet the applicablecriteria of SFAS No. 140, ‘‘Accounting for Transfers and Servicing of Financial Assets andExtinguishment of Liabilities’’ (‘‘SFAS No. 140’’). The amount due from the factoring companies, net ofadvances received from the factoring companies, was $7.4 million and $6.6 million at December 29,2007 and December 30, 2006, respectively, and is shown in Other current assets in the ConsolidatedBalance Sheets. The Company pays factoring fees associated with the sale of receivables based on thedollar value of the receivables sold. Such fees, which are considered to be primarily related to theCompany’s financing activities, are immaterial and are included in Foreign currency and other (gain)loss, net in the Consolidated Statements of Operations.
Note 5. Inventories
Inventories consist of the following (in thousands):
December 29, 2007 December 30, 2006
Finished goods . . . . . . . . . . . . . . . . . . . . . $ 71,855 $ 64,090Work in process . . . . . . . . . . . . . . . . . . . . . 20,125 17,462Raw materials and supplies . . . . . . . . . . . . 47,746 50,171
$139,726 $131,723
Inventories are net of reserves, primarily for obsolete and slow-moving inventories, of approximately$13.0 million and $10.4 million at December 29, 2007 and December 30, 2006, respectively.Management believes that the reserves are adequate to provide for losses in the normal course ofbusiness.
Note 6. Property, Plant and Equipment
Property, plant and equipment consists of the following (in thousands):
December 29, December 30,2007 2006
Land . . . . . . . . . . . . . . . . . . . . . . . . . . . . . . . . . . . . $ 14,463 $ 13,735Buildings and land improvements . . . . . . . . . . . . . . . 108,410 119,157Machinery, equipment and other . . . . . . . . . . . . . . . . 445,940 452,383Construction in progress . . . . . . . . . . . . . . . . . . . . . 49,442 8,286
618,255 593,561Less accumulated depreciation . . . . . . . . . . . . . . . . . (222,861) (182,507)
$ 395,394 $ 411,054
72

POLYMER GROUP, INC.
NOTES TO CONSOLIDATED FINANCIAL STATEMENTS—(Continued)
Depreciation charged to expense was $56.1 million, $54.9 million and $51.3 million for fiscal years2007, 2006 and 2005, respectively.
The significant increase in construction in progress during fiscal 2007 compared to fiscal 2006 wasdue to the capital expansion projects under construction at December 29, 2007, including the retrofit ofan existing hydroentanglement line at our Benson, North Carolina facility and the construction of a newspunmelt line at our facilities near Buenos Aires, Argentina and San Luis Potosi, Mexico.
Note 7. Intangibles and Loan Acquisition Costs
Intangibles and loan acquisition costs consist of the following (in thousands):
December 29, December 30,2007 2006
Cost:Proprietary technology . . . . . . . . . . . . . . . . . . . . . $ 2,328 $ 1,352Loan acquisition costs . . . . . . . . . . . . . . . . . . . . . 9,205 9,191Other . . . . . . . . . . . . . . . . . . . . . . . . . . . . . . . . . . 1,965 1,817
13,498 12,360Less accumulated amortization . . . . . . . . . . . . . . . . . (4,273) (2,154)
$ 9,225 $10,206
In connection with the refinancing of the Company’s then outstanding Bank Facility in November2005, a portion of the unamortized loan acquisition costs associated with the April 2004 refinancing werewritten-off, in the amount of $3.0 million, and expensed in the Consolidated Statement of Operations.Additionally, $1.0 million of third-party costs incurred in connection with the 2005 refinancing were alsocharged to expense.
Components of amortization expense are shown in the table below (in thousands):
2007 2006 2005
Amortization of:Intangibles with finite lives, included in selling,
general and administrative expense . . . . . . . . . . . $ 701 $4,438 $4,252Loan acquisition costs, included in interest expense,
net . . . . . . . . . . . . . . . . . . . . . . . . . . . . . . . . . . 1,386 1,339 1,977
Total amortization expense . . . . . . . . . . . . . . . . . . . $2,087 $5,777 $6,229
Aggregate amortization expense for each of the next five years is expected to be as follows: 2008,$2.1 million; 2009, $2.1 million; 2010, $1.9 million; 2011, $1.8 million; and 2012, $1.1 million. Intangiblesare amortized over periods generally ranging from 4 to 6 years. Loan acquisition costs are amortizedover the life of the related debt.
Note 8. Accounts Payable and Accrued Liabilities
Accounts payable and accrued liabilities in the Consolidated Balance Sheets include salaries,wages and other fringe benefits of $18.3 million and $15.6 million as of December 29, 2007 andDecember 30, 2006, respectively.
73

POLYMER GROUP, INC.
NOTES TO CONSOLIDATED FINANCIAL STATEMENTS—(Continued)
Note 9. Debt
Long-term debt consists of the following:December 29, December 30,
2007 2006
Credit Facility, as defined below, interest rates for U.S. dollarborrowings are based on a specified base plus a specified marginand are subject to certain terms and conditions:First Lien Term Loan—average interest at 7.09% and 7.61% as of
December 29, 2007 and December 30, 2006, respectively; due inmandatory quarterly payments of approximately $1.0 million,subject to additional payments from annual excess cash flows, asdefined by the Credit Facility, with the balance due November 22,2012 . . . . . . . . . . . . . . . . . . . . . . . . . . . . . . . . . . . . . . . . . . . . . $390,300 $405,900
Argentine Facility:Argentine Peso Loan—interest at 13.28% as of December 29, 2007;
denominated in Argentine pesos with quarterly principal paymentsscheduled to begin in June 2008 . . . . . . . . . . . . . . . . . . . . . . . . . 7,617 —
United States Dollar Loan—interest at 8.26% as of December 29,2007; denominated in U.S. dollars with quarterly principalpayments scheduled to begin in June 2008 . . . . . . . . . . . . . . . . . 24,524 —
Other . . . . . . . . . . . . . . . . . . . . . . . . . . . . . . . . . . . . . . . . . . . . . . . . 863 686
423,304 406,586Less: Current maturities . . . . . . . . . . . . . . . . . . . . . . . . . . . . . . . . . . . (7,790) (4,170)
$415,514 $402,416
Scheduled Maturities
The scheduled maturities of long-term debt at December 29, 2007 are as follows (in thousands):
2008 . . . . . . . . . . . . . . . . . . . . . . . . . . . . . . . . . . . . . . . . . . . . . . . . $ 7,7902009 . . . . . . . . . . . . . . . . . . . . . . . . . . . . . . . . . . . . . . . . . . . . . . . . 8,1912010 . . . . . . . . . . . . . . . . . . . . . . . . . . . . . . . . . . . . . . . . . . . . . . . . 8,1602011 . . . . . . . . . . . . . . . . . . . . . . . . . . . . . . . . . . . . . . . . . . . . . . . . 8,1302012 . . . . . . . . . . . . . . . . . . . . . . . . . . . . . . . . . . . . . . . . . . . . . . . . 376,9302013 and thereafter . . . . . . . . . . . . . . . . . . . . . . . . . . . . . . . . . . . . . 14,103
Total . . . . . . . . . . . . . . . . . . . . . . . . . . . . . . . . . . . . . . . . . . . . . . . . $423,304
Credit Facility
The Company’s credit facility (the ‘‘Credit Facility’’), which was entered into on November 22, 2005and amended as of December 8, 2006, consists of a $45.0 million secured revolving credit facility and a$410.0 million first-lien term loan.
All borrowings under the Credit Facility are U.S. dollar denominated and are guaranteed, on a jointand several basis, by each and all of the direct and indirect domestic subsidiaries of the Company. TheCredit Facility and the related guarantees are secured by (i) a lien on substantially all of the assets of theCompany, its domestic subsidiaries and certain of its non-domestic subsidiaries, (ii) a pledge of all or a
74

POLYMER GROUP, INC.
NOTES TO CONSOLIDATED FINANCIAL STATEMENTS—(Continued)
portion of the stock of the domestic subsidiaries of the Company and of certain non-domesticsubsidiaries of the Company, and (iii) a pledge of certain secured intercompany notes. Commitmentfees under the Credit Facility are equal to 0.50% of the daily unused amount of the revolving creditcommitment. The Credit Facility limits restricted payments to $5.0 million, including cash dividends, inthe aggregate since the effective date of the Credit Facility. The Credit Facility contains covenants andevents of default customary for financings of this type, including leverage and interest expense coveragecovenants. The Credit Facility requires that the Company maintain a leverage ratio of not more than4.50:1:00, as of December 29, 2007, with decreases over time, with the next change occurring March 29,2008, at which time the leverage ratio requirement will be 4.00:1:00. The interest expense coverage ratiorequirement at December 29, 2007 was not less than 2.50:1.00, with increases over time, with the nextchange occurring March 29, 2008, at which time the requirement will be 2.75:1.00. The Company was incompliance with the debt covenants under the Credit Facility at December 29, 2007. These ratios arecalculated on a trailing four-quarter basis. As a result, any decline in the Company’s future operatingresults will negatively impact its coverage ratios. While the Company intends to remain in compliancewith these covenant requirements, the automatic adjustment as of March 29, 2008 narrows the marginby which the Company is able to comply with the covenant requirements. The Company’s failure tocomply with these financial covenants, without waiver or amendment from its lenders, could have amaterial adverse effect on its liquidity and operations, including limiting the Company’s ability to borrowunder the Credit Facility.
The first-lien term loan requires mandatory payments of approximately $1.0 million per quarter andrequires the Company to use a percentage of proceeds from excess cash flows, as defined by the CreditFacility and determined based on year-end results, to reduce its then outstanding balances under theCredit Facility. Excess cash flows required to be applied to the repayment of the Credit Facility aregenerally calculated as 50.0% of the net amount of our available cash generated from operationsadjusted for the cash effects of interest, taxes, capital expenditures, changes in working capital andcertain other items. There are no additional amounts due currently under the excess cash flowprovisions of the Credit Facility and the Company has included the mandatory payments ofapproximately $1.0 million per quarter and the application of the remaining proceeds in the amount ofapproximately $1.0 million expected to be received from the sale of certain property and equipment inCurrent portion of long-term debt in the Consolidated Balance Sheet as of December 29, 2007. TheCompany may, in its discretion and based on projected operating cash flows and anticipated cashrequirements, elect to make additional repayments of debt under the Credit Facility in excess of themandatory debt repayments and excess cash flow payments.
The interest rate applicable to borrowings under the Credit Facility is based on three-month LondonInterbank Offered Rate (‘‘LIBOR’’) plus a specified margin. The applicable margin for borrowings underboth the first-lien term loan and the revolving credit facility is 225 basis points. The Company may, fromtime to time, elect to use an alternate base rate for its borrowings under the revolving credit facility basedon the bank’s base rate plus a margin of 75 to 125 basis points based on the Company’s total leverageratio. There were no outstanding borrowings under the revolving credit facility as of December 29, 2007or December 30, 2006. As of December 29, 2007, capacity under the revolving credit facility had beenreserved for outstanding letters of credit in the amount of $10.9 million, as described below. Averagedaily borrowings under the revolving credit facility, which were largely alternative base rate-basedborrowings, for the period from December 31, 2006 to December 29, 2007 were $2.1 million at anaverage rate of 9.50%. Average daily borrowings under the revolving credit facility, which were largelyLIBOR-based borrowings, for the period from January 1, 2006 to December 30, 2006 were $17.6 millionat an average rate of 7.85%. The revolving credit portion of the Credit Facility matures on November 22,2010.
75

POLYMER GROUP, INC.
NOTES TO CONSOLIDATED FINANCIAL STATEMENTS—(Continued)
In accordance with the terms of the Credit Facility, the Company maintained its position in a cashflow hedge originally entered into in May 2004. This cash flow hedge agreement effectively converted$212.5 million of notional principal amount of debt from a variable LIBOR rate to a fixed LIBOR rate of3.383%. This cash flow hedge agreement terminated on May 8, 2007. Additionally, in February 2007, theCompany entered into another cash flow hedge agreement, which is effective May 8, 2007, maturesJune 29, 2009 and effectively converts $240.0 million of notional principal amount of debt from a variableLIBOR rate to a fixed LIBOR rate of 5.085%. Such cash flow hedge agreements are described more fullyin Note 14 to the Consolidated Financial Statements.
Subject to certain terms and conditions, a maximum of $25.0 million of the Credit Facility may beused for letters of credit. As of December 29, 2007, the Company had $10.9 million of standby anddocumentary letters of credit outstanding. Letters of credit are in place to provide added assurance forcertain raw material vendors and administrative service providers. None of these letters of credit hadbeen drawn on at December 29, 2007.
Subsidiary Indebtedness
In fiscal 2006, the Company’s operations in China entered into short-term credit facilitiesdenominated in Chinese renminbi with financial institutions in China. These short-term credit facilitiesare intended to finance working capital requirements. Outstanding indebtedness under these facilitieswas $3.7 million and $4.6 million at December 29, 2007 and December 30, 2006, respectively, whichfacilities mature at various dates through June 2008. Borrowings under these facilities are shown inShort-term borrowings in the Consolidated Balance Sheets.
In January 2007, the Company’s subsidiary in Argentina entered into an arrangement with bankinginstitutions in Argentina to finance the installation of a new spunmelt line at the Company’s facility nearBuenos Aires, Argentina. The maximum borrowings available under the arrangement amount to$38.4 million and are secured by pledges covering (i) the subsidiary’s existing equipment lines; (ii) theoutstanding stock of the subsidiary; and (iii) the new machinery and equipment being purchased, as wellas a trust assignment agreement related to a portion of receivables due from certain major customers ofthe subsidiary. As of December 29, 2007, the outstanding indebtedness was approximately$32.1 million, consisting of a $7.6 million Argentine peso-denominated loan and a $24.5 million U.S.dollar-denominated loan. Accrued interest on these loans, which is shown in Accounts payable andaccrued liabilities in the Consolidated Balance Sheets, will become part of the loan principal balance atthe conclusion of the construction period, at which time the principal payment amounts will be finalized.The interest rate applicable to borrowings under these term loans is based on LIBOR plus 290 basispoints for the U.S. dollar-denominated loan and Buenos Aires Interbanking Offered Rate (‘‘BAIBOR’’)plus 475 basis points for the Argentine peso-denominated loan. Principal and interest payments arescheduled to begin in June 2008 with the loans maturing in March 2016. These dates are subject tochange based on the date of the last loan advance. Additionally, in March 2007, the subsidiary inArgentina entered into a short-term credit facility denominated in U.S. dollars with a financial institution inArgentina. This short-term credit facility is intended to finance working capital requirements asnecessary. There were no amounts outstanding under the short-term credit facility as of December 29,2007.
In March 2006, one of the Company’s wholly-owned Canadian subsidiaries entered into a term loantotaling approximately $0.6 million with an agency of the Canadian government, which agency focuseson generating capital investment in the country. The principal of the term loan is due September 1, 2008.Provided that the term loan is repaid on September 1, 2008, no interest is due. However, if the Companyelects not to repay the loan on September 1, 2008, the Company will begin making monthly payments of
76

POLYMER GROUP, INC.
NOTES TO CONSOLIDATED FINANCIAL STATEMENTS—(Continued)
principal and interest at 6.25% per year. Based on the expectation that the principal will be repaid when itis due, this debt is shown in Current portion of long-term debt in the Consolidated Balance Sheet as ofDecember 29, 2007.
Note 10. Income TaxesThe components of income (loss) before income taxes are as follows (in thousands):
2007 2006 2005
Domestic . . . . . . . . . . . . . . . . . . . . . . . . . . . . . $ (6,446) $(31,445) $ (9,002)Foreign . . . . . . . . . . . . . . . . . . . . . . . . . . . . . . . (23,876) 7,565 29,579
$(30,322) $(23,880) $20,577
The components of income tax expense (benefit) are as follows (in thousands):2007 2006 2005
Current:Federal and state . . . . . . . . . . . . . . . . . . . . . . . . $ 969 $ 1,020 $ (783)Foreign . . . . . . . . . . . . . . . . . . . . . . . . . . . . . . . 4,501 9,165 4,440
Deferred:Federal and state . . . . . . . . . . . . . . . . . . . . . . . . 644 678 359Foreign . . . . . . . . . . . . . . . . . . . . . . . . . . . . . . . 2,724 (2,406) 6,869
Income tax expense . . . . . . . . . . . . . . . . . . . . . . . . $8,838 $ 8,457 $10,885
Provision has been made for U.S. and additional foreign taxes for the anticipated repatriation ofearnings of certain foreign subsidiaries of the Company. The Company considers the undistributedearnings of its foreign subsidiaries above the amount already provided to be indefinitely reinvested.These additional foreign earnings could become subject to additional tax if remitted, or deemedremitted, as a dividend. However the determination of the additional amount of tax that would beincurred is not practicable because of the complexities associated with its hypothetical calculation. AtDecember 29, 2007, the unremitted earnings of its foreign subsidiaries for which U.S. taxes have notbeen provided amounted to approximately $26.3 million. Also, in the event of additional tax,unrecognized tax credits may be available to reduce some portion of any U.S. income tax liability.
As discussed in Note 2 to the Consolidated Financial Statements, the Company adopted theprovisions of FIN 48 on the first day of fiscal 2007. The total amount of unrecognized tax benefits as ofDecember 29, 2007 and December 30, 2006 were $14.3 million and $9.7 million, respectively. Theseamounts include accrued interest and penalties of $6.5 million and $5.0 million at December 29, 2007and December 30, 2006, respectively.
A reconciliation of the beginning and ending amount of unrecognized tax benefits is as follows (inthousands):
Unrecognized tax benefits as of December 31, 2006 . . . . . . . . . . . . . . $ 9,729Gross increases for tax positions of prior years . . . . . . . . . . . . . . . . . . 1,644Gross decreases for tax positions of prior years . . . . . . . . . . . . . . . . . . —Increases in tax positions for the current year . . . . . . . . . . . . . . . . . . . 2,968Settlements . . . . . . . . . . . . . . . . . . . . . . . . . . . . . . . . . . . . . . . . . . . . —Lapse of statute of limitations . . . . . . . . . . . . . . . . . . . . . . . . . . . . . . . —Unrecognized tax benefits as of December 29, 2007 . . . . . . . . . . . . . . $14,341
The Company continues to evaluate unrecognized tax benefits as additional legislation and taxrulings are issued by the various tax authorities to which the Company is subject and as additional factsand circumstances develop. The Company does not anticipate a significant increase or decrease of thetotal amounts of unrecognized tax benefits within the next twelve months due to legislation, settlementsor tax rulings.
77

POLYMER GROUP, INC.
NOTES TO CONSOLIDATED FINANCIAL STATEMENTS—(Continued)
Management judgment is required in determining tax provisions and evaluating tax positions.Although management believes its tax positions and related provisions reflected in the ConsolidatedFinancial Statements are fully supportable, it recognizes that these tax positions and related provisionsmay be challenged by various tax authorities. These tax positions and related provisions are reviewed onan ongoing basis and are adjusted as additional facts and information become available, includingprogress on tax audits, changes in interpretations of tax laws, developments in case law and closing ofstatute of limitations. The Company’s tax provision includes the impact of recording reserves and anychanges thereto. As of December 29, 2007, the Company has a number of open tax years with varioustaxing jurisdictions that range from 2001 to 2007. Although the results of current tax audits and reviewsrelated to open tax years have not been finalized, management believes that the ultimate outcomes willnot have a material adverse effect on the Company’s financial position, results of operations or cashflows.
Income taxes computed at the Company’s U.S. federal statutory rate differed from the provision forincome taxes as follows (in thousands):
2007 2006 2005
Computed income tax expense (benefit) at statutory rate . . . . . . . . . $(10,613) $(8,358) $ 7,202State income taxes, net of federal tax benefit . . . . . . . . . . . . . . . . . 1,629 1,623 535Utilization of post-emergence net operating loss carryforwards . . . . . — — (354)Valuation allowance . . . . . . . . . . . . . . . . . . . . . . . . . . . . . . . . . . . 16,091 7,738 282Withholding taxes and tax credits . . . . . . . . . . . . . . . . . . . . . . . . . . 1,243 1,339 1,290Effect of foreign operations, net . . . . . . . . . . . . . . . . . . . . . . . . . . . (1,763) 777 (381)Effect of foreign earnings on U.S. taxes and other, net . . . . . . . . . . . (2,361) 5,338 2,311Increase in FIN 48 liability . . . . . . . . . . . . . . . . . . . . . . . . . . . . . . . 4,612 — —
Income tax expense . . . . . . . . . . . . . . . . . . . . . . . . . . . . . . . . . . . $ 8,838 $ 8,457 $10,885
The Company’s financial reorganization, through the Chapter 11 process, caused an ownershipchange for federal income tax purposes. As a result, future tax deductions related to certain ‘‘built-indeductions and losses’’ will be limited by Section 382 of the Internal Revenue Code, as amended(‘‘Section 382’’) during the five-year period following the ownership change (the recognition period). TheCompany had substantial amounts of such built-in deductions and losses (primarily depreciationdeductions) scheduled to be realized during the recognition period. Under Section 382, such built-inlosses will be subject to an annual usage limitation of approximately $3.4 million during the recognitionperiod.
At December 29, 2007, the Company had the following significant net operating loss carryforwardsfor income tax purposes (in thousands):
Country Amount Year of Expiration
Canada . . . . . . . . . . . . . . . . . . . . . . . . . . . . . . . . . $ 14,036 2008–2027Germany . . . . . . . . . . . . . . . . . . . . . . . . . . . . . . . . 45,212 IndefiniteNetherlands . . . . . . . . . . . . . . . . . . . . . . . . . . . . . . 29,630 2016–2017Sweden . . . . . . . . . . . . . . . . . . . . . . . . . . . . . . . . . 956 IndefiniteUnited States (State) . . . . . . . . . . . . . . . . . . . . . . . . 896,898 VariousUnited States (Federal) . . . . . . . . . . . . . . . . . . . . . . 62,271 2024–2027
78

POLYMER GROUP, INC.
NOTES TO CONSOLIDATED FINANCIAL STATEMENTS—(Continued)
In addition, the Company had the following credits for income tax purposes as of December 29,2007 (in thousands):
Country Type of Credit Amount Year of Expiration
Mexico . . . . . . . . . . . . . . . Asset Tax $ 818 2008–2012United States . . . . . . . . . . Foreign Tax 15,169 2009United States . . . . . . . . . . Alternative Minimum Tax 692 Indefinite
The Company conducts business in foreign jurisdictions which grant holidays from income taxes fora specified period. The Company recognized approximately $0.6 million of tax benefits during fiscal2007 related to tax holidays in China.
Deferred income taxes reflect the net tax effects of temporary differences between the carryingamounts of assets and liabilities for financial reporting purposes and the amounts used for income taxpurposes, as well as net operating loss and other tax credit carryforwards. Significant components of theCompany’s net deferred tax assets and liabilities are as follows (in thousands):
December 29, December 30,2007 2006
Deferred tax assets:Provision for bad debts . . . . . . . . . . . . . . . . . . . . . . . . . . . . . . . . . $ 1,838 $ 2,525Inventory capitalization and allowances . . . . . . . . . . . . . . . . . . . . . . 3,434 2,188Net operating loss and capital loss carryforwards . . . . . . . . . . . . . . . 97,100 65,595Tax credits . . . . . . . . . . . . . . . . . . . . . . . . . . . . . . . . . . . . . . . . . . . 1,351 8,302Foreign tax credits . . . . . . . . . . . . . . . . . . . . . . . . . . . . . . . . . . . . . 15,169 15,169Property, plant and equipment and intangibles, net . . . . . . . . . . . . . 42,677 32,705Other . . . . . . . . . . . . . . . . . . . . . . . . . . . . . . . . . . . . . . . . . . . . . . 24,920 21,384
Total deferred tax assets . . . . . . . . . . . . . . . . . . . . . . . . . . . . . . . . . 186,489 147,868Valuation allowance . . . . . . . . . . . . . . . . . . . . . . . . . . . . . . . . . . . . . . (172,695) (117,427)
Net deferred tax assets . . . . . . . . . . . . . . . . . . . . . . . . . . . . . . . . . . . 13,794 30,441
Deferred tax liabilities:Property, plant and equipment and intangibles, net . . . . . . . . . . . . . (8,082) (21,865)Stock basis of subsidiaries . . . . . . . . . . . . . . . . . . . . . . . . . . . . . . . (7,709) (7,709)Other, net . . . . . . . . . . . . . . . . . . . . . . . . . . . . . . . . . . . . . . . . . . . (15,776) (32,435)
Total deferred tax liabilities . . . . . . . . . . . . . . . . . . . . . . . . . . . . . . . . . (31,567) (62,009)
Net deferred tax liabilities . . . . . . . . . . . . . . . . . . . . . . . . . . . . . . . . . . $ (17,773) $ (31,568)
A valuation allowance is recorded when, based on the weight of the evidence, it is more likely thannot that some portion, or all, of the deferred tax assets will not be realized. The ultimate realization of thedeferred tax assets depends on the ability of the Company to generate sufficient taxable income of theappropriate character in the future and in the appropriate taxing jurisdictions. In assessing therealizability of the deferred tax assets, management considers, among other factors, the trend ofhistorical and projected future taxable income with appropriate consideration given to the fact that theCompany is five years removed from the Chapter 11 process, the scheduled reversal of deferred taxliabilities, the carryforward period for net operating losses and tax credits as well as tax planningstrategies available to the Company. After consideration of all the evidence, both positive and negative,
79

POLYMER GROUP, INC.
NOTES TO CONSOLIDATED FINANCIAL STATEMENTS—(Continued)
the Company has determined that valuation allowances of $172.7 million and $117.4 million areappropriate as of December 29, 2007 and December 30, 2006, respectively.
During fiscal 2006, the Company: (a) recognized additional tax benefits from the utilization ofpreconfirmation net operating loss carryforwards; (b) completed the IRS examinations for fiscal years2003 and 2004, effectively settling certain tax uncertainties with respect to those years; and (c) modifiedthe tax basis of its investment in subsidiaries as a result of completing the IRS examination. Inaccordance with SOP 90-7, the Company has recognized the tax benefits with respect to such itemswhich were originally estimated as of the Effective Date, in the amount of approximately $27.4 million,first eliminating goodwill of $10.2 million; second, eliminating all remaining intangibles established as ofthe Effective Date of $13.1 million; with the excess of such tax benefits over the amounts allocable togoodwill and other intangibles as a credit to Additional Paid-in Capital of $4.1 million. Also, the additionalincome tax benefits recognized in fiscal 2007 from preconfirmation tax attributes in the amount of$1.3 million were credited to Additional Paid-in Capital.
There were income tax refunds receivable of $1.8 million and $0.1 million at December 29, 2007 andDecember 30, 2006, respectively. These amounts are included in Other current assets on theConsolidated Balance Sheets.
Note 11. Pension and Postretirement Benefit Plans
In September 2006, the FASB issued SFAS No. 158, which required employers to recognize thefunded status of defined benefit plans and other postretirement benefit plans in the ConsolidatedBalance Sheets, with changes in the plan’s funded status recognized as a component of Accumulatedother comprehensive income. SFAS No. 158 has been applied by the Company as of December 30,2006.
The Company and its subsidiaries sponsor multiple defined benefit plans and other postretirementbenefit plans that cover certain employees. Benefits are primarily based on years of service and theemployee’s compensation. It is the Company’s policy to fund such plans in accordance with applicablelaws and regulations. The benefit obligations and related assets under these plans with respect to the
80

POLYMER GROUP, INC.
NOTES TO CONSOLIDATED FINANCIAL STATEMENTS—(Continued)
2007 and 2006 disclosures have been measured as of December 29, 2007 and December 30, 2006,respectively.
U.S. Plans Non-U.S. PlansPension Benefits Pension Benefits2007 2006 2007 2006
(In Thousands)Change in Projected Benefit Obligation:Projected benefit obligation at beginning of year . . . $(12,880) $(12,946) $(118,187) $(112,579)Additional benefit obligations . . . . . . . . . . . . . . . . . — — — —Service costs . . . . . . . . . . . . . . . . . . . . . . . . . . . . . — — (2,418) (2,452)Interest costs . . . . . . . . . . . . . . . . . . . . . . . . . . . . . (736) (717) (5,026) (5,245)Participant contributions . . . . . . . . . . . . . . . . . . . . . — — (151) (142)Plan amendments . . . . . . . . . . . . . . . . . . . . . . . . . — — (38) 3,849Actuarial (loss)/gain . . . . . . . . . . . . . . . . . . . . . . . . (403) (241) 9,176 1,525Currency translation adjustment and other . . . . . . . . — — (13,765) (8,067)Settlements/curtailments . . . . . . . . . . . . . . . . . . . . . — — 18,998 —Benefit payments . . . . . . . . . . . . . . . . . . . . . . . . . . 1,101 1,024 3,032 4,924
Projected benefit obligation at end of year . . . . . . . . $(12,918) $(12,880) $(108,379) $(118,187)
Change in Plan Assets:Fair value of plan assets at beginning of year . . . . . $ 11,700 $ 10,259 $ 106,928 $ 92,348Actual return on and additional plan assets . . . . . . . 1,485 1,425 (424) 6,287Employer and plan participant contributions . . . . . . . 729 1,040 3,904 6,231Plan amendments . . . . . . . . . . . . . . . . . . . . . . . . . — — — —Actuarial (loss)/gain . . . . . . . . . . . . . . . . . . . . . . . . — — — —Settlements/curtailments . . . . . . . . . . . . . . . . . . . . . — — (17,456) —Benefit payments . . . . . . . . . . . . . . . . . . . . . . . . . . (1,103) (1,024) (3,032) (4,924)Currency translation adjustment and other . . . . . . . . — — 13,328 6,986
Fair value of plan assets at end of year . . . . . . . . . . $ 12,811 $ 11,700 $ 103,248 $ 106,928
Funded status . . . . . . . . . . . . . . . . . . . . . . . . . . . . $ (107) $ (1,180) $ (5,131) $ (11,259)
81

POLYMER GROUP, INC.
NOTES TO CONSOLIDATED FINANCIAL STATEMENTS—(Continued)
The Company has plans whose fair value of plan assets exceeds the benefit obligation. In 2007 and2006, the total amount netted in the funded status above for such plans approximates $1.2 million and$0.9 million, respectively. The total amount of prepaid benefit cost included in the net prepaid (accrued)benefit cost recognized related to these plans approximates $0.7 million in 2007 and $0.5 million in 2006.
U.S. Non-U.S.Postretirement PostretirementBenefit Plans Benefit Plans
2007 2006 2007 2006(In Thousands)
Change in Projected Benefit Obligation:Projected benefit obligation at beginning of year . . . . . . . . . $(3,313) $(3,021) $(5,868) $(7,201)Additional benefit obligations . . . . . . . . . . . . . . . . . . . . . . . — — — —Service costs . . . . . . . . . . . . . . . . . . . . . . . . . . . . . . . . . . (103) (216) (42) (78)Interest costs . . . . . . . . . . . . . . . . . . . . . . . . . . . . . . . . . . (171) (212) (314) (348)Participant contributions . . . . . . . . . . . . . . . . . . . . . . . . . . (36) (96) — —Plan amendments . . . . . . . . . . . . . . . . . . . . . . . . . . . . . . . — — — 591Actuarial (loss)/gain . . . . . . . . . . . . . . . . . . . . . . . . . . . . . 646 13 397 702Currency translation adjustment and other . . . . . . . . . . . . . — — (1,070) (23)Settlements/curtailments . . . . . . . . . . . . . . . . . . . . . . . . . . 2,583 (191) — —Benefit payments . . . . . . . . . . . . . . . . . . . . . . . . . . . . . . . 262 410 441 489
Projected benefit obligation at end of year . . . . . . . . . . . . . $ (132) $(3,313) $(6,456) $(5,868)
Change in Plan Assets:Fair value of plan assets at beginning of year . . . . . . . . . . . $ — $ — $ — $ —Actual return on plan assets . . . . . . . . . . . . . . . . . . . . . . . — — — —Acquisition . . . . . . . . . . . . . . . . . . . . . . . . . . . . . . . . . . . . — — — —Employer and plan participant contributions . . . . . . . . . . . . 225 315 441 489Plan amendments . . . . . . . . . . . . . . . . . . . . . . . . . . . . . . . 36 96 — —Benefit payments . . . . . . . . . . . . . . . . . . . . . . . . . . . . . . . (261) (411) (441) (489)Currency translation adjustment and other . . . . . . . . . . . . . — — — —
Fair value of plan assets at end of year . . . . . . . . . . . . . . . $ — $ — $ — $ —
Funded status . . . . . . . . . . . . . . . . . . . . . . . . . . . . . . . . . $ (132) $(3,313) $(6,456) $(5,868)
82

POLYMER GROUP, INC.
NOTES TO CONSOLIDATED FINANCIAL STATEMENTS—(Continued)
The following table summarizes the amounts recognized in the Consolidated Balance Sheet for theCompany’s pension plans as of December 29, 2007 and December 30, 2006 (in thousands):
U.S. Non-U.S.Pension Plans Pension Plans
2007 2006 2007 2006
Other assets . . . . . . . . . . . . . . . . . . . . . . . . . . . . . . . . . . . $ — $ — $ 1,231 $ 854Accrued liabilities . . . . . . . . . . . . . . . . . . . . . . . . . . . . . . . — — (179) (47)Other liabilities . . . . . . . . . . . . . . . . . . . . . . . . . . . . . . . . . (107) (1,180) (6,183) (12,066)Accumulated other comprehensive (income) loss . . . . . . . . (549) (394) 6,406 12,628
Net amounts recognized . . . . . . . . . . . . . . . . . . . . . . . . . $(656) $(1,574) $ 1,275 $ 1,369
The following table summarizes the amounts recognized in the Consolidated Balance Sheet for theCompany’s postretirement benefit plans as of December 29, 2007 and December 30, 2006 (inthousands):
U.S. Non-U.S.Postretirement PostretirementBenefit Plans Benefit Plans
2007 2006 2007 2006
Other assets . . . . . . . . . . . . . . . . . . . . . . . . . . . . . . . . . . . . $ — $ — $ — $ —Accrued liabilities . . . . . . . . . . . . . . . . . . . . . . . . . . . . . . . . (45) (676) (462) (404)Other liabilities . . . . . . . . . . . . . . . . . . . . . . . . . . . . . . . . . . (87) (2,637) (5,994) (5,464)Accumulated other comprehensive (income) loss . . . . . . . . . (233) (518) (2,380) (1,867)
Net amounts recognized . . . . . . . . . . . . . . . . . . . . . . . . . . $(365) $(3,831) $(8,836) $(7,735)
The following table summarizes the amounts recorded in Accumulated other comprehensiveincome, before taxes, for the Company’s pension plans as of December 29, 2007 and December 30,2006 (in thousands):
U.S. Non-U.S.Pension Plans Pension Plans2007 2006 2007 2006
Transition net asset . . . . . . . . . . . . . . . . . . . . . . . . . . . . . . . . $ — $ — $ 86 $ 107Net actuarial (gain) loss . . . . . . . . . . . . . . . . . . . . . . . . . . . . . (549) (394) 8,949 15,070Prior service cost . . . . . . . . . . . . . . . . . . . . . . . . . . . . . . . . . — — (2,629) (2,549)
Net amounts recognized . . . . . . . . . . . . . . . . . . . . . . . . . . . $(549) $(394) $ 6,406 $12,628
The following table summarizes the amounts recorded in Accumulated other comprehensiveincome, before taxes, for the Company’s postretirement benefit plans as of December 29, 2007 andDecember 30, 2006 (in thousands):
U.S. Non-U.S.Postretirement PostretirementBenefit Plans Benefit Plans
2007 2006 2007 2006
Transition net asset . . . . . . . . . . . . . . . . . . . . . . . . . . . . . . . . $ — $ — $ — $ —Net actuarial (gain) loss . . . . . . . . . . . . . . . . . . . . . . . . . . . . . (205) (401) (1,788) (1,331)Prior service cost . . . . . . . . . . . . . . . . . . . . . . . . . . . . . . . . . . (28) (117) (592) (536)
Net amounts recognized . . . . . . . . . . . . . . . . . . . . . . . . . . . $(233) $(518) $(2,380) $(1,867)
83

POLYMER GROUP, INC.
NOTES TO CONSOLIDATED FINANCIAL STATEMENTS—(Continued)
Components of net periodic benefit costs for fiscal years 2007, 2006 and 2005 are as follows (inthousands):
U.S. Plans Non-U.S.Pension Benefits Plans Pension Benefits
2007 2006 2005 2007 2006 2005(In Thousands, Except Percent Data)
Components of net periodicbenefit cost:Current service costs . . . . . . . . $ — $ — $ — $ 2,418 $ 2,452 $ 2,633Interest costs on projected
benefit obligation and other . . 736 717 724 5,025 5,245 5,117Return on plan assets . . . . . . . (1,485) (1,425) (961) 424 (6,287) (11,917)Settlement loss . . . . . . . . . . . . — — — 3,849 — —Net amortization of transition
obligation and other . . . . . . . 559 607 250 (6,270) (306) 6,668
Periodic benefit cost, net . . . . . $ (190) $ (101) $ 13 $ 5,446 $ 1,104 $ 2,501
Weighted average assumptionrates:Return on plan assets . . . . . . . 8.0% 8.0% 8.0% 2.375-7.5% 2.2-7.5% 6.5-7.5%Discount rate on projected
benefit obligations . . . . . . . . 5.75 5.75 5.75 5.30-8.25 4.50-5.00 4.25-5.25Salary and wage escalation rate N/A N/A N/A 2.0-3.0 2.0-3.0 2.0-3.0
Non-U.S.U.S. Postretirement Postretirement
Benefit Plans Benefit Plans2007 2006 2005 2007 2006 2005
(In Thousands, Except Percent Data)Components of net periodic benefit
cost:Current service costs . . . . . . . . . . . . $ 103 $217 $132 $ 42 $ 78 $ 81Interest costs on projected benefit
obligation and other . . . . . . . . . . . 171 212 190 314 348 376Plan amendment . . . . . . . . . . . . . . . — — — — — —Curtailment/settlement (gain) loss . . . (3,303) — — — — —Net amortization of transition
obligation and other . . . . . . . . . . . (211) (26) (37) (252) (94) 1,020
Periodic benefit cost, net . . . . . . . . . $(3,240) $403 $285 $ 104 $ 332 $ 1,477
Weighted average assumption rates:Discount rate on projected benefit
obligations . . . . . . . . . . . . . . . . . . 5.75% 5.75% 5.75% 5.00-5.25% 5.00-5.25% 5.25-5.75%
Discount rates are primarily based on the market yields of global bond indices for AA-ratedcorporate bonds, applied to a portfolio for which the term and currency correspond with the estimatedterm and currency of the obligation. During fiscal 2008, the Company expects to recognize amortizationof actuarial gains/losses, prior service cost and transition obligation as components of net periodicbenefit cost in the amounts of $(0.1) million, $0.4 million and $0.1 million, respectively.
84

POLYMER GROUP, INC.
NOTES TO CONSOLIDATED FINANCIAL STATEMENTS—(Continued)
During the first quarter of fiscal 2006, as part of its restructuring and related cost reduction initiativesfor Oriented Polymers, the Company negotiated certain changes with the union representing theemployees of one of the Company’s Canadian operations, including a partial curtailment of a definedbenefit pension plan. No net gain or loss was incurred as a result of the partial curtailment. However,based on elections made by plan participants during the second quarter of fiscal 2006, and as approvedby Canadian regulatory authorities on January 16, 2007, the Company incurred a settlement lossassociated with employees who have exited the plan. The loss incurred as a result of the partialsettlement of the defined benefit pension plan, consisting of the recognition of previously unamortizedactuarial losses in the amount of approximately $3.8 million, was recognized in the first quarter of fiscal2007 commensurate with governmental approval of the terms of the settlement and upon fulfillment bythe Company of its funding requirements in February 2007. Additionally, the Company approvedamendments to various postretirement benefit plans in the U.S. which curtailed or eliminated definedbenefits previously available under the plans. The amendments, as adopted, eliminated thepostretirement benefit for all current retirees of the Company, and substantially all active employees, asof the end of fiscal 2007. In accordance with SFAS No. 106 ‘‘Employers’ Accounting for PostretirementBenefits Other Than Pensions’’ (as amended), the Company recognized a gain in the fourth quarter offiscal 2007 of approximately $3.3 million on the settlement of such plans.
The assumed annual composite rate of increase in the per capita cost of Company provided healthcare benefits are reflected in the following table:
CompositeRate
Year of Increase
2008 . . . . . . . . . . . . . . . . . . . . . . . . . . . . . . . . . . . . . . . . . . . . . . . . 8.0%2009 . . . . . . . . . . . . . . . . . . . . . . . . . . . . . . . . . . . . . . . . . . . . . . . . 7.5%2010 . . . . . . . . . . . . . . . . . . . . . . . . . . . . . . . . . . . . . . . . . . . . . . . . 7.0%2011 . . . . . . . . . . . . . . . . . . . . . . . . . . . . . . . . . . . . . . . . . . . . . . . . 6.5%2012 . . . . . . . . . . . . . . . . . . . . . . . . . . . . . . . . . . . . . . . . . . . . . . . . 6.0%2013 . . . . . . . . . . . . . . . . . . . . . . . . . . . . . . . . . . . . . . . . . . . . . . . . 5.5%2014 and thereafter . . . . . . . . . . . . . . . . . . . . . . . . . . . . . . . . . . . . . 5.0%
A one-percentage point increase in the assumed health care cost trend rate would have increasedaggregate service and interest cost in 2007 by $0.1 million and the accumulated postretirement benefitobligation as of December 29, 2007 by $0.4 million. A one-percentage point decrease in the assumedhealth care cost trend rate would have decreased aggregate service and interest cost in 2007 by$0.1 million and the accumulated postretirement benefit obligation as of December 29, 2007 by$0.3 million.
The plan sponsor selects the expected long-term rate-of-return on assets assumption inconsultation with their investment advisors and actuary. This rate is intended to reflect the average rate ofearnings expected to be earned on the funds invested or to be invested to provide plan benefits.Historical performance is reviewed, especially with respect to real rates of return (net of inflation), for themajor asset classes held or anticipated to be held by the trust, and for the trust itself. Undue weight is notgiven to recent experience, that may not continue over the measurement period, with higher significanceplaced on current forecasts of future long-term economic conditions.
Because assets are held in a qualified trust, anticipated returns are not reduced for taxes. Further,solely for this purpose, the plans are assumed to continue in force and not terminate during the periodduring which assets are invested. However, consideration is given to the potential impact of current andfuture investment policy, cash flow into and out of the trust, and expenses (both investment and
85

POLYMER GROUP, INC.
NOTES TO CONSOLIDATED FINANCIAL STATEMENTS—(Continued)
non-investment) typically paid from plan assets (to the extent such expenses are not explicitly estimatedwithin periodic cost).
The plans’ weighted-average asset allocations by asset category are as follows:
2007 2006
Equity Securities . . . . . . . . . . . . . . . . . . . . . . . . . . . . . . . . . . . . . . 40% 38%Debt Securities . . . . . . . . . . . . . . . . . . . . . . . . . . . . . . . . . . . . . . . 55 45Other . . . . . . . . . . . . . . . . . . . . . . . . . . . . . . . . . . . . . . . . . . . . . . 5 17
Total . . . . . . . . . . . . . . . . . . . . . . . . . . . . . . . . . . . . . . . . . . . . . 100% 100%
The trust funds are sufficiently diversified to maintain a reasonable level of risk without imprudentlysacrificing return, with an overall targeted asset allocation of 40%-55% fixed income debt securities,40%-55% equity securities and the remainder in cash or cash equivalents. The Investment Managersselect investment fund managers with demonstrated experience and expertise, and funds withdemonstrated historical performance, for the implementation of the Plans’ investment strategy. TheInvestment Managers will consider both actively and passively managed investment strategies and willallocate funds across the asset classes to develop an efficient investment structure.
It is the responsibility of the Trustee to administer the investments of the Trust within reasonablecosts. These costs include, but are not limited to, management and custodial fees, consulting fees,transaction costs and other administrative costs chargeable to the Trust.
The Company’s practice is to fund amounts for its qualified pension plans at least sufficient to meetthe minimum requirements set forth in applicable employee benefit laws and local tax laws. Liabilities foramounts in excess of these funding levels are included in the Consolidated Balance Sheet. Employercontributions to its pension plans in 2008 are expected to approximate $4.0 million.
Expected Benefit Payments
The following table reflects the total benefits projected to be paid from the plans, or from theCompany’s general assets, under the current actuarial assumptions used for the calculation of theprojected benefit obligations and, therefore, may differ from projected benefit payments.
The expected level of payments to, or on the behalf of, participants is as follows (in thousands):
Pension Postretirement
2008 . . . . . . . . . . . . . . . . . . . . . . . . . . . . . . . . . . . . . . $ 5,619 $ 5072009 . . . . . . . . . . . . . . . . . . . . . . . . . . . . . . . . . . . . . . 6,133 5092010 . . . . . . . . . . . . . . . . . . . . . . . . . . . . . . . . . . . . . . 6,098 4742011 . . . . . . . . . . . . . . . . . . . . . . . . . . . . . . . . . . . . . . 6,313 4722012 . . . . . . . . . . . . . . . . . . . . . . . . . . . . . . . . . . . . . . 6,889 4632013-2017 . . . . . . . . . . . . . . . . . . . . . . . . . . . . . . . . . . 36,724 2,207
The Company sponsors several defined contribution plans through its domestic subsidiariescovering employees who meet certain service requirements. The Company makes contributions to theplans based upon a percentage of the employees’ contribution in the case of its 401(k) plans or upon apercentage of the employees’ salary or hourly wages in the case of its noncontributory money purchaseplans. The cost of the plans was $2.1 million, $2.5 million and $2.3 million for fiscal 2007, 2006 and 2005,respectively.
86

POLYMER GROUP, INC.
NOTES TO CONSOLIDATED FINANCIAL STATEMENTS—(Continued)
Note 12. Stock Option and Restricted Stock Plans
Stock Option Plans
The 2003 Stock Option Plan (the ‘‘2003 Option Plan’’), which expires December 3, 2013, wasapproved by the Company’s Board of Directors and shareholders and is administered by theCompensation Committee of the Board of Directors. The 2003 Option Plan approved the issuance of400,000 non-qualified stock options to acquire shares of the Company’s Class A Common Stock. Thestock options have a five-year life and vest, based on the achievement of various service and financialperformance criteria, over a four-year period, with the initial awards beginning their vesting terms as ofJanuary 4, 2004. Vesting of the stock options may be accelerated on the occurrence of a change incontrol or other events, as defined. With respect to post-vesting restrictions, the 2003 Option Planprovides that each option must be exercised, if at all, upon the earlier to occur of (i) the date that is fiveyears after the award date of the option or (ii) concurrently upon the consummation of a change incontrol, as defined. As of December 29, 2007 and December 30, 2006, the Company had awardedgrants of non-qualified stock options to purchase 380,675 shares and 310,500 shares of the Company’sClass A Common Stock, respectively. Accordingly, at December 29, 2007, there remain 19,325 stockoptions available to be awarded pursuant to the 2003 Option Plan.
The Company accounts for the 2003 Option Plan in accordance with the methodology defined inSFAS No. 123(R). Prior to fiscal 2006, the Company elected to account for the 2003 Option Plan inaccordance with the intrinsic value method as prescribed by APB No. 25. As of December 29, 2007, withrespect to the 380,675 options to purchase Class A Common Stock awarded under the 2003 OptionPlan, 53,475 are subject to future vesting based on the attainment of future performance targets, whichtargets had not been established as of December 29, 2007. Accordingly, pursuant to the provisions ofSFAS No. 123(R), 327,200 options to purchase Class A Common Stock have been considered grantedunder the 2003 Option Plan as of December 29, 2007. For fiscal 2007, the Company achieved 51% of itsperformance targets; accordingly, the Company recognized compensation costs for 51% of thecompensation attributable to performance-based awards for the 2007 fiscal year. For fiscal 2006, nocompensation costs were recognized for awards with performance-based vesting as the performancetargets were not achieved. For fiscal 2005, full compensation costs were recognized for awards withperformance-based targets since such targets were achieved. The compensation costs related to the2003 Option Plan were $1.1 million, $0.2 million and $2.2 million during fiscal years 2007, 2006 and2005, respectively, and were included in Selling, general and administrative expenses in theConsolidated Statements of Operations. Had the compensation expense methodology defined in SFASNo. 123(R) been applied for all periods presented, the Company’s net earnings and earnings percommon share for fiscal year 2005 would have been impacted as summarized in the discussion of theCompany’s stock-based compensation accounting policy in Note 2 to the Consolidated FinancialStatements.
87

POLYMER GROUP, INC.
NOTES TO CONSOLIDATED FINANCIAL STATEMENTS—(Continued)
The following table summarizes the stock option activity related to the 2003 Option Plan for theyears ended December 29, 2007, December 30, 2006 and December 31, 2005:
2007 2006 2005
Unexercised options outstanding—beginning of period . . . . . . . . . . 310,500 400,000 225,313Granted . . . . . . . . . . . . . . . . . . . . . . . . . . . . . . . . . . . . . . . . . . . 76,300 — 174,687Exercised . . . . . . . . . . . . . . . . . . . . . . . . . . . . . . . . . . . . . . . . . — — —Forfeited . . . . . . . . . . . . . . . . . . . . . . . . . . . . . . . . . . . . . . . . . . 6,125 89,500 —Expired/canceled . . . . . . . . . . . . . . . . . . . . . . . . . . . . . . . . . . . . — — —
Unexercised options outstanding—end of period . . . . . . . . . . . . . . . 380,675 310,500 400,000
All options granted under the 2003 Option Plan provide for an exercise price of $6.00 per share. Theweighted average grant date fair value of options granted in fiscal 2007 and fiscal 2005 was $26.32 and$17.95, respectively.
2007 2006 2005
Exercisable options:Vested options as of year-end . . . . . . . . . . . . . . . . . . . . 199,352 174,454 156,328Exercisable options as of year-end . . . . . . . . . . . . . . . . . — — —Shares available for future grant as of year-end . . . . . . . . 19,325 89,500 —
Weighted average exercise price per share . . . . . . . . . . . . $ 6.00 $ 6.00 $ 6.00
Information regarding the Company’s stock options granted, as defined by SFAS No. 123(R), andoutstanding as of December 29, 2007 is as follows:
ExpectedVested to Vest
For options granted and outstanding:Number of options . . . . . . . . . . . . . . . . . . . . . . . . . . . . . . . . . . . . 199,352 127,848Weighted average exercise price . . . . . . . . . . . . . . . . . . . . . . . . . . $ 6.00 $ 6.00Aggregate intrinsic value (in $000s) . . . . . . . . . . . . . . . . . . . . . . . . $ 2,791 $ 1,790
For nonvested options:Compensation cost not yet recognized (in $000s) . . . . . . . . . . . . . . $ 1,656Weighted average period of recognition (years) . . . . . . . . . . . . . . . 0.9
The fair value of options granted is estimated using a Black-Scholes option pricing model using thefollowing assumptions:
2007 2006 2005
Annual dividend yield . . . . . . . . . . . . . . . . . . . . . . . . . . . . . . . 0.0% 0.0% 0.0%Weighted average expected life (years) . . . . . . . . . . . . . . . . . . 2.6 3.4 4.4Risk-free interest rate . . . . . . . . . . . . . . . . . . . . . . . . . . . . . . . 4.6% 4.3% 3.9%Expected volatility . . . . . . . . . . . . . . . . . . . . . . . . . . . . . . . . . 39.3% 41.0% 37.0%Weighted average fair value per option granted . . . . . . . . . . . . $26.32 $18.87 $17.95
Expected volatility is based primarily on historical volatility. Historical volatility was computed usingdaily price observations for the period subsequent to the Effective Date. The Company believes this
88

POLYMER GROUP, INC.
NOTES TO CONSOLIDATED FINANCIAL STATEMENTS—(Continued)
method produces an estimate that is representative of our expectations of the volatility over the expectedlife of its options. The Company has no reason to believe future volatility over the expected life of theseoptions is likely to differ materially from historical volatility. The weighted-average expected life is basedon the mandatory exercise provisions contained in the 2003 Option Plan. The risk-free interest rate isbased on the U.S. treasury security rate estimated for the expected life of the options at the date of grant.
SFAS No. 123(R) requires the estimation of forfeitures when recognizing compensation expenseand that the estimate of forfeiture be adjusted over the requisite service period should actual forfeituresdiffer from such estimates. Changes in estimated forfeitures, if significant, are recognized through acumulative adjustment, which is recognized in the period of change and which impacts the amount ofunamortized compensation expense to be recognized in future periods.
Restricted Stock Plans
2004 Restricted Stock Plan for Directors
The Company’s shareholders and Board of Directors approved the 2004 Polymer Group, Inc.Restricted Stock Plan for Directors (the ‘‘2004 Restricted Plan’’), which expires in 2014, for the issuanceof restricted shares of the Company’s Class A Common Stock to Directors of the Company, as defined inthe 2004 Restricted Plan. The 2004 Restricted Plan approved for issuance 200,000 restricted shares andis administered by a committee of the Company’s Board of Directors not eligible to receive restrictedshares under the 2004 Restricted Plan.
In fiscal 2007, 2006 and 2005, the Company awarded 7,920, 9,313 and 3,240 restricted shares,respectively, to members of the Company’s Board of Directors for their Board service to the Company. Inaddition, 12,500 restricted shares were approved for issuance by the Company’s Board of Directors inSeptember 2006 to the Company’s Chairman of the Board as a component of his compensation forserving as interim Chief Executive Officer. The cost associated with these restricted stock grants, whichvest over periods ranging to eighteen months, totaled approximately $0.2 million, $0.5 million and$0.1 million for fiscal years 2007, 2006 and 2005, respectively, and was included in Selling, general andadministrative expenses in the Consolidated Statements of Operations.
Additionally, in April 2007, 50,000 restricted shares were issued pursuant to the terms of theExecutive Employment Agreement entered into with the Company’s Chief Executive Officer. Suchshares vest over a four year service period effective April 23, 2007, and such vesting will be acceleratedupon a change in control and the completion of a minimum service period, as defined. Thecompensation costs associated with such restricted shares issued under the terms of the ExecutiveEmployment Agreement totaled $0.2 million for fiscal 2007 and were included in Selling, general andadministrative expenses in the Consolidated Statement of Operations. Compensation cost not yetrecognized for such nonvested restricted shares issued under the terms of the Executive EmploymentAgreement was approximately $1.1 million as of December 29, 2007, and the weighted average periodof recognition for such compensation was 1.7 years as of December 29, 2007. Additional paid-in capitalin the Consolidated Balance Sheet as of December 29, 2007 is reflected net of such unearnedcompensation.
As of December 29, 2007, there remain 74,387 shares of the Company’s Class A Common Stockavailable to be awarded under the 2004 Restricted Plan.
89
POLYMER GROUP, INC.
NOTES TO CONSOLIDATED FINANCIAL STATEMENTS—(Continued)
2005 Employee Restricted Stock Plan
The Company’s 2005 Employee Restricted Stock Plan (the ‘‘2005 Stock Plan’’) was approved bythe Company’s Board of Directors and shareholders and is administered by the CompensationCommittee of the Company’s Board of Directors. The 2005 Stock Plan, which expires in 2015, approvedfor issuance 482,000 restricted shares to employees of the Company. The Compensation Committeemay, from time to time, award up to 384,000 shares of restricted stock under the 2005 Stock Plan to suchemployees and in such amounts and with specified restrictions as it determines appropriate in thecircumstances. The award of shares of restricted stock by the Compensation Committee in excess of the384,000 shares will also require the approval of the Board of Directors of the Company. Other than forcertain shares initially awarded and immediately vested on January 20, 2006, shares awarded under the2005 Stock Plan primarily vest 25% on each of the grant’s anniversary dates based on a combination ofservice and/or the achievement of certain performance targets. Vesting of the restricted shares, otherthan those shares issued pursuant to the terms of the Executive Employment Agreement entered intowith the Company’s Chief Executive Officer, may be accelerated on the occurrence of a change incontrol or other events, as defined. Vesting of shares awarded under the Executive EmploymentAgreement will be accelerated under a change in control and the completion of a minimum serviceperiod, as defined.
During fiscal 2007, 71,800 restricted shares were awarded to certain employees of the Company, ofwhich 50,000 shares were awarded under the terms of the Executive Employment Agreement enteredinto with the Company’s Chief Executive Officer. In addition, 12,439 shares were surrendered duringfiscal 2007 by employees to satisfy withholding requirements and 4,510 shares were forfeited duringfiscal 2007.
During fiscal 2006, 291,500 restricted shares were awarded to certain employees of the Company.In addition, 47,688 shares were surrendered during fiscal 2006 by employees to satisfy withholdingrequirements and 25,144 shares were forfeited during fiscal 2006.
A summary of the status of the Company’s nonvested shares issued under the 2005 Stock Plan asof December 29, 2007, and changes for the year ended December 29, 2007, is presented below:
Weighted-Average
Grant DateShares Fair Value
Nonvested shares at December 30, 2006 . . . . . . . . . . . . . . . . . . . . 96,842 $23.87Shares:
Granted . . . . . . . . . . . . . . . . . . . . . . . . . . . . . . . . . . . . . . . . . . . 40,015 26.50Vested . . . . . . . . . . . . . . . . . . . . . . . . . . . . . . . . . . . . . . . . . . . . (29,492) 23.68Forfeited . . . . . . . . . . . . . . . . . . . . . . . . . . . . . . . . . . . . . . . . . . (4,000) 24.02
Nonvested shares at December 29, 2007 . . . . . . . . . . . . . . . . . . . . 103,365 24.93
The total fair value of shares vested during the fiscal years ended December 29, 2007 andDecember 30, 2006 was $0.7 million and $2.6 million, respectively.
The compensation costs associated with the 2005 Stock Plan totaled $1.1 million and $4.2 millionfor fiscal years 2007 and 2006, respectively, and were included in Selling, general and administrativeexpenses in the Consolidated Statements of Operations. As of December 29, 2007, awards of 273,519
90

POLYMER GROUP, INC.
NOTES TO CONSOLIDATED FINANCIAL STATEMENTS—(Continued)
shares of the Company’s Class A Common Stock were outstanding and 208,481 shares were availablefor future award under the 2005 Stock Plan.
The Company accounts for the 2005 Stock Plan in accordance with the methodology defined inSFAS No. 123(R). As of December 29, 2007, of the 273,519 shares awarded and outstanding under the2005 Stock Plan, 50,640 shares are subject to future vesting based on the attainment of futureperformance targets, which targets had not been established as of December 29, 2007. Additionally,25,000 shares are guaranteed to be awarded to the Company’s Chief Executive Officer on April 23, 2008under the terms of the Executive Employment Agreement. Accordingly, pursuant to the provisions ofSFAS 123(R), 247,879 restricted shares are considered granted under the 2005 Stock Plan as ofDecember 29, 2007. Compensation cost not yet recognized for nonvested restricted shares consideredgranted under the 2005 Stock Plan was approximately $1.8 million as of December 29, 2007, and theweighted average period of recognition for such compensation was 1.4 years as of December 29, 2007.Additional paid-in capital in the Consolidated Balance Sheet as of December 29, 2007 is reflected net ofsuch unearned compensation.
Note 13. Series A Convertible Pay-in-kind Preferred Shares
In conjunction with the Company’s refinancing in April 2004 of the Restructured Credit Facility, theCompany’s majority shareholder exchanged approximately $42.6 million in aggregate principal amountof 10.0% Convertible Subordinated Notes due 2007 (the ‘‘Junior Notes’’) it controlled for 42,633 sharesof the Company’s PIK Preferred Shares. Also, during the third quarter of fiscal 2004, $10.1 million inaggregate principal amount of the Company’s Junior Notes were exchanged for 10,083 shares of theCompany’s PIK Preferred Shares and 6,719 shares of the Company’s Class A Common Stock. SuchJunior Notes were subordinated indebtedness of the Company and provided for interest at an annualrate of 10.0%, which interest, at the option of the holder, could be received in additional principalamounts of the Junior Notes or in cash. The Junior Notes could be converted, at the option of the holder,into shares of Class A Common Stock on the same terms as included in the PIK Preferred Shares (aconversion rate of 137.14286 shares of Class A Common Stock per share of the convertible security,which approximates an initial conversion price of approximately $7.29 per share). As the aforementionedexchanges were a component of the recapitalization of the Company, involving the majority shareholderand other common shareholders of the Company and the exchange by the majority shareholder was arequirement of the then new Bank Facility, the exchanges have been accounted for as a capitaltransaction and, accordingly, no gain or loss was recognized.
Dividends on the PIK Preferred Shares accrued at an annual rate of 16.0% and were payablesemi-annually in arrears on each January 1 and July 1, commencing with July 1, 2004. Such dividendswere payable at the option of the Company; (i) through the issuance of additional shares of PIK PreferredStock; (ii) in cash; or (iii) in a combination thereof. Accordingly, the Company accrued dividends at thestated rate of 16.0% until such time as the form of the dividend was declared by the Company’s Board ofDirectors. If the dividend was paid-in-kind through the issuance of additional shares of PIK PreferredStock, the Company recognized the dividend at the estimated fair value of the shares issued in excess ofthe amounts previously accrued. At any time prior to June 30, 2012, the holders of the PIK PreferredShares could have elected to convert any or all of their PIK Preferred Shares into shares of theCompany’s Class A Common Stock at an initial conversion rate of 137.14286 shares of Class A CommonStock per share of PIK Preferred Shares which approximates an initial conversion price equal to $7.29per share.
91

POLYMER GROUP, INC.
NOTES TO CONSOLIDATED FINANCIAL STATEMENTS—(Continued)
On January 14, 2005, the Company’s Board of Directors declared that dividends accrued on the PIKPreferred Shares from the date of issuance through December 31, 2004, in the amount of $5.6 million,would be paid in the form of PIK Preferred Shares. The Company recorded the value of the additional PIKPreferred Shares declared as a dividend on January 14, 2005, the date the Board of Directors declaredthat the accrued dividends were to be paid in the form of additional PIK Preferred Shares, rather thancash, reduced by the amount of dividends previously recorded at the stated 16.0% rate. Using theestimated market value of the Company’s Class A Common Stock of $18.50 per share, the fair value ofthe 5,540 additional PIK Preferred Shares issued in lieu of cash payment was approximately$14.1 million, which exceeded the amount previously accrued by the Company of $5.6 million, based onthe stated rate of 16.0%, by approximately $8.5 million. On August 3, 2005, the Company’s Board ofDirectors declared that dividends accrued on the PIK Preferred Shares from January 1, 2005 throughJune 30, 2005, in the amount of $4.7 million, would be paid in the form of PIK Preferred Shares. TheCompany recorded the value of the additional PIK Preferred Shares declared as a dividend on August 3,2005, the date the Board of Directors declared that the accrued dividends were to be paid in the form ofadditional PIK Preferred Shares, rather than cash, reduced by the amount of dividends previouslyrecorded at the stated 16.0% rate. Using the estimated market value of the Company’s Class A CommonStock of $27.70 per share, the fair value of the 4,660 additional PIK Preferred Shares issued in lieu ofcash payment was approximately $17.7 million, which exceeded the amount previously accrued by theCompany of $4.7 million, based on the stated rate of 16.0%, by approximately $13.0 million. In addition,the Company accrued a charge for dividends of $1.8 million for the period from July 2, 2005 through thedate that the PIK Preferred Shares were redeemed for, or converted to, shares of the Company’s Class ACommon Stock, as described below. Accordingly, total accrued and paid-in-kind dividends amounted to$28.0 million in fiscal year 2005.
Also, on July 28, 2005, the Company’s Board of Directors authorized the redemption of all of theCompany’s PIK Preferred Shares on or before September 30, 2005. On August 16, 2005, the Board ofDirectors set September 15, 2005 as the redemption date (the ‘‘Redemption Date’’). In accordance withthe terms of the PIK Preferred Shares, the Company would redeem all PIK Preferred Shares outstandingat the Redemption Date at a redemption rate of 37.26397 shares of Class A Common Stock per PIKPreferred Share. At any time prior to the Redemption Date, holders of PIK Preferred Shares couldexercise their right to convert their PIK Preferred Shares into shares of Class A Common Stock at aconversion rate of 137.14286 shares of Class A Common Stock per PIK Preferred Share.
As of the close of business on the Redemption Date, five PIK Preferred Shares had been redeemedby the Company with the redemption price being paid by the issuance of 187 shares of Class A CommonStock. Additionally, 62,916 PIK Preferred Shares had been converted by holders into 8,628,473 shares ofClass A Common Stock. Also, during the first quarter of fiscal 2005, five PIK Preferred Shares wereconverted into 686 shares of Class A Common Stock. As a result of these transactions, 8,629,346additional shares of Class A Common Stock are now issued and outstanding and no PIK PreferredShares are currently issued or outstanding.
Note 14. Derivatives and Other Financial Instruments and Hedging Activities
The Company uses derivative financial instruments to manage market risks and reduce its exposureto fluctuations in interest rates and foreign currencies. All hedging transactions are authorized andexecuted under clearly defined policies and procedures, which prohibit the use of financial instrumentsfor trading purposes.
92

POLYMER GROUP, INC.
NOTES TO CONSOLIDATED FINANCIAL STATEMENTS—(Continued)
The Company uses interest-rate derivative instruments to manage its exposure related tomovements in interest rates with respect to its debt instruments. As indicated in Note 9 to theConsolidated Financial Statements, to mitigate its interest rate exposure as required by the CreditFacility, the Company has entered into a pay-fixed, receive-variable interest rate swap, effectivelyconverting the variable LIBOR-based interest payments associated with $240.0 million of the debt tofixed amounts at a LIBOR rate of 5.085%. The notional amount of this contract, which became effectiveon May 8, 2007 and expires on June 29, 2009, was $240.0 million. Cash settlements are made quarterlyand the floating rate is reset quarterly, coinciding with the reset dates of the current Credit Facility.Previously, the Company had a similar pay-fixed, receive-variable interest rate swap contract, whicheffectively converted the variable LIBOR-based interest payments associated with $212.5 million of thedebt to fixed amounts at a LIBOR rate of 3.383%, which expired on May 8, 2007.
In accordance with SFAS No. 133, the Company designated these swaps as cash flow hedges ofthe variability of interest payments with changes in fair value of the swap recorded to Accumulated othercomprehensive income in the Consolidated Balance Sheets. The fair value of the interest rate swap thatexpires on June 29, 2009, based on current settlement values, was an obligation of $4.3 million as ofDecember 29, 2007. That amount is included in Other noncurrent liabilities in the Consolidated BalanceSheets. The fair value of the interest rate swap that expired on May 8, 2007 was an asset of $1.5 million asof December 30, 2006. That amount was included in Other noncurrent assets in the ConsolidatedBalance Sheets.
The impacts of these swaps on Interest expense, net in the Consolidated Statements of Operationswere decreases of $1.8 million and $3.7 million for fiscal years 2007 and 2006, respectively, and anincrease of $0.2 million for fiscal 2005.
During fiscal years 2006 and 2005, the Company used foreign exchange forward contracts tomanage its U.S.-dollar exposure on Euro-based obligations for firm commitments. There were nooutstanding foreign exchange forward contracts with third party financial institutions at December 30,2006 or December 29, 2007.
Note 15. Earnings Per Share and Shareholders’ Equity
As of December 29, 2007 and December 30, 2006, the Company’s authorized capital stockconsisted of the following classes of stock:
Type Par Value Authorized Shares
Preferred stock . . . . . . . . . . . . . . . . . . . . . . . . . . . . $.01 173,000Class A common stock . . . . . . . . . . . . . . . . . . . . . . $.01 39,200,000Class B convertible common stock . . . . . . . . . . . . . . $.01 800,000Class C convertible common stock . . . . . . . . . . . . . . $.01 118,453Class D convertible common stock . . . . . . . . . . . . . . $.01 498,688Class E convertible common stock . . . . . . . . . . . . . . $.01 523,557
All classes of the common stock have similar voting rights. In accordance with the Amended andRestated Certificate of Incorporation, all shares of Class B, C, D and E Common Stock may be convertedinto an equal number of shares of Class A Common Stock. The shares of preferred stock may be issuedfrom time to time with such designation, preferences, participation rights and optional or special rights(including, but not limited to, dividend rates, voting rights, maturity dates and the like) as determined bythe Board of Directors.
93

POLYMER GROUP, INC.
NOTES TO CONSOLIDATED FINANCIAL STATEMENTS—(Continued)
All authorized shares of the Class D Common Stock and Class E Common Stock are issuable uponthe exercise, at $.01 per share, of Series A Warrants and Series B Warrants, respectively (‘‘Warrants’’).Such Warrants have (i) customary adjustments for stock splits, stock dividends, and consolidations,(ii) specified anti-dilution protection for sales of securities by the Company at a price below the fairmarket value of such securities if offered to common stockholders and (iii) specified anti-dilutionprotection for sales of securities by the Company at a discount that exceeds 25% of the fair market valueof such securities. Except as set forth in the preceding sentence, the Warrants do not have anti-dilutionprovisions. The Warrants (a) are exercisable in the event of a notice provided by the Company of adistribution to shareholders of a minimum amount ($600 million in the case of the Series A Warrants, and$1.15 billion in the case of the Series B Warrants), and (b) terminate upon the earlier to occur of(i) March 4, 2010, or (ii) a change in control of the Company (as defined in the Warrant Certificates).Pursuant to the adjustment provisions of the Warrant Certificates, the Company may be required,immediately prior to exercise of the warrants, to increase the authorized shares of Class D CommonStock and Class E Common Stock presented in the table above by 1,564 shares and 1,642 sharesrelating to the Series A Warrants and the Series B Warrants, respectively, if the authorized shares areinsufficient for the number of warrants to be exercised.
Note 16. Segment Information
The Company’s reportable segments consist of its primary operating divisions—Nonwovens andOriented Polymers. This reflects how the overall business is managed by the Company’s seniormanagement and reviewed by the Board of Directors. Each of these businesses sells to differentend-use markets, such as hygiene, medical, wipes, industrial and specialty markets. Sales to P&Gaccounted for more than 10% of the Company’s sales in each of the periods presented. Sales to thiscustomer are reported primarily in the Nonwovens segment and the loss of these sales would have amaterial adverse effect on this segment. The Company recorded charges in the ConsolidatedStatements of Operations during the fiscal years 2007, 2006 and 2005 relating to special charges, netthat have not been allocated to the segment data.
94

POLYMER GROUP, INC.
NOTES TO CONSOLIDATED FINANCIAL STATEMENTS—(Continued)
Financial data by segment is as follows (in thousands):
2007 2006 2005
Net salesNonwovens . . . . . . . . . . . . . . . . . . . . . . . . . . . . . . . . . . . $ 885,672 $ 848,281 $763,777Oriented Polymers . . . . . . . . . . . . . . . . . . . . . . . . . . . . . . 173,991 173,327 185,071
$1,059,663 $1,021,608 $948,848
Operating income (loss)Nonwovens . . . . . . . . . . . . . . . . . . . . . . . . . . . . . . . . . . . $ 79,445 $ 66,586 $ 66,211Oriented Polymers . . . . . . . . . . . . . . . . . . . . . . . . . . . . . . 77 4,340 10,586Unallocated Corporate . . . . . . . . . . . . . . . . . . . . . . . . . . . (18,227) (26,616) (20,793)Eliminations . . . . . . . . . . . . . . . . . . . . . . . . . . . . . . . . . . — 258 259
61,295 44,568 56,263Special (charges) credits, net . . . . . . . . . . . . . . . . . . . . . . (61,734) (38,683) (9)
$ (439) $ 5,885 $ 56,254
Depreciation and amortization expense included in operatingincome (loss)Nonwovens . . . . . . . . . . . . . . . . . . . . . . . . . . . . . . . . . . . $ 45,886 $ 48,998 $ 45,083Oriented Polymers . . . . . . . . . . . . . . . . . . . . . . . . . . . . . . 10,460 10,373 10,643Unallocated Corporate . . . . . . . . . . . . . . . . . . . . . . . . . . . 725 211 106Eliminations . . . . . . . . . . . . . . . . . . . . . . . . . . . . . . . . . . (258) (258) (259)
Depreciation and amortization expense included inoperating income . . . . . . . . . . . . . . . . . . . . . . . . . . . . . 56,813 59,324 55,573
Amortization of loan acquisition costs . . . . . . . . . . . . . . . . 1,386 1,339 1,977
$ 58,199 $ 60,663 $ 57,550
Capital spendingNonwovens . . . . . . . . . . . . . . . . . . . . . . . . . . . . . . . . . . . $ 58,908 $ 64,952 $ 77,088Oriented Polymers . . . . . . . . . . . . . . . . . . . . . . . . . . . . . . 969 2,438 1,814Corporate . . . . . . . . . . . . . . . . . . . . . . . . . . . . . . . . . . . . 843 777 —
$ 60,720 $ 68,167 $ 78,902
Division assetsNonwovens . . . . . . . . . . . . . . . . . . . . . . . . . . . . . . . . . . . $ 772,597 $ 736,754 $715,977Oriented Polymers . . . . . . . . . . . . . . . . . . . . . . . . . . . . . . 85,428 116,368 144,477Corporate . . . . . . . . . . . . . . . . . . . . . . . . . . . . . . . . . . . . 1,350 390 2,096Eliminations . . . . . . . . . . . . . . . . . . . . . . . . . . . . . . . . . . (108,704) (112,222) (97,549)
$ 750,671 $ 741,290 $765,001
95
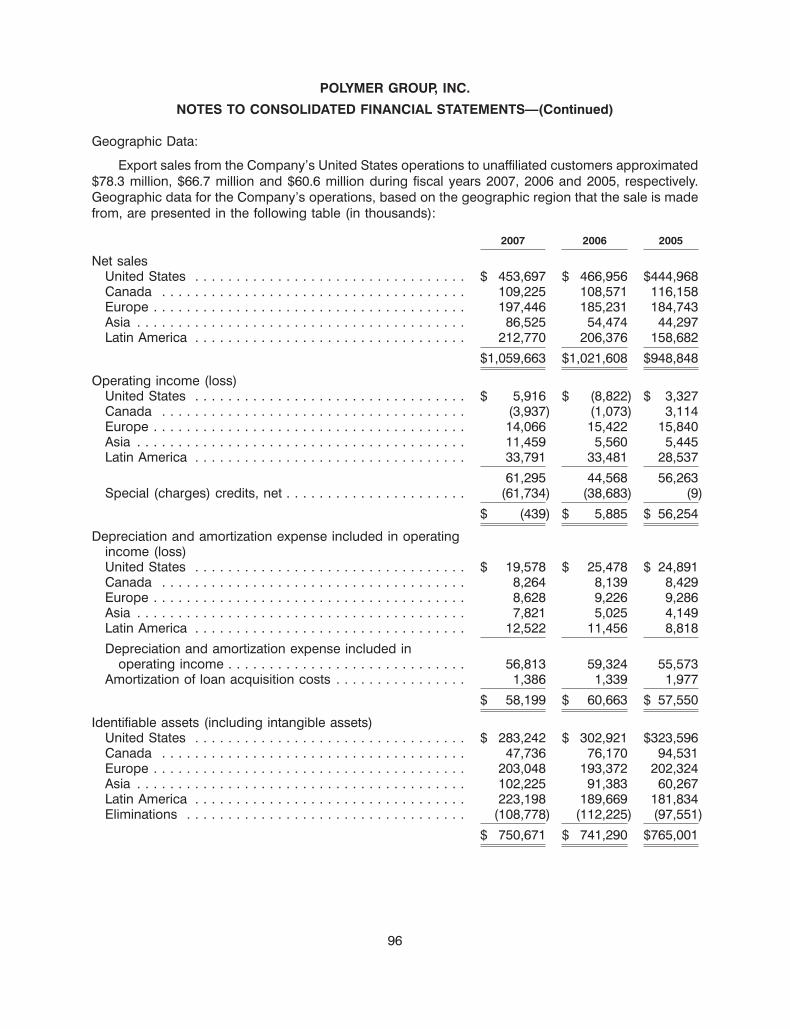
POLYMER GROUP, INC.
NOTES TO CONSOLIDATED FINANCIAL STATEMENTS—(Continued)
Geographic Data:
Export sales from the Company’s United States operations to unaffiliated customers approximated$78.3 million, $66.7 million and $60.6 million during fiscal years 2007, 2006 and 2005, respectively.Geographic data for the Company’s operations, based on the geographic region that the sale is madefrom, are presented in the following table (in thousands):
2007 2006 2005
Net salesUnited States . . . . . . . . . . . . . . . . . . . . . . . . . . . . . . . . . $ 453,697 $ 466,956 $444,968Canada . . . . . . . . . . . . . . . . . . . . . . . . . . . . . . . . . . . . . 109,225 108,571 116,158Europe . . . . . . . . . . . . . . . . . . . . . . . . . . . . . . . . . . . . . . 197,446 185,231 184,743Asia . . . . . . . . . . . . . . . . . . . . . . . . . . . . . . . . . . . . . . . . 86,525 54,474 44,297Latin America . . . . . . . . . . . . . . . . . . . . . . . . . . . . . . . . . 212,770 206,376 158,682
$1,059,663 $1,021,608 $948,848
Operating income (loss)United States . . . . . . . . . . . . . . . . . . . . . . . . . . . . . . . . . $ 5,916 $ (8,822) $ 3,327Canada . . . . . . . . . . . . . . . . . . . . . . . . . . . . . . . . . . . . . (3,937) (1,073) 3,114Europe . . . . . . . . . . . . . . . . . . . . . . . . . . . . . . . . . . . . . . 14,066 15,422 15,840Asia . . . . . . . . . . . . . . . . . . . . . . . . . . . . . . . . . . . . . . . . 11,459 5,560 5,445Latin America . . . . . . . . . . . . . . . . . . . . . . . . . . . . . . . . . 33,791 33,481 28,537
61,295 44,568 56,263Special (charges) credits, net . . . . . . . . . . . . . . . . . . . . . . (61,734) (38,683) (9)
$ (439) $ 5,885 $ 56,254
Depreciation and amortization expense included in operatingincome (loss)United States . . . . . . . . . . . . . . . . . . . . . . . . . . . . . . . . . $ 19,578 $ 25,478 $ 24,891Canada . . . . . . . . . . . . . . . . . . . . . . . . . . . . . . . . . . . . . 8,264 8,139 8,429Europe . . . . . . . . . . . . . . . . . . . . . . . . . . . . . . . . . . . . . . 8,628 9,226 9,286Asia . . . . . . . . . . . . . . . . . . . . . . . . . . . . . . . . . . . . . . . . 7,821 5,025 4,149Latin America . . . . . . . . . . . . . . . . . . . . . . . . . . . . . . . . . 12,522 11,456 8,818
Depreciation and amortization expense included inoperating income . . . . . . . . . . . . . . . . . . . . . . . . . . . . . 56,813 59,324 55,573
Amortization of loan acquisition costs . . . . . . . . . . . . . . . . 1,386 1,339 1,977
$ 58,199 $ 60,663 $ 57,550
Identifiable assets (including intangible assets)United States . . . . . . . . . . . . . . . . . . . . . . . . . . . . . . . . . $ 283,242 $ 302,921 $323,596Canada . . . . . . . . . . . . . . . . . . . . . . . . . . . . . . . . . . . . . 47,736 76,170 94,531Europe . . . . . . . . . . . . . . . . . . . . . . . . . . . . . . . . . . . . . . 203,048 193,372 202,324Asia . . . . . . . . . . . . . . . . . . . . . . . . . . . . . . . . . . . . . . . . 102,225 91,383 60,267Latin America . . . . . . . . . . . . . . . . . . . . . . . . . . . . . . . . . 223,198 189,669 181,834Eliminations . . . . . . . . . . . . . . . . . . . . . . . . . . . . . . . . . . (108,778) (112,225) (97,551)
$ 750,671 $ 741,290 $765,001
96

POLYMER GROUP, INC.
NOTES TO CONSOLIDATED FINANCIAL STATEMENTS—(Continued)
Note 17. Foreign Currency (Gain) Loss, Net
Components of foreign currency (gain) loss are shown in the table below (in thousands):
2007 2006 2005
Included in operating income . . . . . . . . . . . . . . . . . . . . . . . . . . . . . . . . . $(554) $1,229 $ 671Included in other expense (income) . . . . . . . . . . . . . . . . . . . . . . . . . . . . 315 68 (280)
$(239) $1,297 $ 391
For international subsidiaries which have the U.S. dollar as their functional currency, local currencytransactions are remeasured into U.S. dollars, using current rates of exchange for monetary assets andliabilities. Gains and losses from the remeasurement of such monetary assets and liabilities are reportedin Foreign currency (gain) loss, net in the Consolidated Statements of Operations. Likewise, forinternational subsidiaries which have the local currency as their functional currency, gains and lossesfrom the remeasurement of monetary assets and liabilities not denominated in the local currency arereported in Foreign currency (gain) loss, net in the Consolidated Statements of Operations. Additionally,currency gains and losses have been incurred on intercompany loans between subsidiaries, and to theextent that such loans are not deemed to be permanently invested, such currency gains and losses arealso reflected in Foreign currency and other (gain) loss, net in the Consolidated Statements ofOperations.
The Company includes gains and losses on receivables, payables and other operating transactionsas a component of operating income in foreign currency (gain) loss, net. Other foreign currency gainsand losses, primarily related to intercompany loans and debt and other non-operating activities, areincluded in Foreign currency and other (gain) loss, net.
Note 18. Commitments and Contingencies
Non-affiliate Leases
The Company leases certain manufacturing, warehousing and other facilities and equipment underoperating leases. The leases on most of the properties contain renewal provisions. Rent expense (net ofsub-lease income), including incidental leases, approximated $5.7 million, $4.3 million and $3.9 millionin fiscal years 2007, 2006 and 2005, respectively. Rental income approximated $0.2 million in fiscal year2005. There was no rental income in fiscal years 2007 and 2006. The expenses are generally recognizedon a straight-line basis over the life of the lease. The approximate net minimum rental payments requiredunder non-affiliate operating leases that have initial or remaining non-cancelable lease terms in excessof one year at December 29, 2007 are presented in the following table (in thousands):
Gross MinimumRental Payments
2008 . . . . . . . . . . . . . . . . . . . . . . . . . . . . . . . . . . . . . . . . . . . . . . . . . . . . . . . . . $ 3,8682009 . . . . . . . . . . . . . . . . . . . . . . . . . . . . . . . . . . . . . . . . . . . . . . . . . . . . . . . . . 2,6662010 . . . . . . . . . . . . . . . . . . . . . . . . . . . . . . . . . . . . . . . . . . . . . . . . . . . . . . . . . 1,3922011 . . . . . . . . . . . . . . . . . . . . . . . . . . . . . . . . . . . . . . . . . . . . . . . . . . . . . . . . . 1,1552012 . . . . . . . . . . . . . . . . . . . . . . . . . . . . . . . . . . . . . . . . . . . . . . . . . . . . . . . . . 717Thereafter . . . . . . . . . . . . . . . . . . . . . . . . . . . . . . . . . . . . . . . . . . . . . . . . . . . . . 902
$10,700
97

POLYMER GROUP, INC.
NOTES TO CONSOLIDATED FINANCIAL STATEMENTS—(Continued)
Purchase Commitments
At December 29, 2007, the Company had commitments of approximately $73.1 million related tothe purchase of raw materials, maintenance and converting services. Additionally, the Company hasseveral major committed capital projects, including the installment of a new spunmelt line at theCompany’s facility near Buenos Aires, Argentina, the retrofit of an existing hydroentanglement line at theBenson, North Carolina plant to produce Spinlace � products and the installation of a new spunmelt linein San Luis Potosi, Mexico. Total remaining payments with respect to these three major capital expansionprojects as of December 29, 2007 totaled approximately $52.5 million, which are expected to besubstantially expended over fiscal year 2008 and the first half of fiscal 2009. As more fully explained inNote 9 of the Consolidated Financial Statements, the Company has obtained local financing to fund asubstantial portion of the capital expansion in Argentina. Additionally, the Company expects to obtainlocal financing subsequent to December 29, 2007 to support a significant portion of the capital cost ofthe expansion in Mexico.
In June 2006, one of the Company’s subsidiaries, Fabpro Oriented Polymers, Inc. (‘‘Fabpro’’)entered an agreement relating to the sale of certain assets for $2.3 million and a supply and marketingrights agreement (‘‘supply agreement’’) with an unrelated third party. Under the terms of the supplyagreement, which has an initial term of 10 years, Fabpro has committed to purchase a minimum level ofproduct (as defined in the supply agreement), representing approximately $7.1 million per year, basedon current sales prices, through the year 2012. In the event that Fabpro does not purchase suchminimum quantities, Fabpro will be obligated to pay a 12.5% penalty on the value of the committedamounts not purchased, based on sales prices in effect at that time.
Collective Bargaining Agreements
At December 29, 2007, the Company had approximately 3,210 employees worldwide. Of this total,approximately 37% of these employees are represented by labor unions or trade councils that haveentered into separate collective bargaining agreements with the Company. Approximately 23% of theCompany’s labor force is covered by collective bargaining agreements that will expire within one year.
Environmental
The Company is subject to a broad range of federal, foreign, state and local laws and regulationsrelating to pollution and protection of the environment. The Company believes that it is currently insubstantial compliance with applicable environmental requirements and does not currently anticipateany material adverse effect on its operations, financial or competitive position as a result of its efforts tocomply with environmental requirements. Some risk of environmental liability is inherent, however, in thenature of the Company’s business and, accordingly, there can be no assurance that materialenvironmental liabilities will not arise.
Litigation
The Company is not currently a party to any pending legal proceedings other than routine litigationincidental to the business of the Company, none of which are deemed material.
On July 5, 2007, the Company received a call from the Division of Enforcement of the United StatesSecurities and Exchange Commission (the ‘‘SEC’’) regarding the investigation in fiscal 2006 by theCompany’s Audit Committee into certain transactions between the Company and an equipment supplierand related matters. The SEC requested documents related to the Audit Committee’s investigation. TheCompany has furnished documents to the SEC in response to this request. In addition, the Company
98

POLYMER GROUP, INC.
NOTES TO CONSOLIDATED FINANCIAL STATEMENTS—(Continued)
has met with the SEC to explain the Audit Committee’s process and to otherwise respond to anyquestions. The Company intends to comply with any additional requests, if any, from the SEC.
Note 19. Quarterly Results of Operations (Unaudited)
Quarterly financial data for the fiscal year ended December 29, 2007 and the fiscal year endedDecember 30, 2006 is presented below (amounts in thousands, except for per share data). All 2007 and2006 fiscal quarters were comprised of 13 weeks.
Quarterly data for fiscal 2007:
First QuarterFourth Quarter Third Quarter Second Quarter Ended
Ended Ended Ended March 31,December 29, 2007 September 29, 2007 June 30, 2007 2007
Operating data:Net sales . . . . . . . . . . . . . . . . . $265,425 $256,186 $271,015 $267,037Gross profit . . . . . . . . . . . . . . . 38,866 39,671 44,288 46,038Net income (loss) . . . . . . . . . . . (21,769) (20,910) 1,243 290Income (loss) applicable to
common shareholders . . . . . . (21,769) (20,910) 1,243 290Income (loss) per common
share—basic . . . . . . . . . . . . . $ (1.12) $ (1.08) $ 0.06 $ 0.01Income (loss) per common
share—diluted . . . . . . . . . . . . $ (1.12) $ (1.08) $ 0.06 $ 0.01
During the fourth quarter of fiscal 2007, the Company recorded special charges, net ofapproximately $31.5 million. See Note 3 to the Consolidated Financial Statements for additional detailsrelated to such special charges, net recognized in fiscal 2007. The Company also recognized gains onthe sale of certain assets of approximately $2.4 million. Additionally, the Company recognized an incometax benefit of $3.5 million on a pre-tax loss of $24.8 million. The effective tax rate for the fourth quarter wasunfavorably impacted by losses in the U.S. and other jurisdictions for which no tax benefit has beenrecognized, as well as the impact of changes in tax legislation. See Note 10 to the ConsolidatedFinancial Statements for additional details related to the fiscal year 2007 income tax provision.
Quarterly data for fiscal 2006:
Fourth Quarter Third Quarter Second Quarter First QuarterEnded Ended Ended Ended
December 30, 2006 September 30, 2006 July 1, 2006 April 1, 2006
Operating data:Net sales . . . . . . . . . . . . . . . . . . $263,875 $248,586 $248,706 $260,441Gross profit . . . . . . . . . . . . . . . . . 41,416 35,130 36,453 43,204Net loss . . . . . . . . . . . . . . . . . . . (18,860) (1,515) (12,552) (1,605)Loss applicable to common
shareholders . . . . . . . . . . . . . . (18,860) (1,515) (12,552) (1,605)Loss per common share—basic . . . $ (0.98) $ (0.08) $ (0.65) $ (0.08)Loss per common share—diluted . . $ (0.98) $ (0.08) $ (0.65) $ (0.08)
During the fourth quarter of fiscal 2006, the Company recorded special charges, net ofapproximately $21.9 million. See Note 3 to the Consolidated Financial Statements for additional detailsrelated to such special charges, net recognized in fiscal 2006. Additionally, the Company recognized an
99

POLYMER GROUP, INC.
NOTES TO CONSOLIDATED FINANCIAL STATEMENTS—(Continued)
income tax expense of $3.6 million on a pre-tax loss of $15.2 million. The effective tax rate for the fourthquarter was unfavorably impacted by losses in the U.S. and other jurisdictions for which no tax benefithas been recognized, as well as an adjustment to tax accruals recorded through the previous quarters.See Note 10 to the Consolidated Financial Statements for additional details related to the fiscal year2006 income tax provision.
Note 20. Supplemental Cash Flow Information
Cash payments of interest and taxes consist of the following (in thousands):
2007 2006 2005
Cash payments of interest, net of amounts capitalized . . . . . . . . . . . $31,833 $27,546 $34,139Cash payments (refunds) of income taxes, net . . . . . . . . . . . . . . . . 7,676 6,498 (9,705)
Noncash investing or financing transactions in fiscal 2007 included the surrender of 12,439 sharesof the Company’s Class A Common Stock to the Company by participants in the 2005 Stock Plan in theamount of $0.3 million to satisfy employee withholding tax obligations. Also, the Company recorded$7.1 million of property, plant and equipment additions, for which payment had not been made as ofDecember 29, 2007 and $1.0 million of proceeds on the sale of certain assets, for which payment had notbeen received as of December 29, 2007.
Noncash investing or financing transactions in fiscal 2006 included the surrender of 47,688 sharesof the Company’s Class A Common Stock to the Company by participants in the 2005 Stock Plan in theamount of $1.3 million to satisfy employee withholding tax obligations.
Noncash investing or financing transactions in fiscal 2005 included: (i) the conversion orredemption of 62,926 shares of the Company’s PIK Preferred Shares into approximately 8,629,346shares of the Company’s Class A Common Stock, (ii) the issuance of 10,200 PIK Preferred Shares aspayment-in-kind, in lieu of cash payment, of approximately $10.3 million of dividends on the Company’sPIK Preferred Shares, which resulted in an additional non-cash dividend charge of approximately$21.5 million in excess of the amounts accrued at the stated dividend rate of 16.0% on the PIK PreferredShares, and (iii) the accrual of $1.8 million of dividends on the PIK Preferred Shares from the date of thelast dividend declaration date to the date the PIK Preferred Stock were redeemed or converted to Class ACommon Stock.
100

ITEM 9. CHANGES IN AND DISAGREEMENTS WITH ACCOUNTANTS ON ACCOUNTING ANDFINANCIAL DISCLOSURE
None.
ITEM 9A. CONTROLS AND PROCEDURES
Evaluation of Disclosure Controls and Procedures
The Company maintains disclosure controls and procedures that are designed to ensure thatinformation required to be disclosed in Securities and Exchange Commission reports is recorded,processed, summarized and reported within the time periods specified in the Securities and ExchangeCommission’s rules and forms, and that such information is accumulated and communicated to theCompany’s management, including the Chief Executive Officer and Chief Financial Officer, asappropriate, to allow timely decisions regarding required disclosure.
Under the direction of our Chief Executive Officer and Chief Financial Officer, management hascarried out an evaluation of the effectiveness of the Company’s disclosure controls and procedures assuch item is defined in Rule 13a-15(e) under the Securities Exchange Act of 1934, as amended (the‘‘Exchange Act’’). Based on that evaluation, the Chief Executive Officer and Chief Financial Officer haveconcluded that these disclosure controls and procedures were effective as of December 29, 2007.
Management’s Report on Internal Control over Financial Reporting
Management is responsible for establishing and maintaining adequate internal control overfinancial reporting for the Company, as such term is defined in Rule 13a-15(f) of the Exchange Act.Internal control over financial reporting is a process designed to provide reasonable assuranceregarding the reliability of financial reporting and the preparation of financial statements for externalpurposes in accordance with accounting principles generally accepted in the United States and includesthose policies and procedures that (i) pertain to the maintenance of records that in reasonable detailaccurately and fairly reflect the transactions and dispositions of the Company’s assets; (ii) providereasonable assurance that transactions are recorded as necessary to permit preparation of financialstatements in accordance with accounting principles generally accepted in the United States, and thatreceipts and expenditures of the Company are being made only in accordance with authorizations of theCompany’s management and directors; and (iii) provide reasonable assurance regarding prevention ortimely detection of unauthorized acquisition, use or disposition of the Company’s assets that could havea material effect on the financial statements.
Because of its inherent limitations, internal control over financial reporting may not prevent or detectmisstatements. Also, projections of any evaluation of effectiveness to future periods are subject to therisk that controls may become inadequate because of changes in conditions, or that the degree ofcompliance with the policies or procedures may deteriorate.
Under the direction of our Chief Executive Officer and Chief Financial Officer, management hasassessed the effectiveness of the Company’s internal control over financial reporting as of December 29,2007. In making this assessment, management used the criteria set forth in the Internal Control—Integrated Framework issued by the Committee of Sponsoring Organizations of the TreadwayCommission (COSO). Based on this assessment, management concluded that the Company’s internalcontrol over financial reporting was effective as of December 29, 2007.
Changes in Internal Control over Financial Reporting
There were no changes in the Company’s internal control over financial reporting in the fourthquarter of fiscal 2007 that have materially affected, or are reasonably likely to materially affect, theCompany’s internal control over financial reporting.
101

REPORT OF INDEPENDENT REGISTERED PUBLIC ACCOUNTING FIRM
To the Board of Directors and Shareholders ofPolymer Group, Inc.
We have audited Polymer Group, Inc. (a Delaware corporation) and subsidiaries’ internal controlover financial reporting as of December 29, 2007, based on criteria established in Internal Control—Integrated Framework issued by the Committee of Sponsoring Organizations of the TreadwayCommission (COSO). Polymer Group, Inc.’s management is responsible for maintaining effectiveinternal control over financial reporting and for its assessment of the effectiveness of internal control overfinancial reporting, including the accompanying Management’s Report on Internal Control overFinancial Reporting. Our responsibility is to express an opinion on Polymer Group, Inc. and subsidiaries’internal control over financial reporting based on our audit.
We conducted our audit in accordance with the standards of the Public Company AccountingOversight Board (United States). Those standards require that we plan and perform the audit to obtainreasonable assurance about whether effective internal control over financial reporting was maintained inall material respects. Our audit included obtaining an understanding of internal control over financialreporting, assessing the risk that a material weakness exists, testing and evaluating the design andoperating effectiveness of internal control based on the assessed risk, and performing such otherprocedures as we considered necessary in the circumstances. We believe that our audit provides areasonable basis for our opinion.
A company’s internal control over financial reporting is a process designed to provide reasonableassurance regarding the reliability of financial reporting and the preparation of financial statements forexternal purposes in accordance with generally accepted accounting principles. A company’s internalcontrol over financial reporting includes those policies and procedures that (1) pertain to themaintenance of records that, in reasonable detail, accurately and fairly reflect the transactions anddispositions of the assets of the company; (2) provide reasonable assurance that transactions arerecorded as necessary to permit preparation of financial statements in accordance with generallyaccepted accounting principles, and that receipts and expenditures of the company are being madeonly in accordance with authorizations of management and directors of the company; and (3) providereasonable assurance regarding prevention or timely detection of unauthorized acquisition, use, ordisposition of the company’s assets that could have a material effect on the financial statements.
Because of its inherent limitations, internal control over financial reporting may not prevent or detectmisstatements. Also, projections of any evaluation of effectiveness to future periods are subject to therisk that controls may become inadequate because of changes in conditions, or that the degree ofcompliance with the policies or procedures may deteriorate. In our opinion, Polymer Group, Inc. andsubsidiaries maintained, in all material respects, effective internal control over financial reporting as ofDecember 29, 2007, based on Internal Control—Integrated Framework issued by COSO.
We also have audited, in accordance with the standards of the Public Company AccountingOversight Board (United States), the consolidated balance sheets of Polymer Group, Inc. andsubsidiaries as of December 29, 2007 and December 30, 2006 and the related consolidated statementsof operations, changes in shareholders’ equity and comprehensive income (loss) and cash flows foreach of the three years in the period ended December 29, 2007, and our report dated March 11, 2008expressed an unqualified opinion on those financial statements.
/s/GRANT THORNTON LLPColumbia, South CarolinaMarch 11, 2008
102

ITEM 9B. OTHER INFORMATION
None.
PART III
ITEM 10. DIRECTORS, EXECUTIVE OFFICERS AND CORPORATE GOVERNANCE
Information required by this Item is set forth under the captions ‘‘Nominees for Director’’ and‘‘Executive Officers’’ in our definitive proxy materials, which information is incorporated herein byreference.
Information on the beneficial ownership reporting for our directors, executive officers, and certainbeneficial owners is contained under the caption ‘‘Section 16(a) Beneficial Ownership ReportingCompliance’’ in our definitive proxy materials, which information is incorporated herein by reference.
Information on stockholder nominations to our Board of Directors, Audit Committee and AuditCommittee Financial Expert is set forth under the caption ‘‘Information About the Board of Directors’’ inour definitive proxy materials, which information is incorporated herein by reference.
We have a Code of Conduct that applies to all officers and employees, including our principalexecutive officer, principal financial officer, principal accounting officer, and other key financial andaccounting officers. The Code of Conduct can be found on the Investors’ page of our publicly-availablewebsite (www.polymergroupinc.com). We will post any amendments to the Code of Conduct, and anywaivers that are required to be disclosed by Securities and Exchange Commission regulations, on ourwebsite.
ITEM 11. EXECUTIVE COMPENSATION
Information required under this Item relating to executive compensation and director compensationis set forth under the caption ‘‘Executive Compensation’’ in our definitive proxy materials, whichinformation is incorporated herein by reference.
Information required under this Item relating to Compensation Committee Interlocks and InsiderParticipation is set forth under the caption ‘‘Compensation Committee Interlocks and InsiderParticipation’’ in our definitive proxy materials, which information is incorporated herein by reference.
The Compensation Committee Report required under this Item is set forth under the caption‘‘Compensation Committee Report’’ in our definitive proxy materials, which information is incorporatedherein by reference.
ITEM 12. SECURITY OWNERSHIP OF CERTAIN BENEFICIAL OWNERS AND MANAGEMENTAND RELATED STOCKHOLDER MATTERS
Information required under this Item is set forth under the caption ‘‘Security Ownership of CertainBeneficial Owners and Management and Related Stockholder Matters’’ in our definitive proxy materials,which information is incorporated herein by reference.
103

The following table provides certain information as of December 29, 2007 with respect to our equitycompensation plans:
(c)(a) (b) Number of securities
Number of securities Weighted-average remaining availableto be issued upon exercise price for future issuance under
exercise of of outstanding equity compensation plansoutstanding options, options, (excluding securities
Plan category warrants and rights warrants and rights reflected in column (a))
Equity compensation plansapproved by security holders:—2003 Stock Option Plan . . . . 380,675 $6.00 19,325—2004 Restricted Stock Plan
for Directors(1) . . . . . . . . . . . — — 74,387—2005 Employee Restricted
Stock Plan . . . . . . . . . . . . . . — — 208,481
Total . . . . . . . . . . . . . . . . . . . . . . 380,675 302,193
(1) Under the 2004 Restricted Stock for Directors, and unless otherwise determined by a committee ofour Board of Directors not eligible to receive restricted shares under the plan, $10,000 of a director’syearly fee will be payable in shares of our Class A Common Stock. In addition, directors may elect toreceive restricted stock in lieu of cash payments for director’s fees.
ITEM 13. CERTAIN RELATIONSHIPS AND RELATED TRANSACTIONS, AND DIRECTORINDEPENDENCE
Information required under this Item relating to certain relationships and related transactions is setforth under the caption ‘‘Certain Relationships and Related Transactions’’ in our definitive proxymaterials, which information is incorporated herein by reference.
Information required under this Item relating to director independence is set forth under the caption‘‘Information About the Board of Directors’’ in our definitive proxy materials, which information isincorporated herein by reference.
ITEM 14. PRINCIPAL ACCOUNTANT FEES AND SERVICES
Information required under this Item is set forth under the caption ‘‘Independent PublicAccountants’’ in our definitive proxy materials, which information is incorporated herein by reference.
104

PART IV
ITEM 15. EXHIBITS AND FINANCIAL STATEMENT SCHEDULES
(a) 1. Financial Statements
The following consolidated financial statements and reports of Independent Registered PublicAccounting Firms required by this Item are filed herewith under Item 8 of this Annual Report onForm 10-K:
• Report of Grant Thornton LLP, Independent Registered Public Accounting Firm.
• Consolidated Balance Sheets as of December 29, 2007 and December 30, 2006.
• Consolidated Statements of Operations for the fiscal years ended December 29, 2007,December 30, 2006 and December 31, 2005.
• Consolidated Statements of Changes in Shareholders’ Equity and Comprehensive Income (Loss)for the fiscal years ended December 29, 2007, December 30, 2006 and December 31, 2005.
• Consolidated Statements of Cash Flows for the fiscal years ended December 29, 2007,December 30, 2006 and December 31, 2005.
• Notes to Consolidated Financial Statements for the fiscal years ended December 29, 2007,December 30, 2006 and December 31, 2005.
(a) 2. Financial Statement Schedules
Schedule II—Valuation and Qualifying Accounts (‘‘Schedule II’’). Supplemental schedules otherthan Schedule II are omitted because of the absence of conditions under which they are required orbecause the required information is included in the consolidated financial statements or in the notesthereto.
(a) 3. Exhibits
Exhibits required in connection with this Annual Report on Form 10-K are listed below. Certainexhibits are incorporated by reference to other documents on file with the Securities and ExchangeCommission, with which they are physically filed, to be a part of this report as of their respective dates.
ExhibitNumber Document Description
3.1 Amended and Restated Certificate of Incorporation of the Company. (1)3.2 Amended and Restated By-Laws of the Company. 4.1 Shareholders Agreement, dated as of March 5, 2003. (2)4.2 Amendment No. 1 to Shareholders Agreement, dated as of December 20, 2004. (3)10.1 Credit Agreement, dated as of November 22, 2005, among Polymer Group, Inc. as
Borrower, the Lenders referred to therein, Citicorp North America, Inc. as AdministrativeAgent, Document Agent, Collateral Agent and Syndication Agent, and Citigroup GlobalMarkets Inc., as Sole Lead Arranger and Sole Bookrunner (the ‘‘2005 Credit Agreement’’).(4)
10.2 Security Agreement, by Polymer Group, Inc., and the domestic subsidiaries party thereto,as Grantors, and Citicorp North America, Inc. as Collateral Agent, dated as ofNovember 22, 2005. (5)
10.3 Pledge Agreement, by Polymer Group, Inc., and the domestic subsidiaries party thereto,as pledgors, and Citicorp North America, Inc. as Collateral Agent, dated as ofNovember 22, 2005. (6)
105

ExhibitNumber Document Description
10.4 Guarantee Agreement, dated as of November 22, 2005, among each of the subsidiarieslisted on Schedule I thereto of Polymer Group, Inc., Citicorp North America, Inc. asCollateral Agent and Administrative Agent. (7)
10.5 Amendment No. 1 to the 2005 Credit Agreement, dated as of December 8, 2006. (8)10.6 Executive Employment Agreement, dated as of March 29, 2007, between Polymer
Group, Inc. and Veronica M. Hagen. (9)**10.7 Executive Employment Agreement, dated as of March 24, 2006, between Polymer
Group, Inc. and James L. Schaeffer. (10)*10.8 Executive Employment Agreement, dated as of March 24, 2006, between Polymer
Group, Inc. and Willis C. Moore, III. (11)**10.9 Amendment No. 1, dated as of March 30, 2007, to Executive Employment Agreement,
dated as of March 24, 2006, between Polymer Group, Inc. and Willis C. Moore, III. (12)**10.10 Form of Change in Control Severance Compensation Agreements. (13)**10.11 Polymer Group, Inc. 2003 Stock Option Plan. (14)**10.12 Polymer Group, Inc. 2003 Stock Option Plan Amendments. (15)**10.13 Polymer Group, Inc. 2004 Restricted Stock Plan. (16)**10.14 Polymer Group, Inc. 2005 Stock Option Plan. (17)*10.15 Form of Stock Option Agreement for 2003 Plan. (18)**10.16 Polymer Group, Inc. Short-Term Incentive Compensation Plan. (19)**10.17 Polymer Group, Inc. 2005 Employee Restricted Stock Plan. (20)**10.18 Form of Restricted Stock Award Agreement. (21)**10.19 Termination Agreement, dated as of May 8, 2006, between PGI Nonwovens B.V. and Mr. R.
Altdorf. (22)*10.20 Consulting Agreement, dated as of May 8, 2006, between PGI Nonwovens B.V. and Mr. R.
Altdorf. (23)10.21 Severance Agreement, dated as of October 31, 2006, between James L. Schaeffer and
Polymer Group, Inc. (24)*10.22 Separation Agreement, dated as of November 7, 2006, between James Snyder and
Polymer Group, Inc. (25)*21 List of Subsidiaries of the Company.23.1 Consent of Grant Thornton LLP, Independent Registered Public Accounting Firm.31.1 Certification of Chief Executive Officer pursuant to Section 302 of the Sarbanes-Oxley Act
of 2002.31.2 Certification of Chief Financial Officer pursuant to Section 302 of the Sarbanes-Oxley Act
of 2002.32.1 Certification of Chief Executive Officer pursuant to 18 U.S.C. Section 1350.32.2 Certification of Chief Financial Officer pursuant to 18 U.S.C. Section 1350.
(1) Incorporated by reference to Exhibit 99.1 of the Company’s Quarterly Report on Form 10-Q filedwith the SEC on November 12, 2003.
(2) Incorporated by reference to Exhibit 10.3 of the Company’s Quarterly Report on Form 10-Q filedwith the SEC on May 19, 2003.
(3) Incorporated by reference to Exhibit 4.7 of the Company’s Annual Report on Form 10-K filed with theSEC on March 29, 2005.
(4) Incorporated by reference to Exhibit 10.9 of the Company’s Annual Report on Form 10-K filed withthe SEC on March 16, 2006.
106

(5) Incorporated by reference to Exhibit 10.10 of the Company’s Annual Report on Form 10-K filed withthe SEC on March 16, 2006.
(6) Incorporated by reference to Exhibit 10.11 of the Company’s Annual Report on Form 10-K filed withthe SEC on March 16, 2006.
(7) Incorporated by reference to Exhibit 10.12 of the Company’s Annual Report on Form 10-K filed withthe SEC on March 16, 2006.
(8) Incorporated by reference to Exhibit 10.6 of the Company’s Annual Report on Form 10-K/AAmendment No. 2 filed with the SEC on April 5, 2007.
(9) Incorporated by reference to Exhibit 10.1 of the Company’s Quarterly Report on Form 10-Q filedwith the SEC on May 10, 2007.
(10) Incorporated by reference to Exhibit 10.1 of the Company’s Quarterly Report on Form 10-Q filedwith the SEC on May 11, 2006.
(11) Incorporated by reference to Exhibit 10.2 of the Company’s Quarterly Report on Form 10-Q filedwith the SEC on May 11, 2006.
(12) Incorporated by reference to Exhibit 10.2 of the Company’s Quarterly Report on Form 10-Q filedwith the SEC on May 10, 2007.
(13) Incorporated by reference to Exhibit 10.3 of the Company’s Quarterly Report on Form 10-Q filedwith the SEC on May 11, 2006.
(14) Incorporated by reference to Exhibit 4.3 of the Company’s Registration Statement on Form S-8 filedwith the SEC on December 14, 2004.
(15) Incorporated by reference to Annex I of the Company’s Definitive Proxy Statement on Schedule 14Afiled with the SEC on April 15, 2005.
(16) Incorporated by reference to Exhibit 4.3 of the Company’s Registration Statement on Form S-8 filedwith the SEC on December 14, 2004.
(17) Incorporated by reference to Annex III of the Company’s Definitive Proxy Statement onSchedule 14A filed with the SEC on April 15, 2005.
(18) Incorporated by reference to Exhibit 4.4 of the Company’s Registration Statement on Form S-8 filedwith the SEC on December 14, 2004.
(19) Incorporated by reference to Annex II of the Company’s Definitive Proxy Statement onSchedule 14A filed with the SEC on April 15, 2005.
(20) Incorporated by reference to Annex I of the Company’s Definitive Proxy Statement on Schedule 14Afiled with the SEC on April 21, 2006.
(21) Incorporated by reference to Exhibit 10.1 of the Company’s Current Report on Form 8-K filed withthe SEC on May 30, 2006.
(22) Incorporated by reference to Exhibit 10.1 of the Company’s Quarterly Report on Form 10-Q filedwith the SEC on August 15, 2006.
(23) Incorporated by reference to Exhibit 10.2 of the Company’s Quarterly Report on Form 10-Q filedwith the SEC on August 15, 2006.
(24) Incorporated by reference to Exhibit 10.1 of the Company’s Quarterly Report on Form 10-Q filedwith the SEC on November 9, 2006.
107

(25) Incorporated by reference to Exhibit 10.2 of the Company’s Quarterly Report on Form 10-Q filedwith the SEC on November 9, 2006.
* The Company has no remaining obligations under these agreements. These documents are filed asexhibits to this Annual Report on Form 10-K pursuant to Item 601(b)(10) of Regulation S-K, whichrequires the filing of every material agreement that was entered into not more than two years beforethe filing of this Annual Report on Form 10-K.
** Management contract or compensatory plan or arrangement.
108

POLYMER GROUP, INC.SCHEDULE II—VALUATION AND QUALIFYING ACCOUNTS
(In Thousands)
COLUMN A COLUMN B COLUMN D COLUMN ECOLUMN C
ADDITIONS DEDUCTIONS
Balance at Charged To Charged tobeginning costs and other accounts Balance at
Description of period expenses (Describe) (Describe) end of period
Fiscal Year endedDecember 29, 2007
Allowance for doubtful accounts . . . $ 7,580 (491)(1) (84)(2) 1,433(3) $ 5,572Valuation allowance for deferred tax
assets . . . . . . . . . . . . . . . . . . . 117,427 16,091 39,821(2)(4) 644(8) 172,695Plant realignment . . . . . . . . . . . . . 2,044 23,543 233 19,917(5) 5,903Fiscal Year ended
December 30, 2006Allowance for doubtful accounts . . . $ 9,586 (523)(6) 35(2) 1,518(3) $ 7,580Valuation allowance for deferred tax
assets . . . . . . . . . . . . . . . . . . . 98,536 8,835 11,754(2)(4) 1,698(7) 117,427Plant realignment . . . . . . . . . . . . . 163 7,135 30 5,284(5) 2,044Fiscal Year ended
December 31, 2005Allowance for doubtful accounts . . . $ 9,725 1,350 48(2) 1,537(3) $ 9,586Valuation allowance for deferred tax
assets . . . . . . . . . . . . . . . . . . . 103,854 2,681 — 7,999(2)(8) 98,536Plant realignment . . . . . . . . . . . . . 561 9 (32) 375(5) 163
(1) Reserve adjustments of $1,247, net of current year provision of $756.
(2) Foreign currency translation adjustments.
(3) Uncollectible accounts written-off.
(4) Recognition of additional deferred tax assets and valuation allowances related to temporarydifferences not impacting the Consolidated Statement of Operations and the true-up of deferred taxassets.
(5) Cash payments and adjustments.
(6) Reserve adjustments of $1,232, net of current year provision of $709.
(7) Net reduction to goodwill.
(8) Net reductions due to realizations of deferred tax assets.
109

SIGNATURES
Pursuant to the requirements of Section 13 or 15(d) of the Securities Exchange Act of 1934,the registrant has duly caused this report to be signed on its behalf by the undersigned, thereuntoduly authorized.
POLYMER GROUP, INC.
Date: March 11, 2008 By: /s/ WILLIS C. MOORE, III
Willis C. Moore, IIIChief Financial Officer
110

Pursuant to the requirements of the Securities Exchange Act of 1934, this report has beensigned below by the following persons on behalf of the registrant in the capacities indicated onMarch 11, 2008.
Signature Title
/s/ VERONICA M. HAGENChief Executive Officer and Director
Veronica M. Hagen
/s/ WILLIS C. MOORE, IIIChief Financial Officer
Willis C. Moore, III
/s/ ROBERT J. KOCOUREKChief Accounting Officer
Robert J. Kocourek
/s/ WILLIAM B. HEWITTChairman of the Board of Directors
William B. Hewitt
/s/ PEDRO A. ARIASDirector
Pedro A. Arias
/s/ RAMON BETOLAZADirector
Ramon Betolaza
/s/ LAP WAI CHANDirector
Lap Wai Chan
/s/ EUGENE LINDENDirector
Eugene Linden
/s/ WADE D. NESMITHDirector
Wade D. Nesmith
/s/ JAMES A. OVENDENDirector
James A. Ovenden
/s/ CHARLES E. VOLPEDirector
Charles E. Volpe
111

Exhibit 23.1
CONSENT OF GRANT THORNTON LLP, INDEPENDENT REGISTERED PUBLICACCOUNTING FIRM
We have issued our reports dated March 11, 2008, accompanying the consolidated financialstatements and schedule (which report expressed an unqualified opinion and contains an explanatoryparagraph relating to the adoption of Financial Accounting Standards Board (FASB) InterpretationNo. 48, ‘‘Accounting for Uncertainty in Income Taxes—An Interpretation of FASB Statement No. 109’’,FASB Statement No. 123 (revised 2004), ‘‘Share-Based Payment’’, and FASB Statement No. 158,‘‘Employers’ Accounting for Defined Benefit Pension and Other Postretirement Plans’’) andmanagement’s assessment of the effectiveness of internal control over financial reporting included in theAnnual Report of Polymer Group, Inc. on Form 10-K for the fiscal year ended December 29, 2007. Wehereby consent to the incorporation by reference of said reports in the Registration Statements ofPolymer Group, Inc. on Form S-3/A, Amendment No. 2 (File No. 333-145138, effective November 11,2007) and Form S-8 (File No. 333-131156, effective January 20, 2006).
/s/ GRANT THORNTON LLPColumbia, South CarolinaMarch 11, 2008

Exhibit 31.1
CERTIFICATION PURSUANT TO SECTION 302 OF THE SARBANES-OXLEY ACT OF 2002
I, Veronica M. Hagen, certify that:
1. I have reviewed this Annual Report on Form 10-K of Polymer Group, Inc.;
2. Based on my knowledge, this report does not contain any untrue statement of a material fact oromit to state a material fact necessary to make the statements made, in light of thecircumstances under which such statements were made, not misleading with respect to theperiod covered by this report;
3. Based on my knowledge, the financial statements, and other financial information included inthis report, fairly present in all material respects the financial condition, results of operationsand cash flows of the registrant as of, and for, the periods presented in this report;
4. The registrant’s other certifying officer and I are responsible for establishing and maintainingdisclosure controls and procedures (as defined in Exchange Act Rules 13a-15(e) and15d-15(e)) and internal control over financial reporting (as defined in Exchange ActRules 13a-15(f) and 15d-15(f)) for the registrant and have:
a) Designed such disclosure controls and procedures, or caused such disclosure controlsand procedures to be designed under our supervision, to ensure that material informationrelating to the registrant, including its consolidated subsidiaries, is made known to us byothers within those entities, particularly during the period in which this report is beingprepared;
b) Designed such internal control over financial reporting, or caused such internal controlover financial reporting to be designed under our supervision, to provide reasonableassurance regarding the reliability of financial reporting and the preparation of financialstatements for external purposes in accordance with generally accepted accountingprinciples;
c) Evaluated the effectiveness of the registrant’s disclosure controls and procedures andpresented in this report our conclusions about the effectiveness of the disclosure controlsand procedures, as of the end of the period covered by this report based on suchevaluation; and
d) Disclosed in this report any change in the registrant’s internal control over financialreporting that occurred during the registrant’s most recent fiscal quarter (the registrant’sfourth fiscal quarter in the case of an annual report) that has materially affected, or isreasonably likely to materially affect, the registrant’s internal control over financialreporting; and
5. The registrant’s other certifying officer and I have disclosed, based on our most recentevaluation of internal control over financial reporting, to the registrant’s auditors and the auditcommittee of the registrant’s board of directors (or persons performing the equivalentfunctions):
a) All significant deficiencies and material weaknesses in the design or operation of internalcontrol over financial reporting which are reasonably likely to adversely affect theregistrant’s ability to record, process, summarize and report financial information; and
b) Any fraud, whether or not material, that involves management or other employees whohave a significant role in the registrant’s internal control over financial reporting.
/s/ VERONICA M. HAGEN
Veronica M. HagenDate: March 11, 2008 Chief Executive Officer

Exhibit 31.2
CERTIFICATION PURSUANT TO SECTION 302 OF THE SARBANES-OXLEY ACT OF 2002
I, Willis C. Moore, III, certify that:
1. I have reviewed this Annual Report on Form 10-K of Polymer Group, Inc.;
2. Based on my knowledge, this report does not contain any untrue statement of a material fact oromit to state a material fact necessary to make the statements made, in light of thecircumstances under which such statements were made, not misleading with respect to theperiod covered by this report;
3. Based on my knowledge, the financial statements, and other financial information included inthis report, fairly present in all material respects the financial condition, results of operationsand cash flows of the registrant as of, and for, the periods presented in this report;
4. The registrant’s other certifying officer and I are responsible for establishing and maintainingdisclosure controls and procedures (as defined in Exchange Act Rules 13a-15(e) and15d-15(e)) and internal control over financial reporting (as defined in Exchange ActRules 13a-15(f) and 15d-15(f)) for the registrant and have:
a) Designed such disclosure controls and procedures, or caused such disclosure controlsand procedures to be designed under our supervision, to ensure that material informationrelating to the registrant, including its consolidated subsidiaries, is made known to us byothers within those entities, particularly during the period in which this report is beingprepared;
b) Designed such internal control over financial reporting, or caused such internal controlover financial reporting to be designed under our supervision, to provide reasonableassurance regarding the reliability of financial reporting and the preparation of financialstatements for external purposes in accordance with generally accepted accountingprinciples;
c) Evaluated the effectiveness of the registrant’s disclosure controls and procedures andpresented in this report our conclusions about the effectiveness of the disclosure controlsand procedures, as of the end of the period covered by this report based on suchevaluation; and
d) Disclosed in this report any change in the registrant’s internal control over financialreporting that occurred during the registrant’s most recent fiscal quarter (the registrant’sfourth fiscal quarter in the case of an annual report) that has materially affected, or isreasonably likely to materially affect, the registrant’s internal control over financialreporting; and
5. The registrant’s other certifying officer and I have disclosed, based on our most recentevaluation of internal control over financial reporting, to the registrant’s auditors and the auditcommittee of the registrant’s board of directors (or persons performing the equivalentfunctions):
a) All significant deficiencies and material weaknesses in the design or operation of internalcontrol over financial reporting which are reasonably likely to adversely affect theregistrant’s ability to record, process, summarize and report financial information; and
b) Any fraud, whether or not material, that involves management or other employees whohave a significant role in the registrant’s internal control over financial reporting.
/s/ WILLIS C. MOORE, III
Willis C. Moore, IIIDate: March 11, 2008 Chief Financial Officer

Exhibit 32.1
Certification Pursuant To 18 U.S.C. Section 1350
In connection with the Annual Report of Polymer Group, Inc. (the ‘‘Company’’) on Form 10-K for thefiscal year ended December 29, 2007 as filed with the Securities and Exchange Commission on the datehereof (the ‘‘Report’’), I, Veronica M. Hagen, Chief Executive Officer of the Company, certify, pursuant to18 U.S.C. Section 1350, as adopted pursuant to Section 906 of the Sarbanes-Oxley Act of 2002, that tomy knowledge:
(1) The Report fully complies with the requirements of Section 13(a) or 15(d) of the SecuritiesExchange Act of 1934, as amended; and
(2) The information contained in the Report fairly presents, in all material respects, the financialcondition and results of operations of the Company.
/s/ VERONICA M. HAGEN
Veronica M. HagenDate: March 11, 2008 Chief Executive Officer
A signed original of this written statement required by Section 906 has been provided to theCompany and will be retained by the Company and furnished to the Securities and ExchangeCommission or its staff upon request.

Exhibit 32.2
Certification Pursuant To 18 U.S.C. Section 1350
In connection with the Annual Report of Polymer Group, Inc. (the ‘‘Company’’) on Form 10-K for thefiscal year ended December 29, 2007 as filed with the Securities and Exchange Commission on the datehereof (the ‘‘Report’’), I, Willis C. Moore, III, Chief Financial Officer of the Company, certify, pursuant to 18U.S.C. Section 1350, as adopted pursuant to Section 906 of the Sarbanes-Oxley Act of 2002, that to myknowledge:
(1) The Report fully complies with the requirements of Section 13(a) or 15(d) of the SecuritiesExchange Act of 1934, as amended; and
(2) The information contained in the Report fairly presents, in all material respects, the financialcondition and results of operations of the Company.
/s/ WILLIS C. MOORE, III
Willis C. Moore, IIIDate: March 11, 2008 Chief Financial Officer
A signed original of this written statement required by Section 906 has been provided to theCompany and will be retained by the Company and furnished to the Securities and ExchangeCommission or its staff upon request.

PGI
CUSTOMER
PARTNERSHIP
+GLOBAL
+OPERATIONALEXCELLENCE
+INNOVATION
+CUSTOMERSATISFACTION
Management
Veronica HagenChief ExecutiveOfficer
Willis Moore, IIIChief FinancialOfficer
Mike HaleChief OperatingOfficer
Greg CrawfordVice President &General Manager,North America
Rolando DominguezVice President &General Manager,Latin America
William SpencerVice President &General Manager,Canada
Wuling ZhangVice President &General Manager,Asia
Bob DaleVice President,Research &Development
John HeironimusVice President,Chief MarketingOfficer
Dennis NormanVice President,Strategic Planning& Communication
Daniel RikardVice President,General Counseland Secretary
Mary TomaselloVice President,Global HumanResources
Board of Directors
William HewittChairman,Polymer Group, Inc.
Pedro AriasEPSA Engineering
Ramon BetolazaMatlinPattersonGlobal Advisers, LLC
Lap Wai ChanMatlinPattersonGlobal Advisers, LLC
Veronica HagenChief Executive Officer,Polymer Group, Inc.
Eugene LindenBennett Management
Wade NesmithLang Michener, LLP
James OvendenOTO Development, LLC
Charles VolpeRetired – KEMETCorporation
Shareholder InformationAs of March 5, 2008, therewere 19,412,118 common sharesoutstanding. Polymer Group,Inc.'s Class A and Class Bcommon stock are publiclytraded on the OTC BulletinBoard under the ticker symbolsPOLGA and POLGB, respectively.
Transfer AgentAmerican Stock Transfer& Trust Company59 Maiden Lane,Brooklyn, NY 11219800.937.5449

PO
LYM
ER
GR
OU
P,IN
C.
20
07
AN
NU
AL
RE
PO
RT
+GLOBAL
+OPERATIONALEXCELLENCE
+INNOVATION
+CUSTOMERSATISFACTION
PGI
2007 ANNUAL REPORT
PGICUSTOMER
PARTNERSHIP
2007 ANNUAL REPORT
MMEDICAL
WWIPES
HHYGIENE
ININDUSTRIAL
Corporate Contact InformationDennis NormanVice President, Strategic Planning& CommunicationPolymer Group, Inc.9335 Harris Corners ParkwaySuite 300Charlotte, NC 28269704.697.5186
www.polymergroupinc.com