Embed Size (px)
Citation preview
POLYCRYSTALLINE MODELLING OF UDIMET 720
FORGING
Julien Thebault, Denis Solas, Colette Rey, Thierry Baudin, Olivier Fandeur,
Michel Clavel
To cite this version:
Julien Thebault, Denis Solas, Colette Rey, Thierry Baudin, Olivier Fandeur, et al.. POLY-CRYSTALLINE MODELLING OF UDIMET 720 FORGING. TMS (The Minera, metal& ma-terial society) 2008. John Wiley&Sons Inc., pp.985-992, 2008, superalloys 2008, R.C. Reed,K. A. Green, P.C. Carron, T.P. Gabb, M. G. Fahrmann, E.S. Huron, S.A. Woodard. <hal-00783041>
HAL Id: hal-00783041
https://hal-ecp.archives-ouvertes.fr/hal-00783041
Submitted on 7 Feb 2013
HAL is a multi-disciplinary open accessarchive for the deposit and dissemination of sci-entific research documents, whether they are pub-lished or not. The documents may come fromteaching and research institutions in France orabroad, or from public or private research centers.
L’archive ouverte pluridisciplinaire HAL, estdestinee au depot et a la diffusion de documentsscientifiques de niveau recherche, publies ou non,emanant des etablissements d’enseignement et derecherche francais ou etrangers, des laboratoirespublics ou prives.

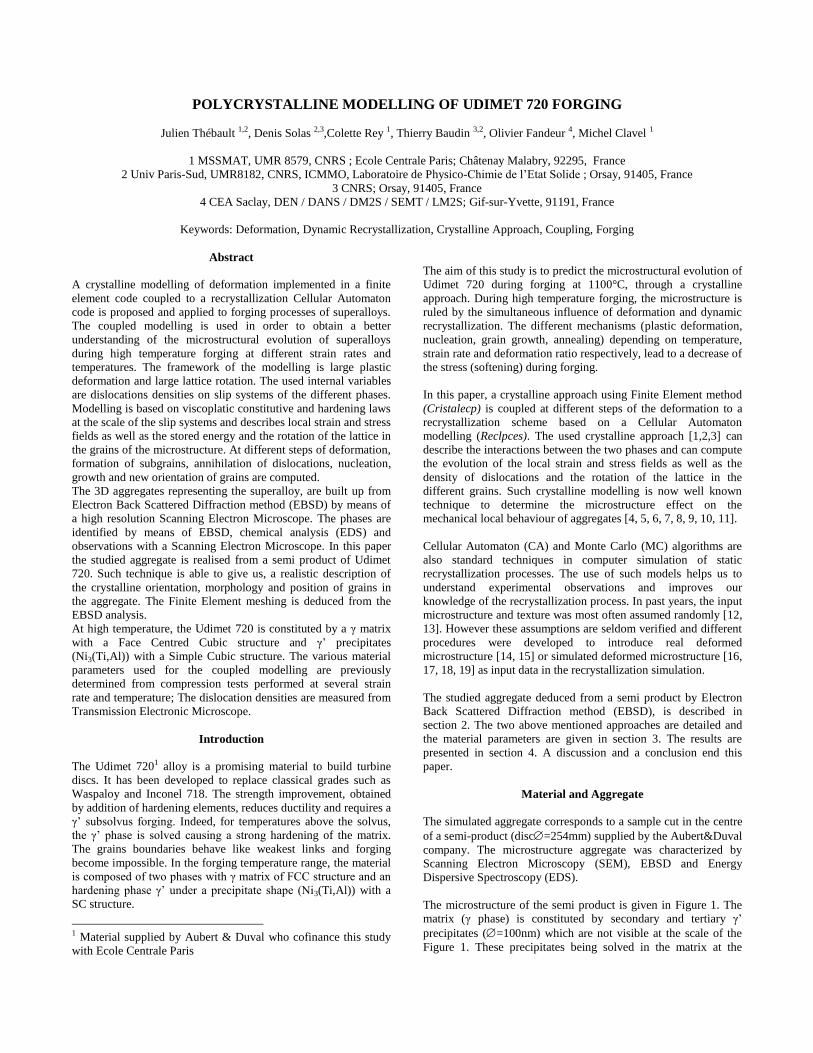
POLYCRYSTALLINE MODELLING OF UDIMET 720 FORGING
Julien Thébault 1,2, Denis Solas 2,3,Colette Rey 1, Thierry Baudin 3,2, Olivier Fandeur 4, Michel Clavel 1
1 MSSMAT, UMR 8579, CNRS ; Ecole Centrale Paris; Châtenay Malabry, 92295, France
2 Univ Paris-Sud, UMR8182, CNRS, ICMMO, Laboratoire de Physico-Chimie de l’Etat Solide ; Orsay, 91405, France
3 CNRS; Orsay, 91405, France
4 CEA Saclay, DEN / DANS / DM2S / SEMT / LM2S; Gif-sur-Yvette, 91191, France
Keywords: Deformation, Dynamic Recrystallization, Crystalline Approach, Coupling, Forging
Abstract
A crystalline modelling of deformation implemented in a finite
element code coupled to a recrystallization Cellular Automaton
code is proposed and applied to forging processes of superalloys.
The coupled modelling is used in order to obtain a better
understanding of the microstructural evolution of superalloys
during high temperature forging at different strain rates and
temperatures. The framework of the modelling is large plastic
deformation and large lattice rotation. The used internal variables
are dislocations densities on slip systems of the different phases.
Modelling is based on viscoplatic constitutive and hardening laws
at the scale of the slip systems and describes local strain and stress
fields as well as the stored energy and the rotation of the lattice in
the grains of the microstructure. At different steps of deformation,
formation of subgrains, annihilation of dislocations, nucleation,
growth and new orientation of grains are computed.
The 3D aggregates representing the superalloy, are built up from
Electron Back Scattered Diffraction method (EBSD) by means of
a high resolution Scanning Electron Microscope. The phases are
identified by means of EBSD, chemical analysis (EDS) and
observations with a Scanning Electron Microscope. In this paper
the studied aggregate is realised from a semi product of Udimet
720. Such technique is able to give us, a realistic description of
the crystalline orientation, morphology and position of grains in
the aggregate. The Finite Element meshing is deduced from the
EBSD analysis.
At high temperature, the Udimet 720 is constituted by a γ matrix
with a Face Centred Cubic structure and γ’ precipitates
(Ni3(Ti,Al)) with a Simple Cubic structure. The various material
parameters used for the coupled modelling are previously
determined from compression tests performed at several strain
rate and temperature; The dislocation densities are measured from
Transmission Electronic Microscope.
Introduction
The Udimet 7201 alloy is a promising material to build turbine
discs. It has been developed to replace classical grades such as
Waspaloy and Inconel 718. The strength improvement, obtained
by addition of hardening elements, reduces ductility and requires a
γ’ subsolvus forging. Indeed, for temperatures above the solvus,
the γ’ phase is solved causing a strong hardening of the matrix.
The grains boundaries behave like weakest links and forging
become impossible. In the forging temperature range, the material
is composed of two phases with γ matrix of FCC structure and an
hardening phase γ’ under a precipitate shape (Ni3(Ti,Al)) with a
SC structure.
1 Material supplied by Aubert & Duval who cofinance this study
with Ecole Centrale Paris
The aim of this study is to predict the microstructural evolution of
Udimet 720 during forging at 1100°C, through a crystalline
approach. During high temperature forging, the microstructure is
ruled by the simultaneous influence of deformation and dynamic
recrystallization. The different mechanisms (plastic deformation,
nucleation, grain growth, annealing) depending on temperature,
strain rate and deformation ratio respectively, lead to a decrease of
the stress (softening) during forging.
In this paper, a crystalline approach using Finite Element method
(Cristalecp) is coupled at different steps of the deformation to a
recrystallization scheme based on a Cellular Automaton
modelling (Reclpces). The used crystalline approach [1,2,3] can
describe the interactions between the two phases and can compute
the evolution of the local strain and stress fields as well as the
density of dislocations and the rotation of the lattice in the
different grains. Such crystalline modelling is now well known
technique to determine the microstructure effect on the
mechanical local behaviour of aggregates [4, 5, 6, 7, 8, 9, 10, 11].
Cellular Automaton (CA) and Monte Carlo (MC) algorithms are
also standard techniques in computer simulation of static
recrystallization processes. The use of such models helps us to
understand experimental observations and improves our
knowledge of the recrystallization process. In past years, the input
microstructure and texture was most often assumed randomly [12,
13]. However these assumptions are seldom verified and different
procedures were developed to introduce real deformed
microstructure [14, 15] or simulated deformed microstructure [16,
17, 18, 19] as input data in the recrystallization simulation.
The studied aggregate deduced from a semi product by Electron
Back Scattered Diffraction method (EBSD), is described in
section 2. The two above mentioned approaches are detailed and
the material parameters are given in section 3. The results are
presented in section 4. A discussion and a conclusion end this
paper.
Material and Aggregate
The simulated aggregate corresponds to a sample cut in the centre
of a semi-product (disc=254mm) supplied by the Aubert&Duval
company. The microstructure aggregate was characterized by
Scanning Electron Microscopy (SEM), EBSD and Energy
Dispersive Spectroscopy (EDS).
The microstructure of the semi product is given in Figure 1. The
matrix (γ phase) is constituted by secondary and tertiary γ’
precipitates (=100nm) which are not visible at the scale of the
Figure 1. These precipitates being solved in the matrix at the
s
c
ss
s
c
sn
s
c
ss
if
)sgn(
1
0
0 s
u
usus
ch
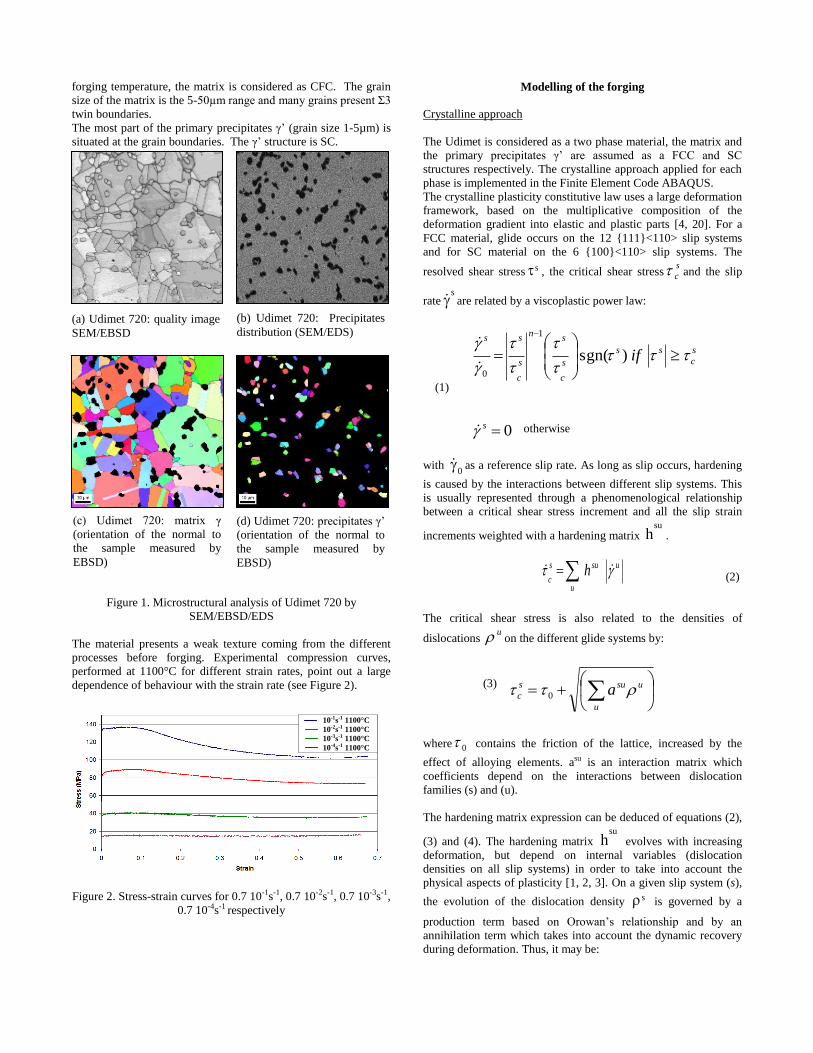
forging temperature, the matrix is considered as CFC. The grain
size of the matrix is the 5-50µm range and many grains present Σ3
twin boundaries.
The most part of the primary precipitates γ’ (grain size 1-5µm) is
situated at the grain boundaries. The γ’ structure is SC.
Figure 1. Microstructural analysis of Udimet 720 by
SEM/EBSD/EDS
The material presents a weak texture coming from the different
processes before forging. Experimental compression curves,
performed at 1100°C for different strain rates, point out a large
dependence of behaviour with the strain rate (see Figure 2).
Figure 2. Stress-strain curves for 0.7 10-1s-1, 0.7 10-2s-1, 0.7 10-3s-1,
0.7 10-4s-1 respectively
Modelling of the forging
Crystalline approach
The Udimet is considered as a two phase material, the matrix and
the primary precipitates γ’ are assumed as a FCC and SC
structures respectively. The crystalline approach applied for each
phase is implemented in the Finite Element Code ABAQUS.
The crystalline plasticity constitutive law uses a large deformation
framework, based on the multiplicative composition of the
deformation gradient into elastic and plastic parts [4, 20]. For a
FCC material, glide occurs on the 12 {111}<110> slip systems
and for SC material on the 6 {100}<110> slip systems. The
resolved shear stress s , the critical shear stresss
c and the slip
rates are related by a viscoplastic power law:
(1)
otherwise
with 0 as a reference slip rate. As long as slip occurs, hardening
is caused by the interactions between different slip systems. This
is usually represented through a phenomenological relationship
between a critical shear stress increment and all the slip strain
increments weighted with a hardening matrix su
h .
(2)
The critical shear stress is also related to the densities of
dislocations u on the different glide systems by:
(3)
where 0 contains the friction of the lattice, increased by the
effect of alloying elements. asu is an interaction matrix which
coefficients depend on the interactions between dislocation
families (s) and (u).
The hardening matrix expression can be deduced of equations (2),
(3) and (4). The hardening matrix su
h evolves with increasing
deformation, but depend on internal variables (dislocation
densities on all slip systems) in order to take into account the
physical aspects of plasticity [1, 2, 3]. On a given slip system (s),
the evolution of the dislocation density s is governed by a
production term based on Orowan’s relationship and by an
annihilation term which takes into account the dynamic recovery
during deformation. Thus, it may be:
u
usus
c a 0
(c) Udimet 720: matrix γ
(orientation of the normal to
the sample measured by
EBSD)
(a) Udimet 720: quality image
SEM/EBSD
(b) Udimet 720: Precipitates
distribution (SEM/EDS)
(d) Udimet 720: precipitates γ’
(orientation of the normal to
the sample measured by
EBSD)
10-1s-1 1100°C
10-2s-1 1100°C
10-3s-1 1100°C
10-4s-1 1100°C

(4)
where uL represents the mean free path of the mobile
dislocations gliding on the system u.
DKL ut
t
u
1
1
1
(5)
and b are respectively shear modulus and Burgers vector
magnitude; cg is proportional to the annihilation distance of
dislocation dipoles; K is a material parameter and D is the average
polycrystal grain size. Only self ass and latent asu hardening are
considered here. The physical meaning of all the parameters set is
detailed in [3].
The parameters used for this simulation were identified using a
polycrystalline model and an inverse method from experimental
results obtained at different temperatures and deformation rates.
At high temperature and for the two phases, the interaction matrix
[21] is assumed weak, which means that dislocations can easily
pass through the obstacles due to the latent dislocations.
The material parameters are usually determined by inverse
method using results on different mechanical tests. In this case,
for high temperature (1100°C), only experimental compression
curves are available, the initial dislocations density in the two
phases being determined by TEM. The parameters are presented
in Table I.
Table I. Material parameters at 1100°C
E
(GPa) υ asu 0
(s-1) n
gc
(nm) K
τ0
(MPa)
ρ0
(m-2)
D
(µm)
b
(nm)
γ 126 0.3 8.10-3 5.10-5 6.2 10 100 5.5 1014 10 0.26
γ' 129 0.3 8.10-5 10-5 6.2 10 100 5 1013 3 0.26
The recrystallization model ―Reclpces‖
After deformation, a recrystallization step is performed. An
energy is assigned to each cell as the sum of the stored energy
Estored and the grain boundary energy Egb. The stored energy is the
result of the Finite Element calculation which gives the local
dislocation density. The grain boundary energy depends on the
misorientation of a given site with respect to its 6 neighbours [16]:
(6)
where:
(7)
where m is the energy of high-angle grain boundaries, * is
the misorientation limit for low angle boundaries (taken as 15° in
the present simulations), 'ss is the crystallographic
misorientation between two neighbours sites s and s’. The grain
boundary energy as the function of the misorientation corresponds
to the well-known Read-Shockley equation. The mobility M of
the boundary between the two sites is calculated according to:
(8)
where Mm is the average mobility of high angle grain boundaries
and the misorientation angle is expressed in degrees.
In this simulation, one type of nucleation was implemented: site
nucleation with high stored energy, which allows to reproduce the
discontinuous dynamic recrystallization mechanism. When the
stored energy is larger than a critical value, nucleation occurred.
The orientation remains the same and its stored energy is set to
zero.
Concerning the growth step, the reorientation of each site is
estimated. For each site, one of its six neighbours is selected at
random, this site 2 has to be already in a recrystallized
configuration. Then the orientation of site 2 is attributed to site 1
and its stored energy is set to 0. The variation of the energy E
between the two configurations is computed. As soon as the
driving force is positive the reorientation is not accepted. The
velocity V of the grain boundary is expressed as:
(9)
Where M is the mobility and E is the driving force. During a
time increment tinc the grain boundary moves along a distance d.
u
cu
t
tst
susu g
La
aµh
1
2
'
'
ss
s
s
gbE
*'
*'
*
'
*
'
'ln1
ss
m
ssssss
mss
when
when
EMV
3'
'
10exp1
ss
m
ss MM

This distance is compared to the cell size d0. The probability of
reorientation is expressed as:
(10)
When all the sites are visited, the microstructure is updated. With
this model, a length scale is introduced. As a consequence, using a
coherent system of units for the driving force and the grain
boundary mobility, a real time scale can be used during the
growth step.
Meshing and boundary conditions
The finite element mesh is constituted by 8 nodes hexahedron
with reduced integration (C3D8R) obtained directly from EBSD
acquisitions. This analysis has been performed on a semi-product
supplied by Aubert & Duval with a FEG-SEM (LEO 1530) using
a 0.6µm step (Figure 3a). Each element of the meshing is
characterized by a constitutive law and a dislocation evolution law
as well as the initial dislocation density, the initial crystalline
orientation and spatial coordinates. By this method, morphology
of grains, spatial distribution of phases and crystallographic
orientation are taken into consideration, enabling us to describe
grains and phases interactions effect on the local mechanical
fields.
In order to represent the forging process, boundary conditions of
simple compression type are applied on the aggregate.
The sequential steps (deformation-recrystallization) correspond to
a deformation of 0.1. To avoid buckling for these large strains, the
pattern thickness is set to 2µm.
In this study, the 3D aggregate is composed of five similar layers
and its dimensions are 48.6 x 48.6 x 10µm3. The purpose is to use
five similar layers to study the intermediate layer and so to avoid
stresses due to boundary conditions on the edges of the aggregate.
The meshing is constituted by 32805 elements.
(a) (b) (c)
Figure 3. (a) Example of inverse pole figure map showing the position of the normal axis in the stereographic triangle, (b) phase map, (c)
aggregate picture.
Sequential coupling
During high temperature forging, the microstructure evolves
under the influence of dynamic recrystallization leading to
softening. To perform a sequential coupling of the two
modellings, we need to determine the deformation ratio (with
―Cristalecp‖) and the recrystallization time (with ―Reclpces‖). In
this way a third model has been developed. This model
corresponds to a macroscopic dynamic recrystallization where
deformation part is ensured by a Kocks & Mecking hardening law
(Peczak and Luton 1993) and the recrystallization part is similar
to the recrystallization model described above. Figure 4 presents
in a theoretical way the different steps of deformation and
recrystallization to be achieved in the context of sequential
coupling. Recrystallization decreasing stored energy and
consequently the macroscopic stress, it is require that the
deformation modelling overestimates slightly the results acquired
during mechanical tests.
Essai 0,7 10-2 1100 C
0
10
20
30
40
50
60
70
80
90
100
0 0.1 0.2 0.3 0.4 0.5 0.6 0.7
Strain
Tru
e s
tre
ss
(M
Pa
)
Déformation « Cristalecp »
Recrystallization « Reclpces »
Mechanical test
00 d
tEM
d
dP inc
TD
RD
2
Matrix
Precipitates
1

Figure 4. Illustration of sequential approach
To sum up, sequential coupling requires three models, two for
microstructural evolution and one to determine the number and
frequency of cycles (deformation + recrystallization).
Results
This chapter presents the results of the computation obtained after
two and a half cycles on the aggregate composed by five similar
layers. In order to reduce the computation time, only the
intermediate layer is submitted to the sequential coupling.
First deformation: For the first deformation step, it is used
parameters shown in Table 1 (named ―state 0‖). The aggregate is
10% deformed at a 10-2s-1 strain rate.
To trace stress evolution during sequential coupling, the stress-
strain curve is drawn after each deformation step. In the first
deformation step, Figure 5 shows that the yield strength is well
represented and that the hardening is slightly higher than the
experimentally observed one. Thus, during recrystallization, the
stress decreases leading to an important microstructural evolution.
Figure 5. Comparison of simulated and experimental stress-strain curves (first step of deformation)
During deformation, the microstructure evolves by crystal lattice
rotation, leading to the formation of intragranular misorientations
(change of color of grain 1 on Figure 6d) and sub-boundaries
(Figure 6c).
(a) (b)
(c) (d)
1
Initial microstructure E=0%
E=10% state 1
Experimental curve
Numerical curve

Figure 6. Grain boundary map and orientation map before and after deformation
Recrystallization: After 10% of deformation, dislocation densities
are heterogeneous and nucleation takes place in sites where the
energy is higher than a critical value. The comparison of the map
at the deformed state (fig7a) and the deformed and recrystallized
ones (called state 2) (Figure 7b), points out that some grains have
grown and are exempt of dislocations (grain 2) whereas others
retain a deformation sub-structure with a crystallographic
orientation spread (grain 3) (see Figure 7c). One can also notices
that some twin boundaries have vanished.
(a) (b) (c)
Figure 7. (a) Orientation map after 10% of deformation, (b) orientation map after recrystallization,(c) dislocation densities after
recrystallization
Second deformation: After the first cycle (deformation +
recrystallization), the intermediate recrystallized layer (state2) is
inserted in the aggregate at the state 0 (Fig 8.). The role of the
surrounding layers is to apply more realistic mechanical fields on
the intermediate layer. The intermediate layer differs from the
other layers by its heterogeneous dislocation densities and its
microstructure. Note that the dislocation densities are calculated
in each point from the stored energy after recrystallization.
In the other layers, the dislocation densities are uniform per phase
and their values are those of the ―state 0‖.
Figure 8. Inserting a deformed and recrystallized layer into an aggregate at state 0
The aggregate is again submitted to a 10% deformation with a
strain rate of 10-2s-1. After the second deformation (E=20%), the
crystallographic orientation of some grains has evolved (grain 4)
and the misorientation of some sub-boundaries (located in
deformed grains) has increased (Figure 9).
2
3
Dislocations densities
in mm-2
Deformed state : state 1
1st Deformation
• Crystallographic
orientation given by
EBSD
• Unique dislocations
density (ρ) per phase
• Crystallographic orientation
at state 2
• ρ heterogeneous in the
aggregate
- Recrystallized grains : ρ=0
- Deformed Grains : ρ state 1
Recrystallized state : state 2
1st Recrystallization
Input
• Layers at state 0
2nd
Deformation
• Layer at state 2
• Layers at state 0
Output
• Layers at state 1
• Layer at state 3
Deformed state : state 3
• Crystallographic orientation at state 3
• Increase of ρ
• ρ heterogeneous in the layer
• Crystallographic
orientation at state 1
• Increase of ρ
• ρ heterogeneous in
the aggregate
• Layers at state 1
Initial state : state 0

(a) (b) (c)
Figure 9. (a) Orientation map after E=10% and recrystallization, (b) orientation map after 20% of deformation and (c) grain boundary map
after the second deformation.
One of the main features of the sequential coupling is to consider,
at each step of the computation, all the sub-grains whose
misorientation is higher than 2°. Some sub-boundaries created
during the first deformation step and not annihilated by the
recrystallization can increase their misorientation during the
second deformation step.
Microstructural evolution after several cycles: Now the
microstructural evolution of the intermediate layer after two and a
half cycles is shown on Figure 10.
Figure 10. Orientation evolution for two and half cycle of deformation and recrystallization
Conclusion
In order to model the high temperature forging of Udimet 720, we
developed a procedure of simulation of the microstructures and
textures of dynamic recrystallization for a two-phase material. In
4
First recrystallization
Third deformation
EBSD analysis First deformation
Second recrystallization Second deformation

this way it is used a sequential coupling of models of deformation
―Cristalecp‖ and recrystallization ―Reclpces‖.
Currently the method is operational and the first results are
promising. However it still remains to determine more precisely
the mechanical parameters for deformation modelling and to take
into consideration recrystallization mechanisms identified during
experimental analyzes.
References
[1] T. Hoc, C. Rey, J. Raphanel, « Experimental and numerical
analysis of localization during sequentials tests for IF-Ti steel. »,
Acta metall materiala, 49 (2001), 835-1846.
[2] F. Delaire, J. Raphanel, C. Rey, « Plastic Heterogeneities of a
Copper Multicrystal Deformed in Uniaxial Tension :
Experimental study and Finite Element Simulations », Acta metall
materiala, 48 (2000), 1075-1087.
[3] P. Erieau, C. Rey, « Modelling of deformation and rotation
bands and of deformation induced grain boundaries in IF steel
aggregate during large plane strain compression.», Inter.J. Plast.,
20 (2004), 1763-1788,
[4] D. Peirce, R.J. Asaro and A. Needleman, « Material rate
dependence and localized deformation in crystalline solids. »,
Acta metall., 31 (1983), 1951-1976.
[5] A.J. Beaudoin, P.R. Dawson, K.K. Mathur and U.F. Kocks, «
A hybrid finite element formulation for polycrystal plasticity with
consideration of macrostructural and microstructural linking »,
Int. J. Plast., 11 (4) (1995), 501–521.
[6] R. Becker and S. Panchanadeeswaran, « Effects of grain
interactions on deformation and local texture in polycrystals » ,
Acta metall., 43 (7) (1995), 701-2719.
[7] A. Acharya and A.J. Beaudoin, « Grain-size effect in
viscoplastic polycrystals at moderate strains », J. Mech. Phys.
Sol., 48 (2000), 2213–2230.
[8] F. Barbe, S. Forest and G. Cailletaud, « Intergranular and
intragranular behavior of polycrystalline aggregates.Part 2:
Results », Int. J. Plast., 17 (4) (2001), 537-563.
[9] F. Barbe, L. Decker, D. Jeulin and G. Cailletaud, «
Intergranular and intragranular behavior of polycrystalline
aggregates. Part 1: F.E. model », Int. J. Plast., 17 (4) (2001), 513-
536.
[10] F.T. Meissonier, E.P. Busso, N.P. O’Dowd, « Finite element
implementation of a generalised non-local rate-dependent
crystallographic formulation for finite strains », Int. J. Plast., 17
(2001), 601-640.
[11] A. Bhattacharyya, E. El-Danaf, S. Kalindindi and R. Doherty,
« Evolution of grain scale microstructure during large strain
simple compression of polycrystalline aluminium with quasi
columnar grains: OIM measurements and numerical simulations.
», Int. J. Plast., 17 (2001), 861–883.
[12] D.J. Srolovitz, G.S. Grest and M.P. Anderson, « Computer
simulation of recrystallization—I. Homogeneous nucleation and
growth », Acta Metallurgica, 34 (1986), 1863.
[13] D.J Srolovitz, G.S. Grest, M.P. Anderson and R.D. Rollett, «
Computer simulation of recrystallization—II. Heterogeneous
nucleation and growth », Acta Metallurgica, 36 (1988), 2115.
[14] T. Baudin, P. Paillard and R. Penelle, « Simulation of the
anisotropic growth of goss grains in Fe3%Si sheets (grade HiB) »,
Scripta Materiala, 40 (1999), 1111.
[15] T. Baudin, F. Julliard, P. Paillard and R. Penelle, «
Simulation of primary recrystallization from tem orientation data
», Scripta Materiala, 43 (2000), 63-68.
[16] D. E. Solas, C. N. Tomé, O. Engler and H. R. Wenk,
« Deformation and recrystallization of hexagonal metals:
modeling and experimental results for zinc », Acta Materialia, 49
(18) (2001), 3791-3801.
[17] P. Erieau, « Experimental study and numerical analyze of the
influence of heterogeneities induced by cold deformation on the
primary recrystallization of IF-Ti steel», (Ph.D. thesis, Ecole
Centrale de Paris, 2003)
[18] T. Baudin, A.L. Etter, Ph. Gerber, A. Samet, R. Penelle and
C. Rey, « Influence of thermo-mechanical treatments on the
stored energy simulated by FEM for two low carbon steels »,
ICOTOM 14, Leuven, Belgium, July 11-15 2005, Trans Tech
Publications, Switzerland, Materials Science Forum, 495-497 (2)
(2005), 1291-1296.
[19] P. Volovitch, F. Caleyo, T. Baudin, Ph. Gerber, R. Penelle
and C. Rey, « Monte Carlo modeling of low carbon steel
recrystallization: role of thermo-mechanical treatment and
chemical composition », ICOTOM 14, Leuven, Belgium, July 11-
15 2005, Trans Tech Publications, Switzerland, 1 (2005), 507-
512.
[20] C. Teodosiu, J.L. Raphanel et L. Tabourot, « Finite
implementation of the large elastoplastic deformation of
multicrystals. », Large Plastic Deformation, Proc. Int. Seminar
MECAMAT’91, ed.by C. Teodosiu, J.L. Raphanel and F.
Sidoroff, (1991), 153-168.
[21] P. Franciosi, « Glide mechanisms in B.C.C. crystals : an
investigation of the case of -iron through multislip and latent
hardening tests.», Acta metall., 31 (1983), 1331–1342.