Embed Size (px)
Citation preview

Políticas y reformas
para la mejora educativa
en la OCDE: el
profesorado y las
escuelas
1
Beatriz Pont, Analista Sr.
Dirección de Educación, OCDE
XXI Encuentro de Consejos Escolares, La Rioja, 25 Octubre, 2012

La presentación de hoy...
2
Resultados y retos educativos en la OCDE y para España
Políticas para la mejora educativa: El profesorado y las escuelas
1.
2.

Porque invertir en educación?
3
crecimiento
progreso
económico
cohesión
social

Altas tasas de cobertura en la educación infantil para
niños de 4 años (2005 y 2010)
0
10
20
30
40
50
60
70
80
90
100
Fran
ceN
eth
erl
and
sSp
ain
Me
xico
Be
lgiu
mD
en
mar
kJa
pan
No
rway
Un
ite
d K
ingd
om
Ital
yLu
xem
bo
urg
Ice
lan
dG
erm
any
Ne
w Z
eal
and
Swe
de
nH
un
gary
Esto
nia
Au
stri
aSl
ove
nia
Isra
el
Po
rtu
gal
Cze
ch R
ep
ub
licO
ECD
ave
rage
Ko
rea
Ch
ileA
rge
nti
na
Ru
ssia
n F
ed
era
tio
nSl
ova
k R
ep
ub
licU
nit
ed
Sta
tes
Ire
lan
dP
ola
nd
Fin
lan
dB
razi
lG
ree
ceA
ust
ralia
Can
ada
Swit
zerl
and
Ind
on
esi
aTu
rke
y
2010 2005%

-30
-20
-10
0
10
20
30
40
Au
stra
lia
Be
lgiu
m
Can
ada
Ch
ile
Cze
ch R
epu
blic
Den
mar
k
Esto
nia
Fin
lan
d
Fran
ce
Ger
man
y
Gre
ece
Hu
nga
ry
Icel
and
Irel
and
Isra
el
Ital
y
Jap
an
Ko
rea
Luxe
mb
ou
rg
Mex
ico
Net
her
lan
ds
New
Zea
lan
d
No
rway
Po
lan
d
Po
rtu
gal
Slo
vak
Rep
ub
lic
Slo
ven
ia
Spai
n
Swed
en
Swit
zerl
and
Turk
ey
Un
ited
Kin
gdo
m
Lectura Matemáticas Ciencias
Disminución en puntaje PISA
Aumento en puntaje PISA
Tambien han mejorado las habilidades de lectura,
matematicas y ciencias entre 2006 y 2009 (PISA)
%

El sistema educativo logra mejorar los resultados de la
población inmigrante
300
350
400
450
500
550
Fin
land
Can
ada
New
Zea
land
Aus
tral
ia
Net
herla
nds
Bel
gium
Nor
way
Est
onia
Sw
itzer
land
Uni
ted
Sta
tes
Sw
eden
Ger
man
y
Irel
and
Fra
nce
Den
mar
k
Uni
ted
Kin
gdom
Hun
gary
OE
CD
ave
rage
Por
tuga
l
Italy
Slo
veni
a
Gre
ece
Spa
in
Cze
ch R
epub
lic
Isra
el
Luxe
mbo
urg
Aus
tria
Rus
sian
Fed
erat
ion
Mex
ico
Bra
zil
Mea
n pe
rfor
man
ce in
the
read
ing
scal
e
Students without an immigrant background Second-generation students First-generation students
Reading performance by immigrant status in PISA (2009)

El nivel de educación de la población ha crecido pero
aún debe crecer más para llegar a la media de la OCDE
Población con educación media superior (2010)
0
10
20
30
40
50
60
70
80
90
100
Kore
a Cz
ech
Repu
blic
Sl
ovak
Rep
ublic
Po
land
Sl
oven
ia
Cana
da
Swed
en
Finl
and
Switz
erla
nd
Uni
ted
Stat
es
Isra
el
Aus
tria
Ir
elan
d Ch
ile
Ger
man
y Es
toni
a H
unga
ry
Aus
tral
ia
Luxe
mbo
urg
Fran
ce
Nor
way
U
nite
d Ki
ngdo
m
Net
herl
ands
Be
lgiu
m
OEC
D a
vera
ge
Den
mar
k N
ew Z
eala
nd
Gre
ece
Icel
and
Ital
y Sp
ain
Braz
il Po
rtug
al
Mex
ico
Turk
ey
55-64 year-olds 25-34 year-olds %
España

Reto: todos los estudiantes deben alcanzar un mínimo
Porcentaje de estudiantes de 15 años que no han alcanzado un nivel mínimo
de competencia lectora, PISA 2009
0
10
20
30
40
50
60
70
80
Sh
ang
hai
-Ch
ina
Ko
rea
Fin
lan
dH
on
g K
on
g-C
hin
aC
anad
aE
sto
nia
Jap
anA
ust
ralia
Net
her
lan
ds
New
Zea
lan
dM
acao
-Ch
ina
No
rway
Po
lan
dD
enm
ark
Sw
itze
rlan
dIc
elan
dIr
elan
dS
wed
enH
un
gar
yU
nit
ed S
tate
sP
ort
ug
alB
elg
ium
Un
ited
Kin
gd
om
Ger
man
yO
EC
D a
vera
ge
Sp
ain
Fra
nce
Ital
yS
love
nia
Gre
ece
Slo
vak
Rep
ub
licC
zech
Rep
ub
licT
urk
eyL
uxe
mb
ou
rgIs
rael
Ru
ssia
n F
eder
atio
nA
ust
ria
Ch
ileP
ueb
la (
Mex
ico
)M
exic
oB
razi
l
Per
cent
age
of s
tude
nts
Below level 2 Level 2

Reto: Reducir la repetición de cursos
0
5
10
15
20
25
30
35
40
45
Jap
anK
ore
aN
orw
ayIc
elan
dS
love
nia
Un
ited
Kin
gd
om
Fin
lan
dRussian…
Slo
vak
Rep
ub
licC
zech
Rep
ub
licD
enm
ark
Sw
eden
New
Zea
lan
dP
ola
nd
Est
on
iaG
reec
eS
han
gh
ai-C
hin
aIs
rael
Au
stra
liaC
anad
aH
un
gar
yIr
elan
dA
ust
ria
Tu
rkey
OE
CD
ave
rag
eU
nit
ed S
tate
sH
on
g K
on
g-C
hin
aIt
aly
Ger
man
yM
exic
oS
wit
zerl
and
Ch
ileN
eth
erla
nd
sB
elg
ium
Po
rtu
gal
Sp
ain
Lu
xem
bo
urg
Fra
nce
Bra
zil
Mac
ao-C
hin
a
Per
cent
age
of s
tude
nts
% de estudiantes de 15 años que ha repetido al menos un curso, PISA 2009

Reto: como mínimo hasta la educación secundaria
% de individuos entre 25 y 34 años que no han alcanzado la educación media
superior
0
10
20
30
40
50
60K
orea
Slo
vak
Rep
ublic
Cze
ch R
epub
licP
olan
dS
love
nia
Can
ada
Sw
eden
Fin
land
Sw
itzer
land
Aus
tria
Uni
ted
Sta
tes
Isra
elE
ston
iaG
erm
any
Hun
gary
Irel
and
Den
mar
kC
hile
Fra
nce
Luxe
mbo
urg
Nor
way
Bel
gium
Aus
tral
iaN
ethe
rland
sU
nite
d K
ingd
omO
EC
D a
vera
geN
ew Z
eala
ndG
reec
eIta
lyIc
elan
dS
pain
Por
tuga
lM
exic
oT
urke
y
Per
cent
age
of p
opul
atio
n

Reto: transición de los jóvenes de 15-19 de edad
Distribution of 15-19 year-olds by education and work status (2010, 2008)
0
10
20
30
40
50
60
SV
N
PO
L
HU
N
SV
K
CZ
E
ES
T
DE
U
LU
X
BE
L
FIN
KO
R
NL
D
SW
E
FR
A
GR
C
CH
E
DN
K
AU
T
OE
CD
US
A
IRL
PR
T
ISL
ITA
ES
P
CA
N
NO
R
UK
M
AU
S
NZ
L
ISR
BR
A
ME
X
TU
R
2010
2008
% 15-19 year-olds not in education
0
20
40
60
80
100Inactive
Unemployed
Employed
Employed(2008)
% 15-19 year-olds not in education, by work status

Germany
Belgium
Luxembourg
Turkey
Hungary
Chile
New Zealand
Netherlands
Switzerland
United Kingdom Denmark
Sweden
Brazil
Austria
Poland
Portugal
Spain
Mexico
Greece Czech Republic Slovak Republic
Ireland
United States
France
Slovenia
Australia
Iceland
Japan
Russian Federation
Italy
Norway
Finland
Canada
Korea
Estonia
400
420
440
460
480
500
520
540
560
051015202530
Mea
n sc
ore
in r
eadi
ng
Percentage of variance in performance explained by the PISA index of economic, social and cultural status (r-squared x 100)
Strength of the relationship between performance and socio-economic background above the OECD average impact
Strength of the relationship between performance and socio-economic background not statistically significantly different from the OECD average impact
Strength of the relationship between performance and socio-economic background below the OECD average impact
Above-average performance
Above-average impact of
socio-economic background
Below-average performance
Above-average impact of
socio-economic background
Below-average performance
Below-average impact of
socio-economic background
Above-average performance
Below-average impact of
socio-economic background
España puede mejorar sus resultados educativos como tros
que logran combinar equidad con calidad

Curriculum
estructura
Docentes
Escuelas
Evaluación y medición
Calidad
educativa
Evidencia, evaluación para mejorar e incentivos
Fortalecer el liderazgo y
gestión
Curriculum y estructura educativa
Atraer,
seleccionar, formar y
desarrollar docentes
Areas clave para la mejora educativa
Financiación e implementación

Curriculum
estructura
Docentes
Escuelas
Evaluación y medición
Calidad
educativa
Atraer, formar,
seleccionar y desarrollar docentes
El profesorado: un area clave de política educativa

La evidencia muestra que el docente es el factor más
importante...
* Entre el 20% superior de los maestros
** Entre el 20% inferior de maestros
Fuente: Sanders & Rivers Cumulative and Residual Effects on Future Student Academic Achievement
Percentiles
De
sem
pe
ño
de
l alu
mn
o
Dos alumnos con el
mismo desempeño
Alumno con
maestro cuyo
desempeño es
bajo**
Percentil 37
Alumno con
maestro cuyo
desempeño es
alto*
Percentil 90

Making a significant educational difference
Successful with students in their class
Making progress with students
Se sienten eficaces los propios docentes?
23% 76% 19% 69% 61% 22%
Dark green bars represent teachers who
strongly agree
Light green bars represent teachers who
agree

Consideran que el tiempo de enseñanza en aula puede
mejorarse, TALIS
Countries are ranked in descending order of the percentage of actual teaching and learning time. Source: OECD, TALIS Database.

Los docentes se sienten satisfechos pero no eficaces
en su trabajo...
Australia
Austria
Belgium (Fl.)
Brazil
Bulgaria
Denmark
Estonia
Hungary
Iceland Ireland
Italy
Korea
Lithuania
Malaysia Malta
Mexico
Norway
Poland
Portugal
Slovak Republic
Slovenia
Spain
Turkey
2,8
2,9
3,0
3,1
3,2
3,3
3,4
3,5
-1,0 -0,5 0,0 0,5 1,0
Jo
b s
ati
sfa
cti
on
Self -efficacy: standardised factor scores

Como ven los alumnos a sus docentes: les motivan a leer? Index of teachers’ stimulation of students’ reading engagement based on students’ reports
0 25 50 75 100
The teacher shows students how the informationin texts builds on what they already know
The teacher helps students relate the stories theyread to their lives
The teacher encourages students to express theiropinion about a text
The teacher recommends a book or author to read
The teacher gives students enough time to thinkabout their answers
The teacher asks questions that challenge studentsto get a better understanding of a text
The teacher asks students to explain the meaningof a text
Spain Canada OECD average

Los docentes son conscientes de sus necesidades y piden
más oportunidades de formación

Los docentes reciben poca evaluación o seguimiento de su
trabajo (2007-08)

Los salarios docentes en educación secondaria, 2010
0
20.000
40.000
60.000
80.000
100.000
Luxe
mb
ou
rgSw
itze
rlan
d1
Ge
rman
yN
eth
erl
and
sC
anad
aIr
ela
nd
De
nm
ark
Sco
tlan
dSp
ain
Au
stra
liaK
ore
aU
nit
ed
Sta
tes2
Jap
anA
ust
ria
Engl
and
Be
lgiu
m (
Fl.)
Be
lgiu
m (
Fr.)
Ne
w Z
eal
and
Fin
lan
dO
ECD
ave
rage
Po
rtu
gal
No
rway
Fran
ceIt
aly
Swe
de
n2
Slo
ven
iaG
ree
ceIc
ela
nd
Me
xico
Ch
ileIs
rae
lC
zech
Re
pu
blic
Po
lan
dA
rge
nti
na2
Hu
nga
ry2
Slo
vak
Re
pu
blic
Esto
nia
Ind
on
esi
a
Equivalent USD
converted using PPPs
Annual statutory teachers' salaries after 15 years of experience and minimum training in public institutions in lower secondary education, in equivalent USD converted using PPPs

Aumentan los salarios en paises OCDE, 2005-2010 Lower secondary teachers’ statutory salaries after 15 years of experience/minimum training, index of
change between 2000 and 2010 (2000 = 100, constant prices
80
90
100
110
120
130
Den
ma
rk
Irel
an
d
Po
rtu
ga
l
Sco
tla
nd
Au
stri
a
OE
CD
av
era
ge
Ko
rea
Gre
ece
Sp
ain
Icel
an
d
Au
stra
lia
Sw
ed
en
Fin
lan
d
New
Zea
lan
d
Mex
ico
En
gla
nd
Isra
el
Bel
giu
m (
Fl.
)
Ita
ly
Bel
giu
m (
Fr.
)
Un
ited
Sta
tes
Sw
itze
rla
nd
Fra
nce
Ja
pa
n
2010 2005Index of change 2000=100

Los docentes son los que más influyen
…y su función esta cambiando
Como responder a
sus necesidades?
Docentes
Alumnos Clases
Escuelas Padres y
comunidad

Docentes de alta calidad
Fortalecer educación
inicial
Atraer y apoyar nuevos
docentes
Retener con condiciones de trabajo favorables
Incentivos para grupos y escuelas con dificultades
Atraer, apoyar y retener a docentes de alta calidad Chile: evaluar y apoyar docentes. Un sistema de evaluación combina distintos instrumentos para medir el desempeño de los docentes, incluidos portafolios, videos, entrevistas con evaluadores par, autoevaluación y evaluación de los directores, con el objetivo de mejorar la práctica docente.
Shanghai (China): Todos los nuevos docentes participan en talleres, mentoring, observación y analizan lecciones con docentes con más experiencia, y se juntan en grupos de investigación para conocer técnicas pedagógicas. Se les reconoce por su excelencia.
Finlandia : la docencia es una profesion de alto prestigio. La educación inicial llega hasta un Master, y tiene componentes específicos: investigación, enfoque en conocimientos pedagógicos, desarrollo de capacidad de diagnostico y respuesta, y prácticas en las escuelas (1 año)
Singapur: Sistema comprensivo y muy definido para selecionar, formar, remunerar y desarrollar a los docentes y directores.
Ontario: Sistema de apoyo para formación y tiempo de preparación conjunta a los docentes.

Curriculum
estructura
Docentes
Escuelas
Evaluación y medición
Calidad
educativa Autonomia con apoyo,
fortaleciendo el liderazgo y
gestión
Las escuelas y su dirección: clave para la mejora

La variación entre escuelas no es mucha… V
ari
an
ce
Performance variation of students within schools
Performance differences between schools

200
493
-2 -1 0 1 2
Puntaje
La educación de calidad para todos es posible
España D
ese
mp
eño
esc
ola
r
Ventaja PISA Index of socio-economic background
Desventaja
Escuela privada Escuela pública en area rural Escuela pública en area urbana
700
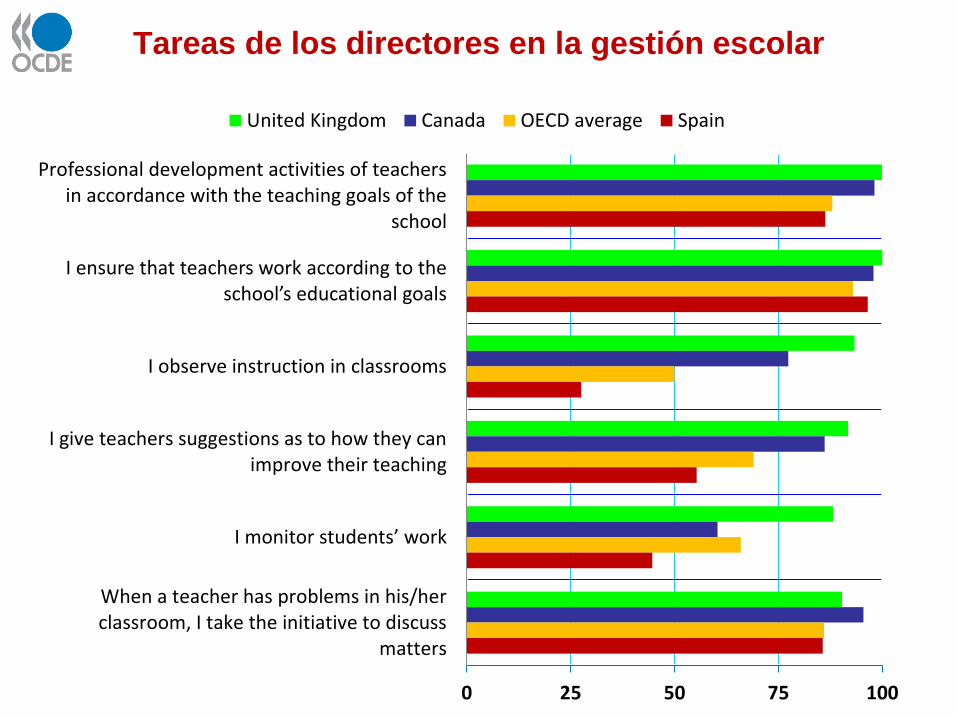
0 25 50 75 100
Professional development activities of teachersin accordance with the teaching goals of the
school
I ensure that teachers work according to the school’s educational goals
I observe instruction in classrooms
I give teachers suggestions as to how they canimprove their teaching
I monitor students’ work
When a teacher has problems in his/herclassroom, I take the initiative to discuss
matters
United Kingdom Canada OECD average Spain
Tareas de los directores en la gestión escolar

Politicas para eliminar la repetición en las escuelas
• Asegurar estrategias de evaluación continua y de apoyo
Medidas preventivas
• Planes estructurados de apoyo
Promoción con apoyo • Conocimiento
público del coste y fijar metas e incentivos
Cambiar la cultura de repetición

31
Curriculum
estructura
Docentes
Escuelas
Evaluación y
medición
•Definir la dirección escolar eficaz •Profesionalizar la formación y • la asignación de plazas de directores •Fortalecer el liderazgo instruccional (pedagogico) en las escuelas •Reforzar y apoyar la autonomía escolar •Incentivos para eliminar la repetición
Las escuelas y su dirección: propuestas para la mejora

OCDE: algunas recomendaciones para la mejora educativa
en materia de evaluación
Curriculum
estructura
Docentes
Escuelas
Evaluación y medición
•Fortalecer la rendición de cuentas pública •Enfocarse en los resultados de los alumnos •Asegurar una evaluación justa del valor agregado de las escuelas •Implementar una evaluación de los maestros para la rendición de cuentas y la mejora •Asegurar incentivos y estímulos efectivos para maestros en servicio

33
La gobernanza e implementación: claves en el diseño de
la política educativa
Objectivos claros centrados en calidad y equidad de las
escuelas
Alineación de los recursos (nacional/regional/local)
Diseñar instituciones/procesos
para apoyar las reformas
Participación de actores clave en procesos de reforma
Sistema de rendición de cuentas y medición de progreso con
datos que apoyan los objectivos
Gobernanza

Retos durante la crisis: la educación es clave
34
Preservar la
calidad :
docentes y
escuelas
Asegurar que
todos
terminen
Apoyar a los
desfavorecidos

Ob
ject
ivo
s •Bring together analysis
•Identify trends, policies and practices
•Analyse reform options
•Facilitate exchanges of lessons
The
rep
ort
will
• Take a systematic and comprehensive perspective
• Cover from ECEC through tertiary
• Build on OECD work
• Provide a common framework
• Independence
C
on
ten
t
• Trends in Education Policy
• Education Policy Profiles: Countries
• Reforms in selected areas
Education Policy Outlook: una nueva publicación
OCDE
Objetivo: aportar conocimientos sobre politica educativa

Education Policy Outlook: country profiles
Will give an OECD constructive perspective on country’s education policies: situation, context, challenges and policy responses. Six policy levers organised into three
questions: • Students: How to raise outcomes for
all in terms of equity and quality and preparing students for the future?
• Institutions: How to raise the quality of instruction through school improvement and evaluation and assessment?
• Systems: How are governance and funding of education systems aligned to be effective?
For policy makers...

Mas información
1) www.oecd.org/edu/ : PISA; TALIS; Equity
2) Preparing teachers and developing school leaders for
the 21st century – lessons from around the world, A.
Schleicher ed., OECD, 2012
3) Improving schools (OECD, 2010; 2011)

En España creció el gasto en educaciónon educational institutions
as a percentage of GDP,(2000, 2009)
0
1
2
3
4
5
6
7
8
Icel
an
d
Ko
rea
Den
ma
rk
New
Zea
lan
d
Un
ited
Sta
tes
Isra
el
Arg
enti
na
Ch
ile
Sw
eden
Bel
giu
m
Fin
lan
d
Irel
an
d
Fra
nce
Est
on
ia
Mex
ico
OE
CD
av
era
ge
Net
her
lan
ds
No
rwa
y
Ca
na
da
Un
ited
Kin
gd
om
Au
stra
lia
Slo
ven
ia
Sw
itze
rla
nd
Po
rtu
ga
l
Au
stri
a
Po
lan
d
Sp
ain
Bra
zil
Ru
ssia
n F
eder
ati
on
Ger
ma
ny
Ja
pa
n
Ita
ly
Hu
ng
ary
Cze
ch R
epu
bli
cS
ou
th A
fric
a
Slo
va
k R
epu
bli
c
Ind
on
esia
Ind
ia
2009 2000 1995% of GDP % of GDP

y a pesar de la crisis, el % del PIB destinado a la
educación ha continuado creciendo, 2009-2010
Index of change in expenditure on educational institutions and GDP (2008, 2009)
80
85
90
95
100
105
110
115
120
125
No
rwa
y
Slo
va
k R
epu
bli
c
Ru
ssia
n F
eder
ati
on
Ire
lan
d
Po
rtu
ga
l
New
Zea
lan
d
Au
stra
lia
Den
ma
rk
Cze
ch R
epu
bli
c
Net
her
lan
ds
Ger
ma
ny
Un
ited
Kin
gd
om
Fin
lan
d
Slo
ven
ia
Mex
ico
Sp
ain
Au
stri
a
Sw
itze
rla
nd
OE
CD
av
era
ge
Ca
na
da
Sw
eden
Ch
ile
Ko
rea
Ja
pa
n
Fra
nce
Icel
an
d
Est
on
ia
Un
ited
Sta
tes
Bel
giu
m
Po
lan
d
Ita
ly
Isra
el
Change in expenditure
Change in gross domestic product
Change in expenditure on educational institutions as a percentage of GDP
Index of change (2008=100)