Embed Size (px)
Citation preview

Copyright 2021 Indonesian Aquaculture Journal p-ISSN 0215-0883 e-ISSN 2502-6577 51
Indonesian Aquaculture Journal 16 (1) 2021 51-60
Correspondence School of Environmental Science UniversitasIndonesia Indonesia Jl Salemba Raya No 4 RW5 KenariSenen Sub-District Jakarta IndonesiaE-mail ofanbosmanuiacid
Available online at httpejournal-balitbangkkpgoidindexphpiaj
POLLUTION INDEX AND ECONOMIC VALUE OF VANNAMEI SHRIMP (Litopenaeus vannamei)FARMING IN INDONESIA
Ofan Bosman) Tri Edhi Budhi Soesilo) and Sinung Rahardjo)
) School of Environmental Science Universitas Indonesia IndonesiaJl Salemba Raya No 4 RW5 Kenari Senen Sub-District Jakarta Indonesia
) Jakarta Technical University of Fisheries IndonesiaJl AUP Pasar Minggu Jakarta Indonesia
(Received February 8 2021 Final revised March 30 2021 Accepted March 30 2021)
ABSTRACT
Shrimp farming has contributed a large share in Indonesiarsquos aquaculture portfolio for at least a decadeand a national plan to increase shrimp production by 250 has been recently laid out However boostingshrimp productions could lead to unintended consequences in environmental and socio-economic negativeimpacts The rapid development of vannamei farming in Java has increased coastline land clearings anddemands of fertilizers feeds and chemicals to sustain the farming activities Such pressures will eventuallylead to a reduced environmental capacity and the farming efficiency itself This study aimed to study theenvironmental impacts and business performance of intensive shrimp farming in Indonesia The study wasconducted in Aquaculture Business Center (ABC) in Karawang for four months from July to October 2020In-situ and ex-situ measurements of water quality parameters were done at six sampling stations directlypost-harvest water discharge The measured parameters consisted of temperature pH dissolved oxygenammonia (NH3) nitrite (NO2) nitrate (NO3) phosphate (PO4) alkalinity and salinity Pollution Index (PI) wasused as the primary method to determine the environmental impacts of the shrimp farming The RC Ratiowas used to analyze the business performance of the company The results showed that the water qualityindex in the ABC area was categorized as lightly polluted in station 1 (PIj 452) and station 5 (PIj 437)moderately polluted in station 2 (PIj 624) station 3 (PIj 672) and station 4 (PIj 613) and heavily pollutedin station 6 (PIj 11106) The determined RC ratio was 110 meaning that the shrimp farming is classifiedas economically profitable Although the shrimp farmingrsquos economic performance value is very good thewater conditions affected by waste from the shrimp pond culture will reduce the RC ratio in the future ifnot properly managed
KEYWORDS pollution index water quality vannamei RC ratio environment
INTRODUCTION
According to the Food and Agriculture Organiza-tion (FAO) Indonesia is the second-largest farmed-shrimp-producing country in ASEAN slightly behindVietnam (FAO 2018) Indonesiarsquos highly valued farmedshrimp is exported to international markets contrib-uting to Indonesiarsquos significant foreign revenue (Hadieamp Hadie 2017 Tran et al 2017) Farmed shrimp prod-ucts from Indonesia are mainly exported to the UnitedStates Japan and the European Union In 2016 farmedshrimp production in Indonesia ranked third globallywith 644000 tons (FAO 2018) It was slightly belowVietnam in second with 694400 tons and China as
the top producer of 1600000 tons (FAO 2018) Ac-cording to the Indonesian National Statistical Datain 2019 farmed shrimp commodity led the nationalfishery export products within the last five years(2013-2017) It grew at an average of 643 per yearwithin the period (BPS 2019)
Aquaculture is the fastest-growing food produc-tion system globally bringing potential solutions andnew challenges for marine and coastal sustainability(Partelow et al 2018) Aquaculture contributes 441of the total worldrsquos fish supply of 1672 million tonswith an annual increase rate of 8 (Jayanthi et al2018) Considering Indonesia has enormous poten-tial resources with a total indicative land area of 172million hectares suitable for aquaculture it is esti-mated that aquaculture could contribute a direct eco-nomic value of 250 billion USD per year (KKP 2018)
doi 1015578iaj1612021 51-60
52 Copyright 2021 Indonesian Aquaculture Journal p-ISSN 0215-0883 e-ISSN 2502-6577
Pollution index and economic value of vannamei shrimp (Ofan Bosman)
The Indonesian government launched a revisedtarget of increasing vannamei shrimp exports by 250in 2024 (Kemenko Marves 2020 KKP 2020) Thisrevised target means that the total value of farmedvannamei has to reach IDR 9030 trillion (USD 645million) by 2024 from IDR 3622 trillion (USD 258million) in 2019 In terms of production volume thetotal shrimp production should increase from 517397tons in 2019 to 1290000 tons in 2020 As part ofthe effort the Indonesian Coordinating Ministry ofMaritime and Investment released a program to in-crease vannamei farming areas to 86000 hectares until2024 (Kemenko Marves 2020)
As a result shrimp farming has caused concern-ing socio-economic and environmental impacts(FAIRR 2019 Galappaththi amp Berkes 2015 Mitro etal 2014 Saha 2017) For example the Ministry ofNational Development Planning (BAPPENAS) in 2014reported that many aquaculture business entities inIndonesia have not yet implemented Good Aquacul-ture Practices (Bappenas 2014) The increase in land-based shrimp farming activities will eventually leadto the clearing of mangrove forests increased use offeeds fertilizers and inappropriate application ofchemicals that can negatively impact the environment(Boyd 2003 De Lacerda et al 2006 Tarunamulia etal 2016)
In Bengkalis Kembung River Indonesia a massiveshrimp pond development had degraded the waterquality of the adjacent rivers in from of increasedBOD
5 nitrate (NO
3) and phosphate (PO4-) values
(Harianja et al 2018) In other areas of Indonesiasuch as in Kawaru Beach and Losari Subdistrict theestablishment of vannamei ponds has changed thecoastal landscape (Pinto 2016) and increased the like-lihood of harmful algal blooms (HABs) occurrences(Tarunamulia et al 2016) In Andulang village-SumenepEast Java Indonesia the rapid development of shrimpponds has impacted nearby agricultural land and re-leased ammonia pollutants to the adjacent coastal area(Hidayatillah 2017) Also high protein feed in shrimpculture can release nitrogen pollutants and organicmatter to the surrounding waters (Imamah et al2013)
The contradicting features of shrimp farming (itsimpact on the environment but profitable as a busi-ness) have attracted global attention from variousstakeholders such as academics practitioners andprivate businesses In most cases research relatedto shrimp cultivation have reported massive nega-tive impacts of shrimp farming on the environment(Paacuteez-Osuna 2001) A new approach needs to be de-veloped that strikes a balance between producing a
high yield of shrimp and maintaining the quality andfunction of the environment Therefore this researchaimed to analyze the environmental impacts and linkthem to the business performance of an Indonesianshrimp farming system
MATERIALS AND METHODS
Research Site
The research was carried out for four months fromJuly to October 2020 at vannamei ponds owned bythe Aquaculture Business Center (ABC) in KarawangRegency-West Java Indonesia
Research Data
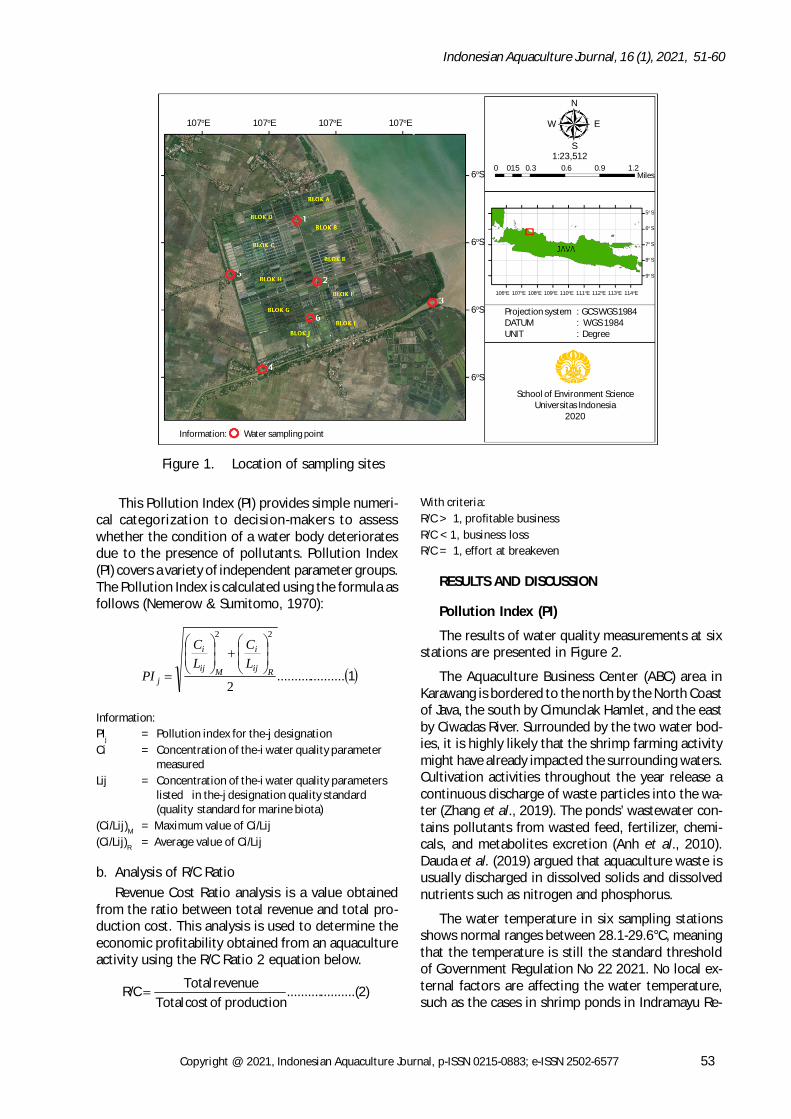
Water samples were collected at six stationsnamely mixed channel A (1) mixed channel B (2) sea-water receptacle (3) Ciwadas River (4) CimunclakRiver (5) and outlet channel (6) (Fig 1) The watersamples were collected shortly after the pondsrsquo wa-ter was discharged post shrimp harvest In-situ mea-surements of water quality parameters were tempera-ture (YSI 550A-SNI 06-698923-2005) pH (pH meter-SNI 06-698911-2004) dissolved oxygen (YSI 550A-SNI 06-698914-2004) and salinity (refractometer) Ex-situ measurements of water quality parameters wereammonia (NH
3) (Spektrofotometer-SNI 06-698930-
2005) nitrite (NO2) (Spektrofotometer-SNI 06-69899-
2004) nitrate (NO3) (Spektrofotometer-SNI 698979-
2011) phosphate (PO4) (Spektrofotometer-SNI 06-
698930-2005) and alkalinity (titrate) in Laboratoriumof Aquaculture Business Center The farming businessanalysis was taken through direct observation andinterviewing pond managers
Data Analysis
The measure of temperature pH dissolved oxy-gen ammonia (NH
3) nitrite (NO
2) nitrate (NO
3) phos-
phate (PO4) alkalinity and salinity The results were
then analyzed using Pollution Index (PI) method byreferring to the Ministerial Decree of EnvironmentNo 115 of 2003 The RC Ratio analysis was appliedto analyze the business process of the ABC companyAll the data were processed and analyzed usingMicrosoft Office Excel 2007 software The step-by-step data analysis can be explained as follows
a Pollution Index (PI)
An index that can determine the water quality sta-tus is the pollution index (PI) The classification ofwater quality using PI was first introduced byNemerow amp Sumitomo (1970) and incorporated inthe Ministerial Decree No 115 2003 as one of thestandard methods to determine water quality level(Table 1)
Copyright 2021 Indonesian Aquaculture Journal p-ISSN 0215-0883 e-ISSN 2502-6577 53
Indonesian Aquaculture Journal 16 (1) 2021 51-60
This Pollution Index (PI) provides simple numeri-cal categorization to decision-makers to assesswhether the condition of a water body deterioratesdue to the presence of pollutants Pollution Index(PI) covers a variety of independent parameter groupsThe Pollution Index is calculated using the formula asfollows (Nemerow amp Sumitomo 1970)
InformationPI
j= Pollution index for the-j designation
Ci = Concentration of the-i water quality parametermeasured
Lij = Concentration of the-i water quality parameterslisted in the-j designation quality standard(quality standard for marine biota)
(CiLij)M
= Maximum value of CiLij(CiLij)
R= Average value of CiLij
b Analysis of RC RatioRevenue Cost Ratio analysis is a value obtained
from the ratio between total revenue and total pro-duction cost This analysis is used to determine theeconomic profitability obtained from an aquacultureactivity using the RC Ratio 2 equation below
With criteriaRC gt 1 profitable businessRC lt1 business lossRC = 1 effort at breakeven
RESULTS AND DISCUSSION
Pollution Index (PI)
The results of water quality measurements at sixstations are presented in Figure 2
The Aquaculture Business Center (ABC) area inKarawang is bordered to the north by the North Coastof Java the south by Cimunclak Hamlet and the eastby Ciwadas River Surrounded by the two water bod-ies it is highly likely that the shrimp farming activitymight have already impacted the surrounding watersCultivation activities throughout the year release acontinuous discharge of waste particles into the wa-ter (Zhang et al 2019) The pondsrsquo wastewater con-tains pollutants from wasted feed fertilizer chemi-cals and metabolites excretion (Anh et al 2010)Dauda et al (2019) argued that aquaculture waste isusually discharged in dissolved solids and dissolvednutrients such as nitrogen and phosphorus
The water temperature in six sampling stationsshows normal ranges between 281-296degC meaningthat the temperature is still the standard thresholdof Government Regulation No 22 2021 No local ex-ternal factors are affecting the water temperaturesuch as the cases in shrimp ponds in Indramayu Re-
Figure 1 Location of sampling sites
1 2
22
Rij
i
Mij
i
j
LC
LC
PI
(2) production ofcost Total
revenue TotalRC
Information Water sampling point
School of Environment ScienceUniversitas Indonesia
2020
Projection system GCS WGS 1984DATUM WGS 1984UNIT Degree
1235120 015 03 06 09 12
Miles
N
W
S
E
5o S
6o S
7o S
8o S
9o S
106oE 107oE 108oE 109oE 110oE 111oE 112oE 113oE 114oE
107oE 107oE 107oE 107oE
6oS
6oS
6oS
6oS
54 Copyright 2021 Indonesian Aquaculture Journal p-ISSN 0215-0883 e-ISSN 2502-6577
Pollution index and economic value of vannamei shrimp (Ofan Bosman)
Table 1 Determination of water categories according to PollutionIndex (The Ministry of Environment No 115 2003)
Figure 2 Water quality in ABC waters
Value of water quality index Category0 le PIj le 10 Water quality standards10 lt PIj le 50 Lightly polluted50 lt PIj le 10 Moderately pollutedPIj gt 10 Heavily polluted
27275
28285
29295
30
1 2 3 4 5 6
Tem
pera
ture
(degC)
Stations
0
005
01
015
02
1 2 3 4 5 6
Amm
onia
(mg
L)Stations
6
7
8
9
1 2 3 4 5 6
pH
Stations
05
10152025
1 2 3 4 5 6
Nit
rate
(mg
L)
Stations
0
5
10
15
20
1 2 3 4 5 6
Salin
ity (p
pt)
Stations
0
2
4
6
8
10
1 2 3 4 5 6
Nit
rite
(mg
L)
Stations
0
50
100
150
200
250
1 2 3 4 5 6
Alka
linit
y (m
gL)
Stations
0
1
2
3
4
5
1 2 3 4 5 6
Phos
phat
e (m
gL)
Stations
012345
1 2 3 4 5 6
Dis
olve
d ox
ygen
(m
gL)
Stations
Copyright 2021 Indonesian Aquaculture Journal p-ISSN 0215-0883 e-ISSN 2502-6577 55
Indonesian Aquaculture Journal 16 (1) 2021 51-60
gency West Java (Utojo et al 2013) Pati ponds inCentral Java (Asaf et al 2015) and Maros ponds inSouth Sulawesi (Utojo et al 2011) This tempera-ture range is the typical value range in most areas ina tropical country such as Indonesia According toAlberto (2016) extreme temperature changes mightaffect an organismrsquos metabolic rate altering the spa-tial distribution of organisms both in the ocean andthe freshwater ecosystem Furthermore the tempera-ture also significantly affects the growth and life ofaquatic biota (Alberto 2016)
The waterrsquos pH (acidity level) of the ABC samplingstations is normal from 761-801 and still within thethreshold of Government Regulation No 22 2021where normal pH should not be out of the range of
6-9 for aquaculture farming Another regulation theMinisterial Decree of Marine Affairs and FisheriesNo282004 also recommends that the pH should notbe out of range 6-9 for the discharged water pondeffluents in shrimp culture This is the same as thepH of the waters in the Indramayu and Maros ponds(Utojo et al 2011 2013) and the waters in the Patiponds Central Java (Asaf et al 2015) This study find-ing is different from the study results by Yu et al(2020) who showed that pH values of 65 and 95 hadcaused a significant reduction in shrimp growth ThepH is described as the number of hydrogen ions inwater which generally represents the acidity or alka-linity of water (Effendi 2003) Changing in pH mayaffect the productivity of aquatic animals and plants
Table 3 Pollution Index (PI) Calculation Results
Table 2 Collection data of water quality
1 2 3 4 5 6
Temperature (degC) 28-32 29 296 29 296 294 281pH 6-9 794 771 761 795 767 801Salinity (ppt) 10-35 5 14 16 3 6 14Alkalinity (mgL) 80-150 126 151 134 104 151 209Ammonia (NH3) (mgL) lt 05 001 004 004 015 002 009Nitrate (NO3) (mgL) 20 1809 2293 2338 198 2348 2264Nitrite (NO2) (mgL) 006 037 052 056 051 036 936
Phospate (PO4) (mgL) 1 425 22 311 195 227 122Dissolved oxygen (mgL) 3 21 46 37 25 27 31
ParametersQuality
standard
Station
Explanation Government Regulation No 222021 (Attached VI)
1 2 3 4 5 6
(CiLij)M 617 867 933 85 6 156(CiLij)R 168 165 18 169 148 1824
(CiLij)M2 3807 7517 8705 7225 36 24336
(CiLij)R2 283 273 325 285 22 33281
(CiLij)M2 + (CiLij)R
2 409 7789 903 751 382 2466881
2045 3895 4515 3755 191 123344
452 624 672 613 437 11106
Pij (PI Status)Lightly
pollutedModerately
pollutedModerately
pollutedModerately
pollutedLightly
pollutedHeavilypolluted
PI calculation phaseStations
(CiLij)Mଶ + (CiLij)R
2
2
(CiLij)Mଶ + (CiLij)R2
2
56 Copyright 2021 Indonesian Aquaculture Journal p-ISSN 0215-0883 e-ISSN 2502-6577
Pollution index and economic value of vannamei shrimp (Ofan Bosman)
Therefore pH is often used to indicate whether ornot the waters could support the life of the aquaticanimal (Effendi 2003)
In station 1 (mixed channels A) station 4 (CiwadasRiver) and station 5 (Cimunclak River) the salinityvalues were 5 ppt 3 ppt and 6 ppt respectively whichare below the suggested standard These numbersindicate that the salinity at that stations is far belowthe threshold stated in the Government RegulationNo 222021 The freshwater mass from the rivers in-fluences the three stationsrsquo salinity levels Accordingto Supriadi (2001) salinity changes are often causedby rainfall and seawater massesrsquo mixing with fresh-waters forming brackish water with unique physicalcharacteristics
For the alkalinity only station Six has exceededthe threshold where the value was 209 mgL StationSix is the outlet channel of the pond Effendi (2003)defines alkalinity as a buffer capacity to decrease thewatersrsquo pH Another water quality parameter theammonia content is the main parameter in deter-mining water quality concerning nitrogen concentra-tion in waters Ammonia values between 001-015mgL indicate that the water condition is still withinthe quality standard based on the PP 22 of 2021 am-monia threshold 05 mgL while the standard qualityvalue of the Decree of the Minister of KP No 28 of2004 is lt01 mgL This finding is the same as theresearch results of Romadhona et al (2016) who foundthe ammonia value ranges from 002ndash012 mgL intheir study sites However ammonia values lt002mgL can inhibit growth and cause tissue damage insome fish species (Wahyuningsih et al 2020) Putriet al (2019) stated that industrial areas agriculturalland and residential areas are the main contributorsto ammonia High concentrations of ammonia inwaters can reduce dissolved oxygen levels that even-tually affect physiological and metabolic functions suchas respiration (Zhang et al 2013)
Station Two Three Five and Six have exceededthe allowable nitrate concentration The nitrate con-centration was 2293 mgL 2338 mgL 2348 mgLand 2264 mgL respectively Based on the Govern-ment Regulation No 22 of 2021 the nitrate thresh-old is 20 mgL for shrimp farming while the Ministe-rial Decree of Environment 2004 limits the nitratethreshold for marine biota to less than 0008 mgL(Harianja et al 2018 Putri et al 2019) Shrimp cul-ture may increase nitrate amount due to the feedand fertilizersrsquo leftover accumulated at the pondrsquosbottom For instance Harianja et al (2018) reportedthat about 457 tonnes of nitrate had entered theKembung River in Bengkalis each year due to theshrimp cultivations and crops along the river Accord-
ing to Nasir et al (2018) agricultural household andaquaculture activities discharge large quantities ofnutrients (N-P) along the Pangkep River SouthSulawesi One of the factors that influence the pres-ence of nitrate in water is the source of nitrate it-self Nitrate in water bodies can be derived from at-mosphere diffusion fixation organic matter degra-dation and organic waste disposal due to human ac-tivities (Effendi 2003)
The concentration of nitrite has exceeded the al-lowable concentration as guided in the GovernmentRegulation In Station Six the nitrite concentrationwas about 936 mgL Station Six is the outlet chan-nel of ABCrsquos ponds According to PP No 22 2021 andKEP28MEN2004 the nitrite threshold concentrationis between 006 mgL-25 mgL As a comparison Putriet al (2019) reported that the concentration of ni-trite in Banyuasin River Estuary ranged from 0002 to0093 mgL while Nasir et al (2018) reported nitriteconcentration in Pangkep ranged from 0004 to 0006mgL Pantjara et al (2015) reported that nitrate con-tent in seawater and reservoirs was about 0040 plusmn00416 mgL and 0045 plusmn 00439 mgL respectivelyTherefore the concentration of nitrite in the Aquac-ulture Business Center (ABC) area was the highestcompared to other areas This result indicates thatthe Aquaculture Business Center in Karawang has beencontaminated with some organic pollutants Nitrite(NO
2) is an oxidized form of nitrogen with an oxida-
tion number of +3 and can be found in wastewaterriver water and drainage treatment plants Nitrite isa critical parameter in determining water quality be-cause it is toxic when it reacts with hemoglobin inthe blood blocking the blood from binding oxygen(Effendi 2003)
The phosphate concentration at all stations hasexceeded the allowable threshold ranged between122-425 mgL Based on the Government RegulationPP No 22 of 2021 phosphatersquos natural occurrencesshould not exceed 1 mgL and regulation of KEP28MEN2004 limits the phosphate to not exceed 01mgL The application of fertilizer during shrimp cul-tivation is the primary source of phosphate in theponds The leftover feed and fertilizer then releasedinto the environment increasing the phosphate andother organic matters to the river (Rawson et al2007) High organic matter may double the watersrsquoprimary productivity and eventually decrease dissolvedoxygen (Ahmed et al 2010) The phytoplankton andbacteria in the bottom of the pond may reduce thephosphate concentration since they can absorb phos-phate and use it in their metabolic process The ab-sorption of phosphate can also occur in the pondrsquosbottom sludge if there is Ca
2+ or Fe
3+ that may help
absorb the phosphate The content of orthophosphate
Copyright 2021 Indonesian Aquaculture Journal p-ISSN 0215-0883 e-ISSN 2502-6577 57
Indonesian Aquaculture Journal 16 (1) 2021 51-60
in water is often used to indicate the level of pri-mary productivity of waters Phosphate in inorganicform is assimilated by phytoplankton and circulatesin estuary waters (Supriadi 2001)
Dissolved oxygen (DO) contents in stations OneFour and Five are the lowest DO level compared tothe other stations The DO concentration was 21mgL 25 mgL and 27 mgL respectively Based onthe Government Regulation No 22 of 2021 andKEP28MEN2004 the limit of DO in aquatic farmingshould not exceed 3 mgL Interestingly based on theresults the low DO contents occurred when the sa-linity concentration was low This situation contra-dicts the study results conducted by Maicaacute et al(2014) who found that the higher the salinity thelower the dissolved oxygen It is argued here thatthe water at the three stations which are located inrivers and mixed water tanks is consistently influ-enced by the low salinity freshwater from the riverThe water also has substantial organic matter con-centration where oxygen is used to break down theorganic material reducing dissolved oxygen Low dis-solved oxygen in water may affect biological func-tions inhibit growth or even causing death to someaquatic organisms (Rahman et al 2020) The con-centration of oxygen in a water body will decreasedue to the organic elementrsquos decomposition (Rawsonet al 2007)
The Pollution Index (PI) method has been used todetermine the water quality status of the ABCrsquosshrimp farming based on the data provided in Table2 The results of the PI calculation are presented inTable 3 These PI values refer to the Minister of Envi-ronment Decree No 115 of 2003 which classify thatthe water quality of ABC shrimp farming is catego-
rized as light to heavily polluted with the score of PIjgt 10 This water pollution is caused by shrimp pondactivities that contribute to the high nitrogen andphosphate concentrations disposed of directly with-out going through a treatment process (Kawasaki etal 2016) The water pollution level in the study sitecould be attributed to the lack of sufficient wastewa-ter treatment plants provided by the company
Nowadays water could become ldquoan expensive andscarce itemrdquo since anthropogenic pollutants such asdomestic wastewater agricultural waste and shrimpfarming waste have contaminated and worsened thewater quality On the other hand the shrimp eco-nomic activity also plays an essential role in the localrsquoseconomy Harianja et al (2018) argued that theeconomy should not be put on top of the ecologyrsquosconcern For instance fish farming uses a large amountof marine and freshwater Since the water resourcesare open access where anyone can utilize them aprecautionary approach regarding the resourcesrsquo useshould always prioritize the minimal impacts to theresources
Business AnalysisThe business analysis of the vannamei farming was
calculated based on one pond per cycle with totalrevenue IDR 102880719 total cost IDR 93869539and benefit IDR 9011180 Therefore the RC ratiois 110 where RC gt1 meaning that the shrimp farm-ing business is profitable or economically viable (Table4) The highest cost component in the production ofvaname is the cost of feed with an average price ofIDR 13000kg It contributes 461 of the total costfollowed by the electricity (205) the cost of fry(17) pond production facilities (135) and labor(29)
Table 4Business analysis of shrimp farming
Components YieldLand area (ha) 045Density (shrimpm2) 68Amount of stocking (shrimp) 307056Amount of feed (kg) 3054Days of culture (DOC) (day) 70Survival rate () 3936Survive (shrimp) 120857Main body weight (g) 1318Shrimp size (shrimpkg) 76Production biomass (kg) 1593FCR 192Shrimp selling price (IDRkg) 64583Revenue (IDR) 102880719Cost (IDR) 93869539Benefit (IDR) 9011180
58 Copyright 2021 Indonesian Aquaculture Journal p-ISSN 0215-0883 e-ISSN 2502-6577
Pollution index and economic value of vannamei shrimp (Ofan Bosman)
CONCLUSION
Some organic pollutants have contaminated shrimpfarming in the Aquaculture Business Center (ABC) areaof Karawang Regency The current pollution statuswater is classified from lightly to heavily pollutedBased on the RC analysis it can be concluded thatshrimp farming is economically viable and profitableHowever this study suggests that the future profit-ability of the farm could be negatively affected if thelevel of water pollution in the area is not adequatelyaddressed Improving the capacity of wastewatertreatment plants efficient feeding management andfollowing the general rules of Good Aquaculture Prac-tices could extend the sustainability of the farmingsystem
ACKNOWLEDGEMENTS
The authors would like to thank Universitas In-donesia for funding this research through PUTI Grantwith contract number NKB-2573UN2RSTHKP05002020 We also thank Aquaculture Business CenterKarawang Regency for providing access and researchsupport during the fieldwork
REFERENCES
Ahmed R Shahabuddin AM Habib MAB ampYasmin M (2010) Impact of Aquaculture Prac-tices in Naogaon District of Bangladesh ResearchJournal of Fisheries and Hydrobiology 5(2) 56-65
Alberto A (2016) Analysis of the physical and chemicalconditions of the vaname shrimp pond effluent(Litopenaeus vannamei) in Aquaculture BusinessCenter Karawang Jawa Barat Universitas Indone-sia
Anh PT Kroeze C Bush SR amp Mol APJ (2010)Water pollution by intensive brackish shrimp farm-ing in south-east Vietnam Causes and optionsfor control Agricultural Water Management 97(6)872-882 httpsdoiorg101016jagwat201001018
Asaf R Ratnawati E amp Mustafa A (2015) Analysisof the influence of environmental factors tambakcultivation on tambak productivity in Tayu PatiDistrict Central Java Province 2 789-800
Bappenas (2014) Study of Sustainable Fisheries Man-agement Strategies Kementerian PPNBapenasDirektorat Kelautan Dan Perikanan 120 pp
Boyd C E (2003) Guidelines for aquaculture efflu-ent management at the farm-level Aquaculture226(1-4) 101-112 httpsdoiorg101016S0044-8486(03)00471-X
BPS (2019) Cultivation fishery production by prov-ince and type of cultivation Retrieved from httpswwwbpsgoiddynamictable201905141622produksi-perikanan-budidaya-menurut-provinsi-dan-jenis-budidaya-2017html
Dauda AB Ajadi A Tola-Fabunmi AS amp AkinwoleAO (2019) Waste production in aquacultureSources components and managements in dif-ferent culture systems Aquaculture and Fisher-ies 4 (3) 81ndash88 httpsdoiorg101016jaaf201810002
De Lacerda LD Vaisman AG Maia LP Ramos ESilva CA amp Soares Cunha EM (2006) Relativeimportance of nitrogen and phosphorus emissionsfrom shrimp farming and other anthropogenicsources for six estuaries along the NE Braziliancoast Aquaculture 253(1ndash4) 433ndash446 httpsdoiorg101016jaquaculture200509005
Effendi H (2003) Study of Water Quality for Man-agement of Water Resources and EnvironmentYogyakarta Kanisius
FAIRR (2019) Shallow returns ESG risks and op-portunities in aquaculture 15 Retrieved fromwwwfairrorg
FAO (2018) The State of World Fisheries and Aquac-ulture 2018 - Meeting the sustainable develop-ment goals In FAO Retrieved from httpwwwfaoorgstate-of-fisheries-aquaculture
Galappaththi EK amp Berkes F (2015) Drama of thecommons in small-scale shrimp aquaculture innorthwestern Sri Lanka International Journal ofthe Commons 9(1) 347-368 httpsdoiorg1018352ijc500
Government Regulation RI No 22 (2021) Govern-ment Regulation Number 22 of 2021 concerningGuidelines for Environmental Protection and Man-agement State Secretariat of the Republic of In-donesia Vol 1 p 483 Retrieved from httpwwwjdihsetjenkemendagrigoid
Hadie W amp Hadie LE (2017) Analysis of the Aquac-ulture System to Support a Policy of SustainableShrimp Production Jurnal Kebijakan Perikanan In-donesia 9(1) 51-60
Harianja R S M Anita S amp Mubarak M (2018)Analysis of pollution load in shrimp ponds aroundthe Kembung River Bantan Bengkalis DistrictDinamika Lingkungan Indonesia 5(1) 12 httpsdoiorg1031258dli51p12-19
Hidayatillah Y (2017) The social impact of shrimppond industry on the environment in AndulangVillage Sumenep Regency Jurnal Teori Dan PraksisPembelajaran IPS 21-26
Copyright 2021 Indonesian Aquaculture Journal p-ISSN 0215-0883 e-ISSN 2502-6577 59
Indonesian Aquaculture Journal 16 (1) 2021 51-60
Imamah IL Hartoyo S Syaukat Y amp Utami KS(2013) The total productivity factor of the pondbusiness is related to pond pollutants in KarawangRegency Agribusiness Journal 7(1) 35-58 httpsdoiorg1015408ajv7i15169
Jayanthi M Thirumurthy S Muralidhar M ampRavichandran P (2018) Impact of shrimp aquac-ulture development on important ecosystems inIndia Global Environmental Change 52(March) 10-21 httpsdoiorg101016jgloenvcha201805005
Kemenko Marves (2020) Coordinating MinisterLuhut Asks for Speeding Up Vaname Shrimp Ex-port Program Retrieved from KementerianKoordinator Bidang Kemaritiman dan Investasiwebsite httpsmaritimgoidmenko-luhut-minta-program-peningkatan-ekspor-udang-vaname
KKP (2018) Shrimp farming is still very potentialRetrieved from httpskkpgoiddjpbartikel8688-kkp-budidaya-udang-masih-sangat-potensial
KKP (2020) KKP Prepares Strategies for Facing Aquac-ulture Challenges in 2020 Retrieved fromKementerian Kelautan dan Perikanan websitehttpskkpgoiddjpbartikel17871-kkp-siapkan-strategi-hadapi-tantangan-akuakultur-di-tahun-2020
Maicaacute PF de Borba MR Martins TG ampWasielesky W (2014) Effect of salinity on per-formance and body composition of Pacific whiteshrimp juveniles reared in a super-intensive sys-tem Revista Brasileira de Zootecnia 43(7) 343ndash350h t t p s d o i o r g 1 0 1 5 9 0 S 1 5 1 6 -35982014000700001
Minister of Environment Number 115 (2003) Decreeof the Minister of Environment Number 115 con-cerning Guidelines for Determining Water Qual-ity Status Jakarta State Minister for the Environ-ment p 1-15
Minister of Marine Affairs and Fisheries No 28 (2004)Decree of the Minister of Marine Affairs and Fish-eries of the Republic of Indonesia Number KEP28MEN2004 concerning General Guidelines for Cul-tivating Shrimp in Ponds 26 pp
Mitro S Khatun R amp Baten M (2014) Socio-Eco-nomic and Environmental Impacts of Shrimp Cul-ture in Some Selected Areas of Bagerhat DistrictJournal of Environmental Science and Natural Re-sources 7(1) 265-269 httpsdoiorg103329jesnrv7i122181
Nasir A Baiduri M A amp Hasniar (2018) NutrientN-P in Coastal Waters of Pangkep South SulawesiJurnal Ilmu dan Teknologi Kelautan Tropis 53(9)1689-1699
Nemerow NL amp Sumitomo H (1970) Benefits of WaterQuality Enhancement Report No 16110 DAJ pre-pared for the US Environmental Protection Agency De-cember 1970 Syracuse University Syracuse NY
Paacuteez-Osuna F (2001) The environmental impact ofshrimp aquaculture A global perspective Environ-mental Pollution 112(2) 229-231 httpsdoiorg101016S0269-7491(00)00111-1
Pantjara B Syafaat M N amp Kristanto A H (2015)Effect of dynamical water quality on shrimp cul-ture in the Integrated Multitropic Aquaculture(IMTA) Indonesian Aquaculture Journal 10(1) 81httpsdoiorg1015578iaj101201581-90
Partelow S Senff P Buhari N amp Schluumlter A (2018)Operationalizing the social-ecological systemsframework in pond aquaculture International Jour-nal of the Commons 12(1) 485-518 httpsdoiorg1018352ijc834
Pinto Z (2016) Study of Coastal Community Behav-ior that Causes Environmental Damage (Case Studyat Kuwaru Beach Poncosari Village Srunjuk Dis-trict Bantul Regency DIY Province) Jurnal WilayahDan Lingkungan 3(3) 163 httpsdoiorg1014710jwl33163-174
Putri W A E Purwiyanto A I S Fauziyah Agustriani F amp Suteja Y (2019) Conditions ofNitrate Nitrite Ammonia Phosphate and Bodiesin the mouth of the Banyuasin River SouthSumatra Jurnal Ilmu Dan Teknologi Kelautan Tropis11 (1) 65-74 httpsdoiorg1029244jitktv11i118861
Rahman A Dabrowski J amp McCulloch J (2020)Dissolved oxygen prediction in prawn ponds froma group of one step predictors Information Pro-cessing in Agriculture 7(2) 307-317 httpsdoiorg101016jinpa201908002
Rawson M Chen C Wang D Yarish C SullivanJ Wang L amp Zhu M (2007) Ecosystem-basedmanagement and models in sustainable manage-ment of coastal aquaculture Bull Fish Res Agent19 97ndash111
Romadhona B Yulianto B amp Sudarno S (2016)Fluctuation of ammonia content and environmen-tal pollution load of intensive vaname shrimp pondswith partial harvest and total harvest techniquesSAINTEK PERIKANAN Indonesian Journal of FisheriesScience and Technology 11(2) 84 httpsdoiorg1014710ijfst11284-93
Saha S K (2017) Socio-economic and environmen-tal impacts of shrimp farming in the south-west-ern coastal region of Bangladesh International Jour-nal of Research on Land-Use Sustainability 128ndash137httpsdoiorg1013140RG2
60 Copyright 2021 Indonesian Aquaculture Journal p-ISSN 0215-0883 e-ISSN 2502-6577
Pollution index and economic value of vannamei shrimp (Ofan Bosman)
Supriadi I H (2001) Tropical estuary dynamicsOseana XXVI(4) 1-11
Tarunamulia Kamariah amp Mustafa A (2016) Spatialrelationship between environmental quality andthe presence of potentially causative phytoplank-ton species of HABs at extensive brackishwaterponds area in Cirebon Regency West Java JurnalRiset Akuakultur 11(2) 181-195
Tran N Rodriguez UP Chan CY Phillips MJMohan CV Henriksson PJG hellip amp Hall S(2017) Indonesian aquaculture futures An analy-sis of fish supply and demand in Indonesia to 2030and role of aquaculture using the AsiaFish modelMarine Policy 79 (November 2016) 25-32 httpsdoiorg101016jmarpol201702002
Utojo Mustafa A amp Hasnawi (2011) Site assess-ment of coastal areas of Maros Regency SouthSulawesi to develope environmentaly-friendlybrackishwater pond culture system Jurnal RisetAkuakultur 6(2) 325-339
Utojo Mustafa A amp Kamariah (2013) Evaluation ofsustainable biophysical properties of windu shrimpcultivation (Penaeus monodon) in Indramayu Dis-trict West Java Prosiding Forum InovasiTeknologi Akuakultur (1) p 1013-1024
Wahyuningsih S Gitarama AM amp Gitarama AM(2020) Ammonia in Fish Cultivation SystemsSyntax Literate Jurnal Ilmiah Indonesia 5(2) 112httpsdoiorg1036418syntax-literatev5i2929
Zhang JY Ni WM Zhu YM amp Pan YD (2013)Effects of different nitrogen species on sensitiv-ity and photosynthetic stress of three commonfreshwater diatoms Aquatic Ecology 47(1) 25-35httpsdoiorg101007s10452-012-9422-z
Zhang Y Yu J Su Y Du Y amp Liu Z (2019) Long-term changes of water quality in aquaculture-dominated lakes as revealed by sedimentgeochemical records in Lake Taibai (EasternChina) Chemosphere 235 297-307 httpsdoiorg101016jchemosphere201906179

52 Copyright 2021 Indonesian Aquaculture Journal p-ISSN 0215-0883 e-ISSN 2502-6577
Pollution index and economic value of vannamei shrimp (Ofan Bosman)
The Indonesian government launched a revisedtarget of increasing vannamei shrimp exports by 250in 2024 (Kemenko Marves 2020 KKP 2020) Thisrevised target means that the total value of farmedvannamei has to reach IDR 9030 trillion (USD 645million) by 2024 from IDR 3622 trillion (USD 258million) in 2019 In terms of production volume thetotal shrimp production should increase from 517397tons in 2019 to 1290000 tons in 2020 As part ofthe effort the Indonesian Coordinating Ministry ofMaritime and Investment released a program to in-crease vannamei farming areas to 86000 hectares until2024 (Kemenko Marves 2020)
As a result shrimp farming has caused concern-ing socio-economic and environmental impacts(FAIRR 2019 Galappaththi amp Berkes 2015 Mitro etal 2014 Saha 2017) For example the Ministry ofNational Development Planning (BAPPENAS) in 2014reported that many aquaculture business entities inIndonesia have not yet implemented Good Aquacul-ture Practices (Bappenas 2014) The increase in land-based shrimp farming activities will eventually leadto the clearing of mangrove forests increased use offeeds fertilizers and inappropriate application ofchemicals that can negatively impact the environment(Boyd 2003 De Lacerda et al 2006 Tarunamulia etal 2016)
In Bengkalis Kembung River Indonesia a massiveshrimp pond development had degraded the waterquality of the adjacent rivers in from of increasedBOD
5 nitrate (NO
3) and phosphate (PO4-) values
(Harianja et al 2018) In other areas of Indonesiasuch as in Kawaru Beach and Losari Subdistrict theestablishment of vannamei ponds has changed thecoastal landscape (Pinto 2016) and increased the like-lihood of harmful algal blooms (HABs) occurrences(Tarunamulia et al 2016) In Andulang village-SumenepEast Java Indonesia the rapid development of shrimpponds has impacted nearby agricultural land and re-leased ammonia pollutants to the adjacent coastal area(Hidayatillah 2017) Also high protein feed in shrimpculture can release nitrogen pollutants and organicmatter to the surrounding waters (Imamah et al2013)
The contradicting features of shrimp farming (itsimpact on the environment but profitable as a busi-ness) have attracted global attention from variousstakeholders such as academics practitioners andprivate businesses In most cases research relatedto shrimp cultivation have reported massive nega-tive impacts of shrimp farming on the environment(Paacuteez-Osuna 2001) A new approach needs to be de-veloped that strikes a balance between producing a
high yield of shrimp and maintaining the quality andfunction of the environment Therefore this researchaimed to analyze the environmental impacts and linkthem to the business performance of an Indonesianshrimp farming system
MATERIALS AND METHODS
Research Site
The research was carried out for four months fromJuly to October 2020 at vannamei ponds owned bythe Aquaculture Business Center (ABC) in KarawangRegency-West Java Indonesia
Research Data
Water samples were collected at six stationsnamely mixed channel A (1) mixed channel B (2) sea-water receptacle (3) Ciwadas River (4) CimunclakRiver (5) and outlet channel (6) (Fig 1) The watersamples were collected shortly after the pondsrsquo wa-ter was discharged post shrimp harvest In-situ mea-surements of water quality parameters were tempera-ture (YSI 550A-SNI 06-698923-2005) pH (pH meter-SNI 06-698911-2004) dissolved oxygen (YSI 550A-SNI 06-698914-2004) and salinity (refractometer) Ex-situ measurements of water quality parameters wereammonia (NH
3) (Spektrofotometer-SNI 06-698930-
2005) nitrite (NO2) (Spektrofotometer-SNI 06-69899-
2004) nitrate (NO3) (Spektrofotometer-SNI 698979-
2011) phosphate (PO4) (Spektrofotometer-SNI 06-
698930-2005) and alkalinity (titrate) in Laboratoriumof Aquaculture Business Center The farming businessanalysis was taken through direct observation andinterviewing pond managers
Data Analysis
The measure of temperature pH dissolved oxy-gen ammonia (NH
3) nitrite (NO
2) nitrate (NO
3) phos-
phate (PO4) alkalinity and salinity The results were
then analyzed using Pollution Index (PI) method byreferring to the Ministerial Decree of EnvironmentNo 115 of 2003 The RC Ratio analysis was appliedto analyze the business process of the ABC companyAll the data were processed and analyzed usingMicrosoft Office Excel 2007 software The step-by-step data analysis can be explained as follows
a Pollution Index (PI)
An index that can determine the water quality sta-tus is the pollution index (PI) The classification ofwater quality using PI was first introduced byNemerow amp Sumitomo (1970) and incorporated inthe Ministerial Decree No 115 2003 as one of thestandard methods to determine water quality level(Table 1)
Copyright 2021 Indonesian Aquaculture Journal p-ISSN 0215-0883 e-ISSN 2502-6577 53
Indonesian Aquaculture Journal 16 (1) 2021 51-60
This Pollution Index (PI) provides simple numeri-cal categorization to decision-makers to assesswhether the condition of a water body deterioratesdue to the presence of pollutants Pollution Index(PI) covers a variety of independent parameter groupsThe Pollution Index is calculated using the formula asfollows (Nemerow amp Sumitomo 1970)
InformationPI
j= Pollution index for the-j designation
Ci = Concentration of the-i water quality parametermeasured
Lij = Concentration of the-i water quality parameterslisted in the-j designation quality standard(quality standard for marine biota)
(CiLij)M
= Maximum value of CiLij(CiLij)
R= Average value of CiLij
b Analysis of RC RatioRevenue Cost Ratio analysis is a value obtained
from the ratio between total revenue and total pro-duction cost This analysis is used to determine theeconomic profitability obtained from an aquacultureactivity using the RC Ratio 2 equation below
With criteriaRC gt 1 profitable businessRC lt1 business lossRC = 1 effort at breakeven
RESULTS AND DISCUSSION
Pollution Index (PI)
The results of water quality measurements at sixstations are presented in Figure 2
The Aquaculture Business Center (ABC) area inKarawang is bordered to the north by the North Coastof Java the south by Cimunclak Hamlet and the eastby Ciwadas River Surrounded by the two water bod-ies it is highly likely that the shrimp farming activitymight have already impacted the surrounding watersCultivation activities throughout the year release acontinuous discharge of waste particles into the wa-ter (Zhang et al 2019) The pondsrsquo wastewater con-tains pollutants from wasted feed fertilizer chemi-cals and metabolites excretion (Anh et al 2010)Dauda et al (2019) argued that aquaculture waste isusually discharged in dissolved solids and dissolvednutrients such as nitrogen and phosphorus
The water temperature in six sampling stationsshows normal ranges between 281-296degC meaningthat the temperature is still the standard thresholdof Government Regulation No 22 2021 No local ex-ternal factors are affecting the water temperaturesuch as the cases in shrimp ponds in Indramayu Re-
Figure 1 Location of sampling sites
1 2
22
Rij
i
Mij
i
j
LC
LC
PI
(2) production ofcost Total
revenue TotalRC
Information Water sampling point
School of Environment ScienceUniversitas Indonesia
2020
Projection system GCS WGS 1984DATUM WGS 1984UNIT Degree
1235120 015 03 06 09 12
Miles
N
W
S
E
5o S
6o S
7o S
8o S
9o S
106oE 107oE 108oE 109oE 110oE 111oE 112oE 113oE 114oE
107oE 107oE 107oE 107oE
6oS
6oS
6oS
6oS
54 Copyright 2021 Indonesian Aquaculture Journal p-ISSN 0215-0883 e-ISSN 2502-6577
Pollution index and economic value of vannamei shrimp (Ofan Bosman)
Table 1 Determination of water categories according to PollutionIndex (The Ministry of Environment No 115 2003)
Figure 2 Water quality in ABC waters
Value of water quality index Category0 le PIj le 10 Water quality standards10 lt PIj le 50 Lightly polluted50 lt PIj le 10 Moderately pollutedPIj gt 10 Heavily polluted
27275
28285
29295
30
1 2 3 4 5 6
Tem
pera
ture
(degC)
Stations
0
005
01
015
02
1 2 3 4 5 6
Amm
onia
(mg
L)Stations
6
7
8
9
1 2 3 4 5 6
pH
Stations
05
10152025
1 2 3 4 5 6
Nit
rate
(mg
L)
Stations
0
5
10
15
20
1 2 3 4 5 6
Salin
ity (p
pt)
Stations
0
2
4
6
8
10
1 2 3 4 5 6
Nit
rite
(mg
L)
Stations
0
50
100
150
200
250
1 2 3 4 5 6
Alka
linit
y (m
gL)
Stations
0
1
2
3
4
5
1 2 3 4 5 6
Phos
phat
e (m
gL)
Stations
012345
1 2 3 4 5 6
Dis
olve
d ox
ygen
(m
gL)
Stations
Copyright 2021 Indonesian Aquaculture Journal p-ISSN 0215-0883 e-ISSN 2502-6577 55
Indonesian Aquaculture Journal 16 (1) 2021 51-60
gency West Java (Utojo et al 2013) Pati ponds inCentral Java (Asaf et al 2015) and Maros ponds inSouth Sulawesi (Utojo et al 2011) This tempera-ture range is the typical value range in most areas ina tropical country such as Indonesia According toAlberto (2016) extreme temperature changes mightaffect an organismrsquos metabolic rate altering the spa-tial distribution of organisms both in the ocean andthe freshwater ecosystem Furthermore the tempera-ture also significantly affects the growth and life ofaquatic biota (Alberto 2016)
The waterrsquos pH (acidity level) of the ABC samplingstations is normal from 761-801 and still within thethreshold of Government Regulation No 22 2021where normal pH should not be out of the range of
6-9 for aquaculture farming Another regulation theMinisterial Decree of Marine Affairs and FisheriesNo282004 also recommends that the pH should notbe out of range 6-9 for the discharged water pondeffluents in shrimp culture This is the same as thepH of the waters in the Indramayu and Maros ponds(Utojo et al 2011 2013) and the waters in the Patiponds Central Java (Asaf et al 2015) This study find-ing is different from the study results by Yu et al(2020) who showed that pH values of 65 and 95 hadcaused a significant reduction in shrimp growth ThepH is described as the number of hydrogen ions inwater which generally represents the acidity or alka-linity of water (Effendi 2003) Changing in pH mayaffect the productivity of aquatic animals and plants
Table 3 Pollution Index (PI) Calculation Results
Table 2 Collection data of water quality
1 2 3 4 5 6
Temperature (degC) 28-32 29 296 29 296 294 281pH 6-9 794 771 761 795 767 801Salinity (ppt) 10-35 5 14 16 3 6 14Alkalinity (mgL) 80-150 126 151 134 104 151 209Ammonia (NH3) (mgL) lt 05 001 004 004 015 002 009Nitrate (NO3) (mgL) 20 1809 2293 2338 198 2348 2264Nitrite (NO2) (mgL) 006 037 052 056 051 036 936
Phospate (PO4) (mgL) 1 425 22 311 195 227 122Dissolved oxygen (mgL) 3 21 46 37 25 27 31
ParametersQuality
standard
Station
Explanation Government Regulation No 222021 (Attached VI)
1 2 3 4 5 6
(CiLij)M 617 867 933 85 6 156(CiLij)R 168 165 18 169 148 1824
(CiLij)M2 3807 7517 8705 7225 36 24336
(CiLij)R2 283 273 325 285 22 33281
(CiLij)M2 + (CiLij)R
2 409 7789 903 751 382 2466881
2045 3895 4515 3755 191 123344
452 624 672 613 437 11106
Pij (PI Status)Lightly
pollutedModerately
pollutedModerately
pollutedModerately
pollutedLightly
pollutedHeavilypolluted
PI calculation phaseStations
(CiLij)Mଶ + (CiLij)R
2
2
(CiLij)Mଶ + (CiLij)R2
2
56 Copyright 2021 Indonesian Aquaculture Journal p-ISSN 0215-0883 e-ISSN 2502-6577
Pollution index and economic value of vannamei shrimp (Ofan Bosman)
Therefore pH is often used to indicate whether ornot the waters could support the life of the aquaticanimal (Effendi 2003)
In station 1 (mixed channels A) station 4 (CiwadasRiver) and station 5 (Cimunclak River) the salinityvalues were 5 ppt 3 ppt and 6 ppt respectively whichare below the suggested standard These numbersindicate that the salinity at that stations is far belowthe threshold stated in the Government RegulationNo 222021 The freshwater mass from the rivers in-fluences the three stationsrsquo salinity levels Accordingto Supriadi (2001) salinity changes are often causedby rainfall and seawater massesrsquo mixing with fresh-waters forming brackish water with unique physicalcharacteristics
For the alkalinity only station Six has exceededthe threshold where the value was 209 mgL StationSix is the outlet channel of the pond Effendi (2003)defines alkalinity as a buffer capacity to decrease thewatersrsquo pH Another water quality parameter theammonia content is the main parameter in deter-mining water quality concerning nitrogen concentra-tion in waters Ammonia values between 001-015mgL indicate that the water condition is still withinthe quality standard based on the PP 22 of 2021 am-monia threshold 05 mgL while the standard qualityvalue of the Decree of the Minister of KP No 28 of2004 is lt01 mgL This finding is the same as theresearch results of Romadhona et al (2016) who foundthe ammonia value ranges from 002ndash012 mgL intheir study sites However ammonia values lt002mgL can inhibit growth and cause tissue damage insome fish species (Wahyuningsih et al 2020) Putriet al (2019) stated that industrial areas agriculturalland and residential areas are the main contributorsto ammonia High concentrations of ammonia inwaters can reduce dissolved oxygen levels that even-tually affect physiological and metabolic functions suchas respiration (Zhang et al 2013)
Station Two Three Five and Six have exceededthe allowable nitrate concentration The nitrate con-centration was 2293 mgL 2338 mgL 2348 mgLand 2264 mgL respectively Based on the Govern-ment Regulation No 22 of 2021 the nitrate thresh-old is 20 mgL for shrimp farming while the Ministe-rial Decree of Environment 2004 limits the nitratethreshold for marine biota to less than 0008 mgL(Harianja et al 2018 Putri et al 2019) Shrimp cul-ture may increase nitrate amount due to the feedand fertilizersrsquo leftover accumulated at the pondrsquosbottom For instance Harianja et al (2018) reportedthat about 457 tonnes of nitrate had entered theKembung River in Bengkalis each year due to theshrimp cultivations and crops along the river Accord-
ing to Nasir et al (2018) agricultural household andaquaculture activities discharge large quantities ofnutrients (N-P) along the Pangkep River SouthSulawesi One of the factors that influence the pres-ence of nitrate in water is the source of nitrate it-self Nitrate in water bodies can be derived from at-mosphere diffusion fixation organic matter degra-dation and organic waste disposal due to human ac-tivities (Effendi 2003)
The concentration of nitrite has exceeded the al-lowable concentration as guided in the GovernmentRegulation In Station Six the nitrite concentrationwas about 936 mgL Station Six is the outlet chan-nel of ABCrsquos ponds According to PP No 22 2021 andKEP28MEN2004 the nitrite threshold concentrationis between 006 mgL-25 mgL As a comparison Putriet al (2019) reported that the concentration of ni-trite in Banyuasin River Estuary ranged from 0002 to0093 mgL while Nasir et al (2018) reported nitriteconcentration in Pangkep ranged from 0004 to 0006mgL Pantjara et al (2015) reported that nitrate con-tent in seawater and reservoirs was about 0040 plusmn00416 mgL and 0045 plusmn 00439 mgL respectivelyTherefore the concentration of nitrite in the Aquac-ulture Business Center (ABC) area was the highestcompared to other areas This result indicates thatthe Aquaculture Business Center in Karawang has beencontaminated with some organic pollutants Nitrite(NO
2) is an oxidized form of nitrogen with an oxida-
tion number of +3 and can be found in wastewaterriver water and drainage treatment plants Nitrite isa critical parameter in determining water quality be-cause it is toxic when it reacts with hemoglobin inthe blood blocking the blood from binding oxygen(Effendi 2003)
The phosphate concentration at all stations hasexceeded the allowable threshold ranged between122-425 mgL Based on the Government RegulationPP No 22 of 2021 phosphatersquos natural occurrencesshould not exceed 1 mgL and regulation of KEP28MEN2004 limits the phosphate to not exceed 01mgL The application of fertilizer during shrimp cul-tivation is the primary source of phosphate in theponds The leftover feed and fertilizer then releasedinto the environment increasing the phosphate andother organic matters to the river (Rawson et al2007) High organic matter may double the watersrsquoprimary productivity and eventually decrease dissolvedoxygen (Ahmed et al 2010) The phytoplankton andbacteria in the bottom of the pond may reduce thephosphate concentration since they can absorb phos-phate and use it in their metabolic process The ab-sorption of phosphate can also occur in the pondrsquosbottom sludge if there is Ca
2+ or Fe
3+ that may help
absorb the phosphate The content of orthophosphate
Copyright 2021 Indonesian Aquaculture Journal p-ISSN 0215-0883 e-ISSN 2502-6577 57
Indonesian Aquaculture Journal 16 (1) 2021 51-60
in water is often used to indicate the level of pri-mary productivity of waters Phosphate in inorganicform is assimilated by phytoplankton and circulatesin estuary waters (Supriadi 2001)
Dissolved oxygen (DO) contents in stations OneFour and Five are the lowest DO level compared tothe other stations The DO concentration was 21mgL 25 mgL and 27 mgL respectively Based onthe Government Regulation No 22 of 2021 andKEP28MEN2004 the limit of DO in aquatic farmingshould not exceed 3 mgL Interestingly based on theresults the low DO contents occurred when the sa-linity concentration was low This situation contra-dicts the study results conducted by Maicaacute et al(2014) who found that the higher the salinity thelower the dissolved oxygen It is argued here thatthe water at the three stations which are located inrivers and mixed water tanks is consistently influ-enced by the low salinity freshwater from the riverThe water also has substantial organic matter con-centration where oxygen is used to break down theorganic material reducing dissolved oxygen Low dis-solved oxygen in water may affect biological func-tions inhibit growth or even causing death to someaquatic organisms (Rahman et al 2020) The con-centration of oxygen in a water body will decreasedue to the organic elementrsquos decomposition (Rawsonet al 2007)
The Pollution Index (PI) method has been used todetermine the water quality status of the ABCrsquosshrimp farming based on the data provided in Table2 The results of the PI calculation are presented inTable 3 These PI values refer to the Minister of Envi-ronment Decree No 115 of 2003 which classify thatthe water quality of ABC shrimp farming is catego-
rized as light to heavily polluted with the score of PIjgt 10 This water pollution is caused by shrimp pondactivities that contribute to the high nitrogen andphosphate concentrations disposed of directly with-out going through a treatment process (Kawasaki etal 2016) The water pollution level in the study sitecould be attributed to the lack of sufficient wastewa-ter treatment plants provided by the company
Nowadays water could become ldquoan expensive andscarce itemrdquo since anthropogenic pollutants such asdomestic wastewater agricultural waste and shrimpfarming waste have contaminated and worsened thewater quality On the other hand the shrimp eco-nomic activity also plays an essential role in the localrsquoseconomy Harianja et al (2018) argued that theeconomy should not be put on top of the ecologyrsquosconcern For instance fish farming uses a large amountof marine and freshwater Since the water resourcesare open access where anyone can utilize them aprecautionary approach regarding the resourcesrsquo useshould always prioritize the minimal impacts to theresources
Business AnalysisThe business analysis of the vannamei farming was
calculated based on one pond per cycle with totalrevenue IDR 102880719 total cost IDR 93869539and benefit IDR 9011180 Therefore the RC ratiois 110 where RC gt1 meaning that the shrimp farm-ing business is profitable or economically viable (Table4) The highest cost component in the production ofvaname is the cost of feed with an average price ofIDR 13000kg It contributes 461 of the total costfollowed by the electricity (205) the cost of fry(17) pond production facilities (135) and labor(29)
Table 4Business analysis of shrimp farming
Components YieldLand area (ha) 045Density (shrimpm2) 68Amount of stocking (shrimp) 307056Amount of feed (kg) 3054Days of culture (DOC) (day) 70Survival rate () 3936Survive (shrimp) 120857Main body weight (g) 1318Shrimp size (shrimpkg) 76Production biomass (kg) 1593FCR 192Shrimp selling price (IDRkg) 64583Revenue (IDR) 102880719Cost (IDR) 93869539Benefit (IDR) 9011180
58 Copyright 2021 Indonesian Aquaculture Journal p-ISSN 0215-0883 e-ISSN 2502-6577
Pollution index and economic value of vannamei shrimp (Ofan Bosman)
CONCLUSION
Some organic pollutants have contaminated shrimpfarming in the Aquaculture Business Center (ABC) areaof Karawang Regency The current pollution statuswater is classified from lightly to heavily pollutedBased on the RC analysis it can be concluded thatshrimp farming is economically viable and profitableHowever this study suggests that the future profit-ability of the farm could be negatively affected if thelevel of water pollution in the area is not adequatelyaddressed Improving the capacity of wastewatertreatment plants efficient feeding management andfollowing the general rules of Good Aquaculture Prac-tices could extend the sustainability of the farmingsystem
ACKNOWLEDGEMENTS
The authors would like to thank Universitas In-donesia for funding this research through PUTI Grantwith contract number NKB-2573UN2RSTHKP05002020 We also thank Aquaculture Business CenterKarawang Regency for providing access and researchsupport during the fieldwork
REFERENCES
Ahmed R Shahabuddin AM Habib MAB ampYasmin M (2010) Impact of Aquaculture Prac-tices in Naogaon District of Bangladesh ResearchJournal of Fisheries and Hydrobiology 5(2) 56-65
Alberto A (2016) Analysis of the physical and chemicalconditions of the vaname shrimp pond effluent(Litopenaeus vannamei) in Aquaculture BusinessCenter Karawang Jawa Barat Universitas Indone-sia
Anh PT Kroeze C Bush SR amp Mol APJ (2010)Water pollution by intensive brackish shrimp farm-ing in south-east Vietnam Causes and optionsfor control Agricultural Water Management 97(6)872-882 httpsdoiorg101016jagwat201001018
Asaf R Ratnawati E amp Mustafa A (2015) Analysisof the influence of environmental factors tambakcultivation on tambak productivity in Tayu PatiDistrict Central Java Province 2 789-800
Bappenas (2014) Study of Sustainable Fisheries Man-agement Strategies Kementerian PPNBapenasDirektorat Kelautan Dan Perikanan 120 pp
Boyd C E (2003) Guidelines for aquaculture efflu-ent management at the farm-level Aquaculture226(1-4) 101-112 httpsdoiorg101016S0044-8486(03)00471-X
BPS (2019) Cultivation fishery production by prov-ince and type of cultivation Retrieved from httpswwwbpsgoiddynamictable201905141622produksi-perikanan-budidaya-menurut-provinsi-dan-jenis-budidaya-2017html
Dauda AB Ajadi A Tola-Fabunmi AS amp AkinwoleAO (2019) Waste production in aquacultureSources components and managements in dif-ferent culture systems Aquaculture and Fisher-ies 4 (3) 81ndash88 httpsdoiorg101016jaaf201810002
De Lacerda LD Vaisman AG Maia LP Ramos ESilva CA amp Soares Cunha EM (2006) Relativeimportance of nitrogen and phosphorus emissionsfrom shrimp farming and other anthropogenicsources for six estuaries along the NE Braziliancoast Aquaculture 253(1ndash4) 433ndash446 httpsdoiorg101016jaquaculture200509005
Effendi H (2003) Study of Water Quality for Man-agement of Water Resources and EnvironmentYogyakarta Kanisius
FAIRR (2019) Shallow returns ESG risks and op-portunities in aquaculture 15 Retrieved fromwwwfairrorg
FAO (2018) The State of World Fisheries and Aquac-ulture 2018 - Meeting the sustainable develop-ment goals In FAO Retrieved from httpwwwfaoorgstate-of-fisheries-aquaculture
Galappaththi EK amp Berkes F (2015) Drama of thecommons in small-scale shrimp aquaculture innorthwestern Sri Lanka International Journal ofthe Commons 9(1) 347-368 httpsdoiorg1018352ijc500
Government Regulation RI No 22 (2021) Govern-ment Regulation Number 22 of 2021 concerningGuidelines for Environmental Protection and Man-agement State Secretariat of the Republic of In-donesia Vol 1 p 483 Retrieved from httpwwwjdihsetjenkemendagrigoid
Hadie W amp Hadie LE (2017) Analysis of the Aquac-ulture System to Support a Policy of SustainableShrimp Production Jurnal Kebijakan Perikanan In-donesia 9(1) 51-60
Harianja R S M Anita S amp Mubarak M (2018)Analysis of pollution load in shrimp ponds aroundthe Kembung River Bantan Bengkalis DistrictDinamika Lingkungan Indonesia 5(1) 12 httpsdoiorg1031258dli51p12-19
Hidayatillah Y (2017) The social impact of shrimppond industry on the environment in AndulangVillage Sumenep Regency Jurnal Teori Dan PraksisPembelajaran IPS 21-26
Copyright 2021 Indonesian Aquaculture Journal p-ISSN 0215-0883 e-ISSN 2502-6577 59
Indonesian Aquaculture Journal 16 (1) 2021 51-60
Imamah IL Hartoyo S Syaukat Y amp Utami KS(2013) The total productivity factor of the pondbusiness is related to pond pollutants in KarawangRegency Agribusiness Journal 7(1) 35-58 httpsdoiorg1015408ajv7i15169
Jayanthi M Thirumurthy S Muralidhar M ampRavichandran P (2018) Impact of shrimp aquac-ulture development on important ecosystems inIndia Global Environmental Change 52(March) 10-21 httpsdoiorg101016jgloenvcha201805005
Kemenko Marves (2020) Coordinating MinisterLuhut Asks for Speeding Up Vaname Shrimp Ex-port Program Retrieved from KementerianKoordinator Bidang Kemaritiman dan Investasiwebsite httpsmaritimgoidmenko-luhut-minta-program-peningkatan-ekspor-udang-vaname
KKP (2018) Shrimp farming is still very potentialRetrieved from httpskkpgoiddjpbartikel8688-kkp-budidaya-udang-masih-sangat-potensial
KKP (2020) KKP Prepares Strategies for Facing Aquac-ulture Challenges in 2020 Retrieved fromKementerian Kelautan dan Perikanan websitehttpskkpgoiddjpbartikel17871-kkp-siapkan-strategi-hadapi-tantangan-akuakultur-di-tahun-2020
Maicaacute PF de Borba MR Martins TG ampWasielesky W (2014) Effect of salinity on per-formance and body composition of Pacific whiteshrimp juveniles reared in a super-intensive sys-tem Revista Brasileira de Zootecnia 43(7) 343ndash350h t t p s d o i o r g 1 0 1 5 9 0 S 1 5 1 6 -35982014000700001
Minister of Environment Number 115 (2003) Decreeof the Minister of Environment Number 115 con-cerning Guidelines for Determining Water Qual-ity Status Jakarta State Minister for the Environ-ment p 1-15
Minister of Marine Affairs and Fisheries No 28 (2004)Decree of the Minister of Marine Affairs and Fish-eries of the Republic of Indonesia Number KEP28MEN2004 concerning General Guidelines for Cul-tivating Shrimp in Ponds 26 pp
Mitro S Khatun R amp Baten M (2014) Socio-Eco-nomic and Environmental Impacts of Shrimp Cul-ture in Some Selected Areas of Bagerhat DistrictJournal of Environmental Science and Natural Re-sources 7(1) 265-269 httpsdoiorg103329jesnrv7i122181
Nasir A Baiduri M A amp Hasniar (2018) NutrientN-P in Coastal Waters of Pangkep South SulawesiJurnal Ilmu dan Teknologi Kelautan Tropis 53(9)1689-1699
Nemerow NL amp Sumitomo H (1970) Benefits of WaterQuality Enhancement Report No 16110 DAJ pre-pared for the US Environmental Protection Agency De-cember 1970 Syracuse University Syracuse NY
Paacuteez-Osuna F (2001) The environmental impact ofshrimp aquaculture A global perspective Environ-mental Pollution 112(2) 229-231 httpsdoiorg101016S0269-7491(00)00111-1
Pantjara B Syafaat M N amp Kristanto A H (2015)Effect of dynamical water quality on shrimp cul-ture in the Integrated Multitropic Aquaculture(IMTA) Indonesian Aquaculture Journal 10(1) 81httpsdoiorg1015578iaj101201581-90
Partelow S Senff P Buhari N amp Schluumlter A (2018)Operationalizing the social-ecological systemsframework in pond aquaculture International Jour-nal of the Commons 12(1) 485-518 httpsdoiorg1018352ijc834
Pinto Z (2016) Study of Coastal Community Behav-ior that Causes Environmental Damage (Case Studyat Kuwaru Beach Poncosari Village Srunjuk Dis-trict Bantul Regency DIY Province) Jurnal WilayahDan Lingkungan 3(3) 163 httpsdoiorg1014710jwl33163-174
Putri W A E Purwiyanto A I S Fauziyah Agustriani F amp Suteja Y (2019) Conditions ofNitrate Nitrite Ammonia Phosphate and Bodiesin the mouth of the Banyuasin River SouthSumatra Jurnal Ilmu Dan Teknologi Kelautan Tropis11 (1) 65-74 httpsdoiorg1029244jitktv11i118861
Rahman A Dabrowski J amp McCulloch J (2020)Dissolved oxygen prediction in prawn ponds froma group of one step predictors Information Pro-cessing in Agriculture 7(2) 307-317 httpsdoiorg101016jinpa201908002
Rawson M Chen C Wang D Yarish C SullivanJ Wang L amp Zhu M (2007) Ecosystem-basedmanagement and models in sustainable manage-ment of coastal aquaculture Bull Fish Res Agent19 97ndash111
Romadhona B Yulianto B amp Sudarno S (2016)Fluctuation of ammonia content and environmen-tal pollution load of intensive vaname shrimp pondswith partial harvest and total harvest techniquesSAINTEK PERIKANAN Indonesian Journal of FisheriesScience and Technology 11(2) 84 httpsdoiorg1014710ijfst11284-93
Saha S K (2017) Socio-economic and environmen-tal impacts of shrimp farming in the south-west-ern coastal region of Bangladesh International Jour-nal of Research on Land-Use Sustainability 128ndash137httpsdoiorg1013140RG2
60 Copyright 2021 Indonesian Aquaculture Journal p-ISSN 0215-0883 e-ISSN 2502-6577
Pollution index and economic value of vannamei shrimp (Ofan Bosman)
Supriadi I H (2001) Tropical estuary dynamicsOseana XXVI(4) 1-11
Tarunamulia Kamariah amp Mustafa A (2016) Spatialrelationship between environmental quality andthe presence of potentially causative phytoplank-ton species of HABs at extensive brackishwaterponds area in Cirebon Regency West Java JurnalRiset Akuakultur 11(2) 181-195
Tran N Rodriguez UP Chan CY Phillips MJMohan CV Henriksson PJG hellip amp Hall S(2017) Indonesian aquaculture futures An analy-sis of fish supply and demand in Indonesia to 2030and role of aquaculture using the AsiaFish modelMarine Policy 79 (November 2016) 25-32 httpsdoiorg101016jmarpol201702002
Utojo Mustafa A amp Hasnawi (2011) Site assess-ment of coastal areas of Maros Regency SouthSulawesi to develope environmentaly-friendlybrackishwater pond culture system Jurnal RisetAkuakultur 6(2) 325-339
Utojo Mustafa A amp Kamariah (2013) Evaluation ofsustainable biophysical properties of windu shrimpcultivation (Penaeus monodon) in Indramayu Dis-trict West Java Prosiding Forum InovasiTeknologi Akuakultur (1) p 1013-1024
Wahyuningsih S Gitarama AM amp Gitarama AM(2020) Ammonia in Fish Cultivation SystemsSyntax Literate Jurnal Ilmiah Indonesia 5(2) 112httpsdoiorg1036418syntax-literatev5i2929
Zhang JY Ni WM Zhu YM amp Pan YD (2013)Effects of different nitrogen species on sensitiv-ity and photosynthetic stress of three commonfreshwater diatoms Aquatic Ecology 47(1) 25-35httpsdoiorg101007s10452-012-9422-z
Zhang Y Yu J Su Y Du Y amp Liu Z (2019) Long-term changes of water quality in aquaculture-dominated lakes as revealed by sedimentgeochemical records in Lake Taibai (EasternChina) Chemosphere 235 297-307 httpsdoiorg101016jchemosphere201906179
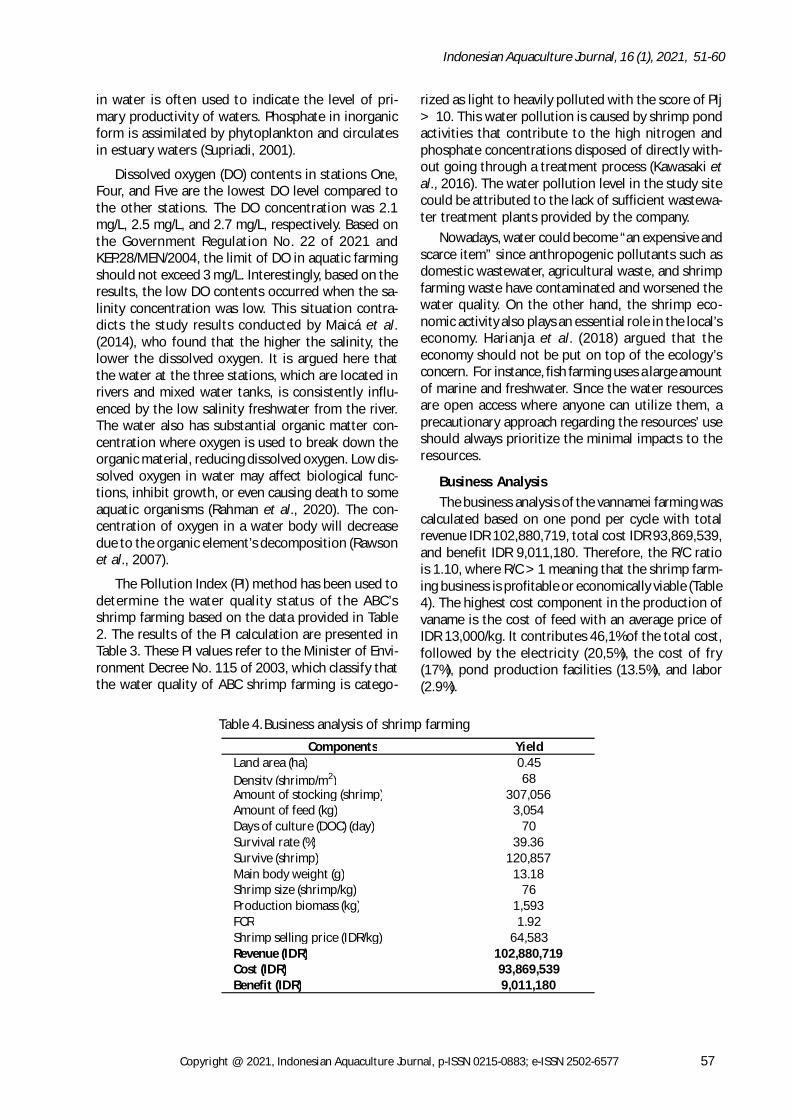


![Pollution Index for Industrial Custers[1]](https://img.dokumen.tips/doc/110x75/577d39461a28ab3a6b997200/pollution-index-for-industrial-custers1.jpg)


