Embed Size (px)
Citation preview
___ __ __w rW POLICY RESEARCH WORKING PAPER 2341
The Tyranny of Concepts Using the word capital torepresent two different
concepts is not such a
CUDIE (Cumulated, Depreciated problem when government is
Investment Effort) Is Not Capital responsible for only a small
fraction of national
Lant Pritcbett investment and is reasonably
effective fas in the United
States). But when
government is a major
investor and is ineffective, the
gap between capital and
"cumulative, depreciated
investment effort" (CUDIE)
may be enormous. A public
sector steel mill may absorb
billions as an 'investment,"
but if it cannot produce steel
it has zero value as capital.
The World Bank
Development Research Group
Poverty and Human Resources UMay 2000
Pub
lic D
iscl
osur
e A
utho
rized
Pub
lic D
iscl
osur
e A
utho
rized
Pub
lic D
iscl
osur
e A
utho
rized
Pub
lic D
iscl
osur
e A
utho
rized
Pub
lic D
iscl
osur
e A
utho
rized
Pub
lic D
iscl
osur
e A
utho
rized
Pub
lic D
iscl
osur
e A
utho
rized
Pub
lic D
iscl
osur
e A
utho
rized

| POLICY RESEARCH WORKING PAPER 2341
Summary findings
The cost of public investment is not the value of public in three broad areas is misguided.capital. Unlike for private investors, there is no remotely First, none of the estimates of the impact of publicplausible behavioral model of the government as investor spending identify the productivity of public capital. Eventhat suggests that every dollar the public sector spends as where public capital could be very productive,"investment" creates capital in an economic sense. regressions and evaluations may suggest that public
This seemingly obvious point has so far been uniformly investment spending has little impact.ignored in the voluminous empirical literature on Second, everything currently said about "total factoreconomic growth, which uses, at best, "cumulated, productivity" in developing countries is deeply suspect,depreciated investment effort" (CUDIE) to estimate as there is no way empirically to distinguish between lowcapital stocks. output (or growth) attributable to investments that
But in developing countries especially, the difference created no "factors" and low output (or growth)between investment cumulated at cost and capital value attributable to low (or slow growth in) productivity inis of primary empirical importance: government using accumulated "factors."investment is half or more of total investment. And Third, multivariate growth regressions to date haveperhaps as much as half or more of government not, in fact, "controlled" for the growth of capital stock,investment spending has not created equivalent "capital." so spurious interpretations have emerged.
This suggests that nearly everything empirical written
This paper - a product of Poverty and Human Resources, Development Research Group - is part of a larger effort in thegroup to understand the importance of public sector actions for economic growth. Copies of the paper are available freefrom the World Bank, 1818 H Street NW, Washington, DC 20433. Please contact Retno Widuri, email [email protected]. Policy Research Working Papers are also posted on the Web at www.worldbank.org/research/workingpapers. The author may be contacted at [email protected]. May 2000. (40 pages)
The Policy Research Working Paper Series disseminates the findings of work in progress to encourage the exchange of ideas aboutdevelopment issues. An objective of the series is to get the findings out quickly, even if the presentations are less than foilly polished. Thepapers carry the names of the authors and should be cited accordinggly. The findings, interpretations, and conclusions expressed in thispaper are entirely those of the authors. They do not necessanily represent the view of the World Bank, its Executive Directors, or thecountries they represent.
Produced by the Policy Research Dissemination Center

The Tyranny of Concepts:CUDIE (Cumulated, Depreciated, Investment
Effort) is Not Capital
Lant Pritchett'World Bank
JEL codes: 040, 047, H50.
Keywords: Capital, Growth, Productivity, Public Sector.
' Lant Pritchet World Bank, 1818 H St, NW, Washington DC, 20433, tel. 202-473-3777, fax 202-5221153, email [email protected]


1
The Tyranny of Concepts:CUDIE (Cumulated, Depreciated, Investment Effort)
is not Capital 2
Since I am about to argue that most of what you think you know about an important topic
is wrong, let me begin with an old joke, a personal story, and a striking example. The joke:
while on a foreign trip a government official of country A was visiting the penthouse apartment
of his friend B, a bureaucrat of a poor country. After A admired the fine residence and
furnishings he says: "Be honest B, I know that with your official salary you cannot possibly
afford this, what gives?" Taking his friend to the window B replies "See that superhighway
running through town? 10 percent." Some time later B had the occasion to visit the even poorer
country of his friend A and found himself in an even larger and more luxuriously appointed
penthouse apartment. Says B, "I know your official salary must be even lower than mine, yet
your house is much nicer, what gives?" Taking his friend to the window A pointed out and said
"See that superhighway running out into the jungle?" After straining his eyes for a minute B
replies "But there is no highway out there." "Exactly," says A with a wink, "100 percent."
While in Tanzania in the early 1990s I traveled to an industrial area which was home to
many public enterprises. Most were rotting hulks with little or no workable machinery and with
2 I would like to thank Bill Easterly, Deon Filmer, Jonah Gelbach, Aart Kray, Ross Levine, NormanLoayza, Allison Morantz, Vikram Nerhu, Moshe Syrquin, Vinaya Swaroop, Mike Walton and the participants atseminars at the World Bank and the Council of Economic Advisors for useful comments and discussions. DennisTao' help was very helpful at a critical stage of this project. This paper is different, but draws heavily on, an earlierpaper of mine, "Mind your p's and q's: The cost of public investment is not the value of public capital." As for thetitle, I would like to remind Alwyn Young of the sincerest form of flattery.

2
the few workers who still bothered to show up standing around listlessly3. Later, back in the
capital, while discussing the topic of privatization with a high level government official I was
told the primary problem was that because these factories had been very costly to construct
(financed with large (mostly official) loans) they were very valuable and there were no good
prospective buyers as they were too expensive for domestic entrepreneurs to afford and that the
government did not want to sell their valuable national assets to foreigners. Clearly in his mind
the value of the firms was determined by their historical cost. I tried to convince him that he had
exactly the opposite problem. Anybody could afford those firms, I could afford those firms. As
ongoing enterprises, with assets and liabilities, the debts incurred to cover construction costs far
exceeded the current value of the capital equipment. The real problem was that government
couldn't afford to pay people to take them away.
The striking example of two steel mills illustrates this same problem with the valuation of
public sector investment. Both mills were built by parastatals with government backing with
investments of several billion dollars. One mill, Pohang Iron and Steel in Korea, is now a model
of efficiency and a serious competitor in world steel markets. The other, Ajaokuta Steel in
Nigeria, has spent upwards of 4 billion dollars and has never been finished to its planned
capacity, much less produced to that capacity. In December of 1998, after the end of the
previous military government, there emerged reports that US$ 2 billion had been siphoned off
from the project into the coffers of leaders in the past government.
3 We did not visit the worst of the white elephants, the Morogoro shoe factory, as the expatriate managerwas reported to be in therapy, depressed from so many visitors trooping through to observe the disaster.

3
Nearly every estimate of the "capital stock" ever used empirically and certainly all those
used in cross national comparisons, including-growth regressions, growth decompositions and
TFP calculations based on a simple formula:
1) K. = Kt-t -*Kt-i+It
This formula, together with an estimate of the "capital stock" in some period allows the
construction of a time series of "perpetual inventory capital stocks."
Since national accounting values government investment at cost, if the cost is the same
then measured investment is the same whether or not the investment spending was efficient, or
even productive. However, the combination of valuation at cost with cumulating investment
creates confusion by using one word: "capital", for two completely different concepts. The idea
of capital, an accumulated input, not fully exhausted in a single production period, valued for its
current and future contribution to output, is a workable and useful concept. The idea of CUDIE,
cumulating investment spending over period to an existing total while subtracting off a certain
amount as "depreciation", is also a workable and useful concept. However, equating the two
concepts, or even using one as an empirical proxy for another, requires assertions that are
obviously and importantly false. The potential contribution to current and future production of a
capital stock is obviously not the same as what happened to have been spent on it, especially
when governments are the investors. There is no plausible positive model of the government as
investor that would support associating measured public sector CUDIE with the economic
concept of public sector capital.
There are three reasons why this obvious theoretical point might be ignored: the effect is
small, the effect is uniforrn across countries, or there is no alternative. However, the difference

4
between CUDIE and capital is often empirically large. Moreover, the gap between CUDIE and
capital varies widely across countries. Ignoring this gap where government is a small fraction of
investment and reasonably effective (e.g. USA) might be acceptable, but when government is the
major investor and is ineffective (e.g. Africa, Middle East, Southeast Asian countries) the
CUDIE vs. capital gap overwhelms nearly all other aspects of measurement. This lack of
theoretical or empirical grounds for equating CUDIE with capital invalidates nearly everything
said (a) based on cross national data about the productivity of "public capital", (b) about the
decomposition of levels and growth of GDP into "capitar' and "productivity", and especially
anything about the level or growth of "TFP", and the literature, accumulation versus productivity
investigating channels of the impact of growth determinants using decompositions into the
proximate causes and the "channels" of growth.
1) Capital and models of investor behavior
Two issues in the measurement of capital affect both public and private capital and I want
to get them acknowledged and out of the way quickly before focusing on the distinctive problem
with public investment.
First, economics has long -made the distinction between the "cost" of a capital good,
which is based only on the past, and the "value" of a capital good, which depends only on the
future. As early as 1941 Hayek's The Pure Theory of Capital should have finally put to rest the
idea, "harmful ... to the theory of capital" that "that particular capital items represented a
definite value, independently of the use that could be made of them, a value which was
apparently thought to be determined by the amounts 'invested' in them." (p. 10). The value of

5
capital and cost of investment will diverge ex post for at least three reasons: relative price shifts,
technological changes, and mistakes.
Since the value of a capital good depends on expected future prices, not fully anticipated
changes in relative prices will change the value of capital goods. These changes in relative
prices can stem either from terms of trade changes4 or from policy reforms. (e.g. a decline in
value of capital equipment devoted to import substitution following tariff reductions).
Technological innovations create a process of "creative destruction" which reduces the value of
existing capital stocks that embody old techniques due to innovation (Jaffee, 1986). Finally,
even though private investors equate costs and expected value when investing the private sector
often makes (large) mistakes. The private sector will have its share of ex post "white elephants"
either through underestimating costs or overestimating potential profits.
The second problem that affects both private and public sector capital, especially in cross
national, comparisons is that differences in the relative prices of investment goods will alter the
relationship between investment spending and actual value of capital created (DeLong and
Summers, 1993). Some countries have imposed large tariffs on imported capital goods and
hence raised the relative price of investment goods. But this additional investment spending
over and above international prices does not create any additional productive capital. However,
since the Penn World Tables investment series are based on comparable prices of investment
4 In fact, this may explain the relatively slower growth of the natural resource dependent economies,conditional on their rates of investment (Sachs and Warner, 1995). What looks like slow "TFP" growth using capitalstocks based on investment flows may really be that massive investments made by governments in resourceextraction industries turned out to have very low returns. One possible way of getting at this phenomena would be toexamine the evolution of the stock market valuation of the equity of resource based firms as commodity prices shift.Perhaps this could lead to some useful way to estimate the revaluation of capital impact of terms of trade shifts on
Zambia's copper mines or Bolivia's tin mines or Cote d'Ivoire's cocoa plants.

6
goods across countries then CUDIE based on those series (such as King and Levine, 1993 and
Levine, 1999) should at least address, if not solve that issue.
A) The Efficacy of Investment
Having acknowledged the importance of the ex ante-ex post distinction and the
importance of price differences in the cost of investment versus value of capital in both the
private and public sectors, I want to focus on a different distinction, between accounting cost of
capital of capital good C (X) which is just what happened to be actually spent (suitably deflated
and discounted if costs are spread over several periods) and the economic cost, EC(X,p). The
economic cost is a technological concept: the minimum achievable cost of creating a capital good
with given technologies at relative prices p. Let me define as the efficacy of investment the ratio
of economic cost to accounting cost.
2) EC(X)/C(X) = y
This ratio will vary between 1 (when the minimum cost is achieved) and will approach zero as
accounting cost approaches infinity. If a capital good can be replicated (that is it does not
involve any special element of rent) the value of a capital good is at most its economic cost.
Under some additional conditions and assumning a particular form of depreciation5 , this means
that the basic accumulation of the capital can be written as in equation 3:
3) Kt=Kt,-l-*Kt-i+y*I.
5 One factor I am ignoring, so as to not complicate the story line, is that government "depreciation" ofassets may be much more rapid than in the private sector. Similar to the cost argument, there are widespread ofexamples of government not making optimal (or even reasonable) investments in maintenance and hence leading tomuch more rapid depreciation of assets. See Easterly (1999) for one explanation of the phenomena. This pointwould only strengthen all the arguments in the paper about the inadequacy of CUDIE as a proxy for capital.

7
Only a fraction y of the actual accounting cost of investment passes into the value of capital and
equation 1 is a very special, and empirically implausible, case.
The efficacy of investment y(.) which links cost and value is not a fixed parameter, but is
the endogenous outcome of a behavioral theory of investors. One cannot assume that investment
equals the investment to capital without a behavioral model in which investors see to minimize
cost. Under some conditions it is plausible to assume an individual profit maximizing investor
will be a cost minimizing investor so that for there is a tendency for y to approach 1. However
even in the private sector there are agency problems. When the creation of the capital good
involves specialized knowledge and capital goods are not homogenous then investors may pay
much more than the economic cost (think of your last major home improvement). Moreover, in
the corporate sector, where management and ownership are separate, managers may not have a
full incentive to cost minimize and agency problems within corporations have received a great
deal of attention in the literature (Milgrom and Roberts, 1996). But these agency problems in
cost minimizing are likely to be especially severe when governments acting as investors.
B) A positive model of government investment efficacy
A behavioral theory of the government as an investor is needed to determine the efficacy
of investment which, in turn, is necessary to calculate the capital stock. The model implicitly
embedded in all the existing empirical growth literature using CUDIE as a proxy for

8
capital6 posits that =- 1, V i and t: all governments are always cost minimizing. A model with
this prediction could either be derived trivially (that is, just assume it) or by specifying an
objective function, powers, and constraints of the government (e.g. omniscient, omnipotent,
benevolent welfare maximizer) that would produce this prediction as an outcome. Either way
such a model would be obviously false7. Not just in investment, but in a wide variety of
activities (from health to education to tax collection to policy formation) governments have been
shown to be less than fully effective, and more so in some countries than others.
I am not proposing a single alternative model. There is no universally accepted general
model of how governments behave, either as investors or otherwise, and for good reason.
"Government" behavior is a complex problem of many agents (the citizens or voters) attempting
to constrain the actions of one (or relatively few) principals (the leaders) who typically interact
amongst themselves in complex ways (e.g. executives vs. legislatures) and these leaders often in
turn have only loose control over another set of agents (the government's employees). Each of
these problems is only imperfectly understood and is, except in the most simple versions,
theoretically intractable. Therefore, I will not attempt to construct a plausible model of
government investment, but rather only indicate the features of a class of plausible models might
have, and their implications for measuring capital stocks.
6 1 don't even address the common procedure of using I or I/Y as a proxy for capital stock growth. Notonly does this share all of the problems described here with CUDIE, but, as it turns out, I/Y is not even a good proxyfor CUDIE growth. As I have shown elsewhere the rate of growth of CUDIE is uncorrelated with I/Y in CUDIEconstructed from either World Bank (Dhareshwar and Nehru 1993) or Penn World Tables (King and Levine 1994)data. This has the obvious implication that, while l/Y is typically a significant growth regressor and CUDIE growthis typically a significant growth regressor, it is also the case that including both in a growth regression producesalmost exactly the same coefficient on both as when they are each included simply. I regard this as something of apuzzle, but certainly the lack of correlation undermines the notion of L'y as a proxy for CUDIE growth.
7 As a methodological point, this is not because the assumptions of such a model might be false, butbecause the predictions are false.

9
A simple class of agency models of the government as an investor would have several
elements8 . Models would have an actor called G (government) and another set of actors called C
(citizens) with G and C endowed with distinct objective functions and beliefs. The objective
function of G increases with the gap between actual and economic costs. This could arise in
many forms: venality, in which G receives direct money payments for personal benefit from the
granting investment project contracts (or other government purchases) (Shliefer, 1993, Shliefer
and Vishny, 1998); patronage, in which G raises costs to provide extra payments to others
(either political supporters or employees); shirking, in which G does not expend effort (which
entails disutility) to reduce costs.
Since the objective function of the agents C is likely to be decreasing in the gap between
actual and economic cost, the model would have to have mechanisms whereby C might be able
to impose constraints on the behavior of G. Conceptually, these "accountability" mechanisms
can be decomposed into the probability of detection, the expected punishment conditional on
detection (which is itself a combination of probability of punishment on detection and the
magnitude of punishment when detected). The constraints on government behavior are key
element, but the most difficult to model convincingly as they vary across countries' institutional
and political environments, most obviously between democracies and non-democracies but also
in ways that reflects the degrees and types of oversight.
In these agency models G picks the level of actual costs for capital good to maximize its
objective function, given its beliefs about the constraints it faces from C. This would lead to a
8 This version is particularly simply as the complicated agency problem within government is embeddedinto the actor "G."

10
model of actual costs and a prediction that actual costs would exceed economic costs by the
optimally chosen degree (e.g. of venality, patronage, and shirking). For instance, V*(.) is the
function that maps from G's objective function and constraints (represented by factors "Z") into
the optimally chosen additional costs due to venality, patronage and shirking:
4)C * (x) - EC(p) = V * (x,Z) + P * (x,Z) + S * (x,Z)
In a theoretical framework like this, excess costs, y, would be a function of underlying
determinants of both government objectives (e.g. discount rates) and of the control of citizens C
over the government agent (e.g. freedom of the press, voter choice, information availability and
budget disclosure, judiciary independence and competence, etc9). So:
Y. = y*(Zi,t)
This is not to argue that govermnent will everywhere and always be inefficient and the
private sector always efficient. However, in the context of agency theory there are several
considerations that suggest it will be qualitatively more difficult for citizens to monitor and
control the investment cost behavior of their governments than for shareholders to discipline
managers.
9 Broadly speaking one could call the control of citizens the "degree of government accountability." This isa common feature of focus on public sector incentives links many current strands of development literature,including: talk of "governance" and "accountability," the treatment of infrastructure in the 1994 WorldDevelopment Report (which focused on the internal organization of infrastructure providers), the talk of "reinventinggovernment" in the USA (Osborne and Gaebler, 1992), discussions of participation as a means of improving publicperformance (Isham, Narayan, and Pritchett, 1995), estimates of the relationship between returns on investment andcivil liberties (Isham, Kaufmann, and Pritchett, 1996) and the work on the features of the public sector in East Asia(Campos and Root, 1996).

11
First, the state, by (roughly) Webber's definition, exercises the exclusive monopoly on
institutionalized coercive power (e.g., police, judiciary and military) within its territory. The
state has the ability to extract investible funds irrespective of the citizen's views of the
profitability of the capital to be created. This monopoly of violence also implies that the
government can often put direct restrictions on the individual citizen's ability to monitor the
government, through restricting information, curtailing individuals' ability to complain publicly,
etc.'°
Second, because two entities claiming exclusive coercive power over the same territory
usually is a called "war", the state is intrinsically a monopoly. This monopoly makes
comparisons of performance on cost or quality difficult without multiple providers of roads,
electricity, defense, judiciary." The intrinsic monopoly of government also implies that new
start-ups are not a viable mechanism for responding to ineffective states. Unlike giant firms
overtaken by entrepreneurs who started small and through superior performance attracted
resources that allow them to expand'2 , one cannot start a competing "state" in the proverbial
garage. Management changes of the state are all or nothing. In the absence of established and
respected procedures, these changes frequently occasion the use of force: hostile takeovers of
governments tend to be very, very hostile.
10 These can lead to variations in performance. Isham, Kaufman, and Pritchett (1995) show that countrieswith greater civil liberties have higher returns on World Bank financed investment.
" Having such multiple providers would itself be an endogenous outcome of the interaction of governmentand citizens, but an outcome which at least part of "government" can be expected to resist.
12 These type of evolutionary dynamics are, to my mind, the most convincing argument behind a tendencyy toward 1 in the private sector.

12
Third, with governments, unlike corporations, "ownership" (the claims to the residual
value of assets) is not traded. Again, this makes the agency problem of citizens more difficult.
Anyone disgruntled with the management of General Motors or IBM can use an "exit" option
and sell her claim to someone else and this provides a useful signal and a mechanism to monitor
management performance at creating shareholder value. If there were a market for, say,
Nigerian or Nepalese or German citizenship and its price began to plummet because citizenship
market analysts thought current management was making poor investments, this would certainly
attract existing citizens attention. Also, lack of a citizenship market means that managers of the
government cannot be explicitly offered "high powered" incentives linked to economic
performance as is frequently the case with top management of corporations'3 .
Fourth, many public sector investments are in the public sector because they are "public
goods" or, for one reason or another, the capital would not be provided in appropriate amounts
by the private sector. The contribution of public sector capital may not be privately
appropriable, which implies that, unlike private capital, one cannot look to any actual "market"
for roads or schools for a proper valuation of the capital created and hence immediately detect
excess costs.
To build a capital stock one needs to impose a value for investment efficacy (y). To do
so requires positive model of government. CUDIE has no priority as a capital stock estimate, but
rather is just a very special (and obviously counter factual) case in which yit=l Vi,t. The class of
13 Although (and I recognize this is a footnote that referees will insist I remove) there was a hilariousSaturday Night Live sketch in which a Ross Perot impersonator offered just such a deal, "Hey, economy grows 3percent I get nothing, but economy grows 4 percent I get 1 billion dollars, now, say the economy growsfive percent

13
agency models sketched here would all make two predictions. First, given the nature of states
versus finms as investors, positive models would predict that government investment efficacy for
many countries would be less than the private sector and much, much less than one (Yi,t << 1) for
many countries. Second, given the range of citizen control over governments in the world, from
totalitarian regimes in which questioning government actions leads to prison (or worse) to
democracies in which competition for power and public scrutiny are intense and effective, any
actual model will predict that, at any point in time, the degree of investment efficacy in some
countries will be much higher than in other countries (3 i,j such that Yi,t >>yj,t).
C) Empirical estimates of differences in investment efficacy across countries
How large are the differences across countries in the efficacy of investment? I present
six sources of evidence that these differences are large. The source of evidence are all indirect as
the lack of hard evidence is endogenous to an agency approach, as there are very good reasons
why governments would make excess costs as difficult to observe as possible.
First, while all countries have white elephants, investments with huge costs and little
value, they are more common and more spectacular in some regimes than in others. The
Ajaokota is not the only problematic still mill, the Lazaro Cardenas mill in Mexico has similar
problems with cost over runs. A nuclear power plant constructed in the Philippines under
Marcos cost, as an investment, more than 2 billion dollars but was never commnissioned and so
has zero value as capital. The Morogoro Shoe factory in Tanzania cost $40 million (financed by
The World Bank), its peak capacity utilization was never more than 4 percent, and is now a
mostly worthless hulk (World Bank, 1991). The list could go on and on. In contrast, some other

14
countries, both developed and developing, have reasonably effective investments and few such
tales.
Second, there are even more spectacular (but even less substantiated) reports of leaders
and their cronies siphoning off, in one form or another, fortunes that are a significant fraction of
their country's total investment. Much of those funds appeared as "investments". In other
countries, the wealth of government officials is quite closely monitored, and at least does not
become expressed as a proportion of GDP.
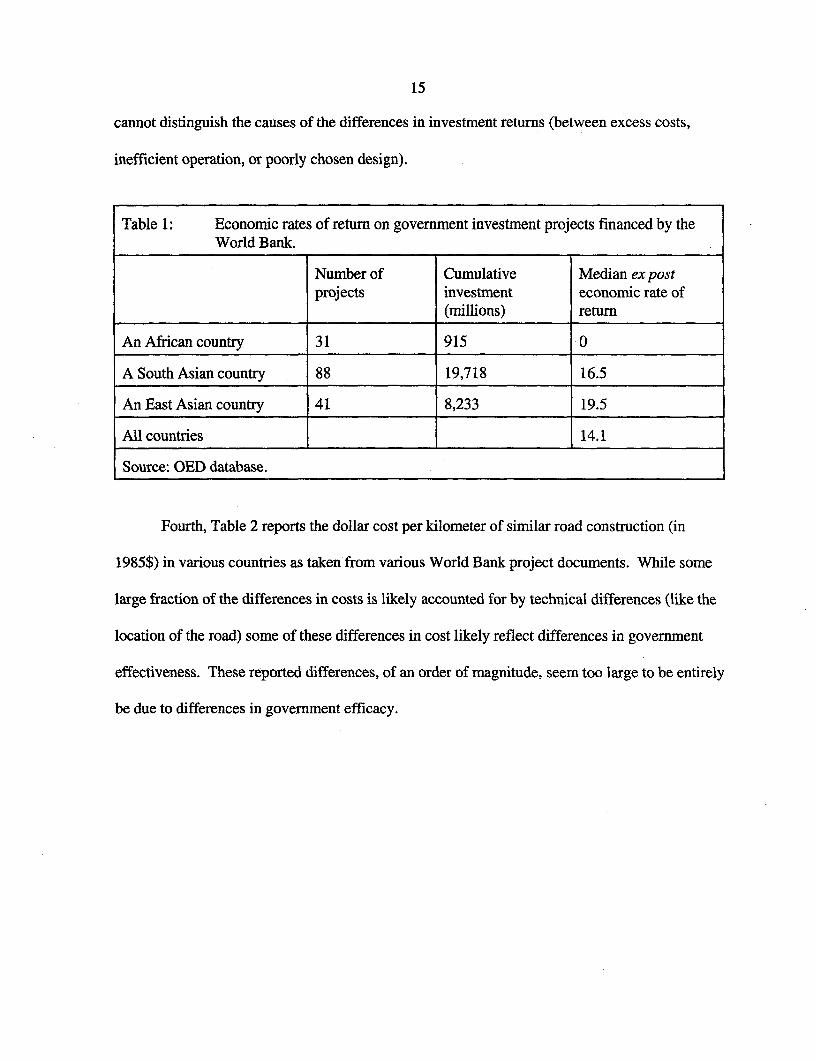
Third, a quantitative piece of evidence about differential public sector effectiveness in
investment is the cross national data on ex post economic rates of return on World Bank financed
investment projects14 . The World Bank finances, but does not implement, government projects
in many countries with the same procedures and staff in every country, hence there are good
reasons to believe the differences in returns across countries indicates varying government
investment efficacy. Table 1 lists the summary statistics on returns over 1973-1991 and provides
some anonymous country examples. The mean return of across all those countries with nine or
more projects was 14.1 percent but with a range from 0 to 25 percent. In one African country the
World Bank lent nearly a billion dollars over this period to finance 31 projects which achieved a
median rate of return of zero. In contrast the $8.2 billion lent to finance government projects in
one East Asia country earned a median return of 19.5 percent. While there clearly are huge
differences in the efficacy of governments in implementing investment projects, this evidence
14 The ex post return is assessed after disbursement of the World Bank loan. Also, these are economic, notfinancial returns to investment, so that they do, at least in theory, value non-marketed outputs, e.g. roads.
15
cannot distinguish the causes of the differences in investment returns (between excess costs,
inefficient operation, or poorly chosen design).
Table 1: Economic rates of return on government investment projects financed by theWorld Bank.
Number of Cumulative Median ex postprojects investment economic rate of
_________________________ ________________ (m illions) return
An African country 31 915 0
A South Asian country 88 19,718 16.5
An East Asian country 41 8,233 19.5
All countries 14.1
Source: OED database.
Fourth, Table 2 reports the dollar cost per kilometer of similar road construction (in
1985$) in various countries as taken from various World Bank project documents. While some
large fraction of the differences in costs is likely accounted for by technical differences (like the
location of the road) some of these differences in cost likely reflect differences in government
effectiveness. These reported differences, of an order of magnitude, seem too large to be entirely
be due to differences in government efficacy.

16
Table 2: Costs of construction of a kilometer of similar road in selected countries(in 1985$)Country High Cost countries Country Low Cost countries
Honduras 771,068 Chile 143840Ethiopia 721,160 India 143306Guatemala 631,965 Costa Rica 131966El Salvador 540,632 Philippines 111343Pakistan 434,650 Uruguay 95440Nigeria 426,839 Korea 92072
Sri Lanka 65277
Average cost: 287,350.Source: Canning and Fay, 1995. Notes: Brazil and Argentina were not included in thehigh and low list because of doubts about appropriate deflation and exchange rateconversion under hyperinflation.
Fifth, the counter-part of CUDIE at the firm level is the inflation adjusted, economically
depreciated, cumulative investments in the firm. This suggests that a good indicator of public
sector investment efficacy is to compare what public enterprises (producing private goods in a
competitive environment) would sell for relative to their CUDIE'5 . In particular, this is a critical
thought experiment for distinguishing the "no capital" from the "badly used capital"
explanations of the low output from public investments. If the reason for low output from public
capital is simply low productivity under public sector management, then public firms could sell
for near their CUDIE (and perhaps much more than their annualized current profit stream)16. If,
on the other hand, the investment spending has not produced economically valuable assets then
privatization values will be perhaps much less than CUDIE.
1 The two qualifications in the sentences are important: "private good" so that prices really could becharged and "competitive environment" because many of the most lucrative privatizations are those that sellmonopolies, like telecommunications firns, where the price paid for accumulated assets is difficult to disentanglefrom the price paid for the exclusive franchise.
16 Although there is not certain as the assets themselves may be in declining industry and there might bediscounts due to asset specificity.

17
However, in spite of the spate of privatizations over the last decade, this remains largely
a thought experiment. I have not been able to collect any systematic concrete information of this
type'7. However, the total net revenues of the unit created to undertake the privatizations of East
German assets was negative $200 billion, the negative receipts obviously indicate other factors,
such as that new owners had to absorb obligations, but nevertheless indicates little underlying
capital value (Boycko, Shliefer, and Vishny, 1993). While many developed countries and Latin
American countries have derived substantial revenues from privatization efforts in many African
countries the "privatizations" have been mainly liquidations and have generated very little net
revenue.
Sixth, there are an increasing number of surveys comparing costs of doing business and
bureaucratic quality across countries. The first generation were based on commercial services
rankings (as used in Mauro 1998, and Keefer and Knack 1997). There is now a new generation
based on comparable firm level surveys recording the level of various costs incurred (Kaufmann,
1998, Charap and Harm, 1998). These differences would translate into higher reported costs of
investment and greater ineffectiveness in creating capital.
The conceptual distinction between public sector CUDIE and the value of public capital
is perfectly obvious. It is also obvious that there is no general positive behavioral theory of
government behavior that would justify a universal prediction of cost minimization. Finally, that
the efficacy of investment varies widely across countries and has often been quite low is also
perfectly obvious. The key question is whether these perfectly obvious points are fruitful and
17 It would be naive to be "surprised," as for governments to admit they are selling firms for a fraction ofwhat they paid for them is obviously embarrassing, and hence best left undocumented. But all the more reason itwould have a high payoff to document.

18
empirically important. The next two sections address this question, first, for public sector capital
and the next for cross national examination of "productivity" and growth determinates.
II) Productivity of public capital and policy recommendations
How productive is public capital? Is there too much or too little? Is there too much of
one type and not enough of another? Many types of public capital do not produce private goods,
but contribute to production indirectly through reductions in costs or increases in productivity of
private production. Often it is impossible to value public capital through a "market". An
aggregated approach if often the only way to estimate the impact of some types of public sector
capital; many empirical studies have used cross national data on public sector investment
spending to examine whether, and what types, of government spending are "productive".
However, this approach may often falsely conclude that "public capital" is unproductive when in
fact public capital would be very productive but the investment efficacy is low.
A) A basic production function with public sector capital
Start with a simple one good (Y) production function specification that distinguishes
private, Kp, and public, (Kg "g" for "government") capital stocks and allows for a separate
productivity parameter for public (Ag) and private (A) production. What enters the production
function is public capital (the true stock of capital available) and also how well that stock is used
(Ag) to produce a flow of "public capital services"
7) Y = F(A, KpP, Ks X, Ag)
Now suppose that only a fraction y(.) of public investment actually creates useful public
capital ( the equation should also reflect that depreciation is also a behavioral, not technological,

19
parameter but, again, I leave this aside). Then the capital stock growth is:
8) Kg =Y(-)*( Ig1Y)*(Y1K8 )-Sg
When this definition of capital growth is substituted into a linearized (e.g. quasi-Solow'8 )
expression for growth rates of output, the coefficient on public investment in the growth
equation is the product of the production function parameter (0Cg) and the efficacy of investment
coefficient Yg( ) and the inverse of the capital/output ratio (Kg). Alternatively, the coefficient on
CUDE growth is ag*y(.):
9) 9=ac*(y(.)* l *g* - )+aG *(p* L P*Kp8p)+A+Ag
A growth regression (or any other empirical procedure) that was limited to observing
outputs and investment inputs (either as an investment share of GDP or as CUDIE) cannot
separately identify the two effects of the technological production function parameter, ag, the
productivity of public capital and the endogenously determined public sector efficacy of
investment, y (.). This is not merely a problem of bias in the estimate of the productivity of
public capital (oxg) but of identification. Neither time series or cross unit regressions based on
equation 9 estimate the parameter oxg at all. Even if y were fixed (over time or across unit of
observation) the coefficient CUDIE from a growth regression is a (perhaps biased) estimate of
y*ag.
I8 Using a "Solow" type production function for the example, hopefully does not create confusion that thisis about "new" versus "old" growth issue or a "spillovers" versus "direct productivity" issue or anything other issueabout the assumed production function. One way or another "public capital" will enter the production function andthis is not about how Kg enters the production function, but about the fact Kg is badly measured.
19 Using investment shares, one needs to divide by the capital/output ratio to recover the productionfunction parameter, but the same lack of identification applies.

20
But y is not constant either over time or across countries. Assume there were a universal
positive model of investment efficacy and, say for simplicity, it was determined completely by
some variables Z and those were included linearly in the growth equation. It would still be the
case that the regression of growth on investment recovers, at best, y(z) * ag (the output effect of
investment evaluated at average efficacy) but not ag. Merely inserting Z (e.g. "extent of
corruption" or "quality of bureaucracy" or some additional variables thought to be related to
government efficacy) into the linear growth regression does not solve the identification problem.
A linear regression of growth on public investment and efficacy (and whatever other terms) does
not recover an estimate of the productivity impact of public capital would still have the
interactive effect specified to be correctly measured.
B) Growth regressions with public CUDIE and their interpretation
Tlhe empirical implications of an investment efficacy that was significantly less than one
and which varied widely across countries would be that, first, we would expect the coefficient on
investment or on public CUDEE to be lower than that of the private sector either in cross sections
or in individual countries. Second, we would expect the estimated impact of public CUDIE to
vary widely across countries.
Turning to the first hypothesis, we specify two typical growth regressions, one of which
is a simple growth accounting exercise that regresses growth on (potentially endogenous)

21
investment rates and another of which adds policy control variables2 0. If we assume that public
capital's share in output is proportional to its share in total investment then we can use the
estimated coefficient to infer the average relative effectiveness of public investment;
0) Yg = A,%
Yp 6plap
The estimates derived from this approach reported in table 3, indicate a relative efficacy
of public investment versus private investment of 50 to 60 percent. The usual interpretation that
this represents lower returns on public investment. But this same evidence consistent with not
that there are lower returns to public capital once created, but that there is a much lower
government than private investment efficacy in this sample so a given amount of investment
creates less capital. But the main point is that from the regression coefficients (ccx) one can make
assumptions about y's to make inferences about the oc's or vice versa, but some assumptions must
be made as the regression coefficients alone do not identify either.
20 Hulten (1996) does similar regressions within the context of a extended Solow model in which thecoefficients on public and private investment are treated as production function parameters. His paper howevertreats only limited infrastructure items and does not make the general point about identification of investmentefficacy in the government sector, nor the implications for measured TFP.

22
Table 3: Cross national growth reg essions with public and private inve tment separately
Without "policy" variables With "policy" variables
Private Investment (262.3) 22.3
{average shareIp/Y} {10.9} I11.01
Consolidated public sector (21.852) 9.35investment 28)209
{average share Ig/Yl (8.91 {8.9}
Implied relative effectiveness of .63 .51public capitala
Other variables in the regressions:
-0.42 -.82Ln Initial Income (1.17) (2.25)
Primary Enrollment rate -.19 1.0(.20) (1.03)
Secondary Enrollment rate (2049) (.203)
Dummy for 1960s 3.1 2.49_______ ______ _______ ______ (5.78) (4.32)
Dummy for 1970s2.3 2.1Dummy for 1970s (26.08) (5.97)
Dummy for Sub-Saharan Africa (2 42) (2.90)
Dummy for LAC -1.6 -1.68Dummy for LAC (3.54) (3.53)
Ratio M2MGDP (2.201)
Government Consumption/GDP -8.4(2.41)
N (obs) 162 136
Adjusted R2 .485 .551
Note: Data is taken from Easterly and Rebelo, 1993. t. statistic in parenthesis. Constants are included butnot reported.a) This is the ratio of the ratios of the regression coefficient on investment over the average share ofinvestment in GDP for public and private.

23
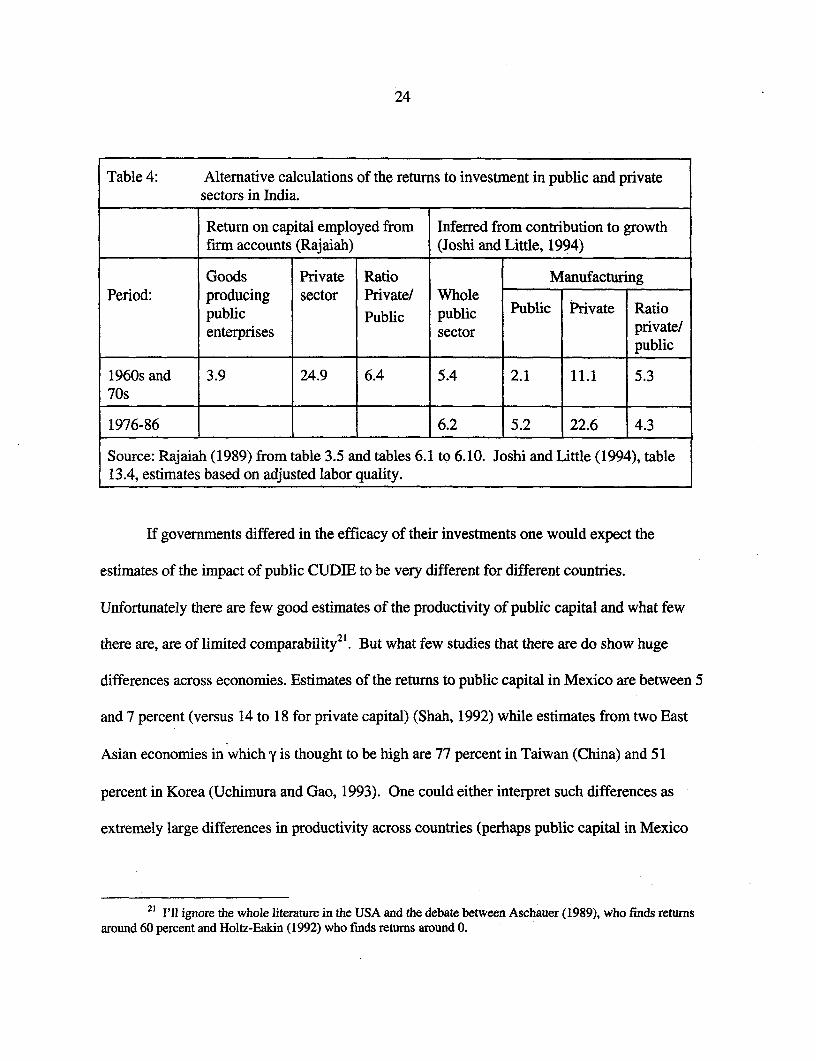
Similar evidence on returns between public and private sector investment, but limited to a
single country, is the difference in returns to investments in manufacturing in the public versus
private sector in India. Rajaiah (1989) compares the returns on capital employed in private and
public enterprises and finds that over the 1967/68 to 1973/74 period for which comparable data
are available, the returns are 4.2 in the public and 24.9 in the private sector. Even if one limits
attention to "goods producing" public sector firms (to account for the possibly non-commercial
nature of many public firms), the average return on capital employed is still only 3.9 percent.
Joshi and Little (1994) use an alternative, indirect, calculation using the relationship between
growth rates, investment rates, and capital shares to calculate the returns to investment in some
sectors in India over the periods 1960-1975 and 1976-1986. As shown in table 4, they find the
return to investment in public sector manufacturing in the latter period was 5.2 percent while the
return in private sector manufacturing was more than four times higher, at 22.6 percent. Again,
this evidence cannot distinguish among various explanations of lower public sector impact (e.g.
excess costs, excess depreciation, inefficient operation) or a low marginal product of additional
public capital but is consistent with much lower government than private investment efficacy
(yg<< Y P).
24
Table 4: Alternative calculations of the returns to investment in public and privatesectors in India.
Return on capital employed from Inferred from contribution to growthfirm accounts (Rajaiah) (Joshi and Little, 1994)
Goods Private Ratio ManufacturingPeriod: producing sector Private/ Whole
public Public public Public Private Ratioenterprises sector private/
_ _ _ _ _ _ _ _ _ _ _ _______ _ _ _ _ _ _ _ _ _ _ _ _ _ _ _ _ ________ p u b lic
1960s and 3.9 24.9 6.4 5.4 2.1 11.1 5.370s
1976-86 6.2 5.2 22.6 4.3
Source: Rajaiah (1989) from table 3.5 and tables 6.1 to 6.10. Joshi and Little (1994), table13.4, estimates based on adjusted labor quality.
If governments differed in the efficacy of their investments one would expect the
estimates of the impact of public CUDIE to be very different for different countries.
Unfortunately there are few good estimates of the productivity of public capital and what few
there are, are of limited comparability2 l. But what few studies that there are do show huge
differences across economies. Estimates of the returns to public capital in Mexico are between 5
and 7 percent (versus 14 to 18 for private capital) (Shah, 1992) while estimates from two East
Asian economies in which y is thought to be high are 77 percent in Taiwan (China) and 51
percent in Korea (Uchimura and Gao, 1993). One could either interpret such differences as
extremely large differences in productivity across countries (perhaps public capital in Mexico
21 I'l ignore the whole literature in the USA and the debate between Aschauer (1989), who finds retunsaround 60 percent and Holtz-Eakin (1992) who finds returns around 0.

25
has a very low marginal product) but one can equally legitimately interpret these differences as
reflecting differences in the efficacy of public sector investment (y g) between the countries.
Since nearly all of the previous empirical literature on productivity of public capital has
relied either on expenditures or cumulative investment flows to estimate capital stocks this
critique leads to fundamentally different interpretations of the results.22 Rather than drawing
inferences from estimates about the effect of public capital (or the optimal effect of any kind of
expenditure) as if one were recovering estimates of a "production function" it is equally (or
perhaps more) plausible that empirical results reflect differences in investment efficacy across
countries, especially when countries with extremely different types of governments are included
in the same analysis.
C) Sensible policy advice on investment in the public sector
From an empirical finding that the impact of public CUDIE on output was small, one
might be tempted to recommend that the public sector should invest less since the productivity of
public "capital" is low. But this is obviously wrong, in two senses. The first and most obvious
point is that policy recommendations clearly must differ across countries (and time). An
empirical finding that "public investment" is not related to performance can either mean that (a)
countries have over-invested in public capital so its marginal product (a g) is very low or (b) that
public capital is very productive but that the average effectiveness of public investment in
creating public capital (y) is very low or (c) that public capital has been created effectively but
22 Exceptions are Canning and Fay (1996) and Hulten (1996) which attempt to estimate infrastructureproductivity using data on actual stock (e.g. phone lines, miles of road), although even here, do they recognize, onemust adjust for quality and actual usable stock.

26
used badly (low Ag) or (d) any combination of the three. Cross national regressions recover, at
best, some "typical" yg* (xg but the true yi or cz for a given country could be much higher or
lower. Examining cross national regressions and recommending that Chile or Korea not build
roads because the observed productivity of public CUDIE in roads is low in a sample that
includes Tanzania or Myanmar is clearly wrong.
Second, imagine the decision tree for an economist (acting altruistically with a benign
social welfare function as the objective function) who asks: "Should I recommend spending Y
dollars of public sector resources to create capital good X?" The first question is whether X is in
a sector where there is some rationale for investment from the public sector. If the answer is no,
stop. The next question is, even if there is a scope for public sector intervention, whether the
appropriate solution is direct provision or regulatory or some type of publicly subsidized
procurement. This is an analytically difficult (and hence often ignored) question as the answer
will vary form country to country and sector to sector. If direct provision is appropriate, the next
question is whether the present efficacy of spending Y dollars to create capital would be high or
low? If the roads or education or irrigation ministry is completely corrupt or ineffective (low y),
then prior to the investment decision is the question, "whether there are reforms capable of
increasing efficacy?" If there are reforms that would alter incentives so as to raise y, then
perhaps those should be pursued first before expanding investment.
Only after addressing all these questions does one arrive at the question of whether the
marginal product of additional public sector capital is high enough to justify additional
investment in the capital good X. If public sector investment efficacy is abysmally low (rO)
with no prospect for reform then even if the marginal product of additional public capital would

27
be very, very high2 3 our hypothetical economist might still recommend no investment spending.
Conversely, if public sector efficacy is high (&1) then a much lower productivity of public
capital could justify the investment.2 4
III) Existing growth decompositions are wrong
There is a powerful institution behind decomposing output per worker into past part "due
to" how much "stuff' each worker uses and how well that "stuff' is used. Of course, how
exactly to define "stuff" and "due to" in a production function is the subject of much growth
literature debate. But, no matter how the production function is specified, this approach goes
empirically badly wrong when the countries compared differ either in the importance of public
sector in total investment or in the efficacy of that public investment as then "stuff' is badly
measured.
Suppose one is comparing the output per worker of Tanzania and the United States. In
1985 relative outputs (in purchasing power adjusted units, P$) were 35 to one while CUDE
stocks were only 38 to one. If one plugs this into a simple y=Af(K) production function model
then one can begin to ask questions like, "are the differences in A implied reasonable?" or "How
high would a need to be if A were the same?" and "What about other dimensions, like human
capital?", and so forth. However, for the USA CUDIE is likely a reasonably good estimate of
23 The case of low efficacy is common in the developing countries reconciles a common paradox. Fordecades development "experts" have observed the lack of roads, power, schools, health clinics, and assumed thatsince the stock was so low, the marginal product of public sector capital must be high, hence "more investment" wasthe appropriate answer. However, this has left a legacy in the poorest countries of large amounts of public sectorinvestment (often with official financing) but with little or no public sector capital to show for it.
24 This also re-enforces the point made by Easterly (1997) that the continued common use of "ICORs" as ameasure of "efficiency" and "investment" as a causally driving force to growth is absurd and should be stopped.

28
capital but CUDIE almost certainly dramatically overstates available capital in Tanzania.
Therefore, no matter how complex the equations involving "K" get, this whole line of reasoning
fails empirically because K is badly measured by CUDEE. The decomposition of output into
"stuff' (factors) and "using stuff well" (productivity) only works if at least one of the two can be
measured well independently.
A) Estimates of TFP
This obviously affects conventionally measured TFP growth. Over the last 30 years,
fifty-five percent of developing countries have measured TFP growth less than zero, with more
than a quarter showing TFP lower than negative one percent per annum. One could argue that
over time these countries were getting less and less productive in using existing factors. A
different interpretation is that much of the "factor" accumulation measured by CUDIE is false.
CUDIE overstates capital and hence understates TFP2 5.
This empirical reinterpretation can be explored by following a simple three step
procedure (data and procedures are documented in the working paper version appendices,
available on request). First, calculate the growth of conventional TFP country by country using
reasonable shares for physical and human capital and observed CUDIE growth for both. Second,
assume that the minimum TFP growth rate is available to any given economy in the world. I use
25 As mentioned above DeLong and Summers (1993) emphasize differences across countries in the price ofinvestment goods as an important source of mis-measurement of capital stocks. If prices are higher in India than inKorea then a greater investment rate (in nominal terms) is required to produce an equivalent increment to the realcapital stock. The capital stocks used in the base case are calculated with investment rates that use the investmentdeflation based on international comparisons of prices so this effect is already incorporated.

29
either zero6 or one percent per annum (the average in the OECD). In some cases this
assumption about TFP is inconsistent with the observed growth of CUDEE and output, that is,
CUDIE growth is "too high." Therefore, the third step is to scale back CUDIE growth to be
consistent with the observed rate of growth of output and the assumed growth of TFP. This
scaled down CUDLE growth creates what I call the "implied" rate of factor accumulation.
In equations, where k and y are the observed percent per per annum growth of per
worker CUDIE and output, the implied rate of factor accumulation (k) is:
k =k if TFP > TFPI,,iOk= -
k = y if TFP < TFPw,
For each of the two assumptions about "minimum" TFP growth (0 or 1 percent) I carry out three
variants on this calculation. The first scales back both physical and human CUDIE equally. The
second assumes that human CUDIE should not be scaled back and scales back just the rate of
growth physical CUDIE (even though the contribution human CUDIE is still used in calculating
TFP). The third just assumes away human capital growth entirely (in both the TFP calculation
and the re-scaling).
I am not able, for these large samples, to scale back differentially government and private
investment as there are not widely available series on the extent of investment in the
"consolidated public sector." Therefore I scale back private and public CUDIE equally, which,
if private investment efficacy is higher, creates very loose upper bound on the investment
efficacy in the public sector. Second, this exercise cannot distinguish among possible
26 Zero is an obvious lower bound as Bernard 1999 points out steady state TFP cannot benegative.

30
explanations of deviations of "capital" from CUDEE (shifts due to price changes, excess
depreciation, etc.) as all are present to some degree.
The results in table 5 are striking in a number of ways. First, the results suggest that in
many regions the "implied" rate of factor accumulation was very, very much slower than the
standard CUDIE estimates would suggest. In every developing region (except for East and
"other" Asia) the implied rate of "capital" growth was only half (South Asia, Africa, MENA) to
three quarters (Latin America) as large as CUDIE growth even when TFP growth was assumed
to be zero. If TFP the growth "available" was one percent, implied capital growth was a quarter
or less of CUDIE outside of East Asia and the OECD.
Second, the results in table 5 are striking in that they accord with my intuition of the
effectiveness of public investment across countries.27 In the OECD and the High Performing
Asian Economies (HPAE) there is very little difference, consistent with casual empiricism of
reasonably effective public sectors, in which, although there was perhaps pervasive corruption,
at least things got done. The problems appear to be worse in regions where the fraction of
investment that was public was high and, one suspected, efficacy low: the Middle East where
governments invested huge oil revenues (even though the subsequent terms of trade shock on
these economies and requisite capital revaluation must be factored in); Sub-Saharan Africa
(where Collier 1999 has recently documented the low returns to investments); and South Asia.
Third, it is also striking that there is no relationship between CUDIE growth and the ratio
of "implied" capital growth to CUDIE (the cross country correlation is only -.19). Africa had
27 See Bosworth, Coflins, and Chen (1995) for an excellent discussion and implementation of the variousissues involved in this type of "growth accounting" estimate of TFP. The regional pattern of their preferred TFPestimates (in spite of the different data, regional coverage, and time period) are similar to the TFP reported in table 5,SSA -.7, MENA -.4, LAC .1, OECD 1.0, East Asia .8, South Asia .7.

31
both low investment effort (2% p.a) and translated only a small fraction (49%) of that investment
into "capital." In the MENA region there was no shortage of investment and CUDIE growth was
nearly as large as in the HPAE (3.5% vs. 3.8%), but growth of "implied" capital was quite slow
(1.6%).
Table 5: Results of calculations of CUDIE growth and "implied" factor accumulation withimposed minimum rates of groth, regional averages ______
Region CUDIE "observed" CUDIE Ratio of CUDIE Ratio of(number of countries) growth TFP growth "TFP Growth 'TP
(% p.a.) "Implied" Implied" to "Implied" Implied" toif Observed if TP Observed
TFP CUDIE growth = CUDIEgrowth=0 growth 1% p.a. growth
Middle East, North Africa 3.53 -1.3 1.62 45.8% 0.95 26.9%9 .Sub-Saharan Africa (21) 2.03 -0.6 0.99 48.8% 0.17 8.4%South Asia (6) 2.13 -0.9 1.15 54.0% 0.19 8.9%Latin America and 1.69 -0.1 1.22 72.2% 0.41 24.3%Caribbean (23)
High Perforning Asian 3.84 1.2 3.63 94.5% 3.07 79.9%Economies (7) _
Other Asian Economies (4) 1.64 0.3 1.56 95.1% 0.82 50.0%OECD (24) 1.791 1 1.75 97.8% 1.32 73.7%Source: Author's calculations.
Table 6 shows that variants on this calculation give different quantitative results, but the
three basic results are robust. If one subtracts from output growth an attribution "due to" human
capital growth in deriving TFP but only assumes that physical CUDIE growth should be scaled
back, the results are obviously even more dramatic, with regions like MENA, SSA and South
Asia showing zero growth contribution of physical capital accumulation over the period. On the
other hand, if one assumes that human capital accumulation had no effect on output (which is

32
what the aggregate growth regressions suggest, Benhabib and Spiegel 1994, Pritchett 1996,
Islam 1995) and use only physical CUDIE in creating TFP and then scale back just the physical
CUDIE, the results are obviously less dramatic: Nevertheless in both cases most of the regional
patterns are preserved. The only exception is South Asia, which looks very effective in physical
capital only if human capital is assumed to have no impact.
Table 6: Results of calculations of actual and "implied" factor accumulation, regionalaverages
Region # of Adjustment of just the physical Adjustment of just physicalcountrie capital stock with educational capital without education capital
s capital in the TFP calculation in the TFP calculationPercent per annum Implied Percent per annum Implied
growth /Observed groth /ObservedObserved Implied Observed ImpliedCUDIE "Capital" CUDIE "Capital"
Middle East, North 9 1.9 0 0.0% 1.58 0.5 36.7%Africa__ _ ___ _ _ _
Sub-Saharan Africa 21 0.85 -0.19 Negative 0.7 0.45 64.2%South Asia 6 0.92 -0.05 Negative 0.76 0.73 96.0%Latin America and 23 1.08 0.61 56.5% 0.89 0.7 78.6%Caribbean _I_High Performing 7 3.03 2.82 93.1% 2.5 2.5 100.0%Asian EconomiesOther Asian 4 1.19 1.09 91.6% 0.98 0.98 100.0%Economies ..
OECD 24 1.36 1.32 97.1% 1.12 1.11 99.1%
My conjecture is that the difference between CUDIE growth and the "implied" capital
growth is at least in part due to difference in y, which are in turn determined by difference in
constraints governments face from their citizens. Recently Sachs and Warner (1995) have
proposed an indicator of overall policy that combines a binary indicator of whether or not a
government is "repressive" and a binary indicator of a minimum amount of "openness" (non-
repressive and open governments are classified as having an "acceptable" policy environment).

33
Table 7 shows the difference in the CUDIE versus implied capital stock growth by whether
regimes were politically repressive. Average CUDIE growth was almost identical (2.14 vs.
2.18). However, the "implied" rate of factor accumulation is 86 percent of CUDIE for the
politically non-repressive economies but only 50 percent for the repressive governments.
Moreover, not only is the difference between observed and "implied" lower, suggesting on
average lower efficacy in regressive regimes, but the variance of the difference is much higher
28for repressive regimes (1.9 vs. .64) . So while some repressive regimes might be quite effective
at creating capital, others are very, very ineffective. The evidence is suggestive that the problem
of low returns on investment is related to issues of governance, in the broad sense of government
efficacy, not just economic policy.
Table 7: Ratio of observed to implied factor accumulation, across types ofcountries.
Percent per annum growth StandardCountry # of factor accumulation Ratio deviation ofclassification countries Observed Implied the difference
Non- 56 2.14 1.84 86.0% 0.69repressive
Repressive 38 2.18 1.08 49.5% 1.9
Acceptable 28 2.27 2.15 94.7% 0.46policies.
Bad policies 66 2.1 1.27 60.5% 1.56
Sources: Sachs and Warner, 1995 for classification of countries.
28 The difference between repressive and non-repressive is robust whether one excludes Africa (mostlyclassified as repressive) or the OECD all (non-repressive) from the calculations.

34
These calculations are not "proof' that CUDIE does not measure capital, it simply
demonstrates the implications of reversing the interpretation of slow growth from "low TFP in
spite of capital accumulation" to "mis-measured capital accumulation." In spite of the fact that
nearly all previous TFP calculations have taken CUDIE as estimates of capital at face value,
there are no logical, theoretical or empirical grounds on which to do so. Except in circumstances
one is willing to make the false assumption that both the public sector and private sector are
equally and fully effective in creating capital from investments" the existing literature says
nothing about a decomposition between "factors" and "productivity" as perpetual inventory
methods do not create an estimate of available productive capital. Moreover, the discrepancy is
not uniform but will be large for some countries (e.g. Tanzania) and small for others (e.g. USA,
Germany).
The ubiquity of this logical inconsistency is well illustrated by the recent paper of Hall
and Jones (1999), two of the world's premier macroeconomists. In their paper they postulate
that "social infrastructure," which is measured by elements of government performance (e.g.
corruption) and policies (especially "openness") affects output per worker. They then
decompose output into "capital" and "productivity" using perpetual inventory capital stocks.
Using this capital stock they show the proportions of output differences due to various sources
(their table 1) and even illustrate the channels where which decomposes the effect of "social
infrastructure" into its impact on "capital" and its impact on "productivity" (lnA). However, it is
29 In addition of course to assuming away of relative price shift induced revaluations,mistakes, terms of trade changes, obsolesce, excess depreciation

35
logically inconsistent to postulate that these characteristics of governments affect output, given
capital stocks, but do not affect the output of capital goods for a given amount of investment.
C) Growth regressions (again) channels of growth
As a final implication, the fact that CUDIE differs from capital systematically across
countries implies two things about growth regressions.
First, having controlled for CUDIE is not the same as controlling for capital and the
"omitted variables bias" affects all other growth regression coefficients. The deviation of actual
capital from CUDIE is country (and time) specific and is endogenously determined and hence is
unlikely to be orthogonal to other co-variates. Take a regression of growth (y) on CUDIE (c)
and some other potential growth determinant, X. The regression is:
yi= af *ci+j6*Xi+a
However, since the cross national regressions almost invariably impose constant
coefficients this means that the error term will contain an "omitted variable" for varying
efficacy:
a = a + [y - r] * ci
As usual the direction of the "omitted variable" bias will be difficult to sign in a
multivariate context, but will depend on the correlation between the included variable (x) and the
omitted variable. The only correct interpretation of such regressions is: "impact of variable X
conditional on CUDIE " not the "impact of variable X conditional on capital stock growth."
Second, this inability to estimate factor growth also implies that all attempts to
empirically decompose a variables impact on growth into its "factor accumulation" effects and
its "productivity" effects is doomed from the outset. In investigations of the channels of impact,

36
researchers should be clear that what is estimated is the "impact of X on growth via investment
effort or CUDIE" and the "impact of X on growth, conditional on investment effort or CUDLE."
This would again make it clear that the decomposition is not into what is normally conceived of
as the concepts of "capital" and 'TFP" but into "CUDIE" and a residual also contains a term
determined by the efficacy of investment (as well as revaluation, etc.).
To some extent this is reassuring, relative to the previous interpretations of the residual
actually reflecting TFP. In many cases researchers regressed the residual of a growth regression
(or a constructed TFP using imposed factor shares) on underlying "determinants" of TFP.
However, as Hall (1989) pointed out, strictly speaking, within the Solow growth model TFP
should be orthogonal to all kinds of rhs variables representing "incentives" as since factor
payments exhaust product there should be no opportunity for incentives to affect TFP. However,
if the residual is correctly interpreted as reflecting (a) technical progress (fundamental progress
in knowledge) and (b) changes in efficiency with which capital stocks (human and physical) are
used and (c) the efficacy of past investments in creating capital useful for current period
production then it need not be orthogonal. In this light many of the existing "TFP" results are
more easily understood.
Conclusion
I would propose that we economists end the tyrannical reign of confusion caused by
using the same word for two distinct concepts. Lets call capital, capital and CUDIE, CUDIE.
All of the recent spate of empirical research on growth using investment or capital has
implicitly assumed that all governments everywhere were always cost minimizing investors.

37
This is obviously false. Cross national empirical research using investment rates or CUDIE
cannot be used to make statements such as "the estimated impact of public capital is...." or "the
contribution of output due to capital is..." or "the portion of output growth not accounted for by
differences in factor accumulation is..." This is not an arcane quibble, but is empirically
important and has serious policy and theoretical implications. If one concludes that the
"productivity of public capital is low" this has different implications for government investment
policy that "the output impact of CUDIE is low." When stated correctly, it is apparent the
impact of CUDIE might have been low because of low investment efficacy, because of
inadequate maintenance and hence high depreciation, because of larger ex post shifts in relative
prices, or because of poor efficiency of the operation of capital in the public sector. Each of
these has different policy implications than low productivity of public capital. The fact recorded
government investment spending of various types may or may not be associated with better
economic performance is an interesting fact but by itself provides little useful information for
policy recommendations.
Similarly, if one concludes "capital does not account for a large fraction of cross national
output differences" this suggests certain theoretical directions, e.g. research into differences in
"technical progress" or "technological diffusion" or "efficiency." If however, the actual
empirical result is stated more prosaically, and more accurately, as "differences in what
govermments run by corrupt autocrats/oligarchs/regimes spent in the past and was recorded as
investment does not explain current output" this suggests very different lines of research,
approaches which are much more likely to be fruitful in understanding cross national differences
in output growth.

38
Bibliograuhy
Aschauer, David, 1989, "Is public expenditure productive?" Journal of Monetary Economics 23:177-200.
Benhabib, Jess, and Mark Spiegel, 1994, "Role of human capital in economic development:evidence from aggregate cross- country data," Journal of Monetary Economics, 34:143-73.
Boskin, Michael J., Marc Robinson and John M. Roberts, 1985, "New Estimate of governmenttangible capital and net investment," NBER Working Paper Series #1774.
Bosworth, Barry, Susan Collins, and Yu-chin Chen, 1995, "Accounting for differences inEconomic Growth," mimeo (Brookings).
Boycko, Maxim, Andrei Shliefer, and Robert Vishny, 1993, "Privatizing Russia," BrookingsPapers on Economic Activity, 2 pp 139-192.
Canning David and Marianne Fay, "Infrastructure and growth," mimeo.
Campos, Edgardo and Hilton Root, 1996, The Key to Asian Miracle: making shared growthcredible, Brookings: Washington DC.
Charap, Joshua and Christian Harm, 1999, "Institutionalized corruption and the kleptocratic state," IMF working paper,WPI9919.
De Long, J. Bradford and Lawrence H. Summers, 1992, "Equipment investment and economicgrowth: how strong is the nexus?" Brookings Papers on Economic Activity, 2:157-211.
Easterly, William, 1999, "When is fiscal adjustment an illusion?" World Bank Policy ResearchWorking Paper #2109.
Easterly William and Sergio Rebelo, 1993, "Fiscal Policy and Economic Growth: An EmpiricalInvestigation," Journal of Monetary Economics, 32: 417-58
Hall, Robert E, 1989, "Invariance properties of Solow's productivity residual," in Solow, RobertM and Peter Diamond, 1990, "Growth, productivity, unemployment: essays to celebrateBob Solow's birthday," Cambridge, Mass. MIT Press.
Hall, Robert E, and Charles Jones, 1999, "Why do some countries produce so much more outputper worker than others?", Quarterly Journal of Economics, 114:83-116.

39
Hayek, Friedrich A., 1941, The Pure Theory of Capital, Chicago: University of Chicago Press.
Holtz-Eakin, Douglas, 1992, "Public Sector Capital and the Productivity Puzzle," NBERWorking Paper #4122.
Hulten, Charles R., 1996, "Infrastructure capital and economic growth: how well you use it maybe more important than how much you have," NBER Working Paper #5847.
Isharn, Jonathan, Deepa Narayan, and Lant Pritchett, 1995, "Does Participation ImprovePerformance? Establishing Causality with Subjective Data," World Bank EconomicReview, 9(2), ppl75-201.
Isham, Jonathan, Daniel Kaufmann, and Lant Pritchett, 1996, "Governance and the Returns toInvestment: An Empirical Investigation," World Bank Policy Research Paper 1550.
Islam, Nazrul, 1995, "Growth empirics: a panel data approach," Quarterly Journal of Economics,110:1127-70.
Jaffe, Adam, 1986, "Technological Opportunity and Spillovers of R&D: Evidence from Firms'Patents, Profits, and Market Value," NBER Working Paper #1815.
Joshi, Vijay and I.M.D. Little, 1994, India: Macroeconomics and Political Economy, 1964-1991,Washington DC: World Bank.
Keefer, Philip and Knack, Stephen 1997, "Why don't poor countries catch up? A cross-nationaltest of an institutional explanation," Economic Inquiry (U.S), 35:590-602.
Mauro, Paolo, 1998, "Corruption and the composition of government expenditure," Journal ofPublic Economics, 69:263-79.
Milgrom, Paul R., and John Roberts, 1992, "Economics, organization, and management,"Prentice-Hall.
Pritchett, Lant, 1996, " Where has all the education gone?", World Bank Policy ResearchWorking Paper #1581.
Rajaiah, B., 1989, Returns to investment and Efficiency in Public Enterprises in India, Delhi:Mittal Publications.
Sachs, Jeffrey and Andrew Warner, 1995, "Economic reform and the process of globalintegration," Brookings Papers on Economic Activity, 1:1-118.

40
Shleifer, Andrei, 1993, " Corruption," Quarterly Journal of Economics; 108:599-617.
Shleifer, Andrei and Robert W. Vishny ,1998, "The grabbing hand: government pathologies andtheir cures," Cambridge, Mass.: Harvard University Press
Shah, Anwar, 1992, "Dynamics of public infrastructure, industrial productivity, andprofitability," Review of Economics and Statistics, 74(1): 28-36.
Uchimura, Kauko and Jong Gao, 1993, "The importance of infrastructure on economicdevelopment," World Bank, Latin American Regional Office, Washington DC.

Policy Research Working Paper Series
ContactTitle Author Date for paper
WPS2328 Social Transfers and Social Branko Milanovic April 2000 P. SaderAssistance: An Empirical Analysis 33902Using Latvian Househoid Survey Data
WPS2329 Improving Russia's Policy on Foreign Joel Bergsman May 2000 S. CraigDirect Investment Harry G. Broadman 33160
Vladimir Drebentsov
WPS2330 Reducing Structural Dominance Harry G. Broadman May 2000 S. Craigand Entry Barriers in Russian 33160Industry
WPS2331 Competition, Corporate Governance, Harry G. Broadman May 2000 S. Craigand Regulation in Central Asia: 33160Uzbekistan's Structural ReformChallenges
WPS2332 Financial Intermediary Distress in Paola Bongini May 2000 K. Labriethe Republic of Korea: Small Is Giovanni Ferri 31001Beautiful? Tae Soo Kang
WPS2333 Output Fluctuations in Latin America: Santiago Herrera May 2000 C. PalarcaWhat Explains the Recent Slowdown? Guillermo Perry 35328
Neile Quintero
WPS2334 Sex Workers and the Cost of Safe Vijayendra Rao May 2000 P. SaderSex: The Compensating Differential Indrani Gupta 33902for Condom Use in Calcutta Smarajit Jana
WPS2335 Inflation and the Poor William Easterly May 2000 K. LabrieStanley Fischer 31001
WPS2336 Endogenous Enforcement and Hua Wang May 2000 Y. D'SouzaEffectiveness of China's Pollution David Wheeler 31449Levy System
WPS2337 Pollution Charges, Community Hua Wang May 2000 Y. D'SouzaPressure, and Abatement Cost of 31449Industrial Pollution in China
WPS2338 The Geography of International Howard J. Shatz May 2000 L. Tabadainvestment Anthony J. Venables 36896
WPS2339 Building Subnational Debt Markets Michel Noel May 2000 M. Noelin Developing and Transition Economies: 32581A Framework for Analysis, PolicyReform, and Assistance Strategy

Policy Research Working Paper Series
ContactTitle Author Date for paper
WPS2340 Currency Substitution in Latin Pere Gomis-Porqueras May 2000 M. PuentesAmerica: Lessons from the 1 990s Carlos Serrano 39621
Alejandro Somuano