Embed Size (px)
Citation preview

The Economic and Social Review, Vol. 44, No. 4, Winter, 2013, pp. 511–540
POLICY PAPER
The Structure of Ireland’s Tax System and
Options for Growth Enhancing Reform
BRENDAN O’CONNOR*Department of Finance, Dublin
Abstract: This paper explores the structure of Ireland’s tax system. Considerable attention isgiven to GDP and GNP as measures of Ireland’s taxable capacity but how appropriate are eitherof these measures given the structure of Ireland’s economy and how does the structure compareinternationally? The paper also examines the distribution of income tax and the threshold for thetop marginal rate as a percentage of the average wage and identifies Ireland as an outlierinternationally in terms of the rapid progression to the highest marginal rate. Consideration isthen given to the microeconomic and macroeconomic impacts of various forms of tax what lessonsemerge from the literature in terms of growth enhancing reforms to the overall tax structures andhow that might apply to Ireland. The results of simulations suggest permanent increases in GDPand employment from a revenue neutral shift from labour to consumption or property taxes.
I INTRODUCTION
As Ireland prepares to exit its EU/IMF programme of financial assistanceat end-2013, attention is turning to the economic strategies that Ireland
could pursue over the medium term. A central issue is how the economy’s
511
* The author is a senior economist in the Department of Finance. An earlier version of the paperwas presented and circulated at the Department of Finance’s “Enabling a Growth Friendly TaxSystem – Tax and Economics Conference”, on 19 June 2013. The author thanks colleagues fromthe Department of Finance as well as attendees and participants at the conference for helpfulcomments on earlier drafts. The author would also like to acknowledge the input of JohnFitzGerald (ESRI) and of the anonymous referee. All opinions expressed in this paper are thepersonal views of the author and the author alone is responsible for the conclusions.E-mail: Brendan.O’[email protected]
05 O'Connor PP article_ESRI Vol 44-4 16/12/2013 12:08 Page 511

growth potential can be increased in order to provide greater employmentopportunities and sustainable improvements in living standards. Thisimperative requires that policies across a range of areas be examined with aview towards assessing whether growth-friendly changes could be madehaving regard to wider societal objectives. This paper seeks to contribute tothis discussion by analysing the role, both positive and negative, that thespecific area of taxation policy can have on economic growth.
After a period of significant fiscal adjustment, it is worth reviewing whereIreland’s tax structure stands in an international context. Cross-countrydifferences in overall tax levels largely reflect societal choices as to theappropriate level of State provision in the economy and the resulting levels ofpublic spending.1 However, investigating how tax structures could best bedesigned or altered to promote economic growth is a key issue for tax policymaking. As acknowledged in the Mirrlees Review by the Institute of FiscalStudies,2 improvements in tax structure and design can reap very valuabledividends in terms of increased economic efficiency and greater fairness. It istherefore relevant to look at the structure of Ireland’s tax system in aninternational context (see Section II).
As well as comparing the tax structure with that of peer countries, thispaper considers what can be learned from the microeconomic literature onoptimal taxation and the macroeconomic interaction between tax policy andeconomic growth (see Section III). The paper then considers the types ofgrowth friendly tax reforms that emerge from the literature on tax andeconomic growth (see Section IV). An obvious issue that emerges from thediscussion is whether scope exists to pursue growth friendly reforms to the taxstructure in Ireland and what the impact of these reforms on employment andeconomic growth might be. Results from two macrosimulation models on theoutput and employment impacts are presented in Section V.
Whilst the purpose of the paper is to stimulate thought and discussion onhow tax policy can contribute towards improved economic performance, itshould be acknowledged that a trade-off can exist between growth-orientatedtax policy and equity and progressivity concerns. This paper does not attemptto address this trade-off, although it notes the highly progressive nature of theIrish personal income taxation system by international standards.
512 THE ECONOMIC AND SOCIAL REVIEW
1 Johansson et al. (2008).2 See Mirrlees Review: Tax by Design, Section 1.
05 O'Connor PP article_ESRI Vol 44-4 16/12/2013 12:08 Page 512

II STRUCTURE OF TAXATION IN IRELAND
High taxation levels are often regarded as an important contributortowards low employment levels and unsatisfactory economic performance inEurope.3 High taxes on labour and corporate income can discourage laboursupply and demand, and reduce incentives for investment and human capitalformation. Accordingly, some commentators recommend a substantial reduc -tion in tax levels, particularly on taxes on employment, to revitalise Europeaneconomies.
On the other hand, some EU Member States have been able to combinerelatively high levels of taxation with a strong economic performance and low unemployment. This indicates that the determination of the optimalaggregate level of taxation is not straightforward.
A number of broad arguments have been put forward as regards the sizeand distribution of the tax burden in Ireland in recent years. Some observershave argued that the burden of taxation is too low and that scope exists toraise the level of taxation as a share of output, whereas others have arguedthat there is no further scope for fiscal adjustment on the revenue side. In arelated debate, some have suggested that the tax burden on labour is too highwhile others have argued that the burden is not high enough on high earners.Very little comment has addressed the potential for (revenue neutral) shifts inthe structure of taxation in Ireland.
The discussion that follows seeks to present data on the structure of thetax system and, in the process, identify whether evidence can support any ofthe arguments referred to above. It also seeks to identify whether oppor -tunities exist for a shift in the structure. The paper does not seek to addresswider normative issues regarding the optimal size of the State.
2.1 The Overall Tax BurdenThe tax burden in Ireland is generally expressed as a share of gross
domestic product (GDP). GDP is an estimate of the total value of all final goodsand services produced within a country in a given year and is generallyregarded as an appropriate measure of the tax base. Using GDP as therelevant tax base, Ireland had one of the lowest tax burdens in the EU-27 in2011, the most recent year for which outturn data are available.4 On thisbasis, it might appear at first sight that Ireland has the capacity forgenerating greater tax revenue by international comparisons.
THE STRUCTURE OF IRELAND’S TAX SYSTEM 513
3 European Commission (2008).4 European Commission (2013).
05 O'Connor PP article_ESRI Vol 44-4 16/12/2013 12:08 Page 513

An alternative measure of the tax base is a country’s gross nationalproduct (GNP). While GDP measures the total output of the economy in aperiod, i.e. the value of work undertaken by employees, companies and self-employed persons, this work generates incomes but not all of these incomesremain the property of residents (and residents may earn some incomeabroad). The total income remaining with Irish residents is GNP and it differsfrom GDP by the net amount of incomes sent to or received from abroad. Thedifference between GDP and GNP is the factor flow to/from abroad and inIreland’s case the factor flow out of Ireland is very large and negative.Ireland’s GNP is therefore less than its GDP.
As shown in Callan et al. (2013), after Luxembourg, Ireland had thelargest difference between GDP and GNP in Europe in 2011 when GDPrepresented 124 per cent of GNP, with the rest of the EU-27 in a rangebetween 97 per cent (Denmark) and 108 per cent (Czech Republic). Due to thisdifference some commentators (McCarthy 2004, 2010) have argued the lowerpotential tax yield from net factor outflows means that GNP should bepreferred.5
Another view is that the “true” base for Ireland is likely to be somewherebetween GNP and GDP. The Irish Fiscal Advisory Council (IFAC) used a linearregression to empirically estimate an economic relationship between taxrevenues and output.6 Using this approach IFAC suggested a ‘hybrid’ measureof GNP plus 40 per cent of net factor flows, in other words GNP plus 40 percent of the difference between GDP and GNP.
Figure 1 below looks at the tax burden as a share of economic output forthe EU-27 in 2011 with three bases used for Ireland; GDP, GNP and the IFAChybrid measure. Ireland would have a tax burden in excess of the Europeanaverage if GNP was used as the relevant base and just below the EU averageusing IFAC’s hybrid approach.
Thus from a purely benchmarking perspective, the capacity for Ireland toraise additional revenue as a share of output depends on one’s view as to theappropriate measure of the tax base taking into account the structure of theIrish economy and the size of factor flows out of the country.
Sticking with GDP as the relevant base it is worth asking what it is thatresults in Ireland looking like an outlier in such benchmarking comparisons.Figure 1 above includes social security contributions (SSC) as a tax revenue.SSC in Ireland at 5 per cent of GDP are the second lowest in the EU-27 after
514 THE ECONOMIC AND SOCIAL REVIEW
5 However as shown in Fitzgerald (2013) GNP itself has been distorted in recent years by thearrival of re-domiciled UK Plcs since 2008 which are estimated to have added up to 4 per cent tothe level of GNP in 2012, while having very little impact on GDP.6 IFAC (2012).
05 O'Connor PP article_ESRI Vol 44-4 16/12/2013 12:08 Page 514

Denmark,7 and are less than half the EU-27 average of 11 per cent and justunder half the OECD average of 9 per cent.8 In some countries, socialinsurance is a genuine form of insurance whereas in others (such as Ireland)the link between contributions and benefits is less clear-cut. Given thisheterogeneity it is worth benchmarking Ireland against other countries SSCexcluded to compare how ‘core’ taxation compares in an international context.
Figure 2 below presents total taxation as a share of GDP without SSC. At24 per cent of GDP it is clear that after stripping out the impact of SSCIreland’s ‘core’ tax burden is in line with the EU average of 25 per cent, and isabove the EU average when the alternative measures of economic output areused.9
2.2 Labour TaxesAt €19 billion in 2011, labour taxes in Ireland represented 12 per cent of
GDP. This placed Ireland as the fifth lowest in the EU-27 and approximatelyfive percentage points below the EU-27 ratio. Such an outcome is consistentwith the findings from the economic literature on the need to keep the overalltax burden on labour low (Prescott, 2004) and the EU trend of shifting the taxburden away from labour (European Commission, 2013).
THE STRUCTURE OF IRELAND’S TAX SYSTEM 515
Figure 1: Tax as a Share of GDP, 2011
Source: Taxation Trends in the EU, European Commission (2013) and author’scalculations.
50
40
30
20
10
0
7 There was a total of €7.9 billion in contributions in Ireland in 2011, with €5.5 billion in employercontributions, €2 billion in employee contributions, and €0.3 billion in contributions by self-employed and non-employed.8 See Taxation Trends in the European Union and OECD Revenue Statistics.9 Similarly, if Ireland’s level of SSC as a share of GDP were at the EU average of 11 per cent itwould add an additional 6 per cent of GDP to the tax burden and bring Ireland up to the EUaverage.
05 O'Connor PP article_ESRI Vol 44-4 16/12/2013 12:08 Page 515

In the same year labour taxes accounted for 42 per cent of total taxation,a share in the mid-range of EU Member States but below the EU average of47 per cent. As with the preceding discussion on total taxation, a cross countrycomparison is somewhat distorted by the inclusion of SSC in this measure.10
When SSC are excluded Ireland’s labour taxes at 7 per cent of GDP wouldexceed the EU average of 6 per cent. Similarly, the share of total taxationwould stand at 24 per cent as against the EU average of 16 per cent. Thisshows that the ‘core’ burden of taxation on income is relatively high in an EUcontext and that the lower headline level is explained by SSC.
Table 1: Taxation on Labour as a Share of GDP and Total Taxation, 2011
Ireland Ireland’s Rank EU Average% in EU-27 %
Share of GDPLabour including SSC 12 23 17Labour excluding SSC 7 8 6
Share of TaxationLabour including SSC 42 19 47Labour excluding SSC 25 3 16
Source: Taxation Trends in the EU, European Commission (2013).
516 THE ECONOMIC AND SOCIAL REVIEW
Figure 2: Tax as a Share of GDP Excluding Social Security Contributions,2011
Source: Taxation Trends in the EU, European Commission (2013) and author’scalculations.
50.0
40.0
30.0
20.0
10.0
0
10 The Mirrlees Review by the Institute for Fiscal Studies did not regard UK SSC (NIC) as a trueSSC and instead regarded it as a tax on labour. It argued that for some countries the SSC is a pureSSC and for others a tax.
05 O'Connor PP article_ESRI Vol 44-4 16/12/2013 12:08 Page 516

Whilst the analysis above benchmarks Ireland’s tax burden on labouragainst other European Union Member States it is worthwhile also to look athow the burden is distributed by income levels and how this comparesinternationally.
In 2012 the top 1 per cent of earners, roughly equating to tax units withincome in excess of €200,000, paid 19 per cent of income taxation includingthe universal social charge (USC) in Ireland. The top 5 per cent of earners,which equates to tax units with income in excess of about €100,000, paidapproximately 40 per cent of income tax and the USC and the top 23 per centof tax units, with income in excess of €50,000, paid approximately 77 per centof tax and USC.11 It is clear, therefore, that the burden of taxation mostly fallson higher paid tax units.
Figure 3: Cumulative Income Tax and USC Paid by Income Level, 2012
Source: Author’s analysis based on data from the Revenue Commissioners.
According to OECD data,12 the Irish income tax system is one of the mostprogressive in the world, as measured by the OECD metric of comparing theratio of the tax wedge of a single individual at 166 per cent of the average wage
THE STRUCTURE OF IRELAND’S TAX SYSTEM 517
100%90%80%70%60%50%40%30%20%10%0%
Share of Tax Units Share of Tax Paid
11 The most recent year for which data is disaggregated by the Revenue Commissioners into singleand married tax units is 2010. In that year 77 per cent of single tax units which represented agross income of €35,000 or less, contributed 15 per cent of all tax paid by that cohort, while formarried (jointly assessed) tax units 79 per cent of tax units, representing a joint gross income of€75,000 or less contributed 23 per cent of all tax paid by that cohort. Overall, for that year thefirst 78 per cent of tax units contributed 18 per cent of tax, or equivalently the last 22 per cent oftax units paid 82 per cent of all tax. The year 2010 included the income and health levies but notthe USC or the changes in income tax credits and bands that were introduced in Budget 2011 andare represented in Figure 3.12 OECD (2013a).
05 O'Connor PP article_ESRI Vol 44-4 16/12/2013 12:08 Page 517

with an individual at 66 per cent of the average wage.13 Using this approachIreland’s progressivity score of 190 per cent was the second highest in theOECD after Israel.
Figure 4: OECD Progressivity Measure, Single Tax Payers, 2012
Source: OECD (2013a), Taxing Wages 2013.
This outcome is not surprising given the low effective tax rates at the lowend of the income distribution. According to OECD data, the effective rates oftax on workers (including SSC) for a single individual in Ireland are below theOECD average at both 66 per cent of the average wage and at the averagewage, and only converge with the OECD average at 166 per cent of the averagewage. When SSC are excluded the effective rates at 66 per cent of the averagewage are still below the OECD average and converge at the average wage. Theeffective rate on an individual at 166 per cent of the average is almost 7 percent higher than the OECD average.
In terms of the entry points to core income tax (excluding USC and SSC),Abbas (2012) identified the entry point to core income tax of €16,500, whichcorresponds to 51 per cent of the average wage, as being by far, the highest inthe OECD. The next closest ratio according to Abbas is 27.6 per cent in Italy,with the average for both OECD and English-speaking economies being 9 percent. If USC were included the entry point in Ireland in 2012 would reduce to
518 THE ECONOMIC AND SOCIAL REVIEW
Ireland, 190%
OECD – Average125%
250%
200%
150%
100%
50%
0%
13 These income levels were approximately €54,400 and €21,800 based on an average wage of€32,600 in 2012.
05 O'Connor PP article_ESRI Vol 44-4 16/12/2013 12:08 Page 518

€10,036 which, at just under one-third of the average wage would, remainunusually high.
Against this Ireland has one of the lowest entry points, as a multiple of theaverage wage, to the top marginal tax rates (MTR) in the OECD. Ireland’s topmarginal rate of 52 per cent including SSC, and 48 per cent excluding SSC,begins at the average wage.14 Excluding the four countries that operate a flattax system (Estonia, Czech Republic, Slovakia and Hungary), Ireland in facthas the joint lowest entry point to the top MTR in the OECD.
In short, entry to core income tax in Ireland is relatively high butprogression to the highest marginal rate is relatively swift.
Figure 5: Threshold for Top Marginal Tax Rate as a Multiple of the AverageWage, Single Tax Payers, 2012
Source: OECD (2013a), Taxing Wages 2013.
THE STRUCTURE OF IRELAND’S TAX SYSTEM 519
Table 2: Effective Rates of Taxation, Single Individuals, No Children, 2012
66% of 100% of 166% of Average Wage Average Wage Average Wage
% % %
Income tax (including USC) and SSCIreland 11.5 18.0 31.5OECD average 21.1 25.1 30.5Income tax only (including USC) Ireland 8.7 14.8 28.0OECD average 11.2 15.3 21.3
Source: OECD (2013a), Taxing Wages 2013.
14 The top marginal tax rate commences at €32,800 while the average wage in 2012 was estimatedby the OECD (2013a) in Taxing Wages 2013 as €32,626.
16141210
86420
05 O'Connor PP article_ESRI Vol 44-4 16/12/2013 12:08 Page 519

Finally the role played by the taxation (and benefits) system in achievingredistributive objectives should be acknowledged. For Ireland the Ginicoefficient, which is a measure of income inequality,15 when calculated afteraccounting for taxation and social transfers, is in line with the OECD averagesuggesting less inequality than the average OECD economy.16 However, whenestimated before taxes and transfers – i.e., on the basis of market incomes only – Ireland has one of the highest Gini coefficients in the OECD. Thisillustrates the very significant impact that Ireland’s taxation (and benefits)system currently has in redistributing income.
Figure 6: Gini Coefficient for Market and Disposable Income, 2010
Source: OECD (2013b), Income Distribution Database, 2013.
520 THE ECONOMIC AND SOCIAL REVIEW
0.7
0.6
0.5
0.4
0.3
0.2
0.1
0
0.7
0.6
0.5
0.4
0.3
0.2
0.1
0
Gini coefficient for market income (pre taxes and transfers)
Gini coefficient on disposable income (after taxes and transfers)
15 The Gini coefficient is a number between 0 and 1 representing income distribution in apopulation. Zero being the case where everyone has the same income and one the case where oneindividual has all the income. It is commonly used as a measure of income inequality.16 See OECD (2013b), Income Distribution Database, 2013, see http://www.oecd.org/social/inequality.htm
05 O'Connor PP article_ESRI Vol 44-4 16/12/2013 12:08 Page 520

2.3 Consumption TaxesConsumption taxes which include VAT, excise taxes and other
consumption taxes account for on average 12 per cent of GDP in the EU-27compared with 10 per cent of GDP in Ireland which is the second lowest levelamongst EU Member States after Spain. Using the IFAC hybrid measure orGNP brings the ratio for Ireland to within one percentage point either side of the EU average. As a share of total taxation, Ireland is at the mid-point of the EU Member States at a level equal to the EU average. In terms of VAT (i.e., excluding excise and other consumption taxes), Ireland also has one of the lowest shares of GDP but a share of taxation in line with the EU average.17
Table 3: VAT and Consumption Taxes, 2011
Ireland Ireland’s Rank EU Average% in EU-27 %
Consumption TaxesShare of GDP 10 14 12Share of Taxation 35 26 34
VATShare of GDP 6 26 8Share of Taxation 21 15 22
Source: Taxation Trends in the EU, European Commission (2013).
Thus for both VAT and consumption taxes in general, Ireland appears tohave a low yield as a share of GDP but a share of total taxation in line withthe EU average. This fact was noted by the European Commission (2012)18 inpointing out that the potential exists to shift towards consumption taxes andaway from taxes that are more harmful to growth, a topic that is returned toin Section IV.
For comparison purposes VAT and consumptions taxes are presented as ashare of GDP, GNP and the IFAC hybrid in the cross-country comparison inFigure 7. This shows that using GDP as the relevant tax base Ireland’s shareof consumption taxes is quite low but closer to the EU average using thealternative measures.
THE STRUCTURE OF IRELAND’S TAX SYSTEM 521
17 VAT receipts in Ireland increased in 2012 following an increase in the standard rate from 21 percent to 23 per cent. Whilst data on other EU member states are not publicly available with respectto 2012, Ireland’s VAT as a share of GDP in 2012 remained constant relative to 2011 at 6 per cent.18 See Table 5.8, European Commission (2012).
05 O'Connor PP article_ESRI Vol 44-4 16/12/2013 12:08 Page 521

Figure 7: Consumption Tax and VAT as a Share of GDP, 2011
Source: Taxation Trends in the EU, European Commission (2013) and author’scalculations.
2.4 Corporate Income TaxAs a share of GDP the amount of corporate income tax collected in Ireland
at 2.4 per cent of GDP in 2011 was only marginally behind the EU-27 averageof 2.7 per cent. As a share of total tax revenue Ireland’s outcome of 8.3 per centplaced it eighth highest in the EU and higher than the EU average of 7.5 percent (see Figures 8 and 9 below).
Figure 8: Corporate Income Tax as a Share of GDP, 2011
Source: Taxation Trends in the EU, European Commission (2013) and author’scalculations.
522 THE ECONOMIC AND SOCIAL REVIEW
16.0
14.0
12.0
10.0
8.0
6.0
4.0
2.0
0.0
Consumption Tax VAT
8.0
7.0
6.0
5.0
4.0
3.0
2.0
1.0
0.0
05 O'Connor PP article_ESRI Vol 44-4 16/12/2013 12:08 Page 522

Figure 9: Corporate Income Tax as Percentage of Total Taxation, 2011
Source: Taxation Trends in the EU, European Commission (2013) and author’scalculations.
A link appears to exist between the size of a country’s financial sector, asmeasured by share of value added, and the relative importance of corporationtax, both as a share of GDP and the country’s overall tax base. For instancethe five largest financial sectors relative to the own country gross value addedin 2011 were in Luxembourg, Ireland, Cyprus, the United Kingdom and Malta.These countries also had relatively large corporation tax shares.
2.5 Environmental TaxationUnder the ESA-95 classification, environmental taxes refer to transport
(excluding fuels), energy (including transport fuels) and pollution/resourcestaxes.
As a share of GDP, environmental taxes were about 2.6 per cent in 2011, alevel equivalent to the EU average, and at €4.1 billion equated toapproximately 9 per cent of total taxation, as against the EU average of 7 percent, and represented the sixth highest share of taxation in the EU.
2.6 Property TaxationProperty taxation in Ireland in 2011 was accounted for by a transactional
tax in the form of stamp duty on non-residential and residential property, andtwo recurring charges in the form of a non-principal private residence chargeand commercial rates levied by local governments on commercial premises.
A household charge was introduced on all residential properties in 2012and in 2013 this was replaced by a market value ‘band based’ recurrent tax on
THE STRUCTURE OF IRELAND’S TAX SYSTEM 523
25.0
20.0
15.0
10.0
5.0
0.0
05 O'Connor PP article_ESRI Vol 44-4 16/12/2013 12:08 Page 523

residential property. The non-principal private residence charge will beremoved in 2014 coinciding with the first full year of the recurring tax onresidential property known as the local property tax (LPT).
The 2011 benchmarking data presented in Table 4 below, therefore, relatesto a year in which Ireland did not have a recurring tax on all immovableproperty and with transaction-based taxes at a cyclical low. In any event, as ashare of GDP, Ireland’s property taxes as a whole, (i.e., including thetransactional stamp duty tax) and recurring taxes on immovable property,were in line with the EU average and were above the EU average in terms ofthe share of total taxation.
Table 4: Property Taxes as Share of GDP and Taxation, 2011
Ireland Ireland’s Rank EU Average% in EU-27 %
Property TaxesShare of GDP 1.2 10 1.3Share of Taxation 4.0 8 3.6
Recurring Taxes on Immovable PropertyShare of GDP 0.9 8 0.8Share of Taxation 3.2 6 2.3
Source: Taxation Trends in the EU, European Commission (2013).
While Ireland may have had a high share of property related taxationrelative to other European Union Member States, Abbas (2012) shows that,when compared with other English speaking OECD countries,19 Ireland has acomparatively low level of property taxation, especially for recurrent taxes onimmovable property. With a similar ratio to GDP in 2010 as 2011 (0.9 percent), Ireland compared unfavourably with the average of 3 per cent of GDPfor the group of English speaking economies cited by the author; with theshare of recurrent property taxation in total property taxes of 57 per cent wellbelow the 83 per cent in these economies.
Norregaard (2013) outlines the benefits of higher recurrent propertytaxation on immovable property which include the relatively stable source of
524 THE ECONOMIC AND SOCIAL REVIEW
19 The English speaking countries referred to by Abbas were the United Kingdom, the UnitedStates, Canada, Australia and New Zealand. The author used these countries as a comparatorgroup given the relatively similar share of personal income taxation (including SSC) as a share ofgovernment revenue in Ireland (47 per cent) and average for this group (45 per cent). By way ofcontrast the small European, large European and OECD average for the personal income taxshare in 2011 was 56 per cent, 59 per cent and 53 per cent respectively.
05 O'Connor PP article_ESRI Vol 44-4 16/12/2013 12:08 Page 524

revenue from this source, which is important in small open economies withvolatile tax bases such as Ireland. The volatility and cyclicality of tax bases insmall open economies is particularly relevant for Ireland given that thetransactional nature of Ireland’s property taxes prior to the introduction of thelocal property tax in 2013 has been shown to have been highly cyclical (seeCallan et al., 2010).
III ECONOMIC THEORY OF TAX POLICY AND ECONOMIC GROWTH
Taxation can impact on the economy through microeconomic andmacroeconomic channels. The macroeconomic factors are discussed in greaterdetail below and relate to the drivers of economic growth, labour supply andparticipation, capital formation and total factor productivity. Before this it isworth discussing the microeconomic aspects of taxation through its impacts onindividual incentives and decisions as it is the aggregate impacts of thesedecisions that drive the macroeconomy.20
3.1 Microeconomic Principles of TaxationThe microeconomic principles of taxation relate to the impacts that
taxation can have on individual’s decisions and the ‘deadweight’ losses thatcan arise from distortions to these decisions caused by taxation. Tax systemswith high marginal rates and narrow bases create larger distortions relativeto those with low rates and wide bases.
Estimates for the size of the deadweight loss from income taxation inIreland were computed by Honohon and Irvine (1987). The authors estimateda deadweight loss of 1.73 times the revenue raised in Ireland in the 1980sunder certain assumptions regarding the elasticity of labour supply and thelevels of redistribution of the revenues raised. Whilst the estimates may notbe readily applicable to Ireland’s income tax system today, they are illustrativeof the high social cost of raising revenues with high marginal rates and narrowbases. The lessons from this research have recently been reflected in the workof the Commission on Taxation (2009) which stated in its approach to taxreform that lower tax rates and broader bases were preferable to higher rateson narrow bases.
A key goal for tax design should be to reduce the deadweight cost oftaxation across the system. Taxes disrupt the economic signals that pricessend in market economies by driving a wedge between the price paid by the
THE STRUCTURE OF IRELAND’S TAX SYSTEM 525
20 The foregoing discussion relies heavily on the insights and learnings from Mirrlees Review: Taxby Design of the Institute of Fiscal Studies.
05 O'Connor PP article_ESRI Vol 44-4 16/12/2013 12:08 Page 525

buyer of a good or service and that received by the supplier. Income tax resultsin employers paying more for an hour of work than employees receive, whileconsumption taxes result in retailers receiving less for a product thancustomers pay. By increasing prices and reducing quantities bought and sold,taxes impose a cost on consumers and producers alike. The sum of thesewelfare costs almost always exceeds the revenue that the taxes raise – thedifference is referred to as the deadweight cost of taxation.21
An established framework for considering the impact of taxation on anindividual’s decisions involves analysing the impact of income andsubstitution effects. When a tax is introduced or increased, an individual’safter tax income declines, making them comparatively poorer, and therebyincentivising greater labour supply to maintain the same after tax income.Thus increases in average rates increase incentives. This is referred to as theincome effect. However, at the margin the increased tax reduces the return tolabour which incentivises less labour supply. Thus increases in marginal ratesreduce incentives. This is referred to as the substitution effect as individualsare incentivised to substitute from labour to leisure. The income andsubstitution effects have the opposite impacts on an individual’s incentives,however, most empirical work suggests that the substitution effectdominates.22
Taxing negative externalities can promote welfare by internalising thecosts of the externality into an individual’s decision,23 for example the taxationof social or environmental ‘bads’, such as tobacco, alcohol or carbon. Taxationcan also remedy market failure, such as underinvestment by the private sectorin R&D relative to the socially optimum level.
An optimal tax is one which is neutral to decisions and in the processminimises deadweight effects.24 The principle of neutrality was one of theguiding principles of Ireland’s Commission on Taxation (2009).25 A neutral tax
526 THE ECONOMIC AND SOCIAL REVIEW
21 Two other costs of taxation include compliance and administrative costs.22 See Mirrlees Review, Section 2 the “Economic Approach to Tax Design”.23 An externality represents a cost or benefit from an activity that does not accrue to the individualor organisation carrying out the activity. A negative externality includes costs such as pollution ornoise which have to be borne by others but not those who carried out the activity that created theexternality, while a positive externality may include the benefit to society from R&D investmentsby private companies. Because the costs of a negative externality (or the benefits of a positiveexternality) are not priced in the cost of the action that created the externality, private individualsor organisations will over-produce these costs relative to the socially optimum level (or underproduce in the case of positive externalities).24 As well as requiring that a system be neutral, optimal taxation also requires the system to besimple and stable (see Mirrlees Review, Section 2, the “Economic Approach to Tax Design”, pp. 40-44).25 The other guiding principles of the Commission on Taxation (2009) were equity, flexibility,simplicity, evidence-based approach and pragmatism.
05 O'Connor PP article_ESRI Vol 44-4 16/12/2013 12:08 Page 526

system treats similar activities in similar ways, in other words individual’sdecisions should not be distorted in respect of different forms of consumption,income or savings.26 A neutral system minimises welfare losses arising fromthese distortions.
An individual’s labour supply decisions can be impacted by the non-neutral treatment of earned and non-earned income. A consumer’sexpenditure basket can be distorted by different VAT rates for similar goodsand services. Other examples of a non-neutral system include differentialtaxation of debt and equity and differential taxation of owner occupiedhousing and other assets. In a limited set of circumstances a departure fromneutrality can be a good thing, in particular to remedy a market failure (e.g.,the taxation of environmental or social bads, incentives for businessexpenditure on R&D, lighter taxation of goods which are complementary towork such as childcare costs), or to create incentives for pensions savings.
Optimal tax theory balances efficiency losses against a government’sdesire for redistribution and the need to raise revenue. A progressive systemwill set taxes on earnings at higher rates for higher earners, but higher taxrates impose distortions and disincentives. An income tax system is optimalwhen the gain through redistribution, and raising revenue, exceeds thedeadweight cost from lowering labour incentives.
Optimal taxation does not always support taking distributional effectsinto account when considering taxation on goods and services – e.g., by usingdifferentiated rates. If taxes on earnings are well designed they can do the“heavy lifting” as far as achieving progressivity is concerned. If progressivityis achieved in the income tax system the rest of the system should focus onefficiency.
3.2 The Macroeconomics of Taxation on GrowthBy distorting individual decisions, taxation can impact on economic output
(Y) and growth by affecting any of the three components of output that aredescribed in the production function below, namely human capital (L),physical capital (K) and total factor productivity (A):
Y = F(L, K, A)
THE STRUCTURE OF IRELAND’S TAX SYSTEM 527
26 In this discussion neutrality relates to decisions within a particular activity, e.g., withinconsumption decisions, rather than across activities such as consumption and leisure. Individualswill not be neutral between various forms of consumption if there are differential forms or ratesof consumption tax applied. Of course an individual’s decisions between consumption and leisuremay be distorted even with a common rate of consumption tax as the individual may favour moreor less consumption relative to leisure. Only a single lump sum tax will maintain neutralitybetween consumption and leisure. The author thanks the anonymous referee for valuablecomments in this regard.
05 O'Connor PP article_ESRI Vol 44-4 16/12/2013 12:08 Page 527

The early literature on growth focused only on human and physical capitalwith productivity considered to be exogenous (i.e. determined outside themodel). The key finding from these ‘exogenous’ growth models was that growthoccurs only through the accumulation of capital, which itself is determined bythe level of savings and depreciation in an economy. Additions of capital to afixed supply of labour result in decreasing returns to capital over time and along run limit on the growth in living standards. Chamley (1986) and Judd(1985) showed in the exogenous model the link between capital formation andsavings leads to a long run optimal tax on capital income of zero. Consequentlyall taxation should fall on labour income under these models.27
The drawback of the exogenous growth model is that it ignored the criticaldriver of permanent increases in growth, namely productivity. Endogenousgrowth models allow for sustained growth and explain its sources. Theseendogenous models focus on the drivers of total factor productivity and includeexplicit models of improvements in human capital, learning by doing,innovation, technology transfer.
According to Myles (2009), the common property of endogenous growthmodels are that choices are made by economic agents, these choices lead toproductivity growth and they can be influenced by economic policies such astaxation. This allows the effects of taxation to be traced through the economyand an assessment to be made as to possible impacts on growth. For instancean increase in taxation reduces the returns to investment (in both physicaland human capital) and R&D. Lower returns mean less accumulation ofhuman and physical capital and innovation in terms of productivity, and hencea lower rate of growth.
Taxes that have a smaller negative impact on the economic decisions ofindividuals and firms are less negative for economic growth. The economicliterature and empirical work by the OECD suggests a tax and economicgrowth hierarchy with recurrent taxes on immovable property being the leastdistortive tax instrument in terms of reducing long-run GDP per capita,followed by consumption taxes and other property taxes as well asenvironmentally-related taxes, personal income taxes and corporate incometaxes (see Johansson et al., 2008). Viewed against this hierarchy, recent policychanges such as the elimination of tax expenditures, the raising ofconsumption and other indirect taxes and the introduction of a local propertytax, may be regarded as growth friendly initiatives.
It is useful to think of how the structure of the tax system can impact onGDP per capita in terms of a framework described by the OECD. GDP percapita can be impacted by affecting the amount of hours worked in the
528 THE ECONOMIC AND SOCIAL REVIEW
27 See Myles (2009) for a derivation of this outcome.
05 O'Connor PP article_ESRI Vol 44-4 16/12/2013 12:08 Page 528

economy (labour utilisation), and the amount of output that is produced perhour (labour productivity) or both (see below).
Figure 10: How Taxes Affect the Determinants of Economic Growth
Source: OECD (2010), Tax Policy Reform and Economic Growth, OECD Tax PolicyStudies.
The discussion below considers the impact that individual taxes have onthe determinants of growth. The lessons from this section and those from thestructure of the Irish tax system are brought together later in the paper (seeSection V).
3.2.1 Property TaxesRecurrent taxes on land and buildings have a small adverse effect on
economic performance. This is because these taxes do not affect the decisionsof economic agents to supply labour, to invest in human capital, to produce,invest and innovate to the same extent as some other taxes.
As buildings and land are highly visible and immobile, these taxes aredifficult to evade, and the immovable nature of the tax base may beparticularly appealing at a time when the bases of other taxes becomeincreasingly internationally mobile. For a further discussion see Heady (2009)or Callan et al. (2010).
Norregard (2013) argues that taxation of immovable property is highlyefficient (in terms of collection and the difficulty for individuals to evade),benign on growth and to the extent that property taxes are based on marketvalues are regarded as equitable. However, Norregard also acknowledges their
THE STRUCTURE OF IRELAND’S TAX SYSTEM 529
Labour utilisation
Taxes
Labour productivity
GDP per Capita
• Employment• Hours Worked
• Consumption• Property• Personal Income• Corporation
• Physical capital• Human capital• TFP
05 O'Connor PP article_ESRI Vol 44-4 16/12/2013 12:08 Page 529

unpopularity which relates to their visibility and difficulty in terms ofavoidance.
3.2.2 Consumption TaxesConsumption taxes are neutral with respect to saving as, in the absence of
rate changes, they apply the same rate to current and future consumption.They, therefore, do not affect the supply of funds for investment and physicalcapital formation.
Consumption taxes have a lower impact on labour supply incentives thandirect taxes, for equivalent revenue, as they are paid out of expenditurefinanced by both labour income and non-labour income.
Consumption taxes tend not to be progressive and, therefore, have a lowerimpact on growth per unit of tax revenue than progressive income taxes whichtend to vary with income. However, changes in consumption taxes lower thepurchasing power of real after tax wages and, therefore, impact labour supplyin the same way as labour taxation. Whilst this principle is undoubtedly truein the long term consumption taxes may be less harmful in the short term withevidence from behavioural economics suggesting consumption taxes result inless negative incentives than income taxes even though the impact on theactual household budget would be equivalent.28
3.2.3 Personal Income TaxesPersonal income taxes are seen as more harmful to growth than
consumption taxes. They are generally progressive, with marginal tax ratesthat are higher than their average rates. This means that they discouragegrowth more per unit of tax revenue than consumption taxes which do notvary with income.
Tax progressivity through higher top marginal tax rates affect both labourutilisation and productivity, thus suggesting a non-trivial trade-off betweentax policies that enhance GDP per capita and distributional objectives.29 Inaddition, the tax wedge between labour cost and take-home pay is found tohave a negative effect on the employment rate and thus labour utilisation.30
530 THE ECONOMIC AND SOCIAL REVIEW
28 See Blumkin et al. (2012) .29 Controlling for human capital, the OECD’s growth regressions (OECD, 2010) point towards thesizeable adverse effects of progressive income tax schedules on GDP per capita. Results show thatfor an average OECD country if the marginal tax rate were to decrease by 5 percentage points,thus decreasing the progressivity of income taxes, the estimated increase in GDP per capita in thelong run would be around 1 per cent.30 Nickel (2004) found that a 10 percentage point increase in the tax wedge reduces employmentby around 1 per cent to 3 per cent of the working age population, while OECD (2005) found thata reduction of the tax wedge in an average OECD country would increase the employment rate by3.7 percentage points.
05 O'Connor PP article_ESRI Vol 44-4 16/12/2013 12:08 Page 530

Top marginal statutory rates mainly affect productivity with a negativerelationship between top marginal tax rates and the long run level of totalfactor productivity (TFP).31 By affecting the relative price of labour andcapital, i.e., through non-neutral treatment, high marginal tax rates can leadto inefficient reallocation of inputs, lowering the efficiency of productioninputs, i.e. lowering TFP.32
Hours worked have also been shown in the literature to be modestlyresponsive to labour taxes while labour market participation is much moreresponsive (Heckman 1993; Blundell et al., 1998).
Capital income taxes affect investment and entrepreneurship throughsavings and firms’ financing. Taxes on personal capital income affect privatesavings by reducing their after tax return. As the income from savings aretaxed as well as the income that is generated from those savings, personalincome taxes can discourage savings (and investments) and are seen as moreharmful to savings than consumption taxes which are generally seen asneutral to savings.
3.2.4 Corporate Income TaxesThe OECD research suggests that corporate income taxes are the most
harmful for growth as they discourage the activities of firms that are mostimportant for growth: investment in capital and productivity improvements.Corporate taxation affects the rate of capital accumulation, by reducing theafter tax return on capital investment, and hence GDP per capita.33
As with labour taxes corporate income taxes can distort relative factorprices and result in misallocation of resources, or by reducing the after-taxreturn from innovative activities thus discouraging investment in R&D.Further, by negatively affecting foreign direct investment and the presence ofmultinational companies corporate taxes can hinder technology transfers.34
THE STRUCTURE OF IRELAND’S TAX SYSTEM 531
31 See Box B.2 in OECD (2010).32 Regression results presented in OECD (2010) show top marginal personal income tax rates havea more negative effect on TFP in sectors characterised by high firm entry rates. Employer andemployee SSC have a more negative influence on TFP in industries that are relatively more labourintensive. .33 OECD regressions found that increases in the tax-adjusted user cost of capital are found toreduce investment at the firm level and the effect on firm-level investment is stronger in moreprofitable industries. This is also confirmed in industry level regressions.34 OECD regressions show a link between corporate taxes, R&D incentives and TFP. While earlierOECD work shows an adverse effect of corporate taxes on FDI with a one percentage pointincrease in a country’s corporation tax rate shown to reduce FDI stocks by 1 per cent to 2 per cent(OECD, 2007).
05 O'Connor PP article_ESRI Vol 44-4 16/12/2013 12:08 Page 531

IV GROWTH ORIENTATED TAX POLICY REFORMS
Arising from the theoretical and empirical literature on tax and growth,economists have proposed growth orientated changes in the structure of taxsystems. Such reforms can be described as those that relate to reforms withinone tax type, for instance widening a given base and lowering headline rates,or shifting the tax burden from more harmful taxes such as corporate andpersonal income taxes towards consumption and property taxes (see OECD,2008 and 2010 and EC, 2008, 2010 and 2012).
OECD (2010) presented empirical and theoretical evidence that therecould be gains in terms of long-run GDP per capita from increasing the use ofconsumption and property taxes relative to income taxes without changingoverall tax revenues.35 This shift would have larger impacts on GDP per capitaif it was in the form of cuts in marginal personal income tax rates rather thanincreases in thresholds (although the latter would be more effective atreducing inequality).
4.1 Shifts from Income to Consumption TaxesConsumption taxes are less harmful to growth as, relative to personal
income taxes, they have a neutral impact on savings and investment. In thelong-run a revenue-neutral shift from personal income to VAT/consumptiontaxes may not have much effect on the average total taxes paid by a typicalemployee as the impact on their real net wages are equivalent, althoughrecent research in the field of behavioural economics has challenged this view.
Since personal income taxes are generally more progressive thanconsumption taxes this reform would reduce the marginal tax rate of a typicalworker and thereby increase labour supply incentives through a positivesubstitution effect. Whilst this may promote economic growth it would do so atthe expense of making the tax system less progressive. If transfer paymentsare not index-linked, there could be positive labour supply impacts,36 althoughthis would cause a worsening in poverty and equality outcomes.
A shift towards consumption taxes does not imply an increase in the toprate of VAT as the shift could be achieved by raising or eliminating reducedVAT rates.37 Reduced rates on consumption taxes are an inefficient way ofreducing income inequality and promoting progressivity.38 Higher income
532 THE ECONOMIC AND SOCIAL REVIEW
35 See Annex B OECD (2010).36 European Commission (2008).37 It is worth noting that a common rate of VAT applying to all of consumption may allow for asubstantially lower rate than today’s standard rate of 23 per cent as items at the lower rates arerelatively more price elastic than those at the standard rate.38 See Mirrlees Review, OECD (2010), European Commission (2008, 2012).
05 O'Connor PP article_ESRI Vol 44-4 16/12/2013 12:08 Page 532

households consume relatively more of lower taxed goods and therebydisproportionately benefit from reduced rate goods. The deadweight costs ofusing consumption taxes to achieve equality and redistributive objectives aretherefore quite high.39
It is because of this deadweight cost that the income tax and benefitssystem is the appropriate place to target redistributive objectives. Bybroadening the VAT base through eliminating or reducing the level of reducedVAT rates, scope would exist to better target expenditure measures to thosewho need them, whilst also allowing for a reduction in the headline rate. Forexample, the Mirrless Review estimated that the UK could eliminate mostreduced and zero-rate VAT while compensating every household through thetax and benefits system to leave them as well off as they were before whilstraising an additional £3 billion for the exchequer.40
4.2 Shifts from Income to Property TaxesA shift towards taxes on property appears to be even better for growth
than a shift towards consumption taxes as it would not impact on laboursupply decisions and would have the advantage of being highly efficient and,in the case of market value based property taxes, equitable (Norregaard,2013). The OECD (2010) cite an additional benefit of increasing taxation onimmovable property as shifting some investment out of housing into higherreturn investments and so increase the rate of growth.
Despite the relative gains of a property tax based shift, OECD (2010) notethat the scope for switching revenue to recurrent taxes on immovable propertyis limited because these taxes are particularly unpopular. This latter point isacknowledged by Norregaard (2013) who attributes their unpopularity to theirtransparency and the relatively limited scope for tax avoidance and evasion.
V OPTIONS FOR IRELAND
As described in Section II the burden of labour taxation is only low whenGDP is used as the tax base and when SSC are included in the comparison.Excluding SSC or using an alternative base to account for the economicstructure of Ireland shows the burden on labour to be relatively high.
THE STRUCTURE OF IRELAND’S TAX SYSTEM 533
39 An exception to the argument in respect of reduced VAT rates can apply to goods that arecomplements and substitutes to labour. Differentiated consumption taxes can encourage work ifgoods and services that are complementary to work – e.g. transport and childcare – are taxed ata lower rate than those that are substitutes to work – e.g. leisure activities.40 See “Broadening the VAT Base”, Mirrlees Review: Tax by Design, Institute of Fiscal Studies(2011) UK.
05 O'Connor PP article_ESRI Vol 44-4 16/12/2013 12:08 Page 533

The burden on consumption is, however, low in a European context and theburden on immovable property is low relative to English speaking OECDcountries.
Within labour taxation the entry point to core income tax, is relativelyhigh. Effective rates of tax are also low relative to the OECD at income levelsbelow the average wage. While the marginal rate in Ireland may not be anoutlier in an OECD context, the entry point to the top marginal rate is thelowest for progressive income tax systems. Ireland is also an outlier in termsof the progressivity of its income tax system. Estimates included in OECD(2010) point to adverse effects of highly progressive income tax schedules onGDP per capita through both lower labour utilisation and lower productivitypartly reflecting lesser incentives to invest in higher education.
The theory and structure would, therefore, suggest that there may begains for Ireland by reducing the burden of taxation on labour, and thestrongest impacts would be from changes in marginal rates through positivesubstitu tion effects. Such a reform may involve moving the entry point to thetop marginal rate away from the average wage, thereby incentivising greaterlabour supply through positive substitution effects, or from reducing the topmarginal tax rate. The options for reform could be achieved by a revenueneutral shift towards consumption or property tax.
5.1 Simulating Tax Shifts Reforms in the structure of the taxation system through revenue neutral
shifts from labour to consumption or property have been simulated in theliterature to raise the rate of growth in an economy. For instance Myles (2009)concludes from a review of the literature of tax reforms on growth that “… almost all the results support the claim that a move from income taxationto consumption taxation will raise the rate of growth”. The results of recentsimulations of tax shifts for Ireland are now discussed.
The effects of taxes on GDP have been simulated using the European Commission’s Quest III Model.41 QUEST III is a New-KeynesianDynamic Stochastic General Equilibrium (DSGE) model used by theCommission’s staff in policy analysis.42 It has previously been used by the
534 THE ECONOMIC AND SOCIAL REVIEW
41 See European Commission (2008).42 The key features of the model are: a fraction of households are liquidity constrained; prices andwages adjust with lags; monetary policy is determined using a Taylor Rule; and, debt is stabilisedby means of a gradual adjustment in labour taxes. The model uses region specific estimatedparameters for the Euro Area and the US, as well as calibrated parameters for the rest of theworld. Individual countries are distinguished from the rest of the Euro Area only by usingcountry-specific information on their size, their degree of openness, their bilateral trade linkagesas well as their employment, tradable sector and government shares. There are no country specific
05 O'Connor PP article_ESRI Vol 44-4 16/12/2013 12:08 Page 534

Department of Finance in the context of an analysis of the impacts ofstructural reforms.43
The Commission’s simulations use three baseline scenarios, a coordinatedtax shift from labour to consumption for the whole Euro Area, a unilateral taxshift by a large Member State (Germany) and, a tax shift by a small MemberState (Ireland). Each of the models confirm that the tax shift would have apositive impact on GDP and employment. In the short run the gains are largerfor a unilateral shift due to competitiveness effects. The simulations aredesigned to be revenue neutral.
The results for Ireland which are described in detail in EuropeanCommission (2008) are summarised below. The model assumes that benefitsand transfers are index linked. The shift results in an increase in GDP andemployment of 0.2 per cent and 0.25 per cent five years after the reform.
Table 5: Results From QUEST III Model of a 1 Per Cent of GDP Shift fromIncome Tax to Consumption Tax
Years After Year 1 Year 2 Year 3 Year 4 Year 5 Year 10 Year 20Reform
GDP 0.12 0.17 0.19 0.2 0.2 0.2 0.19Employment 0.14 0.22 0.24 0.25 0.25 0.23 0.21
Source: European Commission.
As a check against the outputs from the QUEST III simulations, whichmay not be perfectly calibrated for the Irish economy, the results of an existingstructural model of the Irish economy are used.44 The HERMES model wasfirst estimated in the 1980s and is described in Bradley et al. (1993) and themost recent specification of the model is described in Bergin et al. (2013). Themodel is based on a detailed empirical literature on the behaviour of the Irisheconomy. In respect of a ‘tax shift’ the key features of the Irish economy relateto why the incidence of taxation differs between direct, indirect and propertytaxes.
THE STRUCTURE OF IRELAND’S TAX SYSTEM 535
_________42 (contd.) behavioural estimates for individual countries, but the estimates obtained for the EuroArea are imposed. For a detailed description see Ratto, M., W. Roeger, Veld, Jan. 2008. “QUESTIII: An Estimated Open-Economy DSGE Model of the Euro Area with Fiscal and Monetary Policy”,Economic Papers 335.43 See Department of Finance (2011).44 The author would like to thank John FitzGerald for undertaking the reported simulations.
05 O'Connor PP article_ESRI Vol 44-4 16/12/2013 12:08 Page 535

As described in Bergin et al. (2013), HERMES models the wage settingmechanism as a bargaining process between firms and workers over the realafter tax wage. Irish manufacturing output prices are assumed to bedetermined primarily in the world market place and as such cannot easily bealtered to respond to Irish cost conditions. In other words, Irish firms tradinginternationally tend to be price takers. Labour supply is assumed to be elasticwith labour demand relatively inelastic such that in the medium term theincidence of labour taxation falls mainly on employers rather thanemployees.45 As Irish exporters do not have the ability to pass on higher inputcosts on the world market the medium term impact of higher labour taxes is aloss of competitiveness for Irish firms with a consequent fall in output andemployment.
While the medium term impact of an increase in indirect taxes for workersis assumed to be equivalent to an increase in direct taxes, indirect taxes affecta wider population than direct taxes, such that some of the incidence remainswith the household sector with a lower consequent impact on competitiveness.The incidence of property taxes falls entirely on the household sector as theability of workers to avoid the tax by reducing labour supply is limited.
The first set of results presented below simulate a €1 billion increase inrevenue from property taxes offset by a cut in income tax sufficient to keep thegeneral government deficit unchanged each year. The results from HERMESare symmetric and linear and as such the results can be scaled up or down toreflect a greater or lesser shift than that modelled. Transfer payments are notindex-linked in the HERMES simulation results presented herein but themodel does allow for indexation.
Because property tax has a much more limited impact on the labourmarket than personal taxation the net effect of the change is to raise thegrowth rate and reduce the unemployment rate. The results indicate 0.32 percent increase in the GDP, a 0.43 per cent increase in employment and a 0.14per cent reduction in unemployment after 5 years.
Table 6: Results from HERMES Model of a €1 Billion Shift from Income Taxto Property Tax
Years After Reform Year 1 Year 2 Year 3 Year 4 Year 5
GDP (%) 0.00 0.16 0.26 0.32 0.32Employment (%) 0.00 0.11 0.26 0.41 0.43Unemployment rate (change) 0.00 –0.07 –0.08 –0.12 –0.14
536 THE ECONOMIC AND SOCIAL REVIEW
45 For a discussion on the elasticity of labour supply in Ireland see Honohon (1992).
05 O'Connor PP article_ESRI Vol 44-4 16/12/2013 12:08 Page 536
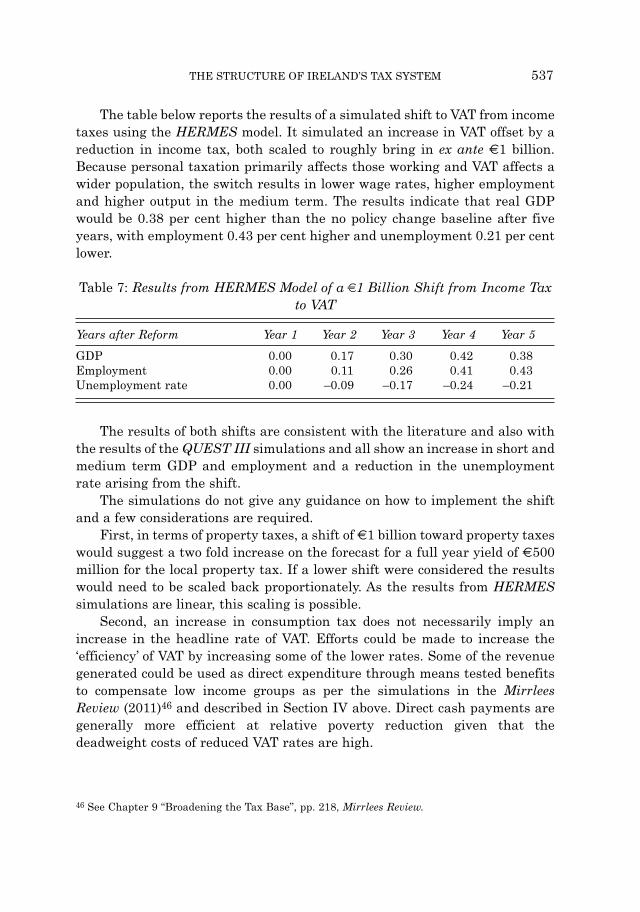
The table below reports the results of a simulated shift to VAT from incometaxes using the HERMES model. It simulated an increase in VAT offset by areduction in income tax, both scaled to roughly bring in ex ante €1 billion.Because personal taxation primarily affects those working and VAT affects awider population, the switch results in lower wage rates, higher employmentand higher output in the medium term. The results indicate that real GDPwould be 0.38 per cent higher than the no policy change baseline after fiveyears, with employment 0.43 per cent higher and unemployment 0.21 per centlower.
Table 7: Results from HERMES Model of a €1 Billion Shift from Income Taxto VAT
Years after Reform Year 1 Year 2 Year 3 Year 4 Year 5
GDP 0.00 0.17 0.30 0.42 0.38Employment 0.00 0.11 0.26 0.41 0.43Unemployment rate 0.00 –0.09 –0.17 –0.24 –0.21
The results of both shifts are consistent with the literature and also withthe results of the QUEST III simulations and all show an increase in short andmedium term GDP and employment and a reduction in the unemploymentrate arising from the shift.
The simulations do not give any guidance on how to implement the shiftand a few considerations are required.
First, in terms of property taxes, a shift of €1 billion toward property taxeswould suggest a two fold increase on the forecast for a full year yield of €500million for the local property tax. If a lower shift were considered the resultswould need to be scaled back proportionately. As the results from HERMESsimulations are linear, this scaling is possible.
Second, an increase in consumption tax does not necessarily imply anincrease in the headline rate of VAT. Efforts could be made to increase the‘efficiency’ of VAT by increasing some of the lower rates. Some of the revenuegenerated could be used as direct expenditure through means tested benefitsto compensate low income groups as per the simulations in the MirrleesReview (2011)46 and described in Section IV above. Direct cash payments aregenerally more efficient at relative poverty reduction given that thedeadweight costs of reduced VAT rates are high.
THE STRUCTURE OF IRELAND’S TAX SYSTEM 537
46 See Chapter 9 “Broadening the Tax Base”, pp. 218, Mirrlees Review.
05 O'Connor PP article_ESRI Vol 44-4 16/12/2013 12:08 Page 537

VI FINAL THOUGHTS
Ireland’s capacity to increase its tax burden very much depends on whatone views as the appropriate measure of economic output for the purposes oftaxation taking into account the structure of the economy and the size of theforeign-owned sector. In terms of tax take as a share of total activity, Irelandis not an outlier when one uses GNP or the IFAC hybrid measure of output. Interms of share of GDP the Irish tax system mainly differs from the EU averagein terms of SSC. Adjusting for SSC, the burden of taxation in terms of totalrevenues and labour taxation is in line with the EU average. In overall terms,when allowance is made for some specific features of the Irish economy andthe nature of its social security system, the size and broad distribution of thetax burden across tax types in Ireland is not greatly out of line with that ofother EU states.
In GDP terms, taxation of consumption is below the EU average. Thissuggests that there may be some scope to use consumption taxes to reduce theburden on labour. Relative to other OECD economies with a similar relianceas Ireland on personal income taxes as a share of overall governmentrevenues, Ireland has a comparatively low level of property taxation,especially for recurrent taxes on immovable property.
The paper identified aspects of the Irish taxation system that may beharmful to growth, in particular the low entry point to the top marginal taxrate, and identified possible scope for growth enhancing reform. The reformsinvolve reductions in the burden of labour taxation either through basebroadening within labour taxation or through a shift from consumption toproperty taxation. Given the constraints faced by the exchequer the reformsare presented in a revenue neutral basis. Results from macrosimulationmodels show positive GDP and employment gains for Ireland.
The objective of this paper is to contribute towards the discussion of taxpolicy in the context of economic growth. Of course economic growth is not theonly consideration when it comes to tax policy. The achievement of redistribu -tive outcomes is also of importance to policymakers. In that regard the tax andbenefits system have achieved a significant reduction in inequality asmeasured by the Gini coefficient for disposable income.
Whilst this paper focuses mostly on changes to the structure of the taxsystem motivated by economic growth objectives, it does acknowledge thehighly progressive nature of Ireland’s income tax system with the burden oflabour taxation falling to a considerable extent on higher income tax payerswhile low earners benefit from unusually low effective rates in aninternational context. Finally, it should be acknowledged that a trade-offexists between progressivity and economic growth.
538 THE ECONOMIC AND SOCIAL REVIEW
05 O'Connor PP article_ESRI Vol 44-4 16/12/2013 12:08 Page 538

REFERENCES
ABBAS, S. M. A., 2012. “Medium-Term Fiscal Consolidation In Ireland: Growth-Friendly, Targeted, Sustainable”, Ireland, Selected Issues, International MonetaryFund.
ARNOLD, J., 2008. “Do Tax Structures Affect Aggregate Economic Growth?: EmpiricalEvidence from a Panel of OECD Countries”, OECD Economics DepartmentWorking Papers, OECD Publishing, No. 643.
ATKINSON A. B. and J. E. STIGLITZ, 1980. Lectures on Public Economics, New York:McGraw Hill.
BERGIN A., T. CONEFREY, J. FITZGERALD, I. KEARNEY and N. ŽNUDERL, 2013.“The HERMES-13 Macroeconomic Model of the Irish Economy”, ESRI WorkingPaper No. 460, July, Dublin: Economic and Social Research Institute.
BLUMKIN, T., B. J. RUFFLE and Y. GANUN, 2012. “Are Income and ConsumptionTaxes Ever Really Equivalent? Evidence from a Real-Effort Experiment with RealGoods”, European Economic Review, Elsevier, Vol. 56, No. 6, pp. 1200-1219.
BLUNDELL, R., A. DUNCAN and C. MEGHIR, 1998. “Estimating Labor SupplyResponses Using Tax Reforms”, Econometrica, Vol. 66.
BRADLEY, J., J. FITZGERALD, D. HURLEY, L. O’SULLIVAN and A. STOREY, 1993.“HERMES: A Macrosectoral Model for the Irish Economy”, in Commission of theEuropean Communities (ed.), HERMES: Harmonised Econometric Research forModelling Economic Systems, North Holland.
CALLAN, T. and M. SAVAGE, 2013. “Tax and Taxable Capacity: Ireland inComparative Perspective”, ESRI Research Note 2012/4/1, Dublin: Economic andSocial Research Institute.
CALLAN T., C. KEANE and J. WALSH, 2010. “What Role for Property Taxes inIreland”, The Economic and Social Review, Vol 41, No. 1, Spring, pp. 89-90.
CHAMLEY, C., 1986. “Optimal Taxation of Capital Income in General Equilibriumwith Infinite Lives”, Econometrica, Vol. 54, pp. 607-622.
COMMISSION ON TAXATION, 2009. Report of the Commission on Taxation, Dublin:Stationery Office.
DEPARTMENT OF FINANCE, 2011. Stability Programme Update, 2011, Dublin:Government Publications.
EUROPEAN COMMISSION, 2008. Public Finances in EMU, 2008.EUROPEAN COMMISSION, 2010. Public Finances in EMU, 2010.EUROPEAN COMMISSION, 2012. Tax Reforms in EU Member States, Tax Policy
Challenges for Economic Growth and Fiscal Sustainability, 2012 Report.EUROPEAN COMMISSION, 2013. Taxation Trends in the European Union, 2013.FITZGERALD, J., 2013. “The Effect of Re-domiciled Plcs on Irish Output Measures and
the Balance of Payments”, ESRI Research Note 2013/1/2, Dublin: Economic andSocial Research Institute.
HEADY, C., 2009. “Property Taxes: a Review of International Experience”, Foundationfor Fiscal Studies Annual Conference on ‘The Fiscal Treatment of Property’.
HECKMAN, J., 1993. “What Has Been Learned About Labor Supply in the PastTwenty Years?”, American Economic Association Papers and Proceedings, Vol. 83,No. 2, May, pp. 116-121.
HONOHAN, P., 1992. “The Link Between Irish and UK Unemployment”, QuarterlyEconomic Commentary, Spring, pp. 33-44.
THE STRUCTURE OF IRELAND’S TAX SYSTEM 539
05 O'Connor PP article_ESRI Vol 44-4 16/12/2013 12:08 Page 539

HONOHON P. and I. IRVINE, 1987. “The Marginal Social Cost of Taxation in Ireland”,The Economic and Social Review, Vol 19, No 1, October, pp. 15-41.
IRISH FISCAL ADVISORY COUNCIL, 2012, Fiscal Assessment Report, September,Dublin: Irish Fiscal Advisory Council.
JOHANSSON A., C. HEADY, J. ARNOLD, B. BRYS, L. VARTIA, 2008. “Taxation andEconomic Growth”, OECD Economics Department Working Papers, No. 620,OECD Publishing.
JUDD, K., 1985. “Redistributive Taxation in a Simple Perfect Foresight Model”,Journal of Public Economics, Vol. 28, pp. 59-83.
MCCARTHY, C., 2004. “Volatility in Irish Quarterly Macroeconomic Data”, QuarterlyEconomic Commentary, Dublin: Economic and Social Research Institute.
MCCARTHY, C., 2010. “Fiscal Adjustment and Macroeconomic Re-balancing inIreland” Dublin: Journal of the Statistical and Social Inquiry Society of Ireland,Vol.XXXIX, pp. 70-78.
MIRRLEES J., S. ADAM, T. BESLEY, R. BLUNDELL, S. BOND, R. CHOTE, M.GAMMIE, P. JOHNSON, G. MYLES and J. POTERBA, 2011. Tax by Design: TheMirrlees Review, Oxford University Press, September.
MYLES, G. D., 2009. “Economic Growth and the Role of Taxation-Theory”, OECDEconomics Department Working Papers, No. 713, OECD Publishing.
NICKELL, S., 2004. “Employment and Taxes”, CEP Discussion Paper, No. 634.NORREGARD, J., 2013. “Taxing Immovable Property: Revenue Potential and
Implementa tion Challenges”, IMF Working Paper, WP/13/129.ORGANISATION FOR ECONOMIC COOPERATION AND DEVELOPMENT (OECD),
2005. OECD Jobs Strategy: Lessons from a Decade’s Experience, Main Report,ECO/CPE/WP1(2006)1, OECD Publishing.
ORGANISATION FOR ECONOMIC COOPERATION AND DEVELOPMENT (OECD),2007. Tax Effects on Foreign Direct Investment: Recent Evidence and PolicyAnalysis, OECD Tax Policy Studies, No. 17, OECD Publishing.
ORGANISATION FOR ECONOMIC COOPERATION AND DEVELOPMENT (OECD),2010. Tax Policy Reform and Economic Growth, OECD Tax Policy Studies, OECDPublishing.
ORGANISATION FOR ECONOMIC COOPERATION AND DEVELOPMENT (OECD),2013a. Taxing Wages, 2013, OECD Publishing.
ORGANISATION FOR ECONOMIC COOPERATION AND DEVELOPMENT (OECD),2013b. Income Distribution Database, 2013, OECD Publishing.
PRESCOTT, E. C., 2004. “Why Do Americans Work So Much More Than Europeans?”,Quarterly Review, Federal Reserve Bank of Minneapolis, July, pp. 2-13.
540 THE ECONOMIC AND SOCIAL REVIEW
05 O'Connor PP article_ESRI Vol 44-4 16/12/2013 12:08 Page 540


