Embed Size (px)
Citation preview
Oracle® Communications
Policy Management SNMP User's Guide
Release 12.5 E94227-01
December 2018

Policy Management SNMP User's Guide, Release 12.5
E94227-01
Copyright © 2011, 2018, Oracle and/or its affiliates. All rights reserved.
This software and related documentation are provided under a license agreement containing restrictions onuse and disclosure and are protected by intellectual property laws. Except as expressly permitted in yourlicense agreement or allowed by law, you may not use, copy, reproduce, translate, broadcast, modify, license,transmit, distribute, exhibit, perform, publish, or display any part, in any form, or by any means. Reverseengineering, disassembly, or decompilation of this software, unless required by law for interoperability, isprohibited.
The information contained herein is subject to change without notice and is not warranted to be error-free. Ifyou find any errors, please report them to us in writing.
If this is software or related documentation that is delivered to the U.S. Government or anyone licensing it onbehalf of the U.S. Government, then the following notice is applicable:
U.S. GOVERNMENT END USERS: Oracle programs, including any operating system, integrated software,any programs installed on the hardware, and/or documentation, delivered to U.S. Government end users are"commercial computer software" pursuant to the applicable Federal Acquisition Regulation and agency-specific supplemental regulations. As such, use, duplication, disclosure, modification, and adaptation of theprograms, including any operating system, integrated software, any programs installed on the hardware,and/or documentation, shall be subject to license terms and license restrictions applicable to the programs.No other rights are granted to the U.S. Government.
This software or hardware is developed for general use in a variety of information management applications.It is not developed or intended for use in any inherently dangerous applications, including applications thatmay create a risk of personal injury. If you use this software or hardware in dangerous applications, then youshall be responsible to take all appropriate fail-safe, backup, redundancy, and other measures to ensure itssafe use. Oracle Corporation and its affiliates disclaim any liability for any damages caused by use of thissoftware or hardware in dangerous applications.
Oracle and Java are registered trademarks of Oracle and/or its affiliates. Other names may be trademarks oftheir respective owners.
Intel and Intel Xeon are trademarks or registered trademarks of Intel Corporation. All SPARC trademarks areused under license and are trademarks or registered trademarks of SPARC International, Inc. AMD, Opteron,the AMD logo, and the AMD Opteron logo are trademarks or registered trademarks of Advanced MicroDevices. UNIX is a registered trademark of The Open Group.
This software or hardware and documentation may provide access to or information about content, products,and services from third parties. Oracle Corporation and its affiliates are not responsible for and expresslydisclaim all warranties of any kind with respect to third-party content, products, and services unlessotherwise set forth in an applicable agreement between you and Oracle. Oracle Corporation and its affiliateswill not be responsible for any loss, costs, or damages incurred due to your access to or use of third-partycontent, products, or services, except as set forth in an applicable agreement between you and Oracle.
This documentation is in preproduction status and is intended for demonstration and preliminary use only. Itmay not be specific to the hardware on which you are using the software. Oracle Corporation and its affiliatesare not responsible for and expressly disclaim all warranties of any kind with respect to this documentationand will not be responsible for any loss, costs, or damages incurred due to the use of this documentation.
Contents
About This Guide.......................................................................................................................................... xiii
Scope and Audience .................................................................................................................................. xiii
How This Guide is Organized ................................................................................................................. xiii
Related Publications .................................................................................................................................. xiii
Locate Product Documentation on the Oracle Help Center Site ........................................................ xiii
Customer Training..................................................................................................................................... xiv
My Oracle Support .................................................................................................................................... xiv
Emergency Response................................................................................................................................. xiv
1 Overview
Simple Network Management Protocol ................................................................................................ 1-1
The SNMP Standard................................................................................................................................. 1-1
SNMP Message Types...................................................................................................................... 1-2
Standard Managed Objects ............................................................................................................. 1-2
2 Configuring SNMP
About SNMP Configuration ................................................................................................................... 2-1
SNMP Versions ................................................................................................................................. 2-2
Configuring SNMP Settings.................................................................................................................... 2-3
3 Supported MIBs
Supported MIBs ........................................................................................................................................ 3-1
SNMP MIB Objects........................................................................................................................... 3-1
MIB Object Access Values ............................................................................................................... 3-2
Compiling MIB Objects ................................................................................................................... 3-2
4 Support for Traps
Alarms Overview...................................................................................................................................... 4-1
Alarms formatting information...................................................................................................... 4-2
Alarm and Event Severity Levels................................................................................................... 4-4
Platform (31000-32800)............................................................................................................................. 4-5
31000 - S/W fault.............................................................................................................................. 4-5
iii
31001 - S/W status............................................................................................................................ 4-5
31002 - Process watchdog failure ................................................................................................... 4-6
31003 - Tab thread watchdog failure.............................................................................................. 4-6
31004 - Test Status............................................................................................................................. 4-7
31005 - Test Fault .............................................................................................................................. 4-7
31100 - Database replication fault .................................................................................................. 4-7
31101 - Database replication to slave failure................................................................................. 4-8
31102 - Database replication from master failure......................................................................... 4-9
31103 - DB Replication update fault ............................................................................................ 4-10
31104 - DB Replication latency over threshold........................................................................... 4-10
31105 - Database merge fault ........................................................................................................ 4-11
31106 - Database merge to parent failure .................................................................................... 4-11
31107 - Database merge from child failure.................................................................................. 4-12
31108 - Database merge latency over threshold......................................................................... 4-13
31109 - Topology config error ....................................................................................................... 4-13
31110 - Database audit fault .......................................................................................................... 4-14
31111 - Database merge audit in progress ................................................................................... 4-14
31112 - DB replication update log transfer timed out................................................................ 4-15
31113 - DB replication manually disabled................................................................................... 4-15
31114 - DB replication over SOAP has failed.............................................................................. 4-16
31115 - Database service fault ....................................................................................................... 4-16
31116 - Excessive shared memory ................................................................................................ 4-17
31117 - Low disk free...................................................................................................................... 4-18
31118 - Database disk store fault .................................................................................................. 4-18
31119 - Database updatelog overrun............................................................................................ 4-19
31120 - Database updatelog write fault ....................................................................................... 4-19
31121 - Low disk free early warning............................................................................................ 4-20
31122 - Excessive shared memory early warning ...................................................................... 4-21
31123 - Database replication audit command complete ........................................................... 4-21
31124 - ADIC error.......................................................................................................................... 4-22
31125 - Database durability degraded......................................................................................... 4-22
31126 - Audit blocked .................................................................................................................... 4-23
31127 - DB Replication Audit Complete ..................................................................................... 4-23
31128 - ADIC Found Error............................................................................................................. 4-24
31129 - ADIC Found Minor Issue................................................................................................. 4-24
31130 - Network health warning.................................................................................................. 4-25
31131 - DB Ousted Throttle Behind.............................................................................................. 4-25
31132 - DB Replication Precedence Relaxed ............................................................................... 4-26
31133 - DB Replication Switchover Exceeds Threshold............................................................ 4-27
31134 - DB Site Replication To Slave Failure............................................................................... 4-27
31135 - DB Site Replication From Master Failure....................................................................... 4-28
31136 - DB Site Replication Precedence Relaxed........................................................................ 4-28
31137 - DB Site Replication Latency Over Threshold................................................................ 4-29
iv
31140 - Database perl fault ............................................................................................................ 4-29
31145 - Database SQL fault............................................................................................................ 4-30
31146 - DB mastership fault .......................................................................................................... 4-30
31147 - DB upsynclog overrun...................................................................................................... 4-31
31148 - DB lock error detected ...................................................................................................... 4-32
31149 - DB Late Write Nonactive.................................................................................................. 4-32
31200 - Process management fault ............................................................................................... 4-33
31201 - Process not running .......................................................................................................... 4-33
31202 - Unkillable zombie process ............................................................................................... 4-34
31206 - Process mgmt monitoring fault....................................................................................... 4-34
31207 - Process resource monitoring fault .................................................................................. 4-35
31208 - IP port server fault ............................................................................................................ 4-36
31209 - Hostname lookup failed................................................................................................... 4-36
31213 - Process scheduler fault ..................................................................................................... 4-37
31214 - Scheduled process fault.................................................................................................... 4-37
31215 - Process resources exceeded ............................................................................................. 4-38
31216 - SysMetric configuration error ......................................................................................... 4-38
31217 - Network Health Warning ................................................................................................ 4-39
31220 - HA configuration monitor fault...................................................................................... 4-39
31221 - HA alarm monitor fault ................................................................................................... 4-40
31222 - HA not configured ............................................................................................................ 4-40
31223 - HA Heartbeat transmit failure ........................................................................................ 4-41
31224 - HA configuration error .................................................................................................... 4-42
31225 - HA service start failure .................................................................................................... 4-42
31226 - HA availability status degraded..................................................................................... 4-43
31227 - HA availability status failed............................................................................................ 4-43
31228 - HA standby offline............................................................................................................ 4-44
31229 - HA score changed ............................................................................................................. 4-44
31230 - Recent alarm processing fault ......................................................................................... 4-45
31231 - Platform alarm agent fault............................................................................................... 4-46
31232 - Late heartbeat warning .................................................................................................... 4-46
31233 - HA Path Down .................................................................................................................. 4-47
31234 - Untrusted Time Upon Initialization .............................................................................. 4-47
31235 - Untrusted Time After Initialization ............................................................................... 4-48
31236 - HA Link Down .................................................................................................................. 4-49
31240 - Measurements collection fault ........................................................................................ 4-49
31250 - RE port mapping fault...................................................................................................... 4-50
31260 - SNMP Agent ...................................................................................................................... 4-50
31261 - SNMP Configuration Error.............................................................................................. 4-51
31270 - Logging output.................................................................................................................. 4-51
31280 - HA Active to Standby transition .................................................................................... 4-52
31281 - HA Standby to Active transition .................................................................................... 4-53
31282 - HA Management Fault..................................................................................................... 4-53
v

31283 - Lost Communication with server ................................................................................... 4-54
31284 - HA Remote Subscriber Heartbeat Warning .................................................................. 4-54
31285 - HA Node Join Recovery Entry........................................................................................ 4-55
31286 - HA Node Join Recovery Plan.......................................................................................... 4-55
31287 - HA Node Join Recovery Complete ................................................................................ 4-56
31288 - HA Site Configuration Error ........................................................................................... 4-56
31290 - HA Process Status ............................................................................................................. 4-57
31291 - HA Election Status ............................................................................................................ 4-57
31292 - HA Policy Status ............................................................................................................... 4-58
31293 - HA Resource Link Status ................................................................................................. 4-58
31294 - HA Resource Status .......................................................................................................... 4-59
31295 - HA Action Status .............................................................................................................. 4-60
31296 - HA Monitor Status............................................................................................................ 4-60
31297 - HA Resource Agent Info .................................................................................................. 4-61
31298 - HA Resource Agent Detail............................................................................................... 4-61
31299 - HA Notification Status ..................................................................................................... 4-62
31300 - HA Control Status............................................................................................................. 4-62
31301 - HA Topology Events......................................................................................................... 4-63
31322 - HA Configuration Error................................................................................................... 4-63
32100 - Breaker Panel Feed Unavailable ..................................................................................... 4-64
32101 - Breaker Panel Breaker Failure ......................................................................................... 4-64
32102 - Breaker Panel Monitoring Failure................................................................................... 4-65
32103 - Power Feed Unavailable .................................................................................................. 4-65
32104 - Power Supply 1 Failure .................................................................................................... 4-65
32105 - Power Supply 2 Failure .................................................................................................... 4-66
32106 - Power Supply 3 Failure .................................................................................................... 4-66
32107 - Raid Feed Unavailable ..................................................................................................... 4-67
32108 - Raid Power 1 Failure ........................................................................................................ 4-67
32109 - Raid Power 2 Failure ........................................................................................................ 4-68
32110 - Raid Power 3 Failure......................................................................................................... 4-68
32111 - Device Failure .................................................................................................................... 4-69
32112 - Device Interface Failure.................................................................................................... 4-69
32113 - Uncorrectable ECC memory error .................................................................................. 4-70
32114 - SNMP get failure ............................................................................................................... 4-70
32115 - TPD NTP Daemon Not Synchronized Failure .............................................................. 4-71
32116 - TPD Server's Time Has Gone Backwards ...................................................................... 4-72
32117 - TPD NTP Offset Check Failure........................................................................................ 4-74
32300 - Server fan failure ............................................................................................................... 4-75
32301 - Server internal disk error ................................................................................................. 4-76
32303 - Server Platform error ........................................................................................................ 4-76
32304 - Server file system error..................................................................................................... 4-77
32305 - Server Platform process error.......................................................................................... 4-78
32306 - Server RAM shortage error.............................................................................................. 4-79
vi
32307 - Server swap space shortage failure ................................................................................ 4-79
32308 - Server provisioning network error ................................................................................. 4-80
32309 - Eagle Network A Error..................................................................................................... 4-81
32310 - Eagle Network B Error ..................................................................................................... 4-81
32311 - Sync Network Error .......................................................................................................... 4-82
32312 - Server disk space shortage error..................................................................................... 4-82
32313 - Server default route network error................................................................................. 4-83
32314 - Server temperature error.................................................................................................. 4-84
32315 - Server mainboard voltage error ...................................................................................... 4-85
32316 - Server power feed error ................................................................................................... 4-86
32317 - Server disk health test error............................................................................................. 4-87
32318 - Server disk unavailable error .......................................................................................... 4-88
32319 - Device error........................................................................................................................ 4-88
32320 - Device interface error ....................................................................................................... 4-89
32321 - Correctable ECC memory error ...................................................................................... 4-90
32322 - Power Supply A error....................................................................................................... 4-91
32323 - Power Supply B error ....................................................................................................... 4-91
32324 - Breaker panel feed error................................................................................................... 4-92
32325 - Breaker panel breaker error ............................................................................................. 4-93
32326 - Breaker panel monitoring error ...................................................................................... 4-96
32327 - Server HA Keepalive error .............................................................................................. 4-97
32328 - DRBD is unavailable......................................................................................................... 4-98
32329 - DRBD is not replicating.................................................................................................... 4-98
32330 - DRBD peer problem.......................................................................................................... 4-99
32331 - HP disk problem ............................................................................................................. 4-100
32332 - HP Smart Array controller problem............................................................................. 4-100
32333 - HP hpacucliStatus utility problem ............................................................................... 4-101
32334 - Multipath device access link problem.......................................................................... 4-102
32335 - Switch link down error................................................................................................... 4-103
32336 - Half Open Socket Limit.................................................................................................. 4-103
32337 - Flash Program Failure .................................................................................................... 4-104
32338 - Serial Mezzanine Unseated ........................................................................................... 4-105
32339 - TPD Max Number Of Running Processes Error......................................................... 4-105
32340 - TPD NTP Daemon Not Synchronized Error ............................................................... 4-106
32341 - TPD NTP Daemon Not Synchronized Error ............................................................... 4-107
32342 - NTP Offset Check Error ................................................................................................. 4-108
32343 - TPD RAID disk ............................................................................................................... 4-109
32344 - TPD RAID controller problem ...................................................................................... 4-110
32345 - Server Upgrade snapshot(s) invalid............................................................................. 4-111
32346 - OEM hardware management service reports an error .............................................. 4-111
32347 - The hwmgmtcliStatus daemon needs intervention ................................................... 4-112
32348 - FIPS subsystem problem................................................................................................ 4-113
32349 - File Tampering................................................................................................................. 4-113
vii
32350 - Security Process Terminated.......................................................................................... 4-114
32500 - Server disk space shortage warning............................................................................. 4-114
32501 - Server application process error ................................................................................... 4-115
32502 - Server hardware configuration error ........................................................................... 4-116
32503 - Server RAM shortage warning ..................................................................................... 4-117
32504 - Software Configuration Error........................................................................................ 4-117
32505 - Server swap space shortage warning........................................................................... 4-118
32506 - Server default router not defined ................................................................................. 4-119
32507 - Server temperature warning ......................................................................................... 4-120
32508 - Server core file detected ................................................................................................. 4-121
32509 - Server NTP Daemon not synchronized ....................................................................... 4-122
32510 - CMOS battery voltage low ............................................................................................ 4-123
32511 - Server disk self test warning.......................................................................................... 4-123
32512 - Device warning ............................................................................................................... 4-124
32513 - Device interface warning ............................................................................................... 4-124
32514 - Server reboot watchdog initiated.................................................................................. 4-125
32515 - Server HA failover inhibited ......................................................................................... 4-126
32516 - Server HA Active to Standby transition ...................................................................... 4-126
32517 - Server HA Standby to Active transition ...................................................................... 4-127
32518 - Platform Health Check failure ...................................................................................... 4-127
32519 - NTP Offset Check failure ............................................................................................... 4-128
32520 - NTP Stratum Check failure............................................................................................ 4-129
32521 - SAS Presence Sensor Missing........................................................................................ 4-130
32522 - SAS Drive Missing .......................................................................................................... 4-131
32523 - DRBD failover busy ........................................................................................................ 4-131
32524 - HP disk resync................................................................................................................. 4-132
32525 - Telco Fan Warning........................................................................................................... 4-133
32526 - Telco Temperature Warning........................................................................................... 4-133
32527 - Telco Power Supply Warning ........................................................................................ 4-134
32528 - Invalid BIOS value .......................................................................................................... 4-135
32529 - Server Kernel Dump File Detected............................................................................... 4-135
32530 - TPD Upgrade Failed ....................................................................................................... 4-136
32531 - Half Open Socket Warning Limit.................................................................................. 4-136
32532 - Server Upgrade Pending Accept/Reject ..................................................................... 4-137
32533 - TPD Max Number Of Running Processes Warning................................................... 4-138
32534 - TPD NTP Source Is Bad Warning ................................................................................. 4-138
32535 - TPD RAID disk resync ................................................................................................... 4-139
32536 - TPD Server Upgrade snapshot(s) warning ................................................................. 4-140
32537 - FIPS subsystem warning event ..................................................................................... 4-141
32540 - CPU Power limit mismatch ........................................................................................... 4-141
32700 - Telco Switch Notification ............................................................................................... 4-142
32701 - HIDS Initialized............................................................................................................... 4-142
32702 - HIDS Baseline Deleted ................................................................................................... 4-143
viii
32703 - HIDS Enabled .................................................................................................................. 4-143
32704 - HIDS Disabled ................................................................................................................. 4-143
32705 - HIDS Monitoring Suspended........................................................................................ 4-144
32706 - HIDS Monitoring Resumed........................................................................................... 4-144
32707 - HIDS Baseline Updated ................................................................................................. 4-144
QP (70000-70999)................................................................................................................................... 4-145
70001 – QP_procmgr failed ......................................................................................................... 4-145
70002 – QP Critical process failed .............................................................................................. 4-145
70003 – QP Non-critical process failed ...................................................................................... 4-146
70004 – QP Processes down for maintenance........................................................................... 4-146
70007 - QP Resource Not Ready................................................................................................. 4-147
70010 – QP Failed Server-backup Remote Archive Rsync...................................................... 4-148
70011 – QP Failed System-backup Remote Archive Rsync .................................................... 4-148
70012 – QP Failed To Create Server Backup ............................................................................. 4-149
70013 – QP Failed To Create System Backup............................................................................ 4-150
70015 – Route Add Failed............................................................................................................ 4-150
70016 – No Available VIP Route ................................................................................................ 4-151
70017 – No Available Static IP .................................................................................................... 4-151
70020 – QP Master database is outdated................................................................................... 4-152
70021 – QP slave database is unconnected to the master ....................................................... 4-153
70022 – QP Slave database failed to synchronize .................................................................... 4-153
70023 – QP Slave database lagging the master ........................................................................ 4-154
70024 - QP Slave database is prevented from synchronizing with the master.................... 4-155
70025 – QP Slave database is a different version than the master......................................... 4-155
70026 – QP Server Symantec NetBackup Operation in Progress .......................................... 4-156
70027 – QP Server Network Config Error................................................................................. 4-156
70028 – QP bonded interface is down ....................................................................................... 4-157
70029 – QP peer node bonded interface is down..................................................................... 4-157
70030 – QP backplane bonded interface is down .................................................................... 4-158
70031 – QP degrade because one or more interfaces are down............................................. 4-159
70032 – QP direct link does not work as configuration .......................................................... 4-159
70038 – QP has blocked IPv4 traffic on an OAM interface..................................................... 4-160
70039 – QP has blocked IPv4 traffic on all interfaces .............................................................. 4-160
70040 – Failure to block IPv4 on the OAM interface ............................................................... 4-161
70041 – Failure to block IPv4 on the all interfaces ................................................................... 4-161
70042 – Failure to remove OAM IPv4 addresses from the cluster/site................................ 4-162
70043 – Failure to remove all IPv4 addresses from the cluster/site...................................... 4-162
70044 – Failure to rollback changes for removing IPv4 addresses ........................................ 4-163
70045 – DNS Server is not available .......................................................................................... 4-163
70050 – QP Timezone change detected ..................................................................................... 4-164
70500 – System Mixed Version ................................................................................................... 4-165
70501 – Cluster Mixed Version ................................................................................................... 4-165
70502 – Cluster Replication Inhibited........................................................................................ 4-166
ix
70503 – Server Forced Standby................................................................................................... 4-167
70505 – ISO Mismatch.................................................................................................................. 4-167
70506 – Upgrade Operation Failed ............................................................................................ 4-168
70507 – Upgrade In Progress ...................................................................................................... 4-169
70508 – Server Is Zombie............................................................................................................. 4-169
Policy Server Alarms (71000-79999) ................................................................................................... 4-170
71001 – Remote Diversion Not Possible.................................................................................... 4-170
71002 – OM Stats Parse Error...................................................................................................... 4-170
71003 – OM Stats Exception Error.............................................................................................. 4-171
71004 – AM Conn Lost................................................................................................................. 4-172
71005 – OM Stats Value Exceed Error........................................................................................ 4-172
71101 – DQOS Downstream Connection Closed ..................................................................... 4-173
71102 – MSC Conn Lost ............................................................................................................... 4-173
71103 – PCMM Conn Lost ........................................................................................................... 4-174
71104 – DQOS AM Connection Closed ..................................................................................... 4-175
71204 – SPC Conn Closed............................................................................................................ 4-175
71402 – Connectivity Lost ........................................................................................................... 4-176
71403 – Connectivity Degraded ................................................................................................. 4-176
71408 – Diameter New Conn Rejected ...................................................................................... 4-177
71414 – SCTP Path Status Changed ........................................................................................... 4-178
71605 – LDAP Conn Failed ......................................................................................................... 4-178
71630 – DHCP Unexpected Event ID ........................................................................................ 4-179
71631 – DHCP Unable to Bind Event ID................................................................................... 4-179
71632 – DHCP Response Timeout Event ID............................................................................. 4-180
71633 – DHCP Bad Relay Address Event ID............................................................................ 4-180
71634 – DHCP Bad Primary Address Event ID ....................................................................... 4-181
71635 – DHCP Bad Secondary Address Event ID ................................................................... 4-181
71684 – SPR Connection Closed ................................................................................................. 4-182
71685 – MSR DB Not Reachable ................................................................................................. 4-182
71702 – BRAS Connection Closed .............................................................................................. 4-183
71703 – COPS Unknown Gateway............................................................................................. 4-184
71801 – PCMM No PCEF............................................................................................................. 4-184
71805 – PCMM Non Connection PCEF..................................................................................... 4-185
72198 – SMSR SMSC Switched to Primary ............................................................................... 4-185
72199 – SMSR SMSC Switched to Secondary ........................................................................... 4-186
72210 – PCMM Reached Max Gates Event ID.......................................................................... 4-186
72211 – PCMM Reached Max GPI Event ID............................................................................. 4-187
72501 – SCE Connection Lost...................................................................................................... 4-187
72549 – SMSR Queue Full ........................................................................................................... 4-188
72559 – SMSR SMSC Connection Closed.................................................................................. 4-189
72565 – SMSR SMTP Connection Closed.................................................................................. 4-189
72575 – Policy Notification:Lost connection with destination URL...................................... 4-190
72703 – RADIUS Server Failed ................................................................................................... 4-190
x
72706 - RADIUS Server Corrupt Auth ...................................................................................... 4-191
72904 – Diameter Too Busy ......................................................................................................... 4-191
72905 – Radius Too Busy ............................................................................................................. 4-192
74000 – Policy Server Critical Alarm ......................................................................................... 4-192
74001 – Policy Server Major Alarm............................................................................................ 4-193
74002 – Policy Server Minor Alarm ........................................................................................... 4-193
74020 – Stats Files Generator Delete Expire Files .................................................................... 4-194
74021 – Files Synchronization Failure ....................................................................................... 4-194
74022 - Files Uploading Failure .................................................................................................. 4-195
74102 - CMTS Subnet Overlapped............................................................................................. 4-196
74103 - NES Without CMTS IP ................................................................................................... 4-196
74602 - Multiple Active In Cluster Failure................................................................................ 4-197
74603 - Max Primary Cluster Failure Threshold...................................................................... 4-198
74604 - MPE Cluster Offline Failure .......................................................................................... 4-198
74605 - Subscriber Trace Backup Failure................................................................................... 4-199
75000 - Policy Library Loading Failed....................................................................................... 4-199
77904 - BOD PCMM Too Busy.................................................................................................... 4-200
77905 - BOD DIAMETER Too Busy ........................................................................................... 4-200
78000 - ADS Connection Lost ..................................................................................................... 4-201
78001 - Rsync Failed ..................................................................................................................... 4-201
78850 - VNF operation error ....................................................................................................... 4-202
79002 - Sess Size Reached Threshold ........................................................................................ 4-203
79003 - Avg Sess Size Exceed ...................................................................................................... 4-203
79004 - Bind Size Reached Threshold........................................................................................ 4-204
79005 - Avg Bind Size Exceed ..................................................................................................... 4-205
79105 - Mediation SOAP Too Busy ............................................................................................ 4-205
79106 - SPR Connection Failed ................................................................................................... 4-206
79107 - Mediation Disk Quota Exceed ...................................................................................... 4-206
79108 - Mediation Disk No Space .............................................................................................. 4-207
79109 - SPR License Limit............................................................................................................ 4-207
79110 - Files Uploading Failure .................................................................................................. 4-208
79120 - Batch Disk Quota Exceeds ............................................................................................. 4-208
79995 - X1 Connection Lost ......................................................................................................... 4-209
79996 - X2 Connection Lost ......................................................................................................... 4-209
Policy Server Events (80000-89999) .................................................................................................... 4-210
80001 - DB State Transition.......................................................................................................... 4-210
80002 - MySQL Relay Log Dropped .......................................................................................... 4-211
80003 - QP MySQL DB Level ...................................................................................................... 4-211
82704 - Binding Release Task ...................................................................................................... 4-212
84004 - Policy Info Event ............................................................................................................. 4-212
86001 – Application Is Ready...................................................................................................... 4-213
86100 - CMP User Login.............................................................................................................. 4-213
86101 - CMP User Login Failed .................................................................................................. 4-214
xi
86102 - CMP User Logout ........................................................................................................... 4-214
86200 - CMP User Promoted Server .......................................................................................... 4-215
86201 - CMP User Demoted Server ........................................................................................... 4-215
86300 - Sh Enable Failed .............................................................................................................. 4-216
86301 - Sh Disable Failed ............................................................................................................. 4-216
86303 - NW-CMP Apply Failed.................................................................................................. 4-217
86304 - S-CMP Unreachable........................................................................................................ 4-217
86305 - S-CMP Split Brain ........................................................................................................... 4-218
86306 - CMP Apply Failed .......................................................................................................... 4-218
86307 - S-CMP Sync Fails ............................................................................................................ 4-219
86308 - NCMP Ref Obj Miss........................................................................................................ 4-219
5 Obtaining SNMP Status and Statistics
Obtaining CMTS and DPS Connection Status...................................................................................... 5-1
Obtaining Rx and Diameter AF Operation Measurement Statistics ................................................. 5-2
Obtaining PCMM Operation Measurement Statistics......................................................................... 5-3
xii
About This Guide
This guide describes Policy Management product support for Simple NetworkManagement Protocol (SNMP).
Scope and AudienceThis guide is intended for service personnel who are responsible for managing PolicyManagement systems.
How This Guide is OrganizedThe information in this guide is presented in the following order:
• About This Guide contains general information about this guide, the organizationof this guide, and how to get technical assistance.
• Overview provides an overview of how Policy Management supports the SimpleNetwork Management Protocol (SNMP).
• Configuring SNMP describes how to configure SNMP support on the CMPsystem.
• Supported MIBs describes the MIBs that are supported for SNMP.
• Support for Traps describes Policy Management support of SNMP alarms andtraps.
• Obtaining SNMP Status and Statistics describes support in cable mode forobtaining Diameter Rx and PCMM statistics.
Related PublicationsFor information about additional publications related to this document, refer to theOracle Help Center site. See Locate Product Documentation on the Oracle Help CenterSite for more information on related product publications.
Locate Product Documentation on the Oracle Help Center SiteOracle Communications customer documentation is available on the web at the OracleHelp Center (OHC) site, http://docs.oracle.com. You do not have to register to accessthese documents. Viewing these files requires Adobe Acrobat Reader, which can bedownloaded at http://www.adobe.com.
xiii
1. Access the Oracle Help Center site at http://docs.oracle.com.
2. Click Industries.
3. Under the Oracle Communications subheading, click the OracleCommunications documentation link.
The Communications Documentation page appears. Most products covered bythese documentation sets will appear under the headings "Network SessionDelivery and Control Infrastructure" or "Platforms."
4. Click on your Product and then the Release Number.
A list of the entire documentation set for the selected product and release appears.
5. To download a file to your location, right-click the PDF link, select Save targetas (or similar command based on your browser), and save to a local folder.
Customer TrainingOracle University offers training for service providers and enterprises. Visit our website to view, and register for, Oracle Communications training:
http://education.oracle.com/communication
To obtain contact phone numbers for countries or regions, visit the Oracle UniversityEducation web site:
www.oracle.com/education/contacts
My Oracle SupportMy Oracle Support is your initial point of contact for all product support and trainingneeds. A representative at Customer Care Center can assist you with My OracleSupport registration.
Call the My Oracle Support main number at 1-800-223-1711 (toll-free in the US), or callthe Oracle Support hotline for your local country from the list at http://www.oracle.com/us/support/contact/index.html. When calling, make the selectionsin the sequence shown below on the Support telephone menu:
1. Select 2 for New Service Request
2. Select 3 for Hardware, Networking and Solaris Operating System Support
3. Select one of the following options:
• For Technical issues such as creating a new Service Request (SR), Select 1
• For Non-technical issues such as registration or assistance with MOS, Select 2
You are connected to a live agent who can assist you with My Oracle Supportregistration and opening a support ticket.
My Oracle Support is available 24 hours a day, 7 days a week, 365 days a year.
Emergency ResponseIn the event of a critical service situation, emergency response is offered by theCustomer Access Support main number at 1-800-223-1711 (toll-free in the US), or by
xiv
calling the Oracle Support hotline for your local country from the list at http://www.oracle.com/us/support/contact/index.html. The emergency response providesimmediate coverage, automatic escalation, and other features to ensure that the criticalsituation is resolved as rapidly as possible.
A critical situation is defined as a problem with the installed equipment that severelyaffects service, traffic, or maintenance capabilities, and requires immediate correctiveaction. Critical situations affect service and/or system operation resulting in one orseveral of these situations:
• A total system failure that results in loss of all transaction processing capability
• Significant reduction in system capacity or traffic handling capability
• Loss of the system’s ability to perform automatic system reconfiguration
• Inability to restart a processor or the system
• Corruption of system databases that requires service affecting corrective actions
• Loss of access for maintenance or recovery operations
• Loss of the system ability to provide any required critical or major troublenotification
Any other problem severely affecting service, capacity/traffic, billing, andmaintenance capabilities may be defined as critical by prior discussion and agreementwith Oracle.
xv


List of Figures
2-1 SNMP Configuration.................................................................................................................. 2-24-1 Breaker Panel LEDs................................................................................................................... 4-944-2 Breaker Panel Setting................................................................................................................ 4-955-1 Sample CMTS And DPS Connection Table Statistics............................................................. 5-15-2 Sample Rx/Diameter OM Statistics.......................................................................................... 5-35-3 Sample PCMM Northbound And Southbound OM Statistics.............................................. 5-4
xvii

xviii

List of Tables
4-1 Alarm and Event Types.............................................................................................................. 4-3
xix

xx
1Overview
This chapter provides an overview of Policy Management support for the SimpleNetwork Management Protocol (SNMP).
Simple Network Management ProtocolSimple Network Management Protocol (SNMP) is a communication protocol thatprovides a method of managing TCP/IP networks, including individual networkdevices, and devices in aggregate. SNMP was developed by the IETF (InternetEngineering Task Force), and is applicable to any TCP/IP network, as well as othertypes of networks.
SNMP is an Application Program Interface (API) to the network, so that general-purpose network management programs can be easily written to work with a varietyof different devices. SNMP defines a client/server relationship. The client program(called the network manager) makes virtual connections to a server program (calledthe SNMP agent). The SNMP agent executes on a remote network device and servesinformation to the manager about the status of the device. The database (referred to asthe SNMP Management Information Base or MIB) is a standard set of statistical andcontrol values that is controlled by the SNMP agent.
Through the use of private MIBs, SNMP allows the extension of the standard valueswith values specific to a particular agent. SNMP agents can be tailored for a myriad ofspecific devices such as computers, network bridges, gateways, routers, modems, andprinters. The definitions of MIB variables supported by a particular agent areincorporated in descriptor files that are made available to network management clientprograms so that they can become aware of MIB variables and their usage. Thedescriptor files are written in Abstract Syntax Notation (ASN.1) format.
Directives are issued by the network manager client to an SNMP agent. Directivesconsist of the identifiers of SNMP variables (referred to as MIB object identifiers orMIB variables), along with instructions to either get the value for the identifier or setthe identifier to a new value.
The SNMP StandardSNMP can be viewed as three distinct standards:
• A Standard Message Format — SNMP is a standard communication protocol thatdefines a UDP message format.
• A Standard Set of Managed Objects — SNMP is a standard set of values (referredto as SNMP objects) that can be queried from a device. Specifically, the standardincludes values for monitoring TCP, IP, UDP, and device interfaces. Eachmanageable object is identified with an official name, and also with a numericidentifier expressed in dot-notation.
Overview 1-1
• A Standard Way of Adding Objects — A standard method is defined to allow thestandard set of managed objects to be augmented by network device vendors withnew objects specific for a particular network.
SNMP Message TypesFour types of SNMP messages are defined:
• A get request returns the value of a named object. Specific values can be fetchedto determine the performance and state of the device, without logging into thedevice or establishing a TCP connection with the device.
• A get-next request returns the next name (and value) of the next objectsupported by a network device given a valid SNMP name. This request allowsnetwork managers to review all SNMP values of a device to determine all namesand values that an operant device supports.
• A set request sets a named object to a specific value. This request provides amethod of configuring and controlling network devices through SNMP toaccomplish activities such as disabling interfaces, disconnecting users, andclearing registers.
• A trap message is generated asynchronously by network devices, which cannotify a network manager of a problem apart from any polling of the device. Thistypically requires each device on the network to be configured to issue SNMPtraps to one or more network devices that are awaiting these traps.
The four message types are all encoded into messages referred to as Protocol DataUnits (PDUs), which are interchanged with SNMP devices.
Standard Managed ObjectsThe list of values that an object supports is referred to as the SNMP ManagementInformation Base (MIB). MIB can be used to describe any SNMP object or portion of anSNMP hierarchy.
The various SNMP values in the standard MIB are defined in RFC-1213, one of thegoverning specifications for SNMP. The standard MIB includes various objects tomeasure and monitor IP activity, TCP activity, UDP activity, IP routes, TCPconnections, interfaces, and general system description. Each of these values isassociated with an official name (such as sysUpTime, which is the elapsed time sincethe managed device was booted) and with a numeric value expressed in dot-notation(such as '1.3.6.1.2.1.1.3.0', which is the object identifier for sysUpTime).
See Supported MIBs for a description of the use of SNMP MIBs for PolicyManagement.
The SNMP Standard
1-2 Policy Management SNMP User's Guide
2Configuring SNMP
This chapter describes how to configure SNMP using the CMP system.
About SNMP ConfigurationSNMP configuration architecture is based on using traps to notify a networkmanagement system of events and alarms that are generated by the MPE and MRAapplication software, and those that are generated by the underlying platforms.Alarms and telemetry data are continuously collected from the entire PolicyManagement network and stored on the CMP system. Alarms will then cause a trap tobe sent as a notification of an event.
Because the underlying platform can deliver the alarms from the MPE or MRA systemto the CMP system, SNMP can be configured in either of two ways:
• The Policy Management system can be configured so that the CMP system is thesource of all traps (the left side of Figure 2-1).
• The Policy Management system can be configured to allow each server to generateits own traps and deliver them to the SNMP management servers (the right sideof Figure 2-1).
Configuring SNMP 2-1
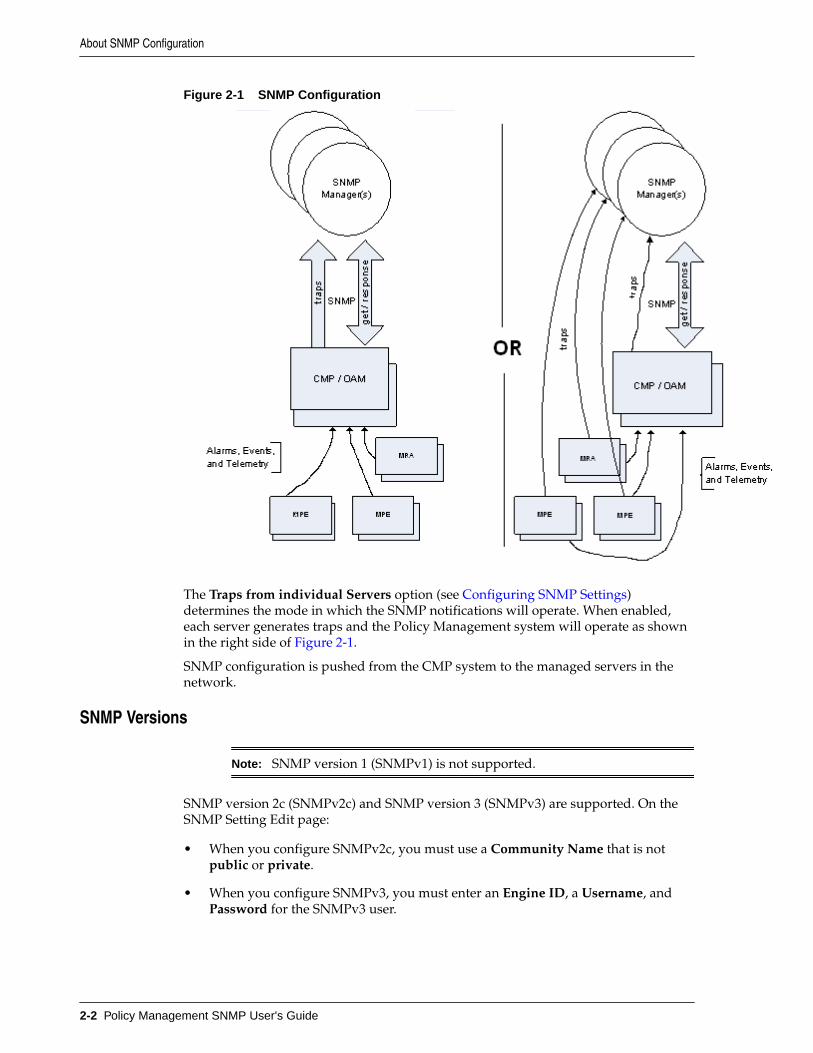
Figure 2-1 SNMP Configuration
The Traps from individual Servers option (see Configuring SNMP Settings)determines the mode in which the SNMP notifications will operate. When enabled,each server generates traps and the Policy Management system will operate as shownin the right side of Figure 2-1.
SNMP configuration is pushed from the CMP system to the managed servers in thenetwork.
SNMP Versions
Note: SNMP version 1 (SNMPv1) is not supported.
SNMP version 2c (SNMPv2c) and SNMP version 3 (SNMPv3) are supported. On theSNMP Setting Edit page:
• When you configure SNMPv2c, you must use a Community Name that is notpublic or private.
• When you configure SNMPv3, you must enter an Engine ID, a Username, andPassword for the SNMPv3 user.
About SNMP Configuration
2-2 Policy Management SNMP User's Guide
Configuring SNMP SettingsYou can configure SNMP settings for the CMP system and all Policy Managementservers in the topology network. You can configure the Policy Management networksuch that the CMP system collects and forwards all traps to up to five external systems(SNMP managers) or such that each server generates and delivers its own traps.
Note: SNMP settings configuration must be done on the active CMP server inthe primary cluster. A warning displays if the login is not on the activeprimary CMP system.
To configure SNMP settings:
1. From the Platform Setting section of the navigation pane, select SNMP Settings.
The SNMP Settings page opens, displaying the current settings.
2. Click Modify.
The Edit SNMP Settings page opens.
3. For each SNMP manager, enter a valid host name or an IPv4/IPv6 address.
The Hostname/IP Address field is required for an SNMP Manager to receive trapsand send SNMP requests. The field has the following restrictions:
• The name can only contain the characters A through Z, a through z, 0 through9, period (.), hyphen (-), and underline (_).
• The maximum length is 20 characters.
• The name is case insensitive (uppercase and lowercase are treated as the same).
By default, these fields are blank.
4. (Optional) You can configure a port for each SNMP manager by entering a portvalue between 1 and 65535 in the Port field. If left blank, the default value is 162.
5. From the Enabled Versions list, select one of the following versions:
• SNMPv2c
• SNMPv3
• SNMPv2c and SNMPv3 (default)
6. If you selected SNMPv2c or SNMPv2c and SNMPv3 from the Enabled Versionslist, configure the following:
a. Traps Enabled—Specifies whether sending SNMPv2 traps is enabled. Thedefault is enabled.
Note: To use the SNMP Trap Forwarding feature, enable this option.
Configuring SNMP Settings
Configuring SNMP 2-3
b. Traps from individual Servers—Specifies whether sending SNMPv2 traps fromindividual servers is enabled. If disabled, SNMPv2 traps are only sent from theactive CMP system only. The default is disabled.
Note: To use the SNMP Trap Forwarding feature, disable this option.
c. SNMPv2c Community Name—Enter the SNMP read-write community string.This field has the following restrictions:
• The field is required if SNMPv2c is enabled.
• The name can only contain the characters A through Z, a through z, 0through 9, period (.), hyphen (-), and underline (_).
• The name cannot exceed 31 characters in length.
• The name cannot be either private or public.
The default value is snmppublic.
7. If you selected SNMPv3 or SNMPv2c and SNMPv3 from the Enabled Versionslist, configure the following:
a. SNMPv3 Engine ID—Enter an Engine ID for SNMPv3. The Engine ID can be 10to 64 digits long and must use only hexadecimal digits (0-9 and a-f). The defaultis no value (null).
b. SNMPv3 Security Level—Select the level of SNMPv3 authentication andprivacy from the list:
• No Auth No Priv—Authenticate using the Username. No Privacy.
• Auth No Priv—Authenticate using MD5 or SHA1 protocol.
• Auth Priv (default)—Authenticate using MD5 or SHA1 protocol. Encryptusing the AES or DES protocol.
c. SNMPv3 Authentication Type—Select an SNMPv3 authentication protocolfrom the list:
• SHA-1—Use Secure Hash Algorithm authentication.
• MD5 (default)—Use Message Digest authentication.
d. SNMPv3 Privacy Type—Select an SNMPv3 privacy protocol from the list:
• AES (default)—Use Advanced Encryption Standard privacy.
• DES—Use Data Encryption Standard privacy.
e. SNMPv3 Username—Enter a user name. The user name can contain 0 to 32characters and must only contain alphanumeric characters. The default isTekSNMPUser.
f. SNMPv3 Password—Enter an authentication password. The password mustcontain between 8 and 64 characters and can include any character.
Note: The SNMPv3 password is also used for msgPrivacyParameters.
Configuring SNMP Settings
2-4 Policy Management SNMP User's Guide

8. Click Save.
The SNMP settings for the network are configured.
Configuring SNMP Settings
Configuring SNMP 2-5

Configuring SNMP Settings
2-6 SNMP User's Guide
3Supported MIBs
This chapter describes the MIBs that are supported for SNMP.
Supported MIBsA Management Information Base (MIB) contains information required to manage aproduct cluster and the applications it runs. The exact syntax and nature of theparameters are described in the version of each MIB that you are loading on yourNMS.
SNMP MIB ObjectsTo use SNMP effectively, an administrator must become acquainted with the SNMPManagement Information Base (MIB), which defines all the values that SNMP iscapable of reading or setting.
The SNMP MIB is arranged in a tree-structured fashion, similar in many ways to adisk directory structure of files. The top-level SNMP branch begins with the ISOinternet directory, which contains four main branches:
• The mgmt SNMP branch contains the standard SNMP objects usually supported(at least in part) by all network devices.
• The private SNMP branch contains those extended SNMP objects defined bynetwork equipment vendors
• The experimental and directory SNMP branches, also defined within theinternet root directory, are usually devoid of any meaningful data or objects.
The tree structure is an integral part of the SNMP standard. However, the mostpertinent parts of the tree are the leaf objects of the tree that provide actualmanagement data about the device. Generally, SNMP leaf objects can be partitionedinto two similar but slightly different types that reflect the organization of the treestructure:
Discrete MIB ObjectsDiscrete SNMP objects contain one piece of management data. The operator has toknow only the name of the object and no other information. Discrete objects oftenrepresent summary values for a device, particularly useful for scanning informationfrom the network for the purposes of comparing network device performance. Theseobjects are often distinguished from Table objects by adding a '.0' (dot-zero)extension to their names. (If the '.0' extension is omitted from a leaf SNMP objectname, it is always implied.)
Table MIB ObjectsTable SNMP objects contain multiple pieces of management data; they allow parallelarrays of information to be supported. These objects are distinguished from Discrete
Supported MIBs 3-1
objects by requiring a '.' (dot) extension to their names that distinguishes theparticular value being referenced.
By convention, SNMP objects are always grouped in an Entry directory, within anobject with a Table suffix. (The ifDescr object described above resides in theifEntry directory contained in the ifTable directory.) Several constraints are placedon SNMP objects as follows:
• Each object in the Entry directory of a table must contain the same number ofelements as other objects in the same Entry directory, where instance numbers ofall entries are the same. Table objects are always regarded as parallel arrays ofdata.
• When creating a new Entry object, SNMP requires that a value be associated witheach table entry in a single SNMP message (single PDU). This means that, tocreate a row in a table (using an SNMP set command), a value must be specifiedfor each element in the row.
• If a table row can be deleted, SNMP requires that at least one object in the entryhas a control element that is documented to perform the table deletion. (Thisapplies only if a row can be deleted, which is not necessarily required of an SNMPtable.)
The '.' (dot) extension is sometimes referred to as the instance number of an SNMPobject. In the case of Discrete objects, this instance number will be zero. In the case ofTable objects, this instance number will be the index into the SNMP table.
MIB Object Access ValuesEach SNMP object is defined to have a particular access, either read-only, read-write,or write-only, that determines whether the user can read the object value, read andwrite the object (with a set command), or only write the object.
Before any object can be read or written, the SNMP community name must be known.These community names are configured into the system by the administrator, and canbe viewed as passwords needed to gather SNMP data. Community names allowreference to portions of the SNMP MIB and object subsets. The purpose of these valuesis to identify commonality between SNMP object sets, though it is common practice tomake these community names obscure to limit access to SNMP capability by outsideusers.
Compiling MIB ObjectsOne of the principal components of an SNMP manager is a MIB Compiler, whichallows new MIB objects to be added to the management system. When a MIB iscompiled into an SNMP manager, the manager is made aware of new objects that aresupported by agents on the network. The concept is similar to adding a new schema toa database. The agent is not affected by the MIB compilation (because the agent isalready aware of its own objects). The act of compiling the MIB allows the manager toknow about the special objects supported by the agent and to access these objects aspart of the standard object set.
Typically, when a MIB is compiled into the system, the manager creates new folders ordirectories that correspond to the objects. These folders or directories can typically beviewed with a MIB Browser, which is a traditional SNMP management toolincorporated into virtually all network management systems. These new objects canoften be alarmed or possibly modified to affect the performance of the remote agent.
Supported MIBs
3-2 Policy Management SNMP User's Guide
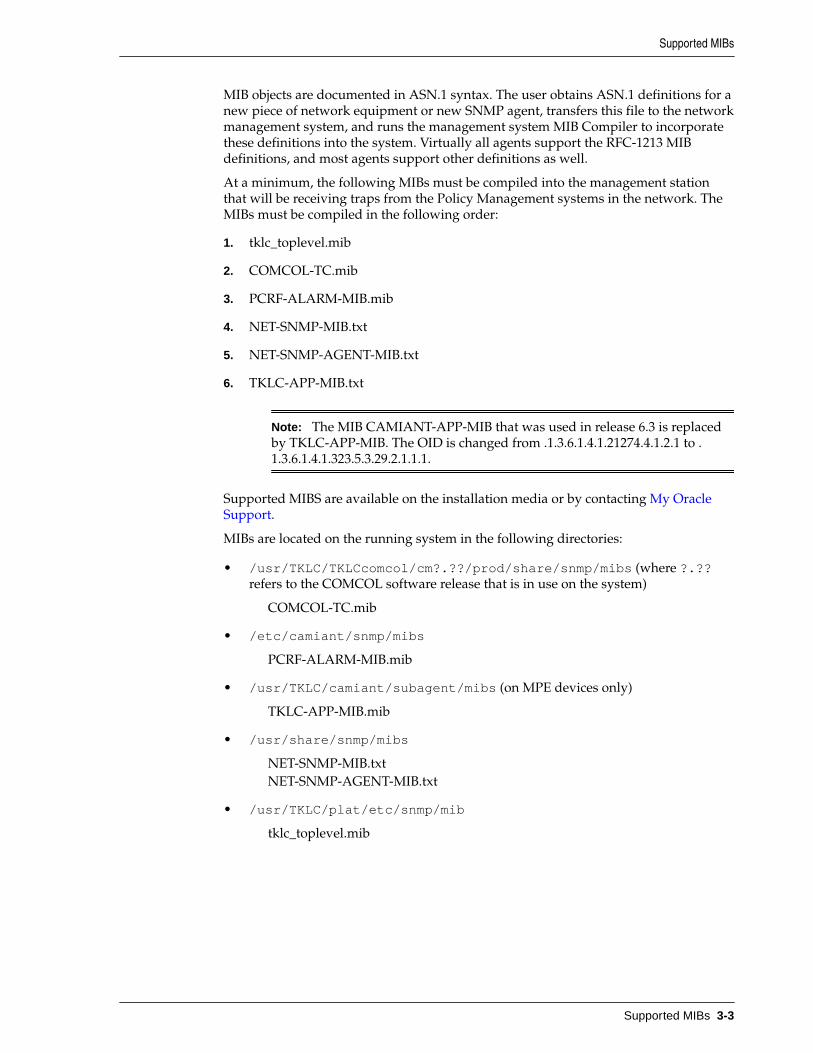
MIB objects are documented in ASN.1 syntax. The user obtains ASN.1 definitions for anew piece of network equipment or new SNMP agent, transfers this file to the networkmanagement system, and runs the management system MIB Compiler to incorporatethese definitions into the system. Virtually all agents support the RFC-1213 MIBdefinitions, and most agents support other definitions as well.
At a minimum, the following MIBs must be compiled into the management stationthat will be receiving traps from the Policy Management systems in the network. TheMIBs must be compiled in the following order:
1. tklc_toplevel.mib
2. COMCOL-TC.mib
3. PCRF-ALARM-MIB.mib
4. NET-SNMP-MIB.txt
5. NET-SNMP-AGENT-MIB.txt
6. TKLC-APP-MIB.txt
Note: The MIB CAMIANT-APP-MIB that was used in release 6.3 is replacedby TKLC-APP-MIB. The OID is changed from .1.3.6.1.4.1.21274.4.1.2.1 to .1.3.6.1.4.1.323.5.3.29.2.1.1.1.
Supported MIBS are available on the installation media or by contacting My OracleSupport.
MIBs are located on the running system in the following directories:
• /usr/TKLC/TKLCcomcol/cm?.??/prod/share/snmp/mibs (where ?.??refers to the COMCOL software release that is in use on the system)
COMCOL-TC.mib
• /etc/camiant/snmp/mibs
PCRF-ALARM-MIB.mib
• /usr/TKLC/camiant/subagent/mibs (on MPE devices only)
TKLC-APP-MIB.mib
• /usr/share/snmp/mibs
NET-SNMP-MIB.txtNET-SNMP-AGENT-MIB.txt
• /usr/TKLC/plat/etc/snmp/mib
tklc_toplevel.mib
Supported MIBs
Supported MIBs 3-3

Supported MIBs
3-4 SNMP User's Guide
4Support for Traps
This chapter describes the SNMP alarms and traps supported by Policy Managementsystems.
Alarms OverviewAlarms provide information about a system's operational condition, which an operatormay need to act upon.
MPE or MRA devices generate Policy Server alarms based on the evaluation ofcomponent states and external factors. The servers communicate with each other in acluster. Each server has a database with merge capabilities to replicate the alarm statesto the CMP database. This information is shown on the KPI dashboard or in detailedCMP reports.
As alarms and events are raised on an application or the platform, the SNMPsubsystem issues a corresponding trap.
Alarms and Events have the following differences:
• Alarms:
– Are issued when a Fault is detected
– Are latched until the Fault is removed (that is, they are explicitly set andcleared)
– Have a Severity: Critical, Major, Minor
– Will cause a trap
• Events:
– Are issued when a Condition is detected (not a Fault)
– Are not latched (that is they are not explicitly set or cleared)
– Do not have a Severity (the Severity is actually INFO)
– Might cause a trap
Separate traps are sent upon raising an alarm and upon clearing an alarm.
Application traps contain the following variable bindings in addition to thesysOpTime and trapID fields:
• comcolAlarmSrcNode - The node that originated the alarm
• comcolAlarmNumber - The OID of the alarm and trap
Support for Traps 4-1
• comcolAlarmInstance - An instance is used when the trap is for a physicaldevice such as disk1, or connection diameterPeer 10.15.22.232:33119
• comcolAlarmSeverity - Severity of the alarm: Critical (1), Major (2), Minor (3),Info (4), Clear (5)
• comcolAlarmText - A text object that defines the trap
• comcolAlarmInfo - An extended text field that adds information to the trap text
• comcolAlarmGroup - The group from which the trap originated (such as PCRFor QP)
Refer to the Policy Management Troubleshooting Reference for more information aboutPolicy Server alarms and traps.
Note: If you encounter an alarm not in this document, contact My OracleSupport.
Alarms formatting informationThis section of the document provides information to help you understand why analarm occurred and to provide a recovery procedure to help correct the condition thatcaused the alarm.
The information provided about each alarm includes:
Alarm GroupThe type of alarm that has occurred. For a list of Event types see Alarm and eventtypes.
DescriptionThe reason or cause for the alarm.
SeverityThe severity of the alarm. This severity may vary, depending on user-defined andspecific application settings.
Instance
HA ScoreThe HA impact of the alarm: Normal, Failed, or Degraded.
Auto Clear SecondsThe number of seconds required for the alarm to automatically clear (if applicable).
OIDThe alarm identifier that appears in SNMP traps.
Alarm IDThe alarm identifier that is used internally (if applicable).
RecoveryLists any necessary steps for correcting or preventing the alarm.
Alarms Overview
4-2 Policy Management SNMP User's Guide
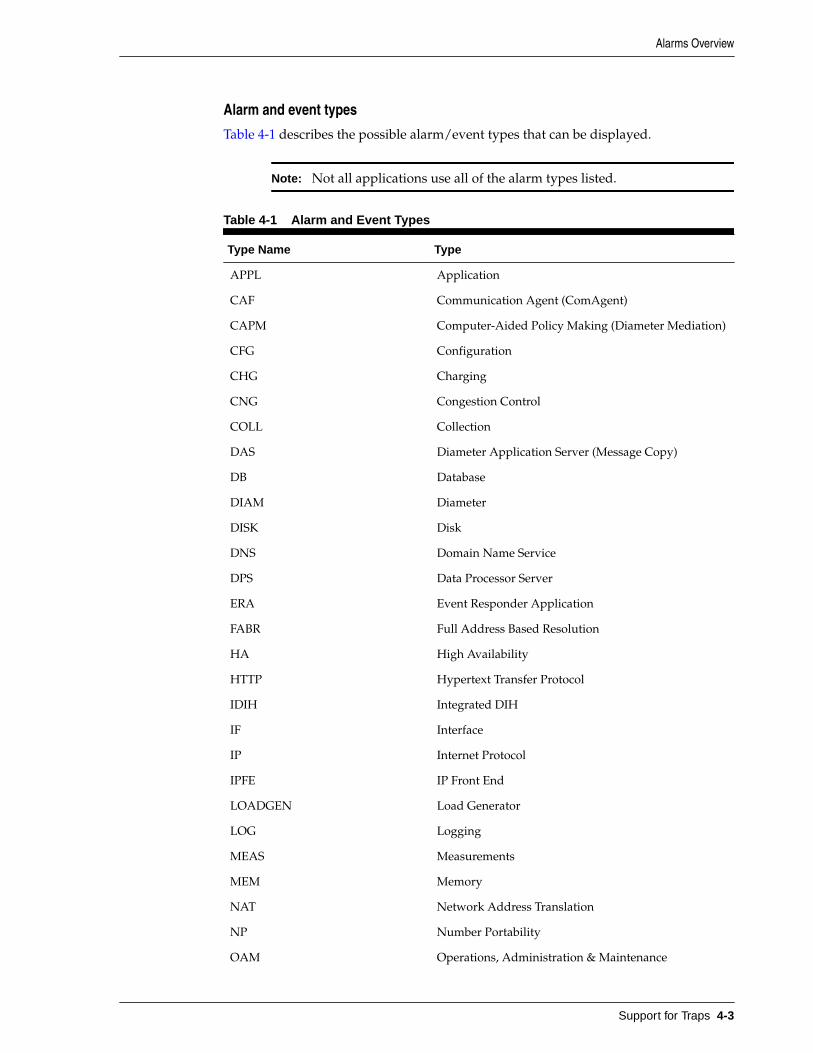
Alarm and event types
Table 4-1 describes the possible alarm/event types that can be displayed.
Note: Not all applications use all of the alarm types listed.
Table 4-1 Alarm and Event Types
Type Name Type
APPL Application
CAF Communication Agent (ComAgent)
CAPM Computer-Aided Policy Making (Diameter Mediation)
CFG Configuration
CHG Charging
CNG Congestion Control
COLL Collection
DAS Diameter Application Server (Message Copy)
DB Database
DIAM Diameter
DISK Disk
DNS Domain Name Service
DPS Data Processor Server
ERA Event Responder Application
FABR Full Address Based Resolution
HA High Availability
HTTP Hypertext Transfer Protocol
IDIH Integrated DIH
IF Interface
IP Internet Protocol
IPFE IP Front End
LOADGEN Load Generator
LOG Logging
MEAS Measurements
MEM Memory
NAT Network Address Translation
NP Number Portability
OAM Operations, Administration & Maintenance
Alarms Overview
Support for Traps 4-3
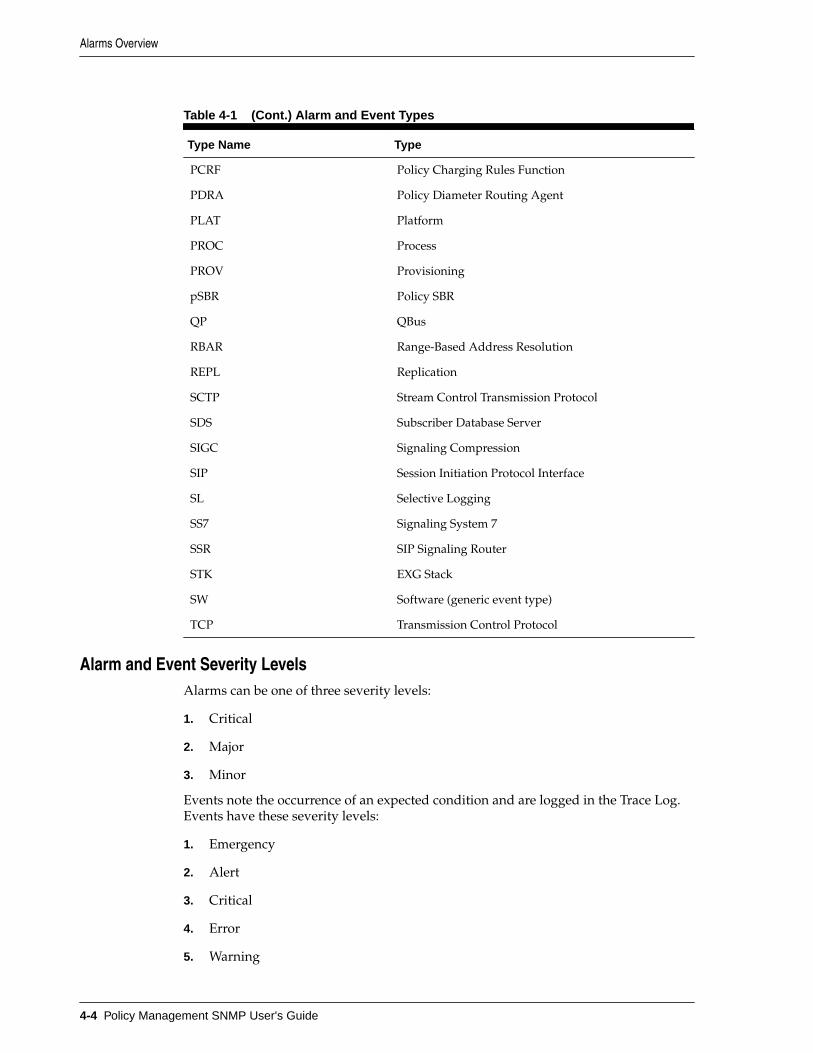
Table 4-1 (Cont.) Alarm and Event Types
Type Name Type
PCRF Policy Charging Rules Function
PDRA Policy Diameter Routing Agent
PLAT Platform
PROC Process
PROV Provisioning
pSBR Policy SBR
QP QBus
RBAR Range-Based Address Resolution
REPL Replication
SCTP Stream Control Transmission Protocol
SDS Subscriber Database Server
SIGC Signaling Compression
SIP Session Initiation Protocol Interface
SL Selective Logging
SS7 Signaling System 7
SSR SIP Signaling Router
STK EXG Stack
SW Software (generic event type)
TCP Transmission Control Protocol
Alarm and Event Severity LevelsAlarms can be one of three severity levels:
1. Critical
2. Major
3. Minor
Events note the occurrence of an expected condition and are logged in the Trace Log.Events have these severity levels:
1. Emergency
2. Alert
3. Critical
4. Error
5. Warning
Alarms Overview
4-4 Policy Management SNMP User's Guide
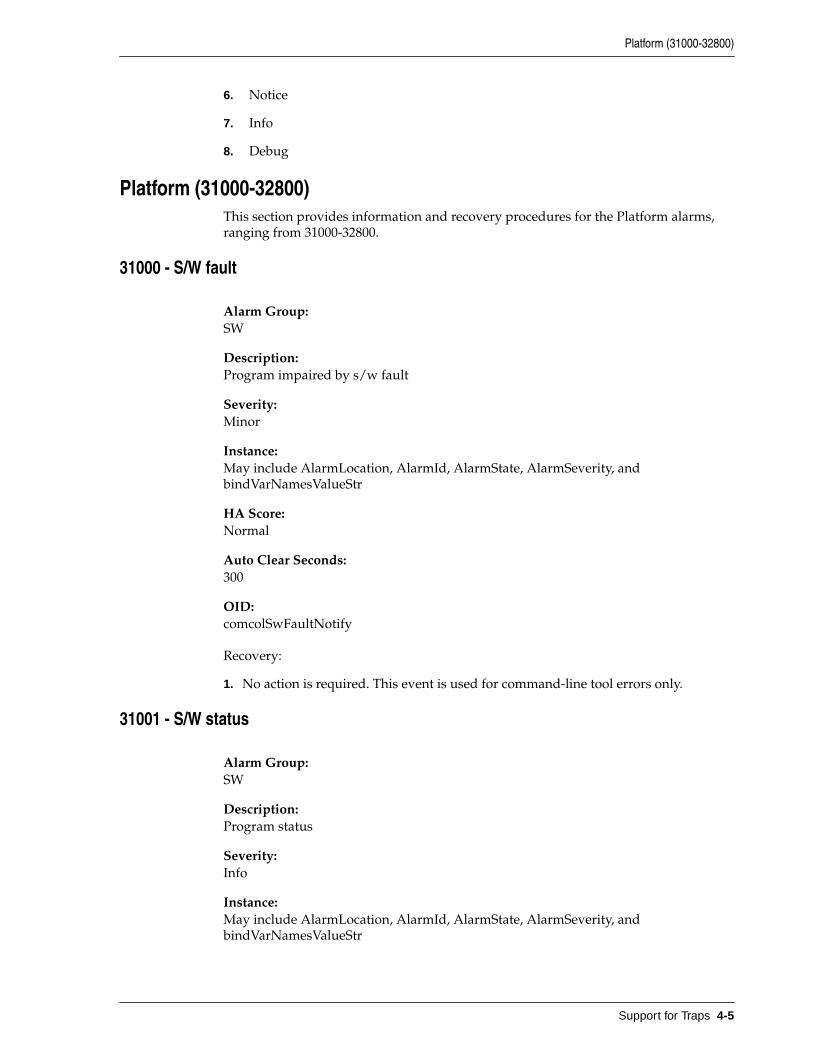
6. Notice
7. Info
8. Debug
Platform (31000-32800)This section provides information and recovery procedures for the Platform alarms,ranging from 31000-32800.
31000 - S/W fault
Alarm Group:SW
Description:Program impaired by s/w fault
Severity:Minor
Instance:May include AlarmLocation, AlarmId, AlarmState, AlarmSeverity, andbindVarNamesValueStr
HA Score:Normal
Auto Clear Seconds:300
OID:comcolSwFaultNotify
Recovery:
1. No action is required. This event is used for command-line tool errors only.
31001 - S/W status
Alarm Group:SW
Description:Program status
Severity:Info
Instance:May include AlarmLocation, AlarmId, AlarmState, AlarmSeverity, andbindVarNamesValueStr
Platform (31000-32800)
Support for Traps 4-5
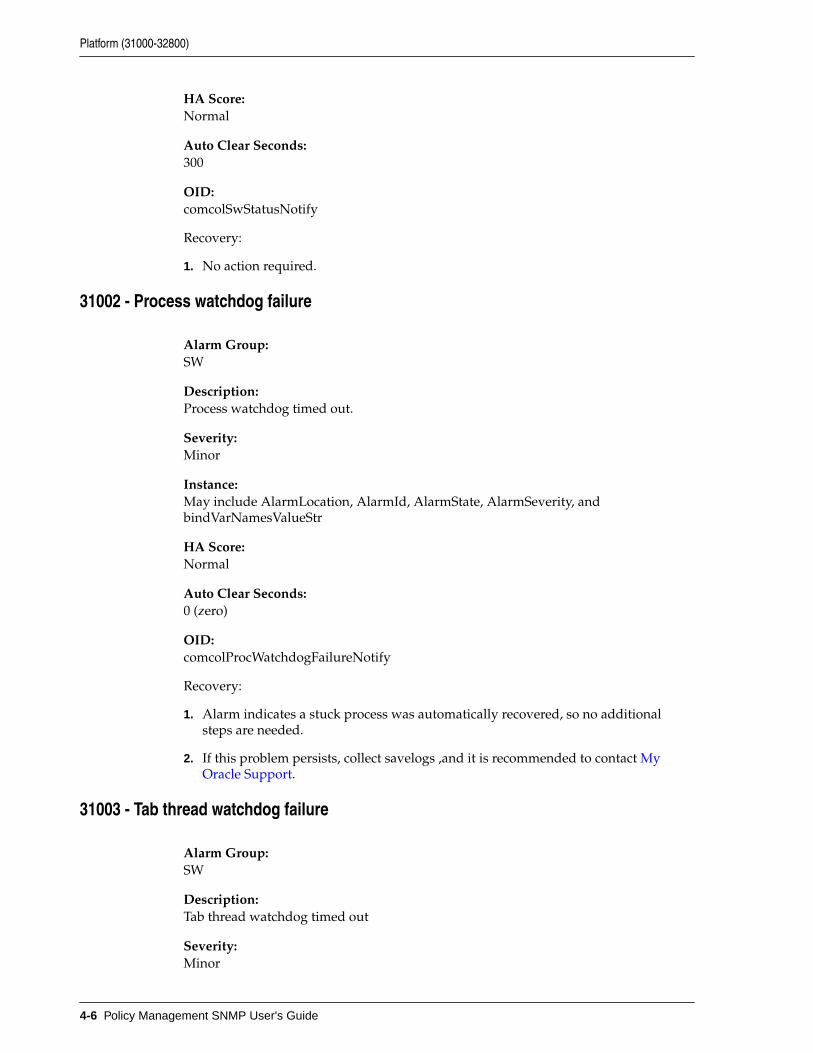
HA Score:Normal
Auto Clear Seconds:300
OID:comcolSwStatusNotify
Recovery:
1. No action required.
31002 - Process watchdog failure
Alarm Group:SW
Description:Process watchdog timed out.
Severity:Minor
Instance:May include AlarmLocation, AlarmId, AlarmState, AlarmSeverity, andbindVarNamesValueStr
HA Score:Normal
Auto Clear Seconds:0 (zero)
OID:comcolProcWatchdogFailureNotify
Recovery:
1. Alarm indicates a stuck process was automatically recovered, so no additionalsteps are needed.
2. If this problem persists, collect savelogs ,and it is recommended to contact MyOracle Support.
31003 - Tab thread watchdog failure
Alarm Group:SW
Description:Tab thread watchdog timed out
Severity:Minor
Platform (31000-32800)
4-6 Policy Management SNMP User's Guide
Instance:May include AlarmLocation, AlarmId, AlarmState, AlarmSeverity, andbindVarNamesValueStr
HA Score:Normal
Auto Clear Seconds:300
OID:comcolThreadWatchdogFailureNotify
Recovery:
1. Alarm indicates a stuck process was automatically recovered, so no additionalsteps are needed.
2. If this problem persists, collect savelogs, and it is recommended to contact MyOracle Support.
31004 - Test Status
Alarm Type: TEST
Description: For testing purposes only
Severity: Info
OID: comcolTestStatNotify
Recovery:
1. Test message. No action necessary.
31005 - Test Fault
Alarm Type: TEST
Description: For testing purposes only
Severity: Minor
OID: comcolTestFaultNotify
Recovery:
1. Test message. No action necessary.
31100 - Database replication fault
Alarm Group:SW
Description:The Database replication process is impaired by a s/w fault
Severity:Minor
Platform (31000-32800)
Support for Traps 4-7
Instance:May include AlarmLocation, AlarmId, AlarmState, AlarmSeverity, andbindVarNamesValueStr
HA Score:Normal
Auto Clear Seconds:300
OID:comcolDbReplicationFaultNotify
Recovery:
1. Export event history for the given server and inetsync task.
2. It is recommended to contact My Oracle Support.
31101 - Database replication to slave failure
Alarm Group:REPL
Description:Database replication to a slave database has failed. This alarm is generated when:
• The replication master finds the replication link is disconnected from the slave.
• The replication master's link to the replication slave is OOS, or the replicationmaster cannot get the slave's correct HA state because of a failure tocommunicate.
• The replication mode is relayed in a cluster and either:
– No nodes are active in cluster, or
– None of the nodes in cluster are getting replication data.
Severity:Critical
Instance:May include AlarmLocation, AlarmId, AlarmState, AlarmSeverity, andbindVarNamesValueStr
HA Score:Normal
Auto Clear Seconds:300
OID:comcolDbRepToSlaveFailureNotify
Recovery:
Platform (31000-32800)
4-8 Policy Management SNMP User's Guide
1. Verify the path for all services on a node by typing path.test –a <toNode> ina command interface to test the paths for all services.
2. Use the path test command to test the communication between nodes by typingiqt -pE NodeInfo to get the node ID. Then type path.test -a <nodeid> totest the paths for all services.
3. Examine the Platform savelogs on all MPs, SO, and NO by typing sudo /usr/TKLC/plat/sbin/savelogs_plat in the command interface. The plat savelogsare in the /tmp directory.
4. Check network connectivity between the affected servers.
5. If there are no issues with network connectivity, contact My Oracle Support.
31102 - Database replication from master failure
Alarm Group:REPL
Description:Database replication from a master database has failed. This alarm is generated whenthe replication slave finds the replication link is disconnected from the master.
Severity:Minor
Instance:May include AlarmLocation, AlarmId, AlarmState, AlarmSeverity, andbindVarNamesValueStr
HA Score:Normal
Auto Clear Seconds:300
OID:comcolDbRepFromMasterFailureNotify
Recovery:
1. Verify the path for all services on a node by typing path.test –a <toNode> ina command interface to test the paths for all services.
2. Use the path test command to test the communication between nodes by typingiqt -pE NodeInfo to get the node ID. Then type path.test -a <nodeid> totest the paths for all services.
3. Examine the Platform savelogs on all MPs, SO, and NO by typing sudo /usr/TKLC/plat/sbin/savelogs_plat in the command interface. The plat savelogsare in the /tmp directory.
4. Indicates replication subsystem is unable to contact a server, due to networkingissues or because the server is not available. Investigate the status of the server andverify network connectivity.
Platform (31000-32800)
Support for Traps 4-9
5. If no issues with network connectivity or the server are found and the problempersists, it is recommended to contact My Oracle Support.
31103 - DB Replication update fault
Alarm Group:REPL
Description:Database replication process cannot apply update to DB.
Severity:Minor
Instance:May include AlarmLocation, AlarmId, AlarmState, AlarmSeverity, andbindVarNamesValueStr
HA Score:Normal
Auto Clear Seconds:300
OID:comcolDbRepUpdateFaultNotify
Recovery:
1. This alarm indicates a transient error occurred within the replication subsystem,but the system has recovered, so no additional steps are needed.
2. If the problem persists, collect savelogs, and it is recommended to contact MyOracle Support.
31104 - DB Replication latency over threshold
Alarm Group:REPL
Description:Database replication latency has exceeded thresholds
Severity:Major
Instance:May include AlarmLocation, AlarmId, AlarmState, AlarmSeverity, andbindVarNamesValueStr
HA Score:Normal
Auto Clear Seconds:300
Platform (31000-32800)
4-10 Policy Management SNMP User's Guide
OID:comcolDbRepLatencyNotify
Recovery:
1. If this alarm is raised occasionally for short time periods (a couple of minutes orless), it may indicate network congestion or spikes of traffic pushing serversbeyond their capacity. Consider re-engineering network capacity or subscriberprovisioning.
2. If this alarm does not clear after a couple of minutes, it is recommended to contact My Oracle Support.
31105 - Database merge fault
Alarm Group:SW
Description:The database merge process (inetmerge) is impaired by a s/w fault
Severity:Minor
Instance:May include AlarmLocation, AlarmId, AlarmState, AlarmSeverity, andbindVarNamesValueStr
HA Score:Normal
Auto Clear Seconds:300
OID:comcolDbMergeFaultNotify
Recovery:
1. This alarm indicates a transient error occurred within the merging subsystem, butthe system has recovered, so no additional steps are needed.
2. If the problem persists, collect savelogs, and it is recommended to contact MyOracle Support.
31106 - Database merge to parent failure
Alarm Group:COLL
Description:Database merging to the parent Merge Node has failed.
Severity:Minor
Platform (31000-32800)
Support for Traps 4-11
Instance:May include AlarmLocation, AlarmId, AlarmState, AlarmSeverity, andbindVarNamesValueStr
HA Score:Normal
Auto Clear Seconds:0 (zero)
OID:comcolDbMergeToParentFailureNotify
Recovery:
1. This alarm indicates the merging subsystem is unable to contact a server, due tonetworking issues or because the server is not available. Investigate the status ofthe server and verify network connectivity.
2. If no issues with network connectivity or the server are found and the problempersists, it is recommended to contact My Oracle Support.
31107 - Database merge from child failure
Alarm Group:COLL
Description:Database merging from a child Source Node has failed.
Severity:Minor
Instance:May include AlarmLocation, AlarmId, AlarmState, AlarmSeverity, andbindVarNamesValueStr
HA Score:Normal
Auto Clear Seconds:300
OID:comcolDbMergeFromChildFailureNotify
Recovery:
1. This alarm indicates the merging subsystem is unable to contact a server, due tonetworking issues or because the server is not available. Investigate the status ofthe server and verify network connectivity.
2. If no issues with network connectivity or the server are found and the problempersists, it is recommended to contact My Oracle Support.
Platform (31000-32800)
4-12 Policy Management SNMP User's Guide
31108 - Database merge latency over threshold
Alarm Group:COLL
Description:Database Merge latency has exceeded thresholds
Severity:Minor
Instance:May include AlarmLocation, AlarmId, AlarmState, AlarmSeverity, andbindVarNamesValueStr
HA Score:Normal
Auto Clear Seconds:300
OID:comcolDbMergeLatencyNotify
Recovery:
1. If this alarm is raised occasionally for short time periods (a couple of minutes orless), it may indicate network congestion or spikes of traffic pushing serversbeyond their capacity. Consider re-engineering network capacity or subscriberprovisioning.
2. If this alarm does not clear after a couple of minutes, it is recommended to contact My Oracle Support.
31109 - Topology config error
Alarm Group:DB
Description:Topology is configured incorrectly
Severity:Minor
Instance:May include AlarmLocation, AlarmId, AlarmState, AlarmSeverity, andbindVarNamesValueStr
HA Score:Normal
Auto Clear Seconds:300
Platform (31000-32800)
Support for Traps 4-13
OID:comcolTopErrorNotify
Recovery:
1. This alarm may occur during initial installation and configuration of a server. Noaction is necessary at that time.
2. If this alarm occurs after successful initial installation and configuration of a server,it is recommended to contact My Oracle Support.
31110 - Database audit fault
Alarm Group:SW
Description:The Database service process (idbsvc) is impaired by a s/w fault.
Severity:Minor
Instance:May include AlarmLocation, AlarmId, AlarmState, AlarmSeverity, andbindVarNamesValueStr
HA Score:Normal
Auto Clear Seconds:300
OID:comcolDbAuditFaultNotify
Recovery:
1. Alarm indicates an error occurred within the database audit system, but the systemhas recovered, so no additional steps are needed.
2. If this problem persists, collect savelogs, and it is recommended to contact MyOracle Support.
31111 - Database merge audit in progress
Alarm Group:COLL
Description:Database Merge Audit between mate nodes in progress
Severity:Minor
Platform (31000-32800)
4-14 Policy Management SNMP User's Guide
Instance:May include AlarmLocation, AlarmId, AlarmState, AlarmSeverity, andbindVarNamesValueStr
HA Score:Normal
Auto Clear Seconds:300
OID:comcolDbMergeAuditNotify
Recovery:
1. No action required.
31112 - DB replication update log transfer timed out
Alarm Group:REPL
Description:DB Replicated data may not have transferred in the time allotted.
Severity:Minor
Instance:May include AlarmLocation, AlarmId, AlarmState, AlarmSeverity, andbindVarNamesValueStr
HA Score:Normal
Auto Clear Seconds:30
OID:comcolDbRepUpLogTransTimeoutNotify
Recovery:
1. No action required.
2. It is recommended to contact My Oracle Support if this occurs frequently.
31113 - DB replication manually disabled
Alarm Group:REPL
Description:DB Replication Manually Disabled
Platform (31000-32800)
Support for Traps 4-15
Severity:Minor
Instance:May include AlarmLocation, AlarmId, AlarmState, AlarmSeverity, andbindVarNamesValueStr
HA Score:Normal
Auto Clear Seconds:0 (zero)
OID:comcolDbReplicationManuallyDisabledNotify
Recovery:
1. No action required.
31114 - DB replication over SOAP has failed
Alarm Group:REPL
Description:Database replication of configuration data via SOAP has failed.
Severity:Minor
Instance:May include AlarmLocation, AlarmId, AlarmState, AlarmSeverity, andbindVarNamesValueStr
HA Score:Normal
Auto Clear Seconds:3600
OID:comcolDbReplicationSoapFaultNotify
Recovery:
1. This alarm indicates a SOAP subsystem is unable to connect to a server, due tonetworking issues or because the server is not available. Investigate the status ofthe server and verify network connectivity.
2. If no issues with network connectivity or the server are found and the problempersists, it is recommended to contact My Oracle Support.
31115 - Database service fault
Platform (31000-32800)
4-16 Policy Management SNMP User's Guide
Alarm Group:SW
Description:The Database service process (idbsvc) is impaired by a s/w fault.
Severity:Minor
Instance:May include AlarmLocation, AlarmId, AlarmState, AlarmSeverity, andbindVarNamesValueStr
HA Score:Normal
Auto Clear Seconds:300
OID:comcolDbServiceFaultNotify
Recovery:
1. Alarm indicates an error occurred within the database disk service subsystem, butthe system has recovered, so no additional steps are needed.
2. If this problem persists, collect savelogs, and it is recommended to contact MyOracle Support.
31116 - Excessive shared memory
Alarm Group:MEM
Description:The amount of shared memory consumed exceeds configured thresholds.
Severity:Major
Instance:May include AlarmLocation, AlarmId, AlarmState, AlarmSeverity, andbindVarNamesValueStr
HA Score:Normal
Auto Clear Seconds:300
OID:comcolExcessiveSharedMemoryConsumptionNotify
Recovery:
Platform (31000-32800)
Support for Traps 4-17
1. This alarm indicates that a server has exceeded the engineered limit for sharedmemory usage and there is a risk that application software will fail. Because thereis no automatic recovery for this condition, it is recommended to contact My OracleSupport.
31117 - Low disk free
Alarm Group:DISK
Description:The amount of free disk is below configured thresholds
Severity:Major
Instance:May include AlarmLocation, AlarmId, AlarmState, AlarmSeverity, andbindVarNamesValueStr
HA Score:Normal
Auto Clear Seconds:300
OID:comcolLowDiskFreeNotify
Recovery:
1. Remove unnecessary or temporary files from partitions.
2. If there are no files known to be unneeded, it is recommended to contact My OracleSupport.
31118 - Database disk store fault
Alarm Group:DISK
Description:Writing the database to disk failed
Severity:Minor
Instance:May include AlarmLocation, AlarmId, AlarmState, AlarmSeverity, andbindVarNamesValueStr
HA Score:Normal
Platform (31000-32800)
4-18 Policy Management SNMP User's Guide
Auto Clear Seconds:300
OID:comcolDbDiskStoreFaultNotify
Recovery:
1. Remove unnecessary or temporary files from partitions.
2. If there are no files known to be unneeded, it is recommended to contact My OracleSupport.
31119 - Database updatelog overrun
Alarm Group:DB
Description:The Database update log was overrun increasing risk of data loss
Severity:Minor
Instance:May include AlarmLocation, AlarmId, AlarmState, AlarmSeverity, andbindVarNamesValueStr
HA Score:Normal
Auto Clear Seconds:300
OID:comcolDbUpdateLogOverrunNotify
Recovery:
1. This alarm indicates a replication audit transfer took too long to complete and theincoming update rate exceeded the engineered size of the update log. The systemwill automatically retry the audit, and if successful, the alarm will clear and nofurther recovery steps are needed.
2. If the alarm occurs repeatedly, it is recommended to contact My Oracle Support.
31120 - Database updatelog write fault
Alarm Group:DB
Description:A Database change cannot be stored in the updatelog
Platform (31000-32800)
Support for Traps 4-19
Severity:Minor
Instance:May include AlarmLocation, AlarmId, AlarmState, AlarmSeverity, andbindVarNamesValueStr
HA Score:Normal
Auto Clear Seconds:300
OID:comcolDbUpdateLogWriteFaultNotify
Recovery:
1. This alarm indicates an error has occurred within the database update logsubsystem, but the system has recovered.
2. If the alarm occurs repeatedly, it is recommended to contact My Oracle Support.
31121 - Low disk free early warning
Alarm Group:DISK
Description:The amount of free disk is below configured early warning thresholds
Severity:Minor
Instance:May include AlarmLocation, AlarmId, AlarmState, AlarmSeverity, andbindVarNamesValueStr
HA Score:Normal
Auto Clear Seconds:300
OID:comcolLowDiskFreeEarlyWarningNotify
Recovery:
1. Remove unnecessary or temporary files from partitions that are greater than 80%full.
2. If there are no files known to be unneeded, it is recommended to contact My OracleSupport.
Platform (31000-32800)
4-20 Policy Management SNMP User's Guide
31122 - Excessive shared memory early warning
Alarm Group:MEM
Description:The amount of shared memory consumed exceeds configured early warningthresholds
Severity:Minor
Instance:May include AlarmLocation, AlarmId, AlarmState, AlarmSeverity, andbindVarNamesValueStr
HA Score:Normal
Auto Clear Seconds:300
OID:comcolExcessiveShMemConsumptionEarlyWarnNotify
Recovery:
1. This alarm indicates that a server is close to exceeding the engineered limit forshared memory usage and the application software is at risk to fail. There is noautomatic recovery or recovery steps.
2. It is recommended to contact My Oracle Support.
31123 - Database replication audit command complete
Alarm Group:REPL
Description:ADIC found one or more errors that are not automatically fixable.
Severity:Info
Instance:May include AlarmLocation, AlarmId, AlarmState, AlarmSeverity, andbindVarNamesValueStr
HA Score:Normal
Auto Clear Seconds:300
Platform (31000-32800)
Support for Traps 4-21
OID:comcolDbRepAuditCmdCompleteNotify
Recovery:
1. No action required.
31124 - ADIC error
Alarm Group:REPL
Description:An ADIC detected errors
Severity:Minor
Instance:May include AlarmLocation, AlarmId, AlarmState, AlarmSeverity, andbindVarNamesValueStr
HA Score:Normal
Auto Clear Seconds:300
OID:comcolDbRepAuditCmdErrNotify
Recovery:
1. It is recommended to contact My Oracle Support.
31125 - Database durability degraded
Alarm Group:REPL
Description:Database durability has dropped below configured durability level
Severity:Major
Instance:May include AlarmLocation, AlarmId, AlarmState, AlarmSeverity, andbindVarNamesValueStr
HA Score:Normal
Auto Clear Seconds:300
Platform (31000-32800)
4-22 Policy Management SNMP User's Guide
OID:comcolDbDurabilityDegradedNotify
Recovery:
1. Check configuration of all servers, and check for connectivity problems betweenserver addresses.
2. If the problem persists, it is recommended to contact My Oracle Support.
31126 - Audit blocked
Alarm Group:REPL
Description:Site Audit Controls blocked an inter-site replication audit due to the number inprogress per configuration.
Severity:Major
Instance:May include AlarmLocation, AlarmId, AlarmState, AlarmSeverity, andbindVarNamesValueStr
HA Score:Normal
Auto Clear Seconds:300
OID:comcolAuditBlockedNotify
Recovery:
1. This alarm indicates that WAN network usage has been limited following a siterecovery. No recovery action is needed.
31127 - DB Replication Audit Complete
Alarm Group:REPL
Description:DB replication audit completed
Severity:Info
Instance:May include AlarmLocation, AlarmId, AlarmState, AlarmSeverity, andbindVarNamesValueStr
Platform (31000-32800)
Support for Traps 4-23
HA Score:Normal
Auto Clear Seconds:300
OID:comcolDbRepAuditCompleteNotify
Recovery:
1. No action required.
31128 - ADIC Found Error
Alarm Group:REPL
Description:ADIC found one or more errors that are not automatically fixable.
Severity:Major
Instance:May include AlarmLocation, AlarmId, AlarmState, AlarmSeverity, andbindVarNamesValueStr
HA Score:Normal
Auto Clear Seconds:300
OID:comcolDbADICErrorNotify
Recovery:
1. This alarm indicates a data integrity error was found by the background databaseaudit mechanism, and there is no automatic recovery.
2. It is recommended to contact My Oracle Support.
31129 - ADIC Found Minor Issue
Alarm Group:REPL
Description:ADIC found one or more minor issues that can most likely be ignored
Severity:Minor
Platform (31000-32800)
4-24 Policy Management SNMP User's Guide
Instance:May include AlarmLocation, AlarmId, AlarmState, AlarmSeverity, andbindVarNamesValueStr
HA Score:Normal
Auto Clear Seconds:14400
OID:comcolDbADICWarn
Recovery:
1. No action required.
31130 - Network health warning
Alarm Group:NET
Description:Network health issue detected
Severity:Minor
Instance:May include AlarmLocation, AlarmId, AlarmState, AlarmSeverity, andbindVarNamesValueStr
HA Score:Normal
Auto Clear Seconds:300
OID:comcolNetworkHealthWarningNotify
Recovery:
1. Check configuration of all servers, and check for connectivity problems betweenserver addresses.
2. If the problem persists, it is recommended to contact My Oracle Support.
31131 - DB Ousted Throttle Behind
Alarm Group:DB
Description:DB ousted throttle may be affecting processes.
Platform (31000-32800)
Support for Traps 4-25
Severity:Minor
Instance:May include AlarmLocation, AlarmId, AlarmState, AlarmSeverity, andbindVarNamesValueStr
HA Score:Normal
Auto Clear Seconds:0 (zero)
OID:comcolOustedThrottleWarnNotify
Recovery:
1. This alarm indicates that a process has failed to release database memory segmentswhich is preventing new replication audits from taking place. There is no automaticrecovery for this failure.
2. Run 'procshm -o' to identify involved processes.
3. It is recommended to contact My Oracle Support.
31132 - DB Replication Precedence Relaxed
Event TypeREPL
DescriptionStandby Database updates are falling behind. Relaxing the replication barrier to allownon-Standby Databases to update as fast as possible.
SeverityInfo
InstanceRemote Node Name + HA resource name (if Policy 0, no resource name)
HA ScoreNormal
Throttle Seconds150
OIDcomcolDbRepPrecRelaxedNotify
Recovery
1. No action required.
Platform (31000-32800)
4-26 Policy Management SNMP User's Guide
31133 - DB Replication Switchover Exceeds Threshold
Alarm GroupREPL
DescriptionDB Replication Active to Standby switchover exceeded maximum switchover time.
SeverityMajor
InstanceRemote Node Name + HA resource name (if Policy 0, no resource name)
HA ScoreNormal
Auto Clear Seconds300
OIDcomcolDbRepSwitchoverNotify
Recovery
1. If this alarm is raised, it may indicate network congestion or spikes of trafficpushing servers beyond their capacity. Consider re-engineering network capacityor subscriber provisioning.
2. If the problem persists, it is recommended to contact My Oracle Support.
31134 - DB Site Replication To Slave Failure
Alarm GroupREPL
DescriptionDB Site replication to a slave DB has failed.
SeverityMinor
InstanceRemote Node Name + HA resource name (if Policy 0, no resource name)
HA ScoreNormal
Auto Clear Seconds300
OIDcomcolDbSiteRepToSlaveFailureNotify
Platform (31000-32800)
Support for Traps 4-27
Recovery
1. Check configuration of all servers, and check for connectivity problems betweenserver addresses.
2. If the problem persists, it is recommended to contact My Oracle Support.
31135 - DB Site Replication From Master Failure
Alarm GroupREPL
DescriptionDB Site replication from a master DB has failed.
SeverityMinor
InstanceRemote Node Name + HA resource name (if Policy 0, no resource name)
HA ScoreNormal
Auto Clear Seconds300
OIDcomcolDbSiteRepFromMasterFailureNotify
Recovery
1. Check configuration of all servers, and check for connectivity problems betweenserver addresses.
2. If the problem persists, it is recommended to contact My Oracle Support.
31136 - DB Site Replication Precedence Relaxed
Event TypeREPL
DescriptionStandby Site Database updates are falling behind. Relaxing the replication barrier toallow non-Standby Site Databases to update as fast as possible.
SeverityInfo
InstanceRemote Node Name + HA resource name (if Policy 0, no resource name)
HA ScoreNormal
Platform (31000-32800)
4-28 Policy Management SNMP User's Guide
Throttle Seconds150
OIDcomcolDbSiteRepPrecRelaxedNotify
Recovery
1. No action required.
31137 - DB Site Replication Latency Over Threshold
Alarm GroupREPL
DescriptionDB Site Replication latency has exceeded thresholds.
SeverityMajor
InstanceRemote Node Name + HA resource name (if Policy 0, no resource name)
HA ScoreNormal
Auto Clear Seconds300
OIDcomcolDbSiteRepLatencyNotify
Recovery
1. If this alarm is raised occasionally for short time periods (a couple of minutes orless), it may indicate network congestion or spikes of traffic pushing serversbeyond their capacity. Consider re-engineering network capacity or subscriberprovisioning.
2. If this alarm does not clear after a couple of minutes, it is recommended to contact My Oracle Support.
31140 - Database perl fault
Alarm Group:SW
Description:Perl interface to Database is impaired by a s/w fault
Severity:Minor
Platform (31000-32800)
Support for Traps 4-29
Instance:May include AlarmLocation, AlarmId, AlarmState, AlarmSeverity, andbindVarNamesValueStr
HA Score:Normal
Auto Clear Seconds:300
OID:comcolDbPerlFaultNotify
Recovery:
1. This alarm indicates an error has occurred within a Perl script, but the system hasrecovered.
2. If the alarm occurs repeatedly, it is recommended to contact My Oracle Support.
31145 - Database SQL fault
Alarm Group:SW
Description:SQL interface to Database is impaired by a s/w fault
Severity:Minor
Instance:May include AlarmLocation, AlarmId, AlarmState, AlarmSeverity, andbindVarNamesValueStr
HA Score:Normal
Auto Clear Seconds:300
OID:comcolDbSQLFaultNotify
Recovery:
1. This alarm indicates an error has occurred within the MySQL subsystem, but thesystem has recovered.
2. If this alarm occurs frequently, it is recommended to collect savelogs and contact My Oracle Support.
31146 - DB mastership fault
Platform (31000-32800)
4-30 Policy Management SNMP User's Guide
Alarm Group:SW
Description:DB replication is impaired due to no mastering process (inetrep/inetrep).
Severity:Major
Instance:May include AlarmLocation, AlarmId, AlarmState, AlarmSeverity, andbindVarNamesValueStr
HA Score:Normal
Auto Clear Seconds:300
OID:comcolDbMastershipFaultNotify
Recovery:
1. Export event history for the given server.
2. It is recommended to contact My Oracle Support.
31147 - DB upsynclog overrun
Alarm Group:SW
Description:UpSyncLog is not big enough for (WAN) replication.
Severity:Minor
Instance:May include AlarmLocation, AlarmId, AlarmState, AlarmSeverity, andbindVarNamesValueStr
HA Score:Normal
Auto Clear Seconds:300
OID:comcolDbUpSyncLogOverrunNotify
Recovery:
1. This alarm indicates that an error occurred within the database replicationsubsystem. A replication audit transfer took too long to complete, and during the
Platform (31000-32800)
Support for Traps 4-31
audit the incoming update rate exceeded the engineered size of the update log. Thereplication subsystem will automatically retry the audit, and if successful, thealarm will clear.
2. If the alarm occurs repeatedly, it is recommended to contact My Oracle Support.
31148 - DB lock error detected
Alarm Group:DB
Description:The DB service process (idbsvc) has detected an IDB lock-related error caused byanother process. The alarm likely indicates a DB lock-related programming error, or itcould be a side effect of a process crash.
Severity:Minor
Instance:May include AlarmLocation, AlarmId, AlarmState, AlarmSeverity, andbindVarNamesValueStr
HA Score:Normal
Auto Clear Seconds:300
OID:comcolDbLockErrorNotify
Recovery:
1. This alarm indicates an error occurred within the database disk service subsystem,but the system has recovered.
2. If this alarm occurs repeatedly, it is recommended to contact My Oracle Support.
31149 - DB Late Write Nonactive
Alarm GroupDB
DescriptionApplication wrote to database while HA role change from active was in progress.
SeverityMinor
InstanceHA resource name
HA ScoreNormal
Platform (31000-32800)
4-32 Policy Management SNMP User's Guide

Auto Clear Seconds3600
OIDcomcolDbLateWriteNotify
Recovery
1. It is recommended to contact #unique_86 for assistance.
31200 - Process management fault
Alarm Group:SW
Description:The process manager (procmgr) is impaired by a s/w fault
Severity:Minor
Instance:May include AlarmLocation, AlarmId, AlarmState, AlarmSeverity, andbindVarNamesValueStr
HA Score:Normal
Auto Clear Seconds:300
OID:comcolProcMgmtFaultNotify
Recovery:
1. This alarm indicates an error occurred within the process management subsystem,but the system has recovered.
2. If this alarm occurs repeatedly, it is recommended to contact My Oracle Support.
31201 - Process not running
Alarm Group:PROC
Description:A managed process cannot be started or has unexpectedly terminated
Severity:Major
Instance:May include AlarmLocation, AlarmId, AlarmState, AlarmSeverity, andbindVarNamesValueStr
Platform (31000-32800)
Support for Traps 4-33
HA Score:Normal
Auto Clear Seconds:300
OID:comcolProcNotRunningNotify
Recovery:
1. This alarm indicates that the managed process exited unexpectedly due to amemory fault, but the process was automatically restarted.
2. It is recommended to collect savelogs and contact My Oracle Support.
31202 - Unkillable zombie process
Alarm Group:PROC
Description:A zombie process exists that cannot be killed by procmgr. procmgr will no longermanage this process.
Severity:Major
Instance:May include AlarmLocation, AlarmId, AlarmState, AlarmSeverity, andbindVarNamesValueStr
HA Score:Normal
Auto Clear Seconds:300
OID:comcolProcZombieProcessNotify
Recovery:
1. This alarm indicates managed process exited unexpectedly and was unable to berestarted automatically.
2. It is recommended to collect savelogs and contact My Oracle Support.
31206 - Process mgmt monitoring fault
Alarm Group:SW
Description:The process manager monitor (pm.watchdog) is impaired by a s/w fault
Platform (31000-32800)
4-34 Policy Management SNMP User's Guide
Severity:Minor
Instance:May include AlarmLocation, AlarmId, AlarmState, AlarmSeverity, andbindVarNamesValueStr
HA Score:Normal
Auto Clear Seconds:300
OID:comcolProcMgmtMonFaultNotify
Recovery:
1. This alarm indicates an error occurred within the process management subsystem,but the system has recovered.
2. If this alarm occurs repeatedly, it is recommended to contact My Oracle Support.
31207 - Process resource monitoring fault
Alarm Group:SW
Description:The process resource monitor (ProcWatch) is impaired by a s/w fault
Severity:Minor
Instance:May include AlarmLocation, AlarmId, AlarmState, AlarmSeverity, andbindVarNamesValueStr
HA Score:Normal
Auto Clear Seconds:300
OID:comcolProcResourceMonFaultNotify
Recovery:
1. This alarm indicates an error occurred within the process monitoring subsystem,but the system has recovered.
2. If this alarm occurs repeatedly, it is recommended to contact My Oracle Support.
Platform (31000-32800)
Support for Traps 4-35
31208 - IP port server fault
Alarm Group:SW
Description:The run environment port mapper (re.portmap) is impaired by a s/w fault
Severity:Minor
Instance:May include AlarmLocation, AlarmId, AlarmState, AlarmSeverity, andbindVarNamesValueStr
HA Score:Normal
Auto Clear Seconds:300
OID:comcolPortServerFaultNotify
Recovery:
1. This alarm indicates an error occurred within the port mapping subsystem, but thesystem has recovered.
2. If this alarm occurs repeatedly, it is recommended to contact My Oracle Support.
31209 - Hostname lookup failed
Alarm Group:SW
Description:Unable to resolve a hostname specified in the NodeInfo table
Severity:Minor
Instance:May include AlarmLocation, AlarmId, AlarmState, AlarmSeverity, andbindVarNamesValueStr
HA Score:Normal
Auto Clear Seconds:300
OID:comcolHostLookupFailedNotify
Platform (31000-32800)
4-36 Policy Management SNMP User's Guide
Recovery:
1. This typically indicates a DNS Lookup failure. Verify all server hostnames arecorrect in the GUI configuration on the server generating the alarm.
2. If the problem persists, it is recommended to contact My Oracle Support.
31213 - Process scheduler fault
Alarm Group:SW
Description:The process scheduler (ProcSched/runat) is impaired by a s/w fault
Severity:Minor
Instance:May include AlarmLocation, AlarmId, AlarmState, AlarmSeverity, andbindVarNamesValueStr
HA Score:Normal
Auto Clear Seconds:300
OID:comcolProcSchedulerFaultNotify
Recovery:
1. This alarm indicates an error occurred within the process management subsystem,but the system has recovered.
2. If this alarm occurs repeatedly, it is recommended to contact My Oracle Support.
31214 - Scheduled process fault
Alarm Group:PROC
Description:A scheduled process cannot be executed or abnormally terminated
Severity:Minor
Instance:May include AlarmLocation, AlarmId, AlarmState, AlarmSeverity, andbindVarNamesValueStr
HA Score:Normal
Platform (31000-32800)
Support for Traps 4-37
Auto Clear Seconds:300
OID:comcolScheduleProcessFaultNotify
Recovery:
1. This alarm indicates that a managed process exited unexpectedly due to a memoryfault, but the system has recovered.
2. It is recommended to contact My Oracle Support.
31215 - Process resources exceeded
Alarm Group:SW
Description:A process is consuming excessive system resources.
Severity:Minor
Instance:May include AlarmLocation, AlarmId, AlarmState, AlarmSeverity, andbindVarNamesValueStr
HA Score:Normal
Auto Clear Seconds:14400
OID:comcolProcResourcesExceededFaultNotify
Recovery:
1. This alarm indicates a process has exceeded the engineered limit for heap usageand there is a risk the application software will fail.
2. Because there is no automatic recovery for this condition, it is recommended tocontact My Oracle Support.
31216 - SysMetric configuration error
Alarm Group:SW
Description:A SysMetric Configuration table contains invalid data
Severity:Minor
Platform (31000-32800)
4-38 Policy Management SNMP User's Guide
Instance:May include AlarmLocation, AlarmId, AlarmState, AlarmSeverity, andbindVarNamesValueStr
HA Score:Normal
Auto Clear Seconds:300
OID:comcolSysMetricConfigErrorNotify
Recovery:
1. This alarm indicates a system metric is configured incorrectly.
2. It is recommended to contact My Oracle Support.
31217 - Network Health Warning
Alarm GroupSW
DescriptionMissed Heartbeats Detected
SeverityMinor
InstanceIP Address
HA ScoreNormal
Auto Clear Seconds300
OIDcomcolNetworkHealthWarningNotify
Recovery
1. Check configuration of all servers, and check for connectivity problems betweenserver addresses.
2. If the problem persists, it is recommended to contact My Oracle Support.
31220 - HA configuration monitor fault
Alarm Group:SW
Platform (31000-32800)
Support for Traps 4-39
Description:The HA configuration monitor is impaired by a s/w fault.
Severity:Minor
Instance:May include AlarmLocation, AlarmId, AlarmState, AlarmSeverity, andbindVarNamesValueStr
HA Score:Normal
Auto Clear Seconds:300
OID:comcolHaCfgMonitorFaultNotify
Recovery:
1. It is recommended to contact My Oracle Support.
31221 - HA alarm monitor fault
Alarm Group:SW
Description:The high availability alarm monitor is impaired by a s/w fault
Severity:Minor
Instance:May include AlarmLocation, AlarmId, AlarmState, AlarmSeverity, andbindVarNamesValueStr
HA Score:Normal
Auto Clear Seconds:300
OID:comcolHaAlarmMonitorFaultNotify
Recovery:
1. It is recommended to contact My Oracle Support.
31222 - HA not configured
Alarm Group:HA
Platform (31000-32800)
4-40 Policy Management SNMP User's Guide
Description:High availability is disabled due to system configuration
Severity:Minor
Instance:May include AlarmLocation, AlarmId, AlarmState, AlarmSeverity, andbindVarNamesValueStr
HA Score:Normal
Auto Clear Seconds:300
OID:comcolHaNotConfiguredNotify
Recovery:
1. It is recommended to contact My Oracle Support.
31223 - HA Heartbeat transmit failure
Alarm Group:HA
Description:The high availability monitor failed to send heartbeat.
Severity:Major
Instance:May include AlarmLocation, AlarmId, AlarmState, AlarmSeverity, andbindVarNamesValueStr
HA Score:Normal
Auto Clear Seconds:300
OID:comcolHaHbTransmitFailureNotify
Recovery:
1. This alarm clears automatically when the server successfully registers for HAheartbeating.
2. If this alarm does not clear after a couple minutes, it is recommended to contact MyOracle Support.
Platform (31000-32800)
Support for Traps 4-41
31224 - HA configuration error
Alarm Group:HA
Description:High availability configuration error
Severity:Major
Instance:May include AlarmLocation, AlarmId, AlarmState, AlarmSeverity, andbindVarNamesValueStr
HA Score:Normal
Auto Clear Seconds:300
OID:comcolHaCfgErrorNotify
Recovery:
1. This alarm indicates a platform configuration error in the High Availability or VIPmanagement subsystem.
2. Because there is no automatic recovery for this condition, it is recommended tocontact My Oracle Support.
31225 - HA service start failure
Alarm Group:HA
Description:The required high availability resource failed to start.
Severity:Major
Instance:May include AlarmLocation, AlarmId, AlarmState, AlarmSeverity, andbindVarNamesValueStr
HA Score:Normal
Auto Clear Seconds:0
Platform (31000-32800)
4-42 Policy Management SNMP User's Guide
OID:comcolHaSvcStartFailureNotify
Recovery:
1. This alarm clears automatically when the HA daemon is successfully started.
2. If this alarm does not clear after a couple minutes, it is recommended to contact MyOracle Support.
31226 - HA availability status degraded
Alarm Group:HA
Description:The high availability status is degraded due to raised alarms.
Severity:Major
Instance:May include AlarmLocation, AlarmId, AlarmState, AlarmSeverity, andbindVarNamesValueStr
HA Score:Normal
Auto Clear Seconds:0
OID:comcolHaAvailDegradedNotify
Recovery:
1. View alarms dashboard for other active alarms on this server.
2. Follow corrective actions for each individual alarm on the server to clear them.
3. If the problem persists, it is recommended to contact My Oracle Support.
31227 - HA availability status failed
Alarm Group:HA
Description:The high availability status is failed due to raised alarms.
Severity:Critical
Instance:May include AlarmLocation, AlarmId, AlarmState, AlarmSeverity, andbindVarNamesValueStr
Platform (31000-32800)
Support for Traps 4-43
HA Score:Normal
Auto Clear Seconds:N/A
OID:comcolHaAvailFailedNotify
Recovery:
1. View alarms dashboard for other active alarms on this server.
2. Follow corrective actions for each individual alarm on the server to clear them.
3. If the problem persists, it is recommended to contact My Oracle Support.
31228 - HA standby offline
Alarm Group:HA
Description:High availability standby server is offline.
Severity:Critical
Instance:May include AlarmLocation, AlarmId, AlarmState, AlarmSeverity, andbindVarNamesValueStr
HA Score:Normal
Auto Clear Seconds:0 (zero)
OID:comcolHaStandbyOfflineNotify
Recovery:
1. If loss of communication between the active and standby servers is causedintentionally by maintenance activity, alarm can be ignored; it clears automaticallywhen communication is restored between the two servers.
2. If communication fails at any other time, it is recommended to look for networkconnectivity issues and/or contact My Oracle Support.
31229 - HA score changed
Alarm Group:HA
Platform (31000-32800)
4-44 Policy Management SNMP User's Guide
Description:High availability health score changed
Severity:Info
Instance:May include AlarmLocation, AlarmId, AlarmState, AlarmSeverity, andbindVarNamesValueStr
HA Score:Normal
Auto Clear Seconds:300
OID:comcolHaScoreChangeNotify
Recovery:
1. Status message - no action required.
31230 - Recent alarm processing fault
Alarm Group:SW
Description:The recent alarm event manager (raclerk) is impaired by a s/w fault.
Severity:Minor
Instance:May include AlarmLocation, AlarmId, AlarmState, AlarmSeverity, andbindVarNamesValueStr
HA Score:Normal
Auto Clear Seconds:300
OID:comcolRecAlarmEvProcFaultNotify
Recovery:
1. This alarm indicates an error occurred within the alarm management subsystem,but the system has recovered.
2. If this alarm occurs repeatedly, it is recommended to contact My Oracle Support.
Platform (31000-32800)
Support for Traps 4-45
31231 - Platform alarm agent fault
Alarm Group:SW
Description:The platform alarm agent impaired by a s/w fault
Severity:Minor
Instance:May include AlarmLocation, AlarmId, AlarmState, AlarmSeverity, andbindVarNamesValueStr
HA Score:Normal
Auto Clear Seconds:300
OID:comcolPlatAlarmAgentNotify
Recovery:
1. This alarm indicates an error occurred within the alarm management subsystem,but the system has recovered.
2. If this alarm occurs repeatedly, it is recommended to contact My Oracle Support.
31232 - Late heartbeat warning
Alarm Group:HA
Description:High availability server has not received a message on specified path within theconfigured interval.
Severity:Minor
Instance:May include AlarmLocation, AlarmId, AlarmState, AlarmSeverity, andbindVarNamesValueStr
HA Score:Normal
Auto Clear Seconds:300
Platform (31000-32800)
4-46 Policy Management SNMP User's Guide
OID:comcolHaLateHeartbeatWarningNotify
Recovery:
1. No action is required. This is a warning and can be due to transient conditions. Ifthere continues to be no heartbeat from the server, alarm 31228 - HA standbyoffline occurs.
31233 - HA Path Down
Alarm Group:HA
Description:High availability path loss of connectivity
Severity:Major
Instance:May include AlarmLocation, AlarmId, AlarmState, AlarmSeverity, andbindVarNamesValueStr
HA Score:Normal
Auto Clear Seconds:300
OID:comcolHaPathDownNotify
Recovery:
1. If loss of communication between the active and standby servers over thesecondary path is caused intentionally by maintenance activity, alarm can beignored; it clears automatically when communication is restored between the twoservers.
2. If communication fails at any other time, look for network connectivity issues onthe secondary network.
3. It is recommended to contact My Oracle Support.
31234 - Untrusted Time Upon Initialization
Alarm Group:REPL
Description:Upon system initialization, the system time is not trusted probably because NTP ismisconfigured or the NTP servers are unreachable. There are often accompanyingPlatform alarms to guide correction. Generally, applications are not started if time is
Platform (31000-32800)
Support for Traps 4-47
not believed to be correct on start-up. Recovery will often will require rebooting theserver.
Severity:Critical
Instance:May include AlarmLocation, AlarmId, AlarmState, AlarmSeverity, andbindVarNamesValueStr
HA Score:Normal
Auto Clear Seconds:0 (zero)
OID:comcolUtrustedTimeOnInitNotify
Recovery:
1. Correct NTP configuration.
2. If the problem persists, it is recommended to contact My Oracle Support.
31235 - Untrusted Time After Initialization
Alarm Group:REPL
Description:After system initialization, the system time has become untrusted probably becauseNTP has reconfigured improperly, time has been manually changed, the NTP serversare unreachable, etc. There are often accompanying Platform alarms to guidecorrection. Generally, applications remain running, but time-stamped data is likelyincorrect, reports may be negatively affected, some behavior may be improper, etc.
Severity:Critical
Instance:May include AlarmLocation, AlarmId, AlarmState, AlarmSeverity, andbindVarNamesValueStr
HA Score:Normal
Auto Clear Seconds:0 (zero)
OID:comcolUtrustedTimePostInitNotify
Recovery:
1. Correct NTP configuration.
Platform (31000-32800)
4-48 Policy Management SNMP User's Guide
2. If the problem persists, it is recommended to contact My Oracle Support.
31236 - HA Link Down
Alarm Group:HA
Description:High availability TCP link is down.
Severity:Critical
Instance:Remote node being connected to plus the path identifier
HA Score:Normal
Auto Clear Seconds:300
OID:comcolHaLinkDownNotify
Recovery:
1. If loss of communication between the active and standby servers over the specifiedpath is caused intentionally by maintenance activity, alarm can be ignored; it clearsautomatically when communication is restored between the two servers.
2. If communication fails at any other time, it is recommended to look for networkconnectivity issues on the primary network and/or contact My Oracle Support.
31240 - Measurements collection fault
Alarm Group:SW
Description:The measurements collector (statclerk) is impaired by a s/w fault.
Severity:Minor
Instance:May include AlarmLocation, AlarmId, AlarmState, AlarmSeverity, andbindVarNamesValueStr
HA Score:Normal
Auto Clear Seconds:300
Platform (31000-32800)
Support for Traps 4-49
OID:comcolMeasCollectorFaultNotify
Recovery:
1. This alarm indicates that an error within the measurement subsystem has occurred,but that the system has recovered.
2. If this alarm occurs repeatedly, it is recommended to collect savelogs and contact My Oracle Support.
31250 - RE port mapping fault
Alarm Group:SW
Description:The IP service port mapper (re.portmap) is impaired by a s/w fault
Severity:Minor
Instance:May include AlarmLocation, AlarmId, AlarmState, AlarmSeverity, andbindVarNamesValueStr
HA Score:Normal
Auto Clear Seconds:300
OID:comcolRePortMappingFaultNotify
Recovery:
1. This typically indicates a DNS Lookup failure. Verify all server hostnames arecorrect in the GUI configuration on the server generating the alarm.
31260 - SNMP Agent
Alarm Group:SW
Description:The SNMP agent (cmsnmpa) is impaired by a s/w fault.
Severity:Minor
Instance:May include AlarmLocation, AlarmId, AlarmState, AlarmSeverity, andbindVarNamesValueStr
Platform (31000-32800)
4-50 Policy Management SNMP User's Guide
HA Score:Normal
Auto Clear Seconds:300
OID:eagleXgDsrDbcomcolSnmpAgentNotify
Recovery:
1. This alarm indicates an error occurred within the SNMP subsystem, but the systemhas recovered.
2. If this alarm occurs repeatedly, it is recommended to collect savelogs and contact My Oracle Support.
31261 - SNMP Configuration Error
Alarm GroupSW
DescriptionA SNMP configuration error was detected
SeverityMinor
InstancecomcolAlarmSrcNode, comcolAlarmNumber, comcolAlarmInstance,comcolAlarmSeverity, comcolAlarmText, comcolAlarmInfo, comcolAlarmGroup,comcolServerHostname, comcolAlarmSequence, comcolAlarmTimestamp,comcolAlarmEventType, comcolAlarmProbableCause, comcolAlarmAdditionalInfo
HA ScoreNormal
Auto Clear Seconds0 (zero)
OIDcomcolSnmpConfigNotify
Recovery
1. Export event history for the given server and all processes.
2. It is recommended to contact My Oracle Support for assistance.
31270 - Logging output
Alarm Group:SW
Platform (31000-32800)
Support for Traps 4-51
Description:Logging output set to Above Normal
Severity:Minor
Instance:May include AlarmLocation, AlarmId, AlarmState, AlarmSeverity, andbindVarNamesValueStr
HA Score:Normal
Auto Clear Seconds:300
OID:comcolLoggingOutputNotify
Recovery:
1. Extra diagnostic logs are being collected, potentially degrading systemperformance. Turn off the debugging log.
31280 - HA Active to Standby transition
Alarm Group:HA
Description:HA active to standby activity transition
Severity:Info
Instance:May include AlarmLocation, AlarmId, AlarmState, AlarmSeverity, andbindVarNamesValueStr
HA Score:Normal
Auto Clear Seconds:300
OID:comcolActiveToStandbyTransNotify
Recovery:
1. If this alarm occurs during routine maintenance activity, it may be ignored.
2. Otherwise, it is recommended to contact My Oracle Support.
Platform (31000-32800)
4-52 Policy Management SNMP User's Guide
31281 - HA Standby to Active transition
Alarm Group:HA
Description:HA standby to active activity transition
Severity:Info
Instance:May include AlarmLocation, AlarmId, AlarmState, AlarmSeverity, andbindVarNamesValueStr
HA Score:Normal
Auto Clear Seconds:300
OID:comcolStandbyToActiveTransNotify
Recovery:
1. If this alarm occurs during routine maintenance activity, it may be ignored.
2. Otherwise, it is recommended to contact My Oracle Support.
31282 - HA Management Fault
Alarm Group:HA
Description:The HA manager (cmha) is impaired by a software fault.
Severity:Minor
Instance:May include AlarmLocation, AlarmId, AlarmState, AlarmSeverity, andbindVarNamesValueStr
HA Score:Normal
Auto Clear Seconds:300
OID:comcolHaMgmtFaultNotify
Platform (31000-32800)
Support for Traps 4-53
Recovery:
1. This alarm indicates an error occurred within the High Availability subsystem, butthe system has automatically recovered.
2. If the alarm occurs frequently, it is recommended to contact My Oracle Support.
31283 - Lost Communication with server
Alarm Group:HA
Description:Highly available server failed to receive mate heartbeats
Severity:Critical
Instance:May include AlarmLocation, AlarmId, AlarmState, AlarmSeverity, andbindVarNamesValueStr
HA Score:Normal
Auto Clear Seconds:0 (zero)
OID:comcolHaServerOfflineNotify
Recovery:
1. If loss of communication between the active and standby servers is causedintentionally by maintenance activity, alarm can be ignored; it clears automaticallywhen communication is restored between the two servers.
2. If communication fails at any other time, look for network connectivity issuesand/or it is recommended to contact My Oracle Support for assistance.
31284 - HA Remote Subscriber Heartbeat Warning
Alarm Group:HA
Description:High availability remote subscriber has not received a heartbeat within the configuredinterval.
Severity:Minor
Instance:May include AlarmLocation, AlarmId, AlarmState, AlarmSeverity, andbindVarNamesValueStr
Platform (31000-32800)
4-54 Policy Management SNMP User's Guide
HA Score:Normal
Auto Clear Seconds:300
OID:comcolHaRemoteHeartbeatWarningNotify
Recovery:
1. No action required. This is a warning and can be due to transient conditions. Theremote subscriber will move to another server in the cluster.
2. If there continues to be no heartbeat from the server, it is recommended to contact My Oracle Support.
31285 - HA Node Join Recovery Entry
Alarm Group:HA
Description:High availability node join recovery entered
Severity:Info
Instance:Cluster set key of the DC outputting the event
HA Score:Normal
Auto Clear Seconds:300
OID:comcolHaSbrEntryNotify
Recovery:
1. No action required; this is a status message generated when one or moreunaccounted for nodes join the designated coordinators group.
31286 - HA Node Join Recovery Plan
Alarm Group:HA
Description:High availability node join recovery plan
Severity:Info
Platform (31000-32800)
Support for Traps 4-55
Instance:Names of HA Policies (as defined in HA policy configuration)
HA Score:Normal
Auto Clear Seconds:300
OID:comcolHaSbrPlanNotify
Recovery:
1. No action required; this is a status message output when the designatedcoordinator generates a new action plan during node join recovery.
31287 - HA Node Join Recovery Complete
Alarm Group:HA
Description:High availability node join recovery complete
Severity:Info
Instance:Names of HA Policies (as defined in HA policy configuration)
HA Score:Normal
Auto Clear Seconds:300
OID:comcolHaSbrCompleteNotify
Recovery:
1. No action required; this is a status message output when the designatedcoordinator finishes running an action plan during node join recovery.
31288 - HA Site Configuration Error
Alarm GroupHA
DescriptionHigh availability site configuration error
SeverityCritical
Platform (31000-32800)
4-56 Policy Management SNMP User's Guide
InstanceGroupName, Policy ID, Site Name
HA ScoreNormal
Auto Clear Seconds0 (zero)
OIDcomcolHaBadSiteCfgNotify
Recovery
1. If this alarm does not clear after correcting the configuration, it is recommended tocontact My Oracle Support for assistance.
31290 - HA Process Status
Alarm Group:HA
Description:HA manager (cmha) status
Severity:Info
Instance:May include AlarmLocation, AlarmId, AlarmState, AlarmSeverity, andbindVarNamesValueStr
HA Score:Normal
Auto Clear Seconds:300
OID:comcolHaProcessStatusNotify
Recovery:
1. This event is used for internal logging. No action is required.
31291 - HA Election Status
Alarm Group:HA
Description:HA DC Election status
Severity:Info
Platform (31000-32800)
Support for Traps 4-57
Instance:May include AlarmLocation, AlarmId, AlarmState, AlarmSeverity, andbindVarNamesValueStr
HA Score:Normal
Auto Clear Seconds:300
OID:comcolHaElectionStatusNotify
Recovery:
1. This event is used for internal logging. No action is required.
31292 - HA Policy Status
Alarm Group:HA
Description:HA Policy plan status
Severity:Info
Instance:May include AlarmLocation, AlarmId, AlarmState, AlarmSeverity, andbindVarNamesValueStr
HA Score:Normal
Auto Clear Seconds:300
OID:comcolHaPolicyStatusNotify
Recovery:
1. This event is used for internal logging. No action is required.
31293 - HA Resource Link Status
Alarm Group:HA
Description:This alarm is raised for nodes in our topology that we should be connected to (i.e., notOOS), but that we do not have any TCP links to it over any configured paths. It doesnot matter why the links were not established (networking connectivity, node notrunning, etc.).
Platform (31000-32800)
4-58 Policy Management SNMP User's Guide
Severity:Info
Instance:May include AlarmLocation, AlarmId, AlarmState, AlarmSeverity, andbindVarNamesValueStr
HA Score:Normal
Auto Clear Seconds:300
OID:comcolHaRaLinkStatusNotify
Recovery:
1. If loss of communication between the active and standby servers is causedintentionally by maintenance activity, alarm can be ignored. It clears automaticallywhen communication is restored between the two servers.
2. If communication fails at any other time, look for network connectivity issues.
3. If the problem persists, it is recommended to contact My Oracle Support.
31294 - HA Resource Status
Alarm Group:HA
Description:HA Resource registration status
Severity:Info
Instance:May include AlarmLocation, AlarmId, AlarmState, AlarmSeverity, andbindVarNamesValueStr
HA Score:Normal
Auto Clear Seconds:300
OID:comcolHaResourceStatusNotify
Recovery:
1. This event is used for internal logging. No action is required.
Platform (31000-32800)
Support for Traps 4-59
31295 - HA Action Status
Alarm Group:HA
Description:HA Resource action status
Severity:Info
InstanceN/A
HA Score:Normal
Auto Clear Seconds:300
OID:comcolHaActionStatusNotify
Recovery:
1. This event is used for internal logging. No action is required.
31296 - HA Monitor Status
Alarm Group:HA
Description:HA Monitor action status
Severity:Info
Instance:May include AlarmLocation, AlarmId, AlarmState, AlarmSeverity, andbindVarNamesValueStr
HA Score:Normal
Auto Clear Seconds:300
OID:comcolHaMonitorStatusNotify
Recovery:
Platform (31000-32800)
4-60 Policy Management SNMP User's Guide
1. This event is used for internal logging. No action is required.
31297 - HA Resource Agent Info
Alarm Group:HA
Description:HA Resource Agent Info
Severity:Info
Instance:May include AlarmLocation, AlarmId, AlarmState, AlarmSeverity, andbindVarNamesValueStr
HA Score:Normal
Auto Clear Seconds:300
OID:comcolHaRaInfoNotify
Recovery:
1. This event is used for internal logging. No action is required.
31298 - HA Resource Agent Detail
Alarm Group:HA
Description:Resource Agent application detailed information
Severity:Info
Instance:May include AlarmLocation, AlarmId, AlarmState, AlarmSeverity, andbindVarNamesValueStr
HA Score:Normal
Auto Clear Seconds:300
OID:comcolHaRaDetailNotify
Platform (31000-32800)
Support for Traps 4-61
Recovery:
1. This event is used for internal logging. No action is required.
31299 - HA Notification Status
Alarm Group:HA
Description:HA Notification status
Severity:Info
Instance:May include AlarmLocation, AlarmId, AlarmState, AlarmSeverity, andbindVarNamesValueStr
HA Score:Normal
Auto Clear Seconds:300
OID:comcolHaNotificationNotify
Recovery:
1. No action required.
31300 - HA Control Status
Alarm Group:HA
Description:HA Control action status
Severity:Info
Instance:May include AlarmLocation, AlarmId, AlarmState, AlarmSeverity, andbindVarNamesValueStr
HA Score:Normal
Auto Clear Seconds:300
OID:comcolHaControlNotify
Platform (31000-32800)
4-62 Policy Management SNMP User's Guide
Recovery:
1. No action required.
31301 - HA Topology Events
Alarm Group:HA
Description:HA Topology events
Severity:Info
Instance:May include AlarmLocation, AlarmId, AlarmState, AlarmSeverity, andbindVarNamesValueStr
HA Score:Normal
Auto Clear Seconds:0 (zero)
OID:eagleXgDsrHaTopologyNotify
Recovery:
1. No action required.
31322 - HA Configuration Error
Alarm GroupHA
DescriptionHigh availability configuration error
SeverityMinor
InstanceNodeID, or HA Tunnel ID
HA ScoreNormal
Auto Clear Seconds0 (zero)
OIDcomcolHaBadCfgNotify
Platform (31000-32800)
Support for Traps 4-63
Recovery
1. It is recommended to contact #unique_86.
32100 - Breaker Panel Feed Unavailable
Alarm Group:PLAT
Description:Breaker Panel Breaker Unavailable
Severity:Critical
Instance:May include AlarmLocation, AlarmId, AlarmState, AlarmSeverity, andbindVarNamesValueStr
HA Score:Normal
Auto Clear Seconds:0 (zero)
OID:tpdBrkPnlFeedUnavailable
Recovery:
1. It is recommended to contact My Oracle Support to request hardware replacement.
32101 - Breaker Panel Breaker Failure
Alarm Group:PLAT
Description:Breaker Panel Breaker Failure
Severity:Critical
Instance:May include AlarmLocation, AlarmId, AlarmState, AlarmSeverity, andbindVarNamesValueStr
HA Score:Normal
Auto Clear Seconds:0 (zero)
OID:tpdBrkPnlBreakerFailure
Platform (31000-32800)
4-64 Policy Management SNMP User's Guide
Recovery
1. It is recommended to contact My Oracle Support to request hardware replacement.
32102 - Breaker Panel Monitoring Failure
Alarm Group: PLAT
Description: Breaker Panel Monitoring Failure
Severity: Critical
Instance: May include AlarmLocation, AlarmId, AlarmState, AlarmSeverity, andbindVarNamesValueStr
HA Score: Normal
Auto Clear Seconds: 0 (zero)
OID: tpdBrkPnlMntFailureNotify
Recovery
1. Contact My Oracle Support to request hardware replacement.
32103 - Power Feed Unavailable
Alarm Group:PLAT
Description:Power Feed Unavailable
Severity:Critical
Instance:May include AlarmLocation, AlarmId, AlarmState, AlarmSeverity, andbindVarNamesValueStr
HA Score:Normal
Auto Clear Seconds:0 (zero)
OID:tpdPowerFeedUnavail
Recovery
1. It is recommended to contact My Oracle Support to request hardware replacement.
32104 - Power Supply 1 Failure
Alarm Group:PLAT
Platform (31000-32800)
Support for Traps 4-65
Description:Power Supply 1 Failure
Severity:Critical
Instance:May include AlarmLocation, AlarmId, AlarmState, AlarmSeverity, andbindVarNamesValueStr
HA Score:Normal
Auto Clear Seconds:0 (zero)
OID:tpdPowerSupply1Failure
Recovery
1. It is recommended to contact My Oracle Support to request hardware replacement.
32105 - Power Supply 2 Failure
Alarm Group:PLAT
Description:Power Supply 2 Failure
Severity:Critical
Instance:May include AlarmLocation, AlarmId, AlarmState, AlarmSeverity, andbindVarNamesValueStr
HA Score:Normal
Auto Clear Seconds:0 (zero)
OID:tpdPowerSupply2Failure
Recovery
1. It is recommended to contact My Oracle Support to request hardware replacement.
32106 - Power Supply 3 Failure
Alarm Group: PLAT
Description: Power Supply 3 Failure
Platform (31000-32800)
4-66 Policy Management SNMP User's Guide
Severity: Critical
Instance: May include AlarmLocation, AlarmId, AlarmState, AlarmSeverity, andbindVarNamesValueStr
HA Score: Normal
Auto Clear Seconds: 0 (zero)
OID: tpdPowerSupply3FailureNotify
Recovery
1. Contact My Oracle Support to request hardware replacement.
32107 - Raid Feed Unavailable
Alarm Group:PLAT
Description:Raid Feed Unavailable
Severity:Critical
Instance:May include AlarmLocation, AlarmId, AlarmState, AlarmSeverity, andbindVarNamesValueStr
HA Score:Normal
Auto Clear Seconds:0 (zero)
OID:tpdRaidFeedUnavailable
Recovery
1. It is recommended to contact My Oracle Support to request hardware replacement.
32108 - Raid Power 1 Failure
Alarm Group:PLAT
Description:Raid Power 1 Failure
Severity:Critical
Instance:May include AlarmLocation, AlarmId, AlarmState, AlarmSeverity, andbindVarNamesValueStr
Platform (31000-32800)
Support for Traps 4-67
HA Score:Normal
Auto Clear Seconds:0 (zero)
OID:tpdRaidPower1Failure
Recovery
1. It is recommended to contact My Oracle Support to request hardware replacement.
32109 - Raid Power 2 Failure
Alarm Group:PLAT
Description:Raid Power 2 Failure
Severity:Critical
Instance:May include AlarmLocation, AlarmId, AlarmState, AlarmSeverity, andbindVarNamesValueStr
HA Score:Normal
Auto Clear Seconds:0 (zero)
OID:tpdRaidPower2Failure
Recovery
1. It is recommended to contact My Oracle Support to request hardware replacement.
32110 - Raid Power 3 Failure
Alarm Group:PLAT
Description:Raid Power 3 Failure
Severity:Critical
Instance:May include AlarmLocation, AlarmId, AlarmState, AlarmSeverity, andbindVarNamesValueStr
Platform (31000-32800)
4-68 Policy Management SNMP User's Guide
HA Score:Normal
Auto Clear Seconds:0 (zero)
OID:tpdRaidPower3Failure
Recovery
1. It is recommended to contact My Oracle Support to request hardware replacement.
32111 - Device Failure
Alarm Group:PLAT
Description:Device Failure
Severity:Critical
Instance:May include AlarmLocation, AlarmId, AlarmState, AlarmSeverity, andbindVarNamesValueStr
HA Score:Normal
Auto Clear Seconds:0 (zero)
OID:tpdDeviceFailure
Recovery:
1. It is recommended to contact My Oracle Support to request hardware replacement.
32112 - Device Interface Failure
Alarm Group:PLAT
Description:Device Interface Failure
Severity:Critical
Instance:May include AlarmLocation, AlarmId, AlarmState, AlarmSeverity, andbindVarNamesValueStr
Platform (31000-32800)
Support for Traps 4-69
HA Score:Normal
Auto Clear Seconds:0 (zero)
OID:tpdDeviceIfFailure
Recovery:
1. It is recommended to contact My Oracle Support to request hardware replacement.
32113 - Uncorrectable ECC memory error
Alarm Group:PLAT
Description:This alarm indicates that chipset has detected an uncorrectable (multiple-bit) memoryerror that the ECC (Error-Correcting Code) circuitry in the memory is unable tocorrect.
Severity:Critical
Instance:May include AlarmLocation, AlarmId, AlarmState, AlarmSeverity, andbindVarNamesValueStr
HA Score:Normal
Auto Clear Seconds:0 (zero)
OID:tpdEccUncorrectableError
Alarm ID:TKSPLATCR14
Recovery:
1. Contact the hardware vendor to request hardware replacement.
32114 - SNMP get failure
Alarm Group:PLAT
Description:The server failed to receive SNMP information from the switch.
Platform (31000-32800)
4-70 Policy Management SNMP User's Guide
Severity:Critical
Instance:May include AlarmLocation, AlarmId, AlarmState, AlarmSeverity, andbindVarNamesValueStr
HA Score:Normal
Auto Clear Seconds:0 (zero)
OID:tpdSNMPGetFailure
Alarm ID:TKSPLATCR15
Recovery:
1. Verify device is active and responds to the ping command.
2. If the problem persists, it is recommended to contact My Oracle Support.
32115 - TPD NTP Daemon Not Synchronized Failure
Alarm Group:PLAT
Description:This alarm indicates the server's current time precedes the timestamp of the lastknown time the servers time was good.
Severity:Critical
Instance:May include AlarmLocation, AlarmId, AlarmState, AlarmSeverity, andbindVarNamesValueStr
HA Score:Normal
Auto Clear Seconds:0 (zero)
OID:tpdNTPDaemonNotSynchronizedFailure
Alarm ID:TKSPLATCR16
Recovery:
Platform (31000-32800)
Support for Traps 4-71
1. Verify NTP settings and that NTP sources are providing accurate time.
a. Ensure ntpd service is running with correct options: -x -g.
b. Verify the content of the /etc/ntp.conf file is correct for the server.
c. Type /usr/sbin/ntpdc -c sysinfo to check the current state of the ntpddaemon.
d. Verify the ntp peer configuration; execute ntpq -np; and analyze the output.Verify peer data, such as tally code (first column before remote), remote, refid,stratum (st), and jitter, are valid for server.
e. Execute ntpstat to determine the ntp time synchronization status. If notsynchronized or the stratum is not correct for server, then ping the ntp peer todetermine if peer can be reached.
2. If ntp peer is reachable, then restart the ntpd service.
3. If problem persists, then a reset the NTP date may resolve the issue.
Note: Before resetting the ntp date, the applications may need to be stopped;and subsequent to the ntp reset, the application restarted.
a. Reset ntpd:
• sudo service ntpd stop
• sudo ntpdate <ntp server ip>
• sudo service ntpd start
4. Conform to recommended NTP topology and strategy.
• No fewer than tree references are recommended.
• If selecting a different number, the number should be odd.
• No intermediate reference should be a virtualized server.
• Additional recommendations and topology are available in NTP Strategysection in the DSR Hardware and Software Installation 1/2 customerdocument
5. If the problem persists, it is recommended to contact My Oracle Support.
32116 - TPD Server's Time Has Gone Backwards
Alarm Group:PLAT
Description:This alarm indicates the server's current time precedes the timestamp of the lastknown time the servers time was good.
Severity:Critical
Platform (31000-32800)
4-72 Policy Management SNMP User's Guide
Instance:May include AlarmLocation, AlarmId, AlarmState, AlarmSeverity, andbindVarNamesValueStr
HA Score:Normal
Auto Clear Seconds:0 (zero)
OID:tpdNTPTimeGoneBackwards
Alarm ID:TKSPLATCR17
Recovery:
1. Verify NTP settings and NTP sources are providing accurate time.
a. Ensure ntpd service is running with correct options: -x -g
b. Verify the content of the /etc/ntp.conf file is correct for the server.
c. Type /usr/sbin/ntpdc -c sysinfo to check the current state of the ntpddaemon.
d. Verify the ntp peer configuration; execute ntpq -p; and analyze the output.Verify peer data, such as tally code (first column before remote), remote, refid,stratum (st), and jitter, are valid for server.
e. Execute ntpstat to determine the ntp time synchronization status. If notsynchronized or the stratum is not correct for server, then ping the ntp peer todetermine if peer can be reached.
2. If ntp peer is reachable, then restart the ntpd service.
3. If problem persists, then a reset the NTP date may resolve the issue.
Note: Before resetting the ntp date, the applications may need to be stopped;and subsequent to the ntp reset, the application restarted.
a. Reset ntpd:
• sudo service ntpd stop
• sudo ntpdate <ntp server ip>
• sudo service ntpd start
4. Conform to recommended NTP topology and strategy.
• No fewer than tree references are recommended.
• If selecting a different number, the number should be odd.
• No intermediate reference should be a virtualized server.
Platform (31000-32800)
Support for Traps 4-73
• Additional recommendations and topology are available in NTP Strategysection in the DSR Hardware and Software Installation 1/2 customerdocument
5. If the problem persists, it is recommended to contact My Oracle Support.
32117 - TPD NTP Offset Check Failure
Alarm Group:PLAT
Description:This alarm indicates the NTP offset of the server that is currently being synced to isgreater than the critical threshold.
Severity:Critical
Instance:May include AlarmLocation, AlarmId, AlarmState, AlarmSeverity, andbindVarNamesValueStr
HA Score:Normal
Auto Clear Seconds:0 (zero)
OID:ntpOffsetCheckFailure
Alarm ID:TKSPLATCR18
Recovery:
1. Verify NTP settings and NTP sources can be reached.
a. Ensure ntpd service is running using ps -ef | grep or service ntpdstatus.
b. Verify the content of the /etc/ntp.conf file is correct for the server.
c. Type /usr/sbin/ntpdc -c sysinfo to check the current state of the ntpddaemon.
d. Verify the ntp peer configuration; execute ntpq -p; and analyze the output.Verify peer data, such as tally code (first column before remote), remote, refid,stratum (st), and jitter, are valid for server.
e. Execute ntpstat to determine the ntp time synchronization status. If notsynchronized or the stratum is not correct for server, then ping the ntp peer todetermine if peer can be reached.
2. If ntp peer is reachable, then restart the ntpd service.
3. If problem persists, then a reset the NTP date may resolve the issue.
Platform (31000-32800)
4-74 Policy Management SNMP User's Guide
Note: Before resetting the ntp date, the applications may need to be stopped;and subsequent to the ntp reset, the application restarted.
a. To reset date:
• sudo service ntpd stop
• sudo ntpdate <ntp server ip>
• sudo service ntpd start
4. Conform to recommended NTP topology and strategy.
• No fewer than tree references are recommended.
• If selecting a different number, the number should be odd.
• No intermediate reference should be a virtualized server.
• Additional recommendations and topology are available in NTP Strategysection in the DSR Hardware and Software Installation 1/2 customerdocument
5. If the problem persists, it is recommended to contact My Oracle Support.
32300 - Server fan failure
Alarm Group:PLAT
Description:This alarm indicates that a fan on the application server is either failing or has failedcompletely. In either case, there is a danger of component failure due to overheating.
Severity:Major
Instance:May include AlarmLocation, AlarmId, AlarmState, AlarmSeverity, andbindVarNamesValueStr
HA Score:Normal
Auto Clear Seconds:0 (zero)
OID:tpdFanError
Alarm ID:TKSPLATMA1
Recovery:
Platform (31000-32800)
Support for Traps 4-75
1. Run Syscheck in Verbose mode to determine which server fan assemblies is failingand replace the fan assembly.
2. If the problem persists, it is recommended to contact My Oracle Support.
32301 - Server internal disk error
Alarm Group:PLAT
Description:This alarm indicates the server is experiencing issues replicating data to one or moreof its mirrored disk drives. This could indicate that one of the server’s disks has eitherfailed or is approaching failure.
Severity:Major
Instance:May include AlarmLocation, AlarmId, AlarmState, AlarmSeverity, andbindVarNamesValueStr
HA Score:Normal
Auto Clear Seconds:0 (zero)
OID:tpdIntDiskError
Alarm ID:TKSPLATMA2
Recovery:
1. Run syscheck in verbose mode.
2. Determine the raid state of the mirrored disks, collect data:
cat /proc/mdstatcat /etc/raidtab
3. It is recommended to contact My Oracle Support and provide the system healthcheck output and collected data.
32303 - Server Platform error
Alarm Group:PLAT
Description:This alarm indicates an error such as a corrupt system configuration or missing files.
Platform (31000-32800)
4-76 Policy Management SNMP User's Guide
Severity:Major
Instance:May include AlarmLocation, AlarmId, AlarmState, AlarmSeverity, andbindVarNamesValueStr
HA Score:Normal
Auto Clear Seconds:0 (zero)
OID:tpdPlatformError
Alarm ID:TKSPLATMA4
Recovery:
1. Run syscheck in verbose mode.
2. Determine the raid state of the mirrored disks, collect data:
cat /proc/mdstatcat /etc/raidtab
3. It is recommended to contact My Oracle Support and provide the system healthcheck output and collected data.
32304 - Server file system error
Alarm Group:PLAT
Description:This alarm indicates unsuccessful writing to at least one of the server’s file systems.
Severity:Major
Instance:May include AlarmLocation, AlarmId, AlarmState, AlarmSeverity, andbindVarNamesValueStr
HA Score:Normal
Auto Clear Seconds:0 (zero)
OID:tpdFileSystemError
Alarm ID:TKSPLATMA5
Platform (31000-32800)
Support for Traps 4-77
Recovery:
1. Run syscheck in verbose mode.
2. Address full file systems identified in syscheck output, and run syscheck in verbosemode.
3. It is recommended to contact My Oracle Support and provide the system healthcheck output.
32305 - Server Platform process error
Alarm Group:PLAT
Description:This alarm indicates that either the minimum number of instances for a requiredprocess are not currently running or too many instances of a required process arerunning.
Severity:Major
Instance:May include AlarmLocation, AlarmId, AlarmState, AlarmSeverity, andbindVarNamesValueStr
HA Score:Normal
Auto Clear Seconds:0 (zero)
OID:tpdPlatProcessError
Alarm ID:TKSPLATMA6
Recovery:
1. Rerun syscheck in verbose mode.
2. If the alarm has been cleared then the problem is solved.
3. If the alarm has not been cleared then determine the run level of the system.
4. If system run level is not 4 then determine why the system is operating at that runlevel.
5. If system run level is 4, determine why the required number of instancesprocess(es) are not running.
6. If the alarm persists, it is recommended to contact My Oracle Support and providethe system health check output.
Platform (31000-32800)
4-78 Policy Management SNMP User's Guide
32306 - Server RAM shortage error
Alarm Group:PLAT
Description:Not Implemented.
Severity:Major
Instance:May include AlarmLocation, AlarmId, AlarmState, AlarmSeverity, andbindVarNamesValueStr
HA Score:Normal
Auto Clear Seconds:0 (zero)
OID:tpdRamShortageError
Recovery
1. It is recommended to contact My Oracle Support.
32307 - Server swap space shortage failure
Alarm Group:PLAT
Description:This alarm indicates that the server’s swap space is in danger of being depleted. Thisis usually caused by a process that has allocated a very large amount of memory overtime.
Severity:Major
Instance:May include AlarmLocation, AlarmId, AlarmState, AlarmSeverity, andbindVarNamesValueStr
HA Score:Normal
Auto Clear Seconds:0 (zero)
OID:tpdSwapSpaceShortageError
Platform (31000-32800)
Support for Traps 4-79
Alarm ID:TKSPLATMA8
Recovery:
1. Run syscheck in verbose mode.
2. Determine processes using swap.
Note: One method to determine the amount of swap being used by process is:grep VmSwap /proc/<process id>/status
3. It is recommended to contact My Oracle Support and provide the system healthcheck output and process swap usage.
32308 - Server provisioning network error
Alarm Group:PLAT
Description:This alarm indicates that the connection between the server’s ethernet interface andthe customer network is not functioning properly.
Severity:Major
Instance:May include AlarmLocation, AlarmId, AlarmState, AlarmSeverity, andbindVarNamesValueStr
HA Score:Normal
Auto Clear Seconds:0 (zero)
OID:tpdProvNetworkError
Alarm ID:TKSPLATMA9
Recovery:
1. Verify that a customer-supplied cable labeled TO CUSTOMER NETWORK issecurely connected to the appropriate server. Follow the cable to its connectionpoint on the local network and verify this connection is also secure.
2. Test the customer-supplied cable labeled TO CUSTOMER NETWORK with anEthernet Line Tester. If the cable does not test positive, replace it.
3. Have your network administrator verify that the network is functioning properly.
Platform (31000-32800)
4-80 Policy Management SNMP User's Guide
4. If no other nodes on the local network are experiencing problems and the fault hasbeen isolated to the server or the network administrator is unable to determine theexact origin of the problem, it is recommended to contact My Oracle Support.
32309 - Eagle Network A Error
Alarm Group:PLAT
Description:Uncorrectable ECC Memory Error -- This alarm indicates that chipset has detected anuncorrectable (multiple-bit) memory error that the ECC (Error-Correcting Code)circuitry in the memory is unable to correct.
Severity:Critical
Instance:May include AlarmLocation, AlarmId, AlarmState, AlarmSeverity, andbindVarNamesValueStr
HA Score:Normal
Auto Clear Seconds:0 (zero)
OID:tpdEagleNetworkAError
Recovery
1. It is recommended to contact My Oracle Support to request hardware replacement.
32310 - Eagle Network B Error
Alarm Group:PLAT
Description:Uncorrectable ECC Memory Error -- This alarm indicates that chipset has detected anuncorrectable (multiple-bit) memory error that the ECC (Error-Correcting Code)circuitry in the memory is unable to correct.
Severity:Critical
Instance:May include AlarmLocation, AlarmId, AlarmState, AlarmSeverity, andbindVarNamesValueStr
HA Score:Normal
Platform (31000-32800)
Support for Traps 4-81
Auto Clear Seconds:0 (zero)
OID:tpdEagleNetworkBError
Recovery
1. It is recommended to contact My Oracle Support to request hardware replacement.
32311 - Sync Network Error
Alarm Group:PLAT
Description:Uncorrectable ECC Memory Error -- This alarm indicates that chipset has detected anuncorrectable (multiple-bit) memory error that the ECC (Error-Correcting Code)circuitry in the memory is unable to correct.
Severity:Critical
Instance:May include AlarmLocation, AlarmId, AlarmState, AlarmSeverity, andbindVarNamesValueStr
HA Score:Normal
Auto Clear Seconds:0 (zero)
OID:tpdSyncNetworkError
Recovery
1. It is recommended to contact My Oracle Support to request hardware replacement.
32312 - Server disk space shortage error
Alarm Group:PLAT
Description:This alarm indicates that one of the following conditions has occurred:
• A file system has exceeded a failure threshold, which means that more than 90%of the available disk storage has been used on the file system.
• More than 90% of the total number of available files have been allocated on thefile system.
Platform (31000-32800)
4-82 Policy Management SNMP User's Guide
• A file system has a different number of blocks than it had when installed.
Severity:Major
Instance:May include AlarmLocation, AlarmId, AlarmState, AlarmSeverity, andbindVarNamesValueStr
HA Score:Normal
Auto Clear Seconds:0 (zero)
OID:tpdDiskSpaceShortageError
Alarm ID:TKSPLATMA13
Recovery:
1. Run syscheck in verbose mode.
2. Examine contents of identified volume in syscheck output to determine if any largefiles are in the file system. Delete unnecessary files, or move files off of server.Capture output from "du -sx <file system>".
3. Capture output from "df -h" and "df -i" commands.
4. Determine processes using the file system(s) that have exceeded the threshold.
5. It is recommended to contact My Oracle Support and provide the system healthcheck output and provide additional file system output.
32313 - Server default route network error
Alarm Group:PLAT
Description:This alarm indicates that the default network route of the server is experiencing aproblem.
Caution: When changing the network routing configuration of the server,verify that the modifications will not impact the method of connectivity forthe current login session. The route information must be entered correctly andset to the correct values. Incorrectly modifying the routing configuration ofthe server may result in total loss of remote network access.
Severity:Major
Platform (31000-32800)
Support for Traps 4-83
Instance:May include AlarmLocation, AlarmId, AlarmState, AlarmSeverity, andbindVarNamesValueStr
HA Score:Normal
Auto Clear Seconds:0 (zero)
OID:tpdDefaultRouteNetworkError
Recovery:
1. Run syscheck in verbose mode.
2. If the syscheck output is: The default router at <IP_address> cannotbe pinged, the router may be down or unreachable. Do the following:
a. Verify the network cables are firmly attached to the server and the networkswitch, router, hub, etc.
b. Verify that the configured router is functioning properly. Check with thenetwork administrator to verify the router is powered on and routing traffic asrequired.
c. Check with the router administrator to verify that the router is configured toreply to pings on that interface.
d. Rerun syscheck.
e. If the alarm has not been cleared, it is recommended to collect the syscheckoutput and contact My Oracle Support.
3. If the syscheck output is: The default route is not on theprovisioning network, it is recommended to collect the syscheck output andcontact My Oracle Support.
4. If the syscheck output is: An active route cannot be found for aconfigured default route, it is recommended to collect the syscheck outputand contact My Oracle Support.
32314 - Server temperature error
Alarm Group:PLAT
Description:The internal temperature within the server is unacceptably high.
Severity:Major
Instance:May include AlarmLocation, AlarmId, AlarmState, AlarmSeverity, andbindVarNamesValueStr
Platform (31000-32800)
4-84 Policy Management SNMP User's Guide
HA Score:Normal
Auto Clear Seconds:0 (zero)
OID:tpdServerTemperatureError
Alarm ID:TKSPLATMA15
Recovery:
1. Ensure that nothing is blocking the fan intake. Remove any blockage.
2. Verify that the temperature in the room is normal. If it is too hot, lower thetemperature in the room to an acceptable level.
Note: Be prepared to wait the appropriate period of time before continuingwith the next step. Conditions need to be below alarm thresholds consistentlyfor the alarm to clear. It may take about ten minutes after the room returns toan acceptable temperature before the alarm cleared.
3. Run syscheck.
a. If the alarm has been cleared, the problem is resolved.
b. If the alarm has not been cleared, continue troubleshooting.
4. Replace the filter.
Note: Be prepared to wait the appropriate period of time before continuingwith the next step. Conditions need to be below alarm thresholds consistentlyfor the alarm to clear. The alarm may take up to five minutes to clear afterconditions improve. It may take about ten minutes after the filter is replacedbefore syscheck shows the alarm cleared.
5. Re-run syscheck.
a. If the alarm has been cleared, the problem is resolved.
b. If the alarm has not been cleared, continue troubleshooting.
6. If the problem has not been resolved, it is recommended to contact My OracleSupport.
32315 - Server mainboard voltage error
Alarm Group:PLAT
Description:This alarm indicates that one or more of the monitored voltages on the servermainboard have been detected to be out of the normal expected operating range.
Platform (31000-32800)
Support for Traps 4-85
Severity:Major
Instance:May include AlarmLocation, AlarmId, AlarmState, AlarmSeverity, andbindVarNamesValueStr
HA Score:Normal
Auto Clear Seconds:0 (zero)
OID:tpdServerMainboardVoltageError
Alarm ID:TKSPLATMA16
Recovery:
1. Run syscheck in verbose mode.
2. If the alarm persists, it is recommended to contact My Oracle Support and providethe system health check output.
32316 - Server power feed error
Alarm Group:PLAT
Description:This alarm indicates that one of the power feeds to the server has failed. If this alarmoccurs in conjunction with any Breaker Panel alarm, there might be a problem withthe breaker panel.
Severity:Major
Instance:May include AlarmLocation, AlarmId, AlarmState, AlarmSeverity, andbindVarNamesValueStr
HA Score:Normal
Auto Clear Seconds:0 (zero)
OID:tpdPowerFeedError
Alarm ID:TKSPLATMA17
Platform (31000-32800)
4-86 Policy Management SNMP User's Guide
Recovery:
1. Verify that all the server power feed cables to the server that is reporting the errorare securely connected.
2. Check to see if the alarm has cleared
• If the alarm has been cleared, the problem is resolved.
• If the alarm has not been cleared, continue with the next step.
3. Follow the power feed to its connection on the power source. Ensure that thepower source is ON and that the power feed is properly secured.
4. Check to see if the alarm has cleared
• If the alarm has been cleared, the problem is resolved.
• If the alarm has not been cleared, continue with the next step.
5. If the power source is functioning properly and the wires are all secure, have anelectrician check the voltage on the power feed.
6. Check to see if the alarm has cleared
• If the alarm has been cleared, the problem is resolved.
• If the alarm has not been cleared, continue with the next step.
7. If the problem has not been resolved, it is recommended to contact My OracleSupport.
32317 - Server disk health test error
Alarm Group:PLAT
Description:Either the hard drive has failed or failure is imminent.
Severity:Major
Instance:May include AlarmLocation, AlarmId, AlarmState, AlarmSeverity, andbindVarNamesValueStr
HA Score:Normal
Auto Clear Seconds:0 (zero)
OID:tpdDiskHealthError
Platform (31000-32800)
Support for Traps 4-87
Alarm ID:TKSPLATMA18
Recovery:
1. Run syscheck in verbose mode.
2. Replace the hard drives that have failed or are failing.
3. Re-run syscheck in verbose mode.
4. Perform the recovery procedures for the other alarms that may accompany thisalarm.
5. If the problem has not been resolved, it is recommended to contact My OracleSupport and provide the system health check output. .
32318 - Server disk unavailable error
Alarm Group:PLAT
Description:The smartd service is not able to read the disk status because the disk has otherproblems that are reported by other alarms. This alarm appears only while a server isbooting.
Severity:Major
Instance:May include AlarmLocation, AlarmId, AlarmState, AlarmSeverity, andbindVarNamesValueStr
HA Score:Normal
Auto Clear Seconds:0 (zero)
OID:tpdDiskUnavailableError
Alarm ID:TKSPLATMA19
Recovery:
1. Run syscheck in verbose mode.
2. It is recommended to contact My Oracle Support and provide the system healthcheck output.
32319 - Device error
Platform (31000-32800)
4-88 Policy Management SNMP User's Guide
Alarm Group:PLAT
Description:This alarm indicates that the offboard storage server had a problem with its diskvolume filling up.
Severity:Major
HA Score:Normal
Auto Clear Seconds:0 (zero)
OID:tpdDeviceError
Alarm ID:TKSPLATMA20
Recovery
1. It is recommended to contact the My Oracle Support.
32320 - Device interface error
Alarm Group:PLAT
Description:This alarm indicates that the IP bond is either not configured or down.
Severity:Major
Instance:May include AlarmLocation, AlarmId, AlarmState, AlarmSeverity, andbindVarNamesValueStr
HA Score:Normal
Auto Clear Seconds:0 (zero)
OID:tpdDeviceIfError
Alarm ID:TKSPLATMA21
Recovery:
Platform (31000-32800)
Support for Traps 4-89
1. Run syscheck in verbose mode.
2. Investigate the failed bond, and slave devices, configuration:
a. Navigate to /etc/sysconfig/network-scripts for the persistent configuration ofa device.
3. Determine if the failed bond, and slave devices, has been administratively shutdown or has operational issues:
a. cat /proc/net/bonding/bondX, where X is bond designation
b. ethtool <slave device>
4. If bond, and slaves, are healthy attempt to administratively bring bond up:
a. ifup bondX
5. If the problem has not been resolved, it is recommended to contact My OracleSupport and provide the system health check output and the output of the aboveinvestigation.
32321 - Correctable ECC memory error
Alarm Group:PLAT
Description:This alarm indicates that chipset has detected a correctable (single-bit) memory errorthat has been corrected by the ECC (Error-Correcting Code) circuitry in the memory.
Severity:Major
Instance:May include AlarmLocation, AlarmId, AlarmState, AlarmSeverity, andbindVarNamesValueStr
HA Score:Normal
Auto Clear Seconds:0 (zero)
OID:tpdEccCorrectableError
Alarm ID:TKSPLATMA22
Recovery:
1. No recovery necessary.
2. If the condition persists, verify the server firmware. Update the firmware ifnecessary, and re-run syscheck in verbose mode. Otherwise if the condition persists
Platform (31000-32800)
4-90 Policy Management SNMP User's Guide
and the firmware is up to date, contact the hardware vendor to request hardwarereplacement.
32322 - Power Supply A error
Alarm Group:PLAT
Description:This alarm indicates that power supply 1 (feed A) has failed.
Severity:Major
Instance:May include AlarmLocation, AlarmId, AlarmState, AlarmSeverity, andbindVarNamesValueStr
HA Score:Normal
Auto Clear Seconds:0 (zero)
OID:tpdPowerSupply1Error
Alarm ID:TKSPLATMA23
Recovery:
1. Verify that nothing is obstructing the airflow to the fans of the power supply.
2. Run syscheck in verbose mode. The output will provide details about what iswrong with the power supply.
3. If the problem persists, it is recommended to contact My Oracle Support andprovide the syscheck verbose output. Power supply 1 (feed A) will probably needto be replaced.
32323 - Power Supply B error
Alarm Group:PLAT
Description:This alarm indicates that power supply 2 (feed B) has failed.
Severity:Major
Instance:May include AlarmLocation, AlarmId, AlarmState, AlarmSeverity, andbindVarNamesValueStr
Platform (31000-32800)
Support for Traps 4-91
HA Score:Normal
Auto Clear Seconds:0 (zero)
OID:tpdPowerSupply2Error
Alarm ID:TKSPLATMA24
Recovery:
1. Verify that nothing is obstructing the airflow to the fans of the power supply.
2. Run syscheck in verbose mode. The output will provide details about what iswrong with the power supply.
3. If the problem persists, it is recommended to contact My Oracle Support andprovide the syscheck verbose output. Power supply 2 (feed B) will probably needto be replaced.
32324 - Breaker panel feed error
Alarm Group:PLAT
Description:This alarm indicates that the server is not receiving information from the breakerpanel relays.
Severity:Major
Instance:May include AlarmLocation, AlarmId, AlarmState, AlarmSeverity, andbindVarNamesValueStr
HA Score:Normal
Auto Clear Seconds:0 (zero)
OID:tpdBrkPnlFeedError
Alarm ID:TKSPLATMA25
Recovery:
1. Verify that the same alarm is displayed by multiple servers:
Platform (31000-32800)
4-92 Policy Management SNMP User's Guide
• If this alarm is displayed by only one server, the problem is most likely to bewith the cable or the server itself. Look for other alarms that indicate a problemwith the server and perform the recovery procedures for those alarms first.
• If this alarm is displayed by multiple servers, go to the next step.
2. Verify that the cables that connect the servers to the breaker panel are not damagedand are securely fastened to both the Alarm Interface ports on the breaker paneland to the serial ports on both servers.
3. If the problem has not been resolved, it is recommended to contact My OracleSupport to request that the breaker panel be replaced.
32325 - Breaker panel breaker error
Alarm Group:PLAT
Description:This alarm indicates that a power fault has been identified by the breaker panel. TheLEDs on the center of the breaker panel (see Figure 4-1) identify whether the faultoccurred on the input power or the output power, as follows:
• A power fault on input power (power from site source to the breaker panel) isindicated by one of the LEDs in the PWR BUS A or PWR BUS B groupilluminated Red. In general, a fault in the input power means that power hasbeen lost to the input power circuit.
Note: LEDs in the PWR BUS A or PWR BUS B group that correspond tounused feeds are not illuminated; LEDs in these groups that are notilluminated do not indicate problems.
• A power fault on output power (power from the breaker panel to other frameequipment) is indicated by either BRK FAIL BUS A or BRK FAIL BUS Billuminated RED. This type of fault can be caused by a surge or some sort ofpower degradation or spike that causes one of the circuit breakers to trip.
Platform (31000-32800)
Support for Traps 4-93
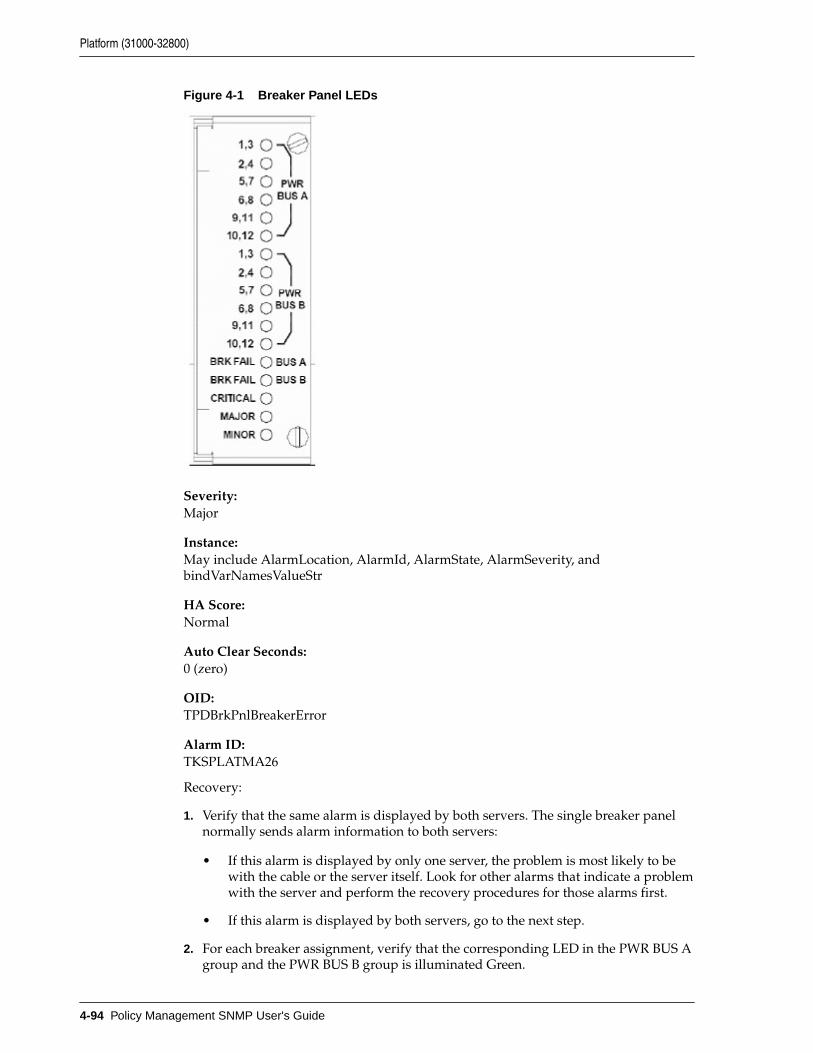
Figure 4-1 Breaker Panel LEDs
Severity:Major
Instance:May include AlarmLocation, AlarmId, AlarmState, AlarmSeverity, andbindVarNamesValueStr
HA Score:Normal
Auto Clear Seconds:0 (zero)
OID:TPDBrkPnlBreakerError
Alarm ID:TKSPLATMA26
Recovery:
1. Verify that the same alarm is displayed by both servers. The single breaker panelnormally sends alarm information to both servers:
• If this alarm is displayed by only one server, the problem is most likely to bewith the cable or the server itself. Look for other alarms that indicate a problemwith the server and perform the recovery procedures for those alarms first.
• If this alarm is displayed by both servers, go to the next step.
2. For each breaker assignment, verify that the corresponding LED in the PWR BUS Agroup and the PWR BUS B group is illuminated Green.
Platform (31000-32800)
4-94 Policy Management SNMP User's Guide
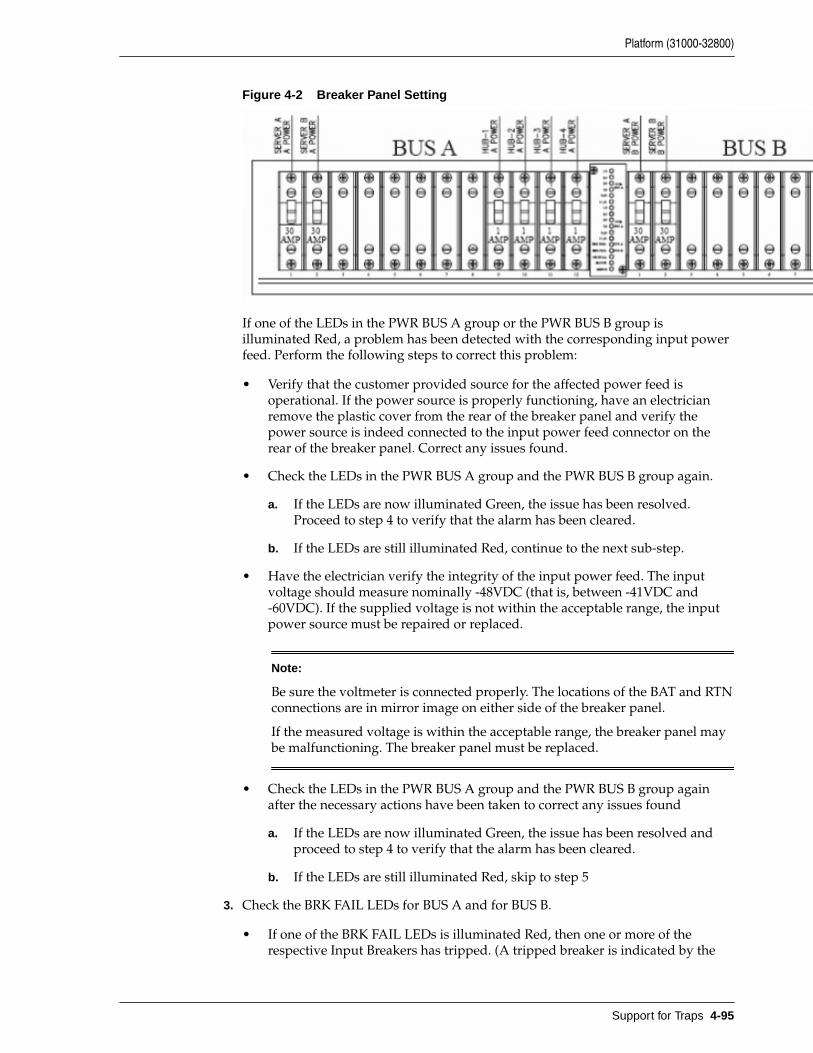
Figure 4-2 Breaker Panel Setting
If one of the LEDs in the PWR BUS A group or the PWR BUS B group isilluminated Red, a problem has been detected with the corresponding input powerfeed. Perform the following steps to correct this problem:
• Verify that the customer provided source for the affected power feed isoperational. If the power source is properly functioning, have an electricianremove the plastic cover from the rear of the breaker panel and verify thepower source is indeed connected to the input power feed connector on therear of the breaker panel. Correct any issues found.
• Check the LEDs in the PWR BUS A group and the PWR BUS B group again.
a. If the LEDs are now illuminated Green, the issue has been resolved.Proceed to step 4 to verify that the alarm has been cleared.
b. If the LEDs are still illuminated Red, continue to the next sub-step.
• Have the electrician verify the integrity of the input power feed. The inputvoltage should measure nominally -48VDC (that is, between -41VDC and-60VDC). If the supplied voltage is not within the acceptable range, the inputpower source must be repaired or replaced.
Note:
Be sure the voltmeter is connected properly. The locations of the BAT and RTNconnections are in mirror image on either side of the breaker panel.
If the measured voltage is within the acceptable range, the breaker panel maybe malfunctioning. The breaker panel must be replaced.
• Check the LEDs in the PWR BUS A group and the PWR BUS B group againafter the necessary actions have been taken to correct any issues found
a. If the LEDs are now illuminated Green, the issue has been resolved andproceed to step 4 to verify that the alarm has been cleared.
b. If the LEDs are still illuminated Red, skip to step 5
3. Check the BRK FAIL LEDs for BUS A and for BUS B.
• If one of the BRK FAIL LEDs is illuminated Red, then one or more of therespective Input Breakers has tripped. (A tripped breaker is indicated by the
Platform (31000-32800)
Support for Traps 4-95
toggle located in the center position.) Perform the following steps to repair thisissue:
a. For all tripped breakers, move the breaker down to the open (OFF) position andthen back up to the closed (ON) position.
b. After all the tripped breakers have been reset, check the BRK FAIL LEDs again.If one of the BRK FAIL LEDs is still illuminated Red, run syscheck and contact My Oracle Support
4. If all of the BRK FAIL LEDs and all the LEDs in the PWR BUS A group and thePWR BUS B group are illuminated Green, there is most likely a problem with theserial connection between the server and the breaker panel. This connection is usedby the system health check to monitor the breaker panel for failures. Verify thatboth ends of the labeled serial cables are properly secured. If any issues arediscovered with these cable connections, make the necessary corrections andcontinue to the next step to verify that the alarm has been cleared, otherwise it isrecommended to run syscheck and contact My Oracle Support
5. Run syscheck.
• If the alarm has been cleared, the problem is resolved.
• If the problem has not been resolved, it is recommended to contact My OracleSupport
32326 - Breaker panel monitoring error
Alarm Group:PLAT
Description:This alarm indicates a failure in the hardware and/or software that monitors thebreaker panel. This could mean there is a problem with the file I/O libraries, the serialdevice drivers, or the serial hardware itself.
Note: When this alarm occurs, the system is unable to monitor the breakerpanel for faults. Thus, if this alarm is detected, it is imperative that thebreaker panel be carefully examined for the existence of faults. The LEDs onthe breaker panel will be the only indication of the occurrence of either alarm:
• 32324 – Breaker panel feed error
• 32325 – Breaker panel breaker error
until the Breaker Panel Monitoring Error has been corrected.
Severity:Major
Instance:May include AlarmLocation, AlarmId, AlarmState, AlarmSeverity, andbindVarNamesValueStr
Platform (31000-32800)
4-96 Policy Management SNMP User's Guide
HA Score:Normal
Auto Clear Seconds:0 (zero)
OID:tpdBrkPnlMntError
Alarm ID:TKSPLATMA27
Recovery:
1. Verify that the same alarm is displayed by both servers (the single breaker panelnormally sends alarm information to both servers):
• If this alarm is displayed by only one server, the problem is most likely to bewith the cable or the server itself. Look for other alarms that indicate a problemwith the server and perform the recovery procedures for those alarms first.
• If this alarm is displayed by both servers, go to the next step.
2. Verify that both ends of the labeled serial cables are secured properly (for locationsof serial cables, see the appropriate hardware manual).
3. Run syscheck..
• If the alarm has been cleared, the problem is resolved.
• If the alarm has not been cleared, it is recommended to contact My OracleSupport
32327 - Server HA Keepalive error
Alarm Group:PLAT
Description:This alarm indicates that heartbeat process has detected that it has failed to receive aheartbeat packet within the timeout period.
Severity:Major
Instance:May include AlarmLocation, AlarmId, AlarmState, AlarmSeverity, andbindVarNamesValueStr
HA Score:Normal
Auto Clear Seconds:0 (zero)
Platform (31000-32800)
Support for Traps 4-97
OID:tpdHaKeepaliveError
Alarm ID:TKSPLATMA28
Recovery:
1. Determine if the mate server is currently down and bring it up if possible.
2. Determine if the keepalive interface is down.
3. Determine if heartbeart is running (service TKLCha status).
Note: This step may require command line ability.
4. It is recommended to contact My Oracle Support.
32328 - DRBD is unavailable
Alarm Group:PLAT
Description:This alarm indicates that DRBD is not functioning properly on the local server. TheDRBD state (disk state, node state, and/or connection state) indicates a problem.
Severity:Major
Instance:May include AlarmLocation, AlarmId, AlarmState, AlarmSeverity, andbindVarNamesValueStr
HA Score:Normal
Auto Clear Seconds:0 (zero)
OID:tpdDrbdUnavailable
Alarm ID:TKSPLATMA29
Recovery
1. It is recommended to contact My Oracle Support.
32329 - DRBD is not replicating
Alarm Group:PLAT
Platform (31000-32800)
4-98 Policy Management SNMP User's Guide
Description:This alarm indicates that DRBD is not replicating to the peer server. Usually thisindicates that DRBD is not connected to the peer server. It is possible that a DRBDSplit Brain has occurred.
Severity:Major
Instance:May include AlarmLocation, AlarmId, AlarmState, AlarmSeverity, andbindVarNamesValueStr
HA Score:Normal
Auto Clear Seconds:0 (zero)
OID:tpdDrbdNotReplicating
Alarm ID:TKSPLATMA30
Recovery
1. It is recommended to contact My Oracle Support.
32330 - DRBD peer problem
Alarm Group:PLAT
Description:This alarm indicates that DRBD is not functioning properly on the peer server. DRBDis connected to the peer server, but the DRBD state on the peer server is eitherunknown or indicates a problem.
Severity:Major
Instance:May include AlarmLocation, AlarmId, AlarmState, AlarmSeverity, andbindVarNamesValueStr
HA Score:Normal
Auto Clear Seconds:0 (zero)
OID:tpdDrbdPeerProblem
Platform (31000-32800)
Support for Traps 4-99
Alarm ID:TKSPLATMA31
Recovery
1. It is recommended to contact the My Oracle Support.
32331 - HP disk problem
Alarm Group:PLAT
Description:This major alarm indicates that there is an issue with either a physical or logical diskin the HP disk subsystem. The message will include the drive type, location, slot andstatus of the drive that has the error.
Severity:Major
Instance:May include AlarmLocation, AlarmId, AlarmState, AlarmSeverity, andbindVarNamesValueStr
HA Score:Normal
Auto Clear Seconds:0 (zero)
OID:tpdHpDiskProblem
Alarm ID:TKSPLATMA32
Recovery:
1. Run syscheck in verbose mode.
2. If "Cache Status" is OK and "Cache Status Details" reports a cache error wasdetected so diagnostics should be run, there probably is no battery and data wasleft over in the write cache not getting flushed to disk and won't since there is nobattery.
3. If "Cache Status" is "Permanently Disabled" and "Cache Status Details" indicatedthe cache is disabled, if there is no battery then the firmware should be upgraded.
4. Re-run syscheck in verbose mode if firmware upgrade was necessary.
5. If the condition persists, it is recommended to contact My Oracle Support andprovide the system health check output. The disk may need to be replaced.
32332 - HP Smart Array controller problem
Platform (31000-32800)
4-100 Policy Management SNMP User's Guide

Alarm Group:PLAT
Description:This major alarm indicates that there is an issue with an HP disk controller. Themessage will include the slot location, the component on the controller that has failed,and status of the controller that has the error.
Severity:Major
Instance:May include AlarmLocation, AlarmId, AlarmState, AlarmSeverity, andbindVarNamesValueStr
HA Score:Normal
Auto Clear Seconds:0 (zero)
OID:tpdHpDiskCtrlrProblem
Alarm ID:TKSPLATMA33
Recovery:
1. Run syscheck in verbose mode.
2. If condition persists, it is recommended to contact My Oracle Support and providethe system health check output.
32333 - HP hpacucliStatus utility problem
Alarm Group:PLAT
Description:This major alarm indicates that there is an issue with the process that caches the HPdisk subsystem status. This usually means that the hpacucliStatus/hpDiskStatusdaemon is either not running, or hung.
Severity:Major
Instance:May include AlarmLocation, AlarmId, AlarmState, AlarmSeverity, andbindVarNamesValueStr
HA Score:Normal
Auto Clear Seconds:0 (zero)
Platform (31000-32800)
Support for Traps 4-101
OID:tpdHPACUCLIProblem
Alarm ID:TKSPLATMA34
Recovery:
1. Run syscheck in verbose mode.
2. Verify the firmware is up to date for the server, if not up to date upgrade firmware,and re-run syscheck in verbose mode.
3. Determine if the HP disk status daemon is running. If not running verify that it wasnot administratively stopped.
Note: The disk status daemon is named either TKLChpacucli orTPDhpDiskStatus in more recent versions of TPD.
a. Executing "status TPDhpDiskStatus", or "status TKLChpacucli" depending onTPD release, should produce output indicating that the process is running.
4. If not running, attempt to start the HP disk status process :
"start TPDhpDiskStatus", or if appropriate "start TKLChpacucli" .
5. Verify that there are no hpssacli, or hpacucli, error messages in /var/log/messages.If there are this could indicate that the HP utility is hung. If the HP hpssacli utility,or hpacucli utility, is hung, proceed with next step.
6. It is recommended to contact My Oracle Support and provide the system healthcheck output, and savelogs_plat output.
32334 - Multipath device access link problem
Alarm Group:PLAT
Description:One or more "access paths" of a multipath device are failing or are not healthy, or themultipath device does not exist.
Severity:Major
Instance:May include AlarmLocation, AlarmId, AlarmState, AlarmSeverity, andbindVarNamesValueStr
HA Score:Normal
Auto Clear Seconds:0 (zero)
Platform (31000-32800)
4-102 Policy Management SNMP User's Guide
OID:tpdMpathDeviceProblem
Recovery:
1. It is recommended to contact My Oracle Support.
32335 - Switch link down error
Alarm Group:PLAT
Description:The link is down.
Severity:Major
Instance:May include AlarmLocation, AlarmId, AlarmState, AlarmSeverity, andbindVarNamesValueStr
HA Score:Normal
Auto Clear Seconds:0 (zero)
OID:tpdSwitchLinkDownError
Alarm ID:TKSPLATMA36
Recovery:
1. Verify the cabling between the port and the remote side.
2. Verify networking on the remote end.
3. If the problem persists, it is recommended to contact My Oracle Support todetermine who should verify port settings on both the server and the switch.
32336 - Half Open Socket Limit
Alarm Group:PLAT
Description:This alarm indicates that the number of half open TCP sockets has reached the majorthreshold. This problem is caused by a remote system failing to complete the TCP 3-way handshake.
Severity:Major
Platform (31000-32800)
Support for Traps 4-103
Instance:May include AlarmLocation, AlarmId, AlarmState, AlarmSeverity, andbindVarNamesValueStr
HA Score:Normal
Auto Clear Seconds:0 (zero)
OID:tpdHalfOpenSockLimit
Alarm ID:TKSPLATMA37
Recovery:
1. Run syscheck in verbose mode.
2. Determine what process and address reports a state of SYN_RECV and collect data:
• netstat -nap.
3. It is recommended to contact My Oracle Support and provide the system healthcheck output and collected data.
32337 - Flash Program Failure
Alarm Group:PLAT
Description:This alarm indicates that there was an error while trying to update the firmware flashon the E5-APP-B cards.
Severity:Major
Instance:May include AlarmLocation, AlarmId, AlarmState, AlarmSeverity, andbindVarNamesValueStr
HA Score:Normal
Auto Clear Seconds:0 (zero)
OID:tpdFlashProgramFailure
Alarm ID:TKSPLATMA38
Platform (31000-32800)
4-104 Policy Management SNMP User's Guide
Recovery:
1. It is recommended to contact My Oracle Support.
32338 - Serial Mezzanine Unseated
Alarm Group:PLAT
Description:This alarm indicates that a connection to the serial mezzanine board may not beproperly seated.
Severity:Major
Instance:May include AlarmLocation, AlarmId, AlarmState, AlarmSeverity, andbindVarNamesValueStr
HA Score:Normal
Auto Clear Seconds:0 (zero)
OID:tpdSerialMezzUnseated
Alarm ID:TKSPLATMA39
Recovery:
1. Ensure that both ends of both cables connecting the serial mezzanine card to themain board are properly seated into their connectors.
2. It is recommended to contact My Oracle Support if reseating the cables does notclear the alarm.
32339 - TPD Max Number Of Running Processes Error
Alarm Group:PLAT
Description:This alarm indicates that the maximum number of running processes has reached themajor threshold.
Severity:Major
Instance:May include AlarmLocation, AlarmId, AlarmState, AlarmSeverity, andbindVarNamesValueStr
Platform (31000-32800)
Support for Traps 4-105
HA Score:Normal
Auto Clear Seconds:0 (zero)
OID:tpdMaxPidLimit
Alarm ID:TKSPLATMA40
Recovery:
1. Run syscheck in verbose mode.
2. Execute 'pstree' to see what pids are on the system and what process created them.Collect the output of command, and review the output to determine the processresponsible for the alarm.
3. It is recommended to contact My Oracle Support and provide the system healthcheck output, and pid output.
32340 - TPD NTP Daemon Not Synchronized Error
Alarm Group:PLAT
Description:This alarm indicates that the server is not synchronized to an NTP source and has notbeen synchronized for an extended number of hours and has reached the majorthreshold.
Severity:Major
Instance:May include AlarmLocation, AlarmId, AlarmState, AlarmSeverity, andbindVarNamesValueStr
HA Score:Normal
Auto Clear Seconds:0 (zero)
OID:tpdNTPDaemonNotSynchronizedError
Alarm ID:TKSPLATMA41
Recovery:
1. Verify NTP settings and that NTP sources can be reached.
Platform (31000-32800)
4-106 Policy Management SNMP User's Guide
a. Ensure ntpd service is running.
b. Verify the content of the /etc/ntp.conf file is correct for the server.
c. Verify the ntp peer configuration; execute ntpq -p and analyze the output. Verifypeer data, (such as tally code (first column before "remote"), remote, refid,stratum (st), and jitter), are valid for server.
d. Execute ntpstat to determine the ntp time synchronization status. If notsynchronized or the stratum is not correct for server then ping the ntp peer todetermine if peer can be reached.
2. If ntp peer is reachable, restart the ntpd service.
3. If problem persists then a reset the NTP date may resolve the issue.
Note: Prior to the reset of the ntp date the applications may need to bestopped, and subsequent to the ntp reset, the application restarted.
a. To reset date:
• sudo service ntpd stop
• sudo ntpdate <ntp server ip>
• sudo service ntpd start
4. If the problem persists, it is recommended to contact My Oracle Support.
32341 - TPD NTP Daemon Not Synchronized Error
Alarm Group:PLAT
Description:This alarm indicates that the server is not synchronized to an NTP source and hasnever been synchronized since the last configuration change.
Severity:Major
Instance:May include AlarmLocation, AlarmId, AlarmState, AlarmSeverity, andbindVarNamesValueStr
HA Score:Normal
Auto Clear Seconds:0 (zero)
OID:tpdNTPDaemonNeverSynchronized
Platform (31000-32800)
Support for Traps 4-107
Alarm ID:TKSPLATMA42
Recovery:
1. Verify NTP settings and that NTP sources can be reached.
a. Ensure ntpd service is running.
b. Verify the content of the /etc/ntp.conf file is correct for the server.
c. Verify the ntp peer configuration; execute ntpq -p and analyze the output. Verifypeer data, (such as tally code (first column before "remote"), remote, refid,stratum (st), and jitter), are valid for server.
d. Execute ntpstat to determine the ntp time synchronization status. If notsynchronized or the stratum is not correct for server then ping the ntp peer todetermine if peer can be reached.
2. If the ntp peer is reachable, restart the ntpd service.
3. If the problem persists then a reset the NTP date may resolve the issue.
Note: Prior to the reset of the ntp date the applications may need to bestopped, and subsequent to the ntp reset, the application restarted.
a. To reset date:
• sudo service ntpd stop
• sudo ntpdate <ntp server ip>
• sudo service ntpd start
4. If the problem persists, it is recommended to contact My Oracle Support.
32342 - NTP Offset Check Error
Alarm Group:PLAT
Description:This alarm indicates the NTP offset of the server that is currently being synced to isgreater than the major threshold.
Severity:Major
Instance:May include AlarmLocation, AlarmId, AlarmState, AlarmSeverity, andbindVarNamesValueStr
HA Score:Normal
Platform (31000-32800)
4-108 Policy Management SNMP User's Guide
Auto Clear Seconds:0 (zero)
OID:ntpOffsetCheckError
Alarm ID:TKSPLATMA43
Recovery:
1. Verify NTP settings and that NTP sources can be reached.
a. Ensure ntpd service is running.
b. Verify the content of the /etc/ntp.conf file is correct for the server.
c. Verify the ntp peer configuration; execute ntpq -p and analyze the output. Verifypeer data, (such as tally code (first column before "remote"), remote, refid,stratum (st), and jitter), are valid for server.
d. Execute ntpstat to determine the ntp time synchronization status. If notsynchronized or the stratum is not correct for server then ping the ntp peer todetermine if peer can be reached.
2. If the ntp peer is reachable, restart the ntpd service.
3. If the problem persists then a reset the NTP date may resolve the issue.
Note: Prior to the reset of the ntp date the applications may need to bestopped, and subsequent to the ntp reset, the application restarted.
a. To reset date:
• sudo service ntpd stop
• sudo ntpdate <ntp server ip>
• sudo service ntpd start
4. If the problem persists, it is recommended to contact My Oracle Support.
32343 - TPD RAID disk
Alarm Group:PLAT
Description:This alarms indicates that physical disk or logical volume on RAID controller is not inoptimal state as reported by syscheck.
Severity:Major
Platform (31000-32800)
Support for Traps 4-109
Instance:May include AlarmLocation, AlarmId, AlarmState, AlarmSeverity, andbindVarNamesValueStr
HA Score:Normal
Auto Clear Seconds:0 (zero)
OID:tpdDiskProblem
Alarm ID:TKSPLATMA44
Recovery:
1. Run syscheck in verbose mode.
2. It is recommended to contact My Oracle Support and provide the system healthcheck output.
32344 - TPD RAID controller problem
Alarm Group:PLAT
Description:This alarms indicates that RAID controller needs intervention.
Severity:Major
Instance:May include AlarmLocation, AlarmId, AlarmState, AlarmSeverity, andbindVarNamesValueStr
HA Score:Normal
Auto Clear Seconds:0 (zero)
OID:tpdDiskCtrlrProblem
Alarm ID:TKSPLATMA45
Recovery:
1. Run syscheck in verbose mode.
2. Verify firmware is up to date for the server, if not up to date upgrade firmware, andre-run syscheck in verbose mode.
Platform (31000-32800)
4-110 Policy Management SNMP User's Guide
3. It is recommended to contact My Oracle Support and provide the system healthcheck output.
32345 - Server Upgrade snapshot(s) invalid
Alarm Group:PLAT
Description:This alarm indicates that upgrade snapshot(s) are invalid and backout is no longerpossible.
Severity:Major
Instance:May include AlarmLocation, AlarmId, AlarmState, AlarmSeverity, andbindVarNamesValueStr
HA Score:Normal
Auto Clear Seconds:0 (zero)
OID:tpdUpgradeSnapshotInvalid
Alarm ID:TKSPLATMA46
Recovery:
1. Run accept to remove invalid snapshot(s) and clear alarms.
2. If the alarm persists, it is recommended to contact My Oracle Support.
32346 - OEM hardware management service reports an error
Alarm Group:PLAT
Description:This alarms indicates that OEM hardware management service reports an error.
Severity:Major
Instance:May include AlarmLocation, AlarmId, AlarmState, AlarmSeverity, andbindVarNamesValueStr
HA Score:Normal
Platform (31000-32800)
Support for Traps 4-111
Auto Clear Seconds:0 (zero)
OID:tpdOEMHardware
Alarm ID:TKSPLATMA47
Recovery:
1. Run syscheck in verbose mode.
2. It is recommended to contact My Oracle Support and provide the system healthcheck output.
32347 - The hwmgmtcliStatus daemon needs intervention
Alarm Group:PLAT
Description:This alarms indicates the hwmgmtcliStatus daemon is not running or is notresponding.
Severity:Major
Instance:May include AlarmLocation, AlarmId, AlarmState, AlarmSeverity, andbindVarNamesValueStr
HA Score:Normal
Auto Clear Seconds:0 (zero)
OID:tpdHWMGMTCLIProblem
Alarm ID:TKSPLATMA47
Recovery:
1. Run syscheck in verbose mode.
2. Verify the firmware is up to date for the server, if not up to date upgrade firmware,and re-run syscheck in verbose mode.
3. Determine if the hwmgmtd process is running. If not running verify that it was notadministratively stopped.
• Running "service hwmgmtd status" should produce output indicating that theprocess is running.
Platform (31000-32800)
4-112 Policy Management SNMP User's Guide
• If not running, attempt to start process "service hwmgmtd status".
4. Determine if the TKLChwmgmtcli process is running. If not running verify that itwas not administratively stopped.
• Running "status TKLChwmgmtcli" should produce output indicating that theprocess is running.
• If not running, attempt to start process "start TKLChwmgmtcli".
5. Verify that there are no hwmgmt error messages in /var/log/messages. If there arethis could indicate that the Oracle utility is hung. If hwmgmtd process is hung,proceed with next step.
6. It is recommended to contact My Oracle Support and provide the system healthcheck output.
32348 - FIPS subsystem problem
Alarm Group:PLAT
Description:This alarm indicates the FIPS subsystem is not running or has encountered errors.
Severity:Major
Instance:May include AlarmLocation, AlarmId, AlarmState, AlarmSeverity, andbindVarNamesValueStr
HA Score:Normal
Auto Clear Seconds:0 (zero)
OID:tpdFipsSubsystemProblem
Recovery:
1. Run syscheck in verbose mode.
2. It is recommended to contact My Oracle Support and provide the system healthcheck output.
32349 - File Tampering
Alarm Group:PLAT
Description:This alarm indicates HIDS has detected file tampering.
Platform (31000-32800)
Support for Traps 4-113
Severity:Major
Instance:May include AlarmLocation, AlarmId, AlarmState, AlarmSeverity, andbindVarNamesValueStr
HA Score:Normal
Auto Clear Seconds:0 (zero)
OID:tpdHidsFileTampering
Recovery:
1. It is recommended to contact My Oracle Support.
32350 - Security Process Terminated
Alarm Group:PLAT
Description:This alarm indicates that the security process monitor is not running.
Severity:Major
Instance:May include AlarmLocation, AlarmId, AlarmState, AlarmSeverity, andbindVarNamesValueStr
HA Score:Normal
Auto Clear Seconds:0 (zero)
OID:tpdSecurityProcessDown
Recovery:
1. It is recommended to contact My Oracle Support.
32500 - Server disk space shortage warning
Alarm Group:PLAT
Description:This alarm indicates that one of the following conditions has occurred:
Platform (31000-32800)
4-114 Policy Management SNMP User's Guide
• A file system has exceeded a warning threshold, which means that more than80% (but less than 90%) of the available disk storage has been used on the filesystem.
• More than 80% (but less than 90%) of the total number of available files have beenallocated on the file system.
Severity:Minor
Instance:May include AlarmLocation, AlarmId, AlarmState, AlarmSeverity, andbindVarNamesValueStr
HA Score:Normal
Auto Clear Seconds:0 (zero)
OID:tpdDiskSpaceShortageWarning
Alarm ID:TKSPLATMI1
Recovery:
1. Run syscheck in verbose mode.
2. Examine contents of identified volume in syscheck output to determine if any largefiles are in the file system. Delete unnecessary files, or move files off of server.Capture output from "du -sx <file system>".
3. Capture output from "df -h" and "df -i" commands.
4. Determine processes using the file system(s) that have exceeded the threshold.
5. It is recommended to contact My Oracle Support, provide the system health checkoutput, and provide additional file system output.
32501 - Server application process error
Alarm Group:PLAT
Description:This alarm indicates that either the minimum number of instances for a requiredprocess are not currently running or too many instances of a required process arerunning.
Severity:Minor
Instance:May include AlarmLocation, AlarmId, AlarmState, AlarmSeverity, andbindVarNamesValueStr
Platform (31000-32800)
Support for Traps 4-115
HA Score:Normal
Auto Clear Seconds:0 (zero)
OID:tpdApplicationProcessError
Alarm ID:TKSPLATMI2
Recovery:
1. Run syscheck in verbose mode.
2. If the alarm has been cleared, then the problem is solved.
3. If the alarm has not been cleared, determine the run level of the system.
• If system run level is not 4, determine why the system is operating at that runlevel.
• If system run level is 4, determine why the required number of instancesprocesses are not running.
4. For additional assistance, it is recommended to contact My Oracle Support andprovide the syscheck output.
32502 - Server hardware configuration error
Alarm Group:PLAT
Description:This alarm indicates that one or more of the server’s hardware components are not incompliance with specifications (refer to the appropriate hardware manual).
Severity:Minor
Instance:May include AlarmLocation, AlarmId, AlarmState, AlarmSeverity, andbindVarNamesValueStr
HA Score:Normal
Auto Clear Seconds:0 (zero)
OID:tpdHardwareConfigError
Alarm ID:TKSPLATMI3
Platform (31000-32800)
4-116 Policy Management SNMP User's Guide
Recovery:
1. Run syscheck in verbose mode.
2. Contact the hardware vendor to request a hardware replacement.
32503 - Server RAM shortage warning
Alarm Group:PLAT
Description:This alarm is generated by the MPS syscheck software package and is not part of theTPD distribution.
Severity:Minor
Instance:May include AlarmLocation, AlarmId, AlarmState, AlarmSeverity, andbindVarNamesValueStr
HA Score:Normal
Auto Clear Seconds:0 (zero)
OID:tpdRamShortageWarning
Alarm ID:TKSPLATMI4
Recovery
1. Refer to MPS-specific documentation for information regarding this alarm.
2. It is recommended to contact the My Oracle Support.
32504 - Software Configuration Error
Alarm Group:PLAT
Description:This alarm is generated by the MPS syscheck software package and is not part of thePLAT distribution.
Severity:Minor
Instance:May include AlarmLocation, AlarmId, AlarmState, AlarmSeverity, andbindVarNamesValueStr
Platform (31000-32800)
Support for Traps 4-117
HA Score:Normal
Auto Clear Seconds:0 (zero)
OID:tpdSoftwareConfigError
Recovery
1. It is recommended to contact My Oracle Support.
32505 - Server swap space shortage warning
Alarm Group:PLAT
Description:This alarm indicates that the swap space available on the server is less than expected.This is usually caused by a process that has allocated a very large amount of memoryover time.
Note: For this alarm to clear, the underlying failure condition must beconsistently undetected for a number of polling intervals. Therefore, thealarm may continue to be reported for several minutes after corrective actionsare completed.
Severity:Minor
Instance:May include AlarmLocation, AlarmId, AlarmState, AlarmSeverity, andbindVarNamesValueStr
HA Score:Normal
Auto Clear Seconds:0 (zero)
OID:tpdSwapSpaceShortageWarning
Alarm ID:TKSPLATMI6
Recovery:
1. Run syscheck in verbose mode.
2. Determine which processes are using swap.
a. List application processes and determine the process id.
Platform (31000-32800)
4-118 Policy Management SNMP User's Guide
b. Determine how much swap each process is using. One method to determine theamount of swap being used by process is:
• grep VmSwap /proc/<process id>/status
3. It is recommended to contact My Oracle Support, provide the system health checkoutput, and process swap usage.
32506 - Server default router not defined
Alarm Group:PLAT
Description:This alarm indicates that the default network route is either not configured or thecurrent configuration contains an invalid IP address or hostname.
Caution: When changing the server’s network routing configuration it isimportant to verify that the modifications will not impact the method ofconnectivity for the current login session. It is also crucial that thisinformation not be entered incorrectly or set to improper values. Incorrectlymodifying the server’s routing configuration may result in total loss of remotenetwork access.
Severity:Minor
Instance:May include AlarmLocation, AlarmId, AlarmState, AlarmSeverity, andbindVarNamesValueStr
HA Score:Normal
Auto Clear Seconds:0 (zero)
OID:tpdDefaultRouteNotDefined
Alarm ID:TKSPLATMI7
Recovery:
1. Run syscheck in verbose mode.
2. If the syscheck output is: The default router at <IP_address> cannotbe pinged, the router may be down or unreachable. Do the following:
a. Verify the network cables are firmly attached to the server and the networkswitch, router, hub, etc.
Platform (31000-32800)
Support for Traps 4-119
b. Verify that the configured router is functioning properly. Check with thenetwork administrator to verify the router is powered on and routing traffic asrequired.
c. Check with the router administrator to verify that the router is configured toreply to pings on that interface.
d. Rerun syscheck.
3. If the alarm has not cleared, it is recommended to collect the syscheck output andcontact My Oracle Support.
32507 - Server temperature warning
Alarm Group:PLAT
Description:This alarm indicates that the internal temperature within the server is outside of thenormal operating range. A server Fan Failure may also exist along with the ServerTemperature Warning.
Severity:Minor
Instance:May include AlarmLocation, AlarmId, AlarmState, AlarmSeverity, andbindVarNamesValueStr
HA Score:Normal
Auto Clear Seconds:0 (zero)
OID:tpdServerTemperatureWarning
Alarm ID:TKSPLATMI8
Recovery:
1. Ensure that nothing is blocking the fan intake. Remove any blockage.
2. Verify that the temperature in the room is normal. If it is too hot, lower thetemperature in the room to an acceptable level.
Note: Be prepared to wait the appropriate period of time before continuingwith the next step. Conditions need to be below alarm thresholds consistentlyfor the alarm to clear. It may take about ten minutes after the room returns toan acceptable temperature before the alarm cleared.
3. Run syscheck.
Platform (31000-32800)
4-120 Policy Management SNMP User's Guide
4. Replace the filter (refer to the appropriate hardware manual).
Note: Be prepared to wait the appropriate period of time before continuingwith the next step. Conditions need to be below alarm thresholds consistentlyfor the alarm to clear. It may take about ten minutes after the filter is replacedbefore the alarm cleared.
5. Run syscheck.
6. If the problem has not been resolved, it is recommended to contact My OracleSupport.
32508 - Server core file detected
Alarm Group:PLAT
Description:This alarm indicates that an application process has failed and debug information isavailable.
Severity:Minor
Instance:May include AlarmLocation, AlarmId, AlarmState, AlarmSeverity, andbindVarNamesValueStr
HA Score:Normal
Auto Clear Seconds:0 (zero)
OID:tpdServerCoreFileDetected
Alarm ID:TKSPLATMI9
Recovery:
1. It is recommended to contact My Oracle Support to create a service request.
2. On the affected server, run this command:
ll /var/TKLC/core
Add the command output to the service request. Include the date of creation foundin the command output.
3. Attach core files to the My Oracle Support service request.
4. The user can remove the files to clear the alarm with this command:
rm -f /var/TKLC/core/<coreFileName>
Platform (31000-32800)
Support for Traps 4-121
32509 - Server NTP Daemon not synchronized
Alarm Group:PLAT
Description:This alarm indicates that the NTP daemon (background process) has been unable tolocate a server to provide an acceptable time reference for synchronization.
Severity:Minor
Instance:May include AlarmLocation, AlarmId, AlarmState, AlarmSeverity, andbindVarNamesValueStr
HA Score:Normal
Auto Clear Seconds:0 (zero)
OID:tpdNTPDeamonNotSynchronizedWarning
Alarm ID:TKSPLATMI10
Recovery:
1. Verify NTP settings and that NTP sources can be reached.
a. Ensure ntpd service is running.
b. Verify the content of the /etc/ntp.conf file is correct for the server.
c. Verify the ntp peer configuration; execute ntpq -p and analyze the output. Verifypeer data, (such as tally code (first column before "remote"), remote, refid,stratum (st), and jitter), are valid for server.
d. Execute ntpstat to determine the ntp time synchronization status. If notsynchronized or the stratum is not correct for server then ping the ntp peer todetermine if peer can be reached.
2. If ntp peer is reachable, restart the ntpd service.
3. If problem persists then a reset the NTP date may resolve the issue.
Note: Before resetting the ntp date, the applications may need to be stopped;and subsequent to the ntp reset, the application restarted.
a. To reset date:
• sudo service ntpd stop
Platform (31000-32800)
4-122 Policy Management SNMP User's Guide
• sudo ntpdate <ntp server ip>
• sudo service ntpd start
4. If the problem persists, it is recommended to contact My Oracle Support.
32510 - CMOS battery voltage low
Alarm Group:PLAT
Description:The presence of this alarm indicates that the CMOS battery voltage has been detectedto be below the expected value. This alarm is an early warning indicator of CMOSbattery end-of-life failure which will cause problems in the event the server ispowered off.
Severity:Minor
Instance:May include AlarmLocation, AlarmId, AlarmState, AlarmSeverity, andbindVarNamesValueStr
HA Score:Normal
Auto Clear Seconds:0 (zero)
OID:tpdCMOSBatteryVoltageLow
Alarm ID:TKSPLATMI11
Recovery:
1. It is recommended to contact My Oracle Support.
32511 - Server disk self test warning
Alarm Group:PLAT
Description:A non-fatal disk issue (such as a sector cannot be read) exists.
Severity:Minor
Instance:May include AlarmLocation, AlarmId, AlarmState, AlarmSeverity, andbindVarNamesValueStr
Platform (31000-32800)
Support for Traps 4-123
HA Score:Normal
Auto Clear Seconds:0 (zero)
OID:tpdSmartTestWarn
Alarm ID:TKSPLATMI12
Recovery:
1. Run syscheck in verbose mode.
2. It is recommended to contact My Oracle Support.
32512 - Device warning
Alarm Group:PLAT
Description:This alarm indicates that either we are unable to perform an snmpget command onthe configured SNMP OID or the value returned failed the specified comparisonoperation.
Severity:Minor
Instance:May include AlarmLocation, AlarmId, AlarmState, AlarmSeverity, andbindVarNamesValueStr
HA Score:Normal
Auto Clear Seconds:0 (zero)
OID:tpdDeviceWarn
Alarm ID:TKSPLATMI13
Recovery:
1. Run syscheck in verbose mode.
2. It is recommended to contact My Oracle Support.
32513 - Device interface warning
Platform (31000-32800)
4-124 Policy Management SNMP User's Guide
Alarm Group:PLAT
Description:This alarm can be generated by either an SNMP trap or an IP bond error.
Severity:Minor
Instance:May include AlarmLocation, AlarmId, AlarmState, AlarmSeverity, andbindVarNamesValueStr
HA Score:Normal
Auto Clear Seconds:0 (zero)
OID:tpdDeviceIfWarn
Alarm ID:TKSPLATMI14
Recovery:
1. Run syscheck in verbose mode.
2. It is recommended to contact My Oracle Support.
32514 - Server reboot watchdog initiated
Alarm Group:PLAT
Description:This alarm indicates that the hardware watchdog was not strobed by the software andso the server rebooted the server. This applies to only the last reboot and is onlysupported on a T1100 application server.
Severity:Minor
Instance:May include AlarmLocation, AlarmId, AlarmState, AlarmSeverity, andbindVarNamesValueStr
HA Score:Normal
Auto Clear Seconds:0 (zero)
OID:tpdWatchdogReboot
Platform (31000-32800)
Support for Traps 4-125
Alarm ID:TKSPLATMI15
Recovery:
1. It is recommended to contact My Oracle Support.
32515 - Server HA failover inhibited
Alarm Group:PLAT
Description:This alarm indicates that the server has been inhibited and therefore HA failover isprevented from occurring.
Severity:Minor
Instance:May include AlarmLocation, AlarmId, AlarmState, AlarmSeverity, andbindVarNamesValueStr
HA Score:Normal
Auto Clear Seconds:0 (zero)
OID:tpdHaInhibited
Alarm ID:TKSPLATMI16
Recovery:
1. It is recommended to contact My Oracle Support.
32516 - Server HA Active to Standby transition
Alarm Group:PLAT
Description:This alarm indicates that the server is in the process of transitioning HA state fromActive to Standby.
Severity:Minor
Instance:May include AlarmLocation, AlarmId, AlarmState, AlarmSeverity, andbindVarNamesValueStr
Platform (31000-32800)
4-126 Policy Management SNMP User's Guide
HA Score:Normal
Auto Clear Seconds:0 (zero)
OID:tpdHaActiveToStandbyTrans
Alarm ID:TKSPLATMI17
Recovery:
1. It is recommended to contact My Oracle Support.
32517 - Server HA Standby to Active transition
Alarm Group:PLAT
Description:This alarm indicates that the server is in the process of transitioning HA state fromStandby to Active.
Severity:Minor
Instance:May include AlarmLocation, AlarmId, AlarmState, AlarmSeverity, andbindVarNamesValueStr
HA Score:Normal
Auto Clear Seconds:0 (zero)
OID:tpdHaStandbyToActiveTrans
Alarm ID:TKSPLATMI18
Recovery:
1. It is recommended to contact My Oracle Support.
32518 - Platform Health Check failure
Alarm Group:PLAT
Description:This alarm is used to indicate a configuration error.
Platform (31000-32800)
Support for Traps 4-127
Severity:Minor
Instance:May include AlarmLocation, AlarmId, AlarmState, AlarmSeverity, andbindVarNamesValueStr
HA Score:Normal
Auto Clear Seconds:0 (zero)
OID:tpdHealthCheckFailed
Alarm ID:TKSPLATMI19
Recovery:
1. It is recommended to contact My Oracle Support.
32519 - NTP Offset Check failure
Alarm Group:PLAT
Description:This minor alarm indicates that time on the server is outside the acceptable range (oroffset) from the NTP server. The Alarm message will provide the offset value of theserver from the NTP server and the offset limit that the application has set for thesystem.
Severity:Minor
Instance:May include AlarmLocation, AlarmId, AlarmState, AlarmSeverity, andbindVarNamesValueStr
HA Score:Normal
Auto Clear Seconds:0 (zero)
OID:ntpOffsetCheckWarning
Alarm ID:TKSPLATMI20
Recovery:
Platform (31000-32800)
4-128 Policy Management SNMP User's Guide
1. Verify NTP settings and that NTP sources can be reached.
a. Ensure ntpd service is running.
b. Verify the content of the /etc/ntp.conf file is correct for the server.
c. Verify the ntp peer configuration; execute ntpq -p and analyze the output. Verifypeer data, (such as tally code (first column before "remote"), remote, refid,stratum (st), and jitter), are valid for server.
d. Execute ntpstat to determine the ntp time synchronization status. If notsynchronized or the stratum is not correct for server then ping the ntp peer todetermine if peer can be reached.
2. If ntp peer is reachable, restart the ntpd service.
3. If problem persists then a reset the NTP date may resolve the issue.
Note: Before resetting the ntp date, the applications may need to be stopped;and subsequent to the ntp reset, the application restarted.
a. To reset date:
• sudo service ntpd stop
• sudo ntpdate <ntp server ip>
• sudo service ntpd start
4. If the problem persists, it is recommended to contact My Oracle Support.
32520 - NTP Stratum Check failure
Alarm Group:PLAT
Description:This alarm indicates that NTP is syncing to a server, but the stratum level of the NTPserver is outside of the acceptable limit. The Alarm message will provide the stratumvalue of the NTP server and the stratum limit that the application has set for thesystem.
Severity:Minor
Instance:May include AlarmLocation, AlarmId, AlarmState, AlarmSeverity, andbindVarNamesValueStr
HA Score:Normal
Auto Clear Seconds:0 (zero)
Platform (31000-32800)
Support for Traps 4-129
OID:ntpStratumCheckFailed
Alarm ID:TKSPLATMI21
Recovery:
1. Verify NTP settings and that NTP sources can be reached.
a. Ensure ntpd service is running.
b. Verify the content of the /etc/ntp.conf file is correct for the server.
c. Verify the ntp peer configuration; execute ntpq -p and analyze the output. Verifypeer data, (such as tally code (first column before "remote"), remote, refid,stratum (st), and jitter), are valid for server.
d. Execute ntpstat to determine the ntp time synchronization status. If notsynchronized or the stratum is not correct for server then ping the ntp peer todetermine if peer can be reached.
2. If ntp peer is reachable, restart the ntpd service.
3. If problem persists then a reset the NTP date may resolve the issue.
Note: Before resetting the ntp date, the applications may need to be stopped;and subsequent to the ntp reset, the application restarted.
a. To reset date:
• sudo service ntpd stop
• sudo ntpdate <ntp server ip>
• sudo service ntpd start
4. If the problem persists, it is recommended to contact My Oracle Support.
32521 - SAS Presence Sensor Missing
Alarm Group:PLAT
Description:This alarm indicates that the T1200 server drive sensor is not working.
Severity:Minor
Instance:May include AlarmLocation, AlarmId, AlarmState, AlarmSeverity, andbindVarNamesValueStr
HA Score:Normal
Platform (31000-32800)
4-130 Policy Management SNMP User's Guide
Auto Clear Seconds:0 (zero)
OID:sasPresenceSensorMissing
Alarm ID:TKSPLATMI22
Recovery:
1. It is recommended to contact My Oracle Support to get a replacement sensor.
32522 - SAS Drive Missing
Alarm Group:PLAT
Description:This alarm indicates that the number of drives configured for this server is not beingdetected.
Severity:Minor
Instance:May include AlarmLocation, AlarmId, AlarmState, AlarmSeverity, andbindVarNamesValueStr
HA Score:Normal
Auto Clear Seconds:0 (zero)
OID:sasDriveMissing
Alarm ID:TKSPLATMI23
1. It is recommended to contact My Oracle Support.
32523 - DRBD failover busy
Alarm Group:PLAT
Description:This alarm indicates that a DRBD sync is in progress from the peer server to the localserver. The local server is not ready to act as the primary DRBD node, since it’s data isnot up to date.
Severity:Minor
Platform (31000-32800)
Support for Traps 4-131
Instance:May include AlarmLocation, AlarmId, AlarmState, AlarmSeverity, andbindVarNamesValueStr
HA Score:Normal
Auto Clear Seconds:0 (zero)
OID:tpdDrbdFailoverBusy
Alarm ID:TKSPLATMI24
Recovery
1. A DRBD sync should not take more than 15 minutes to complete. Please wait forapproximately 20 minutes, and then check if the DRBD sync has completed. If thealarm persists longer than this time period, it is recommended to contact My OracleSupport.
32524 - HP disk resync
Alarm Group:PLAT
Description:This minor alarm indicates that the HP disk subsystem is currently resynchronizingafter a failed or replaced drive, or some other change in the configuration of the HPdisk subsystem. The output of the message will include the disk that isresynchronizing and the percentage complete. This alarm should eventually clearonce the resync of the disk is completed. The time it takes for this is dependent on thesize of the disk and the amount of activity on the system.
Severity:Minor
Instance:May include AlarmLocation, AlarmId, AlarmState, AlarmSeverity, andbindVarNamesValueStr
HA Score:Normal
Auto Clear Seconds:0 (zero)
OID:tpdHpDiskResync
Alarm ID:TKSPLATMI25
Platform (31000-32800)
4-132 Policy Management SNMP User's Guide
Recovery:
1. Run syscheck in verbose mode.
2. If the percent recovering is not updating, wait at least 5 minutes betweensubsequent runs of syscheck.
3. If the alarm persists, it is recommended to contact My Oracle Support and providethe syscheck output.
32525 - Telco Fan Warning
Alarm Group:PLAT
Description:This alarm indicates that the Telco switch has detected an issue with an internal fan.
Severity:Minor
Instance:May include AlarmLocation, AlarmId, AlarmState, AlarmSeverity, andbindVarNamesValueStr
HA Score:Normal
Auto Clear Seconds:0 (zero)
OID:tpdTelcoFanWarning
Alarm ID:TKSPLATMI26
Recovery:
1. Contact the vendor to get a replacement switch. Verify the ambient air temperaturearound the switch is as low as possible until the switch is replaced.
Note: My Oracle Support personnel can perform an snmpget command orlog into the switch to get detailed fan status information.
32526 - Telco Temperature Warning
Alarm Group:PLAT
Description:This alarm indicates that the Telco switch has detected the internal temperature hasexceeded the threshold.
Platform (31000-32800)
Support for Traps 4-133
Severity:Minor
Instance:May include AlarmLocation, AlarmId, AlarmState, AlarmSeverity, andbindVarNamesValueStr
HA Score:Normal
Auto Clear Seconds:0 (zero)
OID:tpdTelcoTemperatureWarning
Alarm ID:TKSPLATMI27
Recovery:
1. Lower the ambient air temperature around the switch as low as possible.
2. If the problem persists, it is recommended to contact My Oracle Support.
32527 - Telco Power Supply Warning
Alarm Group:PLAT
Description:This alarm indicates that the Telco switch has detected that one of the duplicate powersupplies has failed.
Severity:Minor
Instance:May include AlarmLocation, AlarmId, AlarmState, AlarmSeverity, andbindVarNamesValueStr
HA Score:Normal
Auto Clear Seconds:0 (zero)
OID:tpdTelcoPowerSupplyWarning
Alarm ID:TKSPLATMI28
Recovery:
Platform (31000-32800)
4-134 Policy Management SNMP User's Guide
1. Verify the breaker was not tripped.
2. If the breaker is still good and problem persists, it is recommended to contact MyOracle Support who can perform a snmpget command or log into the switch todetermine which power supply is failing. If the power supply is bad, the switchmust be replaced.
32528 - Invalid BIOS value
Alarm Group:PLAT
Description:This alarm indicates that the HP server has detected that one of the setting for eitherthe embedded serial port or the virtual serial port is incorrect.
Severity:Minor
Instance:May include AlarmLocation, AlarmId, AlarmState, AlarmSeverity, andbindVarNamesValueStr
HA Score:Normal
Auto Clear Seconds:0 (zero)
OID:tpdInvalidBiosValue
Alarm ID:TKSPLATMI29
Recovery:
1. Change the BIOS values to the expected values which involves re-booting theserver. It is recommended to contact My Oracle Support for directions on changingthe BIOS.
32529 - Server Kernel Dump File Detected
Alarm Group:PLAT
Description:This alarm indicates that the kernel has crashed and debug information is available.
Severity:Minor
Instance:May include AlarmLocation, AlarmId, AlarmState, AlarmSeverity, andbindVarNamesValueStr
Platform (31000-32800)
Support for Traps 4-135
HA Score:Normal
Auto Clear Seconds:0 (zero)
OID:tpdServerKernelDumpFileDetected
Alarm ID:TKSPLATMI30
Recovery:
1. Run syscheck in verbose mode.
2. It is recommended to contact My Oracle Support.
32530 - TPD Upgrade Failed
Alarm Group:PLAT
Description:This alarm indicates that a TPD upgrade has failed.
Severity:Minor
Instance:May include AlarmLocation, AlarmId, AlarmState, AlarmSeverity, andbindVarNamesValueStr
HA Score:Normal
Auto Clear Seconds:0 (zero)
OID:TpdServerUpgradeFailed
Alarm ID:TKSPLATMI31
Recovery:
1. It is recommended to contact My Oracle Support.
32531 - Half Open Socket Warning Limit
Alarm Group:PLAT
Platform (31000-32800)
4-136 Policy Management SNMP User's Guide
DescriptionThis alarm indicates that the number of half open TCP sockets has reached the majorthreshold. This problem is caused by a remote system failing to complete the TCP 3-way handshake.
Severity:Minor
Instance:May include AlarmLocation, AlarmId, AlarmState, AlarmSeverity, andbindVarNamesValueStr
HA Score:Normal
Auto Clear Seconds:0 (zero)
OID:tpdHalfOpenSocketWarning
Alarm ID:TKSPLATMI32
Recovery:
1. Run syscheck in verbose mode.
2. It is recommended to contact My Oracle Support.
32532 - Server Upgrade Pending Accept/Reject
Alarm Group:PLAT
Description:This alarm indicates that an upgrade occurred but has not been accepted or rejectedyet.
Severity:Minor
Instance:May include AlarmLocation, AlarmId, AlarmState, AlarmSeverity, andbindVarNamesValueStr
HA Score:Normal
Auto Clear Seconds:0 (zero)
OID:tpdServerUpgradePendingAccept
Platform (31000-32800)
Support for Traps 4-137
Alarm ID:TKSPLATMI33
Recovery:
1. Follow the steps in the application procedure to accept or reject the upgrade.
32533 - TPD Max Number Of Running Processes Warning
Alarm Group:PLAT
Description:This alarm indicates that the maximum number of running processes has reached theminor threshold.
Severity:Minor
Instance:May include AlarmLocation, AlarmId, AlarmState, AlarmSeverity, andbindVarNamesValueStr
HA Score:Normal
Auto Clear Seconds:0 (zero)
OID:tpdMaxPidWarning
Alarm ID:TKSPLATMI34
Recovery:
1. Run syscheck in verbose mode.
2. It is recommended to contact My Oracle Support.
32534 - TPD NTP Source Is Bad Warning
Alarm Group:PLAT
Description:This alarm indicates that an NTP source has been rejected by the NTP daemon and isnot being considered as a time source.
Severity:Minor
Platform (31000-32800)
4-138 Policy Management SNMP User's Guide
Instance:May include AlarmLocation, AlarmId, AlarmState, AlarmSeverity, andbindVarNamesValueStr
HA Score:Normal
Auto Clear Seconds:0 (zero)
OID:tpdNTPSourceIsBad
Alarm ID:TKSPLATMI35
Recovery:
1. Verify NTP settings and that NTP sources can be reached.
a. Ensure ntpd service is running.
b. Verify the content of the /etc/ntp.conf file is correct for the server.
c. Verify the ntp peer configuration; execute ntpq -p and analyze the output. Verifypeer data, (such as tally code (first column before "remote"), remote, refid,stratum (st), and jitter), are valid for server.
d. Execute ntpstat to determine the ntp time synchronization status. If notsynchronized or the stratum is not correct for server then ping the ntp peer todetermine if peer can be reached.
2. If ntp peer is reachable, restart the ntpd service.
3. If problem persists then a reset the NTP date may resolve the issue.
Note: Before resetting the ntp date, the applications may need to be stopped;and subsequent to the ntp reset, the application restarted.
a. To reset date:
• sudo service ntpd stop
• sudo ntpdate <ntp server ip>
• sudo service ntpd start
4. If the problem persists, it is recommended to contact My Oracle Support.
32535 - TPD RAID disk resync
Alarm Group:PLAT
Platform (31000-32800)
Support for Traps 4-139
Description:This alarm indicates that the RAID logical volume is currently resyncing after afailed/replaced drive, or some other change in the configuration. The output of themessage will include the disk that is resyncing. This alarm should eventually clearonce the resync of the disk is completed. The time it takes for this is dependent on thesize of the disk and the amount of activity on the system (rebuild of 600G diskswithout any load takes about 75min).
Severity:Minor
Instance:May include AlarmLocation, AlarmId, AlarmState, AlarmSeverity, andbindVarNamesValueStr
HA Score:Normal
Auto Clear Seconds:0 (zero)
OID:tpdDiskResync
Alarm ID:TKSPLATMI36
Recovery:
1. Run syscheck in verbose mode.
2. If this alarm persists for several hours (depending on a load of a server, rebuildingan array can take multiple hours to finish), it is recommended to contact My OracleSupport.
32536 - TPD Server Upgrade snapshot(s) warning
Alarm Group:PLAT
Description:This alarm indicates that upgrade snapshot(s) are above configured threshold andeither accept or reject of LVM upgrade has to be run soon, otherwise snapshots willbecome full and invalid.
Severity:Minor
Instance:May include AlarmLocation, AlarmId, AlarmState, AlarmSeverity, andbindVarNamesValueStr
HA Score:Normal
Platform (31000-32800)
4-140 Policy Management SNMP User's Guide
Auto Clear Seconds:0 (zero)
OID:tpdUpgradeSnapshotWarning
Alarm ID:TKSPLATMI37
Recovery:
1. Run accept or reject of current LVM upgrade before snapshots become invalid.
2. It is recommended to contact My Oracle Support
32537 - FIPS subsystem warning event
Alarm Type:PLAT
Description:This alarm indicates that the FIPS subsystem requires a reboot in order to completeconfiguration.
Severity:Minor
Instance:May include AlarmLocation, AlarmId, AlarmState, AlarmSeverity, andbindVarNamesValueStr
HA Score:Normal
Auto Clear Seconds:0 (zero)
OID:tpdFipsSubsystemWarning
Recovery
1. If alarm does not clear on its own, it is recommended to contact My OracleSupport.
32540 - CPU Power limit mismatch
Alarm Group:PLAT
Description:The BIOS setting for CPU Power Limit is different than expected.
Severity:Minor
Platform (31000-32800)
Support for Traps 4-141
Instance:N/A
HA Score:Normal
Auto Clear Seconds:0 (zero)
OID:tpdCpuPowerLimitMismatch
Alarm ID:TKSPLATMI41
Recovery:
1. It is recommended to contact My Oracle Support.
32700 - Telco Switch Notification
Alarm Group:PLAT
DescriptionTelco Switch Notification
SeverityInfo
InstanceMay include AlarmLocation, AlarmId, AlarmState, AlarmSeverity, andbindVarNamesValueStr
HA ScoreNormal
Auto Clear Seconds86400
OIDtpdTelcoSwitchNotification
Recovery:
1. It is recommended to contact My Oracle Support.
32701 - HIDS Initialized
Alarm Group:PLAT
Description:This alarm indicates HIDS was initialized.
Platform (31000-32800)
4-142 Policy Management SNMP User's Guide
Default Severity:Info
OID:tpdHidsBaselineCreated
Recovery:
1. It is recommended to contact My Oracle Support.
32702 - HIDS Baseline Deleted
Alarm Group:PLAT
Description:HIDS baseline was deleted.
Default Severity:Info
OID:tpdHidsBaselineDeleted
Recovery:
1. It is recommended to contact My Oracle Support.
32703 - HIDS Enabled
Alarm Group:PLAT
Description:HIDS was enabled.
Default Severity:Info
OID:tpdHidsEnabled
Recovery:
1. It is recommended to contact My Oracle Support.
32704 - HIDS Disabled
Alarm Group:PLAT
Description:HIDS was disabled.
Platform (31000-32800)
Support for Traps 4-143
Default Severity:Info
OID:tpdHidsDisabled
Recovery:
1. It is recommended to contact My Oracle Support.
32705 - HIDS Monitoring Suspended
Alarm Group:PLAT
Description:HIDS monitoring suspended.
Default Severity:Info
OID:tpdHidsSuspended
Recovery:
1. It is recommended to contact My Oracle Support.
32706 - HIDS Monitoring Resumed
Alarm Group:PLAT
Description:HIDS monitoring resumed.
Default Severity:Info
OID:tpdHidsResumed
Recovery:
1. It is recommended to contact My Oracle Support.
32707 - HIDS Baseline Updated
Alarm Group:PLAT
Description:HIDS baseline updated.
Platform (31000-32800)
4-144 Policy Management SNMP User's Guide
Default Severity:Info
OID:tpdHidsBaselineUpdated
Recovery:
1. It is recommended to contact My Oracle Support.
QP (70000-70999)The QBus Platform (QP) software provides an execution environment for Java-basedapplications, which are the Multiprotocol Routing Agent (MRA) devices, MultimediaPolicy Engine (MPE) devices, or the Configuration Management Platform (CMP)server. QP provides common interfaces into databases, event logging, SNMP, andcluster state. Two servers in the cluster provide 1+1 High-Availability (HA) protection.The application executes on one server. The other server acts as a hot standby in casethe first server fails to provide service.
70001 – QP_procmgr failed
Alarm TypeQP
DescriptionThe QP-procmgr process has failed. This process manages all PCRF software.
Default SeverityCritical
InstanceN/A
HA ScoreFailed
Clearing ActionThis alarm is cleared by qp-procmgr after qp-procmgr is restarted.
OIDQPProcmgrFailed
Recovery:
1. If the alarm does not clear automatically within a few seconds, or if the alarmoccurs frequently, contact My Oracle Support.
70002 – QP Critical process failed
Alarm TypeQP
DescriptionThe QP_procmgr has detected that one of the critical processes it monitors has failed.
QP (70000-70999)
Support for Traps 4-145
Default SeverityCritical
InstanceN/A
HA ScoreNormal
Clearing ActionThis alarm clears automatically.
OIDQPCriticalProcFailed
Recovery:
1. This alarm automatically clears as Policy processes are restarted.
2. If the alarm does not clear automatically within a few seconds, or if the alarmoccurs frequently, contact My Oracle Support.
70003 – QP Non-critical process failed
Alarm TypeQP
DescriptionThe QP_procmgr has detected that one of the non-critical processes it monitors hasfailed.
Default SeverityMinor
InstanceN/A
HA ScoreNormal
Clearing ActionThis alarm clears automatically after 60 seconds.
OIDQPNonCriticalProcFailed
Recovery:
1. If the alarm occurs infrequently, monitor the health of the system.
2. If the alarm occurs frequently, contact My Oracle Support.
70004 – QP Processes down for maintenance
QP (70000-70999)
4-146 Policy Management SNMP User's Guide
Alarm TypeQP
DescriptionThe QP processes have been brought down for maintenance.
Default SeverityMajor
InstanceN/A
HA ScoreFailed
Clearing ActionThis alarm clears when the QP processes are restarted and exit maintenance.
OIDQPMaintShutdown
Recovery:
1. If the alarm is occurring, confirm that the server is down for maintenance.
70007 - QP Resource Not Ready
Alarm Type: QP
Description: Not all QP resources are ready.
Severity: Critical
Instance: N/A
HA Score: Failed
Clearing Action: To clear the alarm, one of the following conditions must be met:
• All route resources managed by QP are functional.
• The alarm auto clears after 300 sec.
OID: QPResourceNotReady
Recovery:
Note: Static routes will be reapplied during the promotion of a node toActive. If a failure occurs while reapplying static routes, promoting a node toActive in turn will fail.
Note: Currently, only the route resource is managed by QP.
QP (70000-70999)
Support for Traps 4-147
Note: The main log location for troubleshooting route resource not readyissues is here:/var/camiant/log/qpRouteTool.log. Trace logs forqp_procmgr and routemgr may be needed for troubleshooting. Trace logscan be captured using commands:tr.cat qp_procmgr > /qp_procmgr.trace tr.cat routemgr > /routemgr.trace
1. If the original Active node can go back to Active, the current node will be demotedafter failure. In this situation, no workaround is needed because the system willrecover automatically. However, you need to check the reason that applying routesfails so that it does not occur in the next failover.
2. If the original Active node can not go back to Active, the current node willrepeatedly attempt to go Active. It will not become Active until the application ofstatic routes is successful. In this situation, the reason for the failure needs to bechecked case by case so that the system can be recovered.
70010 – QP Failed Server-backup Remote Archive Rsync
Alarm TypeQP
DescriptionA scheduled backup failed to synchronize the local server-backup archive with theremote server-backup archive.
• Hostname=<hostname | IPaddr>
• path=<path>
• errorcode=<rsync error>
Default SeverityMajor
InstanceN/A
HA ScoreNormal
Clearing ActionThis alarm clears automatically after 64800 seconds (18 hours).
OIDQPServerBackupRsyncFailed
Recovery:
1. Check that the parameters are correct; take corrective action based on the returnederror code details for alarms 70010 and 70011. Then re-attempt server-backupremote archive synchronization.
70011 – QP Failed System-backup Remote Archive Rsync
QP (70000-70999)
4-148 Policy Management SNMP User's Guide
Alarm TypeQP
DescriptionA scheduled backup failed to synchronize the local system-backup archive with theremote system-backup archive.Hostname=<host name | IP addr>, user=<user>, path=<path>,errorcode=<rsyncerror>
Default SeverityMajor
InstanceN/A
HA ScoreNormal
Clearing ActionThis alarm clears automatically after 64800 seconds (18 hours).
OIDQPSystemBackupRsyncFailed
Recovery:
1. Check that the parameters are correct; take corrective action based on the returnederror code details for alarms 70010 and 70011. Then re-attempt server-backupremote archive synchronization.
70012 – QP Failed To Create Server Backup
Alarm TypeQP
DescriptionA scheduled backup failed to create the local server-backup file.Failure-reason=<errorcode>
Default SeverityMajor
InstanceN/A
HA ScoreNormal
Clearing ActionThis alarm clears automatically after 64800 seconds (18 hours).
OIDQPServerBackupFailed
Recovery:
QP (70000-70999)
Support for Traps 4-149
1. Check that the parameters are correct; take corrective action based on the returnederror code details for alarms 70010 and 70011. Then re-attempt server-backupremote archive synchronization.
70013 – QP Failed To Create System Backup
Alarm TypeQP
DescriptionA scheduled backup failed to create the local system-backup file.Failure-reason=<errorcode>
Default SeverityMajor
InstanceN/A
HA ScoreNormal
Clearing ActionThis alarm clears automatically after 64800 seconds (18 hours).
OIDQPSystemBackupFailed
Recovery:
1. Check that the parameters are correct; take corrective action based on the returnederror code details for alarms 70010 and 70011. Then re-attempt server-backupremote archive synchronization.
70015 – Route Add Failed
Alarm TypeQP
DescriptionVIP Route Add Failed — VIP route add failed to re-apply during VIP event.The alarm displays the following information:
• IP-Type
• Route-Type
• Network
• Destination
• Gateway-Address
• Error Message
QP (70000-70999)
4-150 Policy Management SNMP User's Guide
Default SeverityMajor
InstanceN/A
HA ScoreNormal
Clearing ActionThis alarm clears automatically after 3600 seconds (60 minutes).
OIDQpAddRouteFailed
Recovery:
1. Use Platcfg Routing menu to repair the route manually.
70016 – No Available VIP Route
Alarm TypeQP
DescriptionThis alarm is raised when the application of a route item with VIP as the preferredsource fails because the VIP is not configured.
Default SeverityMinor
InstanceN/A
HA ScoreNormal
Clearing ActionWhen VIP becomes available, this alarm is cleared. If the route item is deleted, thisalarm is also cleared.
OIDQPNoVipForRoute
Recovery:
1. Check route configuration.
2. If route is configured correctly, this alarm can be ignored.
70017 – No Available Static IP
Alarm TypeQP
QP (70000-70999)
Support for Traps 4-151
DescriptionThis alarm is raised when the application of a route item with STATIC IP as preferredsource fails because the STATIC IP is not available.
Default SeverityMinor
InstanceN/A
HA ScoreNormal
Clearing ActionWhen a STATIC IP becomes available, this alarm is cleared. If the route item isdeleted, this alarm is also cleared.
OIDQPNoStaticIPForRoute
Recovery:
1. Check the route configuration and check the STATIC IP status.
2. Check route configuration; if route is configured correctly, this alarm can beignored.
70020 – QP Master database is outdated
Alarm TypeQP
DescriptionThe current MYSQL master server has an outdated database.
Default SeverityCritical
InstanceN/A
HA ScoreDegraded
Clearing ActionThis alarm clears when the master server either is made a slave server or if a databaserestore action clears the condition.
OIDQPMySQLMasterOutdated
Recovery:
1. Once the condition has occurred, the 80003 event will be sent once a minute. Waituntil all of the expected servers are being reported. It is important to wait because
QP (70000-70999)
4-152 Policy Management SNMP User's Guide
the best slave might be undergoing a restart and its DB Level will not be knownuntil after the restart completes.
2. Use the information in 80003 to select the new master candidate.
3. Except for the current master and the master candidate, put all of the other serversinto forced standby.
4. If the best secondary server is in the same cluster (the most common case), performa failover by restarting the current active blade. If the best secondary server is in aseparate cluster, then a site promotion is necessary.
5. Remove the forced standby settings on the other slaves.
6. If none of the slaves are good candidates, perform a database restore.
a. Put all of the slave servers into forced standby state.
b. Perform a restore on the active server.
The restore will clear the condition.
c. Take the slave servers out of the standby state.
70021 – QP slave database is unconnected to the master
Alarm TypeQP
DescriptionThe MySQL slave is not connected to the master.
Default SeverityMajor
InstanceN/A
HA ScoreFailed
Clearing ActionThis alarm clears automatically when the slave server connects to the master server.
OIDQPMySQLSlaveUnconnected
Recovery:
1. No action required unless the alarm does not clear within a few hours.
2. If the problem persists, contact My Oracle Support.
70022 – QP Slave database failed to synchronize
Alarm TypeQP
QP (70000-70999)
Support for Traps 4-153
DescriptionThe MySQL slave failed to synchronize with the master.
Default SeverityMajor
InstanceN/A
HA ScoreFailed
Clearing ActionThis alarm clears when the slave server synchronizes with the master server.
OIDQPMySQLSlaveSyncFailure
Recovery:
1. No action required unless the alarm does not clear within a few hours.
2. If the problem persists, contact My Oracle Support.
70023 – QP Slave database lagging the master
Alarm TypeQP
DescriptionThe MySQL slave is lagging the master —The MYSQL slave server is connected to themaster server but its database has fallen behind the master database.
Default SeverityMinor
InstanceN/A
HA ScoreDegraded
Clearing ActionThis alarm clears automatically when the slave database is synchronized with themaster database.
OIDQPMySQLSlaveLagging
Recovery:
1. No action required unless the alarm does not clear within a few hours or thecondition is repeatedly set and cleared.
2. If either of the problems persists, contact My Oracle Support.
QP (70000-70999)
4-154 Policy Management SNMP User's Guide
70024 - QP Slave database is prevented from synchronizing with the master
Alarm TypeQP
DescriptionThe MySQL slave has been prevented from synchronizing with the master—TheMySQL slave database has been prevented from synchronization with the masterdatabase because the master database is outdated.
Default SeverityCritical
InstanceN/A
HA ScoreDegraded
Clearing ActionThis alarm clears when the slave database is synchronized with the master database.This alarm is set on the slave server and will only occur when the active server on theprimary site has set alarm 70020. This alarm clears automatically when the slavedatabase is synchronized with the master database.
OIDQPMySQLSlaveSyncPrevented
Recovery:
1. Diagnose the CMP master server to clear its 70020 alarm.
2. Once alarm 70020 is cleared, the slave server will clear alarm 70024.
70025 – QP Slave database is a different version than the master
Alarm TypeQP
DescriptionThe MySQL slave has a different schema version than the master.This alarm is set by the CMP Slave Server during a CMP Server Upgrade or Backout,when the CMP Master Server DB is a different version than the CMP Slave Server DB.
Default SeverityCritical
InstanceN/A
HA ScoreNormal
QP (70000-70999)
Support for Traps 4-155
Clearing ActionThe slave server clears the alarm when the master DB version is equal to the slave DBversion.
OIDQPMySQLSchemaVersionMismatch
Recovery:
1. The Slave Server clears the alarm when the Master Server and the Slave Serveragain have the same version.
70026 – QP Server Symantec NetBackup Operation in Progress
Alarm TypeQP
DescriptionServer is performing a Symantec NetBackup Operation.
Default SeverityMinor
InstanceN/A
HA ScoreNormal
Clearing ActionAlarm clears when the NetBackup client operation has completed.
OIDQPNetBackupInProgress
Recovery:
1. When operation is complete, alarm should clear.
2. If the alarm does not clear within a few hours, then check the NetBackup Serverlogs.
3. If the NetBackup Server logs have no errors or if the alarm is occurring over andover, contact My Oracle Support.
70027 – QP Server Network Config Error
Alarm TypeQP
DescriptionQP Server Network Error.
Default SeverityMinor
QP (70000-70999)
4-156 Policy Management SNMP User's Guide
InstanceN/A
HA ScoreNormal
Clearing ActionAutoclears in 1800 seconds (30 minutes).
OIDQPServerNetworkConfigError
Recovery
1. Correct the indicated networking configuration.
2. If the problem persists, contact My Oracle Support.
70028 – QP bonded interface is down
Alarm TypeQP
DescriptionOAM bonded interface bond0 is down; Signaling bonded interface bond1 is down;Signaling bonded interface bond2 is down.
Default SeverityCritical
InstanceOAM, SIGA, SIGB
HA ScoreDegraded
Clearing ActionProcess qp_hamonitor has detected the VIP is not defined on this bonded networkinterface; VIP is defined on this bonded network interface and qp_hamonitorprocess has detected the interface is up.
OIDQPBondedInterfaceDown
Recovery:
1. Reset the OAM network interface and run process qp_hamonitor to clear thealarm.
2. If the qp_hamonitor process does not clear the alarm, or if the alarm does notclear automatically, or if the alarm is persists, contact My Oracle Support
70029 – QP peer node bonded interface is down
QP (70000-70999)
Support for Traps 4-157
Alarm TypeQP
DescriptionQP Peer Node ${host name} (${ip addr}) bonded interface bond0 (OAM) is down.
Default SeverityCritical
InstancePeer_OAM
HA ScoreNormal
Clearing ActionProcess qp_hamonitor will clear the alarm once the OAM network interface is up.The alarm will also clear automatically after 60 seconds.
OIDQPPeerBondedInterfaceDown
Recovery:
1. Reset the OAM network interface and run process qp_hamonitor to clear thealarm.
2. If the qp_hamonitor process does not clear the alarm, or if the alarm does notclear automatically, or if the alarm is persists, contact My Oracle Support
70030 – QP backplane bonded interface is down
Alarm TypeQP
DescriptionBackplane bonded interface is down.
Default SeverityCritical
InstanceBackplane_bond3
HA ScoreNormal
Clearing ActionProcess qp_hamonitor has detected the bonded backplane network interface hasbeen restored or the alarm has been raised for 60 seconds.
OIDQPBackplaneBondedInterfaceDown
Recovery:
QP (70000-70999)
4-158 Policy Management SNMP User's Guide
1. Restore the bonded backplane network interface that is down and theqp_hamonitor process will clear the alarm.
70031 – QP degrade because one or more interfaces are down
Alarm TypeQP
DescriptionHA status is degraded because selected interface(s) (${OAM, SIGA, or SIGB}) aredown.
Default SeverityCritical
InstanceOAM or SIGA or SIGB
HA ScoreFailed
Clearing ActionAlarm clears when process qp_hamonitor has detected all OAM, SIGA and SIGBnetwork interfaces are up. Alarm also clears automatically after 60 seconds.
OIDQPInterfacesDegrade
Recovery:
1. Reset the interfaces that are down and run the qp_hamonitor process to clear thealarm.
2. If this does not clear the alarm, or if the alarm does not automatically clear, or if thealarm persists, contact My Oracle Support.
70032 – QP direct link does not work as configuration
Alarm TypeQP
DescriptionQP degrade because one or more interfaces are down.This alarm is due to the incorrect configuration of backplane so that it cannot beapplied to the system.
Default SeverityNotice
InstanceN/A
HA ScoreNormal
QP (70000-70999)
Support for Traps 4-159
Clearing ActionN/A
OIDQPBpMismatch
Recovery:
1. Check the validity of backplane IP Address and Comcol table LogicPath.
70038 – QP has blocked IPv4 traffic on an OAM interface
Alarm TypeQP
DescriptionThis alarm is raised on each server if IPv4 is blocked on an OAM. AfterqpIPv4Harvest -–block_oam_ipv4 is finished successfully, this alarm is raised.
Default SeverityMinor
InstanceN/A
HA ScoreNormal
Clearing ActionThis alarm is cleared by qpIPv4Harvest –harvest_oam_only orqpIPv4Harvest –harvest_oam_all.
OIDQPHasBlockedIPv4
Recovery:
1. Rollback changes in qpIPv4Harvest –block_oam_ipv4; Or continue to runqpIPv4Harvest –harvest_oam_only.
70039 – QP has blocked IPv4 traffic on all interfaces
Alarm TypeQP
DescriptionThis alarm is raised on each server if IPv4 is blocked on all interfaces. AfterqpIPv4Harvest –block_all_ipv4 is finished successfully, this alarm is raised.
Default SeverityMinor
InstanceN/A
QP (70000-70999)
4-160 Policy Management SNMP User's Guide
HA ScoreNormal
Clearing ActionThis alarm is cleared by qpIPv4Harvest –harvest_all.
OIDQPHasBlockedIPv4
Recovery:
1. Rollback changes in qpIPv4Harvest –block_all_ipv4; Or continue to runqpIPv4Harvest –harvest_all.
70040 – Failure to block IPv4 on the OAM interface
Alarm TypeQP
DescriptionThis alarm is raised when there is a failure to block IPv4 on an OAM interface.
Default SeverityMinor
InstanceN/A
HA ScoreNormal
Clearing ActionThis alarm will be cleared automatically in 60 minutes. Or it can be cleared once thecluster/site has successfully blocked IPv4 on an OAM interface.
OIDQPFailedToBlockOAMIpv4
Recovery:
1. Correct the error conditions and run qpIPv4Harvest –block_oam_ipv4 again.
70041 – Failure to block IPv4 on the all interfaces
Alarm TypeQP
DescriptionThis alarm is raised when there is a failure to block IPv4 on all interfaces.
Default SeverityMinor
InstanceN/A
QP (70000-70999)
Support for Traps 4-161
HA ScoreNormal
Clearing ActionThis alarm will be cleared automatically in 1 hour. Or it can be cleared once thecluster/site has successfully blocked IPv4 on all interfaces.
OIDQPFailedToBlockAllIpv4
Recovery:
1. Correct the error conditions, and run qpIPv4Harvest –block_all_ipv4 again.
70042 – Failure to remove OAM IPv4 addresses from the cluster/site
Alarm TypeQP
DescriptionThis alarm is raised when there is a failure to remove OAM IPv4 addresses fromcluster/site
Default SeverityMinor
InstanceN/A
HA ScoreNormal
Clearing ActionThis alarm will be cleared automatically in 1 hour. Or it can be cleared once the OAMIPv4 addresses are successfully removed.
OIDQPFailedToRemoveOAMIpv4
Recovery:
1. Correct the error conditions and do the harvest again.
70043 – Failure to remove all IPv4 addresses from the cluster/site
Alarm TypeQP
DescriptionThis alarm is raised when there is a failure to remove all IPv4 addresses from cluster/site.
Default SeverityMinor
QP (70000-70999)
4-162 Policy Management SNMP User's Guide
InstanceN/A
HA ScoreNormal
Clearing ActionThis alarm will be cleared automatically in 1 hour. Or it can be cleared once all IPv4addresses are successfully removed.
OIDQPFailedToRemoveAllIpv4
Recovery:
1. Correct the error conditions and do harvest again.
70044 – Failure to rollback changes for removing IPv4 addresses
Alarm TypeQP
DescriptionThis alarm is raised when there is a failure to rollback changes for removing IPv4addresses.
Default SeverityMinor
InstanceN/A
HA ScoreNormal
Clearing ActionThis alarm will be cleared automatically in 1 hour. Or it can be cleared once therollback action finished successfully.
OIDQPFailedToRollbackRecaptureIpv4
Recovery:
1. Correct the error conditions and do the rollback again.
70045 – DNS Server is not available
Alarm TypeQP
QP (70000-70999)
Support for Traps 4-163
DescriptionIf DNS servers are configured on PCRF nodes, those nodes will use DNS servers.Process qp_monitor will check DNS availability at the runtime of every node. If aDNS server is found unavailable, QP alarm 70045 is triggered.
Default SeverityMajor
InstanceN/A
HA ScoreNormal
Clearing ActionThis alarm will be cleared automatically after 120 seconds.
OIDQPDNSServerIsNotAvailable
Recovery:
1. If the alarm message is No reply from server, the server could not be reached orthe connection has timed out. To resolve:
a. Check the route and firewall settings from the PCRF node reporting the alarm todetermine if a DNS server can be accessed.
b. Repair the access to the specific DNS server.
2. If the alarm message is Internal error the DNS server IP address format is incorrect.To resolve:
a. Use Platcfg commands Policy Configuration -> Perform InitialConfiguration to check the IP address format of the DNS server:
70050 – QP Timezone change detected
Alarm TypeQP
DescriptionTime zone has been changed using platcfg commands Server Configuration-> Time Zone -> Edit. The application needs to be restarted after this change.
Default SeverityMinor
InstanceN/A
HA ScoreNormal
QP (70000-70999)
4-164 Policy Management SNMP User's Guide
Clearing ActionThis alarm clears when the application is restarted (qp_procmgr restarted). This isnot an auto-clear alarm.
OIDQPTimezonechangedetected
Recovery:
1. Log in to the server with root privileges.
2. Execute the command service qp_procmgr restart.
3. If the alarm persists, collect savelogs and contact My Oracle Support.
70500 – System Mixed Version
Alarm TypeQP
DescriptionThere are multiple software versions running in the system because of an upgrade orbackout. This alarm is raised when the upgrade director determines that differentversions of code are running in the topology. This is expected during an upgrade. It isintended to be a signal that further upgrade activity is required before the system isfully consistent.
Default SeverityMinor
InstanceN/A
HA ScoreNormal
Clearing ActionN/A
OIDSystemMixedVersion
Recovery:
1. The upgrade director will clear this condition once all servers are running aconsistent version.
2. If the alarm does not clear automatically, contact My Oracle Support.
70501 – Cluster Mixed Version
Alarm TypeQP
QP (70000-70999)
Support for Traps 4-165
DescriptionThere are multiple software versions running in a cluster because of an upgrade orbackout. Since the cluster is in mixed version, its behavior is likely to be impaired (forexample, loss of redundancy/replication). Certain operations may not be possible forthe cluster while this alarm is asserted. This alarm is raised when the upgrade directordetermines that different versions of code are running in the specified cluster. This isexpected during an upgrade. It is intended to be a signal that further upgrade activityis required before the cluster is fully consistent.
Default SeverityMinor
InstanceThe Comcol ID of the cluster.
HA ScoreNormal
Clearing ActionN/A
OIDClusterMixedVersion
Recovery:
1. The upgrade director will clear this condition once all servers in the cluster arerunning a consistent version.
2. If the alarm does not clear automatically, contact My Oracle Support.
70502 – Cluster Replication Inhibited
Alarm TypeQP
DescriptionThe upgrade director will inhibit replication to a server if it determines thatreplication would result in a corrupted database. This can happen if there is anincompatibility between different versions.
Default SeverityMinor
InstanceThe Comcol ID of the server.
Note: The alarm text will contain the proper host name of the server.
HA ScoreNormal
Clearing ActionN/A
QP (70000-70999)
4-166 Policy Management SNMP User's Guide
OIDClusterReplicationInhibited
Recovery:
1. Once the server completes the upgrade or backout, the upgrade director will clearthe inhibition and the alarm.
2. If the alarm does not clear automatically, contact My Oracle Support.
70503 – Server Forced Standby
Alarm TypeQP
DescriptionThe upgrade director will place a server into forced standby if it is NOT running thesame version of software as the active server in the cluster. This alarm signals that theupgrade director has taken this action.
Default SeverityMinor
InstanceThe Comcol ID of the server.
Note: The alarm text will contain the proper hostname of the server.
HA ScoreNormal
Clearing ActionN/A
OIDServerForcedStandby
Recovery:
1. When the server completes the upgrade or backout, the upgrade director will takethe server out of forced standby.
2. If the alarm does not clear automatically, contact My Oracle Support.
70505 – ISO Mismatch
Alarm TypeQP
DescriptionThe server's ISO is not the expected version. This alarm is raised when the upgradedirector determines that the 'pending ISO' (the one that would be installed if weattempted an upgrade) is not consistent with what is expected (for example, thewrong version).
QP (70000-70999)
Support for Traps 4-167
Default SeverityMinor
InstanceThe Comcol ID of the server.
Note: The alarm text will contain the proper host name of the server.
HA ScoreNormal
Clearing ActionN/A
OIDISOMismatch
Recovery:
1. Have the operator remove the offending ISO from /var/TKLC/log on the affectedmachine.
2. If the alarm does not clear automatically, contact My Oracle Support.
70506 – Upgrade Operation Failed
Alarm TypeQP
DescriptionAn action initiated by the upgrade director has failed. Click Alarm Details associatedwith the alarm in the CMP GUI to find the root cause of the failed upgrade action.
Default SeverityMinor
InstanceThe Comcol ID of the server.
Note: The alarm text will contain the proper host name of the server.
HA ScoreNormal
Clearing ActionN/A
OIDUpgradeOperationFailed
Recovery:
QP (70000-70999)
4-168 Policy Management SNMP User's Guide
1. Make changes as detailed in the Alarm Detail associated with the alarm and thenre-attempt the failed upgrade action.
2. If the issues cannot be resolved, collect savelogs and contact My Oracle Support.
70507 – Upgrade In Progress
Alarm TypeQP
DescriptionAn upgrade or backout action on a server is in progress.
Default SeverityMinor
InstanceThe Comcol ID of the server.
Note: The alarm text will contain the proper host name of the server.
HA ScoreNormal
Clearing ActionN/A
OIDUpgradeInProgress
Recovery:
1. Once the upgrade/backout process has completed, the upgrade director will clearthis alarm.
2. If the alarm does not clear automatically, contact My Oracle Support.
70508 – Server Is Zombie
Alarm TypeQP
DescriptionA server has failed an upgrade or backout and now is in an unknown state.
Default SeverityCritical
InstanceThe Comcol ID of the server.
QP (70000-70999)
Support for Traps 4-169
Note: The alarm text will contain the proper host name of the server.
HA ScoreNormal
Clearing ActionN/A
OIDServerIsZombie
Recovery:
1. If alarm 70506 is also triggered, make changes as detailed in the Alarm Detailassociated with alarm 70506 and then re-attempt the failed upgrade action toresolve both alarms.
2. If the alarm persists, collect savelogs and contact My Oracle Support.
Policy Server Alarms (71000-79999)This section provides a list of Policy Server alarms (71000-79999) which are generatedby policy devices, such as MPE devices and MRA devices.
71001 – Remote Diversion Not Possible
Alarm TypePCRF
DescriptionThis alarm occurs when all other associated MRA devices are currently unavailablefor remote diversion.
Default SeverityMinor
InstanceN/A
HA ScoreNormal
Clearing ActionAuto clear after 7200 seconds.
OIDRemoteDiversionNotPossible
Recovery:
1. If the problem persists, contact My Oracle Support.
71002 – OM Stats Parse Error
Policy Server Alarms (71000-79999)
4-170 Policy Management SNMP User's Guide
Alarm TypePCRF
DescriptionOM statistics task could not parse statistics information.
Default SeverityMinor
InstanceN/A
HA ScoreNormal
Clearing ActionAuto clears after 7200 seconds or when OM statistics are run again.
OIDOmStatsParseError
Recovery:
1. Check to ensure Policy server version is the same as the CMP version. If theversions are different, upgrade the server version to be the same as the CMPversion.
71003 – OM Stats Exception Error
Alarm TypePCRF
DescriptionOM statistics task could not generate particular statistics due to an exception.
Default SeverityMinor
InstanceN/A
HA ScoreNormal
Clearing ActionAuto clear after 7200 seconds (120 minutes) or when OM statistics are run again.
OIDOmStatsExceptionError
Recovery:
1. Check to ensure Policy server version is the same as the CMP version. If theversions are different, upgrade the server version to be the same as the CMPversion.
Policy Server Alarms (71000-79999)
Support for Traps 4-171
2. Check MySQL status to ensure there is not an exception in the DC log.
71004 – AM Conn Lost
Alarm TypePCRF
DescriptionAM socket closed.
Default SeverityMinor
InstanceN/A
HA ScoreNormal
Clearing ActionAM connection restored to remote peer.
OIDAMConnLost
Recovery:
1. Check the availability of the AM.
2. Check the AM log for a recent failover or other operations that can interruptcommunications.
3. If the AM has not failed, make sure that the path from the AM to the MPE device(port 3918) is operational.
4. If the problem persists, contact My Oracle Support.
71005 – OM Stats Value Exceed Error
Alarm TypePCRF
DescriptionOM statistics value has been truncated to fit the data size.
Default SeverityMinor
InstanceN/A
HA ScoreNormal
Policy Server Alarms (71000-79999)
4-172 Policy Management SNMP User's Guide
Clearing ActionAuto clears after 7200 seconds or when OM statistics are run again.
OIDOmStatsValueExceedError
Recovery:
1. Check whether the list of IP addresses in a Network Element Diameter SCTPconnection association value exceeds 255 in length. If found, correct the valuelength.
71101 – DQOS Downstream Connection Closed
Alarm TypePCRF
DescriptionDQoS Downstream connection is closed.
Default SeverityMinor
InstanceN/A
HA ScoreNormal
Clearing ActionDQoS connection restored to a remote peer.
OIDDqosDownstreamConnectionClosed
Recovery:
1. Check configuration and availability of the downstream element.
2. Check the downstream element for a reboot or other service interruption.
3. .If the downstream element has not failed, make sure that the network path fromthe MPE device to the downstream element is operational.
4. If the problem persists, contact My Oracle Support.
71102 – MSC Conn Lost
Alarm TypePCRF
DescriptionMSC connection lost. The connection was lost to the specified CMTS or downstreampolicy server.
Policy Server Alarms (71000-79999)
Support for Traps 4-173
Default SeverityMinor
InstanceN/A
HA ScoreNormal
Clearing ActionConnection to a remote peer is restored.
OIDMSCConnLost
Recovery:
1. Check configuration and availability of the network element.
2. Check the network element for a reboot or other service interruption.
3. If the element has not failed, make sure that the network path from the MPE deviceto the element (port 3918) is operational.
4. If the problem persists, contact My Oracle Support.
71103 – PCMM Conn Lost
Alarm TypePCRF
DescriptionPCMM connection lost. The connection was lost to the specified CMTS ordownstream policy server.
Default SeverityMinor
InstanceN/A
HA ScoreNormal
Clearing ActionAlarm clears when the connection to a remote peer is restored. The alarm also clearsautomatically after 7200 seconds.
OIDPCMMConnLost
Recovery:
1. Check configuration and availability of the network element.
2. Check the network element for a reboot or other service interruption.
Policy Server Alarms (71000-79999)
4-174 Policy Management SNMP User's Guide
3. If the element has not failed, make sure that the network path from the MPE deviceto the element (port 3918) is operational.
4. If the problem persists, contact My Oracle Support.
71104 – DQOS AM Connection Closed
Alarm TypePCRF
DescriptionDQoS AM Connection Closed.
Default SeverityMinor
InstanceN/A
HA ScoreNormal
Clearing ActionConnection to a remote peer is restored.
OIDDqosAmConnectionClosed
Recovery:
1. If the problem persists, contact My Oracle Support.
71204 – SPC Conn Closed
Alarm TypePCRF
DescriptionSPC connection closed.
Default SeverityMinor
InstanceN/A
HA ScoreNormal
Clearing ActionConnection to a remote peer is restored.
OIDSPCConnClosed
Policy Server Alarms (71000-79999)
Support for Traps 4-175
Recovery:
1. Check configuration and availability of the SPC element. Check the MPE device fora reboot or other service interruption.
2. If the MPE device has not failed, make sure that the network path from the MPEdevice to the SPC device is operational.
3. If the problem persists, contact My Oracle Support.
71402 – Connectivity Lost
Alarm TypePCRF
DescriptionDiameter connection socket is closed.
Default SeverityMinor
InstanceN/A
HA ScoreNormal
Clearing ActionThis alarm clears automatically after 7200 seconds or the connection to a Diameterpeer is restored.
OIDConnectivityLost
Recovery:
1. Check the configuration and availability of the network element.
2. Check the network element for a reboot or other service interruption.
3. If the network element has not failed, ensure the network path from the device tothe network element is operational.
4. If the problem persists, contact My Oracle Support.
71403 – Connectivity Degraded
Alarm TypePCRF
DescriptionA connection with a Diameter peer has been closed by a network element.
Default SeverityMinor
Policy Server Alarms (71000-79999)
4-176 Policy Management SNMP User's Guide
InstanceN/A
HA ScoreNormal
Clearing ActionThis alarm clears automatically after 7200 seconds or the connection to a Diameterpeer is restored.
OIDConnectivityDegraded
Recovery:
1. Check the configuration and availability of the network element.
2. Check the network element for a reboot or other service interruption.
3. If the network element has not failed, ensure the network path from the device tothe network element is operational.
4. If the problem persists, contact My Oracle Support.
71408 – Diameter New Conn Rejected
Alarm TypePCRF
DescriptionDiameter new connection rejected as an already functioning one exists. A Diameterpeer (identified by its Diameter Identity) attempted to establish a connection with thedevice although it already has a valid connection. The Diameter protocol allows onlyone connection from a particular peer.
Note: This situation only occurs whenDIAMETER.AllowMultipleConnectionsPerPeer is set to false, or when themultiple connections setting is turned off on the Advanced Settings of thePolicy Server tab in the CMP system.
Default SeverityMinor
InstanceN/A
HA ScoreNormal
Clearing ActionThis alarm clears automatically after 300 seconds.
OIDDIAMETERNewConnRejected
Policy Server Alarms (71000-79999)
Support for Traps 4-177
Recovery:
1. Check the peer configuration and ensure that the peer sees a valid connection withthe device.
2. If the problem persists, contact My Oracle Support.
71414 – SCTP Path Status Changed
Alarm TypePCRF
DescriptionSCTP Path Status Changed. Occurs when an MPE or MRA device is multihoming.The alarm occurs when one path fails, and clears when the path becomes availableagain. If the path that is currently transmitting Diameter messages fails, the alarm istriggered when the SCTP association tries to send the next Diameter message. If thepath is not transmitting Diameter messages (it is a backup) then it may take up to 30seconds for the alarm to be triggered, since heartbeat chunks are sent every 30seconds.
Default SeverityMinor
InstancePeer address + Association ID
HA ScoreNormal
Clearing ActionThis alarm clears automatically after 7200 seconds (2 hours).
OIDSctpPathStatusChanged
Recovery:
1. If the problem persists, contact My Oracle Support.
71605 – LDAP Conn Failed
Alarm TypePCRF
DescriptionConnection to LDAP server failed.
Default SeverityMinor
InstanceN/A
Policy Server Alarms (71000-79999)
4-178 Policy Management SNMP User's Guide
HA ScoreNormal
Clearing ActionConnection to LDAP server is restored or clears automatically after 7200 seconds (2hours).
OIDLdapConnFailed
Recovery:
1. Verify that there is no problem with the LDAP server or the network path used toreach the server.
2. If the problem persists, contact My Oracle Support.
71630 – DHCP Unexpected Event ID
Alarm TypePCRF
DescriptionDHCP Communication exception.
Default SeverityMinor
InstanceN/A
HA ScoreNormal
Clearing ActionNext successful DHCP operation will clear this alarm.
OIDDHCPUnexpectedEventId
Recovery:
1. If the problem persists, contact My Oracle Support.
71631 – DHCP Unable to Bind Event ID
Alarm TypePCRF
DescriptionDHCP unable to bind event ID.
Default SeverityMinor
Policy Server Alarms (71000-79999)
Support for Traps 4-179
InstanceN/A
HA ScoreNormal
Clearing ActionNext successful DHCP bind operation will clear this alarm or clears automaticallyafter 60 seconds.
OIDDHCPUnableToBindEventId
Recovery:
1. If this alarm occurs infrequently, monitor the health of the system.
2. If this alarm occurs frequently, contact My Oracle Support.
71632 – DHCP Response Timeout Event ID
Alarm TypePCRF
DescriptionDHCP Response Timeout Event Id.
Default SeverityMinor
InstanceN/A
HA ScoreNormal
Clearing ActionThis alarm clears automatically after 60 seconds.
OIDDHCPResponseTimeoutEventId
Recovery:
1. If this alarm occurs infrequently, then monitor the health of the system.
2. If this alarm occurs frequently, contact My Oracle Support.
71633 – DHCP Bad Relay Address Event ID
Alarm TypePCRF
DescriptionDHCP bad relay address event id.
Policy Server Alarms (71000-79999)
4-180 Policy Management SNMP User's Guide
Default SeverityMinor
InstanceN/A
HA ScoreNormal
Clearing ActionThis alarm clears automatically after 30 seconds.
OIDDHCPBadRelayAddressEventId
Recovery:
1. If this alarm occurs infrequently, then monitor the health of the system.
2. If this alarm occurs frequently, contact My Oracle Support.
71634 – DHCP Bad Primary Address Event ID
Alarm TypePCRF
DescriptionDHCP no primary address specified.
Default SeverityMinor
InstanceN/A
HA ScoreNormal
Clearing ActionThis alarm clears automatically after 30 seconds.
OIDDHCPBadPrimaryAddressEventId
Recovery:
1. If this alarm occurs infrequently, then monitor the health of the system.
2. If this alarm occurs frequently, contact My Oracle Support.
71635 – DHCP Bad Secondary Address Event ID
Alarm TypePCRF
Policy Server Alarms (71000-79999)
Support for Traps 4-181
DescriptionDHCP no secondary address specified.
Default SeverityMinor
InstanceN/A
HA ScoreNormal
Clearing ActionThis alarm clears automatically after 30 seconds.
OIDDHCPBadSecondaryAddressEventId
Recovery:
1. If this alarm occurs infrequently, then monitor the health of the system.
2. If this alarm occurs frequently, contact My Oracle Support.
71684 – SPR Connection Closed
Alarm TypePCRF
DescriptionSPR Closing a secondary connection to revert to primary connection.
Default SeverityMinor
InstanceN/A
HA ScoreNormal
Clearing ActionConnection to SPR is restored.
OIDSPRConnectionClosed
Recovery:
1. If the problem persists, contact My Oracle Support.
71685 – MSR DB Not Reachable
Alarm TypePCRF
Policy Server Alarms (71000-79999)
4-182 Policy Management SNMP User's Guide
DescriptionUnable to connect to Multimedia Subscriber Repository (MSR) after several attempts.
Default SeverityMinor
InstanceN/A
HA ScoreNormal
Clearing ActionConnection to MSR is restored.
OIDMSRDBNotReachable
Recovery:
1. Verify that there is no problem with the MSR server or the network path used toreach the server.
2. If the problem persists, contact My Oracle Support.
71702 – BRAS Connection Closed
Alarm TypePCRF
DescriptionBRAS Connection Closed. The MPE device lost a connection to the B-RAS element ofthe gateway.
Default SeverityMinor
InstanceN/A
HA ScoreNormal
Clearing ActionConnection to BRAS is restored.
OIDBrasConnectionClosed
Recovery:
1. Check availability of the gateway.
2. If the gateway has not failed, make sure that the path from the gateway to the MPEis operational.
Policy Server Alarms (71000-79999)
Support for Traps 4-183

3. If the problem persists, contact My Oracle Support.
71703 – COPS Unknown Gateway
Alarm TypePCRF
DescriptionCOPS Unknown Gateway. An unknown gateway is trying to establish a COPS-PRconnection to the MPE device.
Default SeverityMinor
InstanceN/A
HA ScoreNormal
Clearing ActionCOPS network element is associated with MPE device.
OIDCOPSUnknownGateway
Recovery:
1. Check the configuration of the network elements in the CMP system. There shouldbe a B-RAS network element for this gateway and that B-RAS must be associatedwith this MPE device.
2. Make sure that the configuration of the B-RAS network element is consistent withthe provisioned information on the gateway.
The network element name in the CMP system must match the provisioned routername on the gateway.
3. If the problem persists, contact My Oracle Support.
71801 – PCMM No PCEF
Alarm TypePCRF
DescriptionThis alarm is raised when the MPE cannot find the PCEF. The alarm is disabled bydefault unless the user sets RC.TrapNoPcefEnabled to true in RcMgr. This updateoccurs in both the MPE-R and MPE-S. The SubId in the alarm details is actuallyCMTSIP if the MPE uses CMTSIP to find PCEF when it receives PCMM requests. ThePCMM requests may be GateSet/GateInfo/GateDelete.
Default SeverityMinor
Policy Server Alarms (71000-79999)
4-184 Policy Management SNMP User's Guide
InstanceN/A
HA ScoreNormal
Clearing ActionThis alarm clears automatically after 60 seconds.
OIDPCMMNoPCEF
Recovery:
1. If this alarm occurs infrequently, monitor the health of the system.
2. If this alarm occurs frequently, contact My Oracle Support.
71805 – PCMM Non Connection PCEF
Alarm TypePCRF
DescriptionPCMM Non Connection to PCEF.
Default SeverityMinor
InstanceN/A
HA ScoreNormal
Clearing ActionThis alarm clears automatically after 60 seconds.
OIDPCMMNonConnectionPCEF
Recovery:
1. If this alarm occurs infrequently, monitor the health of the system.
2. If this alarm occurs frequently, contact My Oracle Support.
72198 – SMSR SMSC Switched to Primary
Alarm TypePCRF
DescriptionSwitched to primary Short Message Service Center (SMSC). Switched from Secondaryto Primary SMSC.
Policy Server Alarms (71000-79999)
Support for Traps 4-185
Default SeverityMinor
InstanceSMSC address
HA ScoreNormal
Clearing ActionThis alarm automatically clears after 60 minutes (3600 seconds).
OIDSMSRSMSCSwitchedToPrimary
Recovery:
1. No action necessary.
72199 – SMSR SMSC Switched to Secondary
Alarm TypePCRF
DescriptionSwitched to Secondary Short Message Service Center (SMSC). Switched from Primaryto Secondary SMSC.
Default SeverityMinor
InstanceSMSC Address
HA ScoreNormal
Clearing ActionThis alarm automatically clears after 60 minutes (3600 seconds).
OIDSMSRSMSCSwitchedToSecondary
Recovery:
1. No action necessary.
72210 – PCMM Reached Max Gates Event ID
Alarm TypePCRF
DescriptionPCMM Reached Maximum Gates. A subscriber at IP address ip-addr has reached theconfigured maximum number of upstream gates.
Policy Server Alarms (71000-79999)
4-186 Policy Management SNMP User's Guide
Default SeverityMinor
InstanceN/A
HA ScoreNormal
Clearing ActionThis alarm clears automatically after 60 seconds.
OIDPCMMReachedMaxGatesEventId
Recovery:
1. If this alarm occurs infrequently, monitor the health of the system.
2. If this alarm occurs frequently, contact My Oracle Support.
72211 – PCMM Reached Max GPI Event ID
Alarm TypePCRF
DescriptionPCMM Reached Maximum GPI. A subscriber at IP address ip-addr has reached theconfigured maximum grants per interval on all upstream gates.
Default SeverityMinor
InstanceN/A
HA ScoreNormal
Clearing ActionThis alarm clears automatically after 60 seconds.
OIDPCMMReachedMaxGPIEventId
Recovery:
1. This subscriber address is exceeding the capacity; attention is required.
2. If the problem persists, contact My Oracle Support.
72501 – SCE Connection Lost
Alarm TypePCRF
Policy Server Alarms (71000-79999)
Support for Traps 4-187
DescriptionService Control Engine (SCE) Connection is lost.
Default SeverityMinor
InstanceN/A
HA ScoreNormal
Clearing ActionConnection to SCE is restored.
OIDSCEConnectionLost
Recovery:
1. If the problem persists, contact My Oracle Support.
72549 – SMSR Queue Full
Alarm TypePCRF
DescriptionShort Message Service Relay (SMSR) internal queue is full: notification internal queuehas reached capacity. Messages will be rejected until the queue space becomesavailable.
Default SeverityMinor
InstanceSMSR queue
HA ScoreNormal
Clearing ActionAvailable capacity is restored and queue begins to accept new messages orautomatically clears after 60 minutes (3600 seconds).
OIDSMSRQueueFull
Recovery:
1. Check configuration and availability of the destination service to ensure there areno connections problems and that the network path from the MPE device to theelement (host/port/resource location) is operational.
Policy Server Alarms (71000-79999)
4-188 Policy Management SNMP User's Guide
72559 – SMSR SMSC Connection Closed
Alarm TypePCRF
DescriptionSMSC connection closed.
Default SeverityMinor
InstanceSMSC address
HA ScoreNormal
Clearing ActionThis alarm automatically clears after 60 minutes (3600 seconds) or when the SMSCconnection is restored.
OIDSMSRSMSCConnectionClosed
Recovery:
1. No action necessary.
72565 – SMSR SMTP Connection Closed
Alarm TypePCRF
DescriptionSimple Mail Transfer Protocol (SMTP) connection closed. SMTP connection has beenclosed to MTA {IP Address}.
Default SeverityMinor
Instance{host name of MTA}
HA ScoreNormal
Clearing ActionThis alarm automatically clears after 60 minutes (3600 seconds) or when the SMTPconnection is restored.
OIDSMSRSMTPConnectionClosed
Policy Server Alarms (71000-79999)
Support for Traps 4-189
Recovery:
1. If the problem persists, contact My Oracle Support.
72575 – Policy Notification:Lost connection with destination URL
Alarm TypePCRF
DescriptionThe connection to a configured Policy Notification destination was lost.
Default SeverityMinor
InstanceDestination Name
HA ScoreNormal
Clearing ActionAuto clears after 60 minutes (3600 seconds) or when HTTP connection is restored.
OIDSMSRHTTPConnectionClosed
Recovery:
1. Check configuration, including URL, and availability of the destination service.
2. Check the client for reboot or other service interruption.
3. If the element has not failed, make sure that the network path from the MPE deviceto the element (host/port/resource location) is operational.
4. If the problem persists, contact My Oracle Support.
72703 – RADIUS Server Failed
Alarm TypePCRF
DescriptionRADIUS server start failed.
Default SeverityMinor
InstanceN/A
HA ScoreN/A
Policy Server Alarms (71000-79999)
4-190 Policy Management SNMP User's Guide
Clearing ActionN/A
OIDRADIUSServerFailed
Recovery:
1. If the problem persists, contact My Oracle Support.
72706 - RADIUS Server Corrupt Auth
Alarm TypePCRF
DescriptionRADIUS authenticator is corrupted.
SeverityMinor
InstanceN/A
HA ScoreN/A
Clearing ActionN/A
OIDRADIUServerCorrupAuth
Recovery:
1. Check the connectivity and configuration of the RADIUS server.
72904 – Diameter Too Busy
Alarm TypePCRF
DescriptionSystem has entered a busy state.
Default SeverityMinor
InstanceN/A
HA ScoreNormal
Policy Server Alarms (71000-79999)
Support for Traps 4-191
Clearing ActionThe Diameter load drops below admission criteria thresholds or this alarm clearsautomatically after 30 seconds.
OIDDiameterTooBusy
Recovery:
1. If this alarm occurs infrequently, then monitor the health of the system.
2. If this alarm occurs frequently, contact My Oracle Support.
72905 – Radius Too Busy
Alarm TypePCRF
DescriptionRADIUS load shedding set a busy state.
Default SeverityMinor
InstanceN/A
HA ScoreNormal
Clearing ActionThe RADIUS load drops below admission criteria thresholds or this alarm clearsautomatically after 30 seconds.
OIDRadiusTooBusy
Recovery:
1. If this alarm occurs infrequently, then monitor the health of the system.
2. If this alarm occurs frequently, contact My Oracle Support.
74000 – Policy Server Critical Alarm
Alarm TypePCRF
DescriptionCritical Policy alarm.
Default SeverityCritical
Policy Server Alarms (71000-79999)
4-192 Policy Management SNMP User's Guide
InstanceN/A
HA ScoreNormal
Clearing ActionThis alarm can be cleared by a policy or clears automatically after 3600 seconds (60minutes).
OIDPolicyServerCriticalAlarm
Recovery:
1. If the problem persists, contact My Oracle Support.
74001 – Policy Server Major Alarm
Alarm TypePCRF
DescriptionMajor Policy alarm.
Default SeverityMajor
InstanceN/A
HA ScoreNormal
Clearing ActionThis alarm can be cleared by a policy or clears automatically after 3600 seconds (60minutes).
OIDPolicyServerMajorAlarm
Recovery:
1. If the problem persists, contact My Oracle Support.
74002 – Policy Server Minor Alarm
Alarm TypePCRF
DescriptionMinor Policy alarm.
Default SeverityMinor
Policy Server Alarms (71000-79999)
Support for Traps 4-193
InstanceN/A
HA ScoreNormal
Clearing ActionThis alarm can be cleared by a policy or clears automatically after 3600 seconds (60minutes).
OIDPolicyServerMinorAlarm
Recovery:
1. If the problem persists, contact My Oracle Support.
74020 – Stats Files Generator Delete Expire Files
Alarm TypePCRF
DescriptionDelete expire files. Stats Files Generator Task has removed some files which were notsynchronized to remote servers ({external system IP}, {external system IP}, etc).
Default SeverityMajor
InstanceStats files generator
HA ScoreNormal
Clearing ActionThe alarm is automatically cleared after 300 seconds (5 minutes).
OIDStatsFilesGeneratorDeleteExpireFiles
Recovery:
1. Check all enabled Stats Files Synchronization tasks status in the DC (DataCollection) tasks of CMP system and ensure they are configured successfully.
2. Exchange SSL key with mate server in cluster.
74021 – Files Synchronization Failure
Alarm TypePCRF
Policy Server Alarms (71000-79999)
4-194 Policy Management SNMP User's Guide
DescriptionFiles synchronization failure. Files Synchronization #{num} task failed to synchronizelocal to remote server ({external system Host Name/IP}) after retry {num} times, where:
• {num} is task #
• {num}is retry times (1 to 5)
• {external system Host Name/IP} is the user-defined remote server's IP address towhich files are synchronized
Default SeverityMinor
InstanceStats files synchronization
HA ScoreNormal
Clearing ActionAuto clear 300 seconds
OIDFilesSynchronizationFailure
Recovery:
1. Check the network status of the remote server which you configured in the StatsFiles Synchronization task.
2. Ensure remote server supports SSH protocol and you configured the user nameand password correctly.
74022 - Files Uploading Failure
Alarm TypePCRF
DescriptionPM Statistics Files Uploading Task failed to upload local statistics files to FTP serverFTP server Host Name/IP after retry number times.
Default SeverityMajor
InstanceN/A
HA ScoreNormal
Clearing ActionThis alarm automatically clears after 5 minutes (300 seconds).
Policy Server Alarms (71000-79999)
Support for Traps 4-195
OIDFilesUploadingFailureNotify
Recovery:
1. Fix network problems or verify FTP configuration information, which is defined inthe scheduler task of the CMP system.
2. If the issue does not resolve, contact My Oracle Support.
74102 - CMTS Subnet Overlapped
Alarm Type
DescriptionOverlapped subnets are present on the CMTS.
Default SeverityMinor
InstanceN/A
HA ScoreNormal
Clearing ActionAuto clears when task runs again.
OIDCmtsSubnetOverlapped
Recovery:
1. Go to Schedule Tasks Administration with menu item System Administration >Scheduled Tasks.
2. Open Subnet Overlap Detector Task hyperlink.
3. Open Subnet Overlapping Report by clicking 'details' hyperlink in Exit StatusMessage.
4. Refer to Subnet Overlap Report for overlapped subnets of CMTS detailinformation.
5. Reconfigure the subnets of CMTS to resolve the overlap.
6. Run the Subnet Overlap Detector task again.
7. If the issue still exists, repeat the previous steps.
74103 - NES Without CMTS IP
Alarm Type
Policy Server Alarms (71000-79999)
4-196 Policy Management SNMP User's Guide
DescriptionThis alarm is raised when Routing by CMTS IP is enabled and Network Elementsexist without CMTS IP addresses assigned.
Default SeverityMinor
InstanceN/A
HA ScoreNormal
Clearing ActionThis alarm automatically clears after 30 seconds.
OIDNeWithoutCmtsIp
Recovery:
1. If the problem persists, contact My Oracle Support.
74602 - Multiple Active In Cluster Failure
Alarm TypeQP
DescriptionMultiple Active servers have been detected in the same cluster; the cluster is in SplitBrain state.
Default SeverityMajor
InstanceN/A
HA ScoreNormal
Clearing ActionThis alarm clears when HA recovers or clears automatically after 30 minutes (1800seconds). When HA recovers there will be only one Active server in a cluster.
OIDQPMultipleActiveInClusterFailure
Recovery:
1. Fix network problems and restore connectivity.
2. Place one of the Active servers in the cluster into Forced Standby mode.
3. If the problem persists, contact My Oracle Support.
Policy Server Alarms (71000-79999)
Support for Traps 4-197
74603 - Max Primary Cluster Failure Threshold
Alarm TypeQP
DescriptionThe number of failed MPE pairs reaches the threshold of configured threshold value atsite name.
Default SeverityMajor
InstanceN/A
HA ScoreNormal
Clearing ActionThis alarm clears when the number of failed MPE pairs remain at a lower value thanthe threshold of max primary site failure threshold at site, or clears automatically after 30minutes (1800 seconds).
OIDQPMaxMPEPrimaryClusterFailure
Recovery:
1. When the failure count drops below the threshold value and stays below thethreshold for 30 seconds, the alarm is cleared. (The 30 seconds delay prevents thealarm from being cleared too soon.)
2. If alarm does not clear automatically, contact My Oracle Support.
74604 - MPE Cluster Offline Failure
Alarm TypeQP
DescriptionPolicy Cluster is offline.
Default SeverityCritical
InstanceN/A
HA ScoreNormal
Clearing ActionThis alarm clears when a server in the MPE cluster comes online. The alarm clearsautomatically after 30 minutes (1800 seconds).
Policy Server Alarms (71000-79999)
4-198 Policy Management SNMP User's Guide
OIDQPMPEClusterOfflineFailure
Recovery:
1. When a server comes online ( in Active, Standby, or Spare state), the alarm iscleared. Please check whether all servers are powered down or rebooted at thattime.
2. If alarm does not clear automatically, contact My Oracle Support.
74605 - Subscriber Trace Backup Failure
Alarm TypeQP
DescriptionThe script responsible for backing up the subscriber trace log has failed.
Default SeverityMinor
InstanceN/A
HA ScoreNormal
Clearing Action
OIDSubscriberTraceBackupFailure
Recovery:
1. When a server comes online ( in Active, Standby, or Spare state), the alarm iscleared. Please check whether all servers are powered down or rebooted at thattime.
2. If alarm does not clear automatically, contact My Oracle Support.
75000 - Policy Library Loading Failed
Alarm TypePCRF
DescriptionPolicy library loading failed. PCRF was unable to load the latest policy library. If thisalarm occurred at startup time or at failover, this indicates the PCRF does not haveany policies deployed. If this alarm occurred on a new policy push when PCRF wasrunning with some existing policies, this alarm indicates that the PCRF will continueto run with those existing policies.
Default SeverityMajor
Policy Server Alarms (71000-79999)
Support for Traps 4-199
InstanceN/A
HA ScoreNormal
Clearing ActionPerforming a reapply config may fix the problem.
OIDPolicyLoadingLibraryFailed
Recovery:
1. Perform a reapply config from the CMP system to reload the library.
2. If the problem persists, contact My Oracle Support.
77904 - BOD PCMM Too Busy
Alarm TypePCRF
DescriptionBOD PCMM load shedding set a busy state.
Default SeverityMinor
InstanceN/A
HA ScoreNormal
Clearing ActionThis alarm clears automatically after 30 seconds.
OIDBODPCMMTooBusy
Recovery:
1. If the problem persists, contact My Oracle Support.
77905 - BOD DIAMETER Too Busy
Alarm TypePCRF
DescriptionBOD DIAMETER Too Busy
Default SeverityMinor
Policy Server Alarms (71000-79999)
4-200 Policy Management SNMP User's Guide
InstanceN/A
HA ScoreNormal
Clearing ActionThis alarm clears automatically after 30 seconds.
OIDBODDiameterTooBusy
Recovery:
1. If the problem persists, contact My Oracle Support.
78000 - ADS Connection Lost
Alarm TypePCRF
DescriptionADS Connection Lost. The Analytics Data Stream (ADS) connection was lost to thespecified client.
Default SeverityMinor
InstanceAnalytics Client ID
HA ScoreNormal
Clearing ActionConnection to a remote peer is restored by the same client (ID), or automatically clearsin 60 minutes (3600 seconds).
OIDADSConnectionLost
Recovery:
1. Check configuration and availability of the analytics client.
2. Check the client for reboot or other service interruption.
3. If the element has not failed, make sure that the network path from the MPE deviceto the element (port 222) is operational.
4. If the problem persists, contact My Oracle Support.
78001 - Rsync Failed
Alarm TypePCRF
Policy Server Alarms (71000-79999)
Support for Traps 4-201
DescriptionTransfer of Policy jar files failed. PCRF was unable to transfer the latest policy libraryfrom the active to the standby server. The alarm can be raised by the active serverwhen a policy change is made or a Reapply Configuration is performed. It can beraised by the standby server during startup if it was unable to get the policy jar filefrom the active server during startup.
Default SeverityMajor
InstanceN/A
HA ScoreNormal
Clearing ActionSince the alarm can be raised by both the active and standby servers, the alarm willnot clear once the problem is fixed. It will be cleared when the issue is fixed internallyon the affected blades.
OIDRsyncFailed
Recovery:
1. This alarm can be ignored during a mixed version upgrade (for example, 7.5/7.6 to9.1) and when rebooting both servers on the MPE device.
2. If the alarm is seen on the MRA device, it indicates the logback config files are nottransferring, which is harmless to the operation.
3. The most likely cause is that the ssh keys have not been exchanged; ensure they areexchanged correctly.
4. Perform a Reapply Configuration.
5. If performing a Reapply Configuration does not fix the problem, another alarm willbe raised by the active server for that particular operation. If the problem persists,contact My Oracle Support.
78850 - VNF operation error
Alarm TypePCRF
DescriptionThere was an error while performing the requested operation on the VNF cluster.
Default SeverityMinor
InstanceN/A
Policy Server Alarms (71000-79999)
4-202 Policy Management SNMP User's Guide
HA ScoreNormal
Clearing ActionThe event will clear when the VM is in the Active state or the event must be clearedmanually.
OIDVNFOperationError
Recovery:
1. Trace Logs provide details of the operation failure and which VMs were impacted.Validate information that was submitted as part of the request. Correct Topologyand repeat the failed operation or take corrective action on the VM directly.
79002 - Sess Size Reached Threshold
Alarm TypePCRF
DescriptionTotal session database size reached maximum threshold percentage of plannedsession database size.
Default SeverityMinor
InstanceN/A
HA ScoreNormal
Clearing ActionTotal session database size goes below minimum threshold percentage of plannedsession database size.
OIDSessDBSizeReachedThreshold
Recovery:
1. Check the threshold configuration to make sure that it matches the expectation.
2. If the problem persists, contact My Oracle Support.
79003 - Avg Sess Size Exceed
Alarm TypePCRF
DescriptionAverage session size exceeded the projected size.
Policy Server Alarms (71000-79999)
Support for Traps 4-203
Default SeverityMinor
InstanceN/A
HA ScoreNormal
Clearing ActionThis alarm clears automatically after 60 minutes (3600 seconds).
OIDAvgSessSizeReachedThreshold
Recovery:
1. Check the threshold configuration to make sure that it matches the customer'sexpectation.
2. If the problem persists, contact My Oracle Support.
79004 - Bind Size Reached Threshold
Alarm TypePCRF
DescriptionTotal binding database size reached maximum threshold percentage of plannedbinding database size.
Default SeverityMinor
InstanceN/A
HA ScoreNormal
Clearing ActionTotal binding database size goes below minimum threshold percentage of plannedbinding database size or clears automatically after 60 minutes (3600 seconds).
OIDBindDBSizeReachedThreshold
Recovery:
1. Check the threshold configuration to make sure that it matches the customer'sexpectation.
2. If the problem persists, contact My Oracle Support.
Policy Server Alarms (71000-79999)
4-204 Policy Management SNMP User's Guide
79005 - Avg Bind Size Exceed
Alarm TypePCRF
DescriptionAverage binding size exceeded the projected size.
Default SeverityMinor
InstanceN/A
HA ScoreNormal
Clearing ActionThis alarm clears automatically after 60 minutes (3600 seconds).
OIDAvgBindSizeReachedThreshold
Recovery:
1. Check the threshold configuration to make sure that it matches the expectation.
2. If the problem persists, contact My Oracle Support.
79105 - Mediation SOAP Too Busy
Alarm TypePCRF
DescriptionMediation Server SOAP provisioning interface reaches busy state; load sheddingbegins.
Default SeverityMinor
InstanceN/A
HA ScoreNormal
Clearing ActionThis alarm clears automatically after 30 seconds or when the Mediation load recovers.
OIDMediationSOAPTooBusy
Policy Server Alarms (71000-79999)
Support for Traps 4-205
Recovery:
1. Check that UDR is in a normal state to handle a SOAP provisioning request.
2. If the problem persists, contact My Oracle Support.
79106 - SPR Connection Failed
Alarm TypePCRF
DescriptionCreated connection to SPR failed.
Default SeverityMinor
InstanceN/A
HA ScoreNormal
Clearing ActionThis alarm clears when provisioning the connection between the Mediation and UDRrecovers.
OIDSPRConnectionFailed
Recovery:
1. Check that the provisioning data source configuration on the Mediation server iscorrect.
2. If the problem persists, contact My Oracle Support.
79107 - Mediation Disk Quota Exceed
Alarm TypePCRF
DescriptionSync directory disk quota exceeded.
Default SeverityMinor
InstanceN/A
HA ScoreNormal
Policy Server Alarms (71000-79999)
4-206 Policy Management SNMP User's Guide
Clearing ActionThis alarm clears automatically after 3600 seconds or when the disk usage of theMediation server is decreased to value less than the quota limit.
OIDMSDiskQuotaExceed
Recovery:
1. Release disk usage to ensure that 32G of free disk space is available in the syncdirectory.
2. If the problem persists, contact My Oracle Support.
79108 - Mediation Disk No Space
Alarm TypePCRF
DescriptionNo space left on device.
Default SeverityMinor
InstanceN/A
HA ScoreNormal
Clearing ActionThis alarm clears when the disk space is not fully used.
OIDMSDiskNoSpace
Recovery:
1. Release disk usage to ensure that 32G of free disk space is available in the syncdirectory.
2. If the problem persists, contact My Oracle Support.
79109 - SPR License Limit
Alarm TypePCRF
DescriptionAchieve 80% maximum number of users in SPR.
Default SeverityMinor
Policy Server Alarms (71000-79999)
Support for Traps 4-207
InstanceN/A
HA ScoreNormal
Clearing ActionN/A
OIDSPRLicenselimit
Recovery:
1. If the problem persists, contact My Oracle Support.
79110 - Files Uploading Failure
Alarm TypePCRF
DescriptionSMS Notification Statistics Upload Task failed to upload stats files to remote FTPserver after retry.
Default SeverityMajor
InstanceN/A
HA ScoreNormal
Clearing ActionAuto clears after 300 seconds or the next time the task is run.
OIDFilesUploadingFailure
Recovery:
1. Check the FTP server configuration is correct in schedule task SMS NotificationStatistics Uploading Task.
2. Check and ensure remote FTP server is accessible and service is available.
79120 - Batch Disk Quota Exceeds
Alarm TypePCRF
DescriptionThe batch folder disk quota exceeds.
Policy Server Alarms (71000-79999)
4-208 Policy Management SNMP User's Guide
Default SeverityMinor
InstanceN/A
HA ScoreNormal
Clearing ActionN/A
OIDBatchDiskQuotaExceeds
Recovery:
1. If the problem persists, contact My Oracle Support.
79995 - X1 Connection Lost
Alarm TypePCRF
DescriptionThe X1 Connection between the Mediation Function and Policy Server is Lost.
Default SeverityMinor
InstanceN/A
HA ScoreNormal
Clearing ActionThis alarm clears automatically after 7200 seconds.
OIDX1ConnectionLost
Recovery:
1. Check if the X1 Connection is down.
2. If the problem persists, contact My Oracle Support.
79996 - X2 Connection Lost
Alarm TypePCRF
DescriptionX2 Connection between the Policy Server and Mediation Function is Lost.
Policy Server Alarms (71000-79999)
Support for Traps 4-209
Default SeverityMinor
InstanceN/A
HA ScoreNormal
Clearing ActionThis alarm clears automatically after 7200 seconds.
OIDX2ConnectionLost
Recovery:
1. Check if the X2 Connection is down.
2. If the problem persists, contact My Oracle Support.
Policy Server Events (80000-89999)This section provides a list of Policy Server events (80000-89999) which are generatedby policy devices, such as MPE devices and MRA devices.
80001 - DB State Transition
Alarm TypeQP
DescriptionThe DB status of the blade is not fully ready. The MySQL database manager generatesa "MySQL state transition" event every time it makes a state-machine transition. Theevent text describes the transition.
Default SeverityInfo
InstanceMySQL
HA ScoreNormal
Clearing ActionThis alarm is cleared by qp-procmgr as qp-procmgr shuts down.
OIDQPDBStateChange
Recovery:
1. Because this is an information-only message, there is no recovery action required.
Policy Server Events (80000-89999)
4-210 Policy Management SNMP User's Guide
80002 - MySQL Relay Log Dropped
Alarm TypeQP
DescriptionA portion of the MySQL relay log was dropped as the secondary server was shuttingdown. This event is raised when a secondary server times out while trying to applyits relay log during a secondary stop. The server may not be hurt, but there may beafter effects. This event is raised to trigger a debug for possible after effects.
Default SeverityInfo
InstanceN/A
HA ScoreNormal
Clearing ActionN/A
OIDQPMySQLRelayLogDropped
Recovery:
1. Debug the system for possible after effects caused by the timeout.
80003 - QP MySQL DB Level
Alarm TypeQP
DescriptionThe ranking of secondaries when the primary database is outdated. If the primarydatabase is outdated, the server raises this event once per minute. The server willrank the secondaries, from best to worst, based on their database level.
Default SeverityInfo
InstanceN/A
HA ScoreNormal
Clearing ActionN/A
OIDQPMySQLDBLevel
Policy Server Events (80000-89999)
Support for Traps 4-211
Recovery:
1. Use the information of this event to help resolve an outdated primary databaseraised by alarm 70020.
82704 - Binding Release Task
Alarm TypePCRF
DescriptionBinding Release Task. The binding release task has started, completed, or aborted.
Default SeverityInfo
InstanceN/A
HA ScoreNormal
Clearing ActionN/A
OIDBindingReleaseTask
Recovery:
1. No action required.
84004 - Policy Info Event
Alarm TypePCRF
DescriptionPolicy Info Event. Application is ready.
Default SeverityInfo
InstanceN/A
HA ScoreNormal
Clearing ActionN/A
OIDPolicyInfoEvent
Policy Server Events (80000-89999)
4-212 Policy Management SNMP User's Guide
Recovery:
1. No action required.
86001 – Application Is Ready
Alarm TypePCRF
DescriptionApplication is ready for service.
Default SeverityInfo
InstanceN/A
HA ScoreNormal
Clearing ActionN/A
OIDApplicationIsReady
Recovery:
1. No action required.
86100 - CMP User Login
Alarm TypePCRF
DescriptionCMP user login was successful.
Default SeverityInfo
InstanceN/A
HA ScoreNormal
Clearing ActionN/A
OIDCMPUserLogin
Policy Server Events (80000-89999)
Support for Traps 4-213
Recovery:
1. No action required. Recovery is immediate.
86101 - CMP User Login Failed
Alarm TypePCRF
DescriptionCMP user login failed.
Default SeverityInfo
InstanceN/A
HA ScoreNormal
Clearing ActionN/A
OIDCMPUserLoginFailed
Recovery:
1. No action required. Recovery is immediate.
86102 - CMP User Logout
Alarm TypePCRF
DescriptionCMP User performed logout.
Default SeverityInfo
InstanceN/A
HA ScoreNormal
Clearing ActionN/A
OIDCMPUserLogout
Policy Server Events (80000-89999)
4-214 Policy Management SNMP User's Guide
Recovery:
1. No action required. Recovery is immediate.
86200 - CMP User Promoted Server
Alarm TypePCRF
DescriptionCMP user promoted server. The current site becomes the Primary site.
Default SeverityInfo
InstanceN/A
HA ScoreNormal
Clearing ActionN/A
OIDCMPUserPromotedServer
Recovery:
1. No action required. Recovery is immediate.
86201 - CMP User Demoted Server
Alarm TypePCRF
DescriptionCMP user demoted server. The current site becomes the Secondary site.
Default SeverityInfo
InstanceN/A
HA ScoreNormal
Clearing ActionN/A
OIDCMPUserDemotedServer
Policy Server Events (80000-89999)
Support for Traps 4-215
Recovery:
1. No action required. Recovery is immediate.
86300 - Sh Enable Failed
Alarm TypePCRF
DescriptionEnable Sh Connection failed. The CMP server performed a global operation to enableSh on all MPE devices and it failed on the specified MPE.
Default SeverityMajor
InstanceN/A
HA ScoreNormal
Clearing ActionN/A
OIDCMPShConEnableFailed
Recovery:
1. The operation can be retried. If repeated attempts fail, there may be othermanagement issues with the associated MPE devices and connectivity to thosedevices should be verified.
86301 - Sh Disable Failed
Alarm TypePCRF
DescriptionDisable Sh Connection failed. The CMP performed a global operation to disable Sh onall MPE devices and it failed on the specified MPE.
Default SeverityMajor
InstanceN/A
HA ScoreNormal
Clearing ActionN/A
Policy Server Events (80000-89999)
4-216 Policy Management SNMP User's Guide
OIDCMPShConDisableFailed
Recovery:
1. The operation can be retried. If repeated attempts fail, there may be othermanagement issues with the associated MPE devices and connectivity to thosedevices should be verified.
86303 - NW-CMP Apply Failed
Alarm TypePCRF
DescriptionNW-CMP failed to apply settings to S-CMP.
Default SeverityMajor
InstanceN/A
HA ScoreNormal
Clearing ActionN/A
OIDNWCMPApplyFailed
Recovery:
1. The alarm on the NW-CMP will be cleared once the NW-CMP successfully appliesthe configuration to the S-CMP.
86304 - S-CMP Unreachable
Alarm TypePCRF
DescriptionThe S-CMP is offline or unreachable by the NW-CMP. This alarm will be raised on theNW-CMP.
Default SeverityMajor
InstanceN/A
HA ScoreNormal
Policy Server Events (80000-89999)
Support for Traps 4-217
Clearing ActionN/A
OIDSCMPUNREACHABLE
Recovery:
1. This alarm will be cleared once the S-CMP is reachable.
86305 - S-CMP Split Brain
Alarm TypePCRF
DescriptionWhen a geo-redundant S-CMP is in split brain (that is, both sites are reporting asPrimary), an alarm is raised on NW-CMP.
Default SeverityMajor
InstanceN/A
HA ScoreNormal
Clearing ActionN/A
OIDSCMPSplitBrain
Recovery:
1. This alarm will be cleared automatically when the split brain on the S-CMP is gone.
86306 - CMP Apply Failed
Alarm TypePCRF
DescriptionWhen a CMP system failed to apply settings to any MRA or MPE device, this alarm israised on this S-CMP.
Default SeverityMajor
InstanceN/A
HA ScoreNormal
Policy Server Events (80000-89999)
4-218 Policy Management SNMP User's Guide
Clearing ActionN/A
OIDCMPApplyFailed
Recovery:
1. This alarm will be cleared automatically when the next applying to that MRA orMPE device is successful.
86307 - S-CMP Sync Fails
Alarm TypePCRF
DescriptionIf the connection between the NW-CMP and the S-CMP is broken and thesynchronization fails, an alarm will be raise in S-CMP.
Default SeverityMajor
InstanceN/A
HA ScoreNormal
Clearing ActionN/A
OIDSCMPSYNCFAILS
Recovery:
1. The alarm will be cleared once the synchronization is successful in the next cycle.
86308 - NCMP Ref Obj Miss
Alarm TypePCRF
DescriptionThe top level object is missing in NW-CMP but is referred by S-CMP server. Thisalarm will be raised in the NW-CMP server.
Default SeverityMajor
InstanceN/A
Policy Server Events (80000-89999)
Support for Traps 4-219
HA ScoreNormal
Clearing ActionN/A
OIDNCMPReferdObjMiss
Recovery:
1. This alarm will be cleared once there is no referred but missing top level object.
Policy Server Events (80000-89999)
4-220 Policy Management SNMP User's Guide
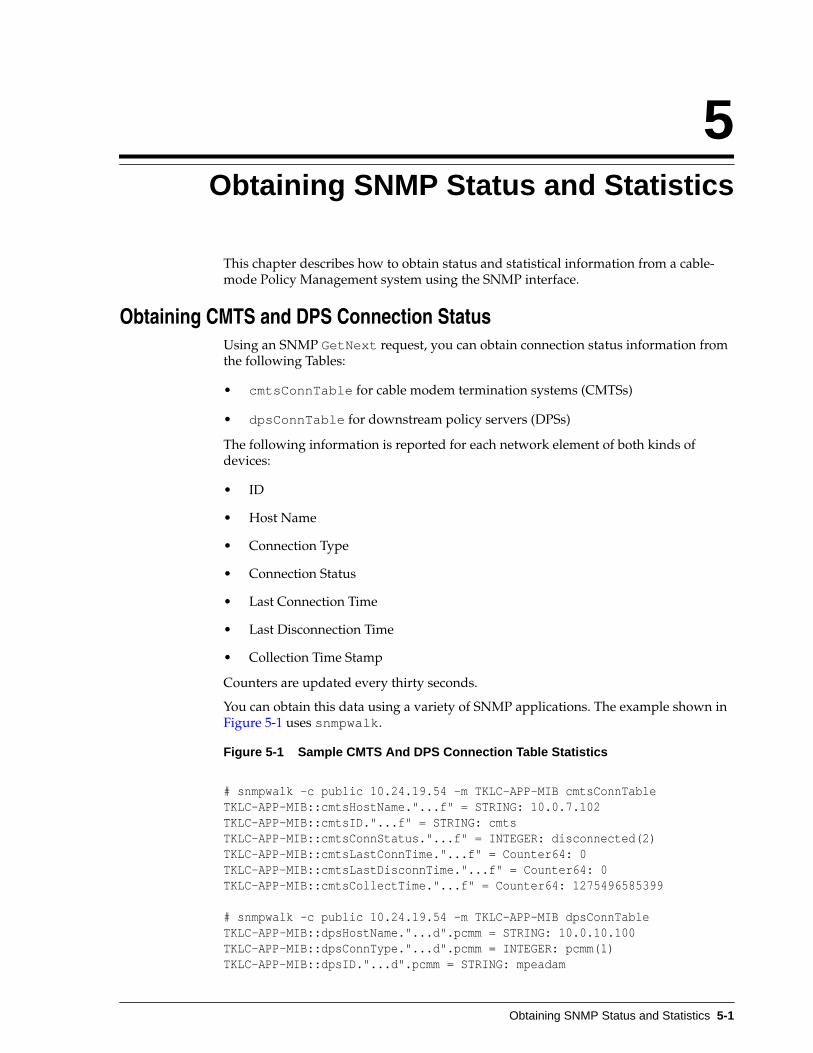
5Obtaining SNMP Status and Statistics
This chapter describes how to obtain status and statistical information from a cable-mode Policy Management system using the SNMP interface.
Obtaining CMTS and DPS Connection StatusUsing an SNMP GetNext request, you can obtain connection status information fromthe following Tables:
• cmtsConnTable for cable modem termination systems (CMTSs)
• dpsConnTable for downstream policy servers (DPSs)
The following information is reported for each network element of both kinds ofdevices:
• ID
• Host Name
• Connection Type
• Connection Status
• Last Connection Time
• Last Disconnection Time
• Collection Time Stamp
Counters are updated every thirty seconds.
You can obtain this data using a variety of SNMP applications. The example shown in Figure 5-1 uses snmpwalk.
Figure 5-1 Sample CMTS And DPS Connection Table Statistics
# snmpwalk -c public 10.24.19.54 -m TKLC-APP-MIB cmtsConnTableTKLC-APP-MIB::cmtsHostName."...f" = STRING: 10.0.7.102TKLC-APP-MIB::cmtsID."...f" = STRING: cmtsTKLC-APP-MIB::cmtsConnStatus."...f" = INTEGER: disconnected(2)TKLC-APP-MIB::cmtsLastConnTime."...f" = Counter64: 0TKLC-APP-MIB::cmtsLastDisconnTime."...f" = Counter64: 0TKLC-APP-MIB::cmtsCollectTime."...f" = Counter64: 1275496585399
# snmpwalk -c public 10.24.19.54 -m TKLC-APP-MIB dpsConnTableTKLC-APP-MIB::dpsHostName."...d".pcmm = STRING: 10.0.10.100TKLC-APP-MIB::dpsConnType."...d".pcmm = INTEGER: pcmm(1)TKLC-APP-MIB::dpsID."...d".pcmm = STRING: mpeadam
Obtaining SNMP Status and Statistics 5-1
TKLC-APP-MIB::dpsConnStatus."...d".pcmm = INTEGER: connected(1)TKLC-APP-MIB::dpsLastConnTime."...d".pcmm = Counter64: 1275417944367TKLC-APP-MIB::dpsLastDisconnTime."...d".pcmm = Counter64: 1275417899375TKLC-APP-MIB::dpsCollectTime."...d".pcmm = Counter64: 1275496622064#
Obtaining Rx and Diameter AF Operation Measurement StatisticsUsing an SNMP GetNext request, you can obtain operation measurement (OM)statistics from diameterOMStats for the Rx and Diameter protocols. The following OMcounters are reported:
• AAR Initial messages received
• AAR Initial messages sent
• AAR Modification messages received
• AAR Modification messages sent
• AAR Received messages
• AAR Received Success messages
• AAR Received Failure messages
• AAR Sent messages
• AAR Sent Success messages
• AAR Sent Failure messages
• STR Received messages
• STR Sent messages
• STA Received Success messages
• STA Received Failure messages
• STA Sent Success messages
• STA Sent Failure messages
• ASR Received messages
• ASR Sent messages
• ASA Received Success messages
• ASA Received Failure messages
• ASA Sent Success messages
• ASA Sent Failure messages
• RAR Received messages
• RAR Sent messages
• RAA Received Success messages
Obtaining Rx and Diameter AF Operation Measurement Statistics
5-2 Policy Management SNMP User's Guide
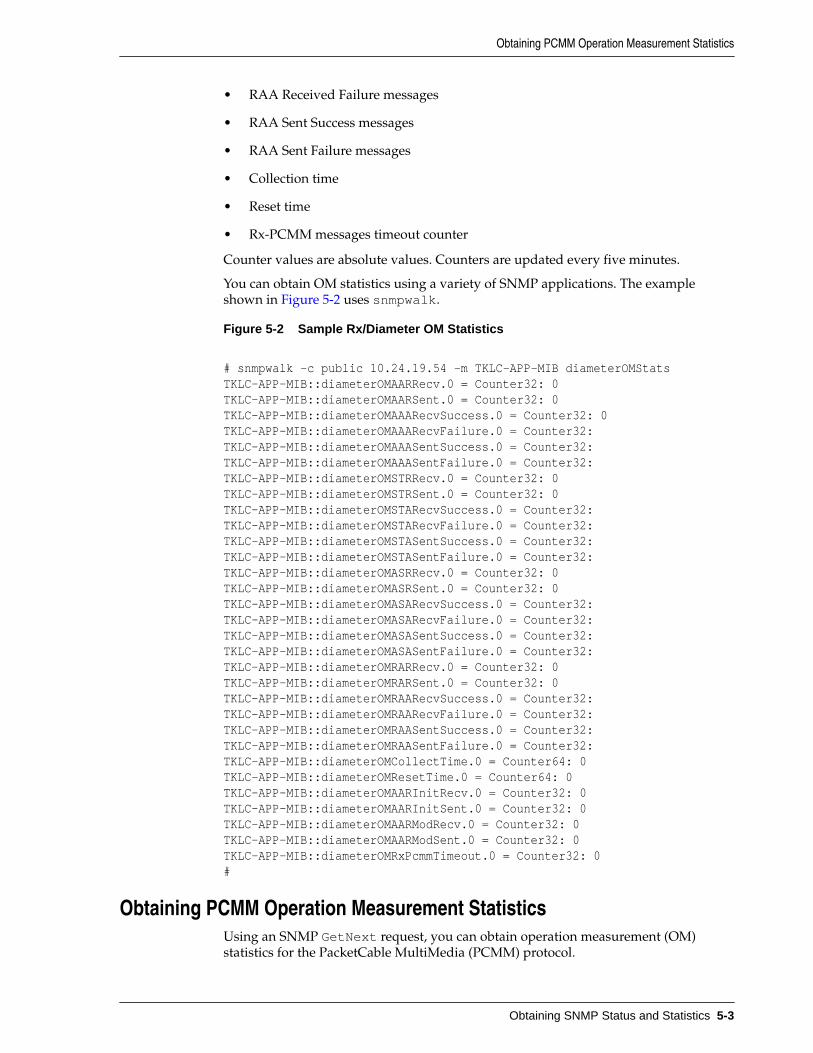
• RAA Received Failure messages
• RAA Sent Success messages
• RAA Sent Failure messages
• Collection time
• Reset time
• Rx-PCMM messages timeout counter
Counter values are absolute values. Counters are updated every five minutes.
You can obtain OM statistics using a variety of SNMP applications. The exampleshown in Figure 5-2 uses snmpwalk.
Figure 5-2 Sample Rx/Diameter OM Statistics
# snmpwalk -c public 10.24.19.54 -m TKLC-APP-MIB diameterOMStatsTKLC-APP-MIB::diameterOMAARRecv.0 = Counter32: 0TKLC-APP-MIB::diameterOMAARSent.0 = Counter32: 0TKLC-APP-MIB::diameterOMAAARecvSuccess.0 = Counter32: 0TKLC-APP-MIB::diameterOMAAARecvFailure.0 = Counter32:TKLC-APP-MIB::diameterOMAAASentSuccess.0 = Counter32:TKLC-APP-MIB::diameterOMAAASentFailure.0 = Counter32:TKLC-APP-MIB::diameterOMSTRRecv.0 = Counter32: 0TKLC-APP-MIB::diameterOMSTRSent.0 = Counter32: 0TKLC-APP-MIB::diameterOMSTARecvSuccess.0 = Counter32:TKLC-APP-MIB::diameterOMSTARecvFailure.0 = Counter32:TKLC-APP-MIB::diameterOMSTASentSuccess.0 = Counter32:TKLC-APP-MIB::diameterOMSTASentFailure.0 = Counter32:TKLC-APP-MIB::diameterOMASRRecv.0 = Counter32: 0TKLC-APP-MIB::diameterOMASRSent.0 = Counter32: 0TKLC-APP-MIB::diameterOMASARecvSuccess.0 = Counter32:TKLC-APP-MIB::diameterOMASARecvFailure.0 = Counter32:TKLC-APP-MIB::diameterOMASASentSuccess.0 = Counter32:TKLC-APP-MIB::diameterOMASASentFailure.0 = Counter32:TKLC-APP-MIB::diameterOMRARRecv.0 = Counter32: 0TKLC-APP-MIB::diameterOMRARSent.0 = Counter32: 0TKLC-APP-MIB::diameterOMRAARecvSuccess.0 = Counter32:TKLC-APP-MIB::diameterOMRAARecvFailure.0 = Counter32:TKLC-APP-MIB::diameterOMRAASentSuccess.0 = Counter32:TKLC-APP-MIB::diameterOMRAASentFailure.0 = Counter32:TKLC-APP-MIB::diameterOMCollectTime.0 = Counter64: 0TKLC-APP-MIB::diameterOMResetTime.0 = Counter64: 0TKLC-APP-MIB::diameterOMAARInitRecv.0 = Counter32: 0TKLC-APP-MIB::diameterOMAARInitSent.0 = Counter32: 0TKLC-APP-MIB::diameterOMAARModRecv.0 = Counter32: 0TKLC-APP-MIB::diameterOMAARModSent.0 = Counter32: 0TKLC-APP-MIB::diameterOMRxPcmmTimeout.0 = Counter32: 0#
Obtaining PCMM Operation Measurement StatisticsUsing an SNMP GetNext request, you can obtain operation measurement (OM)statistics for the PacketCable MultiMedia (PCMM) protocol.
Obtaining PCMM Operation Measurement Statistics
Obtaining SNMP Status and Statistics 5-3
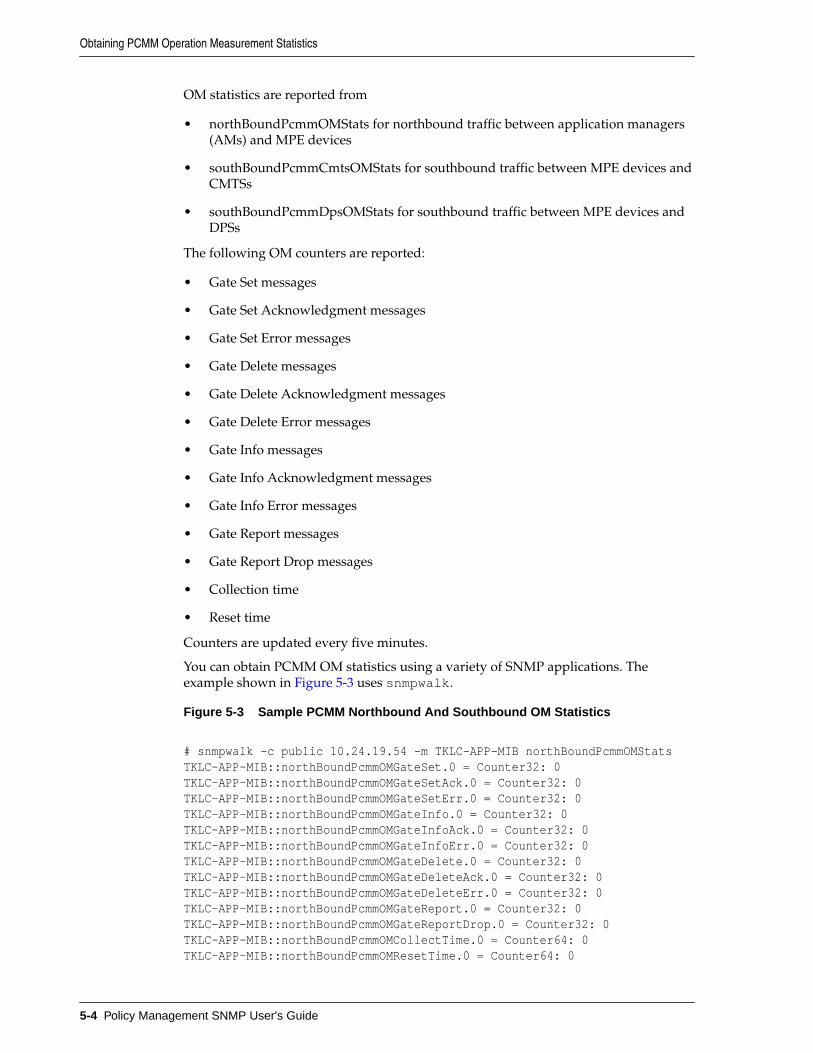
OM statistics are reported from
• northBoundPcmmOMStats for northbound traffic between application managers(AMs) and MPE devices
• southBoundPcmmCmtsOMStats for southbound traffic between MPE devices andCMTSs
• southBoundPcmmDpsOMStats for southbound traffic between MPE devices andDPSs
The following OM counters are reported:
• Gate Set messages
• Gate Set Acknowledgment messages
• Gate Set Error messages
• Gate Delete messages
• Gate Delete Acknowledgment messages
• Gate Delete Error messages
• Gate Info messages
• Gate Info Acknowledgment messages
• Gate Info Error messages
• Gate Report messages
• Gate Report Drop messages
• Collection time
• Reset time
Counters are updated every five minutes.
You can obtain PCMM OM statistics using a variety of SNMP applications. Theexample shown in Figure 5-3 uses snmpwalk.
Figure 5-3 Sample PCMM Northbound And Southbound OM Statistics
# snmpwalk -c public 10.24.19.54 -m TKLC-APP-MIB northBoundPcmmOMStatsTKLC-APP-MIB::northBoundPcmmOMGateSet.0 = Counter32: 0TKLC-APP-MIB::northBoundPcmmOMGateSetAck.0 = Counter32: 0TKLC-APP-MIB::northBoundPcmmOMGateSetErr.0 = Counter32: 0TKLC-APP-MIB::northBoundPcmmOMGateInfo.0 = Counter32: 0TKLC-APP-MIB::northBoundPcmmOMGateInfoAck.0 = Counter32: 0TKLC-APP-MIB::northBoundPcmmOMGateInfoErr.0 = Counter32: 0TKLC-APP-MIB::northBoundPcmmOMGateDelete.0 = Counter32: 0TKLC-APP-MIB::northBoundPcmmOMGateDeleteAck.0 = Counter32: 0TKLC-APP-MIB::northBoundPcmmOMGateDeleteErr.0 = Counter32: 0TKLC-APP-MIB::northBoundPcmmOMGateReport.0 = Counter32: 0TKLC-APP-MIB::northBoundPcmmOMGateReportDrop.0 = Counter32: 0TKLC-APP-MIB::northBoundPcmmOMCollectTime.0 = Counter64: 0TKLC-APP-MIB::northBoundPcmmOMResetTime.0 = Counter64: 0
Obtaining PCMM Operation Measurement Statistics
5-4 Policy Management SNMP User's Guide
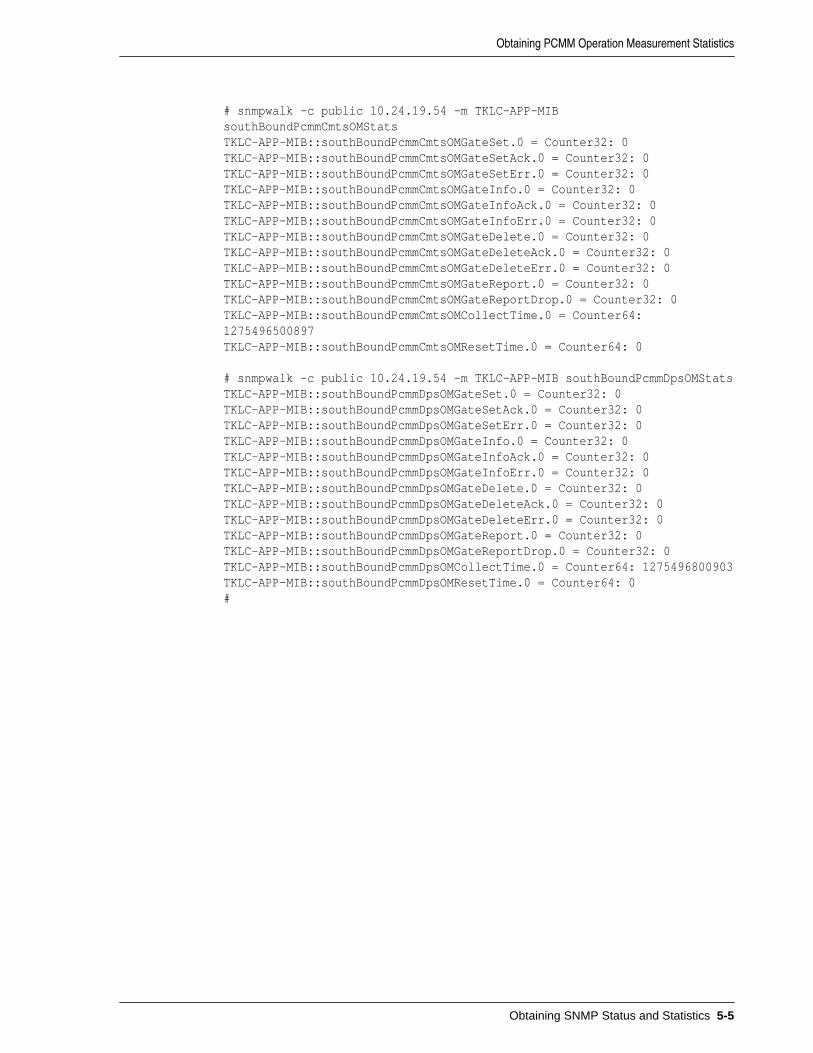
# snmpwalk -c public 10.24.19.54 -m TKLC-APP-MIB southBoundPcmmCmtsOMStatsTKLC-APP-MIB::southBoundPcmmCmtsOMGateSet.0 = Counter32: 0TKLC-APP-MIB::southBoundPcmmCmtsOMGateSetAck.0 = Counter32: 0TKLC-APP-MIB::southBoundPcmmCmtsOMGateSetErr.0 = Counter32: 0TKLC-APP-MIB::southBoundPcmmCmtsOMGateInfo.0 = Counter32: 0TKLC-APP-MIB::southBoundPcmmCmtsOMGateInfoAck.0 = Counter32: 0TKLC-APP-MIB::southBoundPcmmCmtsOMGateInfoErr.0 = Counter32: 0TKLC-APP-MIB::southBoundPcmmCmtsOMGateDelete.0 = Counter32: 0TKLC-APP-MIB::southBoundPcmmCmtsOMGateDeleteAck.0 = Counter32: 0TKLC-APP-MIB::southBoundPcmmCmtsOMGateDeleteErr.0 = Counter32: 0TKLC-APP-MIB::southBoundPcmmCmtsOMGateReport.0 = Counter32: 0TKLC-APP-MIB::southBoundPcmmCmtsOMGateReportDrop.0 = Counter32: 0TKLC-APP-MIB::southBoundPcmmCmtsOMCollectTime.0 = Counter64: 1275496500897TKLC-APP-MIB::southBoundPcmmCmtsOMResetTime.0 = Counter64: 0
# snmpwalk -c public 10.24.19.54 -m TKLC-APP-MIB southBoundPcmmDpsOMStatsTKLC-APP-MIB::southBoundPcmmDpsOMGateSet.0 = Counter32: 0TKLC-APP-MIB::southBoundPcmmDpsOMGateSetAck.0 = Counter32: 0TKLC-APP-MIB::southBoundPcmmDpsOMGateSetErr.0 = Counter32: 0TKLC-APP-MIB::southBoundPcmmDpsOMGateInfo.0 = Counter32: 0TKLC-APP-MIB::southBoundPcmmDpsOMGateInfoAck.0 = Counter32: 0TKLC-APP-MIB::southBoundPcmmDpsOMGateInfoErr.0 = Counter32: 0TKLC-APP-MIB::southBoundPcmmDpsOMGateDelete.0 = Counter32: 0TKLC-APP-MIB::southBoundPcmmDpsOMGateDeleteAck.0 = Counter32: 0TKLC-APP-MIB::southBoundPcmmDpsOMGateDeleteErr.0 = Counter32: 0TKLC-APP-MIB::southBoundPcmmDpsOMGateReport.0 = Counter32: 0TKLC-APP-MIB::southBoundPcmmDpsOMGateReportDrop.0 = Counter32: 0TKLC-APP-MIB::southBoundPcmmDpsOMCollectTime.0 = Counter64: 1275496800903TKLC-APP-MIB::southBoundPcmmDpsOMResetTime.0 = Counter64: 0#
Obtaining PCMM Operation Measurement Statistics
Obtaining SNMP Status and Statistics 5-5

Obtaining PCMM Operation Measurement Statistics
5-6 SNMP User's Guide