Embed Size (px)
Citation preview

Policies, incentives, and measurement protocols for food waste reporting by businesses Prepared by: Juan Diego Martinez, UBC Greenest City Scholar 2021 Prepared for: Erin Nichols, Senior Project Manager – Zero Waste Engineering Services Division Dept., City of Vancouver
August 2021

Acknowledgements
The author would like to thank the following individuals for their contribution, feedback, and support throughout this project.
Erin Nichols, Senior Project Manager – Zero Waste Engineering Services Division Dept., City of
Vancouver
Andrea McKenzie, Zero Waste Project Engineer - Engineering Services, City of Vancouver
Karen Taylor, Manager – Sustainability Scholars Program, UBC Sustainability Initiative
Sarah Labahn, Planning Analyst – Sustainability Group | Planning, Urban Design & Sustainability,
City of Vancouver
Interviewed experts (kept anonymous for confidentiality purposes) who greatly enhanced the
depth of publicly available literature and helped navigate an exciting and nascent food policy
field.
Suggested citation: Martinez, J.D. (2021) Policies, incentives, and measurement protocols for food
waste reporting by businesses. Vancouver, BC
Cover photo by FOODISM360 on Unsplash

Contents
1 Executive Summary 22 Introduction 63 Context - What has been done locally thus far to address the problem: 10
3.1 Vancouver’s Zero Waste 2040 Strategic Plan 103.2 Disposal Ban 123.3 Metro Vancouver Food Recovery Network 143.4 Initiatives to reduce FLW in Canada 153.5 Objectives 16
4 Policy and Incentives 164.1 Where does waste reporting innovation happen? 174.2 Voluntary agreements 184.3 Policies that indirectly improve measurement. 224.4 Regulation 24
5 Case studies 265.1 Europe 275.2 United Kingdom 30
6 Food Waste Measurement 326.1 Direct Measurement 336.2 Waste composition studies 376.3 Measuring through waste hauling services 386.4 Food recovery networks 39
7 Waste reporting 417.1 Reporting Protocols 417.2 Comparison of data management on-site vs. off-site 44
8 Discussion 478.1 Decision Matrix 478.2 Future directions 53
9 Options for the future 5510 Conclusion 57

11 References 5812 Appendices 63
12.1 Appendix 1 – Legislation 6312.2 Appendix 2 – Environmental reasons to reduce waste 6712.3 Appendix 3 – Potential timeline for a Voluntary Agreement 6912.4 Appendix 4 – TABLE critique of VAs in UK 69
List of Figures
Figure 1: Food waste in Canada – In Millions of tonnes 7Figure 2: Avoidable food waste in Canada – in Millions of tonnes 7Figure 3: The business case for reducing food waste 9Figure 4: Vancouver Total Food Disposal 2019 12Figure 5: Food waste share by sector in 2019 13Figure 6: US-EPA Food Recovery Hierarchy 14Figure 7: Policy types and examples 16Figure 8: Voluntary Agreements, Contributing Factors 21Figure 9: FLWS Scope diagram template tool 41Figure 10: SDG 12.3 FLWS Scope diagram 42Figure 11: Comparison of Champions 12.3 and Pacific Coast Collaborative food waste hierarchies 43Figure 12: FLWS Scope diagram for IKEA's waste reduction case study 44Figure 13: Data quality attributes diagram 49Figure 14: Decision Matrix combining policies and measurement method 52
List of Tables
Table 1: Voluntary Agreement Coverage in Nordic Countries 29Table 2: Accepted Measurement methods by supply chain stage in the EU 32Table 3: Strengths and limitations of direct measurement of FLW in Processing and Manufacturing 33Table 4: Summary of methods used to measure FLW in Processing and Manufacturing Sector 34Table 5: Strengths and limitations of scanning of FLW in Retail 35Table 6: Summary of methods used to measure FLW in Retail 35Table 7: Strengths and limitations: Smart Bins to measure FLW in Food Service and Hospitality 36Table 8: Strengths and limitations: Plate Waste to measure FLW in Food Service and Hospitality 36Table 9: Summary of methods used to measure FLW in the Food Service and Hospitality Sector 37Table 10: Strengths and weaknesses: Food-Focused Waste Composition Analysis to quantify FLW 38Table 11: Possibilities for decision matrix criteria 51

2
1 Executive Summary
It is estimated that in Canada 58% of the food that is intended for human consumption is lost or wasted along the supply chain. Of Canada’s total food waste, 32% can be avoided. The food lost and wasted throughout the entire food supply chain is associated with unnecessary greenhouse gas (GHG) emissions, use of energy and water, as well as unrealized potential to alleviate hunger. The City of Vancouver has long recognized and prioritized food waste reduction as part of its vision of a sustainable city, first with the Greenest City Action Plan (GCAP) goal of reducing food waste by 50% by 2020 with a 2008 baseline, and more recently with the Vancouver Zero Waste 2040 Strategic Plan (ZW2040). Moving ahead with other food waste reduction actions without strengthening progress tracking capabilities will yield uncertain results in terms of effectiveness of the actions aimed at avoiding and reusing material “waste” streams.
Industrial, commercial and institutional (ICI) sectors generate the largest share of food waste in the city. Currently, the City’s sole data source to assess and estimate changes in Vancouver’s ICI organic waste streams is aggregated regional data (Metro Vancouver) which lacks specificity on the types of foods being wasted and the food business sectors that are producing it.
This work conducted a literature review and expert interviews to research (food) waste measurement in businesses, reporting protocols, and anonymized progress reporting and regional, national and international government policies and industry incentives that promote them. Direct measurement – which differs in application at each supply chain stage with their corresponding strengths and weaknesses– is the best practice for measurement. Another key finding was that the gold standard waste reporting protocol – the Food Loss and Waste Standard (FLWS) – is comprehensive, adaptable but requires expert knowledge to be used. Multiple third parties in the city and metro region are capable of conducting the measurement as well as the reporting process. It was also found that the differences in operations, level of consolidation, and average business size, might warrant differentiated policies for each stage of the food supply chain.
The range in governmental policy tools to influence and realize food waste reduction, measurement and reporting have varying degrees of effectiveness, usually correlated with the degree of intervention or restriction in decision making. Voluntary agreements (VAs), are schemes in which public and private sector organizations make commitments to improve –in this case– their environmental performance, without the need for legislation or sanctions. In compliance with EU regulation, multiple Member States have opted for VAs as the policy choice to encourage businesses to commit to measurement, reporting and reduction of waste food. Evidence was also found for jurisdictions in East Asia, where submission to the environmental

3
authority regarding industrial waste management plans, reduction strategies, and waste measurement and reporting are mandatory. The Singapore National Environment Agency can require the mandatory reporting of waste data and submission of waste reduction plans by any owner, occupier or lessee of a work place. The reporting template actually includes food recycled by weight as a value to be reported on a monthly basis. Another relevant finding was from New York City where annual food waste prevention strategies need to be reported for every city-operated agency. Finally, there is also the precedent of different jurisdictions requiring private waste management companies and haulers to report pick-up location, total volumes and/or weights, and final disposal sites with the aid of technological solutions such as trucks equipped with GPS tracking and on-board weighing scales.
This work concluded that in order to address the City’s objective to improve standardized waste measurement and reporting by the Vancouver ICI sector, the City needs to –with the ZW2040 goals in mind, the fast approaching end life of the Vancouver Landfill, and the overall spatial constraints of the Metro Vancouver geography for future waste disposal – engage with the ICI sector and haulers to co-develop one of two options:
a) A VA with the ICI sector to improve the capacity to measure and report food waste with the risk of defaulting to option (b) in case of VA failure. This engagement should aim to co-design a VA to start measuring and reporting under an ambitious standard that equals or exceeds current international best practices, or
b) Conducting a consultation process with the intent of establishing a food waste measurement and reporting bylaw, a course of action that is informed by the pending deadlines of SDG 12.3 and ZW2040 and an urgency to meet them.
If voluntary agreements are chosen as the best option for the City’s interests in food waste measurement by the ICI sector, then following these actions are likely to improve their effectiveness:
• Require robust and transparent reporting requirements (e.g. to prevent selective disclosure and improve accountability).
• Require regular and credible independent (e.g. third-party) monitoring and evaluation systems, with sector average data made publically available or data on business reporting compliance made publically available.
• Apply sanctions for non-compliance with clear verification mechanism (e.g. revocation of any benefits associated with scheme participation).
If the voluntary agreement has a larger goal of waste reduction and is not exclusive to measurement and reporting, then establishing clearly defined and measurable targets (e.g.

4
quantitative and time limited) set against a clear and credible baseline assessment will likely improve the success of the VA.
Establishing the best possible VA is crucial to leverage the time and resources invested to commit, measure and act. If the policy fails to deliver the desired results, business confidence may falter, the food waste problem may worsen and yearly progress will need to increase in order to comply within a shortened timeline.
If regulation is chosen as the best option for the City’s interests in food waste measurement by the ICI sector, or VAs are not sufficiently effective to achieve the ZW2040 goals due to insufficient participation from industry, low compliance with agreements or other factors, the following considerations in the by-law design are likely to improve their effectiveness:
• Clearly define the target group with parameters differentiated by food subsector (e.g. based on revenue, number of employees, or surface area)
• Require robust and transparent measurement and reporting requirements (e.g. to prevent selective disclosure and improve accountability).
• Require regular and credible monitoring and evaluation systems, with anonymized food sub-sector data made publically available, potentially through independent (e.g. third-party) verification.
• Apply sanctions for non-compliance with clear verification mechanism (e.g. fiscal disincentives such as fines, revocation of business license).
• Provide or promote technological and operational support for initial entry in advance of the by-law coming into effect (e.g. similar to the grace period of 6 months in the organics disposal ban).
• Plan and allow for the regulation to be flexible with regards to new technologies and standards on waste measurement and reporting.
In conjunction with the aforementioned recommendations for VAs and regulation, the City can lead by example by implementing ambitious but realistic FLW prevention and diversion measurement, reporting programs and strategies in all City facilities and advocate for such programs to be implemented by other Cities and by other levels of government. Furthermore, the City could advocate for the implementation of voluntary agreements or regulation requirements for businesses by other cities and levels of government in order to meet Federal and international commitments and ultimately to demonstrate best practices in establishing a common ground for food measurement and reporting for all of the food business sector across Canada.

5
Data hosting: The City as an enduring and stable institution with experience hosting sensitive information from businesses is a reliable choice with regards to hosting data. However, if the government not only hosts the data but is also a regulator that can issue fines based on the data collected, businesses will likely be hesitant to report. The option of a third party issuing anonymized reports from businesses to cities or other government bodies can help avoid concerns that submitting data could directly lead to being fined. It is key for the City to gain a better understanding of current ICI perceptions of data sharing with government institutions and whether local food ICI sector is already engaged in other VAs where data is collected and shared.
The report informs how the City could proceed to measure progress towards ZW2040, advance the need for operational change within businesses, and inform adjustments in zero waste initiatives. Grocery retailers, manufacturers and distributors, hotels, restaurants and institutions operating in the City and beyond will stand to benefit from engaging as soon as possible in designing the path towards zero waste while improving their triple bottom line. Realizing circular economy and zero waste goals will contribute to a healthier more resilient future for the people of Vancouver and the planet as a whole.

6
2 Introduction
Food loss and waste (FLW) is a global phenomenon with negative environmental, economic, social and nutritional impacts. Global estimates suggest that one third of the food produced is wasted or lost on the path from farm to fork (FAO, 2011). More recent global estimates suggest that 17% of all food available at the consumption stage of the supply chain is wasted (UNEP, 2021). The food lost and wasted through the entire food supply chain is associated with greenhouse gas (GHG) emissions, unnecessary use of energy and water as well as unrealized potential to alleviate hunger (Papargyropoulou, Lozano, K. Steinberger, Wright, & Ujang, 2014; Raak, Symmank, Zahn, Aschemann-Witzel, & Rohm, 2017). In recognition of this inefficiency, in 2015 the United Nations (UN) included Target 12.3 as part of the Sustainable Development Goals (SDGs). The SDGs set a roadmap to address key global challenges in order to ensure a better and more sustainable future for all. Target 12.3 specifically aims to “halve per capita global food
waste at the retail and consumer levels and reduce food losses along production and supply
chains, including post-harvest losses [by 2030]”.
The UN SDG Indicators to measure progress towards targets fall under three tier classifications. The scarcity of data regarding (FLW) places Indicator 12.3 under Tier II where the indicator is
conceptually clear, has an internationally established methodology and standards are available,
but data are not regularly produced by countries (Stats UN, 2019). Reducing and tracking wasted food is therefore on the agenda for governments worldwide, including Canada.
In Canada, it is estimated that 58% of the food that is intended for human consumption is lost or wasted along the supply chain, the majority in the production and processing stages (Figure 1). Of the total food waste, 32% can be avoided and the biggest share in avoidable food waste happens in the manufacturing, households, and then processing stages (Figure 2) (Gooch et al., 2019).

7
Figure 1: Food waste in Canada – In Millions of tonnes *Source: (Gooch et al. 2019)
Figure 2: Avoidable food waste in Canada – in Millions of tonnes *Source: (Gooch et al. 2019)
The City of Vancouver (hereafter referred to as the City1) has long recognized and prioritized food waste reduction as part of its vision of a sustainable city, first with the Greenest City Action Plan (GCAP) goal of reducing food waste by 50% by 2020 with a 2008 baseline2, and currently with the Vancouver Zero Waste 2040 Strategic Plan (ZW2040). Industrial, commercial and institutional
1 A capitalized “c” in City refers to the institution, a lower-case “c” in city refers to the territory and its people 2 As of 2019 the reduction in total waste has been 30% since 2008, and the reduction in food waste from 2016 to 2019 is estimated at 26%. The estimates for food waste with a 2008 baseline have not been calculated as of the publishing of this report.

8
(ICI) sectors generate the largest share of food waste in the city (Figure 5). Food waste measurement and reporting have been recognized internationally as key actions towards successfully managing surplus food and ultimately reducing food waste in these sectors as measurement assists entities in understanding their current state, prioritizing areas of action, setting targets, monitoring progress towards said targets and helping to evaluate the effectiveness of different interventions to ensure the right approaches are taken to deliver change (WWF-WRAP, 2020).
Reasons to reduce FLW: Figure 3 below summarises the multifaceted business case for FLW reduction, highlighting a global average 14:1 return on investment for FLW reduction initiatives across a range of different sub-sectors of the food industry (Champions 12.3, 2019; Hanson, C., & Mitchell, 2017). In summary, Figure 3 outlines the following reasons for businesses to reduce wasted food,
1. Save Money 2. Fight hunger 3. Conserve resources 4. Comply with laws
5. Curb climate change 6. Improve reputation 7. Uphold ethics
This paper is concerned with number 4, Comply with laws and the use of policy and incentives to advance food waste measurement and reporting.
As previously mentioned, the current food system is signaling inefficient use of resources that negatively impacts potential financial savings and environmental impacts. Appendix 2 explores some of the environmental impacts in further detail.

9
Figure 3: The business case for reducing food waste *Source: (Champions 12.3, 2019)
Methodology: This report begins with a detailed contextual overview of the City: the current policies in place to reduce food waste and current waste measurement capability. It then proceeds with a literature review on regional, national and international government policies and industry incentives that encourage (food) waste measurement in businesses; reporting protocols and anonymized progress reporting. The primary research results from semi-structured interviews with City staff, waste management experts and food waste management and business engagement experts, are presented throughout the document to complement secondary research findings. The discussion section highlights findings from the literature review and interviews, analysed through the lens of the City’s context to present recommendations and future avenues of research for the City. Finally, the report concludes with summarized recommendations to address the City’s objective to improve standardized waste measurement and reporting by the ICI sector.

10
3 Context - What has been done locally thus far to address the problem:
The objective of this section is to set the context of food waste management and measurement in the City of Vancouver and Metro Vancouver.
3.1 Vancouver’s Zero Waste 2040 Strategic Plan
The ZW2040 consultation process summarized the following recommendations (City of Vancouver, 2017):
• 1.2: Support industry education strategies that increase waste diversion and circular
practices, such as workshops, incentives, waste audits, tracking systems to monitor and
evaluate industry progress.
• 5.7: Establish clear measurement tools to audit and track waste reduction at city, business
and resident level and enforce violations.
• 5.8: Review and update policies on zero waste infrastructure, facilities, technology and
transportation systems, as well as measurement, tracking and benchmarking tools.
Given Vancouver’s ZW2040 special focus on waste reduction progress tracking, one of, if not the principal priority action for the City should be to improve its capability to measure wasted food with the level of detail the plan proposes and obtain reporting from the relevant stakeholders. Moving ahead with other food waste reduction actions without strengthening progress tracking capabilities will yield uncertain results in terms of effectiveness of the actions aimed at avoiding and reusing material “waste” streams. With the objective to become a leading city in food waste prevention and to serve as an example for other jurisdictions, better tracking is imperative as the City of Vancouver currently lags behind what other cities are capable of measuring. For example, the City of Calgary, has access to data for residential –both single and multi-family housing– by three different waste streams (garbage, recycling and organics) because their city’s waste hauling operation serves a share of both of these sectors while City of Vancouver only serves single family housing3.
In response to the recommendations of the ZW2040 consultation process the objectives of this research project are:
3 The City also serves a negligible number of Multi-Family housing units, which are not representative of their total

11
• To review, document and compare regional, national and international government policies and industry incentives that encourage change and the use of measurement protocols and anonymized progress reporting, to report on the change.
• To review, document and compare measurement protocols that encourage the collection and submission of anonymized waste or material data from businesses.
Currently, the City’s sole data source to assess and estimate changes in Vancouver’s ICI and multi-family organic waste streams is aggregated regional data (Metro Vancouver), which is unable to identify the types of foods being wasted or the specific food business sectors that are producing it. Furthermore, as the City does not collect any ICI or multi-family waste through its own operation; this limits access to Vancouver specific diversion rate estimates.
The measurement of wasted food from ICI sectors is directly related to the realization of ZW2040 to become a leading city in food waste prevention, and in particular to identify and pursue options to improve food rescue and redistribution systems.
The ZW2040 strategic plan recognizes that data about zero waste activities and progress through initiatives administered by businesses, educational institutions and others in the community will require the development of new tracking tools, and programs. Furthermore, the Plan notes that data may only be available through voluntary reporting, a potential limitation when aspiring to improve the overall data quality (City of Vancouver, 2018).
A common saying in business is, you can’t manage what you can’t measure. Food waste measurement by businesses is claimed to reduce the incidence of wasted food. Businesses that (1) measure the amount and type of foods being wasted, (2) establish a wasted food baseline and (3) commit to a reduction goal are more likely to make operational changes. Sector averages from aggregated anonymized business data, allows individual businesses to benchmark their progress towards zero waste. Published sector averages and commitments made by food businesses also demonstrate a new normal that reinforces operational change (Commission for Environmental Cooperation, n.d.; WRAP, 2020a, 2020b).
“For example, there is plenty of healthy competition for brewers to have the highest yield.
Once an industry benchmark becomes standard and widely shared, it will drive action.”
Enviro-Stewards, Food Waste Consultant

12
3.2 Disposal Ban
In 2015 the Metro Vancouver Region (hereafter referred to as the Region) introduced an organics disposal ban for all sectors which included food scraps, meaning that no food scraps could be discarded in the garbage but rather they had to be diverted. Despite initial resistance by the ICI and the multi-family housing sectors in particular, the ban came into effect. Hauling services tipping garbage at the disposal sites in the region that show more that 25% organic material are fined according to the by-law4 (City of Vancouver Solid Waste By-Law No. 8417). Food waste was the reason of surcharge in only 3%, 2% and 4% of surcharged loads in 2017, 2018 and 2019 respectively (Metro Vancouver, 2020).
Figure 4: Vancouver Total Food Disposal 2019
Source: (City of Vancouver SWSS, 2021)
The City has made great progress in the last 3 years with a reduction of 28 thousand tonnes of total food waste equivalent to a 26% reduction (See Figure 4). The diversion rate also improved, increasing from 46% in 2016 to 53% in 2019. Despite the progress, food waste reduction continues to be key to the overall zero waste target because in 2019 it still represented 11% of what was showing up in all garbage. Almost 6 years after the introduction of the organics ban it is evident that food waste is still making its way to landfill and incineration in the Region and 46% of the City’s food waste not being properly sorted and diverted means the disposal ban still is far from meeting the aspirational goal of zero waste sent to landfill5. In Figure 5, we can see that the
4 The 25% threshold is the least stringent of all banned material. An opportunity if the City wants to prioritize food waste reduction could be to lower that threshold, further supporting the effectiveness of the organics disposal ban. 5 Challenges in the local availability of processing capacity and markets for organics and clean wood have required occasional temporary relaxation of disposal ban surcharges (Metro Vancouver, 2020)
- 10 20 30 40 50 60 70
2016 … 2019
Thou
sand
Tonn
es
Total Food Disposal by StreamGarbage Green Bin
Total Food Waste108,475 tonnes
Total Food Waste80,077 tonnes

13
latest available estimates for the City show that the majority of the food waste is generated by the ICI sector (58%), and half of the total food waste that ends up in landfill or incineration (garbage disposal) was generated by the ICI sector. However, the food diversion rate6 in the City’s ICI sector is higher, 59%, compared to 50% and 43% in single-family housing and multi-family housing respectively (All values for 2016 and 2019 are calculations based on estimates by the City of Vancouver Solid Waste Strategic Services team, 2021).
Figure 5: Food waste share by sector in 2019 ICI: Industrial, Commercial, Institutional. MF: Multi-Family Housing. SF: Single-Family Housing
Source: (City of Vancouver SWSS, 2021)
Prioritizing food waste measurement and reduction in Vancouver’s ICI makes strategic sense. First, because it encompasses a smaller number of actors7 with higher waste generation per actor in comparison to the residential sector. Second, while data quality for single family housing can be improved through City waste management operations, ICI generates a larger share of total food waste and there is no consistent City level data that provides insights into waste by sector or waste by food type. However, marginal improvements in food waste diversion rate within the ICI could prove to be challenging because the diversion rate is already higher than in the residential sector8.
6 In this case diversion rate is calculates as: green bin/(green bin + garbage) 7 Actors in the residential sector refers to households or multi-family units, and businesses or institutions in the ICI sector 8 Likely a result of sensitivity to enforcement of bylaws and regulations, such as the disposal bans compared to the residential sector. Regardless, the drivers of waste and diversion differ in residential and ICI sector, which would require further research to asses which of the two sectors (if any difference exists) will prove harder to improve.

14
3.3 Metro Vancouver Food Recovery Network
To facilitate the reduction in wasted food from the ICI sector, the Region has secured a contract with a third party to develop a food recovery network (FRN) that aims to divert surplus food to the highest value end-use (See Figure 6 for a food waste recovery hierarchy), create secondary markets and reduce avoidable food waste through a customized online platform that connects a network of food sector businesses with end-users in order to rescue and redistribute edible nutritious food, facilitate food exchanges and donations, and track total tonnes of food and nutritious food recovery across the Metro Vancouver region. The service provider will recruit partners, promote the network, and provide training opportunities and technical support (Metro Vancouver, 2021).
This initiative by the Region is a key example in the evaluation of strategies that aim to improve waste data collection and availability. As progress is made, what is prioritized and explored further should aim to build on this commitment. The Region will likely be on-track to significantly improve the data quality on food waste if the adoption rate is increased to better reflect ICI surplus food generation and especially if stakeholders with large market share along the food supply chain (FSC) become participants. Furthermore, MV’s jurisdictional mandate to manage municipal solid waste MSW in the region suggests the need for a region-wide functioning FRN in the long term. This report will also explore which solutions are best suited to work effectively alongside the FRN and which are not.
Figure 6: US-EPA Food Recovery Hierarchy

15
There is precedent of FRNs in the Region. FoodMesh is a local for profit based in the region. FoodMesh entered the marketplace to provide a service that the food industry couldn’t effectively provide for itself. Beyond a simple service, FoodMesh recognizes their business model is also an educational and operational change opportunity for businesses and the fees paid to FoodMesh are often recovered or partially offset by the elimination of waste hauling services, revenue from secondary markets for unsold food, and better inventory management that reduces product costs. FoodMesh provides a tracking service of volumes resold and donated by department, what was or wasn’t fit for human consumption, as well as what was redirected to animal feed or to compost.
FoodMesh staff describe the service as two different business models: 1) Alternative waste hauler, where FoodMesh’s charity partners pick up 5 or 7 day a week. As part of this model FM collects, manages and reports on data from surplus food diversion activities. 2) Online market place, where FM receives a commission on resold food. For products that are hard to sell FoodMesh guarantees they will be moved out of the customers’ warehouse (donated or destined to compost facilities). For small volumes of surplus foods their donation services are free.
FoodMesh operates as a service provider for individual businesses, but they also have experience setting up FRN for jurisdictions. The first region to commit to building a food recovery network with FoodMesh was Fraser Valley Regional District (FVRD). It is an outcome-based contract, dependant on the recruitment of a minimal number of donors and charities as well as the number of meals provided. Additionally, there is a partnership with the city of Richmond. However, neither FVRD nor Richmond’s focus of interest is the department level food diversion data, but rather the number of meals, total tonnes of food diverted, and total number of businesses and charities involved in the network.
3.4 Initiatives to reduce FLW in Canada
Large businesses, especially in the retail and manufacturing sector have already started tracking progress and making reduction commitments (National Zero Wast Council & Provision Coalition, 2019). Compared to food sector small and medium sized enterprises (SME), large scale food businesses are more likely to see the economic benefits of operational changes early on. Engaging, educating, and supporting operational change in SMEs is considered a priority next step in the Government of Canada report, Taking stock: Reducing food loss and waste in Canada (Environment and Climate Change Canada, 2019)

16
3.5 Objectives
Given the existing and planned activities that make up the local context, Vancouver’s interest in collecting more detailed food waste data is well timed. This report’s assessment will help inform the possible development of the City’s own data reporting policies, incentives and protocols for Vancouver food businesses, the results of which will help the City to measure progress towards ZW2040, advance the need for operational change within businesses, and inform adjustments in zero waste initiatives. The food business audience for these tools of operational change includes grocery retailers; manufacturers and distributors; hotels, restaurants and institutions; and food producers and harvesters. Policies and incentives gleaned from multiple jurisdictions show a range of possible options that can be combined or adjusted for a Vancouver specific approach.
4 Policy and Incentives
The range in governmental policy tools to influence and realize desired goals and outcomes have varying degrees of effectiveness, usually correlated with the degree of intervention or restriction in decision making. Within the two large policy tools categories of advocacy and regulation, there is a wide range of possibilities through which to encourage waste measurement and reporting or ultimately mandate it. Figure 7 gives an overview of this range of possibilities.
Figure 7: Policy types and examples

17
This section explores a wide range of policy tools at different government levels that aim to increase waste data quality and reporting. The review is not exclusive to food waste, because food waste reporting is a nascent practice internationally and so key insights need to be drawn from other waste streams. Section 4 focuses primarily on voluntary agreements and regulation because information and education advocacy tools have already been implemented by the City are deemed less impactful on their own and should serve as complementary policies to voluntary agreements and regulation.
This section will first introduce context regarding where policies and innovation for waste reduction and waste reporting tend to happen. An introduction to advocacy tools with the advantages and disadvantages are then presented, followed by a parallel introduction to regulatory tools. Actual legislation text can be found in Appendix 1.
4.1 Where does waste reporting innovation happen?
All modern societies generate waste, however the amount generated per capita tends to be correlated with affluence. Rich economies in North America, Europe, and East Asia generate the most waste per capita with Canada and the US having the highest numbers (Kawai & Tasaki, 2016). Technology and manufacturing have usually fuelled the economic growth of these regions. The final component that sets up the conditions for waste management innovation is land scarcity. Territories with a high opportunity cost for land have had to minimize the amount of waste that goes to landfill, which has been –for a large part of waste management history– the default end-site for material products. In this regard Canada and the US, and most of their constituent territories (Provinces in Canada and States in the US), have mostly lagged behind Europe, and East Asia due to the vast amount of available land and relatively low population density compared with the other two regions9. Thus, high population density as well as high population numbers coupled with economies that have the technological tools and highly educated population capable of implementing innovative solutions have been at the vanguard of reducing waste and diverting from landfill, because of the high opportunity cost of land. Maybe the epitome of this opportunity cost is Singapore, a very small country where the only operating landfill is actually located on an island, on land claimed from the ocean for this sole purpose. The site is filled primarily with ash from incineration plants onshore to reduce as much as possible the total volume and weight disposed in this island landfill.
Putting this information in context for the City is crucial. Despite being located in a large province, the City and the Region are largely contained by mountains and water as well as the agricultural
9 There are some exceptions to this rule for Cities and municipalities.

18
lands to the south, constraints that suggest similarities with Europe and East Asia where, as noted above, there is land scarcity for waste disposal and high land opportunity costs. Furthermore, the City has the highest population density of any municipality in Canada (Statistics Canada, 2016) and the Region hosts one of the highest population densities as well. In other words, beyond the City’s commitment to being an environmental pioneer in North America, the drivers that require the City to become an example of circular economy are also present. The following sections explore the policies and tools that can help the City achieve its goal of better waste measurement and reporting in businesses.
4.2 Voluntary agreements
Voluntary agreements (VAs), are schemes in which public and private sector organizations make commitments to improve –in this case– their environmental performance, without the need for legislation or sanctions. Participating companies commit themselves to obtain specified targets within predefined periods. The government, in return, commits to facilitate the companies with, for example information and incentives, and it commits to avoid introducing more stringent regulation during the agreement period. The voluntary character of the agreements is reflected in the fact that no company can be forced to sign a contract to join a VA, and is free to withdraw from it (van Beeck, 2007).
4.2.1 The benefits of a voluntary commitment program
These voluntary commitments have the potential to offer efficient and adaptable10 alternatives to traditional regulatory structures (Steelman & Rivera, 2006), whilst improving the image of both the regulator and the regulated by signalling the willingness of both sides to engage in a more flexible process of environmental protection (Koehler, 2007). VAs can save time by avoiding the steps of new legislation or regulation introduction. Private businesses are incentivised to participate by clear positive incentives such as cost-sharing, subsidies and a public platform from which to project a positive brand image. Furthermore, VAs with a strong case for economic gains for the business can translate into quick positive environmental results (Koehler, 2007). In the UK these co-benefits exist under the potential threat of legislation to measure and report on food waste. This will be discussed further in Section 5.2.
Funding. VA start-up costs are usually covered with seed funding allocated by the government and then participating businesses pay a fee that covers the long term operational costs of the VA.
10 Different organizations will be at different stages in the food waste journey. A VA provides a safe space for experimentation, collaboration and the exploration of solutions

19
A report on Voluntary Agreements for policymakers prepared by Food Innovation Australia recognizes the following needs for a VAs funding structure:
Ensuring the long-term financing and financial stability of any voluntary commitment is
critical to its longevity and impact, providing confidence of all those involved that it
presents a worthwhile investment of their time and resources and is laying the
foundations for longterm change.
In other countries, different funding compositions exist, which can come in the form of
donations, grants or governmental funding agreements, can be 100% private sector, 100%
public sector, charitable foundation or donor funding or a mix of all of these funding
streams. In most cases, seed and some on-going government funding is required to help
establish a voluntary commitment program and provide others with the confidence to
invest in it over time.
In the medium to long term (4 to 10 years) those responsible for leading the voluntary
commitment program should seek to secure diversified funding for it, so it is not
dependent on the will of the government or a few actors or signatories. From experience
elsewhere (e.g. the Courtauld Commitment in the UK, The Sustainability Consortium in the
USA and the UN Environment Transforming Tourism Project in Asia, Africa and Latin
America), the ideal medium-term funding composition is a mix of private and public
funding to ensure success whilst maintaining neutrality. Once a voluntary commitment is
established, it is often easier to ask signatory organisations to contribute to the costs,
once they have seen the value from their participation in the program. This also helps
them to feel a greater sense of ownership in the voluntary commitment – but large
financial contributors to the voluntary commitment should not have biased representation
in it or be in a position to block progress against agreed objectives and targets.
(Food Innovation Australia, 2020)
In Europe there has been a proliferation of VAs where government and industry commit to reducing food waste during a target period of time; the most recurrent being to halve food waste by 2030 with a 2015 baseline; a target that is in line with UN SDG 12.3. Waste reduction is the primary goal of most agreements but they have a clear measuring and reporting requirements as well to support that main objective of reduction. Some commitments cover all sectors along the food supply chain, others are sector specific. The VAs in the UK, Germany, The Netherlands, Norway, Finland, are a few examples. The retail sector tends to be the food sector with the highest participation rate because it is consolidated and has a strong interface with consumers, increasing the incentive to improve their brand. Norway for example has 100% market

20
representation of retail and the Finland has 90% (Hanssen & Östergren, 2021). Hospitality on the other hand, tends to have much lower participation rates because measuring for them is costlier11 and the sector is comprised of many SME.
From the evidence gathered, all of the active VAs have a third party involved in collecting the data under strict confidentiality, calculating sector averages and reporting back on progress. Confidentiality is often cited as a main concern for businesses and was also highlighted as a concern by all waste consultant experts interviewed (3/3). However, 2 of the experts also noted that in some cases, once businesses have been engaged through a waste consultation or through a VA, operational benefits start to be realized which increase businesses’ willingness to make their data public and be identified as part of a case study.
The wide adoption of VAs to collect data from private businesses in Europe could be seen as counter intuitive when compared with evidence that concludes that their environmental effectiveness is often questionable, and their economic efficiency, generally low (OECD, 2003). However, their precedence in Europe is particular to compliance with EU regulation passed in 2019 (European Commission, 2018, 2019) requiring all EU Member States to measure their food waste in 2020 and report data back by June 202212. The claimed benefits of the “voluntary” aspect of VA’s are thus leveraged against the possibility of regulation should voluntary compliance fail to make headway on SDG 12.3 goals and reporting. In other words, businesses are aware that if they don’t supply the data voluntarily in order for the Member State to report back to the EU, the individual Member States could pass legislation themselves to comply with the reporting requirements. This example is corroborated by studies which have found that the threat of legislation has shown to increase VA effectiveness (McCarthy, D. & Morling, 2015; WWF-WRAP, 2020). WRAP staff confirmed that they prefer the use of the word Voluntary Legislation to imply this threat.
Neither the City of Vancouver nor Canada have passed binding reporting requirements with the level of detail the EU has. The intention of this section is to learn from previous VAs in order to propose the best possible option should the City decide to use VA agreements among the suite of strategies to encourage food waste reporting. Below are additional contributing factors that can negatively impact the success of VAs,
11 Measurement methods by food supply chain stage are explained in section 6 12 This regulation is covered in more detail in the Regulation section below.

21
1. Unambitious target setting over the course of the commitment can be an issue. However, food waste measurement methods and reporting standards best practices are clearly established in the literature. Those need to be adopted.
2. Low participation rates: Even if the target setting is ambitious, the compliance methods clearly established, and the success in improving performance by participating business high, a low level of participation will negatively affect the overall effectiveness of the VA13.
3. Low target achievement: even if the target setting is ambitious and there is high a participation rate, an unclear compliance structure with few dis/incentives to encourage action can still lead to a lack of achievement and unrealised commitments14.
4. Inefficient compliance and incentives structure: This factor directly affects participation rates and target achievement but is not their exclusive explanation. Incentives and compliance structures need to strike a balance between being attractive enough for businesses to join and strict enough for making them comply without discouraging enrollment.
All four contributing factors can be seen as having multiplicative effects on VA results and impacts rather than additive. For example, very low participation rates will not significantly improve
13 In the UK there has been limited adoption by some food sectors, the details are further explored in the UK case study later on. 14 In the UK there has been limited reporting by some signatories, the details are further explored in the UK case study later on.
Target Setting
Participation Rates
Compliance Structure
Target Achievement
VA
Figure 8: Voluntary Agreements, Contributing Factors

22
industry data quality nor waste reduction, regardless of how good the success in the other factors is.
Establishing the best possible VA is crucial to realise the time and resources invested to commit, measure and act. If the policy fails to deliver the desired results, business confidence may falter, the food waste problem may worsen and yearly progress will need to increase in order to comply within a shortened timeline.
If VAs are chosen as the best option for the City’s interests in food waste measurement for the ICI sector, then following the actions below is likely to improve their effectiveness (McCarthy, D. & Morling, 2015):
• Robust and transparent reporting requirements (e.g. to prevent selective disclosure and improve accountability).
• Regular and credible independent (e.g. third-party) monitoring and evaluation systems, with sector average data made publically available or data on reporting compliance made publically available15.
• Sanctions for non-compliance (e.g. revocation of any benefits associated with scheme participation).
If the voluntary agreement has a larger goal of waste reduction and is not exclusive to measurement then establishing clearly defined and measurable targets (e.g. quantitative and time limited) set against a clear and credible baseline assessment will likely improve the success of the VA.
4.3 Policies that indirectly improve measurement.
There is a suite of actions and interventions that aim to address the differential needs of individual steps along the supply chain. The actions can be undertaken in initial phases before implementation of a food sector wide VA or regulation. Alternatively, they can be complementary to either VAs or regulation.
The Natural Resource Defence Council summarizes examples of fiscal incentives that have been implemented in the US in their Tackling Food Waste In Cities report:
Some government entities have developed programs that provide partner organizations with
food waste tracking software or help in cost sharing. The Smart Kitchen Initiative is a program
of StopWaste, the public agency responsible for reducing the food waste stream in Alameda
15 In the UK, the businesses that have joined the VA with WRAP don’t have their waste generation data made public, but it is know which businesses have submitted the data, and which ones have actually shown improvement.

23
County, California. This initiative works with medium and large-scale food service operators,
such as hotels and colleges, to measure and prevent pre-consumer waste. Participants receive
free licenses of LeanPath software16 for one year, as well as staff training and support from
StopWaste [REF] This represents a value in the range of $4,500 to $10,000 USD depending on
which version of LeanPath is selected and how much technical assistance is provided. Smaller
organizations received a less expensive tablet system and larger operations received a scale,
tablet, and camera [REF]. In exchange, businesses agreed to track waste, establish goals and
share their results. Through this program, Cal Dining, the residence hall dining operator of the
University of California, reduced food waste by 19 percent, the equivalent of 27 tons per year
and $98,000 USD in reduced food costs [REF].
The King County program took a broader approach and included projects that emphasized
recycling in the commercial sector in addition to prevention and rescue efforts. Through a
competitive request for proposal process, King County awarded between $24,000 and
$100,000 USD to seven programs between 2016 and 2018. Projects with an equity and social
justice element received priority consideration. For example, the local composting facility was
selected to partner with ten restaurants whose owners are people of colour, foreign born,
and/or whose primary language is not English. The facility will help these restaurants conduct
waste audits and implement customized food waste recycling programs. All projects are
required to track quarterly the quantity of food waste prevented or diverted from the landfill
[REF]. These programs illustrate different ways in which grant funding can be used to
jumpstart efforts in the commercial sector.
(Mugica, Rose, & Hoover, 2019)
4.3.1 Incentives by non-government institutions
The City could also explore partnerships beyond the food ICI sector. For example, in 2019, the Greencore Group in Ireland along with its banking partners launched corporate sustainable revolving credit worth £300 million (€342.5 million). The credit is tied to sustainability KPIs including food waste reduction (Greencore, 2019). Banking institutions in Vancouver or the Region might be interested in supporting a similar credit structure for businesses who’s reporting and targets align with food waste reduction goals, including the City’s ZW2040 strategy.
16 LeanPath and other technological waste measurement solutions are discussed in detail in the Measurement chapter

24
4.4 Regulation
Regulation explicitly requiring food waste reporting by individual businesses was not found through the literature review nor through the expert interviews. This section draws from examples where measurement and reporting are mandatory for different waste streams or where food waste measurement is required from entities other than food waste generating businesses.
4.4.1 Other waste streams
As previously mentioned, some affluent East Asian countries and territories have a high land opportunity cost and thus a powerful incentive to reduce overall waste going to landfill. The states of South Korea, Singapore, Japan and Taiwan explored here, are also highly industrialized economies with a well-educated population that values local communities and collectivism over individual priorities. Furthermore, these states have historically had sizable technology manufacturing industries which generate hazardous waste. The need to streamline hazardous waste management is another driver that led to the development of highly automated and technology reliant waste reporting systems. In summary, these states have the socio-economic conditions and environmental pressures conducive to strict and efficient waste management and reporting. Japan, South Korea and Taiwan, all have a centralized industrial waste reporting system.
Taiwan in 2002 implemented an Industrial Waste Control and Report System (IWCRS), a centralized system for all industrial waste reporting, which includes, but is no longer exclusive to, hazardous waste17 (Houng & Cheng, 2013). Reports are checked against GPS tracked hauling trucks and their tipped waste, as well as regular waste audits carried throughout the more than 12,000 businesses registered in the territory. This represents a very high level of data consolidation by a government agency, a high level of control as well as a significant amount of work required by individual businesses.
The Taiwanese model represents a mix of waste management strategies that involve mainly regulatory measures. The main one is the obligation to report waste with a prescribed level of detail, in the categories reported, on a frequent basis. This is coupled with the randomized and targeted follow-up on self-reports with waste audits, and the capacity to weigh the waste and track the flow from origin to management site through GPS equipped trucks. Finally, the IWCRS serves as a material exchange portal for businesses, thus augmenting the connectivity of
17 Through the resources found, it was not possible to establish is MSW need to be reported by separate waste streams that singles out food waste.

25
Taiwanese businesses and opportunities to reuse and recycle materials and avoid or delay “end of life” disposal.
The Korea Environment Corporation, a South Korean government body, manages an online waste information and management system, Allbaro, working with the Ministry of Environment, local governments and the Korea Coast Guard. Allbaro, originally established in 2001 to track hazardous waste, uses radio-frequency identification (RFID) to follow waste movements. The system also provides online preparation of official transfer documents. Most of the waste generated by businesses is covered by Allbaro (OECD, 2019).
Singapore has also enacted waste reporting requirements that are relevant to this research. The Singapore National Environment Agency can require18 the mandatory reporting of waste data and submission of waste reduction plans by any owner, occupier or lessee of a work place, upon their receipt of a written notice (see example). The initiative aims to draw management’s attention to, and sustain their awareness of, the amount of waste produced by their premises and to the potential for improving waste management systems. The case studies highlighted on their website include two hotels that have seen substantial cost savings in waste management as a result of their waste reduction plans. The reporting template actually includes food recycled by weight as a value to be reported on a monthly basis (Singapore - National Environment Agency, 2014).
4.4.2 Regulation for waste hauling and management businesses
Waste management businesses can also be subject to reporting regulation in order to have a better understanding of the waste streams within a particular jurisdiction. Staff at the City of Vancouver and the City of Calgary recognize that leakage to the US and/or private landfills cannot be ruled out. There are examples of different types of legislation to address these gaps. As previously mentioned, Taiwan provides one example of how to gain full understanding of waste flows between generation sites and disposal sites. More than 90% of waste hauling trucks in Taiwan are equipped with scales to measure every picked-up load, as well as GPS tracking systems to know pick-up sites and disposal sites for each load; all the data is sent electronically to the centralized system (Houng & Cheng, 2013). Another example is the City of Austin, where private haulers are required19 to report twice a year on the amount in tons of solid waste, recyclables, and organic materials hauled to landfills, recycling facilities, and organic materials processing facilities (Austin Government, 2016; Mugica et al., 2019). In a similar fashion, to address the data gaps on transboundary leakage to the US through private waste hauling
18 See Appendix 1 for legislation text 19 See Appendix 1 for legislation text

26
services, further regulation could be introduced to complement agreements already in place. Canada has multiple agreements that track movement of hazardous waste as well as some non-hazardous recyclables: 1) Canada-US Arrangement on non-hazardous waste and scrap, 2) Decision OECD/LEGAL/0266 of the Organization for Economic Cooperation and Development (OECD), and 3) the Canada-US Agreement on the Transboundary Movement of Hazardous Waste. An additional agreement that covers any type of waste including MSW, where volume, type and municipality of origin are reported, would improve waste tracking accuracy for multiple jurisdictions in Canada, including the City of Vancouver.
4.4.3 Regulation for government entities
The city of New York has passed an unprecedented requirement20 that city operated agencies with food contracts develop and implement a plan for reducing food waste. Each agency that is part of this new process will have to produce and submit annual reports with updates on food waste prevention plans and measures taken to successfully make progress. The regulation does not mention measuring of progress, nor a standardized way of reporting.
As mentioned in the voluntary agreements section, the EU passed regulation in 2019 (European Commission, 2018, 2019), requiring all EU Member States to measure their food waste in 2020 with an 18 -month window from the end of that year to report data back. Member States are required to report estimates of food waste levels by sector21, on a yearly basis, using a range of methods (European Commission, 2019). In addition, Member States are also expected to report more precise data on food waste at each stage of the food supply chain, at least once every four years. Whilst yearly indications may utilise a wide range of methods, assumptions and proxy data; more precise data (reported every four years) is expected to be derived from more robust direct food waste measurement methods (See Table 2 which is Annex III of the EU Commission Delegated Decision).
5 Case studies
This section explores in more detail the context and success of different strategies to improve food waste measurement and reporting with case study examples.
20 See Appendix 1 for legislation text 21 The EU defines 5 sectors: primary production, manufacturing and processing, retail and distribution, hospitality and food service, and households.

27
5.1 Europe
In the voluntary agreements and regulation sections some examples from Europe22 were highlighted. The case in Europe is noteworthy because it combines regulation and voluntary agreements at different jurisdictional levels with a common goal of food waste reduction. Furthermore, the European socio-economic and cultural context is similar to the Canadian context.
The revised Waste Framework Directive adopted on 30 May 2018 requires EU Member States to reduce food waste at each stage of the food supply chain, monitor food waste levels and report back regarding progress made. The Commission Delegated Decision lays down a common food waste measurement methodology to support Member States in quantifying food waste at each stage of the food supply chain. Based on a common definition of food waste, the methodology aims to ensure coherent baselining and monitoring of food waste levels across the EU. The initial baselining process started in 2020 and Member States will report back by the end of 2022 to The EU Commission. As called for by the new EU Farm to Fork Strategy, the Commission will propose legally binding targets to reduce food waste across the EU, by end 2023, defined against the EU baseline with a deadline in 2030 (in alignment with SDG 12.3)23.
Through the Delegated Act, Member States are required to report estimates of food waste levels by sector, on a yearly basis, using a range of methods (European Commission, 2019). In addition, Member States are also expected to report more precise data on food waste at each stage of the food supply chain, at least once every four years. While yearly indications may utilise a wide range of methods, assumptions and proxy data; more precise data (reported every four years) is expected to be derived from more robust direct food waste measurement methods (European Commission, 2019).
However, the Delegated Act contains two important limitations which have been underlined by stakeholders. Firstly, the reporting is limited to food waste flows destined for waste treatment operations (such as landfilling, composting, biogas, incineration, etc.) and does not require Member States to report food waste separately according to the different food waste hierarchy destinations. Secondly, the Delegated Act does not require the measurement of harvest losses, which is estimated to account for between 11 % (FAO, 2011) and 36% (FUSIONS 2016) of overall food waste across the EU. In relation to these aforementioned limitations, any efforts towards
22 The terms Europe and EU will not be used interchangeably. Some states, such as the UK and Norway are no longer or were never part of the EU. But their policies and legislation have aligned with EU regulation. 23 Multiple EU Member States as well as other European States already have aspirational food waste reduction targets for 2030, but to our knowledge none of them are legally binding.

28
policy development in Canada, BC, Metro Vancouver or the City should aim to include regulation that addresses these gaps and the ability to report consistently to the two SDG indicators of Target 12.324
5.1.1 Nordic countries
The Nordic region states cooperate and share experiences in detail. Their own experts identify the four biggest countries as having different approaches to tackle the reporting requirements of the EU regulation. Sweden and Denmark national food waste estimates by food supply chain stage are mainly driven by the authorities applying a top-down approach while Finland and Norway use of a bottom-up perspective driven by the business sector and research and development (R&D). The top-down approaches are commissioned by the authorities to collect national data on food waste. The main interest of a top-down approaches is to produce aggregated data for national statistics. The bottom-up approaches are aimed for change management at the stakeholder level. They focus on much more detailed data and with an aim to identify opportunities for prevention. Aggregated data are collected among the engaged stakeholders for benchmarking and to develop common strategies for collaboration (Hanssen & Östergren, 2021).
Norway: In the documentation available in English, it is stated that voluntary agreement is binding once it is signed (Norway Ministry of Climate and Environment, 2017)
Voluntary Agreement document Voluntary Agreement contract
24 The Food Loss Index and the Food Waste Index have two different custodians, FAO and UNEP respectively.

29
Table 1: Voluntary Agreement Coverage in Nordic Countries
State Supply chain stage Data Collection Method & Quality
Standardize waste definition
Coverage Reference
Norway Manufacturing & Processing
Self-reported following Norwegian standard Medium quality
Yes 46% (Hanssen, 2017; Hanssen & Östergren, 2021)
Finland Manufacturing & Processing
Interviews, questionnaires Low quality
No 40% (Riipi & Hartikainen, 2020)
Norway Retail and Wholesale
Scanned items High quality
Yes 100% Retail 65% Wholesale
(Hanssen, 2017; Hanssen & Östergren, 2021)
Finland Retail and Wholesale
Interviews, questionnaires Low quality
No 90% (3 chains) (Riipi & Hartikainen, 2020)
Norway Catering Multiple methods Mixed (low and medium) quality
Yes 44 Hotels - 47% 598 Canteens - 36% 59 Restaurants - 2%
(Hanssen, 2017; Hanssen & Östergren, 2021; Stensgård, Prestrud, & Callewaert, 2020)
Finland Catering Food waste diary Med-high quality Questionnaires Low quality
No 0.015% D 150 Diaries (D) 0.09% Questionnaires 900 Questionnaires
(Hartikainen, Riipi, Katajajuuri, & Silvennoinen, 2020; Riipi & Hartikainen, 2020),
Table 1 summarizes the level of engagement the Finnish and Norwegian voluntary agreements have achieved. Information on the progress and measurement and reporting complains was not obtained from the resources available.

30
5.2 United Kingdom
A proposal on food waste reduction and reporting legislation precede the adoption of VAs as a
strategy to reduce food waste and improve food waste measurement and reporting. A “private
members bill” was proposed in 2015, titled “The Food Waste (Reduction) Bill 2015-16”, which
would have required large supermarkets, manufacturers and distributors to reduce their food
waste by no less than 30 % by 2025 and enter into formal agreements with food redistribution
organizations; to require large supermarkets and food manufacturers to disclose levels of food
waste in their supply chain. However, the proposed legislation was not taken forward by the UK
parliament.
In the UK, the charity Waste and Resources Action Programme (WRAP) has served as the third
party to engage, recruit and co-inform the VAs currently active in the UK. There are two main
agreements, the Food Waste Reduction Roadmap and the Courtauld Commitment 202525. At the
time of this report, 261 organizations have committed to the Food Waste Reduction Roadmap,
including 16 retailers, 162 producers/manufacturers and 35 hospitality and food service
businesses. WRAP estimates that these organizations are likely to generate around 1.2 million
tonnes of waste in their operations each year. Of the organizations, 190 are sharing waste data
and progress with WRAP (Dray, 2021; WRAP, 2021b).
The UK Department for Environment, Food and Rural Affairs (DEFRA) claims that the UK was one
of the first countries in the world to publish comprehensive data on food waste in line with
international best practice (Government of the United Kingdom, 2018). In the UK’s Resources and
Waste Strategy, DEFRA recognizes that it would like to see more food businesses use the
resources facilitated by WRAP, to set a reduction target in line with UN SDG 12.3, and to report
their food waste transparently on an annual basis. The report included plans for a consult in 2019
on introducing regulations to make reporting mandatory for businesses of an appropriate size, as
well as a consult on seeking powers for mandatory food waste prevention targets for appropriate
food businesses and for surplus food redistribution obligations to be introduced, subject to
progress made by businesses to reduce food waste.
The leadership that WRAP has shown in managing these initiatives; together with the threat of
legislation for mandatory measuring, reporting and even binding reduction targets, might explain
25
The commitment has been extended to 2030 to further align with the SDGs. Courtauld operated with a higher
level of engagement and support compared to Food Waste Reduction Roadmap. There is a fee for getting that level
of support by WRAP. This ensure the businesses get the targeted support needed once low hanging fruit
interventions have been implemented.
31
the claimed success of the UK voluntary agreements. Even though the UK’s Resources and Waste
Strategy was published in 2018, to date there is no mandatory requirement, and measurement of
food waste in UK businesses relies entirely on the success of the VAs.
In the following paragraphs are the highlights of key limitations of UK’s VAs identified by TABLE26,
a food systems sustainability think-tank based in the UK. Even though TABLE recognizes UK’s
successes, especially in comparison to states that don’t have VAs nor regulation, they advocate
for a shift to regulation-led approaches to reduce food waste and improve reporting based on
the following limitations27 (Bowman, 2021):
• Low participation rates: The UK government has had to intervene to boost signatories to
the VA. Low participation can drive conveners to keep the ambition of targets lower in an
attempt to persuade more businesses to join. TABLE cites evidence that the UK’s
voluntary targets to reduce food waste by 20% by 2025 under Courtauld 2025 were not
set at a higher 30% level for fear that businesses would not sign up. Despite the lower
target set, intervention to boost participation was still required.
• Lack of transparency: Of the total signatories to the VA, a third (when TABLE report was
written) had not yet provided any evidence that they are implementing any change, and
the VA did not designate any authority to “punish” lack of compliance
• Slow pace of change: Between 2011-18 UK food businesses reduced their food waste by
only about 1% per year. The UK’s voluntary commitments set out for a slightly higher
ambition of about 1.5% per year reductions. TABLE argues It is not unreasonable to
suppose that faster change might be achieved.
26
Their report also mentions the exclusion of waste at primary production as a shortfall, but because the City does
not have primary producers the detailed information is left out. See TABLE to see full critique.
27 How to address some of these challenges in VAs has already been addressed in the voluntary agreements section.

32
6 Food Waste Measurement
Food waste measurement can take a variety of forms and range in terms of cost to carry out and
the technology involved depending on which stage of the food supply chain is targeted. The most
common way to measure food waste over time is through repeat waste composition studies, but
there are currently accepted alternate best practices for each stage of the supply chain. For
example, the EU has established in their legislation which measurement methodologies are
acceptable for each stage of the supply chain (Annex III of the Commission Delegated Decision
(EU) 2019/1597 on Measuring, see Table 2). Given the focus on the ICI sector for the City and in
particular the three stages present in the City, this section will focus on measurement best
practices and challenges for Processing and Manufacturing, Retail and Wholesale, Restaurants
and other Food services with their preferred method of measurement according to the
Commission for Environmental Cooperation.
Table 2: Accepted Measurement methods by supply chain stage in the EU28
The Commission for Environmental Cooperation (CEC) has published a detailed report on
advantages and challenges of each measurement method, for each different stage of the supply
chain. Along a summary review of the primary methods of measurement follows with tables
quoted from CEC’s supplementary report: Why and How to Measure Food Loss and Waste, A
PRACTICAL GUIDE - VERSION 2.0.
28
This table refers to Mass balance measurement. It is not explored in detail here but the method infers food loss
and waste levels by comparing inputs (e.g., products entering a grocery store) with outputs (e.g., products sold to
customers) along with changes in standing stock levels. At its most basic, this method estimates FLW by subtracting
the outputs from the inputs, with the difference being considered the amount of FLW. (Source)
33
The primary methods of measurement reviewed in the section below are:
6.1 Direct measurement
6.2 Waste composition studies
6.3 Measuring through waste hauling services
6.4 Food recovery networks
6.1 Direct Measurement
6.1.1 Processing and Manufacturing
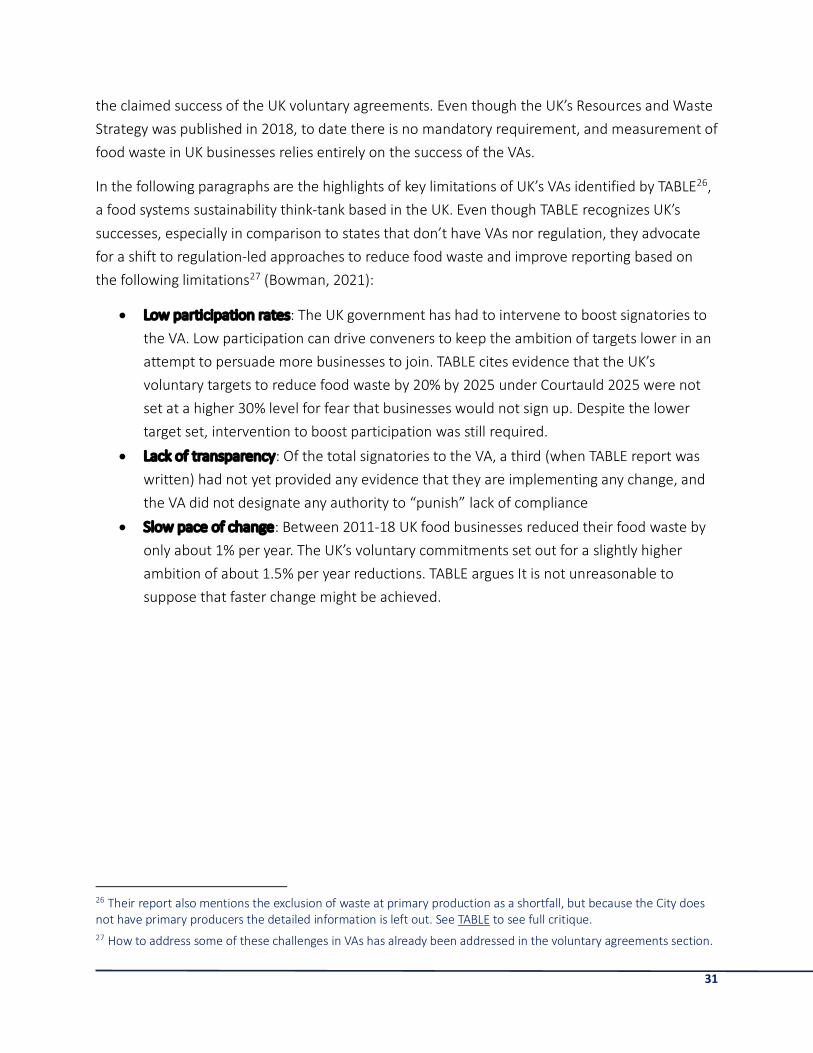
Direct Measurement in the sector: usually involves diverting the food that is being lost or wasted
into containers (e.g., buckets) where it can be weighed. Food waste is collected for a period of
time (e.g., one eight-hour shift) and then scaled to provide an approximate estimate amount for
a week, month, or year. More accurate estimates require repeated sampling to account for
fluctuations over time (e.g., seasonality). Table 3 summarizes some advantages and
disadvantages of this method.
Table 3: Strengths and limitations of direct measurement of FLW in Processing and Manufacturing
Source: (CEC, 2021a)

34
There are other ways of measuring at this stage of the supply chain, Table 4 compares them:
Table 4: Summary of methods used to measure FLW in Processing and Manufacturing Sector
Source: (CEC, 2021b)
6.1.2 Retail and Wholesale
Direct Measurement in the sector: Most retailers use an electronic scanning system for inventory
and sales. Under this method, when items leave the retailer’s premises for reasons other than
being sold (e.g., landfill, donation), they are scanned and this information is integrated into a
database that can then be used to quantify the amounts and types of food going to different
destinations. It can be used to estimate the value of lost sales and can provide a good starting
point for prioritizing actions for preventing food from being wasted. However, fresh produce,
bakery and delicatessen items are challenging to capture since they are often not consistently
scanned out. Table 5 summarizes some advantages and disadvantages of this method.
“Business owners know that the marginal gains of scanning every single fresh produce, bakery or
deli item are low compared to the labour cost of having personnel scan everything out”
FoodMesh Expert
35
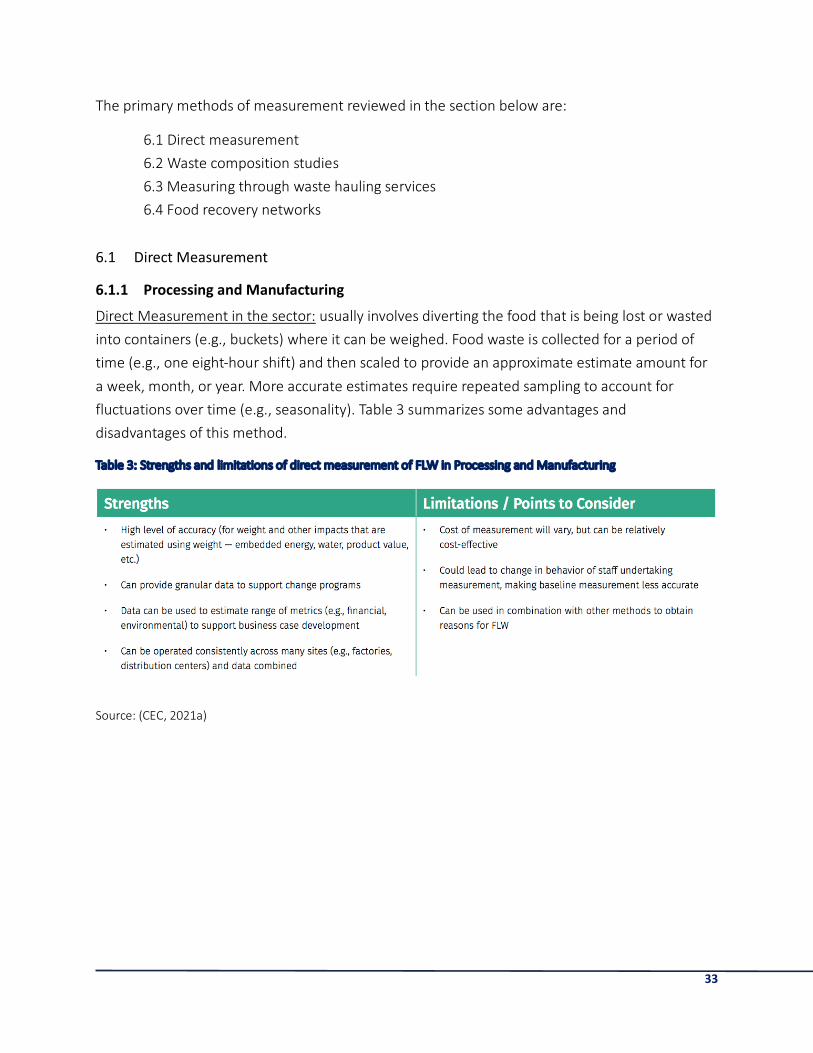
Table 5: Strengths and limitations of scanning of FLW in Retail
Source: (CEC, 2021a)
There are other ways of measuring at this stage of the supply chain, Table 6 compares them:
Table 6: Summary of methods used to measure FLW in Retail
Source: (CEC, 2021b)
6.1.3 Restaurants and other Food Services.
Direct Measurement in the sector:
Smart bins: More advanced technologies to track food wasted in institutional and restaurant
environments on an ongoing basis29. These systems aid in tracking and monitoring pre-consumer
and post-consumer food waste so that strategies can be identified to reduce waste. These offer a
more automated approach, include more detailed reporting, and require a more significant
29
software solutions such as LeanPath , Winnow.

36
financial investment (Mugica et al., 2019). Smart bins can be deployed as a one-off project to
facilitate change or provide ongoing monitoring for continuous improvement and measurement
of performance data. Using smart bins as one-off projects could be a model that City supports by
purchasing the equipment and renting or lending it out to partnering food businesses. Table 7
summarizes some advantages and disadvantages of this method.
Table 7: Strengths and limitations: Smart Bins to measure FLW in Food Service and Hospitality
Source: (CEC, 2021a)
Plate weighing can be used to measure plate leftovers in hospitality, food service and school
settings. It usually involves two direct measurements, first, a sample of trays containing the food
directly after serving to establish the average amount being served; and second, a sample of
trays containing the plate leftovers after the diners have eaten. This method is applicable mostly
for post-consumer waste at full service restaurants. Table 8 summarizes some advantages and
disadvantages of this method.
Table 8: Strengths and limitations: Plate Waste to measure FLW in Food Service and Hospitality
Source: (CEC, 2021a)
37
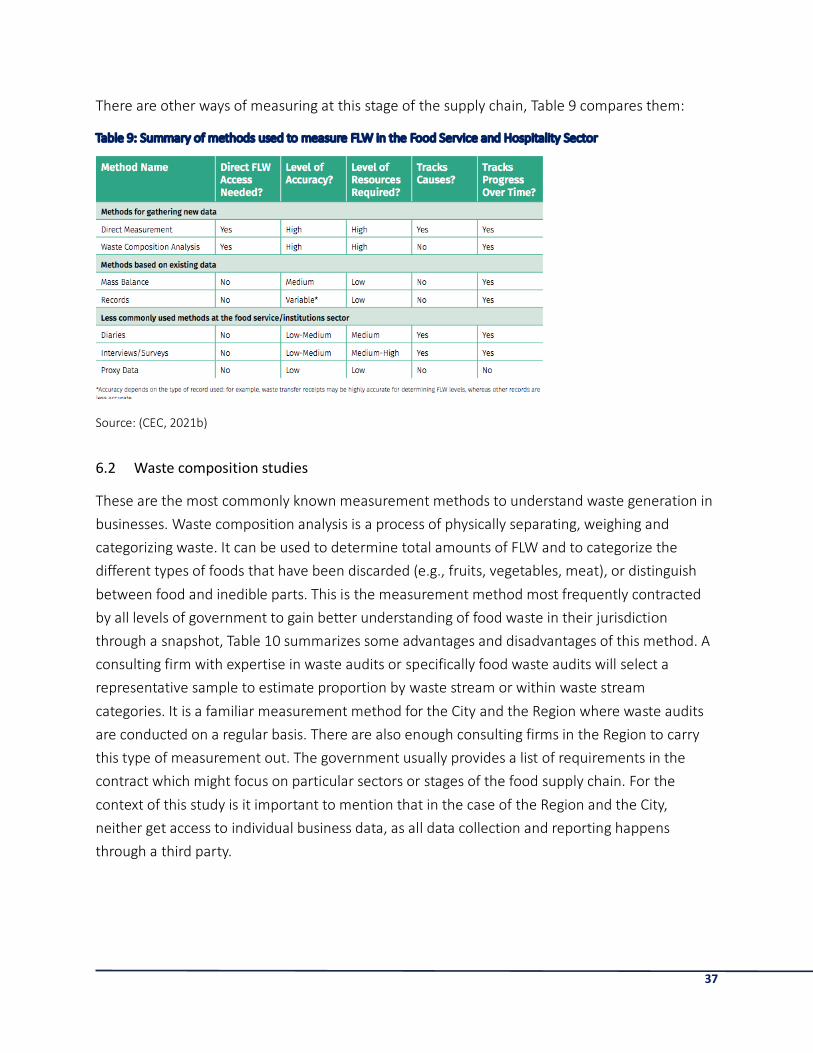
There are other ways of measuring at this stage of the supply chain, Table 9 compares them:
Table 9: Summary of methods used to measure FLW in the Food Service and Hospitality Sector
Source: (CEC, 2021b)
6.2 Waste composition studies
These are the most commonly known measurement methods to understand waste generation in
businesses. Waste composition analysis is a process of physically separating, weighing and
categorizing waste. It can be used to determine total amounts of FLW and to categorize the
different types of foods that have been discarded (e.g., fruits, vegetables, meat), or distinguish
between food and inedible parts. This is the measurement method most frequently contracted
by all levels of government to gain better understanding of food waste in their jurisdiction
through a snapshot, Table 10 summarizes some advantages and disadvantages of this method. A
consulting firm with expertise in waste audits or specifically food waste audits will select a
representative sample to estimate proportion by waste stream or within waste stream
categories. It is a familiar measurement method for the City and the Region where waste audits
are conducted on a regular basis. There are also enough consulting firms in the Region to carry
this type of measurement out. The government usually provides a list of requirements in the
contract which might focus on particular sectors or stages of the food supply chain. For the
context of this study is it important to mention that in the case of the Region and the City,
neither get access to individual business data, as all data collection and reporting happens
through a third party.

38
Table 10: Strengths and weaknesses: Food-Focused Waste Composition Analysis to quantify FLW
Source: (CEC, 2021a)
If businesses carry out waste audits by law, then there can be no penalty attached to the waste
findings. The reason is simple, they will change operation habits or even find it worth looking for
illegal waste handling methods to avoid high percentages of waste showing up in their audit
results. Furthermore, the food business sector should not be the sole target for a policy on
measurement, rather it should be seen as a pilot project that could inform actions for other
waste streams. Businesses operating in non-food related sectors have other waste streams that
are characteristic of their industry (e.g. textiles in the textile industry) and negatively impact the
City’s zero waste goals. The final suite of policies implemented needs to be balanced across all
sectors. When compared with other industries, for example to the tech industry, the food
industry runs on slim profit margins and so requiring reporting that entails extra costs for just one
industry sector might be negatively perceived
To help counter this anticipated reaction, this pilot needs to emphasise the benefits of food
waste reduction, including the opportunity to address and improve the bottom line of their
businesses, even by a few percentage points.
6.3 Measuring through waste hauling services
As mentioned previously in the report, not only waste generators can improve the overall
understanding of waste generation in the City or Region. Food management companies and
haulers are key levers to improve the data available. A precise technological solution would be to
require hauling trucks in the Province, Region or City to be equipped with weight and GPS
monitoring. Each time a site is collected from, the truck registers the weight and location which is
then automatically cross-referenced to business license. Taiwan, explored in detail in section
4.4.1, has implemented this type of waste tracking for all industrial waste. Another option to

39
consider is incentivizing haulers to regularly report on the amount of waste and its destination.
For example, the city of Austin requires private haulers to report twice a year on the amount in
tonnes of solid waste, recyclables, and organic materials hauled to landfills, recycling facilities,
and organic materials processing facilities (Austin Government, 2016; Mugica et al., 2019). An
example of a hauling company with this capability is Casella Organics. They provide organic waste
recycling and disposal services in Vermont and their trucks can weigh waste using their onboard
scales and provide data to several of their college clients. For clients for whom their organics
waste is all or predominantly comprised of food scraps, this real-time measurement offers useful
information about food waste generation (Mugica et al., 2019).
6.4 Food recovery networks
As previously mentioned Food Recovery Networks are also capable of tracking food flows
between their clients and different diversion strategies. In terms of the quality of the data
collection; most large-scale grocers and wholesalers know their inflows and outflows in good
detail. However, the level of detail that FoodMesh (FM) provides by default (e.g. 2000 kg of
donated food from the bakery department) is not sufficient for business to easily act on. The data
provides a general picture, but in order to effectively understand what is being wasted businesses
need a higher level of report detail, including the type items donated (e.g. muffins), the reasons
why (e.g. close to expiry date), and the days when surpluses usually occur (e.g., Tuesday-
Thursday). The level of data detail FM is able to capture would suffice for the City’s measurement
purposes, however without further refinement in FM’s method, it might fall short with regards to
the City’s goal of enabling operational change in local food businesses. FM staff did confirm that
FM is capable of reporting food waste data by different food categories30 and are familiar with
the FLW Reporting Protocol.
Overall challenges of measurement
Tracking methods that rely on procurement data, such as the one used by ReFED, are a simple
system that easily adapts to retailers: what enters the retailer business relates directly to what it
sells, discards or donates, as there is little or no transformation of the product. Conversely,
manufacturers, food service venues, or institutional cafeterias, transform products (ingredients)
and therefore the calculation method is more complex than for retailers and requires costlier
techniques to keep track of quality data. There is also greater overlap of what is being wasted.
For example, reducing the amount of leftover lasagna may mean that some ingredients can be
bought in smaller quantities, but those same ingredients are likely used for other products. Being
30
High level food categories such as: Deli, Bakery, Eggs, Dairy, Meats, Seafood, Fresh Produce, Dry goods, etc.

40
able to distinguish what the waste driver is in the manufacturing sector requires detailed
measurement of each transformation process. In manufacturing the factors impacting waste and
their relationship with procurement levels are not 1 to 1, as they would be in a strictly retail
setting. Retail is also different to the other sectors in the type of waste. Sectors that transform
ingredients (e.g. manufacturers and restaurants) have a smaller proportion of packaged waste
and a higher proportion of food scraps that are considered inedible, e.g. peels, pits, bones, skins,
shells, etc. These inedible elements are normally still attached to the foods sold and wasted at
retail. Finally, food service providers tend to see a higher proportion of food waste that was
edible compared to manufacturers, because of their direct engagement with costumers. Edible
leftover plate food waste is common place because of portion sizes for menu items are standard
while customer appetites are highly variable.
This section has reviewed the literature on waste measurement methods and identified best
practices by sector. As identified in the strengths and weaknesses tables, better measurement
methods are more time consuming and costlier. It is expected that the higher the quality of the
measurement method the higher the resistance to adopting it. It is important to communicate to
businesses in the city that those higher quality measurement methods provide the key
information that can be acted upon to reduce waste and costs.

41
7 Waste reporting
7.1 Reporting Protocols
This section reviews reporting protocols. There is a general consensus among organizations that
have led research in best reporting practices as to what the gold standard for FLW reporting is:
the Food Loss + Waste Standard (FLWS) led by the World Resources Institute (WRI). It represents
a comprehensive view of necessary variables to consider, grouped under four components that
define the scope of reporting31 (See Figure 9). It remains flexible to different interpretations of
waste and enables companies, countries, cities and others to quantify and report in a consistent
and transparent way on the amount of food (and the associated inedible parts) wasted. It
provides a common language and framework for describing what has been measured so
companies and others can develop targeted FLW reduction strategies.
Figure 9: FLWS Scope diagram template tool
31
This tool is helps the entity reporting to edit a personalised scope diagram

42
It is important to highlight that the definition of Food Loss and Waste is still a contested topic
(Bellemare, Çakir, Peterson, Novak, & Rudi, 2017; Spang et al., 2019; WRAP, 2021a). The City will
have a pending decision to make, ideally in conjunction with the Region32 on what the ideal
definition of food waste will be and whether the best is to align with the suggested interpretation
from SDG 12.3: “Food Waste: Food and the inedible parts of food removed from the food supply
chain to be recovered or disposed of […]this definition excludes food surplus that is redistributed
for human consumption, diverted to animal feed, or sent to bio-based material / biochemical
processing (i.e., used to produce industrial products). All of these are considered for the purpose
of the SDG Target 12.3 as waste prevention activities” (Figure 10 captures this definition using the
FLWS scope diagram). This decision is no minor undertaking, but should prioritize the City’s
aspirational goals, especially if they are considered more ambitious than SDG 12.3, i.e. zero waste
by 2040.
Figure 10: SDG 12.3 FLWS Scope diagram
Because multiple efforts to standardize reporting are informed by how the SDG 12.3 is
interpreted; more detail regarding the scope and definition is provided with the comparison in
Figure 11 (Hanson, 2017).
32
Ideally the Federal government will also adopt a consistent food waste definition.

43
Figure 11: Comparison of Champions 12.3 and Pacific Coast Collaborative food waste hierarchies
From Figure 11 it can be inferred that based on the waste definition and the recovery hierarchy
chosen, the progress and measurement requirements will differ, and consequently the final
decision of the City needs to be informed by the main priorities. Compared to Champions SDG
12.3 interpretation, the food waste hierarchy outlined by the Pacific Coast Collaborative33 (PCC)
for their Pacific Coast Food Waste Commitment identifies Composting and Anaerobic Digestion
as categories that contribute towards achieving SGD Target 12.3. PCC also includes a
fundamental category which is Source Reduction, hard to measure but the cornerstone of true
progress on addressing food surplus and it potentially becoming food waste. Considerations and
interpretations like the aforementioned need to inform the City’s definition of food waste so that
the measurement and reporting requirements put forward by the City are able to track progress
and of zero waste goal.
33
The Pacific Coast Collaborative: The Pacific Coast of North America represents the world’s fifth-largest economy, a
thriving region of 55 million people with a combined GDP of $3 trillion. Through the Pacific Coast Collaborative,
British Columbia, Washington, Oregon, California, and the cities of Vancouver, Seattle, Portland, San Francisco,
Oakland, and Los Angeles are working together to build the low carbon economy of the future.
https://pacificcoastcollaborative.org/
Pacific Coast Collaborative:
Pacific Coast Food Waste Commitment
Food Waste Hierarchy, 2020 for achieving SGD
Target 12.3

44
An example of a company’s FLWS report case study can be seen in Figure 12. It is important that
before measurement starts under the defined scope the staff or third party in charge of reporting
familiarize themselves with the reporting template and potentially decide the measurement
method best suited for their need with the FWL Quantification Method Ranking Tool. However,
the measurement of waste and familiarization with the reporting template is another reason why
some of the systems that measure and quantify waste aim to simplify this task for the consumer
and generate report that are compliant with the FLWS, such as ReFED, LeanPath, FoodMesh, and
most waste composition consultants.
Figure 12: FLWS Scope diagram for IKEA's waste reduction case study
7.2 Comparison of data management on-site vs. off-site
This section aims to describe and compare possible trade-offs and risks with regards to two
hosting options for waste data reported by businesses: government hosting and hosting through
a third party.
All levels of government in Canada have experience hosting sensitive information from
businesses. Furthermore, provincial and federal statistical offices have sufficient experience

45
publishing industry or sector averages and coefficients of variation. As a host of sensitive
business information like food waste data, the greatest risk for the City is the potential
occurrence of a data breach. Such a breach could erode the relationship with businesses and
might entail legal action against the City. That said, government institutions, including the City,
already hold other types of sensitive information from businesses, including financial
performance information for corporate tax purposes, employee personal information and
salaries, requirements and forms submitted for license approval and renewal, and health and
safety operations certificates for food operations, among many examples. For example, all
businesses in Canada report gross income and profit data to the Canada Revenue Agency (CRA)
in order to pay corporate tax. The data can be linked to businesses by CRA personnel, but only
summary data is presented publicly. The demonstrated expertise in governments securing data
would need to be thoroughly communicated with businesses should the City, Region or Province
decide to host food waste data as well.
The City as an enduring and stable institution is another benefit with regards to hosting data.
While businesses come and go the City will persist, providing long term, consistent access to the
data repository thus avoiding the risk of a third party data host no longer being able to provide
their services.
However, if the government not only hosts the data but is also a regulator that can issue fines
based on the data collected, businesses will be hesitant to report. Hesitancy may even exist in the
case where there are no fines, as the government could potentially implement such fines in the
future. Based on the experience of European countries like the UK and the Netherlands, the
hosting of data through a third party may be an attractive alternative for businesses. The option
of a third party issuing anonymized reports from businesses to cities or other government bodies
can avoid concerns that submitting data could directly lead to being fined.
Businesses are also likely to be concerned about their identifiable waste data being made public
as part of government reports. A signed non-disclosure agreement (NDA) between the reporting
businesses and the City or third-party data host is suggested to help allay these concerns34.
If the end goal is to have a by-law that requires waste reporting by individual businesses, it is
sensible to collect that data and manage it in a government institution. If the goal is to recruit
through voluntary commitments, a third-party hosting data and managing engagement with
businesses might increase participation.
34
Indeed, a standard in the waste auditing industry is complete confidentiality of data with client’s data to attenuate
possible negative impacts on corporate image.

46
Based on the trade-offs presented here, it is key for the City to gain a better understanding of
current ICI perceptions of data sharing with government institutions and whether local food ICI
sector is already engaged in other VAs where data is collected and shared.
In order to start a policy co-design process, the planning phase could include stakeholders the
engagement through surveys or focus groups to learn from their experience with voluntary
reporting where data is shared directly or indirectly with government and to inquire how food
waste data could be gathered and stored locally as well as what anonymized data could be
shared publicly. Once this initial assessment is carried out, the City would be better prepared to
support the specific needs and concerns of the local food ICI sector with regards to measuring
and reporting on food waste data.

47
8 Discussion
The City of Vancouver has the opportunity to lead by example in terms of measurement,
reporting and most importantly total waste reduction and increased diversion rates, first within
their facilities and then through different strategies across all the ICI sector in the City’s
jurisdiction. This discussion section will explore and compare those strategies, draw insights from
policies and regulations presented in this report to suggest a path forward for the City to lead by
example, and finally summarize some research avenues this work has opened.
There is however, a clear hierarchy as to how regulation and motivation for action needs to
proceed in order to foster systemic change. The examples show that states have been able to
access information from all landfill, incineration, and other waste end disposal sites through
regulation. And most examples of VAs to address the food waste systematically are pursued at
state level. This indicates that the highest leverage in order to comply with 12.3 is at the level of
the Canadian federal government. However, without mandatory or voluntary reporting at the
federal level, measurement and categorization of food waste will be piecemeal across the
country.
8.1 Decision Matrix
A decision matrix is used to compare different criteria that are relevant to evaluate a project. The
following list of criteria aims to capture the key considerations to decide which strategy or
combination of strategies are best adapted to the City’s food waste measurement and reporting
goal:
1. Time to success
2. Monetary cost for the City
3. Monetary cost for waste generating businesses
4. Monetary cost for waste hauling/managing businesses
5. Political cost
6. Industry level data quality
7. Co-benefits to tracking of other waste streams
Time to success: The total time it will take to fulfil the objective of calculating a significantly
higher quality food waste estimate for the City/Region. This criterion speaks to the urgency of
reducing waste going to the Vancouver Landfill, whose maximum capacity is projected to be
reached before the end the landfill contract. It also speaks to the urgency of having quality data
that will be able to assess the impact that different interventions have on waste reduction. Based
on the timeframe that EU Member States are projecting to have the baseline and then reduce

48
food waste up to 2030, this work estimates that the latest date by which Vancouver should have
robust food waste measuring and reporting in the ICI sector is 2030. That gives the City and the
ICI sector 10 years to achieve zero waste and achieve a circular economy35.
Monetary cost for City: The estimated cost for the city to implement this strategy. It considers
estimates for stakeholder engagement, payments to contractors, further research, technology
acquisition, data management, and short and long-term personnel. It is ideal to carry out a
detailed cost benefit analysis for the strategies here mentioned.
Monetary cost for generating businesses: The estimated cost for the waste generating business
to implement this strategy. It considers estimates for payments to contractors, technology
acquisition, data management, additional human resource needs, staff training expenses, and
new taxes or fees. It is ideal to carry out a detailed cost benefit analysis for the strategies here
mentioned.
Monetary cost for hauling/managing business: The estimated cost for the waste generating
business to implement this strategy. It considers estimates for payments to contractors,
technology acquisition, data management, additional human resource needs, staff training
expenses, and new taxes or fees. It is ideal to carry out a detailed cost benefit analysis for the
strategies here mentioned.
Political cost: The estimated political cost for the City, Mayor or Council would need to assume
and navigate in case the strategy is pushed forward. For this study it is estimated based on how
many constituents would perceive this negatively. E.g. if a strategy affects mostly the food retail
companies, the political cost is likely lower than a strategy that is perceived negatively by food
service businesses because of the large difference in the number of business owners in each
category. However, for political cost detailed assessment it is ideal to carry out further direct and
indirect stakeholder engagement which includes estimating how relevant those constituents are
in determining electoral outcomes.
Industry level data quality: Three factors influence this indicator: 1) The precision of the weight
of waste data, 2) the number of subcategories the methodology is able to disaggregate total
waste into, and 3) temporal resolution, i.e. does the strategy generate yearly, monthly, weekly, or
daily data (See Figure 13). Data quality needs will differ greatly between the City and individual
businesses but scores were assigned based on the City needs. The City likely only needs yearly (or
35
(WWF-WRAP, 2020) suggest 5 years as a reasonable window of voluntary agreement. 1 year where Government
and partner setup and engage private sector. 3 years measuring, reporting and improving. 1 year at the end for
analysis and legacy of project

49
quarterly to account for seasonality) data, with confidence at the tonnes scale, with detail about
which end destination the food is going to (e.g. compost, landfill, animal feed, etc.) and whether
it was avoidable or unavoidable waste. Based on the evidence of this work, data need to be
precise in tonnes for large businesses and hundreds of kilograms for smaller businesses on at
least a monthly basis to be able to act on it. However, it is most likely the will need weekly or
daily data to gain the valuable insight that might change their operation practices. Similarly, they
will need to gains insight by the individual food item level to adjust preparation or ordering.
Detail on the destination will either be irrelevant or relevant for those committed to social and
environmental causes.
Figure 13: Data quality attributes diagram
Co-benefits for tracking of other waste streams: Implementing the strategy will improve the
data quality of other waste streams. This criterion is included to provide the information, but
does not count towards the final score, because the focus of the report is on food waste and not
other waste streams. The weighing can be easily changed in the original spreadsheet.
Table 11 present how the best and worst score in each criterion should be interpreted. Because
most criteria speak about reduction, a score of 1 represent the best score. Each field in the
decision matrix is justified in an accompanying document that explains the rationale behind the

50
score. This decision matrix is a living document that will support decision making in the City once
new information is available.
For the decision matrix seen in Figure 14, this work follows the insights of section 6 to focus on
measurement methods that yield the highest quality data for the business. The final values for
each individual food supply chain stage are displayed with gray font to indicated that they should
not be compared directly to the other strategies, but rather are illustrative to compare how
different stages face different challenges in order to get high quality data. Their data is averaged
with equal weigh to calculate the Direct Measurement row. As mentioned in section 6, the higher
the quality of the data for the individual business, the likelier it is that it can inform their
operational change and leverage the information to reduce food waste in a targeted fashion. As
mentioned previously, the quality of such measurement practices might go beyond what the City
decides is enough detail to inform its goals. Once the necessary decision has been made, the
decision matrix can be revisited, new rows with additional strategies can be added as well as new
criteria to compare the strategies. Furthermore, the current matrix uses equal weighting for all
criteria, something that can be updated based on expert opinion once an informed decision
needs to be made.
The results of this decision matrix are preliminary because the weights currently stand at 1. With
that caveat in mind, the results suggest a Food Recovery Network might be the best strategy to
pursue. The Region already started a similar process to develop a FRN. As mentioned, some
policies beyond what is explored here might actually act as positive synergies (e.g. higher tipping
fees for garbage across the region would increase the incentive to divert and use solutions such
as the FRN, thus increasing the quality of food waste data measurement), whereas some other
strategies might have negative feedback effects on the FRN (e.g. acquiring technology such as
smart bins in restaurants might seem redundant for some businesses, and thus the two
strategies would somehow compete for clients and the FRN would be weakened by fewer
members that already “sunk” their investment in a technological food waste measure).
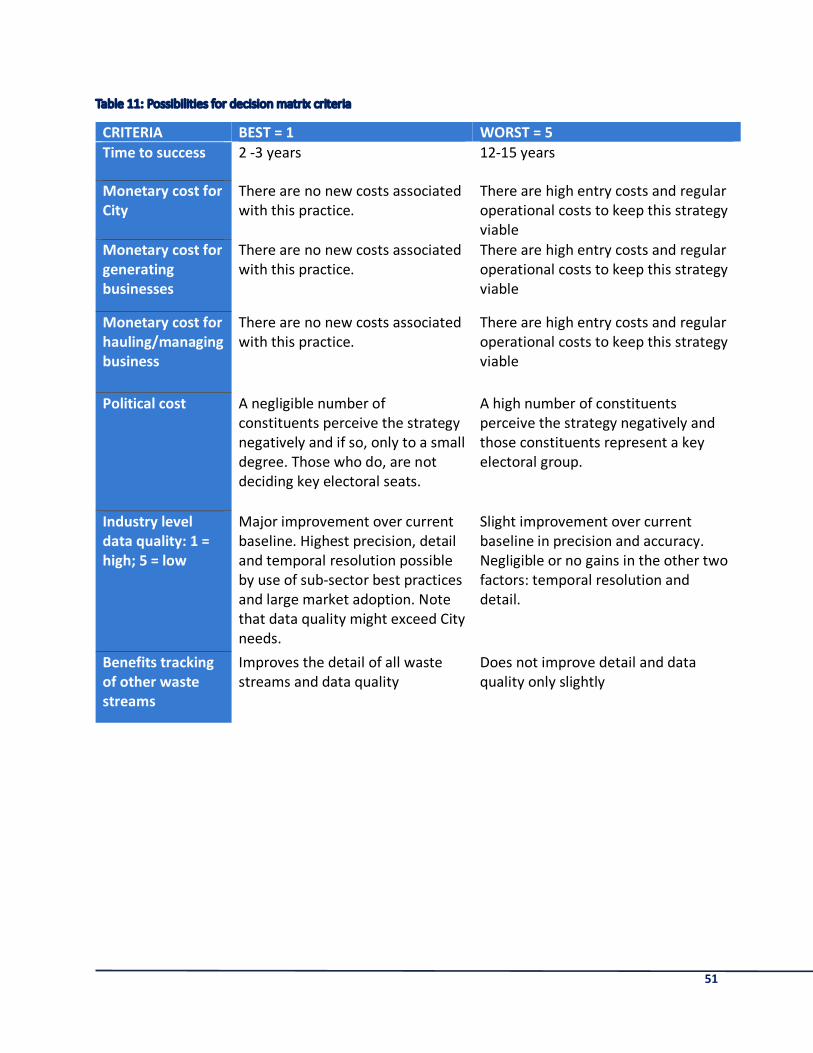
51
Table 11: Possibilities for decision matrix criteria
CRITERIA BEST = 1 WORST = 5 Time to success 2 -3 years 12-15 years
Monetary cost for City
There are no new costs associated
with this practice.
There are high entry costs and regular
operational costs to keep this strategy
viable
Monetary cost for generating businesses
There are no new costs associated
with this practice.
There are high entry costs and regular
operational costs to keep this strategy
viable
Monetary cost for hauling/managing business
There are no new costs associated
with this practice.
There are high entry costs and regular
operational costs to keep this strategy
viable
Political cost A negligible number of
constituents perceive the strategy
negatively and if so, only to a small
degree. Those who do, are not
deciding key electoral seats.
A high number of constituents
perceive the strategy negatively and
those constituents represent a key
electoral group.
Industry level data quality: 1 = high; 5 = low
Major improvement over current
baseline. Highest precision, detail
and temporal resolution possible
by use of sub-sector best practices
and large market adoption. Note
that data quality might exceed City
needs.
Slight improvement over current
baseline in precision and accuracy.
Negligible or no gains in the other two
factors: temporal resolution and
detail.
Benefits tracking of other waste streams
Improves the detail of all waste
streams and data quality
Does not improve detail and data
quality only slightly

52
Figure 14: Decision Matrix combining policies and measurement method
53
8.2 Future directions
This work is based on publicly available literature and expert interviews. There is currently no
gold standard for fostering waste measurement and reporting by the food sector. Given the
complexity of the food system and diversity in regulation, and cultural contexts worldwide, those
yet-to-be-developed theoretical gold standards would still need to be localized for use in the
Vancouver context. For that reason, the following research directions are suggested.
1. A true cost benefit analysis or environmental return on investment of the policies
proposed will be a relevant step forward in determining which approach is the most
preferable in terms of food waste measurement for the ICI, either through voluntary
agreements or through regulation. The environmental, economic and social cost of food
waste globally and in Vancouver is a terrible reality. Most measures and efforts to curtail
waste are well grounded, but additional attention should be paid to the environmental
cost of potential solutions. Technological solutions that track waste in high detail36,
deployed on a large scale could mean thousands of electronic devices being produced for
that sole purpose; the environmental impacts associated with the life cycle of electronics
and their batteries need to be juxtaposed to the environmental impacts of wasted food.
Exploring the trade-offs between precision and overall environmental and economic cost
with a full life cycle assessment methodology will yield higher certainty as to what the
optimal solution for the City’s sustainability goals are. The implementation of policies to
encourage food waste measurement and reporting are valuable in so far as the resulting
insights from the data, the ensuing total food waste reduction, and cost savings for
businesses and the City exceed the expected results under business as usual operation. A
detailed true cost benefit analysis – which clearly details how it prices environmental
externalities– is needed to back up any City decision.
2. The City should continue to build a strong working relationship with third party
organizations such as PCC, ReFED, FoodMesh, and WRAP, which have experience hosting
food waste data external to the government. As noted above this may help avoid
reluctance from ICI sector business to measure and report. Setting a strong data
governance structure and plan before engaging business is key for the process.
Establishing a relationship and supporting the Region’s FRN contract holder will also
facilitate learnings on how to leverage the FRN’s data and successes for the City’s zero
waste goals.
36 For example, LeanPath, Winnow, and similar “smart bins” in the food service sector, or hauling trucks equipped with GPS and scales in the waste management sector

54
3. Alternatively, an analysis of how additional regulation requiring the reporting of food
waste data by businesses would fit with current municipal, regional, provincial and federal
regulations would be the next step, if the desired route is mandatory reporting by waste
generating businesses and/or waste management businesses.
4. A plausible timeline37 combined with a decision tree noting explicit deadlines for when
more ambitious City interventions might need to happen to improve waste measurement
and reporting if success is not achieved with non-regulatory agreements.
5. One challenge identified in this report and highlighted by the experts interviewed at
WRAP is the difficulty in motivating SMEs with a reasonable yet compelling business case
for food waste measurement and reporting. The noted barrier is that the marginal cost of
investing in training, human resource time and availability is proportionally much higher
compared to larger businesses. The stakeholder engagement process in the City should
focus on those food sectors that are highly distributed and dominated by SME, such as
the food service sector.
6. A final suggested avenue of research, is the integration of circular economy theory and an
equity lens for the evolution of the waste management industry. Waste management is
likely to be an industry that will have to transform their business model as the objective of
the zero-waste community and a circular economy model materializes. As for the
generators of food waste, once transformation or circularity is achieved, businesses
should be able to keep their waste to very low levels or near zero and the waste tracking
industry will need to pivot as new avenues for material collection, disassembly and reuse
emerge and then become common practice. Many of the strategies proposed here will
create new jobs, but in the long term the idea is for some historic waste related jobs to
disappear or be transformed. For this reason, mapping equivalent skills to new green
jobs, and training programs when no equivalent is apparent, is a key avenue of research
for a just transition.
8.2.1 Lead by example The City recognized in the ZW2040 that leading by example within City operations and facilities is
key to drive change across Vancouver. In this report, New York City was mentioned as an example
of a jurisdiction that has mandated all city agencies to report on their waste reductions plans on
an annual basis. The City could take a step further and lead the way to be the first jurisdiction in
North America where measurement and public annual reporting of progress to achieve zero food
waste is mandated for all City facilities that have food procurement. Furthermore, given the
37 Appendix 3, presents a proposed timeline for a VA in Australia that can serve as a template to start off.

55
comprehensiveness of the ZW2040, and the many waste streams present in City facilities, leading
by measuring and reporting should not only be limited to food.
The City of Vancouver’s food procurement includes several aggregated and disaggregated streams, as follows:
• Facilities run by Arts, Culture, and Community Services (three low cost meal providers) and the Parks Board (golf courses, concession stands and community centres), which together account for about 60% of City’s food purchases by dollar value (Craig, 2014).
• Catering for meetings and events (which is disaggregated across City departments with no centralized coordination); PNE and Vancouver Civic Theatres (which primarily procure packaged snack foods and beverages); and VPD, VPL and Vancouver Fire & Rescue (which have their own governance models). Together these account for about 40% of the City’s food purchases by dollar value (Craig, 2014).
(Maji, 2019)
Measurement and reporting protocols adopted by the City should reflect the same standard that
the City would encourage businesses and institutions to adopt. This will serve as a demonstration
hub, a learning lab, and equally important, it will translate into cost savings to the city and the
taxpayers. Additionally, if the city contracts for food service with a private entity, it will be
important to work with the vendor to encourage aligned action on food waste and, optimally,
make food waste monitoring and reporting, food donation and recycling a requirement in future
contracts (Mugica et al., 2019).
9 Options for the future This report’s assessment may help inform the possible development of the City’s own data
reporting policies, incentives and protocols for Vancouver food businesses, gleaning from
multiple jurisdictions with a range of possible options that can be combined or adjusted for a
Vancouver specific approach.
Voluntary agreements: If voluntary agreements are chosen as the best option for the City’s
interests in food waste measurement by the ICI sector, then following these actions are likely to
improve their effectiveness (McCarthy, D. & Morling, 2015):
• Require robust and transparent reporting requirements (e.g. to prevent selective
disclosure and improve accountability).

56
• Require regular and credible independent (e.g. third-party) monitoring and evaluation
systems, with sector average data made publically available or data on business reporting
compliance made publically available.
• Apply sanctions for non-compliance with clear verification mechanism (e.g. revocation of
any benefits associated with scheme participation).
If the voluntary agreement has a larger goal of waste reduction38 and is not exclusive to
measurement and reporting, then establishing clearly defined and measurable targets (e.g.
quantitative and time limited) set against a clear and credible baseline assessment will likely
improve the success of the VA.
Regulation: If regulation is chosen as the best option for the City’s interests in food waste
measurement by the ICI sector, or voluntary agreements are not sufficiently effective to achieve
the ZW2040 goals due to insufficient participation from industry, low compliance with
agreements or other factors, the following considerations in the by-law design are likely to
improve their effectiveness:
• Clearly define the target group with parameters differentiated by food subsector (e.g.
based on revenue, number of employees, or surface area)
• Require robust and transparent measurement and reporting requirements (e.g. to
prevent selective disclosure and improve accountability).
• Require regular and credible monitoring and evaluation systems, with anonymized food
sub-sector data made publically available, potentially through independent (e.g. third-
party) verification.
• Apply sanctions for non-compliance with clear verification mechanism (e.g. fiscal
disincentives such as fines, revocation of business license).
• Provide or promote technological and operational support for initial entry in advance of
the by-law coming into effect (e.g. similar to the grace period of 6 months in the organics
disposal ban).
• Plan and allow for the regulation to be flexible with regards to new technologies and
standards on waste measurement and reporting.
Lead by example: Finally, in conjunction with the aforementioned recommendations for
voluntary agreements and regulation, the City can lead by example by implementing ambitious
but realistic FLW prevention and diversion measurement, reporting programs and strategies in all
City facilities and advocate for such programs to be implemented by other Cities and by other
38 Which is beyond the scope of this report, but because most evidence for VAs on waste measurement and reporting have a waste reduction goal, it is included as a consideration.
57
levels of government, i.e. Metro Vancouver, and British Columbia. Furthermore, the City could
advocate for the implementation of voluntary agreements or regulation requirements for
businesses by other cities and levels of government in order to meet Federal and international
commitments and ultimately to demonstrate best practices in establishing a common ground for
food measurement and reporting for all of the food business sector across Canada.
Data hosting: The City as an enduring and stable institution with experience hosting sensitive
information from businesses is a reliable choice with regards to hosting data. However, if the
government not only hosts the data but is also a regulator that can issue fines based on the data
collected, businesses will likely be hesitant to report. The option of a third party issuing
anonymized reports from businesses to cities or other government bodies can help avoid
concerns that submitting data could directly lead to being fined. It is key for the City to gain a
better understanding of current ICI perceptions of data sharing with government institutions and
whether local food ICI sector is already engaged in other VAs where data is collected and shared.
10 Conclusion
Given the existing and planned activities that make up the local context, Vancouver’s interest in
collecting more detailed food waste data is well timed. This report’s assessment may help inform
the possible development of the City’s own data reporting policies, incentives and protocols for
Vancouver food businesses. Gleaning a range of possible options from multiple jurisdictions has
revealed approaches that can be combined or adjusted for Vancouver’s specific context. The
results inform how the City could proceed to measure progress towards ZW2040, advance the
need for operational change within businesses, and inform adjustments in sustainability or
circular economy initiatives. Grocery retailers, manufacturers and distributors, hotels, restaurants
and institutions operating in the City and beyond will stand to benefit from engaging as soon as
possible in designing the path towards zero waste and to improve their triple bottom line.
Realizing circular economy and zero waste goals will contribute to a healthier more resilient
future for the people City of Vancouver and the planet as a whole.

58
11 References Austin Government. CHAPTER 15-6. - SOLID WASTE SERVICES. Ordinance No. 20151119-098
(2016). Austin. Retrieved from
https://library.municode.com/tx/austin/codes/code_of_ordinances?nodeId=TIT15UTRE_CH
15-6SOWASE_ART3PRSOWACOSE_DIV1GEPR_S15-6-44RERE
Bellemare, M. F., Çakir, M., Peterson, H. H., Novak, L., & Rudi, J. (2017). On the measurement of
food waste. American Journal of Agricultural Economics, 99(5), 1148–1158.
Bowman, M. (2021). Why the climate emergency demands food waste regulation. TABLE.
Retrieved from https://www.tabledebates.org/blog/why-climate-emergency-demands-food-
waste-regulation
CEC. (2021a). Why and How to Measure Food Loss and Waste: A Practical Guide - Version 2.0. Appendix A - Methods. Montreal,Canada. Retrieved from http://www.cec.org/flwm/wp-
content/themes/flwm-theme/documents/cec_flw_guide_appendix.pdf
CEC. (2021b). Why and How to Measure Food Loss and Waste: A Practical Guide - Version 2.0.
Montreal,Canada. Retrieved from http://www3.cec.org/islandora/en/item/11869-why-and-
how-measure-food-loss-and-waste-practical-guide-version-20-en.pdf
Champions 12.3. (2019). The business case for reducing food loss and waste. Retrieved August
15, 2021, from https://champions123.org/sites/default/files/2020-09/infographic-the-
business-case-for-reducing-food-loss-and-waste.jpg
City of Vancouver. (2017). ZERO WASTE 2040 Workshop Consultation Summary. Vancouver, BC.
City of Vancouver. (2018). Zero Waste 2040 - The City of Vancouver’s Zero Waste Strategic Plan.
Retrieved from https://council.vancouver.ca/20180516/documents/pspc2a.pdf
Commission for Environmental Cooperation. (n.d.). Why Measure Food Loss and Waste?
Retrieved August 15, 2021, from http://www.cec.org/flwm/checklist-item/why-measure-
food-loss-and-waste/
Dray, S. (2021). Food waste in the UK. Retrieved from https://lordslibrary.parliament.uk/food-
waste-in-the-uk/
Environment and Climate Change Canada. (2019). Taking stock: Reducing food loss and waste in Canada.
European Commission. (2018). Revised Waste Framework Directive. Retrieved from https://eur-
lex.europa.eu/eli/dir/2018/851/oj?locale=en

59
European Commission. (2019). COMMISSION DELEGATED DECISION (EU) 2019/1597. Retrieved
August 15, 2021, from https://eur-lex.europa.eu/eli/dec_del/2019/1597/oj
FAO. (2011). Global food losses and food waste – Extent, causes and prevention. Rome.
Food Innovation Australia. (2020). Establishing a Voluntary Commitment Program: Working collaboratively to halve food waste in Australia.
Gooch, M., Bucknell, D., LaPlain, D., Dent, B., Whitehead, P., Felfel, A., … Maguire, M. (2019). The Avoidable Crisis of Food Waste: Technical Report. Retrieved from
https://secondharvest.ca/research/the-avoidable-crisis-of-food-waste/
Government of the United Kingdom. (2018). Our waste, our resources: A strategy for England.
Retrieved from www.nationalarchives.gov.uk/doc/open-government-
licence/version/3/[email protected]
Greencore. (2019). Greencore Secures Innovative ‘Green’ Refinancing Facility. Retrieved August
15, 2021, from https://www.greencore.com/greencore-secures-innovative-green-
refinancing-facility/
Hanson, C., & Mitchell, P. (2017). The business case for reducing food loss and waste: A report on behalf of Champions 12.3. Washington DC.
Hanson, C. (2017). Guidance on interpreting sustainable development goal target 12.3.
Washington DC.
Hanssen, O. J. (2017). The Negotiated Agreement for prevention of edible food waste in Norway – methodologies for food waste quantification. Retrieved from
https://ec.europa.eu/food/system/files/2017-10/fw_eu-platform_20170925_sub-
fwm_pres-06.pdf
Hanssen, O. J., & Östergren, K. (2021). Presentation for the EU Expert group on Food Waste monitoring. Retrieved from https://ec.europa.eu/food/system/files/2021-07/fw_eu-
platform_20210709_fwm-webinar_pres-03.pdf
Hartikainen, H., Riipi, I., Katajajuuri, J.-M., & Silvennoinen, K. (2020). From Measurement to
Management: Food Waste in the Finnish Food Chain. In Food Waste Management (pp. 415–
439). Cham: Springer International Publishing. https://doi.org/10.1007/978-3-030-20561-
4_16
Houng, H., & Cheng, Y. W. (2013). Electronic tracking and management of industrial waste in
Taiwan. Journal of Material Cycles and Waste Management, 15(2), 146–153.
60
https://doi.org/10.1007/s10163-012-0104-7
Kawai, K., & Tasaki, T. (2016). Revisiting estimates of municipal solid waste generation per capita
and their reliability. Journal of Material Cycles and Waste Management, 18(1), 1–13.
https://doi.org/10.1007/s10163-015-0355-1
Koehler, D. A. (2007). The Effectiveness of Voluntary Environmental Programs-A Policy at a
Crossroads? Policy Studies Journal, 35(4), 689–722. https://doi.org/10.1111/j.1541-
0072.2007.00244.x
Maji, P. (2019). Estimating Greenhouse Gas Emissions from Food: A Case Study on the City of Vancouver’s Food Procurement Practices. Vancouver, BC.
McCarthy, D. & Morling, P. (2015). Using Regulation as a Last Resort: Assessing the Performance
of Voluntary Approaches. Royal Society for the Protection of Birds: Sandy, Bedfordshire.
Metro Vancouver. (2020). 2019 Biennial Report Integrated Solid Waste and Resource Management Plan.
Metro Vancouver. (2021). Metro Vancouver Food Recovery Network - Request for Porposals.
Mugica, Y., Rose, T., & Hoover, D. (2019). Tackling food waste in cities: A policy and program toolkit. Retrieved from https://www.nrdc.org/sites/default/files/food-waste-cities-policy-
toolkit-report.pdf
National Zero Wast Council, & Provision Coalition. (2019). Food Industry Leaders Commit to Tackle Food Waste in Canada.
Norway Ministry of Climate and Environment. (2017, June 28). Agreement to reduce food waste.
Retrieved August 15, 2021, from https://www.regjeringen.no/en/aktuelt/agreement-to-
reduce-food-waste/id2558931/
OECD. (2003). Voluntary Approaches for Environmental Policy. Voluntary Approaches for Environmental Policy: Effectiveness, Efficiency and Usage in Policy Mixes (Vol. 9789264101).
OECD. https://doi.org/10.1787/9789264101784-en
OECD. (2019). Chapter 4. Policy instruments for waste and materials management. In Waste Management and the Circular Economy in Selected OECD Countries (p. 210). OECD.
https://doi.org/10.1787/9789264309395-en
Papargyropoulou, E., Lozano, R., K. Steinberger, J., Wright, N., & Ujang, Z. bin. (2014). The food
waste hierarchy as a framework for the management of food surplus and food waste.
Journal of Cleaner Production, 76, 106–115. https://doi.org/10.1016/j.jclepro.2014.04.020

61
Raak, N., Symmank, C., Zahn, S., Aschemann-Witzel, J., & Rohm, H. (2017). Processing- and
product-related causes for food waste and implications for the food supply chain. Waste Management, 61, 461–472. https://doi.org/10.1016/j.wasman.2016.12.027
Riipi, I., & Hartikainen, H. (2020). Monitoring and preventing food waste at the Finnish food chain.
Singapore - National Environment Agency. (2014). Mandatory Waste Reporting. Retrieved August
15, 2021, from https://www.nea.gov.sg/our-services/waste-management/mandatory-waste-
reporting
Spang, E. S., Moreno, L. C., Pace, S. A., Achmon, Y., Donis-Gonzalez, I., Gosliner, W. A., … others.
(2019). Food loss and waste: measurement, drivers, and solutions. Annual Review of Environment and Resources, 44, 117–156.
Statistics Canada. (2016). The 10 highest population densities among municipalities (census
subdivisions) with 5,000 residents or more, Canada, 2016. Retrieved August 15, 2021, from
https://www150.statcan.gc.ca/n1/daily-quotidien/170208/t001a-eng.htm
Stats UN. (2019). IAEG-SDGs — SDG Indicators. Retrieved from https://unstats.un.org/sdgs/iaeg-
sdgs/tier-classification/
Steelman, T. A., & Rivera, J. (2006). Voluntary Environmental Programs in the United States.
Organization & Environment, 19(4), 505–526. https://doi.org/10.1177/1086026606296393
Stensgård, A. E., Prestrud, K., & Callewaert, P. (2020). Food Waste in Norway: Report on Key Figures 2015-2019. Retrieved from https://www.matvett.no/uploads/documents/OR.51.20-
Matsvinn-i-Norge-2015-2019-translated.pdf
UNEP. (2021). Food Waste Index Report 2021. Nairobi. Retrieved from
https://www.unep.org/resources/report/unep-food-waste-index-report-2021
van Beeck, N. (2007). Transferring the Dutch success of voluntary agreements with industry to
other countries. SenterNovem, 1427–1436.
WRAP. (2020a). Courtauld Commitment 2025 Annual Report. Retrieved from
https://wrap.org.uk/resources/report/courtauld-commitment-2025-annual-report-2020
WRAP. (2020b). Food Waste Reduction Roadmap Progress Report. Retrieved from
https://wrap.org.uk/resources/report/food-waste-reduction-roadmap-progress-report-2020
WRAP. (2021a). Food waste reporting guidelines for the Hospitality and Food Service sector.
Retrieved from https://wrap.org.uk/sites/default/files/2020-10/WRAP-
Food_waste_reporting_guidelines_HaFS_1_0.pdf

62
WRAP. (2021b). The Courtauld Commitment Annual Report: Shaping a sustainable recovery.
WWF-WRAP. (2020). Halving food loss and waste in the EU by 2030: the major steps needed to accelerate progress 2020.

63
12 Appendices
12.1 Appendix 1 – Legislation
This section lists verbatim examples of legislation in different jurisdictions requiring waste
reporting and waste reduction progress reporting. These examples do not represent a validation
of what should and what shouldn’t be adopted by the city but, rather facilitate access to the
language used and detail present in different examples.
Singapore
30A.—(1) The Director-General may, by notice in writing from time to time, require any owner, occupier or lessee of a work place to do all or any of the following:
(a) to furnish the Director-General with any information on the amount, type and nature of any waste produced in that work place and such other particulars as may be specified in the notice;
(b) to keep and maintain records containing such information on any waste produced in that work place as may be specified in the notice and retain those records for such period as may be specified in the notice;
(c) to submit to the Director-General any waste reduction plan for such period and containing information on the targets for waste reduction, measures to reduce waste and the progress of any waste reduction measure contained in any waste reduction plan previously submitted to the Director-General, and such other particulars relating to waste reduction, as may be specified in the notice.
(2) Any person who fails to comply with any notice under subsection (1) shall be guilty of an offence and shall be liable on conviction to a fine not exceeding $5,000 and, in the case of a second or subsequent conviction, to a fine not exceeding $10,000 or to imprisonment for a term not exceeding 3 months or to both.
Austin, Texas, US
§ 15-6-44 - REPORTING REQUIREMENTS.
A. A licensee shall maintain a list of the containers used for the collection, storage, or
disposal of solid waste that are owned or serviced by the licensee, with the customer
number and the location of each container.

64
B. A licensee shall file a quarterly report of the number of containers it services in the city. A
licensee shall submit the container fee required by this article with a report filed under
this section.
C. A licensee who provides solid waste collection service under Article 3 (Private Solid Waste Collection Service) or recycling service under Article 5 (Universal Recycling) shall file a
report with the Austin Code Department. The report shall be on a form provided by the
Austin Code Department. The report shall be filed with the Austin Code Department
semi-annually on or before the last business day in January and July of each calendar year.
Beginning with the report due in January, 2017, for the six-month reporting period that
ends December 31, 2016, the report shall contain the following information:
a. the amount in tons of solid waste, recyclables, and organic materials (but
excluding construction and demolition materials) hauled to:
i. landfills;
ii. recycling facilities; and
iii. organic materials processing facilities;
b. the amount in tons of construction and demolition materials hauled directly to:
i. landfills;
ii. recycling facilities; and
iii. organic materials processing facilities; and
c. other information required by the Austin Code Department.
Source: 1992 Code Section 12-3-83; Ord. 031204-14; Ord. 031211-11; Ord. 20101104-018; Ord. 20120628-012; Ord. No. 20151119-098, Pt. 3, 10-1-16. (Source)
Taiwan
Article 18 Taiwan Waste Disposal Act: “[…] An auditing and certification group shall perform the auditing and certification of recycling and disposal volumes for regulated recyclable waste in accordance with auditing and certification regulations; the central competent authority shall determine auditing and certification procedural regulations.
Regulated recyclable waste recycling and disposal enterprises of a certain scale or larger that are designated and officially announced by the central competent authority shall register with the competent authority and report recycling and disposal volumes and related operational circumstances. […]”
New York
Int. No. 1673 - A Local Law to amend the administrative code of the city of New York, in relation
to city agency food waste prevention plans
[…]

65
b. Agency food waste prevention plans. Every covered agency shall, no later than July 1,
2020, prepare and submit to the commissioner for approval, a food waste prevention plan. The
commissioner shall submit each approved agency food waste prevention plan to the speaker of
the council not later than seven days after such approval. Such plan shall conform to applicable
provisions of law and, at a minimum:
1. Identify surplus food that may be safely donated;
2. Identify methods to reduce the amount of surplus food;
3. Develop procedures for the safe, efficient donation of surplus food; and
4. Include any other provisions as are necessary for the reduction of surplus food and
the handling of surplus food that may be donated.
c. Food waste prevention coordinator. Upon approval of an agency’s food waste prevention
plan by the commissioner, each covered agency shall designate a coordinator to oversee
implementation of the plans required in subdivision b.
d. Report. On or before January 1, 2021 for the period between the date of enactment of
the local law that added this section through January 1, 2021, and annually thereafter for the
previous 12-month reporting period, each agency food waste prevention coordinator established
pursuant to subdivision c shall submit a report to the head of such coordinator’s respective agency
and to the commissioner. Such report shall include, at a minimum:
1. A summary of actions taken to implement the food waste prevention plan;
2. Proposed actions to be taken to implement such plan; and
3. Updates or changes to any information included in such plan.
The department shall consolidate the information contained in all reports prepared pursuant to
this subdivision and include such information as part of the department’s annual recycling report
required pursuant to subdivision k of section 16-305 of this chapter.
Europe
https://eur-lex.europa.eu/eli/dec_del/2019/1597/oj
UK
https://publications.parliament.uk/pa/bills/cbill/2015-2016/0067/cbill_2015-
20160067_en_2.htm
[…]
The food waste reduction strategy under subsection (3), and the scheme under subsection (4),
shall, amongst other things—

66
(a) set annual objectives and targets and the key indicators by which progress towards
such objectives and targets shall be measured,
(b) take into account the principles and practices of the food waste reduction hierarchy,
and
(c) include incentives for individuals, public sector bodies and private sector companies to
implement and encourage observance of the food waste reduction hierarchy, which the
Secretary of State must make provision for.
2 Food waste from large businesses
(1) In the discharge of his duty under Section 1, the Secretary of State shall by regulation require
large supermarkets, manufacturers and distributors to—
(a) reduce their food waste across their supply chains by no less than 30 per cent by
2025, from a 2016 baseline,
(b) agree an industry benchmark by the end of 2018 for measuring on-farm waste,
(c) set a target, or targets, for the reduction of on-farm waste against the benchmark
agreed under paragraph (b),
(d) make proposals for achieving a reduction of food waste by 50 per cent by 2030 from a
2016 baseline, and
(e) enter into formal agreements with food redistribution organisations within 6 months
of this Act coming into force, for the purpose of donating unsold in-date food to such
organisations.
(2) The Secretary of State may make provision about the content of the formal agreements
mentioned in subsection (1)(b) in regulations.
(3) Regulations under subsection (2) shall define—
(a) “large supermarkets, manufacturers and distributors” for the purposes
of subsection (1) and section 3(1); and
(b) “food distribution charities” for the purposes of subsection (1)(b).
(4) Before requiring that formal agreements under subsection (1)(b) are entered into, the
Secretary of State must consult relevant bodies and organisations including, but not limited to—
(a) supermarkets,
(b) food manufacturers,

67
(c) food distributors, and
(d) food redistribution organisations,
on the terms of such agreements.
3 Disclosure of levels of food waste from supermarkets and food manufacturers
(1) Large supermarkets and food manufacturers shall be required to disclose levels of food waste
in their supply chain.
(2) The Secretary of State may by regulations make provision about this requirement.
[…]
12.2 Appendix 2 – Environmental reasons to reduce waste
• Reducing food waste is the third most effective way to combat climate change (after
refrigerant management and using onshore wind turbines to generate renewable
energy)[Project Drawdown].
• GHG emissions mostly in the form of methane (CH4) from anaerobic organic waste
decomposition at the landfill site. Specific data for the City of Vancouver was not found,
but provincially, Solid Waste Disposal represents 15% of all Methane emissions and 2% of
all GHG emissions (CO2e) [Provincial GHG inventory, accessed 2021-06-08]. The
proportion of total methane emissions from Vancouver’s solid waste disposal is likely
higher because of the economic sectors active within city limits (which do not include
coal, oil and gas extraction nor agriculture).
• Reducing methane is a priority due to the urgency of the climate crisis and methane’s
contribution to the crisis as a GHG that is 25 times more potent than carbon dioxide,
reducing methane is a priority because it mitigates climate change risk faster than
reductions in carbon dioxide [IPCC AR6, and here].
• According to US-EPA, national methane emissions data and projections for the world,
Canada has the highest per capita methane emissions from Municipal Solid Waste (MSW)
of the G7 countries, and the fifth highest of both the G20 and OECD countries
[https://www.globalmethane.org/methane-emissions-data.aspx for total methane
emissions and self-calculations for per capita emissions using World Bank population
data].
• In BC, municipal landfills generate 7.5 per cent of the province's greenhouse gas
emissions, according to the province.

68
• Most of the MSW collected in Vancouver goes to the Vancouver Landfill in Delta, BC. There, landfill gas (LFG, which is 50% methane) is captured and managed through different means to avoid direct methane release to the atmosphere. However, in 2020 the proportion that was burned in on-site flares and not converted to energy or heat was at least 70%, signaling the need for more efficient use of this resource. A plan to make beneficial use of that flared gas in the coming years with two new biomethane projects with Village Farms and Fortis is intended to address this inefficiency.
• Flaring still releases carbon dioxide into the atmosphere, which is still a GHG albeit one
with less warming potential. Furthermore, the latest LFG collection efficiency estimate is
73.3% which further strengthens the argument to reduce LFG at the landfill to mitigate
the GHG emissions from organic waste streams [2020 landfill report].
• Natural resource opportunity cost of wasted organic matter which should follow the
following hierarchy:
• Better waste sorting and stream division avoids contamination of other recyclable and
reusable streams such as paper products, and cardboard

69
12.3 Appendix 3 – Potential timeline for a Voluntary Agreement
[Source]
12.4 Appendix 4 – TABLE critique of VAs in UK
Low participation rates: The UK government has had to intervene to boost signatories to the voluntary agreements. There is still particularly low coverage in the primary production and catering sectors. Of those signed up, a third have not yet provided any evidence that they are implementing any change, and nobody has disciplinary powers to punish this, creating a strong risk of free riders slowing progress. Low participation creates negative knock-on effects, as conveners keep the ambition of targets lower in an attempt to persuade reluctant businesses to join by making the targets less ambitious. For example, the RSPB has found evidence that voluntary agreements frequently set low targets and are held back by low rates of participation. Feedback has heard from several businesses that the UK’s voluntary targets to reduce food waste by 20% by 2025 under Courtauld 2025 were not set at a higher 30% level for fear that businesses would not sign up. Despite the lower target set, intervention to boost participation was still required.
Lack of transparency: Ten years since the UK’s first voluntary food waste agreement, only 60 businesses in the UK have publicly reported their food waste data (nearly all of them Tesco suppliers) – less than 10% of the businesses responsible for most of the UK’s food waste. Seven

70
years have passed since Tesco led the way by reporting its food waste figures for the first time, and sustained campaigning and threats of regulation have raised great pressure on food businesses to publish data since then. But without a level playing field, companies appear afraid or unwilling to publish their data, and progress is slow.
Slow pace of change: The rate of food waste reduction under the UK’s current voluntary commitments has been distinctly underwhelming. Between 2011-18 UK food businesses (retail, manufacturing and catering) reduced their food waste by only about 1% per year, seven years for a decrease from 3.11 to 2.88 million tonnes. The UK’s voluntary commitments set out for this to be reduced to 2.34 million tonnes by 2030 – a slightly higher ambition of about 1.5% per year reductions. It is not unreasonable to suppose that faster change might be achieved.
Exclusion of waste at primary production: Measuring food waste on farms is tough, but ignoring it is more problematic still. Current estimates indicate that more food waste and surplus probably occurs on UK farms (about 3.6 million tonnes, i.e. 7.2% of food harvested) than in retail, manufacturing and catering businesses combined. Once primary production food waste is factored in, businesses (farms, factories, retail and catering) in rich countries like the UK waste as much as households. But without data, it is locked out of UK reduction targets. Voluntary approaches have failed to get to the bottom of waste at primary production across the sector, with few producer businesses participating and little sense of progress.”