Embed Size (px)
Citation preview
Bea
con
Hill
Inst
itut
eBHI Policy Study
November 2 0 0 4
Police Details in Massachusetts:Protection or Perk?

The Beacon Hill Institute for Public Policy ResearchSuffolk University
8 Ashburton Place
Boston, MA 02108
Phone: 617-573-8750 Fax: 617-720-4272
http://www.beaconhill.org
November 2004 3 Police Details in Massachusetts
Table of Contents
Executive Summary......................................................................................................... 4Cost .............................................................................................................................. 4Safety ........................................................................................................................... 4
Introduction ...................................................................................................................... 4Data Sources and Methodology .................................................................................... 5Findings............................................................................................................................. 5
Safety ........................................................................................................................... 5Massachusetts citizens bear the burden ................................................................. 8Detail pay creates perverse incentives for police officers .................................... 8
Conclusion ........................................................................................................................ 9Appendix ........................................................................................................................ 10
Regression Results ................................................................................................... 10Hourly Rates & Administrative Costs for Extra-Paid Details ........................... 10Statistical Analysis ................................................................................................... 10Sample Letter to Police Departments ................................................................... 14Communications from the Police .......................................................................... 15Response from the Department of State Police ................................................... 16Letter from the Massachusetts Chiefs of Police Association ............................. 18
Endnotes.......................................................................................................................... 19

Police Details in Massachusetts 4 November 2004
Executive Summary
Massachusetts is the only state in which busi-nesses or governmental entities conductingprojects on local roads generally use police de-tails rather than flaggers. This practice is the re-sult of both local ordinances and the exercise ofdiscretion by local police officials empowered torequire the use of police details in work zones.
The system is both unique and expensive. Criticsargue that the practice of requiring police detailsinflates costs to businesses and taxpayers, whilesupporters argue that it improves public safety.Calls for reforms to the system have faced strongopposition from police departments. To date,however, no hard figures have been available toaid in the issue, and both sides have relied heavilyon anecdotal evidence.
Using regression analysis on data provided by 103police departments around the state, we have es-timated the cost of police details for Massachu-setts and assessed the argument that police de-tails increase public safety. We find that the po-lice details are unnecessarily costly and that thereis no evidence that public safety benefits from theunnecessary costs that they impose.
Cost
· Police officers in Massachusetts citiesand towns earned an estimated $141.4million working off-duty details in2003. Of this amount, officers work-ing traffic assignments received ap-proximately $93.3 million. This esti-mate applies to local police only. Itexcludes detail pay earned by statepolice officers.
· The users of police details includepublic utilities, local government, realestate developers and entertainmentvenues such as Six Flags New En-gland. Police details usually provideeither security or traffic control ser-vices. Both services could be pro-vided more cheaply by civilian per-sonnel. We limit our attention here topolice details hired to control trafficin work zones other than highwaywork zones. The use of civilian flaggersin these work zones would have savedMassachusetts businesses and taxpayers$36.5 to $66.5 million last year.
Safety
In Massachusetts, cities and towns generallyrequire police details to control traffic inwork zones on local roads. The other 49states allow civilian flaggers, rather than uni-formed police officers, to handle much of thistraffic. If police details increase traffic safety,it should be possible to find supporting evi-dence in traffic-accident data. Massachusettsshould be a safer place to drive, as measuredby data relating to accident rates.
To the end of determining whether this is infact true, we examined data on propertydamage and bodily injury claims resultingfrom automobile accidents for the 50 statesand for 16 metropolitan areas, includingBoston.
These data show that by two measures, Mas-sachusetts is not safer than other states butis, in fact, the least safe state in which todrive. Specifically:
· Massachusetts has the worst acci-dent rate in the nation, as measuredby accidents causing property dam-age.
· It has the second worst accident ratein the nation, as measured by acci-dents causing bodily injury.
· Accident rates are higher in Bostonthan in 15 comparable metropolitanareas that do not ordinarily use po-lice details in work zones.
These findings are all statistically significant.On the basis of all the available evidence, wemust conclude that police details, used inwork zones on local roads, do not improvetraffic safety but do add substantially to con-struction costs and other costs.
Introduction
The presence of a police car at road construc-tion and other worksites is a familiar sightin Massachusetts. But this practice has en-gendered growing controversy over the pastdecade. Opponents contend that the use ofpolice officers is unnecessarily expensive andincreases costs to both private and publicprojects. Supporters of police details, gen-erally the police unions and patrolmen’s as-
November 2004 5 Police Details in Massachusetts
sociations, argue that the presence of a policeofficer ensures that motorists obey the postedspeed limits, and thus increases safety for work-ers and motorists alike. In order to investigatethe arguments for both sides, one needs to get ahandle on the cost of the current system and onthe data pertaining to traffic safety.
BHI has analyzed the cost of police details inMassachusetts and state and city accident ratesin order to illuminate the safety issue. In whatfollows, we report our data, methodology andfindings.
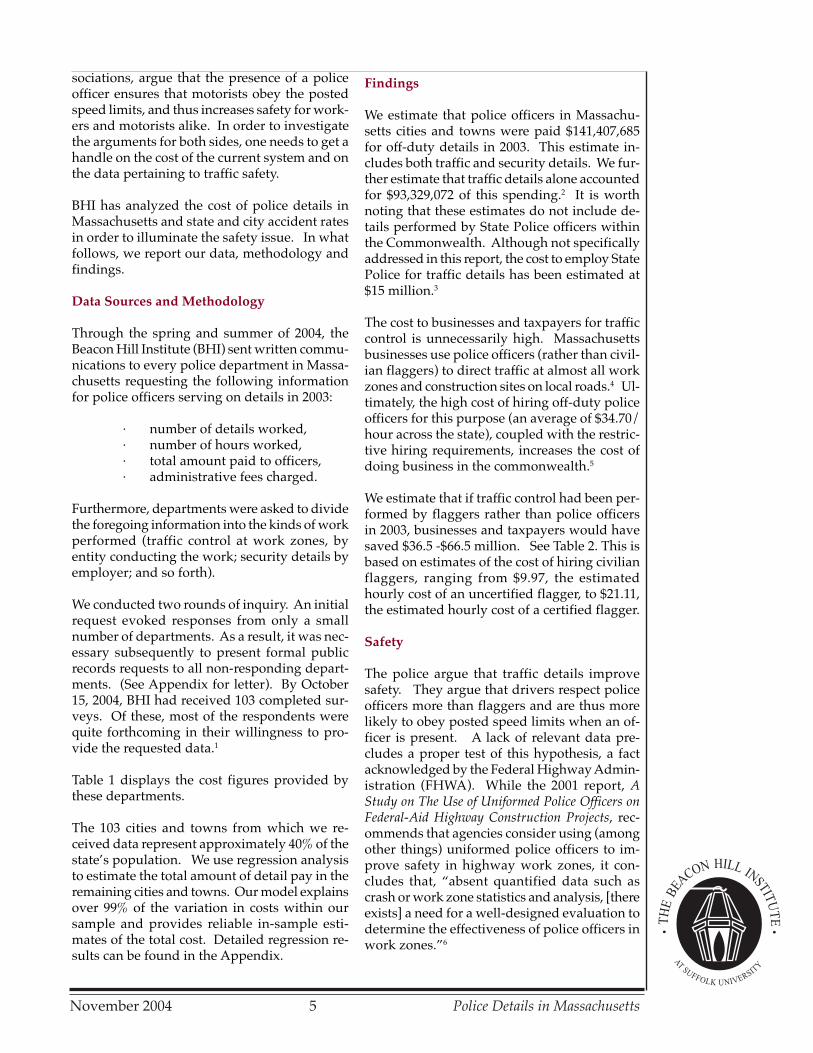
Data Sources and Methodology
Through the spring and summer of 2004, theBeacon Hill Institute (BHI) sent written commu-nications to every police department in Massa-chusetts requesting the following informationfor police officers serving on details in 2003:
· number of details worked,· number of hours worked,· total amount paid to officers,· administrative fees charged.
Furthermore, departments were asked to dividethe foregoing information into the kinds of workperformed (traffic control at work zones, byentity conducting the work; security details byemployer; and so forth).
We conducted two rounds of inquiry. An initialrequest evoked responses from only a smallnumber of departments. As a result, it was nec-essary subsequently to present formal publicrecords requests to all non-responding depart-ments. (See Appendix for letter). By October15, 2004, BHI had received 103 completed sur-veys. Of these, most of the respondents werequite forthcoming in their willingness to pro-vide the requested data.1
Table 1 displays the cost figures provided bythese departments.
The 103 cities and towns from which we re-ceived data represent approximately 40% of thestate’s population. We use regression analysisto estimate the total amount of detail pay in theremaining cities and towns. Our model explainsover 99% of the variation in costs within oursample and provides reliable in-sample esti-mates of the total cost. Detailed regression re-sults can be found in the Appendix.
Findings
We estimate that police officers in Massachu-setts cities and towns were paid $141,407,685for off-duty details in 2003. This estimate in-cludes both traffic and security details. We fur-ther estimate that traffic details alone accountedfor $93,329,072 of this spending.2 It is worthnoting that these estimates do not include de-tails performed by State Police officers withinthe Commonwealth. Although not specificallyaddressed in this report, the cost to employ StatePolice for traffic details has been estimated at$15 million.3
The cost to businesses and taxpayers for trafficcontrol is unnecessarily high. Massachusettsbusinesses use police officers (rather than civil-ian flaggers) to direct traffic at almost all workzones and construction sites on local roads.4 Ul-timately, the high cost of hiring off-duty policeofficers for this purpose (an average of $34.70/hour across the state), coupled with the restric-tive hiring requirements, increases the cost ofdoing business in the commonwealth.5
We estimate that if traffic control had been per-formed by flaggers rather than police officersin 2003, businesses and taxpayers would havesaved $36.5 -$66.5 million. See Table 2. This isbased on estimates of the cost of hiring civilianflaggers, ranging from $9.97, the estimatedhourly cost of an uncertified flagger, to $21.11,the estimated hourly cost of a certified flagger.
Safety
The police argue that traffic details improvesafety. They argue that drivers respect policeofficers more than flaggers and are thus morelikely to obey posted speed limits when an of-ficer is present. A lack of relevant data pre-cludes a proper test of this hypothesis, a factacknowledged by the Federal Highway Admin-istration (FHWA). While the 2001 report, AStudy on The Use of Uniformed Police Officers onFederal-Aid Highway Construction Projects, rec-ommends that agencies consider using (amongother things) uniformed police officers to im-prove safety in highway work zones, it con-cludes that, “absent quantified data such ascrash or work zone statistics and analysis, [thereexists] a need for a well-designed evaluation todetermine the effectiveness of police officers inwork zones.”6

Police Details in Massachusetts 6 November 2004
Table 1: Total Amount Paid to Officers, 2003, Cities and Towns Responding to BHI Inquiry
Police Department Amount Paidto Officers, $ Police Department Amount Paid
to Officers, $
Acushnet 77,752 Leyden 465Agawam 392,357 Longmeadow 32,742Andover 1,225,319 Lynn 1,734,791Arlington 782,550 Manchester-by-the-Sea 222,930
Ashburnham 63,144 Marion 78,370Ashland 387,020 Marlborough 674,727Athol 39,819 Mashpee 233,043Ayer 137,401 Medfield 162,218Barnstable 663,485 Medford 1,376,610Belchertown 93,130 Medway 189,649Bellingham 530,843 Melrose 524,631Berkley 18,870 Merrimac 64,434
Berlin 79,220 Millville 2,503Beverly 661,826 Natick 385,464Billerica 219,700 New Bedford 1,533,448Bolton 84,016 New Braintree 1,440Boston 26,300,000 Newbury 35,403Bourne 208,075 Newburyport 334,662Boxborough 93,300 Northampton 419,950Boxford 234,517 Norwood 485,031
Brewster 97,311 Oak Bluffs 66,856Brookline 1,662,496 Oxford 93,308Burlington 961,987 Peabody 490,943Cambridge 4,027,356 Pembroke 294,555Charlemont 33,212 Peru 1,936Charlton 256,656 Rehoboth 80,395Chelsea 643,839 Royalston 29,472Chilmark 20,352 Rutland 26,478Clarksburg 5,086 Sandwich 146,601
Clinton 340,000 Scituate 198,000Concord 400,000 Shelburne 10,040Dracut 407,886 Somerset 380,135East Brookfield 20,981 Southbridge 62,142Edgartown 28,925 Springfield 3,900,000Essex 280,212 Stow 93,284Fairhaven 214,178 Sturbridge 68,351Franklin 333,585 Swampscott 317,948
Gloucester 896,000 Swansea 210,651Groton 19,678 Templeton 89,798Groveland 207,760 Topsfield 211,097Hamilton 149,836 Wakefield 360,000Hampden 34,665 Walpole 362,319Hanson 73,797 Ware 75,000Hatfield 16,830 Webster 85,750
Holbrook 216,050 Wellfleet 100,773Holden 419,368 West Newbury 96,102Holliston 118,252 Westborough 254,705Holyoke 732,949 Westfield 528,800Hopedale 101,678 Westwood 250,543Hopkinton 317,652 Winchendon 133,884Ipswich 170,404 Yarmouth 376,135
Leverett 4,605
November 2004 7 Police Details in Massachusetts
Table 3: Mean Property Damage Claims (per 100 insured cars), 1980-2000
Alabama 3.517 Louisiana 4.462 Ohio 4.283
Alaska 4.117 Maine 3.784 Oklahoma 3.985
Arizona 4.066 Maryland 4.686 Oregon 3.913
Arkansas 3.748 Massachusetts 7.362 Pennsylvania 4.086
California 4.316 Michigan 4.123 Rhode Island 4.935
Colorado 3.822 Minnesota 3.950 South Carolina 3.964
Connecticut 4.960 Mississippi 3.413 South Dakota 3.451
Delaware 4.111 Missouri 4.750 Tennessee 3.938
Florida 3.942 Montana 3.338 Texas 4.841
Georgia 4.265 Nebraska 4.032 Utah 4.240
Hawaii 3.874 Nevada 4.042 Vermont 3.738
Idaho 3.447 New Hampshire 4.504 Virginia 3.989
Illinois 4.566 New Jersey 4.378 Washington 3.980
Indiana 4.348 New Mexico 3.634 West Virginia 3.850
Iowa 4.003 New York 5.123 Wisconsin 3.846
Kansas 4.092 North Carolina 3.612 Wyoming 3.045
Kentucky 4.075 North Dakota 3.542
Source: Insurance Research Council
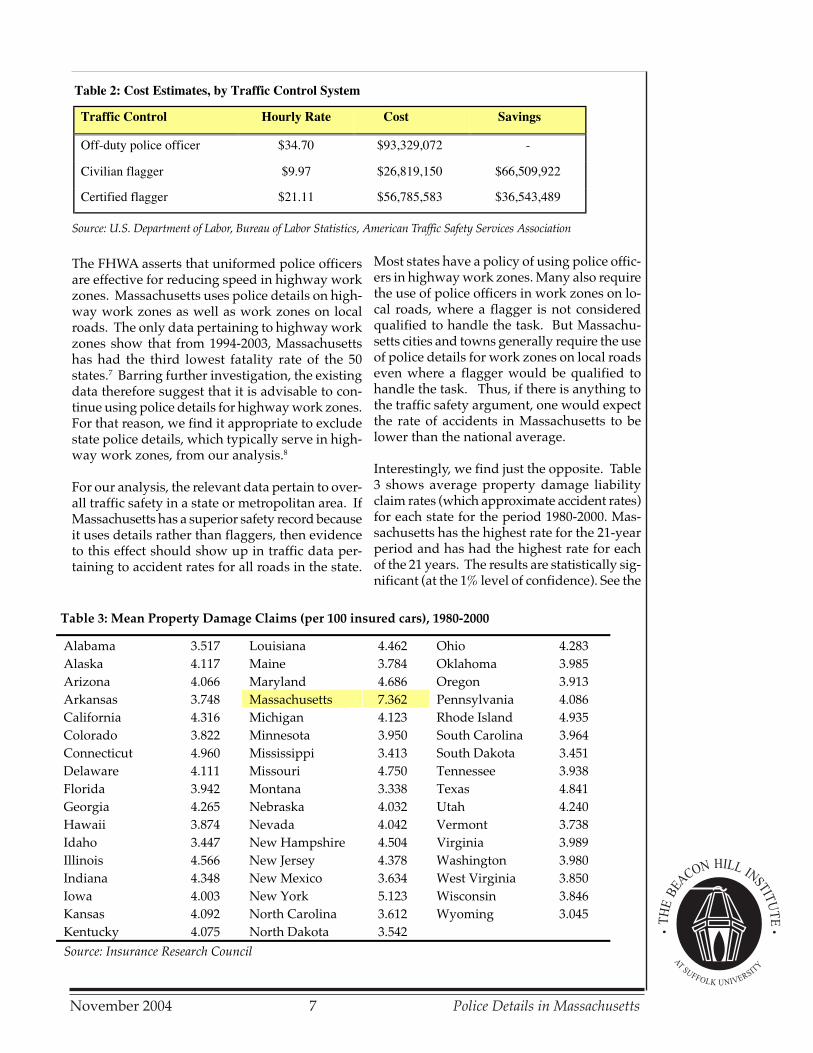
The FHWA asserts that uniformed police officersare effective for reducing speed in highway workzones. Massachusetts uses police details on high-way work zones as well as work zones on localroads. The only data pertaining to highway workzones show that from 1994-2003, Massachusettshas had the third lowest fatality rate of the 50states.7 Barring further investigation, the existingdata therefore suggest that it is advisable to con-tinue using police details for highway work zones.For that reason, we find it appropriate to excludestate police details, which typically serve in high-way work zones, from our analysis.8
For our analysis, the relevant data pertain to over-all traffic safety in a state or metropolitan area. IfMassachusetts has a superior safety record becauseit uses details rather than flaggers, then evidenceto this effect should show up in traffic data per-taining to accident rates for all roads in the state.
Most states have a policy of using police offic-ers in highway work zones. Many also requirethe use of police officers in work zones on lo-cal roads, where a flagger is not consideredqualified to handle the task. But Massachu-setts cities and towns generally require the useof police details for work zones on local roadseven where a flagger would be qualified tohandle the task. Thus, if there is anything tothe traffic safety argument, one would expectthe rate of accidents in Massachusetts to belower than the national average.
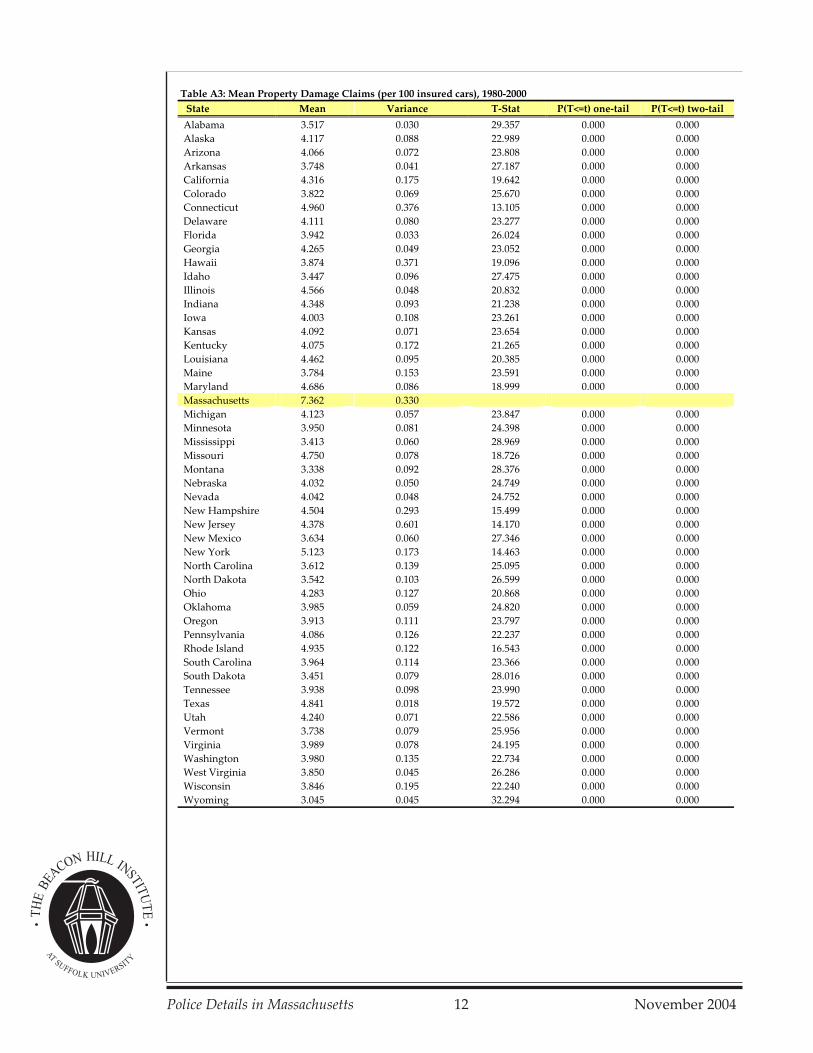
Interestingly, we find just the opposite. Table3 shows average property damage liabilityclaim rates (which approximate accident rates)for each state for the period 1980-2000. Mas-sachusetts has the highest rate for the 21-yearperiod and has had the highest rate for eachof the 21 years. The results are statistically sig-nificant (at the 1% level of confidence). See the
Source: U.S. Department of Labor, Bureau of Labor Statistics, American Traffic Safety Services Association
Table 2: Cost Estimates, by Traffic Control System
Traffic Control Hourly Rate Cost Savings
Off-duty police officer $34.70 $93,329,072 -
Civilian flagger $9.97 $26,819,150 $66,509,922
Certified flagger $21.11 $56,785,583 $36,543,489

Police Details in Massachusetts 8 November 2004
Appendix for a detailed explanation of ourstatistical analysis.
Another indicator is the frequency of autoinjury claims for bodily injury liability. Thenational average over the period 1980-2000stood at 1.06; Massachusetts ranks behindonly California with a rate of 1.87 claims per100 insured cars (the difference is not statis-tically significant).
Finally, we can compare Boston with othermajor metropolitan areas for one more indi-cator of whether police details improvesafety. See Table 5. Boston has the highestfrequency of bodily injury (BI) and propertydamage (PD) claims among 16 comparablemetropolitan areas.
These data do not prove that Massachusettspolice details decrease safety. All we can in-fer is that there is no evidence to suggest thatusing police details in work zones on localroads in Massachusetts contributes to safety.
The implications of this analysis are signifi-cant. Massachusetts spends $37-$67 milliondollars per year just to have police detailsrather than flaggers handle work-zone traf-fic. The safety record suggests that the stateis receiving a poor return on its investment.
Massachusetts citizens bear the burden
It has been argued that the excess cost of po-lice details is inconsequential to Massachu-setts residents because they are not paid forwith tax dollars. This argument isunpersuasive. While it is true that details arecommonly required by private companies likeVerizon, Keyspan, or Comcast and thus, notpaid directly by taxpayers, this excess cost ispassed on to consumers in terms of higherutility bills. Or it reduces the funds availableto these utilities to invest in infrastructure. In-terestingly, an official of the MassachusettsPolice Association (MPA) has made this verypoint. James Machado, legislative director forthe MPA, agreed that replacing police offic-ers with civilian flaggers could save consum-ers on their utility bills.9
Detail pay creates perverse incentives forpolice officers
Detail pay is such a lucrative deal for policeofficers in Massachusetts that they have cometo rely on them as part of their salary. Forinstance, Robert Gariepy of the Haverhill Po-lice Department claims that, “Without thoseprivate jobs…I don’t know how officerswould be able to have a moderate standard
Table 4: Mean Bodily Injury Claims (per 100 insured cars), 1980-2000
Alabama 0.743 Louisiana 1.804 Ohio 1.053
Alaska 0.821 Maine 0.801 Oklahoma 1.207
Arizona 1.575 Maryland 1.464 Oregon 1.203
Arkansas 1.024 Massachusetts 1.870 Pennsylvania 0.656
California 1.944 Michigan 0.272 Rhode Island 1.557
Colorado 0.376 Minnesota 0.365 South Carolina 1.518
Connecticut 0.965 Mississippi 0.982 South Dakota 0.532
Delaware 0.968 Missouri 1.141 Tennessee 0.948
Florida 0.623 Montana 0.724 Texas 1.327
Georgia 0.976 Nebraska 0.710 Utah 0.790
Hawaii 0.344 Nevada 1.505 Vermont 0.669
Idaho 0.798 New Hampshire 1.112 Virginia 1.069
Illinois 1.226 New Jersey 0.991 Washington 1.235
Indiana 0.924 New Mexico 1.125 West Virginia 0.853
Iowa 0.698 New York 0.678 Wisconsin 0.955
Kansas 0.361 North Carolina 1.136 Wyoming 0.506
Kentucky 0.468 North Dakota 0.186
Source: Insurance Research Council

November 2004 9 Police Details in Massachusetts
Table 5: Mean BI and PD Claim Rates, Metro Areas, 1995-1997
City BI Frequency PD Frequency
Boston 5.494 10.571
West Roxbury 2.399 7.398
Roslindale 5.853 10.924
Jamaica Plain 6.089 10.300
Hyde Park 6.375 10.562
Dorchester 9.157 12.889
Roxbury 11.068 14.346
Boston Central 3.611 8.492
Brighton 3.395 10.929
South Boston 3.662 9.689
Charlestown, East Boston 4.501 11.227
Buffalo 0.843 7.371
Charlotte 2.844 5.580
Cincinnati 1.517 5.405
Columbus 1.560 5.437
Denver 0.767 6.084
Hartford 2.230 5.426
Jersey City 2.907 4.964
Miami 1.753 5.043
Paterson 3.768 4.980
Philadelphia 2.742 4.921
Pittsburgh 0.964 6.010
Portland, Oregon 2.430 5.470
Providence 4.043 7.472
San Francisco 1.781 5.262
Washington, D.C. 2.517 6.196
of living. They just don’t make enough money.”10
Detail assignments have become a sort of entitle-ment program by which police officers supple-ment their base salaries.
Because police officers have come to rely heavilyon detail pay, the danger exists that a policeofficer’s priorities may be altered and job per-formance may suffer. In 1996, the Boston Globereported that the lure of lucrative details hoursled many state troopers to work over 100 hoursa week. One sergeant, for instance, was only off-duty for 6 1/2 hours during a 118-hour stretch.11
While one could hardly blame a police officerfor working long hours to earn valuable detailpay, the system may also lead to less savory be-havior as well. In 1998, a Boston Globe investi-gation learned that hundreds of officers hadworked details on the same days they had calledin sick or injured for regular shifts. These offic-ers thus earned sick pay in addition to detail pay.
Another Globe report, in October 2000, re-vealed that 20 officers had worked private de-tails on the same days they skipped out oncourt dates, resulting in the dismissal of crimi-nal cases.12
Conclusion
While other states generally rely on flaggersto staff residential work zone traffic assign-ments, cities and towns in Massachusetts con-tinue with the costly practice of hiring off-dutypolice officers for traffic details. If ended,Commonwealth businesses and residentswould save $37-$67 million annually. The evi-dence for change is compelling; what remainsto be seen, is whether the political will to fa-cilitate change exists in Massachusetts. Adecision to end police details used in workzones on local roads would end what amountsto a generous giveaway to local police, at noloss in protection aimed at traffic safety.

Police Details in Massachusetts 10 November 2004
Appendix
Regression Results
We estimate the total amount paid to police of-ficers in each town using regression analysis. Thedependent variable in our model is the amountpaid police officers in 2003, as reported by eachdepartment. As independent variables we usepopulation and population-squared. Squaringthe population variable adjusts for the fact thatthe volume of detail work rises more than in pro-portion with local population. Our overall modelis significant at the 1% level, as are both our in-dependent variables. Table A1 below summa-rizes the regression results.
Our model has strong predictive powers. It ex-plains over 99% of the variation in the amountpaid to police officers in the sample and providesaccurate in-sample estimates.
Hourly Rates & Administrative Costs for Extra-Paid Details
To approximate the cost saving that would resultfrom the elimination of police details, we com-pared the average wage paid to flaggers with theweighted average of effective hourly rates ob-served in our sample. There is, however, the po-tential for additional saving beyond this wagegap, though the magnitude of this saving is not
clear. Most towns charge private firms anadministrative fee [typically 10%] in addi-tion to the detail officer’s wage. Thus, hir-ing a police detail at $35/hour, for instance,will actually cost the hiring firm $38.50/hour. If one assumes that a firm now usingpolice details would allow current staff tohandle flagging, the administrative fee iszero. However, if the firm hired flaggerswho are not currently on staff, there wouldbe some additional administrative expense.We have chosen to assume zero savings inadministrative costs and thus to err in thedirection of underestimating the cost savingfrom hiring flaggers.
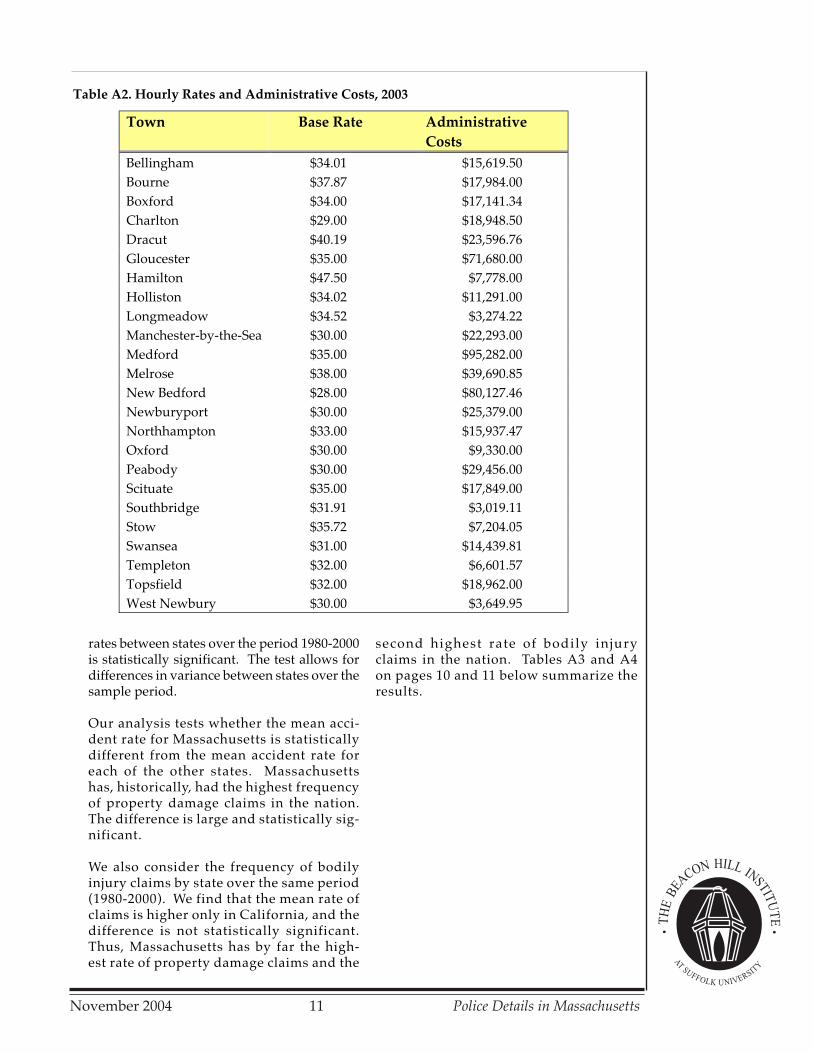
For illustrative purposes, we provide TableA2 below which summarizes the hourlyrates and administrative costs for a sub-sample of our dataset.
It is important to note that administrativecosts are paid to the localities (and not to po-lice departments). Details performed onpublic projects are not subject to the 10% ad-ministrative charge, so the costs illustratedin Table A2 are born entirely by private busi-nesses.
Statistical Analysis
Our statistical analysis of mean accidentrates between states involves a two-samplet-test. The t-test can be used to determinewhether two sample means are equal. In thiscase, we test whether differences in accident
Table A1: Regression Results
Dependent Variable Detail Cost
Number of observations 103
F(2,98) 6025.8
Prob > F 0.000
R-squared 0.9917
Adj R-squared 0.9915
Root MSE 250,000
Independent Variable Coefficient Standard Error t P-value
Population 18.27407 .9493051 19.25 0.000
Population-Squared 0.0000448 0.0000 24.83 0.000
November 2004 11 Police Details in Massachusetts
Table A2. Hourly Rates and Administrative Costs, 2003
Town Base Rate Administrative
Costs
Bellingham $34.01 $15,619.50
Bourne $37.87 $17,984.00
Boxford $34.00 $17,141.34
Charlton $29.00 $18,948.50
Dracut $40.19 $23,596.76
Gloucester $35.00 $71,680.00
Hamilton $47.50 $7,778.00
Holliston $34.02 $11,291.00
Longmeadow $34.52 $3,274.22
Manchester-by-the-Sea $30.00 $22,293.00
Medford $35.00 $95,282.00
Melrose $38.00 $39,690.85
New Bedford $28.00 $80,127.46
Newburyport $30.00 $25,379.00
Northhampton $33.00 $15,937.47
Oxford $30.00 $9,330.00
Peabody $30.00 $29,456.00
Scituate $35.00 $17,849.00
Southbridge $31.91 $3,019.11
Stow $35.72 $7,204.05
Swansea $31.00 $14,439.81
Templeton $32.00 $6,601.57
Topsfield $32.00 $18,962.00
West Newbury $30.00 $3,649.95
rates between states over the period 1980-2000is statistically significant. The test allows fordifferences in variance between states over thesample period.
Our analysis tests whether the mean acci-dent rate for Massachusetts is statisticallydifferent from the mean accident rate foreach of the other states. Massachusettshas, historically, had the highest frequencyof property damage claims in the nation.The difference is large and statistically sig-nificant.
We also consider the frequency of bodilyinjury claims by state over the same period(1980-2000). We find that the mean rate ofclaims is higher only in California, and thedifference is not statistically significant.Thus, Massachusetts has by far the high-est rate of property damage claims and the
second highest rate of bodily injuryclaims in the nation. Tables A3 and A4on pages 10 and 11 below summarize theresults.
Police Details in Massachusetts 12 November 2004
Table A3: Mean Property Damage Claims (per 100 insured cars), 1980-2000
State Mean Variance T-Stat P(T<=t) one-tail P(T<=t) two-tail
Alabama 3.517 0.030 29.357 0.000 0.000
Alaska 4.117 0.088 22.989 0.000 0.000
Arizona 4.066 0.072 23.808 0.000 0.000
Arkansas 3.748 0.041 27.187 0.000 0.000
California 4.316 0.175 19.642 0.000 0.000
Colorado 3.822 0.069 25.670 0.000 0.000
Connecticut 4.960 0.376 13.105 0.000 0.000
Delaware 4.111 0.080 23.277 0.000 0.000
Florida 3.942 0.033 26.024 0.000 0.000
Georgia 4.265 0.049 23.052 0.000 0.000
Hawaii 3.874 0.371 19.096 0.000 0.000
Idaho 3.447 0.096 27.475 0.000 0.000
Illinois 4.566 0.048 20.832 0.000 0.000
Indiana 4.348 0.093 21.238 0.000 0.000
Iowa 4.003 0.108 23.261 0.000 0.000
Kansas 4.092 0.071 23.654 0.000 0.000
Kentucky 4.075 0.172 21.265 0.000 0.000
Louisiana 4.462 0.095 20.385 0.000 0.000
Maine 3.784 0.153 23.591 0.000 0.000
Maryland 4.686 0.086 18.999 0.000 0.000
Massachusetts 7.362 0.330
Michigan 4.123 0.057 23.847 0.000 0.000
Minnesota 3.950 0.081 24.398 0.000 0.000
Mississippi 3.413 0.060 28.969 0.000 0.000
Missouri 4.750 0.078 18.726 0.000 0.000
Montana 3.338 0.092 28.376 0.000 0.000
Nebraska 4.032 0.050 24.749 0.000 0.000
Nevada 4.042 0.048 24.752 0.000 0.000
New Hampshire 4.504 0.293 15.499 0.000 0.000
New Jersey 4.378 0.601 14.170 0.000 0.000
New Mexico 3.634 0.060 27.346 0.000 0.000
New York 5.123 0.173 14.463 0.000 0.000
North Carolina 3.612 0.139 25.095 0.000 0.000
North Dakota 3.542 0.103 26.599 0.000 0.000
Ohio 4.283 0.127 20.868 0.000 0.000
Oklahoma 3.985 0.059 24.820 0.000 0.000
Oregon 3.913 0.111 23.797 0.000 0.000
Pennsylvania 4.086 0.126 22.237 0.000 0.000
Rhode Island 4.935 0.122 16.543 0.000 0.000
South Carolina 3.964 0.114 23.366 0.000 0.000
South Dakota 3.451 0.079 28.016 0.000 0.000
Tennessee 3.938 0.098 23.990 0.000 0.000
Texas 4.841 0.018 19.572 0.000 0.000
Utah 4.240 0.071 22.586 0.000 0.000
Vermont 3.738 0.079 25.956 0.000 0.000
Virginia 3.989 0.078 24.195 0.000 0.000
Washington 3.980 0.135 22.734 0.000 0.000
West Virginia 3.850 0.045 26.286 0.000 0.000
Wisconsin 3.846 0.195 22.240 0.000 0.000
Wyoming 3.045 0.045 32.294 0.000 0.000

November 2004 13 Police Details in Massachusetts
Table A4: Mean Bodily Injury Claims (per 100 insured cars), 1980-2000
State Mean Variance T-Stat P(T<=t) one-tail P(T<=t) two-tail
Alabama 0.743 0.010 12.776 0.000 0.000
Alaska 0.821 0.010 11.881 0.000 0.000
Arizona 1.575 0.027 3.176 0.002 0.004
Arkansas 1.024 0.037 8.888 0.000 0.000
California 1.944 0.118 -0.651 0.260 0.519
Colorado 0.376 0.003 17.313 0.000 0.000
Connecticut 0.965 0.091 8.388 0.000 0.000
Delaware 0.968 0.053 9.098 0.000 0.000
Florida 0.623 0.028 13.391 0.000 0.000
Georgia 0.976 0.140 7.553 0.000 0.000
Hawaii 0.344 0.008 17.371 0.000 0.000
Idaho 0.798 0.005 12.317 0.000 0.000
Illinois 1.226 0.007 7.366 0.000 0.000
Indiana 0.924 0.021 10.371 0.000 0.000
Iowa 0.698 0.004 13.523 0.000 0.000
Kansas 0.361 0.001 17.598 0.000 0.000
Kentucky 0.468 0.028 15.072 0.000 0.000
Louisiana 1.804 0.059 0.652 0.259 0.519
Maine 0.801 0.003 12.376 0.000 0.000
Maryland 1.464 0.017 4.491 0.000 0.000
Massachusetts 1.870 0.154
Michigan 0.272 0.001 18.604 0.000 0.000
Minnesota 0.365 0.004 17.365 0.000 0.000
Mississippi 0.982 0.011 10.027 0.000 0.000
Missouri 1.141 0.014 8.166 0.000 0.000
Montana 0.724 0.008 13.039 0.000 0.000
Nebraska 0.710 0.009 13.165 0.000 0.000
Nevada 1.505 0.085 3.420 0.001 0.002
New Hampshire 1.112 0.010 8.496 0.000 0.000
New Jersey 0.991 0.065 8.605 0.000 0.000
New Mexico 1.125 0.023 8.113 0.000 0.000
New York 0.678 0.010 13.511 0.000 0.000
North Carolina 1.136 0.007 8.388 0.000 0.000
North Dakota 0.186 0.001 19.651 0.000 0.000
Ohio 1.053 0.004 9.436 0.000 0.000
Oklahoma 1.207 0.066 6.480 0.000 0.000
Oregon 1.203 0.022 7.285 0.000 0.000
Pennsylvania 0.656 0.021 13.308 0.000 0.000
Rhode Island 1.557 0.031 3.332 0.001 0.002
South Carolina 1.518 0.023 3.829 0.000 0.001
South Dakota 0.532 0.013 15.025 0.000 0.000
Tennessee 0.948 0.002 10.685 0.000 0.000
Texas 1.327 0.146 4.550 0.000 0.000
Utah 0.790 0.020 11.867 0.000 0.000
Vermont 0.669 0.007 13.722 0.000 0.000
Virginia 1.069 0.003 9.258 0.000 0.000
Washington 1.235 0.025 6.889 0.000 0.000
West Virginia 0.853 0.037 10.655 0.000 0.000
Wisconsin 0.955 0.005 10.525 0.000 0.000
Wyoming 0.506 0.005 15.670 0.000 0.000
Police Details in Massachusetts 14 November 2004
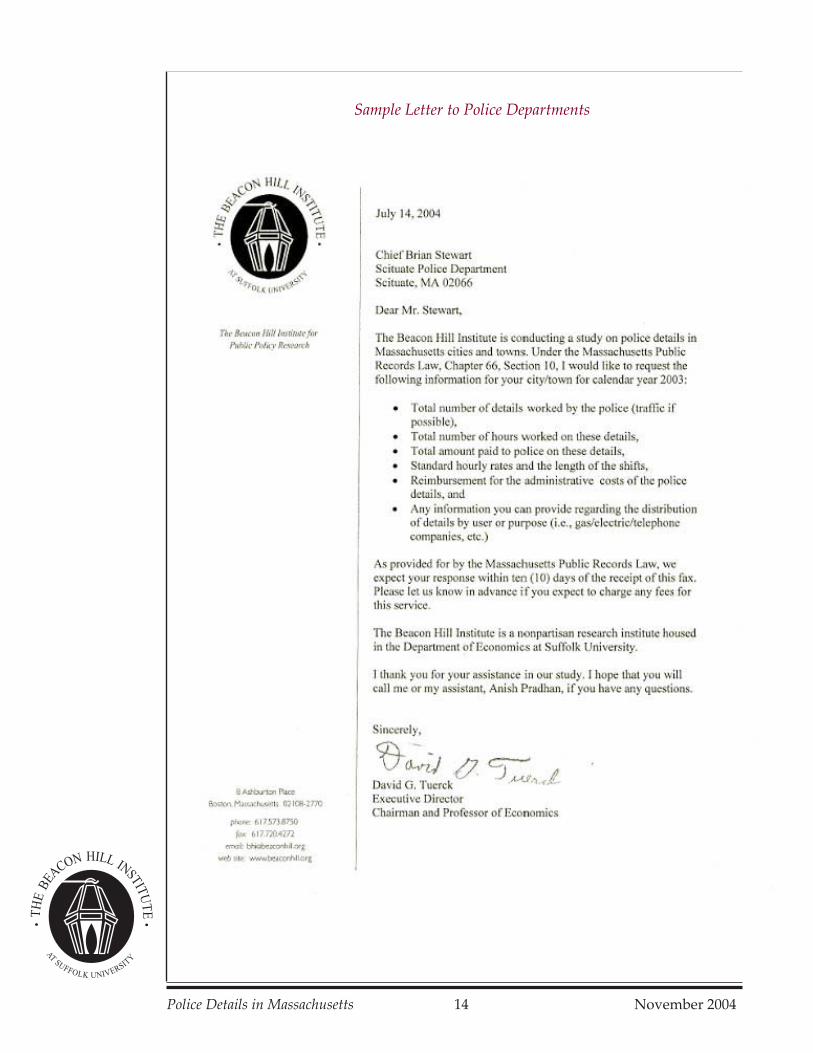
Sample Letter to Police Departments
November 2004 15 Police Details in Massachusetts
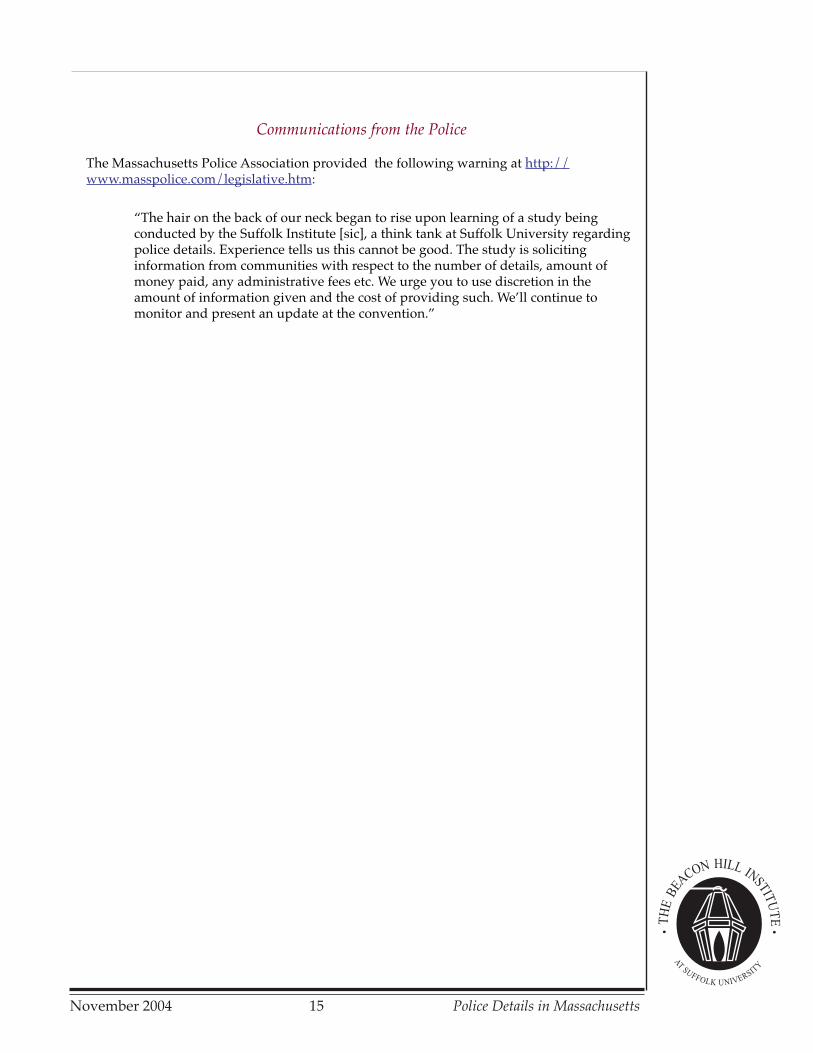
Communications from the Police
The Massachusetts Police Association provided the following warning at http://www.masspolice.com/legislative.htm:
“The hair on the back of our neck began to rise upon learning of a study beingconducted by the Suffolk Institute [sic], a think tank at Suffolk University regardingpolice details. Experience tells us this cannot be good. The study is solicitinginformation from communities with respect to the number of details, amount ofmoney paid, any administrative fees etc. We urge you to use discretion in theamount of information given and the cost of providing such. We’ll continue tomonitor and present an update at the convention.”

Police Details in Massachusetts 16 November 2004
Response from the Department of State Police
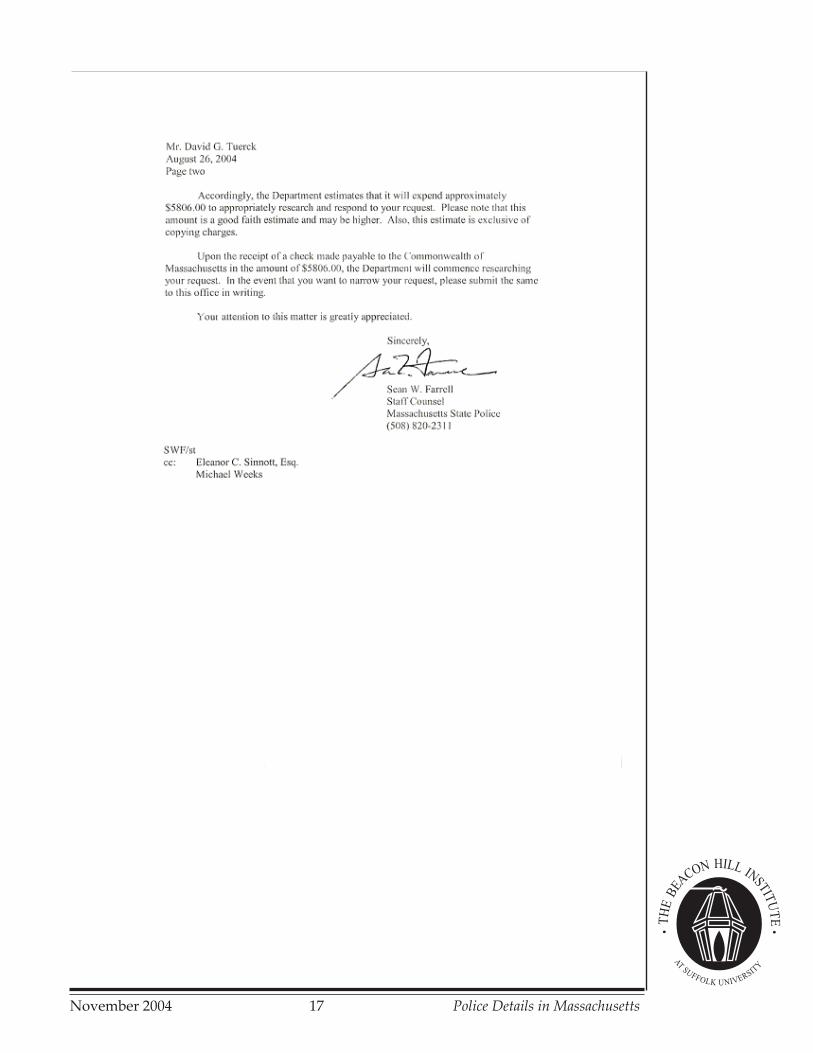
November 2004 17 Police Details in Massachusetts
Police Details in Massachusetts 18 November 2004
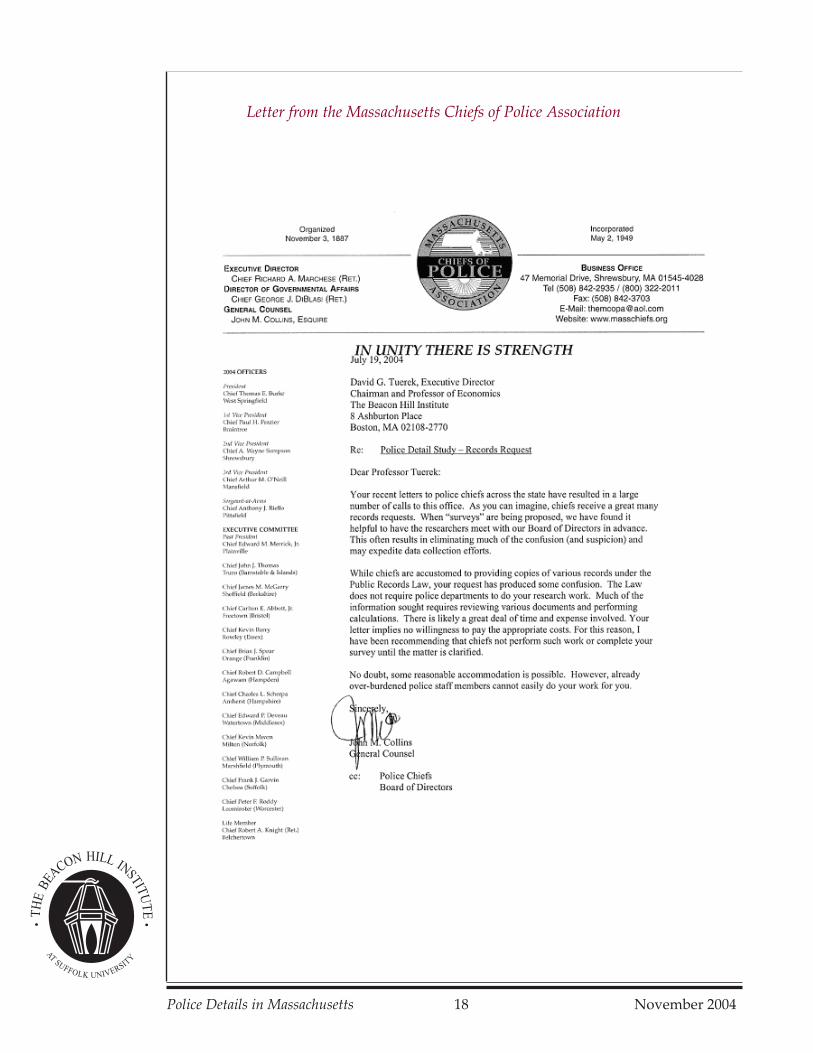
Letter from the Massachusetts Chiefs of Police Association
November 2004 19 Police Details in Massachusetts
Endnotes
1 For the remaining 248 cities and towns,we received an inadequate response, noresponse or a response demanding pay-ment for the requested data. See Appendixfor a letter from the Police Chiefs Associa-tion and for an item posted on Massachu-setts Police Association website, both ofwhich might explain the difficulty weencountered obtaining data.2 This estimate is based on responses to ourinquiries with local police departments.3 Robert Sears, “Romney may target policebenefits in budget,” Patriot Ledger,February 5, 2003.4 American Traffic Safety ServicesAssociation, http://www.flagger.com.Accessed on October 18, 2004.5 Officers are typically hired for 4 or 8-hourshifts. If the assignment last for any lengthof time past four hours, but fewer thaneight, the department bills for the entire 8-hour shift. Furthermore, a 10%administrative fee further increasing thecost.6 Referenced at http://safety.fhwa.dot.gov/fourthlevel/nwzaw/toc.htm [Accessed on October 22, 2004].7 Based on an analysis of Fatality AnalysisReporting System data available at: http://
wzsafety.tamu.edu/crash_data/fatal.stm[Accessed on October 18, 2004].8 In addition, we declined to obtain data onstate police details in light of a demand fromthe state police that we pay $5,000 to obtainthis data. See Appendix for a copy of the statepolice response to our request.9 Robert Sears, “Romney may target policebenefits in budget,” Patriot Ledger, February 5,2003. Mr. Machado estimates that the savingsto consumers would be between $5-$7annually. Based on our estimates, thesefigures appear to be very low.10 Ibid.11 Referenced in David Armstrong, “Limitsought on trooper paid details; State offerwould hike base $10,000; Union urges rejectionof contract,” Boston Globe, December 18, 1997.12 Donovan Slack, “Police expand probe ofdoubled detail pay,” Boston Globe, September 9,2004. Accessed on the internet on October 17,2004 at: http://www.boston.com/news/local/articles/2004/09/09/police_expand_probe_of_doubled_detail_pay/
The Beacon Hill Institute at Suffolk University in Boston focuses on federal, state and localeconomic policies as they affect citizens and businesses. The institute conducts research
and educational programs to provide timely, concise and readable analyses that helpvoters, policymakers and opinion leaders understand today’s leading public policy issues.
This report is the product of the Beacon Hill Institute alone and does not necessarilyrepresent the views of Suffolk University. The project was directed by BHI economistDouglas Giuffre, MSEP with assistance from interns Kate Allen of the University of
Pennsylvania and Anish Pradhan of St. Anselm College.
© 2004 by the Beacon Hill Institute at Suffolk UniversityISBN 1-866320-27-6
Beacon Hill Institute at Suffolk University8 Ashburton PlaceBoston, MA 02108
Phone 617-573-8750; Fax 617-720-4272;e-mail [email protected]; web www.beaconhill.org
The Beacon Hill Institute for Public Policy ResearchSuffolk University8 Ashburton PlaceBoston, MA 02108
Phone: 617-573-8750 Fax: [email protected]
http://www.beaconhill.org
$15.00


