Embed Size (px)
Citation preview

Proceedings of the 1st Conference of the Asia-Pacific Chapter of the Association for Computational Linguisticsand the 10th International Joint Conference on Natural Language Processing, pages 804–810
December 4 - 7, 2020. c©2020 Association for Computational Linguistics
804
Point-of-Interest Type Inference from Social Media Text
Danae Sanchez Villegasα Daniel Preotiuc-Pietroβ Nikolaos Aletrasαα Computer Science Department, University of Sheffield, UK
β Bloomberg{dsanchezvillegas1, n.aletras}@sheffield.ac.uk
Abstract
Physical places help shape how we perceivethe experiences we have there. We study therelationship between social media text and thetype of the place from where it was posted,whether a park, restaurant, or someplace else.To facilitate this, we introduce a novel data setof ∼200,000 English tweets published from2,761 different points-of-interest in the U.S.,enriched with place type information. We trainclassifiers to predict the type of the locationa tweet was sent from that reach a macro F1of 43.67 across eight classes and uncover thelinguistic markers associated with each typeof place. The ability to predict semantic placeinformation from a tweet has applications inrecommendation systems, personalization ser-vices and cultural geography.1
1 Introduction
Social networks such as Twitter allow users to shareinformation about different aspects of their livesincluding feelings and experiences from places thatthey visit, from local restaurants to sport stadiumsand parks. Feelings and emotions triggered by per-forming an activity or living an experience in aPoint-of-Interest (POI) can give a glimpse of theatmosphere in that place (Tanasescu et al., 2013).
In particular, the language used in posts fromPOIs is an important component that contributes to-ward the place’s identity and has been extensivelystudied in the context of social and cultural ge-ography (Tuan, 1991; Scollon and Scollon, 2003;Benwell and Stokoe, 2006). Social media postsfrom a particular location are usually focused onthe person posting the content, rather than on pro-viding explicit information about the place. Table 1displays example Twitter posts from different POIs.Users express their feelings related to a certain
1Data is available here: https://archive.org/details/poi-data
place (‘this places gives me war flashbacks’), com-ments and thoughts associated with the place theyare in (‘few of us dressed appropriately’) or activi-ties they are performing (‘leaving the news station’,‘on the way to the APCE Annual’).
In this paper, we aim to study the language thatpeople on Twitter use to share information about aspecific place they are visiting. Thus, we define theprediction of a POI type given a post (i.e. tweet)as a multi-class classification task using only in-formation available at posting time. Given the textfrom a user’s post, our goal is to predict the correcttype of the location it was posted, e.g. park, baror shop. Inferring the type of place from a user’spost using linguistic information, is useful for cul-tural geographers to study a place’s identity (Tuan,1991) and has downstream geosocial applicationssuch as POI visualisation (McKenzie et al., 2015)and recommendation (Alazzawi et al., 2012; Yuanet al., 2013; Preotiuc-Pietro and Cohn, 2013; Gaoet al., 2015).
Predicting the type of a POI is inherently dif-ferent to predicting the POI type from commentsor reviews. The role of the latter is to provideopinions or descriptions of the places, rather thanthe activities and feelings of the user posting thetext (McKenzie et al., 2015), as illustrated in Ta-ble 1. This is also different, albeit related, to thepopular task of geolocation prediction (Cheng et al.,2010; Eisenstein et al., 2010; Han et al., 2012;Roller et al., 2012; Rahimi et al., 2015; Dredzeet al., 2016), as this aims to infer the exact geo-graphical location of a post using language vari-ation and geographical cues rather than inferringthe place’s type. Our task aims to uncover the geo-graphic agnostic features associated with POIs ofdifferent types.
Our contributions are as follows: (1) We providethe first study of POI type prediction in computa-tional linguistics; (2) A large data set made out of
805
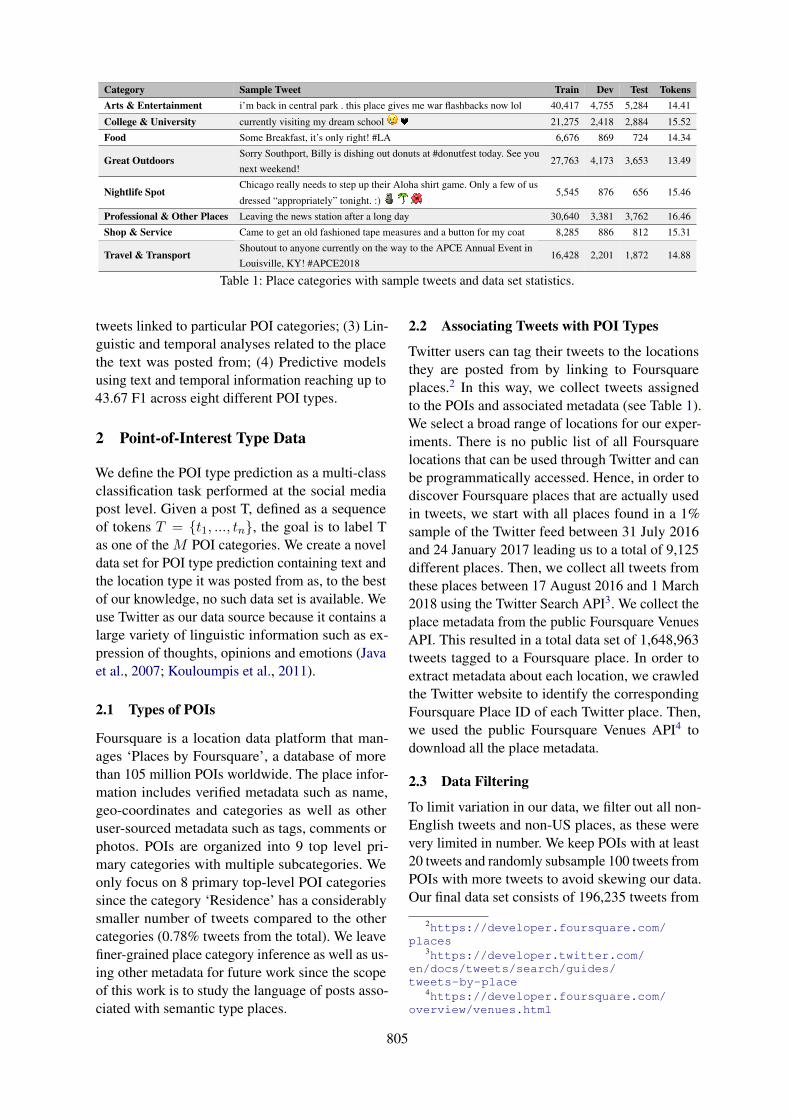
Category Sample Tweet Train Dev Test TokensArts & Entertainment i’m back in central park . this place gives me war flashbacks now lol 40,417 4,755 5,284 14.41
College & University currently visiting my dream school 21,275 2,418 2,884 15.52
Food Some Breakfast, it’s only right! #LA 6,676 869 724 14.34
Great OutdoorsSorry Southport, Billy is dishing out donuts at #donutfest today. See younext weekend!
27,763 4,173 3,653 13.49
Nightlife SpotChicago really needs to step up their Aloha shirt game. Only a few of us
dressed “appropriately” tonight. :)5,545 876 656 15.46
Professional & Other Places Leaving the news station after a long day 30,640 3,381 3,762 16.46
Shop & Service Came to get an old fashioned tape measures and a button for my coat 8,285 886 812 15.31
Travel & TransportShoutout to anyone currently on the way to the APCE Annual Event inLouisville, KY! #APCE2018
16,428 2,201 1,872 14.88
Table 1: Place categories with sample tweets and data set statistics.
tweets linked to particular POI categories; (3) Lin-guistic and temporal analyses related to the placethe text was posted from; (4) Predictive modelsusing text and temporal information reaching up to43.67 F1 across eight different POI types.
2 Point-of-Interest Type Data
We define the POI type prediction as a multi-classclassification task performed at the social mediapost level. Given a post T, defined as a sequenceof tokens T = {t1, ..., tn}, the goal is to label Tas one of the M POI categories. We create a noveldata set for POI type prediction containing text andthe location type it was posted from as, to the bestof our knowledge, no such data set is available. Weuse Twitter as our data source because it contains alarge variety of linguistic information such as ex-pression of thoughts, opinions and emotions (Javaet al., 2007; Kouloumpis et al., 2011).
2.1 Types of POIs
Foursquare is a location data platform that man-ages ‘Places by Foursquare’, a database of morethan 105 million POIs worldwide. The place infor-mation includes verified metadata such as name,geo-coordinates and categories as well as otheruser-sourced metadata such as tags, comments orphotos. POIs are organized into 9 top level pri-mary categories with multiple subcategories. Weonly focus on 8 primary top-level POI categoriessince the category ‘Residence’ has a considerablysmaller number of tweets compared to the othercategories (0.78% tweets from the total). We leavefiner-grained place category inference as well as us-ing other metadata for future work since the scopeof this work is to study the language of posts asso-ciated with semantic type places.
2.2 Associating Tweets with POI Types
Twitter users can tag their tweets to the locationsthey are posted from by linking to Foursquareplaces.2 In this way, we collect tweets assignedto the POIs and associated metadata (see Table 1).We select a broad range of locations for our exper-iments. There is no public list of all Foursquarelocations that can be used through Twitter and canbe programmatically accessed. Hence, in order todiscover Foursquare places that are actually usedin tweets, we start with all places found in a 1%sample of the Twitter feed between 31 July 2016and 24 January 2017 leading us to a total of 9,125different places. Then, we collect all tweets fromthese places between 17 August 2016 and 1 March2018 using the Twitter Search API3. We collect theplace metadata from the public Foursquare VenuesAPI. This resulted in a total data set of 1,648,963tweets tagged to a Foursquare place. In order toextract metadata about each location, we crawledthe Twitter website to identify the correspondingFoursquare Place ID of each Twitter place. Then,we used the public Foursquare Venues API4 todownload all the place metadata.
2.3 Data Filtering
To limit variation in our data, we filter out all non-English tweets and non-US places, as these werevery limited in number. We keep POIs with at least20 tweets and randomly subsample 100 tweets fromPOIs with more tweets to avoid skewing our data.Our final data set consists of 196,235 tweets from
2https://developer.foursquare.com/places
3https://developer.twitter.com/en/docs/tweets/search/guides/tweets-by-place
4https://developer.foursquare.com/overview/venues.html

806
2,761 POIs.
2.4 Data Split
We create our data split at a location-level to ensurethat our models are robust and generalize to loca-tions held-out in training. We split the locationsin train (80%), development (10%) and test (10%)sets and assign tweets to one of the three splitsbased on the location they were posted from (seeTable 1 for detailed statistics).
2.5 Text Processing
We lower-case text and replace all URLs and men-tions of users with placeholders. We preserve emoti-cons and punctuation and replace tokens that ap-pear in less than five tweets with an ‘unknown’token. We tokenize text using a Twitter-aware tok-enizer (Schwartz et al., 2017).
3 Analysis
We first analyze our data set to understand the rela-tionship between location type, language and post-ing time.
3.1 Linguistic Analysis
We analyze the linguistic features specific to eachcategory by ranking unigrams that appear in at least5 different locations, such that these are represen-tative of the larger POI category rather than a fewspecific places. Features are normalized to sum upto unit for each tweet, then we compute the (Pear-son) χ2 coefficient independently between its dis-tribution across posts and the binary category labelof the post similar to the approach followed by Ma-ronikolakis et al. (2020) and Preotiuc-Pietro et al.(2019). Table 2 presents the top unigram featuresfor each category.
We note that most top unigrams specific of acategory naturally refer to types of places (e.g.‘campus’, ‘beach’, ‘mall’, ‘airport’) that are partof that category. All categories also contain wordsthat refer to activities that the poster of the tweetis performing or observing while at a location(e.g. ‘camp’ and ‘football’ for College, ‘concert’and ‘show’ for Arts & Entertainment, ‘party’ forNightlife Spot, ‘landed’ for Travel & Transport,‘hike’ for Greater Outdoors). Nightlife Spot andFood categories are represented by types of foodor drinks that are typically consumed at these loca-tions. Beyond these typical associations, we high-light that usernames are more likely mentioned in
the Arts & Entertainment category, usually indi-cating activities involving groups of users, emojisindicative of the user state (e.g. happy emoji inFood places) and adjectives indicative of the user’ssurroundings (e.g. ‘beautiful’ in Greater Outdoorsplaces). Finally, we also uncover words indicativeof the time the user is at a place, such as ‘tonight’for Arts & Entertainment, ‘sunset’ for the GreaterOutdoors and ‘night’ for Nightlife Spots and Arts& Entertainment.
3.2 Temporal Analysis
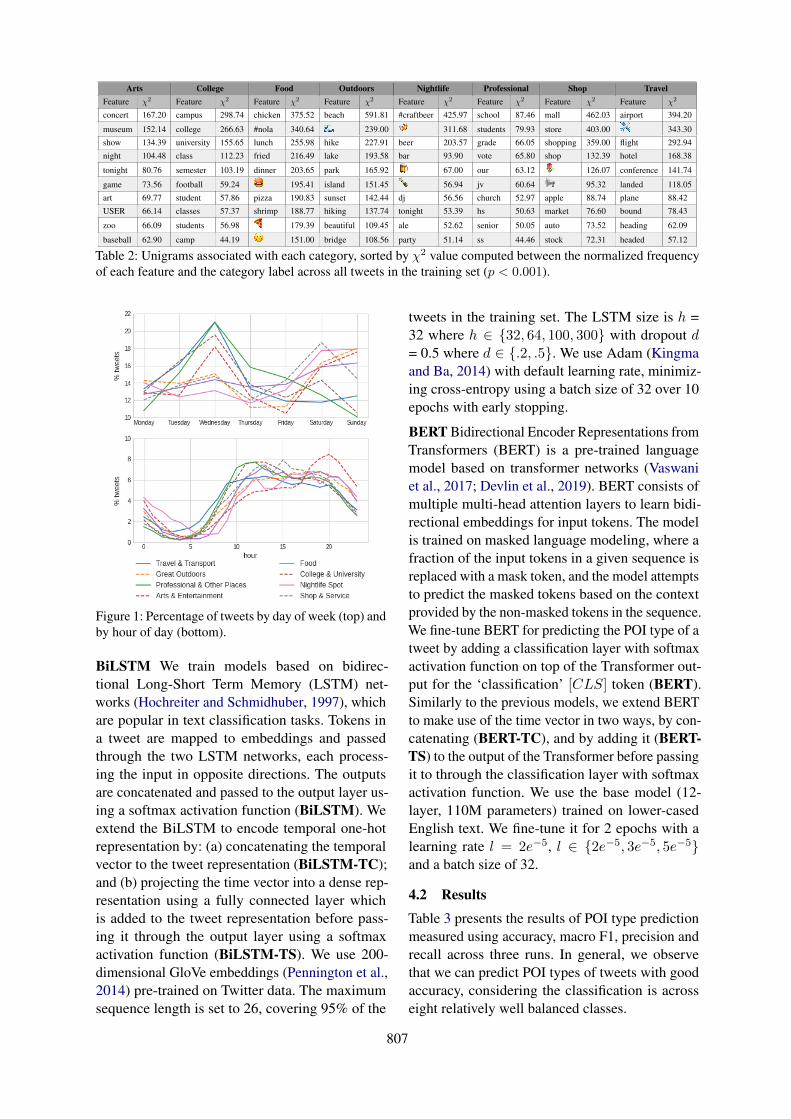
We further examine the relationship between thetime a tweet was posted and the POI type it wasposted from. Figure 1 shows the percentage oftweets by day of week (top) and hour of day (bot-tom).
We observe that tweets posted from the ‘Profes-sional & Other Places’, ‘Travel & Transport’ and‘College & University’ categories are more preva-lent on weekdays, peaking on Wednesday, while onweekends more tweets are posted from the ‘GreatOutdoors’, ‘Arts & Entertainment’, ‘Nightlife &Spot’ and ‘Food’ categories when people focusless on professional activities and dedicate moretime to leisure as expected. The hour of day patternfollows the daily human activity rhythm, but thedifferences between categories are less prominent,perhaps with the exception of the ‘Arts & Entertain-ment’ category peaks around 8PM and ‘NightlifeSpots’ that see a higher percent of tweets in theearly hours of the day (between 1-5am) than othercategories.
4 Predicting POI Types of Tweets
4.1 Methods
Logistic Regression We first experiment with lo-gistic regression using a standard bag of n-gramsrepresentation of the tweet (LR-W), including uni-grams to trigrams weighted using TF-IDF. We iden-tified in the analysis section that temporal informa-tion about the tweet may be useful for classifica-tion. Hence, to add temporal information extractedfrom a tweet, we create a 31-dimensional vectorencoding the hour of the day and the day of theweek it was sent from. We experiment with onlyusing the temporal features (LR-T) and in combi-nation with the text features (LR-W+T). We useL1 regularization (Hoerl and Kennard, 1970) withhyperparameter α = .01 (selected based on dev setfrom {.001, .01, .1}).
807
Arts College Food Outdoors Nightlife Professional Shop TravelFeature χ2 Feature χ2 Feature χ2 Feature χ2 Feature χ2 Feature χ2 Feature χ2 Feature χ2
concert 167.20 campus 298.74 chicken 375.52 beach 591.81 #craftbeer 425.97 school 87.46 mall 462.03 airport 394.20
museum 152.14 college 266.63 #nola 340.64 239.00 311.68 students 79.93 store 403.00 343.30
show 134.39 university 155.65 lunch 255.98 hike 227.91 beer 203.57 grade 66.05 shopping 359.00 flight 292.94
night 104.48 class 112.23 fried 216.49 lake 193.58 bar 93.90 vote 65.80 shop 132.39 hotel 168.38
tonight 80.76 semester 103.19 dinner 203.65 park 165.92 67.00 our 63.12 126.07 conference 141.74
game 73.56 football 59.24 195.41 island 151.45 56.94 jv 60.64 95.32 landed 118.05
art 69.77 student 57.86 pizza 190.83 sunset 142.44 dj 56.56 church 52.97 apple 88.74 plane 88.42
USER 66.14 classes 57.37 shrimp 188.77 hiking 137.74 tonight 53.39 hs 50.63 market 76.60 bound 78.43
zoo 66.09 students 56.98 179.39 beautiful 109.45 ale 52.62 senior 50.05 auto 73.52 heading 62.09
baseball 62.90 camp 44.19 151.00 bridge 108.56 party 51.14 ss 44.46 stock 72.31 headed 57.12
Table 2: Unigrams associated with each category, sorted by χ2 value computed between the normalized frequencyof each feature and the category label across all tweets in the training set (p < 0.001).
Figure 1: Percentage of tweets by day of week (top) andby hour of day (bottom).
BiLSTM We train models based on bidirec-tional Long-Short Term Memory (LSTM) net-works (Hochreiter and Schmidhuber, 1997), whichare popular in text classification tasks. Tokens ina tweet are mapped to embeddings and passedthrough the two LSTM networks, each process-ing the input in opposite directions. The outputsare concatenated and passed to the output layer us-ing a softmax activation function (BiLSTM). Weextend the BiLSTM to encode temporal one-hotrepresentation by: (a) concatenating the temporalvector to the tweet representation (BiLSTM-TC);and (b) projecting the time vector into a dense rep-resentation using a fully connected layer whichis added to the tweet representation before pass-ing it through the output layer using a softmaxactivation function (BiLSTM-TS). We use 200-dimensional GloVe embeddings (Pennington et al.,2014) pre-trained on Twitter data. The maximumsequence length is set to 26, covering 95% of the
tweets in the training set. The LSTM size is h =32 where h ∈ {32, 64, 100, 300} with dropout d= 0.5 where d ∈ {.2, .5}. We use Adam (Kingmaand Ba, 2014) with default learning rate, minimiz-ing cross-entropy using a batch size of 32 over 10epochs with early stopping.
BERT Bidirectional Encoder Representations fromTransformers (BERT) is a pre-trained languagemodel based on transformer networks (Vaswaniet al., 2017; Devlin et al., 2019). BERT consists ofmultiple multi-head attention layers to learn bidi-rectional embeddings for input tokens. The modelis trained on masked language modeling, where afraction of the input tokens in a given sequence isreplaced with a mask token, and the model attemptsto predict the masked tokens based on the contextprovided by the non-masked tokens in the sequence.We fine-tune BERT for predicting the POI type of atweet by adding a classification layer with softmaxactivation function on top of the Transformer out-put for the ‘classification’ [CLS] token (BERT).Similarly to the previous models, we extend BERTto make use of the time vector in two ways, by con-catenating (BERT-TC), and by adding it (BERT-TS) to the output of the Transformer before passingit to through the classification layer with softmaxactivation function. We use the base model (12-layer, 110M parameters) trained on lower-casedEnglish text. We fine-tune it for 2 epochs with alearning rate l = 2e−5, l ∈ {2e−5, 3e−5, 5e−5}and a batch size of 32.
4.2 Results
Table 3 presents the results of POI type predictionmeasured using accuracy, macro F1, precision andrecall across three runs. In general, we observethat we can predict POI types of tweets with goodaccuracy, considering the classification is acrosseight relatively well balanced classes.

808
Model Acc F1 P RMajor. Class 26.89 5.30 3.36 12.50Random 13.63 12.64 13.63 15.68LR-T 27.93 14.01 15.78 16.06LR-W 43.04 37.33 37.06 38.03LR-W+T 43.73 37.83 37.68 38.37BiLSTM 44.38 35.77 45.29 33.78BiLSTM-TC 44.01 38.07 41.51 36.46BiLSTM-TS 44.72 38.26 42.91 36.30BERT 48.89 43.67 48.44 41.33BERT-TC 46.13 41.19 46.81 39.03BERT-TS 49.17 43.47 48.40 41.26
Table 3: Accuracy (Acc), Macro-F1 Score (F1), Preci-sion macro (P), and Recall macro (R) for POI type pre-diction (all std. dev < 0.01). Best results are in bold.
Best results are obtained using BERT-based mod-els (BERT, BERT-TC and BERT-TS), with the high-est accuracy of 49.17 (compared to 26.89 majorityclass) and highest macro-F1 of 43.67 (compared to12.64 random). We observe that BERT models out-perform both BiLSTM and linear methods acrossall metrics, with over 4% improvement in accuracyand 5 points F1. The BiLSTM models performmarginally better than the linear models. Temporalfeatures alone are marginally useful when modelsare evaluated using accuracy (+0.28 BERT, +0.34for BiLSTMs, +0.69 for LR) and perform similarlyon F1, with the notable exception of the BiLSTMmodels. We find that adding these features is morebeneficial than concatenating them, with concate-nation hurting performance on accuracy for bothBiLSTM and BERT.
Figure 2 shows the confusion matrix of our bestperforming model, BERT, according to the macro-F1 score. The confusion matrix is normalized overthe actual values (rows). The category ‘Arts & En-tertainment‘ has the greatest percentage (62%) ofcorrectly classified tweets, followed by the ‘GreatOutdoors‘ category with 54%, and the ‘College &University‘ category with 44%. On the other hand,the categories ‘Nightlife Spot‘ and ‘Shop & Ser-vice‘ have the lowest results, where 30% of thetweets predicted as each of these classes is cor-rectly classified. Most common error is when themodel classifies tweets from the category ‘College& University’ as ‘Professional & Other Places’, astweets from these places contain similar terms suchas ‘students’ or ‘class’.
5 Conclusion
We presented the first study on predicting the POItype a social media message was posted from
Figure 2: Confusion Matrix of the best performingmodel (BERT).
and developed a large-scale data set with tweetsmapped to their POI category. We conducted ananalysis to uncover features specific to place typeand trained predictive models to infer the POI cat-egory using only tweet text and posting time withaccuracy close to 50% across eight categories. Fu-ture work will focus on using other modalities suchas network (Aletras and Chamberlain, 2018; Tsaka-lidis et al., 2018) or image information (Vempalaand Preotiuc-Pietro, 2019; Alikhani et al., 2019)and prediction at a more granular level of POItypes.
Acknowledgments
DSV is supported by the Centre for Doctoral Train-ing in Speech and Language Technologies (SLT)and their Applications funded by the UK Researchand Innovation grant EP/S023062/1. NA is sup-ported by ESRC grant ES/T012714/1.
References
Ahmed N Alazzawi, Alia I Abdelmoty, and Christo-pher B Jones. 2012. What can I do there? To-wards the automatic discovery of place-related ser-vices and activities. International Journal of Geo-graphical Information Science 26(2):345–364.
Nikolaos Aletras and Benjamin Paul Chamberlain.2018. Predicting Twitter user socioeconomic at-tributes with network and language information. InProceedings of the 29th Conference on Hypertextand Social Media, pages 20–24.
Malihe Alikhani, Sreyasi Nag Chowdhury, Gerardde Melo, and Matthew Stone. 2019. CITE: A cor-pus of image-text discourse relations. In Proceed-ings of the 2019 Conference of the North American

809
Chapter of the Association for Computational Lin-guistics: Human Language Technologies, Volume 1(Long and Short Papers). Association for Compu-tational Linguistics, Minneapolis, Minnesota, pages570–575.
Bethan Benwell and Elizabeth Stokoe. 2006. Dis-course and identity. Edinburgh University Press.
Zhiyuan Cheng, James Caverlee, and Kyumin Lee.2010. You Are Where You Tweet: A Content-BasedApproach to Geo-Locating Twitter Users. In Pro-ceedings of the 19th ACM International Conferenceon Information and Knowledge Management. CIKM’10, pages 759–768.
Jacob Devlin, Ming-Wei Chang, Kenton Lee, andKristina Toutanova. 2019. BERT: Pre-training ofdeep bidirectional transformers for language under-standing. In Proceedings of the 2019 Conference ofthe North American Chapter of the Association forComputational Linguistics: Human Language Tech-nologies, Volume 1 (Long and Short Papers). Asso-ciation for Computational Linguistics, Minneapolis,Minnesota, pages 4171–4186.
Mark Dredze, Miles Osborne, and Prabhanjan Kam-badur. 2016. Geolocation for twitter: Timing mat-ters. In Proceedings of the 2016 Conference ofthe North American Chapter of the Association forComputational Linguistics: Human Language Tech-nologies. Association for Computational Linguistics,San Diego, California, pages 1064–1069.
Jacob Eisenstein, Brendan O’Connor, Noah A. Smith,and Eric P. Xing. 2010. A latent variable modelfor geographic lexical variation. In Proceedings ofthe 2010 Conference on Empirical Methods in Nat-ural Language Processing. Association for Compu-tational Linguistics, Cambridge, MA, pages 1277–1287.
Huiji Gao, Jiliang Tang, Xia Hu, and Huan Liu. 2015.Content-aware point of interest recommendation onlocation-based social networks. In Proceedings ofthe Twenty-Ninth AAAI Conference on Artificial In-telligence. AAAI, pages 1721–1727.
Bo Han, Paul Cook, and Timothy Baldwin. 2012. Ge-olocation prediction in social media data by findinglocation indicative words. In Proceedings of COL-ING 2012. The COLING 2012 Organizing Commit-tee, Mumbai, India, pages 1045–1062.
Sepp Hochreiter and Jurgen Schmidhuber. 1997. Longshort-term memory. Neural computation 9(8):1735–1780.
Arthur E Hoerl and Robert W Kennard. 1970. Ridge re-gression: Biased estimation for nonorthogonal prob-lems. Technometrics 12(1):55–67.
Akshay Java, Xiaodan Song, Tim Finin, and BelleTseng. 2007. Why we Twitter: understanding mi-croblogging usage and communities. In Proceed-ings of the 9th WebKDD and 1st SNA-KDD 2007
Workshop on Web Mining and Social Network Anal-ysis. pages 56–65.
Diederik P Kingma and Jimmy Ba. 2014. Adam: Amethod for stochastic optimization. arXiv preprintarXiv:1412.6980 .
Efthymios Kouloumpis, Theresa Wilson, and Jo-hanna D Moore. 2011. Twitter sentiment analysis:The good the bad and the omg! In Proceedings ofthe Fifth International AAAI Conference on Weblogsand Social Media. ICWSM, pages 538–541.
Antonios Maronikolakis, Danae Sanchez Villegas,Daniel Preotiuc-Pietro, and Nikolaos Aletras. 2020.Analyzing political parody in social media. In Pro-ceedings of the 58th Annual Meeting of the Asso-ciation for Computational Linguistics. pages 4373–4384.
Grant McKenzie, Krzysztof Janowicz, Song Gao, Jiue-An Yang, and Yingjie Hu. 2015. POI pulse: Amulti-granular, semantic signature–based informa-tion observatory for the interactive visualization ofbig geosocial data. Cartographica: The Interna-tional Journal for Geographic Information and Geo-visualization 50(2):71–85.
Jeffrey Pennington, Richard Socher, and ChristopherManning. 2014. Glove: Global vectors for word rep-resentation. In Proceedings of the 2014 Conferenceon Empirical Methods in Natural Language Process-ing (EMNLP). Association for Computational Lin-guistics, Doha, Qatar, pages 1532–1543.
Daniel Preotiuc-Pietro and Trevor Cohn. 2013. Min-ing user behaviours: a study of check-in patterns inlocation based social networks. In Proceedings ofthe 5th annual ACM Web Science Conference. WebScience, pages 306–315.
Daniel Preotiuc-Pietro, Mihaela Gaman, and NikolaosAletras. 2019. Automatically identifying complaintsin social media. In Proceedings of the 57th AnnualMeeting of the Association for Computational Lin-guistics. pages 5008–5019.
Afshin Rahimi, Duy Vu, Trevor Cohn, and TimothyBaldwin. 2015. Exploiting text and network con-text for geolocation of social media users. In Pro-ceedings of the 2015 Conference of the North Amer-ican Chapter of the Association for ComputationalLinguistics: Human Language Technologies. Asso-ciation for Computational Linguistics, Denver, Col-orado, pages 1362–1367.
Stephen Roller, Michael Speriosu, Sarat Rallapalli,Benjamin Wing, and Jason Baldridge. 2012. Super-vised text-based geolocation using language modelson an adaptive grid. In Proceedings of the 2012 JointConference on Empirical Methods in Natural Lan-guage Processing and Computational Natural Lan-guage Learning. Association for Computational Lin-guistics, Jeju Island, Korea, pages 1500–1510.

810
H. Andrew Schwartz, Salvatore Giorgi, Maarten Sap,Patrick Crutchley, Lyle Ungar, and Johannes Eich-staedt. 2017. DLATK: Differential language anal-ysis ToolKit. In Proceedings of the 2017 Confer-ence on Empirical Methods in Natural LanguageProcessing: System Demonstrations. Association forComputational Linguistics, Copenhagen, Denmark,pages 55–60.
Ron Scollon and Suzie Wong Scollon. 2003. Dis-courses in place: Language in the material world.Routledge.
Vlad Tanasescu, Christopher B Jones, GualtieroColombo, Martin J Chorley, Stuart M Allen, andRoger M Whitaker. 2013. The personality of venues:Places and the five-factors (’big five’) model of per-sonality. In Fourth IEEE International Conferenceon Computing for Geospatial Research and Applica-tion. pages 76–81.
Adam Tsakalidis, Nikolaos Aletras, Alexandra ICristea, and Maria Liakata. 2018. Nowcasting thestance of social media users in a sudden vote: Thecase of the Greek Referendum. In Proceedings ofthe 27th ACM International Conference on Informa-tion and Knowledge Management. pages 367–376.
Yi-Fu Tuan. 1991. Language and the making of place:A narrative-descriptive approach. Annals of the As-sociation of American geographers 81(4):684–696.
Ashish Vaswani, Noam Shazeer, Niki Parmar, JakobUszkoreit, Llion Jones, Aidan N Gomez, ŁukaszKaiser, and Illia Polosukhin. 2017. Attention is allyou need. In Advances in Neural Information Pro-cessing Systems. pages 5998–6008.
Alakananda Vempala and Daniel Preotiuc-Pietro. 2019.Categorizing and inferring the relationship betweenthe text and image of twitter posts. In Proceed-ings of the 57th Annual Meeting of the Associationfor Computational Linguistics. Association for Com-putational Linguistics, Florence, Italy, pages 2830–2840.
Quan Yuan, Gao Cong, Zongyang Ma, Aixin Sun,and Nadia Magnenat Thalmann. 2013. Time-awarepoint-of-interest recommendation. In Proceedingsof the 36th International ACM SIGIR Conference onResearch and Development in Information Retrieval.pages 363–372.


![Bayesian Causal Inference - uni-muenchen.de...from causal inference have been attracting much interest recently. [HHH18] propose that causal [HHH18] propose that causal inference stands](https://img.dokumen.tips/doc/110x75/5ec457b21b32702dbe2c9d4c/bayesian-causal-inference-uni-from-causal-inference-have-been-attracting.jpg)