Embed Size (px)
Citation preview

Scientia Iranica D (2017) 24(6), 3257{3267
Sharif University of TechnologyScientia Iranica
Transactions D: Computer Science & Engineering and Electrical Engineeringwww.scientiairanica.com
Poincar�e section-based biomarkers of hemisphericasymmetry applied to autism spectrum disorder
Gh. Sadeghi Bajestania, A. Sheikhania, M.R. Hashemi Golpayeganib;�,F. Ashrafzadehc and P. Hebranid
a. Department of Biomedical Engineering, Science and Research Branch, Islamic Azad University, Hesarak, Tehran, P.O. Box1477893855, Iran.
b. Department of Biomedical Engineering, Amirkabir University of Technology, 424 Hafez Ave., Tehran, 15875-4413, Iran.c. Paediatrics Neurology Division, Ghaem Hospital, Mashhad University of Medical Sciences, Mashhad, Iran.d. Department of Paediatrics, Dr. Sheikh Paediatric Hospital, Mashhad University of Medical Sciences, Mashhad, Iran.
Received 20 February 2016; received in revised form 26 June 2016; accepted 18 July 2016
KEYWORDSAutism spectrumdisorder;Poincar�e section;Hemisphericasymmetry;Information.
Abstract. Asymmetry and symmetry coexist in natural and human processes, and theinteraction of asymmetric action (recursion) and symmetric opposition (sinusoidal waves)is instrumental in generating creative features. Autism Spectrum Disorder (ASD) is adisorder in which asymmetry and functionality of brain hemispheres are a�ected. In thisstudy, di�erence in brain asymmetry in ASD and normal children and the e�ect of voice onasymmetry are being investigated. Due to abnormal cortical voice processing in ASD, datarecording is done in two situations: animation with audio (V-A) for 5 minutes and watchingthe animation with muted audio band (VwA). Two Indexes Divergence (D) and number ofPoincar�e section points further from threshold (HD) as new biomarkers are being extracted.Hemispheric asymmetry in ASD children does not follow norm patterns, and H and HDindexes con�rm a disorder in hemisphere's functionality in all statistical tests which can beglobally unveiled with Poincar�e section and extracted information. Two remarkable featuresof the presented method are: data recording protocol specialized for ASD children and newpractical time-series analysis for detecting episodic patterns (complexes) as hallmark ofASD dynamic and arrangement as an empirical measure of nonrandom complexity. Thepresented method could detect these complexes.© 2017 Sharif University of Technology. All rights reserved.
1. Introduction
The term symmetry originally means a sense of har-monious, aesthetically pleasing proportionality thatembodies beauty. Soon, the term symmetry acquired
*. Corresponding author. Tel.: +98 21 64542370;E-mail addresses: [email protected] (Gh. SadeghiBajestani); [email protected] (A. Sheikhani);[email protected] (M.R. HashemiGolpayegani); [email protected] (F. Ashrafzadeh);[email protected]. (P. Hebrani)
doi: 10.24200/sci.2017.4356
a more precise meaning of mathematical balance suchas when one shape becomes exactly like another if it is ipped (\mirror" symmetry), slid, or turned. Over thetime, symmetry came to be de�ned when this internalidentity could be demonstrated according to the rulesof a formal system [1,2]. A mathematical objectis symmetric with respect to a given mathematicaloperation if this operation preserves some propertiesof the object, when applied to the object. The mostunique aspect in human brain organization is asym-metry based on which brain hemispheres nearly haveseparate functions and structures. Brain hemisphericasymmetry might vary regarding di�erent reasons [3].

3258 Gh. Sadeghi Bajestani et al./Scientia Iranica, Transactions D: Computer Science & ... 24 (2017) 3257{3267
Autism is a disorder which might a�ect brain functions.Autism is a neurodevelopmental disorder recognizablewith aws in social communications and interactionsand repetitive behavioral patterns, interests, and ac-tivities. The essential clinical features of autism spec-trum disorder in Diagnostic and Statistical Manual ofMental Disorders (DSM-5) are: persistent impairmentspeci�c to reciprocal social communication and socialinteraction (Criterion A); restricted, repetitive patternsof behavior, interests, or activities (Criterion B). Thesesymptoms are present as of early childhood and limitor impair our everyday functioning (Criteria C andD) [4]. These clinical presentations are mostly detectedin childhood; other behaviors are frequently found inAutism Spectrum Disorders (ASDs) such as neophobia,enhanced anxiety, abnormal pain sensitivity and eyeblink conditioning, disturbed sleep patterns, seizures,and de�cits in sensorimotor gating [5,6]. Recent epi-demiologic studies have estimated the ASD prevalenceof 1 out of 68 children [7].
Numerous studies have shown that brain hemi-spheric asymmetry in ASD with regard to normalpeople is entirely di�erent. In this �eld, widespreadstudies have been carried out using EEG in whichdi�erent tools are applied to investigate asymmetry [8-14], and di�erent indexes are introduced as biologicalindexes, some of which are mentioned in Table 1.
Although it is precisely mentioned in some articlesthat there has not been detected a biological index forASD disorder yet [15], it seems that non-globalism inthe results is abridged in non-globalism in tools. Inthis research, another tool, named \Poincar�e section",is implemented to extract biomarkers with the aim ofunveiling disorder in brain asymmetry of ASD cases, inwhich globalism, holism, and cybernetic approach arethe main features. In the forthcoming sections, the re-sults and conclusions are analyzed and preceded by in-troduction of the essence of Poincar�e section and its im-plementation in addition to signal recording protocol.
2. De�nitions
Newton and Leibniz are the origin of dynamical system
theory and Poincar�e is the �rst person who discovera chaotic deterministic system. Newton and Leibnizdeveloped calculus to study celestial mechanics{themotion of the stars and planets and Poincar�e solved,three-body problem. At the heart of these theoryare di�erential equations that express the temporaldynamics of a system's state variables according to thephysical laws governing the system. Some de�nitionsare as below
� An nth-order autonomous continuous-time dynami-cal system is de�ned by the state equation:
_x = f(x); x(t0) = x0; (1)
where _x := dxdt , x(t) 2 Rn is the state at time t,
and f : Rn ! Rn is called the vector �eld. Sincethe vector �eld does not depend on time, the initialtime may always be taken as t0 = 0;
� An nth-order non-autonomous continuous-time dy-namical system is de�ned by the state equation:
_x = f(x; t); x(t0) = x0: (2)
For non-autonomous systems, the vector �eld de-pends on time and, unlike the autonomous case, theinitial time cannot, in general, be set to 0. Thesolution to Eq. (2) passing through x0 at time tois denoted by 't(x0; y0). Dynamical system (2) islinear if vector �eld, f(x; t), is linear with respect tox [16];
� An nth-order time-periodic non-autonomous systemwith period T can always be converted into an(n + l)th-order autonomous system by appendingan extra state � := 2�t=T . The autonomous systemis given by:
_x = f(x; �T=2�) x(t0) = x0;
_� = 2�=T �(t0) = 2�t0=T: (3)
Since f is time periodic with period T , System (3)is periodic in � with period 2�. Hence, the planes,
Table 1. Important indexes used as biomarker in ASD.
Biomarker Ref.EEG complexity as a biomarker (multiscale entropy). [47,48]Higuchi's fractal dimension and Katz's fractal dimension. [49]Time and frequency domain and principal component analysis. [48]Spectral features. [50-52]EEG coherence for six frequency bands (delta, theta, alpha, sigma, beta, and total spectrum). [53,54]Power spectral. [55-57]EEG power and coherence. [58,59]Wavelet decomposition. [60]Mu rhythm investigation. [18,19,61]

Gh. Sadeghi Bajestani et al./Scientia Iranica, Transactions D: Computer Science & ... 24 (2017) 3257{3267 3259
i.e. � = 0 and = 2�, may be identi�ed and the statespace is transformed from Euclidean space Rn+1 tocylindrical space Rn�S1 where S1 := [0; 2�) denotesthe circle.
The solution to Eq. (3) in the cylindrical statespace is:�
x(t)�(t)
�=�
�t(x0; t0)2�t=Tmod2�
�; (4)
where the modulo function restricts 0 � � <2�. Using this transformation, the theory of au-tonomous systems can be applied to time-periodicnon-autonomous systems [16];
� A classical technique for analyzing dynamical sys-tems is due to the issue of Poincar�e. It replaces the ow of an nth-order continuous-time system withan (n � l)th-order discrete-time system called thePoincar�e map. The de�nition of the Poincar�e mapensures that its limit sets correspond to those ofthe underlying ow. The Poincar�e map's usefulnesslies in the reduction of order and the fact that itbridges the gap between continuous- and discrete-time systems.
The Poincar�e map of non-autonomous sys-tems: Recall that a time-periodic nth-order non-autonomous system with minimum period T canbe transformed into an (n+ l)th-order autonomoussystem in cylindrical state space Rn�S1 via eq. (3).
Consider that n-dimensional hyper planeP 2
Rn � S1 is de�ned by:X:= f(x; �) 2 Rn � S1 : � = �0g: (5)
In every T second, Trajectory (4) intersects S (Fig-ure 1). The resulting map PN :
P!P(Rn???Rn)
is de�ned by PN (x) := ;t0+T (x; t0).
Figure 1. The Poincar�e map of a �rst-ordernon-autonomous system [16].
Figure 2. The Poincar�e map of a third-order autonomoussystem [16].
PN is called the Poincar�e map of the non-autonomous system. Subscript N stands for non-autonomous and is used to distinguish this map fromthe Poincare maps that are used with autonomoussystems.
The Poincar�e map of autonomous systems:Consider an nth-order autonomous system withlimit cycle � shown in Figure 2. Let x� be a point onthe limit cycle and let
Pbe an (n� 1)-dimensional
hyper plane transversal to T at x�. The trajectoryemanated from x� will hit
Pat x� in T seconds,
where T is the minimum period of the limit cycle.Due to the continuity of 't with respect to the initialcondition, trajectories starting on
Pin a su�ciently
small neighborhood of x� will, in approximately Tseconds, intersect
Pin the vicinity of x�. Hence, 't
andP
de�ne a mapping PA of some neighborhoodU � P of x� onto another neighborhood V � Pof x�. PA is a Poincar�e map of the autonomoussystem [16,17].
3. Materials and methods
3.1. DataOne of the main casualties in ASD children is thefact that they do not cooperate in recording, andthat is why opened or even closed eye EEG recordingis rarely talked about. In this research, with theclose cooperation of Hedayate-noor autism center ofMashhad and Ibne-Sina Hospital and Aren center, notonly are these casualties overcome, but also a newprotocol based on common shapes of children's braindynamics is presented.
In the present study, 60 ASD children (45 boysand 5 girls from 3 to 11 years old) and 60 normalchildren (50 boys and 10 girls from 3 to 11 years old)are chosen; having �lled the EEG recording protocolform, they were diagnosed by an specialist based onDSM5 criteria.
Data, in this research, are recorded by ProComp5

3260 Gh. Sadeghi Bajestani et al./Scientia Iranica, Transactions D: Computer Science & ... 24 (2017) 3257{3267
In�niti� and EEG double channel recording on C3 andC4 electrodes with sampling frequency of 256 Hz. Datarecording process consists of �lling the questionnaireby parents and recording in a sound room with twochannels (in C3 and C4 channels in 10-20 system). Thechild is �rst put in the sound room and EEG is recordedfor 2 minutes. Then, his/her favorite animation isplayed for 5 minutes. Then, the same animation isplayed without sound, and the kid pays full attentionto the screen in both cases.
Hence, in this process, there are three condi-tions in each case: base form (2 minutes), watchingthe animation with audio (V-A) for 5 minutes, andwatching the animation with muted audio band (VwA)for 5 minutes. It is worth mentioning that soundroom is an acoustic room without any environmentalnoises with precise sound and voice control for childrenempowerment in the center. C3 and C4 channels areused for two reasons: clinical and technical (Figure 3).
The primary reason is the fact that installation ofthe children from the middle of spectrum to the restwith recording cap using plate-like electrodes (madewith gold and special jelly with temporary conductivityand adhesion) is easy and quick; moreover, C3 and C4in 10-20 systems have the most stability even in caseof head movement. The second reason is the former
Figure 3. Location of electrodes in international 10-20system; the used channels are shown with gray color andred line and sound room.
studies based on the importance of mirror and MUrhythm in ASD studies [10,18-24].
The core question of data recording is that CTand MRI are both advanced neuroimaging tools. Whydo we still choose EEG in this research? Two mainreasons are:
1. It is important to note that in the living system,global order or coherence must be sustained andmaintained over time, so CT and MRI are not goodchoices for date recording for dynamical studies;
2. CT cannot represent adequate information even forstatistical analysis, but fMRI is better. However,using fMRI is expensive and limited centers couldfollow up on it, so using EEG is a sine qua non forscreening and investigating the studies.
3.2. ProcedureTo extract information, instead of using methods basedon signal amplitude, an independent method fromamplitude and energy can be applied. In normalquanti�cations of QEEG, amplitude and signal energyin di�erent bands are solely considered, but to obtainsignal information, we have to look for transforma-tions which take signal to information phase. Inthis research, Poincar�e section is used for extractinginformation from signal and new indexes are alsointroduced for its quanti�cation. In this section, �rst,we focus on how to implement Poincar�e section on EEGsignal, and then move on to the extracted features. Interms of optimum feature investigation, to compare thetwo groups of independent t-test, two channels in agroup of paired t-test and two channels in two groupsof Repeated Measures Analysis of Covariance are used;Pearson test is also used to investigate the relationbetween situations of with and without voice.
3.3. Poincar�e sectionThree general methods are used for Poincar�e section:time sampling, sampling with regard to special events,and geometrical methods. Time sampling, known asstroboscopic, is mostly used in the study of autonomoussystems with a single alternating input [25]. Stro-boscopic is known as the origin of Poincar�e sectionin which the vantage point is the geometrical inter-section with trajectories regardless of the samplingtime. Sampling with regard to special events mostlyreveals the peaks, such as the interval between twoheart beats. Geometrical section is a general methodand does not have a special application. Based onTakens' theory, if time series of one of the outputs ofa set of di�erential equations is available, by using it,phase plane with a dimension twice as much as themain phase state with the same basic features can bereconstructed [26]. These basic characteristics includedimension, Lyapunov exponents, and entropy [27]. Themin idea in phase space reconstruction and study of

Gh. Sadeghi Bajestani et al./Scientia Iranica, Transactions D: Computer Science & ... 24 (2017) 3257{3267 3261
system's dynamics is to determine the present samplefrom the former, and time series follows a di�erentialequation or a recursive transformation [28,29]. Toreconstruct phase plane, knowing space dimension (m)and delay (�) is essential; hence, these values have tobe estimated [29]. Considerable point is the fact thatthere exists more than one method for this purpose; forinstance, delay can be estimated with correlation di-mension and mutual information [30]. To estimate thecorrelation dimension, Higuchi [31] and False NearestNeighbor (FNN) can be used [32]. Auto-correlation ormutual information are de�ned with random signals,and they are used to estimate the state of dynamicalsignals that variables in each moment are generatedfrom the previous moment, which is notable [33,34].
In addition, reconstructed phase plane is sensitiveto delay and reconstruction dimension, while estimatedvalues, using di�erent methods, are considerably dif-ferent. Moreover, most of the times, the estimateddimension is more than 3, and it is shown in 2 or 3dimensions due to practical reasons [35,36]; in fact, theestimated reconstructed dimension is left useless [36].
Another considerable point is the fact that inthe reconstructed space [37], the limits of all variablesare the same as those of the used variable. In [38],EEG is presented in two dimensions with di�erent re-constructing delays. Despite some initial assumptionsin some papers, it is said that many chaotic systems(e.g., Lorenz, Russler), signals (i.e., EEG), and theirphase plane reconstruction are not sensitive to (m) [39].According to what was mentioned above, althoughmost of the studies on phase plane reconstruction areconsidered as the foundation of theoretical problemsolving, they do not implement it in practice. Oneof the approaches to phase space reconstruction is rel-ativism, and this method is accompanied by a relativeapproach to the system. In this method, depending onthe sampling frequency, each sample can be presentedwith regard to the previous one. What happens inTakens' theory phase plane reconstruction leads to sucha presentation. However, two major di�erences of thismethod are:
1. The non-requirement of any delay and systemdimension estimation;
2. Not claiming at all that this method is capable ofachieving new variables and their representations.
In most of the resources, these diagrams are calledLorenz or Poincar�e. But, the main di�erence of thismethod from Poincar�e diagram is that the recon-structed diagram is not determined using this approachby Poincar�e section [37,40]. After representation inthe proper space, a proper section is to be determined.This step is of high importance, and numerous methodscan be implemented for choosing a proper section which
indeed is dependent on the application of cyberneticsignal. If the goal is to determine system's dynamics,periodic or chaotic, Poincar�e section is chosen correctlywhen it intersects all the trajectory rings [41]. In fact,in this series of problems, each intersection point is arepresentation of an orbit of the trajectory. If there isone point with the mentioned features, it is that thebehavior is periodic one. In this approach, the workingpoint of the system can be the intersecting point on thesection (special state), or this trajectory will pass thesame point. With an increase in the section points,system's period will be 2, 3, etc. Only the timesequence of the points can be determined using phasespace and Poincar�e section results, and no conclusioncan be made with regard to the time distance betweenthem [42]. In the relative representation of the two-dimensional space, line section (straight line or curve)is appropriate.
In our point of view, choosing the section de-termines the question which is asked of the system'sdynamics, and the more technical the question is, themore perspectives of the dynamics it reveals. But,what is an appropriate section? The answer consistsof two contradictory parts; a proper section has moreintersection points and is placed where we have themost stretching of the signal. In fact, there should bea balance between the numbers of intersection pointand stretching, which are like stability and exibility ofthe system, or to make it more simple, like accelerationand brake. In the following, to choose the indexes, bothabove-mentioned points are considered simultaneously:one is known as number of point (HD) and one asdivergence (D). In Figure 4, two-dimensional relativerepresentation and �rst-order intersection with y =�x + � are used, and � = 1, � = 0 [43]. In otherwords, the relation of the points on the section is inthe form of xn+1 = xn.
4. Feature extraction
The most important aspect in Poincar�e section is thearrangement of the points on the section; in otherwords, the extracted information from Poincar�e sectionis from the points. The important question here isthe informative essence of Poincar�e section, which isshown in Figure 5. As it can be clearly seen, usingPoincar�e section, point #1 which has a great di�erencein amplitude compared to point #3 is chosen as asection point, but point #2 that has a little di�erencecompared to point #3 is not chosen; therefore, this isthe informative approach that depletes energy.
In this research, divergence index is used toinvestigate the arrangement of the Poincar�e sectionpoints. In this criterion, in this index, Euclideandistance of all points from the average point is usedas an index. As shown in Figure 6, suppose n

3262 Gh. Sadeghi Bajestani et al./Scientia Iranica, Transactions D: Computer Science & ... 24 (2017) 3257{3267
Figure 4. Poincar�e section of EEG signal in relativistic reconstructed phase plane ((a) and (b)) and time domain ((c) and(d)) with Y = X section and the same length. (a) and (c) is Autism in V-A and (b) and (d) are normal.
Figure 5. Informative essence of Poincar�e.
points of Poincar�e section in two-dimensional space.These points are arranged as n columns of matrixP (P 2 <2�N ) and P = [p1; p2; � � � ; pN ]. Averageof all points in vertical and horizontal angles is pm(pm 2 <2) and yields pm = 1
nPNi=1 pi; then, the
sum of Euclidean distances between pi and pm iscomputed from Eq. (6) [44], meaning Euclidean normand Heaviside function presented in Eq. (7):
di = kpi � pmk; (6)
%endgather�(x) =
(0 x < 01 x � 0
(7)
Figure 6. Index for ordering of point in Poincar�e section.
Div =NXi=1
dm; (8)
HD =NXi=1
�(Hthr � di); (9)
C(R) =1
N � 1
NXi=1
NXj=1;j 6=i
�(xi � xj): (10)

Gh. Sadeghi Bajestani et al./Scientia Iranica, Transactions D: Computer Science & ... 24 (2017) 3257{3267 3263
The extracted features in this state investigate thearrangement of the Poincar�e points with regard tothe dispersion. Di�erent features were extracted fromthe Poincar�e section from which two are labeled as\important":
1. Number of Poincar�e points whose distance fromthe center of gravity is higher than the threshold(dm > Hthr) as in Eq. (9). This concept resemblescorrelation sum, yet with considerable di�erence;having a de�nite direction on trajectory that canalso be named \Poincar�e Section". The parameter\HD", introduced in Eq. (9), focuses on de�nitedirection while C(R), in Eq. (10), is about de�nitedistance;
2. The overall dispersion calculated from Eq. (8) thatis synonymous with stretching-folding concept. Inthe following, we work on statistical analysis of theresults and their features.
5. Results
Based on the two features already mentioned, we aregoing to analyze each index in the following. HD Index:As already mentioned, this feature shows the number ofpoints from Poincar�e section (in each 4 seconds) whosedistance from intersection points' weight point (Pm inthe above �gure) is more than the threshold (dm >Hthr). In other words, this feature investigates thedivergence of the Poincar�e section points. HD index intwo channels C3 and C4 in VwA and V-A situations isinvestigated. Figure 7 shows four recent features.
Figure 7. Comparison of HD index in normal and ASDcases. Dxx de�nition: xx is 13 with VwA situation and C3electrode; is 14 with VwA situation and C4 electrode; is23 with V-A situation and C3 electrode; and is 24 withV-A situation and C4 electrode.
Figure 8. Comparison of D index in normal and ASDcases. HDxx de�nition: xx is 13 with VwA situation andC3 electrode; is 14 with VwA situation and C4 electrode;is 23 with V-A situation and C3 electrode; and is 24 withV-A situation and C4 electrode.
As shown in Figure 7, a distinctive di�erenceis observable between the normal and ASD cases inHD criteria under both VwA and V-A situations;the intensi�ed di�erence in VwA situation is also aninteresting fact.
D Index shows the value of Div outcome of Eq. (8)and demonstrates the general divergence; smaller num-ber means more folding and larger number means morestretching.
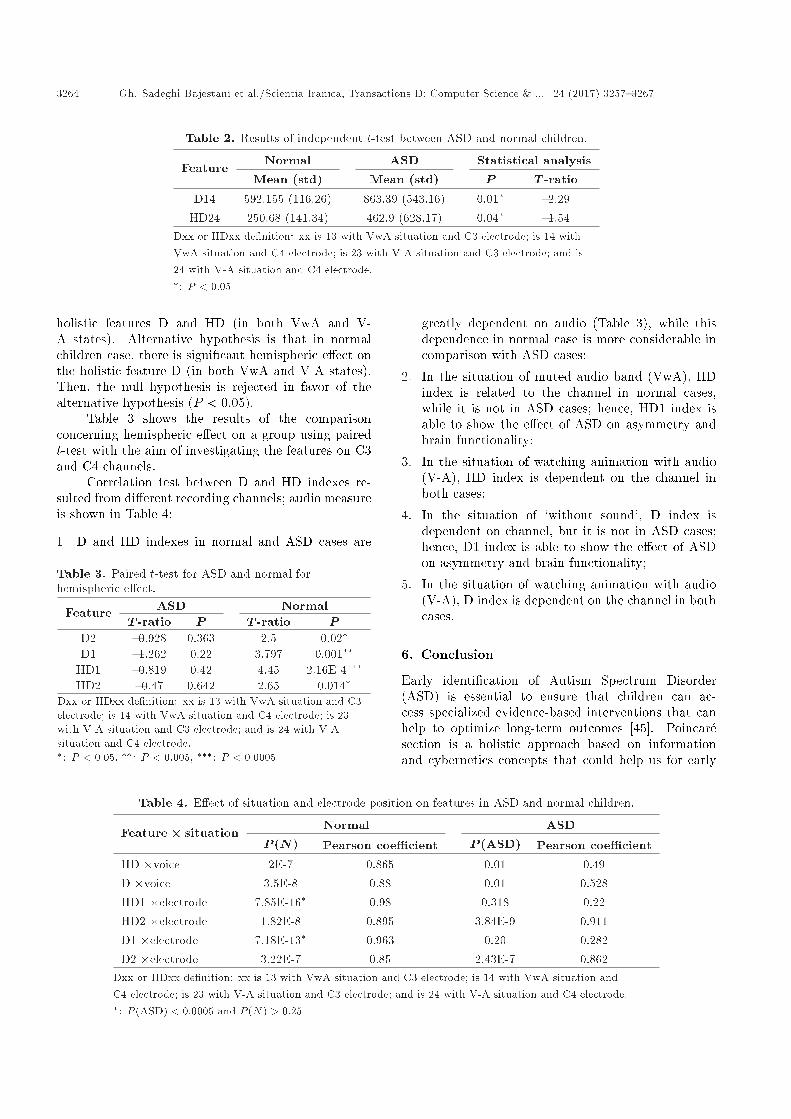
As can be seen (in Figure 8), divergence in ASDcase is much more than normal cases. The second pointis that asymmetry in hemispheres, the region in which95% of the data lie, is much smaller in normal casescompared to ASD, and this di�erence maximizes C4electrode. To investigate the optimum index and tocompare two groups of independent t-test, two channelsin a group paired t-test and two channels in two groupsof Repeated Measure analysis of covariance are used.Pearson test is also used to investigate the relationbetween VwA and V-A with and without situations; allstatistical analyses are done with [email protected] Table 2, the Null hypothesis is: Holistic featuresD14 (VwA state on channel C4) and HD24 (V-Astate on channel C4) cannot discriminate normal casesfrom ASD ones. Alternative hypothesis states thatD14 and HD24 can discriminate normal cases fromASD ones. Then, the null hypothesis is rejectedin favor of the alternative hypothesis (P < 0:05).The comparison between normal and ASD groups isdone using independent t-test; considerable di�erenceis observable in D index on C4 in VwA situation,t(120) = 6:582, P = 0:01, and in HD on C4 in VwAsituation, t(120) = �1:546, P = 0:04, (Table 2).
In Table 3, null hypothesis is that in normalchildren case, there is no hemispheric e�ect on the
3264 Gh. Sadeghi Bajestani et al./Scientia Iranica, Transactions D: Computer Science & ... 24 (2017) 3257{3267
Table 2. Results of independent t-test between ASD and normal children.
Feature Normal ASD Statistical analysisMean (std) Mean (std) P T -ratio
D14 592.155 (116.26) 863.39 (543.16) 0.01� {2.29HD24 250.68 (141.34) 462.9 (628.17) 0.04� {1.54
Dxx or HDxx de�nition: xx is 13 with VwA situation and C3 electrode; is 14 withVwA situation and C4 electrode; is 23 with V-A situation and C3 electrode; and is24 with V-A situation and C4 electrode.�: P < 0:05
holistic features D and HD (in both VwA and V-A states). Alternative hypothesis is that in normalchildren case, there is signi�cant hemispheric e�ect onthe holistic feature D (in both VwA and V-A states).Then, the null hypothesis is rejected in favor of thealternative hypothesis (P < 0:05).
Table 3 shows the results of the comparisonconcerning hemispheric e�ect on a group using pairedt-test with the aim of investigating the features on C3and C4 channels.
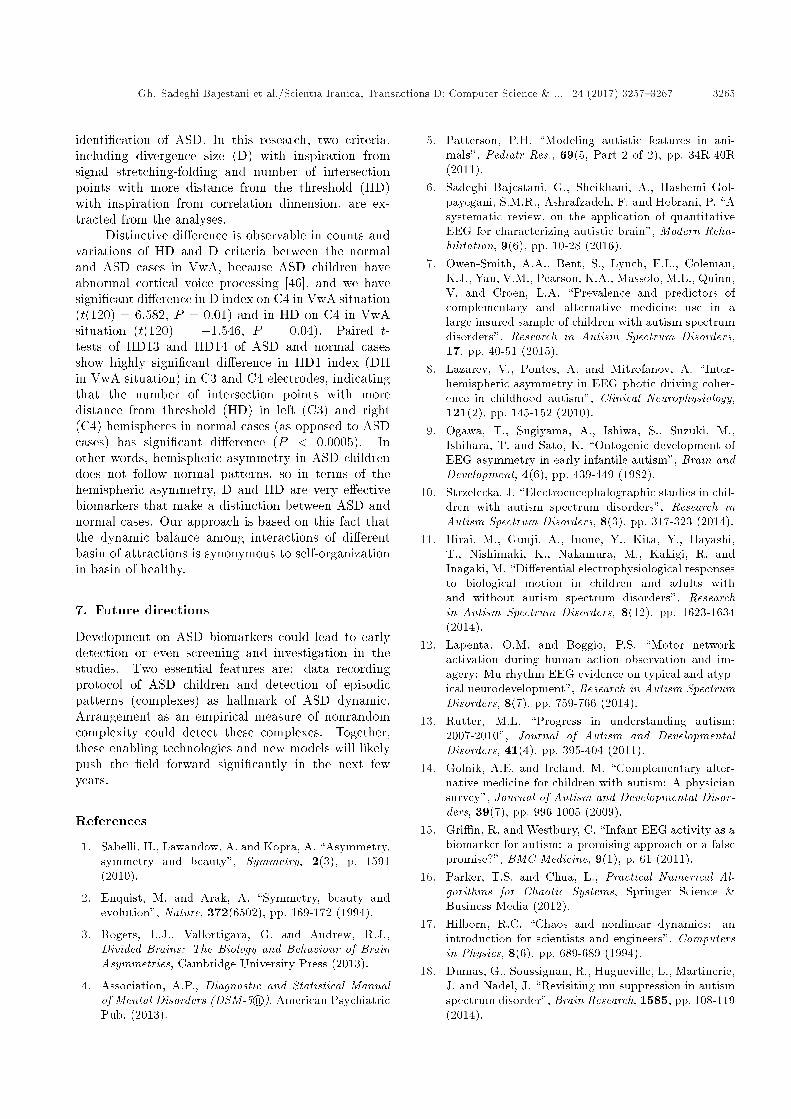
Correlation test between D and HD indexes re-sulted from di�erent recording channels; audio measureis shown in Table 4:
1. D and HD indexes in normal and ASD cases are
Table 3. Paired t-test for ASD and normal forhemispheric e�ect.
Feature ASD NormalT -ratio P T -ratio P
D2 {0.928 0.363 2.5 0.02�D1 {1.262 0.22 3.797 0.001��
HD1 {0.819 0.42 4.45 2.16E-4���HD2 {0.47 0.642 2.65 0.014�
Dxx or HDxx de�nition: xx is 13 with VwA situation and C3electrode; is 14 with VwA situation and C4 electrode; is 23with V-A situation and C3 electrode; and is 24 with V-Asituation and C4 electrode.�: P < 0:05, ��: P < 0:005, ���: P < 0:0005
greatly dependent on audio (Table 3), while thisdependence in normal case is more considerable incomparison with ASD cases;
2. In the situation of muted audio band (VwA), HDindex is related to the channel in normal cases,while it is not in ASD cases; hence, HD1 index isable to show the e�ect of ASD on asymmetry andbrain functionality;
3. In the situation of watching animation with audio(V-A), HD index is dependent on the channel inboth cases;
4. In the situation of `without sound', D index isdependent on channel, but it is not in ASD cases;hence, D1 index is able to show the e�ect of ASDon asymmetry and brain functionality;
5. In the situation of watching animation with audio(V-A), D index is dependent on the channel in bothcases.
6. Conclusion
Early identi�cation of Autism Spectrum Disorder(ASD) is essential to ensure that children can ac-cess specialized evidence-based interventions that canhelp to optimize long-term outcomes [45]. Poincar�esection is a holistic approach based on informationand cybernetics concepts that could help us for early
Table 4. E�ect of situation and electrode position on features in ASD and normal children.
Feature� situation Normal ASDP (N) Pearson coe�cient P (ASD) Pearson coe�cient
HD �voice 2E-7 0.865 0.01 0.49D �voice 3.5E-8 0.88 0.01 0.528HD1 �electrode 7.85E-16� 0.98 0.318 0.22HD2 �electrode 1.82E-8 0.895 3.84E-9 0.911D1 �electrode 7.18E-13� 0.963 0.20 0.282D2 �electrode 3.22E-7 0.85 2.43E-7 0.862
Dxx or HDxx de�nition: xx is 13 with VwA situation and C3 electrode; is 14 with VwA situation andC4 electrode; is 23 with V-A situation and C3 electrode; and is 24 with V-A situation and C4 electrode.�: P (ASD) < 0:0005 and P (N) > 0:25
Gh. Sadeghi Bajestani et al./Scientia Iranica, Transactions D: Computer Science & ... 24 (2017) 3257{3267 3265
identi�cation of ASD. In this research, two criteria,including divergence size (D) with inspiration fromsignal stretching-folding and number of intersectionpoints with more distance from the threshold (HD)with inspiration from correlation dimension, are ex-tracted from the analyses.
Distinctive di�erence is observable in counts andvariations of HD and D criteria between the normaland ASD cases in VwA, because ASD children haveabnormal cortical voice processing [46], and we havesigni�cant di�erence in D index on C4 in VwA situation(t(120) = 6:582, P = 0:01) and in HD on C4 in VwAsituation (t(120) = �1:546, P = 0:04). Paired t-tests of HD13 and HD14 of ASD and normal casesshow highly signi�cant di�erence in HD1 index (DHin VwA situation) in C3 and C4 electrodes, indicatingthat the number of intersection points with moredistance from threshold (HD) in left (C3) and right(C4) hemispheres in normal cases (as opposed to ASDcases) has signi�cant di�erence (P < 0:0005). Inother words, hemispheric asymmetry in ASD childrendoes not follow normal patterns, so in terms of thehemispheric asymmetry, D and HD are very e�ectivebiomarkers that make a distinction between ASD andnormal cases. Our approach is based on this fact thatthe dynamic balance among interactions of di�erentbasin of attractions is synonymous to self-organizationin basin of healthy.
7. Future directions
Development on ASD biomarkers could lead to earlydetection or even screening and investigation in thestudies. Two essential features are: data recordingprotocol of ASD children and detection of episodicpatterns (complexes) as hallmark of ASD dynamic.Arrangement as an empirical measure of nonrandomcomplexity could detect these complexes. Together,these enabling technologies and new models will likelypush the �eld forward signi�cantly in the next fewyears.
References
1. Sabelli, H., Lawandow, A. and Kopra, A. \Asymmetry,symmetry and beauty", Symmetry, 2(3), p. 1591(2010).
2. Enquist, M. and Arak, A. \Symmetry, beauty andevolution", Nature, 372(6502), pp. 169-172 (1994).
3. Rogers, L.J., Vallortigara, G. and Andrew, R.J.,Divided Brains: The Biology and Behaviour of BrainAsymmetries, Cambridge University Press (2013).
4. Association, A.P., Diagnostic and Statistical Manualof Mental Disorders (DSM-5r), American PsychiatricPub. (2013).
5. Patterson, P.H. \Modeling autistic features in ani-mals", Pediatr Res., 69(5, Part 2 of 2), pp. 34R-40R(2011).
6. Sadeghi Bajestani, G., Sheikhani, A., Hashemi Gol-payegani, S.M.R., Ashrafzadeh, F. and Hebrani, P. \Asystematic review, on the application of quantitativeEEG for characterizing autistic brain", Modern Reha-bilitation, 9(6), pp. 10-28 (2016).
7. Owen-Smith, A.A., Bent, S., Lynch, F.L., Coleman,K.J., Yau, V.M., Pearson, K.A., Massolo, M.L., Quinn,V. and Croen, L.A. \Prevalence and predictors ofcomplementary and alternative medicine use in alarge insured sample of children with autism spectrumdisorders", Research in Autism Spectrum Disorders,17, pp. 40-51 (2015).
8. Lazarev, V., Pontes, A. and Mitrofanov, A. \Inter-hemispheric asymmetry in EEG photic driving coher-ence in childhood autism", Clinical Neurophysiology,121(2), pp. 145-152 (2010).
9. Ogawa, T., Sugiyama, A., Ishiwa, S., Suzuki, M.,Ishihara, T. and Sato, K. \Ontogenic development ofEEG-asymmetry in early infantile autism", Brain andDevelopment, 4(6), pp. 439-449 (1982).
10. Strzelecka, J. \Electroencephalographic studies in chil-dren with autism spectrum disorders", Research inAutism Spectrum Disorders, 8(3), pp. 317-323 (2014).
11. Hirai, M., Gunji, A., Inoue, Y., Kita, Y., Hayashi,T., Nishimaki, K., Nakamura, M., Kakigi, R. andInagaki, M. \Di�erential electrophysiological responsesto biological motion in children and adults withand without autism spectrum disorders", Researchin Autism Spectrum Disorders, 8(12), pp. 1623-1634(2014).
12. Lapenta, O.M. and Boggio, P.S. \Motor networkactivation during human action observation and im-agery: Mu rhythm EEG evidence on typical and atyp-ical neurodevelopment", Research in Autism SpectrumDisorders, 8(7), pp. 759-766 (2014).
13. Rutter, M.L. \Progress in understanding autism:2007-2010", Journal of Autism and DevelopmentalDisorders, 41(4), pp. 395-404 (2011).
14. Golnik, A.E. and Ireland, M. \Complementary alter-native medicine for children with autism: A physiciansurvey", Journal of Autism and Developmental Disor-ders, 39(7), pp. 996-1005 (2009).
15. Gri�n, R. and Westbury, C. \Infant EEG activity as abiomarker for autism: a promising approach or a falsepromise?", BMC Medicine, 9(1), p. 61 (2011).
16. Parker, T.S. and Chua, L., Practical Numerical Al-gorithms for Chaotic Systems, Springer Science &Business Media (2012).
17. Hilborn, R.C. \Chaos and nonlinear dynamics: anintroduction for scientists and engineers", Computersin Physics, 8(6), pp. 689-689 (1994).
18. Dumas, G., Soussignan, R., Hugueville, L., Martinerie,J. and Nadel, J. \Revisiting mu suppression in autismspectrum disorder", Brain Research, 1585, pp. 108-119(2014).

3266 Gh. Sadeghi Bajestani et al./Scientia Iranica, Transactions D: Computer Science & ... 24 (2017) 3257{3267
19. Bernier, R., Dawson, G., Webb, S. and Murias,M. \EEG mu rhythm and imitation impairments inindividuals with autism spectrum disorder", Brain andCognition, 64(3), pp. 228-237 (2007).
20. Friedrich, E.V., Suttie, N., Sivanathan, A., Lim, T.,Louchart, S. and Pineda, J.A. \Brain-computer in-terface game applications for combined neurofeedbackand biofeedback treatment for children on the autismspectrum", Frontiers in Neuroengineering, 7, p. 21(2014).
21. Khan, S., Michmizos, K., Tommerdahl, M., Ganesan,S., Kitzbichler, M.G., Zetino, M., Garel, K.L.A.,Herbert, M.R., H�am�al�ainen, M.S. and Kenet, T.\Somatosensory cortex functional connectivity abnor-malities in autism show opposite trends, depending ondirection and spatial scale", Brain, 138(5), pp. 1394-1409 (2015).
22. Cuevas, K., Cannon, E.N., Yoo, K. and Fox, N.A.\The infant EEG mu rhythm: Methodological consid-erations and best practices", Developmental Review,34(1), pp. 26-43 (2014).
23. Coll, M.P., Bird, G., Catmur, C. and Press, C. \Cross-modal repetition e�ects in the mu rhythm indicatetactile mirroring during action observation", Cortex,63, pp. 121-131 (2015).
24. Brown, E.C., Gonzalez-Liencres, C., Tas, C. andBr�une, M. \Reward modulates the mirror neuronsystem in schizophrenia: A study into the mu rhythmsuppression, empathy, and mental state attribution",Social Neuroscience, pp. 1-12 (2015).
25. Denton, T.A. and Diamond, G.A. \Can the analytictechniques of nonlinear dynamics distinguish periodic,random and chaotic signals?", Computers in Biologyand Medicine, 21(4), pp. 243-263 (1991).
26. Stam, C.J. \Nonlinear dynamical analysis of EEG andMEG:Review of an emerging �eld", Clinical Neuro-physiology, 116, pp. 2266-2301 (2005).
27. Takens, F. \Detecting strange attractors in turbu-lence", Lecture Notes in Mathematics, 898, pp. 366-381 (1981).
28. Liu, Z. \Chaotic time series analysis", MathematicalProblems in Engineering, 2010, p. 31 (2010).
29. Takens, F. \Detecting strange attractors in turbu-lence", Lecture Notes in Mathematics, 898(1), pp. 366-381 (1981).
30. Andrew, M.F. and Swinney H.L. \Independent coordi-nates for strange attractors from mutual information",Phys. Rev. A 33, 1134, 33(2), pp. 1134-1140 (1986).
31. Higuchi, T. \Approach to an irregular time series onthe basis of the fractal theory", Physica D: NonlinearPhenomena, 31(2), pp. 277-283 (1988).
32. Hegger, R. and Kantz, H. \Improved false nearestneighbor method to detect determinism in time seriesdata", Physical Review E, 60(4), p. 4970 (1999).
33. Grassberger, P. \Generalized dimensions of strangeatfractors", Physics Letters A, 97(6), pp. 227-230 (5Sept. 1983).
34. Kennel, M.B., Brown, R. and Abarbanel, H.D.I. \De-termining embedding dimension for phase-space recon-struction using a geometrical construction", Phys. Rev.A, 3403 - Published, 45(6), pp. 3403-3411 (1 March1992).
35. Dvorak, I. and Siska, J. \On some problems encoun-tered in the estimation of the correlation dimension ofthe EEG", Physics Letters A, 118(2), pp. 63-66 (Sept.1986).
36. Dvo�r�ak, I. \Takens versus multichannel reconstructionin EEG correlation exponent estimates", Physics Let-ters A, 151(5), pp. 225-233 (10 Dec. 1990).
37. Sharma, R. and Pachori, R.B. \Classi�cation of epilep-tic seizures in EEG signals based on phase spacerepresentation of intrinsic mode functions", ExpertSystems with Applications, 42(3), pp. 1106-1117 (15Feb. 2015).
38. Jianbo, G., Hu, J. and Tung, W. \Complexity mea-sures of brain wave dynamics", Cognitive Neurodynam-ics, 5(2), pp. 171-182 (2011).
39. Rong-Yi, Y. and Xiao-Jing, H. \Phase space recon-struction of chaotic dynamical system based on waveletdecomposition", Chinese Physics B, 20(2), p. 020505(2011).
40. Dabanloo, N.J., Moharreri, S., Parvaneh, S. andNasrabadi, A.M. \Application of novel mapping forheart rate phase space and its role in cardiac arrhyth-mia diagnosis", In Computing in Cardiology, 2010, pp.209-212 (2010).
41. Hilborn, R., Chaos and Nonlinear Dynamics: An In-troduction for Scientists and Engineers, USA: OxfordUniversity Press (Jan. 11, 2001).
42. Piskorski, J. and Guzik, P. \Geometry of the Poincar�eplot of RR intervals and its asymmetry in healthyadults", Physiological Measurement, 28 (IOP Publish-ing), pp. 287-300 (2007).
43. Bajestani, G.S., Sheikhani A., Hashemi Golpayegani,M.R., Ashrafzadehi, F. and Hebrani, P. \Cyberneticapproach in identi�cation of brain pattern variationsin autism spectrum disorder. Biomedical Engineering:Applications", Basis and Communications, 28(01), p.1650006 (2016).
44. Jafari, S., Sprott, J.C., Pham, V., Hashemi Gol-payegani, S.M.R. and Jafari, A.H. \A new cost func-tion for parameter estimation of chaotic systems usingreturn maps as �ngerprints", International Journal ofBifurcation and Chaos, 24(10), p. 1450134 (2014).
45. Woods, J.J. and Wetherby, A.M. \Early identi�cationof autism spectrum disorder: Recommendations forpractice and research", Pediatrics, 136(Supplement 1),pp. S10-S40 (2015).

Gh. Sadeghi Bajestani et al./Scientia Iranica, Transactions D: Computer Science & ... 24 (2017) 3257{3267 3267
46. Gervais, H., Belin, P., Boddaert, N., Leboyer, M.,Coez, A., Sfaello, I., Barth'el'emy, C., Brunelle, F.,Samson, Y. and Zilbovicius, M. \Abnormal corticalvoice processing in autism", Nature Neuroscience,7(8), pp. 801-802 (2004).
47. Okazaki, R., Takahashi, T., Koichi Takahashi, K.,Ishitobi, M., Kikuchi, M., Higashima, M. and Wada,Y. \Changes in EEG complexity with electroconvulsivetherapy in a patient with autism spectrum disorders:A multiscale entropy approach", Frontiers in HumanNeuroscience, 9, p. 106 (2015).
48. Hoole, P.R.P., Pirapaharan, K., Basar, S.A., Ismail,R., Liyanage, D.L.D.A., Senanayake, S.S.H.M.U.L.and Hoole S.R.H. \Autism, EEG and brain electro-magnetics research" in Biomedical Engineering andSciences (IECBES), IEEE EMBS Conference on,(2012).
49. Ahmadlou, M., Adeli, H. and Adeli, A. \Fractality anda wavelet-chaos-neural network methodology for EEG-based diagnosis of autistic spectrum disorder", Journalof Clinical Neurophysiology, 27(5), pp. 328-333 (2010).
50. Du�y, F.H. and Als, H. \A stable pattern of EEGspectral coherence distinguishes children with autismfrom neuro-typical controls-a large case control study",BMC Medicine, 10(1), p. 64 (2012).
51. Peters, J.M., Taquet, M. , Vega, C. , Jeste, S.S.,S�anchez Fern�andez, I. , Tan, J., Nelson, C. A., Sahin,M. and War�eld, S.K. \Brain functional networks insyndromic and non-syndromic autism: a graph theo-retical study of EEG connectivity", BMC Medicine,11(1), p. 54 (2013).
52. Goh, S., Dong, Z., Zhang, Y., DiMauro, S. and Peter-son B.S. \Mitochondrial dysfunction as a neurobiolog-ical subtype of autism spectrum disorder: Evidencefrom brain imaging", JAMA Psychiatry, 71(6), pp.665-671 (2014).
53. L�eveill�e, C., Barbeau, E.B., Bolduc, C., Limoges,�E., Berthiaume, C., Chevrier, �E., Mottron, L. andGodbout, R. \Enhanced connectivity between visualcortex and other regions of the brain in autism: a REMsleep EEG coherence study", Autism Research, 3(5),pp. 280-285 (2010).
54. Lazarev, V.V., Pontes, A. and Mitrofanov, A.A.\Interhemispheric asymmetry in EEG photic drivingcoherence in childhood autism", Clinical Neurophysi-ology, 121(2), pp. 145-152 (2010).
55. Tierney, A.L., Gabard-Durnam, L., Vogel-Farley, V.,Tager-Flusberg, H. and Nelson, C.A. \Developmentaltrajectories of resting EEG power: an endophenotypeof autism spectrum disorder", PloS One, 7(6), p.e39127 (2012).
56. Tierney, A.L., Gabard-Durnam, L., Vogel-Farley, V.,Tager-Flusberg, H. and Nelson, C.A. Developmental
Trajectories of Resting EEG Power: An Endopheno-type of Autism Spectrum Disorder, Clinical Neurophys-iology, 123(9), pp. 1798-1809 (2012).
57. Mathewson, K.J., Jetha, M.K., Drmic, I.E., Bryson,S.E., Goldberg, J.O. and Schmidt, L.A. \RegionalEEG alpha power, coherence, and behavioral symp-tomatology in autism spectrum disorder", ClinicalNeurophysiology, 123(9), pp. 1798-1809 (2012).
58. Coben, R., et al. \EEG power and coherence in autisticspectrum disorder", Clinical Neurophysiology, 119(5),pp. 1002-1009 (2008).
59. Isler, J.R., et al. \Reduced functional connectivity invisual evoked potentials in children with autism spec-trum disorder", Clinical Neurophysiology, 121(12), pp.2035-2043 (2010).
60. Ahmadlou, M., Adeli, H. and Adeli, A. \Fuzzy syn-chronization likelihood-wavelet methodology for diag-nosis of autism spectrum disorder", Journal of Neuro-science Methods, 211(2), pp. 203-209 (2012).
61. Yasuhara, A. \Correlation between EEG abnormalitiesand symptoms of autism spectrum disorder (ASD)",Brain and Development, 32(10), pp. 791-798 (2010).
Biographies
Ghasem Sadeghi Bajestani is a PhD student ofBiomedical Engineering. His research interests arechaotic dynamics and applications, complexity theoryand cybernetics.
Ali Sheikhani is an Assistant Professor of BiomedicalEngineering, Islamic Azad University, Science andResearch Branch, Tehran, Iran. His research interestsare biomedical signal processing, signal processing, andbio instruments.
Seyed Mohammad Reza Hashemi Golpayeganiis a Professor of Biomedical Engineering, AmirkabirUniversity of Technology. His research interests arechaotic dynamics and applications, complexity theoryand cybernetics.
Farah Ashrafzadeh is a Professor of Pediatric neurol-ogy, Mashhad University of Medical Sciences (MUMS)Mashhad, Iran. Her research interests are herbaltherapy in epilepsy and Brain structural abnormality-Developmental delay.
Paria Hebrani is an Associate Professor of Child andAdolescent Psychiatry, Mashhad University of MedicalSciences (MUMS) Mashhad, Iran. Her research inter-ests are ADHD, Autism.


![Higher order Lagrange-Poincar´e and Hamilton-Poincar´e reductions · 2018-06-07 · arXiv:1407.0273v1 [math-ph] 1 Jul 2014 Higher order Lagrange-Poincar´e and Hamilton-Poincar´e](https://img.dokumen.tips/doc/110x75/5e734a59e19ac07efb66ad44/higher-order-lagrange-poincare-and-hamilton-poincare-reductions-2018-06-07.jpg)

![Around the Poincar e lemma, after Beilinson [1] Luc Illusie 1. The classical Poincar e ...illusie/... · 2015-05-17 · Around the Poincar e lemma, after Beilinson [1] Luc Illusie](https://img.dokumen.tips/doc/110x75/5e7cdf95e86d8138da6bceca/around-the-poincar-e-lemma-after-beilinson-1-luc-illusie-1-the-classical-poincar.jpg)


![Poincar e’s Odds · Poincar e, 1912-2012, Vol. XVI, 2012 Poincar e’s Odds 175 of his work. He wrote a review of Poincar e’s book for the journal Nature ([79]); the review was](https://img.dokumen.tips/doc/110x75/601348f269d8ea7b601956f4/poincar-eas-poincar-e-1912-2012-vol-xvi-2012-poincar-eas-odds-175-of-his.jpg)