Embed Size (px)
Citation preview
Page 2
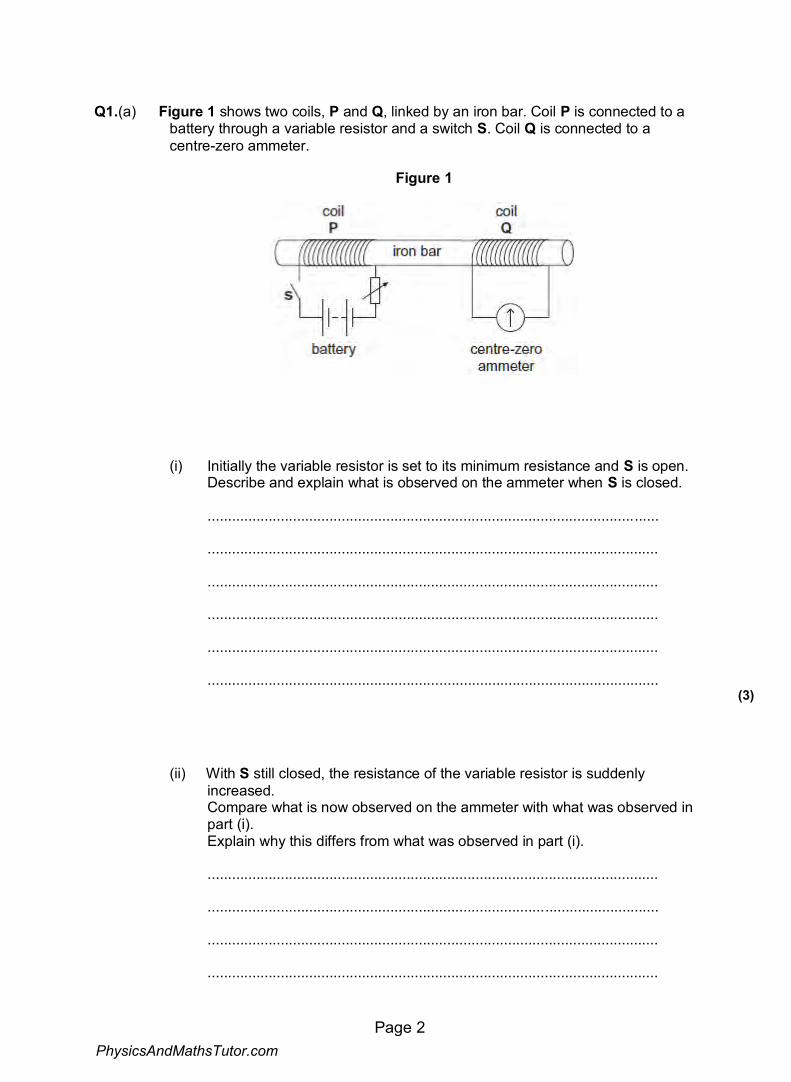
Q1.(a) Figure 1 shows two coils, P and Q, linked by an iron bar. Coil P is connected to a battery through a variable resistor and a switch S. Coil Q is connected to a centre-zero ammeter.
Figure 1
(i) Initially the variable resistor is set to its minimum resistance and S is open. Describe and explain what is observed on the ammeter when S is closed.
...............................................................................................................
...............................................................................................................
...............................................................................................................
...............................................................................................................
...............................................................................................................
............................................................................................................... (3)
(ii) With S still closed, the resistance of the variable resistor is suddenly increased. Compare what is now observed on the ammeter with what was observed in part (i). Explain why this differs from what was observed in part (i).
...............................................................................................................
...............................................................................................................
...............................................................................................................
...............................................................................................................
PhysicsAndMathsTutor.com

Page 3
............................................................................................................... (2)
(b) Figure 2 shows a 40-turn coil of cross-sectional area 3.6 × 10⁻³ m2 with its plane set at right angles to a uniform magnetic field of flux density 0.42 T.
Figure 2
(i) Calculate the magnitude of the magnetic flux linkage for the coil. State an appropriate unit for your answer.
flux linkage ....................................................... unit ..................... (2)
(ii) The coil is rotated through 90° in a time of 0.50 s. Determine the mean emf in the coil.
mean emf ................................................. V (2)
(Total 9 marks)
PhysicsAndMathsTutor.com

Page 4
Q2.The diagram below shows the main parts of a geophone.
The spike attaches the geophone firmly to the ground. At the instant an earthquake occurs, the case and coil move upwards due to the Earth’s movement. The magnet remains stationary due to its inertia. In 3.5 ms, the coil moves from a position where the flux density is 9.0 mT to a position where the flux density is 23.0 mT.
(a) The geophone coil has 250 turns and an area of 12 cm2.
Calculate the average emf induced in the coil during the first 3.5 ms after the start of the earthquake.
emf ................................................. V
PhysicsAndMathsTutor.com

Page 5
(3)
(b) Explain how the initial emf induced in the coil of the geophone would be affected:
if the stiffness of the springs were to be increased
........................................................................................................................
........................................................................................................................
if the number of turns on the coil were to be increased.
........................................................................................................................
........................................................................................................................ (2)
(c) (i) The geophone’s magnet has a mass of 8.0 × 10⁻³ kg and the spring stiffness of the system is 2.6 N m–1.
Show that the natural period of oscillation of the mass−spring system is approximately 0.35 s.
(2)
(ii) At the instant that the Earth stops moving after one earthquake, the emf in the coil is at its maximum value of +8 V. The magnet continues to oscillate.
On the grid below, sketch a graph showing the variation of emf with time as the magnet’s oscillation decays. Show at least three oscillations.
PhysicsAndMathsTutor.com

Page 6
(3)
(Total 10 marks)
Q3.Figure 1 shows an arrangement for investigating electromagnetic induction.
Figure 1
PhysicsAndMathsTutor.com
Page 7
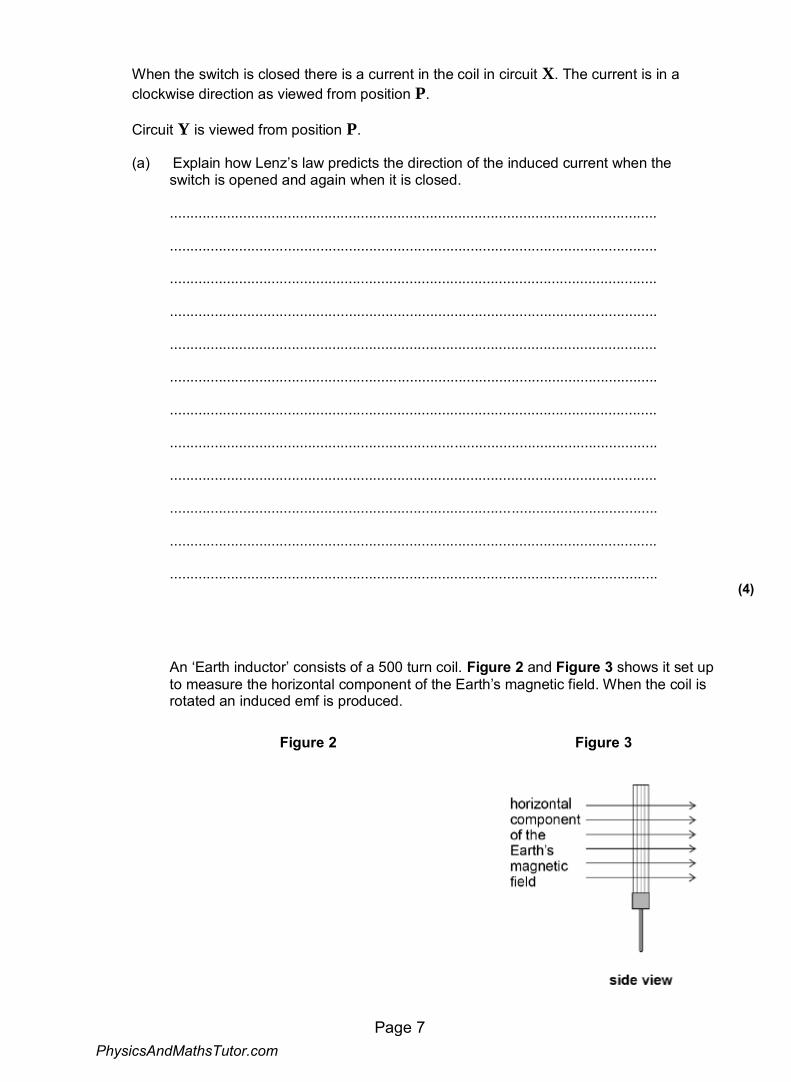
When the switch is closed there is a current in the coil in circuit X. The current is in a clockwise direction as viewed from position P.
Circuit Y is viewed from position P.
(a) Explain how Lenz’s law predicts the direction of the induced current when the switch is opened and again when it is closed.
........................................................................................................................
........................................................................................................................
........................................................................................................................
........................................................................................................................
........................................................................................................................
........................................................................................................................
........................................................................................................................
........................................................................................................................
........................................................................................................................
........................................................................................................................
........................................................................................................................
........................................................................................................................ (4)
An ‘Earth inductor’ consists of a 500 turn coil. Figure 2 and Figure 3 shows it set up to measure the horizontal component of the Earth’s magnetic field. When the coil is rotated an induced emf is produced.
Figure 2 Figure 3
PhysicsAndMathsTutor.com
Page 8
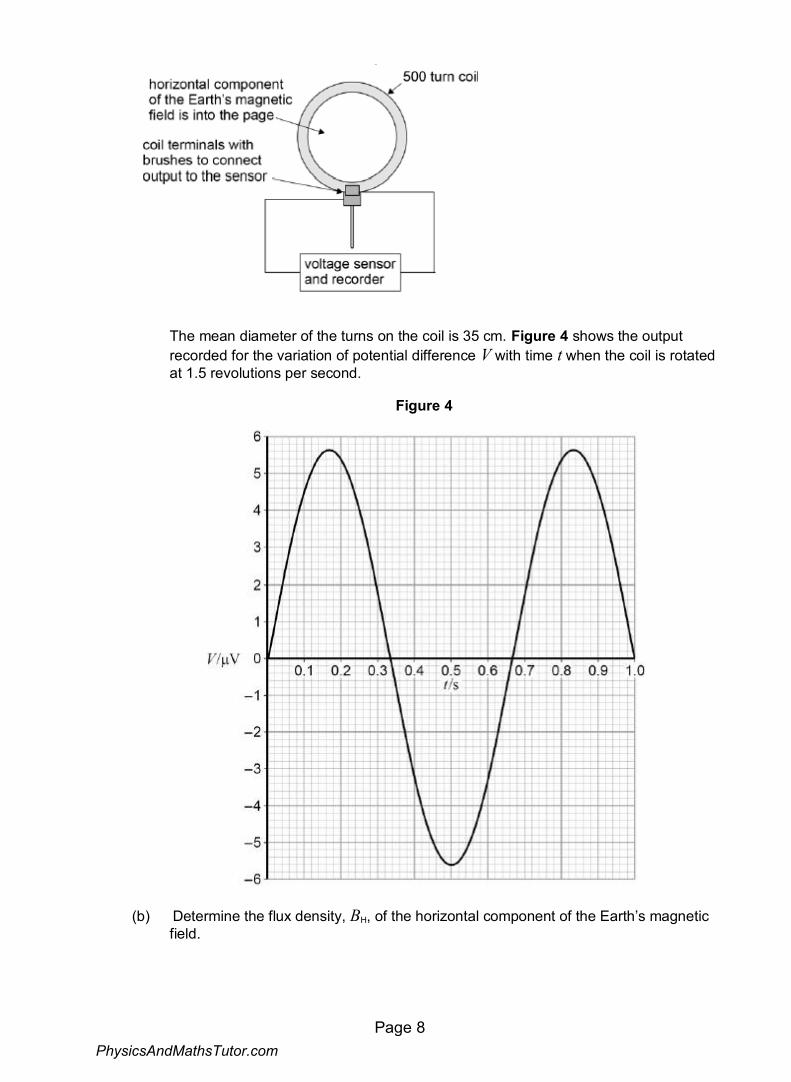
The mean diameter of the turns on the coil is 35 cm. Figure 4 shows the output recorded for the variation of potential difference V with time t when the coil is rotated at 1.5 revolutions per second.
Figure 4
(b) Determine the flux density, BH, of the horizontal component of the Earth’s magnetic field.
PhysicsAndMathsTutor.com
Page 9
horizontal component of flux density = _____________T (3)
(Total 7 marks)
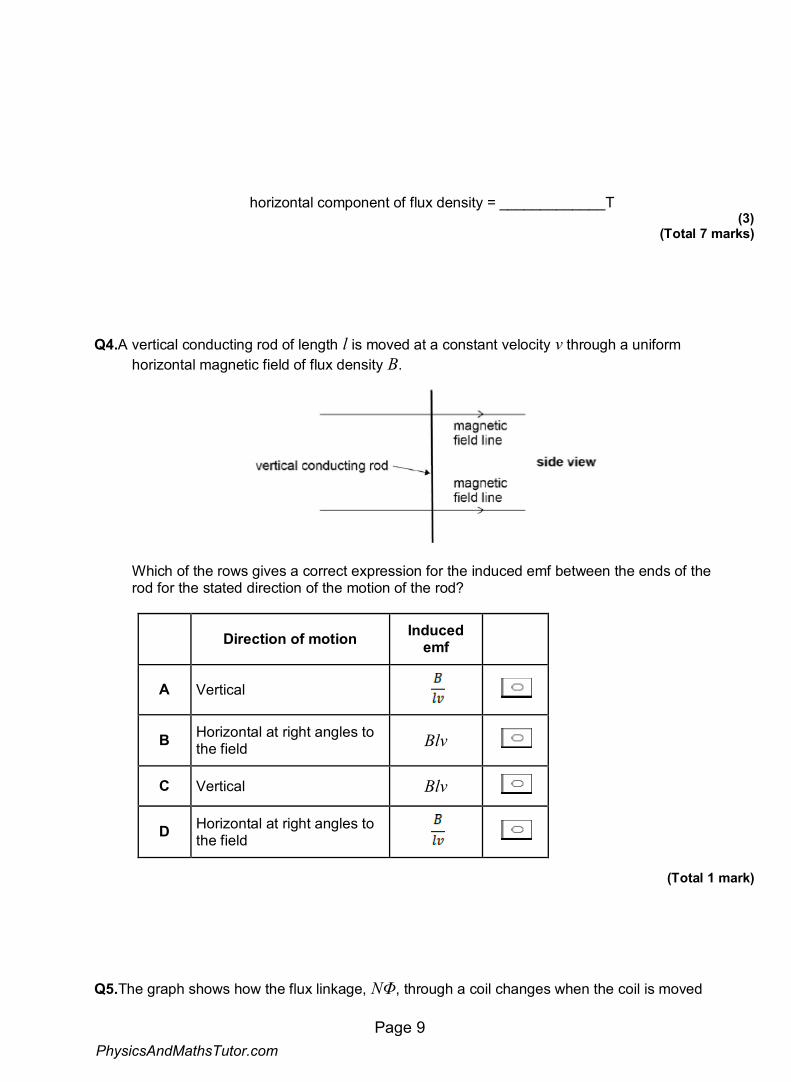
Q4.A vertical conducting rod of length l is moved at a constant velocity v through a uniform horizontal magnetic field of flux density B.
Which of the rows gives a correct expression for the induced emf between the ends of the rod for the stated direction of the motion of the rod?
Direction of motion Induced emf
A Vertical
B Horizontal at right angles to the field Blv
C Vertical Blv
D Horizontal at right angles to the field
(Total 1 mark)
Q5.The graph shows how the flux linkage, NΦ, through a coil changes when the coil is moved
PhysicsAndMathsTutor.com

Page 10
into a magnetic field.
The emf induced in the coil
A decreases then becomes zero after time t0.
B increases then becomes constant after time t0.
C is constant then becomes zero after time t0.
D is zero then increases after time t0.
(Total 1 mark)
Q6.In which one of the following applications does electromagnetic induction not take place?
A the generators at a nuclear power station
B the ac power adapter for a laptop computer
C the wings of an aircraft cutting through the Earth’s magnetic field
D the back up capacitor of an electric timer (Total 1 mark)
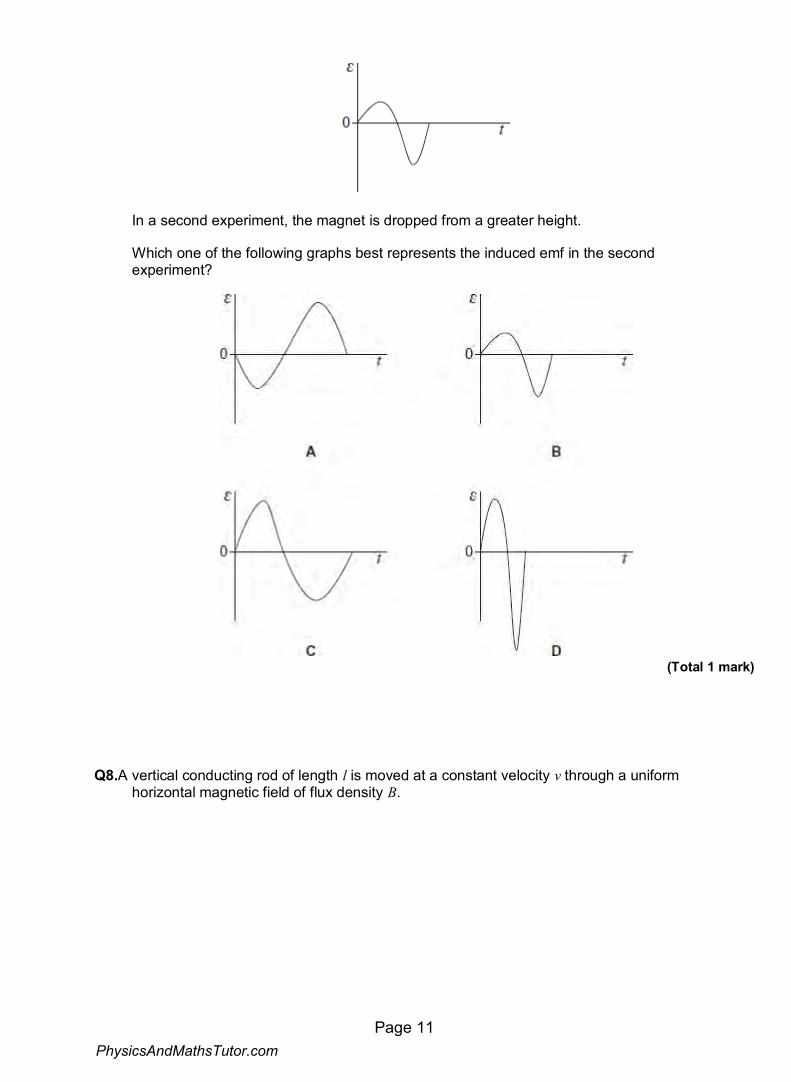
Q7.When a magnet is dropped through an aluminium ring an emf is induced. A data logger connected to the ring records the variation of the induced emf ε with time t as shown below.
PhysicsAndMathsTutor.com
Page 11
In a second experiment, the magnet is dropped from a greater height.
Which one of the following graphs best represents the induced emf in the second experiment?
(Total 1 mark)
Q8.A vertical conducting rod of length l is moved at a constant velocity v through a uniform horizontal magnetic field of flux density B.
PhysicsAndMathsTutor.com
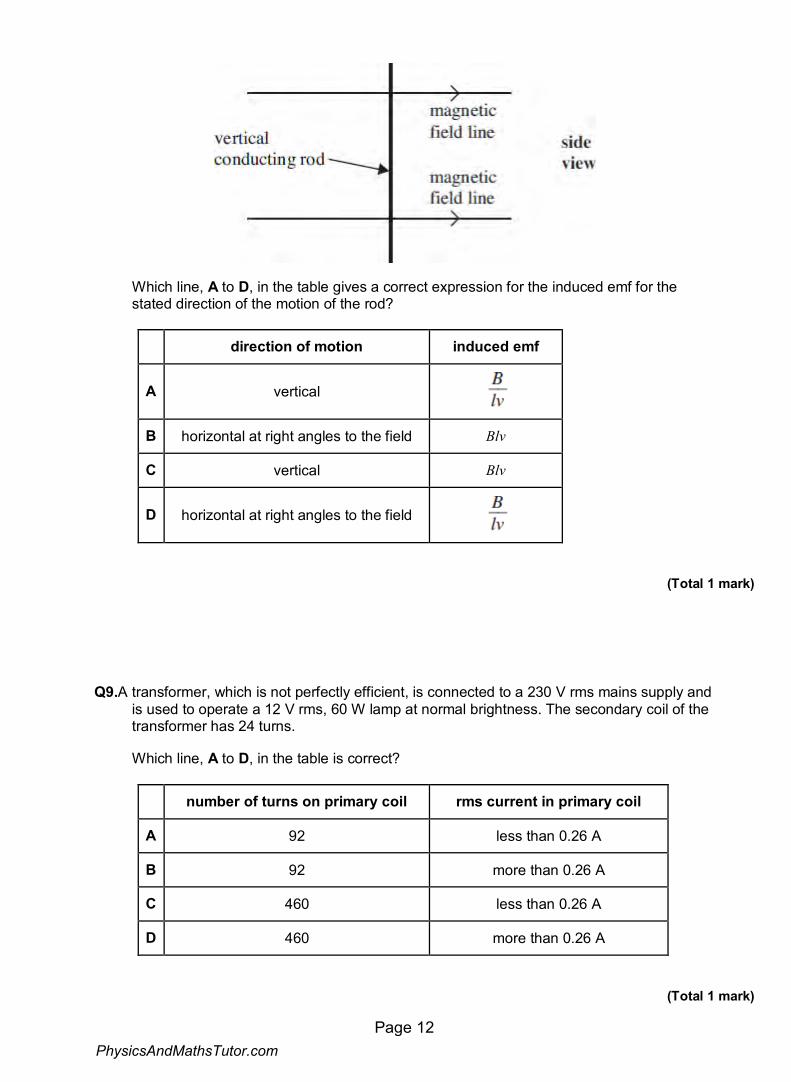
Page 12
Which line, A to D, in the table gives a correct expression for the induced emf for the stated direction of the motion of the rod?
direction of motion induced emf
A vertical
B horizontal at right angles to the field Blv
C vertical Blv
D horizontal at right angles to the field
(Total 1 mark)
Q9.A transformer, which is not perfectly efficient, is connected to a 230 V rms mains supply and is used to operate a 12 V rms, 60 W lamp at normal brightness. The secondary coil of the transformer has 24 turns.
Which line, A to D, in the table is correct?
number of turns on primary coil rms current in primary coil
A 92 less than 0.26 A
B 92 more than 0.26 A
C 460 less than 0.26 A
D 460 more than 0.26 A
(Total 1 mark)
PhysicsAndMathsTutor.com

Page 13
Q10.A rectangular coil is rotating anticlockwise at constant angular speed with its axle at right angles to a uniform magnetic field. Figure 1 shows an end-on view of the coil at a particular instant.
Figure 1
(a) At the instant shown in Figure 1, the angle between the normal to the plane of the coil and the direction of the magnetic field is 30°.
(i) State the minimum angle, in degrees, through which the coil must rotate from its position in Figure 1 for the emf to reach its maximum value.
angle ................................. degrees (1)
(ii) Calculate the minimum angle, in radians, through which the coil must rotate from its position in Figure 1 for the flux linkage to reach its maximum value.
angle ................................. radians (2)
(b) Figure 2 shows how, starting in a different position, the flux linkage through the coil varies with time.
(i) What physical quantity is represented by the gradient of the graph shown in Figure 2?
............................................................................................................... (1)
PhysicsAndMathsTutor.com

Page 14
(ii) Calculate the number of revolutions per minute made by the coil.
revolutions per minute .............................................. (2)
Figure 2
Figure 3
(iii) Calculate the peak value of the emf generated.
PhysicsAndMathsTutor.com

Page 15
peak emf ......................................... V (3)
(c) Sketch a graph on the axes shown in Figure 3 above to show how the induced emf varies with time over the time interval shown in Figure 2.
(2)
(d) The coil has 550 turns and a cross-sectional area of 4.0 × 10⁻³m2.
Calculate the flux density of the uniform magnetic field.
flux density .......................................... T (2)
(Total 13 marks)
Q11.A rectangular coil is rotated in a uniform magnetic field.
When the coil is rotated at a constant rate, an alternating emf ε is induced in it. The
PhysicsAndMathsTutor.com

Page 16
variation of emf ε, in volts, with time t, in seconds, is given by
ε = 20 sin (100 πt)
Which line, A to D, in the table gives the peak value ε0 and the frequency f of the induced emf?
ε0 / V
f / Hz
A
10
50
B
10
100
C
20
50
D
20
100 (Total 1 mark)
PhysicsAndMathsTutor.com