Embed Size (px)
Citation preview

Natural England Evidence Project Report RP01513
Plymouth Sound and Estuaries SAC/SSSI: 2013 saltmarsh
condition assessment survey report
Plymouth Sound & Estuaries SAC and units of the Lynher Estuary SSSI, Tamar-
Tavy SSSI and St. John’s Lake SSSI.
First published 8 December 2016
www.gov.uk/natural-england


Natural England Evidence Project Report RP01513
Plymouth Sound and Estuaries SAC/SSSI: 2013 saltmarsh
condition assessment survey report
Rob Seebold1
1Natural England

Project details
This report should be cited as:
SEEBOLD, R. 2016. Plymouth Sound and Estuaries SAC/SSSI: 2013 saltmarsh condition assessment survey report. Natural England Evidence Project Report RP01513.
Project manager
Rob Seebold
Marine Adviser
Devon, Cornwall and the Isles of Scilly Team
Natural England
Polwhele
Truro, TR4 9AD
Acknowledgements
The Author would like to thank the following for their help and support in the completion of this research:
Hugh Tyler, Nick Packer, Charlotte Marshall, Wesley Smyth, Elizabeth Bailey, Maxine Chavner, Angela Gall, Lizy Gardner, Lone Mouritsen, Christine Singfield, Simon Tame, Kate Sugar, Trudy Russell, Llucia Mascorda Cabre, Richard Cook, Sue Rees (all Natural England), Nigel Mortimer (Devon Estuaries Partnership), Kaja Curry (Tamar Estuaries Consultative Forum), Jennifer Yates (Plymouth University), Sue Scott (Helford VMCA), Kathy Turtle, Jen Dyer (both Environment Agency), Natasha Sprague, Megan Baker (both Plymouth University post-graduate students), Ann Reynolds (Cornwall Council).
2 Plymouth Sound and Estuaries SAC/SSSI: 2013 saltmarsh condition assessment survey report (RP01513)
Summary
The Plymouth Sound and Estuaries Special Area of Conservation (SAC) forms part of the Natura 2000 (N2K) network established by the EU Habitats Directive. Natural England has a statutory duty to report on the condition of the features of Plymouth Sound and Estuaries SAC every 6 years. The objective of survey in this report was to monitor the condition of the saltmarsh features of the SAC and underlying SSSI units of the Lynher Estuary SSSI, Tamar-Tavy SSSI and St. John’s Lake SSSI. The overall condition of the saltmarsh feature in the Tamar Estuary appears stable and favourable. The overall extent of the feature is stable. Whilst some change was noted at SSSI Unit level, these changes should be viewed with a degree of caution due to methodological considerations. Community structure is also stable and the species present exhibit a high degree of consistency over the longer term.

3 Plymouth Sound and Estuaries SAC/SSSI: 2013 saltmarsh condition assessment survey report (RP01513)
Contents Project manager ..................................................................................................................................... 2
Acknowledgements ................................................................................................................................ 2
1 Introduction ..................................................................................................................................... 7
Saltmarsh function ................................................................................................................................. 7
Saltmarsh in Plymouth Sound and Estuaries .......................................................................................... 7
Aims and objectives ............................................................................................................................. 10
Condition Assessment.......................................................................................................................... 10
Assessment of condition of the saltmarsh features of Plymouth Sound and Estuaries SAC .......... 10
Current condition of SSSI units ..................................................................................................... 11
Previous research and relevant data .................................................................................................... 12
2 Methodology ................................................................................................................................. 13
Survey method ..................................................................................................................................... 13
Selection of sample points ............................................................................................................ 13
Fieldwork dates ............................................................................................................................. 13
Survey briefing .............................................................................................................................. 13
Survey materials ........................................................................................................................... 13
Survey method - Quadrats ............................................................................................................ 14
Survey method - Transects ........................................................................................................... 14
Data analysis ....................................................................................................................................... 14
3 Results .......................................................................................................................................... 16
Analysis notes: ..................................................................................................................................... 16
Extent ................................................................................................................................................... 16
Community structure ............................................................................................................................ 16
Results by area: ................................................................................................................................... 17
Tamar-Tavy SSSI ................................................................................................................................. 17
Lynher SSSI ......................................................................................................................................... 35
St John’s Lake SSSI ............................................................................................................................ 57
4 Discussion .................................................................................................................................... 61
Community structure ............................................................................................................................ 61
Limitations ............................................................................................................................................ 62
Conclusion ........................................................................................................................................... 62
Recommendations for future monitoring ............................................................................................... 63
Condition Assessment.......................................................................................................................... 64
SSSI condition ..................................................................................................................................... 64
SAC condition ...................................................................................................................................... 67
5 References ................................................................................................................................... 68

4 Plymouth Sound and Estuaries SAC/SSSI: 2013 saltmarsh condition assessment survey report (RP01513)
List of figures Figure 1- Map depicting the location of saltmarsh features in the Tamar estuary ................................... 9 Figure 2 - Aerial photograph of Unit 65 Kingsmill Lake from 1988. ...................................................... 18 Figure 3- Aerial photograph of Unit 65 Kingsmill Lake from 2009. ....................................................... 18 Figure 4 -Aerial photograph of Unit 66 Bere Ferrers from 1988. .......................................................... 20 Figure 5 - Aerial photograph of Unit 66 Bere Ferrers from 2009. ......................................................... 20 Figure 6 - Aerial photograph of Unit 69 Tamerton Lake from 1988. ..................................................... 24 Figure 7 - Aerial photograph of Unit 69 Tamerton Lake from 2009. ..................................................... 24 Figure 8 - Aerial photograph of for Unit 70 Egypt Marsh from 1988. .................................................... 27 Figure 9 - Aerial photograph of for Unit 70 Egypt Marsh from 2009. .................................................... 27 Figure 10 - Aerial photograph of for Unit 75 Clifton Marsh from 1988. ................................................. 30 Figure 11 - Aerial photograph of for Unit 75 Clifton Marsh from 2009. ................................................. 30 Figure 12 - Aerial photograph of for Unit 76 North Hooe from 1988. .................................................... 33 Figure 13 - Aerial photograph of for Unit 76 North Hooe from 2009. .................................................... 33 Figure 14 - Aerial photograph of for Unit 27 Wiveliscombe Lake from 1988. ....................................... 36 Figure 15 - Aerial photograph of for Unit 27 Wiveliscombe Lake from 2009. ........................................ 36 Figure 16 -:Aerial photograph of for Unit 28 Wacker Lake and Anthony from 1988. ............................. 38 Figure 17 - Aerial photograph of for Unit 28 Wacker Lake and Anthony from 2009. ............................. 38 Figure 18 - Aerial photograph of for Unit 29 Erth Barton from 1988. .................................................... 41 Figure 19 - Aerial photograph of for Unit 29 Erth Barton from 2009. .................................................... 41 Figure 20 - Aerial photograph of for Unit 31 River Tidy from 1988. ...................................................... 44 Figure 21 - Aerial photograph of for Unit 31 River Tidy from 2009. ...................................................... 44 Figure 22 - Aerial photograph of for Unit 32 Grove Turf from 1988. ..................................................... 47 Figure 23 - Aerial photograph of for Unit 32 Grove Turf from 2009. ..................................................... 47 Figure 24 - Aerial photograph of for Unit 32 Erth Island from 1988. ..................................................... 48 Figure 25 - Aerial photograph of for Unit 32 Erth Island from 2009. ..................................................... 48 Figure 26 - Aerial photograph of for Unit 33 Polbathic Turf from 1988. ................................................ 51 Figure 27 - Aerial photograph of for Unit 33 Polbathic Turf from 2009. ................................................ 51 Figure 28 - Aerial photograph of for Unit 33 Sconner Turf from 1988. .................................................. 52 Figure 29 - Aerial photograph of for Unit 33 Sconner Turf from 2009. .................................................. 52 Figure 30 - Aerial photograph of for Unit 34 Upper Lynher from 1988. ................................................. 55 Figure 31 - Aerial photograph of for Unit 34 Upper Lynher from 2009. ................................................. 55 Figure 32 - Aerial photograph of for Unit 1 St John’s Lake Insworke from 1988. .................................. 58 Figure 33 - Aerial photograph of for Unit 1 St John’s Lake Insworke from 2009. .................................. 58 Figure 34 - Aerial photograph of for Unit 3 St John’s Lake from 1988. ................................................. 60 Figure 35 - Aerial photograph of for Unit 3 St John’s Lake from 2001. ................................................. 60

5 Plymouth Sound and Estuaries SAC/SSSI: 2013 saltmarsh condition assessment survey report (RP01513)
List of tables Table 1 - Current condition of Tamar-Tavy SSSI Units. ........................................................................ 11 Table 2 - Current condition of Lynher Estuary SSSI Units. ................................................................... 11 Table 3 - Current condition of St John’s Lake SSSI Units. .................................................................... 11 Table 4 - Comparison of community structure 2013, 2009 and 1986 for Unit 65 Kingsmill Lake. .......... 17 Table 5 - Comparison of community structure 2013 and 2009 for Unit 66 Bere Ferrers........................ 21 Table 6 - Community structure in 2013 for Unit 67 Blaxton Marsh. ....................................................... 22 Table 7 - Comparison of saltmarsh extent (hectares) 2001 to 2009 for Unit 69 Tamerton Lake. ........... 23 Table 8 - Community structure in 2013 for Unit 69 Tamerton Lake. ...................................................... 25 Table 9 - Comparison of saltmarsh extent (hectares) 2001 to 2009 for Unit 70 Egypt Marsh................ 26 Table 10 - Comparison of community structure 2013 and 2009 for Unit 70 Egypt Marsh. ..................... 28 Table 11 - Comparison of saltmarsh extent (hectares) 2001 to 2009 for Unit 75 Clifton Marsh. ............ 29 Table 12 - Comparison of community structure 2013, 2009 and 1986 for Unit 75 Clifton Marsh. .......... 31 Table 13 - Comparison of saltmarsh extent (hectares) 2001 to 2009 for Unit 76 North Hooe. Note: data is for both North & South Hooe. ............................................................................................................ 32 Table 14 - Comparison of community structure 2013, 2010 and 1986 for Unit 76 North Hooe.............. 34 Table 15 - Comparison of community structure 2013 and 2010 for Unit 27 Wiveliscombe Lake. .......... 35 Table 16 - Comparison of saltmarsh extent (hectares) 2001 to 2009 for Unit 28 Wacker Lake and Anthony. Note: data is for Anthony section of marsh only. .................................................................... 37 Table 17 - Comparison of community structure 2013, 2009 and 1986 for Unit 28 Wacker Lake and Anthony. ............................................................................................................................................... 39 Table 18 - Comparison of saltmarsh extent (hectares) 2001 to 2009 for Unit 29 Erth Barton. .............. 40 Table 19 - Comparison of community structure 2013, 2010 and 1986 for Unit 29 East of Erth Barton. . 42 Table 20 - Comparison of saltmarsh extent (hectares) 2001 to 2009 for Unit 31 River Tidy. ................ 43 Table 21 - Comparison of community structure 2013, 2010 and 1986 for Unit 31 River Tiddy. ............. 45 Table 22 - Comparison of saltmarsh extent (hectares) 2001 to 2009 for Unit 32 Grove Turf and Erth Island. .................................................................................................................................................. 46 Table 23 - Comparison of community structure 2013 and 1986 for Unit 32 Grove Turf & Erth Island. .. 49 Table 24 - Comparison of saltmarsh extent (hectares) 2001 to 2009 for Unit 33 Polbathic Turf and Sconner Turf. ....................................................................................................................................... 50 Table 25 - Comparison of community structure 2013, 2010 and 1986 for Unit 33 Polbathic Turf & Sconner Turf. ....................................................................................................................................... 53 Table 26 - Comparison of saltmarsh extent (hectares) 2001 to 2009 for Unit 34 Upper Lynher. ........... 54 Table 27 - Comparison of community structure 2013, 2010 and 1986 for Unit 34 Upper Lynher. ......... 56 Table 28 - Comparison of community structure 2013 and 1986 for Unit 1 St John’s Lake Insworke. .... 57 Table 29 - Comparison of community structure 2013 and 1986 for Unit 3 St John’s Lake. ................... 59 Table 30 - Summary of updated condition of Tamar-Tavy SSSI Units. ................................................. 64 Table 31 - Summary of updated condition of Lynher SSSI Units. ......................................................... 65 Table 32 - Summary of updated condition of St John’s Lake SSSI Units. ............................................. 66 Table 33 - Favourable Condition Summary for Saltmarsh Communities of Plymouth Sound and Estuaries SAC ...................................................................................................................................... 67

6 Plymouth Sound and Estuaries SAC/SSSI: 2013 saltmarsh condition assessment survey report (RP01513)
Appendices (Published as separate documents) Appendix A - Example Survey forms ....................................................................................................... Appendix B - Transect Information form .................................................................................................. Appendix C - Additional aerial photographs of Unit 65 Kingsmill Lake, Tamar Tavy SSSI from A) 1995 and B) 2001. ............................................................................................................................................ Appendix D - Additional aerial photograph of Unit 66 Bere Ferrers, Tamar Tavy SSSI from 2001 ........... Appendix E - Additional aerial photograph of Unit 69 Tamerton Lake, Tamar Tavy SSSI from 2001. Appendix F - Additional aerial photographs of Unit 70 Egypt Marsh, Tamar Tavy SSSI from A) 1995 and B) 2001 ............................................................................................................................................. Appendix G - Additional aerial photographs of Unit 75 Clifton Marsh, Tamar Tavy SSSI from A) 1995 and B) 2001 ............................................................................................................................................. Appendix H - Additional aerial photographs of Unit 76 North Hooe, Tamar Tavy SSSI from A) 1995 and B) 2001 .................................................................................................................................................... Appendix I - Additional aerial photographs of Unit 27 Wiveliscombe Lake , Lynher Estuary SSSI from A) 1995 and B) 2001 .................................................................................................................................... Appendix J - Additional aerial photographs of Unit 28 Wacker Lake and Anthony , Lynher Estuary SSSI from A) 1995 and B) 2001 ....................................................................................................................... Appendix K- Additional aerial photographs of Unit 29 Erth Barton, Lynher Estuary SSSI from A) 1995 and B) 2001 ............................................................................................................................................. Appendix L - Additional aerial photographs of Unit 31 River Tidy, Lynher Estuary SSSI from A) 1995 and B) 2001 ............................................................................................................................................. Appendix M - Additional aerial photographs of Unit 32 Grove Turf and Erth Island, Lynher Estuary SSSI from A) 1995 and B) 2002 ....................................................................................................................... Appendix N- Additional aerial photographs of Unit 32 Erth Island from A) 1995 and B) 2001 .................. Appendix O - Additional aerial photographs of Unit 33 Polbathic and Sconner Turf, Lynher Estuary SSSI from A) 1995 and B) 2001 .............................................................................................................. Appendix P - Additional aerial photographs of Unit 33 Polbathic and Sconner Turf, Lynher Estuary SSSI from A) 1995 and B) 2001. ............................................................................................................. Appendix Q - Additional aerial photographs of Unit 34 Upper Lynher, Lynher Estuary SSSI from A) 1995 and B) 2009 .................................................................................................................................... Appendix R - Additional aerial photographs of Unit 1 St John’s Lake Insworke, St John’s Lake SSSI from A) 1995 and B) 2001 ....................................................................................................................... Appendix S - Additional aerial photographs of Unit 3 St John’s Lake, St John’s Lake SSSI from A) 1995 and B) 2009 ............................................................................................................................................. Appendix T - 2013 Species List Tamar Tavy SSSI .................................................................................. Appendix U - 2013 Species List Lynher SSSI .......................................................................................... Appendix V - 2013 Species St Johns Lake SSSI ..................................................................................... Appendix W – Favourable Condition Table for Saltmarsh Communities of Plymouth Sound and Estuaries SAC ......................................................................................................................................... Appendix X – Draft Favourable Condition Tables for Saltmarsh Communities of Tamar Tavy SSSI ........ Appendix Y - Favourable Condition Table for Saltmarsh Communities of Lynher Estuary SSSI .............. Appendix Z - Favourable Condition Table for Saltmarsh Communities of St Johns Lake SSSI ................ Appendix AA- Raw 2013 data sheets here .............................................................................................. Appendix BB - Maps of Species Recorded from the 1986 Saltmarsh Survey of Great Britain. Individual maps for the Tamar Estuary. ................................................................................................................... Appendix CC - Maps of Species Recorded from the 1986 Saltmarsh Survey of Great Britain. Individual maps for the Lynher Estuary. ................................................................................................................... Appendix DD - Maps of Species Recorded from the 1986 Saltmarsh Survey of Great Britain. Individual maps for St.John’s Lake. .........................................................................................................................

7 Plymouth Sound and Estuaries SAC/SSSI: 2013 saltmarsh condition assessment survey report (RP01513)
1 Introduction
Saltmarsh function Saltmarshes provide a natural link between land and sea and are found above the muddy shores of sheltered estuaries and inlets, typically lying between mean high water neap tides and mean high water spring tides. Characteristic vegetation includes a relatively limited number of halophytic (salt tolerant) species that can cope with regular immersion by the tide and a clear zonation typically emerges in saltmarshes that reflects different plant species tolerance to salt and the frequency of inundation by the tide (Burd, 1989). Estuarine saltmarshes occur where rivers gradually empty into the sea and are more extensive in area of significant soft-sediment supply, like the rivers of North West and Eastern England. They are less extensive in areas such as the ria (drowned river valley) systems of the South West, including the Tamar estuary. Saltmarsh in ria systems can therefore be more truncated, and not exhibit the clear zonation seen in more extensive saltmarsh areas. This is in evidence in the Tamar ria system, which tends to be dominated by upper saltmarsh communities with an absence of a clear pioneer zone. Within the South West of England saltmarshes are a scarce habitat and serve a number of important ecological functions including acting as a resource for wading birds and water fowl. Additionally, the sheltered saltmarsh fringes provide important nursery areas for several species of fish including bass Dicentrarchus labrax. Saltmarshes also provide further ecosystem services in terms of natural sea defences.
Saltmarsh in Plymouth Sound and Estuaries Plymouth Sound and Estuaries is a complex ria system of marine inlets in South-west England, on the border of Devon and Cornwall. The ria system of Plymouth Sound (St John's Lake and parts of the Rivers Tavy, Tamar and Lynher), the large bay of the Sound itself, Wembury Bay, and the ria of the River Yealm are of international marine conservation importance because of their wide variety of salinity conditions and sedimentary and reef habitats. The Plymouth Sound and Estuaries Special Area of Conservation (SAC) overlaps with a number of designations including, the Tamar Estuaries Complex Special Protection Area (SPA), the Lynher Site of Special Scientific Interest (SSSI), the Tamar-Tavy SSSI, St John’s Lake SSSI and the Tamar Estuary Sites Marine Conservation Zone (MCZ). Plymouth Sound and Estuaries SAC is considered representative of a ria system in South-west England and was designated for the following range of qualifying features, including Saltmarsh communities:
H1110. Sandbanks which are slightly covered by sea water all the time; Subtidal sandbanks
H1130. Estuaries
H1140. Mudflats and sandflats not covered by seawater at low tide; Intertidal mudflats and sandflats
H1160. Large shallow inlets and bays
H1170. Reefs
H1330. Atlantic salt meadows (Glauco-Puccinellietalia maritimae)
S1102. Alosa alosa; Allis shad

8 Plymouth Sound and Estuaries SAC/SSSI: 2013 saltmarsh condition assessment survey report (RP01513)
S1441. Rumex rupestris; Shore dock Saltmarsh is qualifying feature of the site, under H1330 Atlantic salt meadows (Glauco-Puccinellietalia maritimae) and is also a sub-feature of H1130 Estuaries. Due to the typically steep banks associated with rias, the Tamar is characterised by an absence of typical saltmarsh zones. Instead, the Plymouth Sound and Estuaries SAC tends to be dominated by upper saltmarsh communities and an absence of a clear pioneer zone and no large areas of lower-mid marsh due to the truncated structure of this habitat. The saltmeadows in the estuary are principally made up of sea club-rush Scirpus maritimus, saltmarsh rush Juncus gerardii, common saltmarsh-grass Puccinellia maritima, red fescue Festuca rubra and sea couch Elymus pycanthus. Other common saltmarsh plants include sea purslane Halimione portulacoides, sea aster Aster tripolium, sea arrowgrass Triglochin maritima, and English scurvygrass Cochlearia anglica. There is also a strong population of sea purslane Halimione portulacoides which is uncommon in Cornwall. The Atlantic salt meadows make a vital contribution to the structure and function of the estuary and the other habitats within it. The mudflats surrounding saltmarshes is of particular importance to the Tamar Estuaries Complex SPA bird interest features avocets Recurvirostra avosetta and Little egrets Egretta garzetta. Figure 1 below shows the location of the saltmarsh features in the Tamar estuary to which this report relates.

9 Plymouth Sound and Estuaries SAC/SSSI: 2013 saltmarsh condition assessment survey report (RP01513)
Figure 1- Map depicting the location of saltmarsh features in the Tamar estuary

10 Plymouth Sound and Estuaries SAC/SSSI: 2013 saltmarsh condition assessment survey report (RP01513)
Aims and objectives The specific objectives of this survey work and research report are:
1. To inform a condition assessment for the Saltmarsh features of Plymouth Sound and Estuaries SAC.
2. To inform a condition assessment for the underlying Units of Lynher Estuary SSSI, Tamar-Tavy SSSI and St. Johns Lake SSSI.
Condition Assessment The EU Habitats Directive requires that member states regularly assess the ecological condition of the designated features of SACs. Condition Assessment of European Marine Sites (including SACs) is carried out on a six yearly cycle, and it is the responsibility of Natural England to report this to Europe through the Joint Nature Conservation Committee (JNCC).
Natural England also assesses the condition of all SSSIs in England as part of a similar six year cycle.
Assessment of condition of the saltmarsh features of Plymouth Sound and Estuaries SAC
The assessment of condition for the feature H1330. Atlantic salt meadows (Glauco-Puccinellietalia maritimae) relies on the condition assessment of the underlying SSSI units and earlier surveys to form a baseline evaluation.
Favourable condition for the SAC saltmarsh communities is defined in terms of the following:
No decrease in extent, subject to natural change.
No alteration of creek patterns, subject to natural change.
Stability in range and distribution of characteristic saltmarsh communities, subject to natural change.
Stability in frequency and abundance of characterising species, subject to natural change.
More detailed Favourable condition tables are appended.

11 Plymouth Sound and Estuaries SAC/SSSI: 2013 saltmarsh condition assessment survey report (RP01513)
Current condition of SSSI units
Tables 1-3 below show the current condition of the SSSI Units surveyed in 2013. Whilst the Tamar-Tavy SSSI and Lynher Estuary SSSI units are all considered in Favourable condition, the St. John’s Lake units are considered to be Unfavourable Recovering. However, this assessment in St John’s Lake of was in respect to the notified bird interest features (overwintering wildfowl and waters) and not due to saltmarsh condition.
Table 1 - Current condition of Tamar-Tavy SSSI Units.
SSSI Unit Current Condition Date of last assessment
Unit 65 Kingsmill Lake Favourable July 2009
Unit 66 Bere Ferrers (North Tavy) Favourable July 2009
Unit 67 Blaxton Marsh (South Tavy) Favourable May 2009
Unit 69 Tamerton Lake Favourable June 2010
Unit 70 Egypt Marsh Favourable August 2009
Unit 75 Clifton Favourable August 2009
Unit 76 North Hooe Favourable June 2010
Table 2 - Current condition of Lynher Estuary SSSI Units.
SSSI Unit Current Condition Date of last assessment
Unit 27 Wiveliscombe Lake Favourable June 2010
Unit 28 Wacker Lake & Anthony (Wacker Marsh)
Favourable August 2009
Unit 29 Erth Barton Favourable June 2010
Unit 31 River Tiddy Favourable August 2009
Unit 32 Grove Turf and Erth Island Favourable May 2009
Unit 33 Polbathic Turf (and Sconner Turf)
Favourable July 2010
Unit 34 Upper Lynher (Western Lynher)
Favourable July 2010
Table 3 - Current condition of St John’s Lake SSSI Units.
SSSI Unit Current Condition Date of last assessment
Unit 1 St John’s Lake (Insworke) Unfavourable Recovering December 2009
Unit 3 St John’s Lake (North Side) Unfavourable Recovering December 2009

12 Plymouth Sound and Estuaries SAC/SSSI: 2013 saltmarsh condition assessment survey report (RP01513)
Favourable condition for the SSSI saltmarsh communities is defined in terms of the following (subject to natural change):
No decrease in extent.
Maintain range of typical zonation.
Maintain site specific structural variation in the sward height.
Maintain frequency of characteristic species composition.
Maintain indicators of local distinctiveness (Alopecurus bulbosus).
No recent expansion of Spartina anglica.
No further anthropogenic changes to creek patterns and pans.
Negative indicators (turf cutting, increase in bare substrate due to anthropogenic activity, poaching damage from stock or horses, artificial drainage) are absent or rare.
More detailed Favourable condition tables are appended.
Previous research and relevant data The following existing data sources have been identified as relevant points of comparison to inform assessments of condition and evaluation of long term change.
Lynher Estuary SSSI Condition Assessment survey, 2009/2010, Natural England.
Lynher Tamar-Tavy Estuary SSSI Condition Assessment survey, 2009/2010, Natural England.
Saltmarsh Survey of Great Britain, 1986, Fiona Burd.
Cornwall Council Aerial Survey Project: 1988, 1995, 2001, 2009.

13 Plymouth Sound and Estuaries SAC/SSSI: 2013 saltmarsh condition assessment survey report (RP01513)
2 Methodology
The survey methodology has been designed to be comparable and allow comparison with the previous condition assessment (Lynher Estuary SSSI and Tamar-Tavy Estuary SSSI Condition Assessment survey, 2009/2010, Natural England)
The requirements of Environment Agency (EA) Water Framework Directive (WFD) have also been taken into account.
Survey method
Selection of sample points
In total 16 sample points (in 15 SSSI units) were selected for survey in 2013.
Fieldwork dates
The majority of fieldwork took place between 24 and 28 June 2013 to coincide with good weather and tides.
Due to logistic reasons fieldwork was completed in four sites between 6-9 August 2013 and remaining quadrats on two sites in late September 2013.
Survey briefing
Prior to survey two site based training sessions were organised for all survey staff:
o Kingsmill Lake, Cornwall, 24 June 2013
o Bere Ferrers, Devon, 25 June 2013
The site briefings comprised site health and safety/risk assessment, identification training for key saltmarsh species and a full briefing on the survey equipment, the recording materials and the methodology. The survey team had the chance to participate in practise quadrats and transects under the direction of the Survey Supervisor.
Survey materials
Survey packs/materials included:
o Briefing instructions on site access arrangements/landowner information
o Aerial photographs of each site with target quadrat and transect points marked
o OS grid references for each quadrat and transect point
o Quadrat recording forms
o Transect recording forms
o Meter rulers and bamboo measuring poles (to measure quadrats and sward height)
o Guidelines on assigning percentage cover of species
o GPS unit
o Saltmarsh species identification guides (Field Studies Council)

14 Plymouth Sound and Estuaries SAC/SSSI: 2013 saltmarsh condition assessment survey report (RP01513)
o OS Map
Survey method - Quadrats
A structured walk methodology was employed, using pre-determined quadrat locations as stops.
Target quadrats were located using GPS units and OS Grid references, with aerial photos providing an additional reference point.
Meter rulers and measuring poles were used to mark out 2m x 2m quadrats and all saltmarsh floral species present within the quadrat identified and recorded. The DAFOR scale was used to estimate the percentage cover of species. An average sward height for the quadrat was recorded (the average of 3 separate estimates at different points within the quadrat).
For each quadrat the presence of artificial drainage, inappropriate agricultural practices and vehicles/vehicle use were also recorded.
Survey method - Transects
At each site a minimum of one transect was surveyed. Transect locations were replicated from previous survey.
The starting point of each target transect was located using GPS units and OS Grid references, with aerial photos providing an additional reference point. This was typically the point of the previous (2009) transect, nearest the upper marsh limit. However, in some cases, site logistics and time available meant that the transect point nearest the leading edge of the marsh was used.
A description of the vegetation community structure at this starting point was recorded including dominant and other species present.
Surveyors then walked in a direct line towards the landward boundary (upper limit) of the marsh and noted where a change in community composition/zone occurred. A GPS waypoint was recorded at this new location and once again floral community structure recorded.
This process was repeated as many times as required (depending on how many zones were present on the transect) until the landward boundary (upper) limit of the marsh was reached.
Data analysis The following data analyses were used to assess change over time and current condition of the saltmarsh feature.
Assessing change
Extent
Saltmarsh extent over time was analysed using available aerial photography (Cornwall Council Aerial Survey Project).
Here available aerial photos from 1988, 1995, 2001/2002 and 2009 were used to evaluate changes in overall extent of saltmarsh.
First, the aerial photographs were geo-referenced to fit the OS national grid. This requires good reference points, such as field boundaries and where there are few of these it is more difficult to accurately line up the photos. This is especially an issue near the edges of the images. The margin of error has been calculated as +/- 10 metres for the 1988 and 1995 photographs.

15 Plymouth Sound and Estuaries SAC/SSSI: 2013 saltmarsh condition assessment survey report (RP01513)
By contrast, we have greater confidence in the alignment of 2001 and 2009 photographs as these mapped onto each other more exactly, and therefore quantitative area estimates are provided only for 2001 and 2009.
To create area estimates, in each case the perimeter of the marsh (leading edge and rear edge) was digitised and converted to a GIS polygon. The available time series were then overlaid and an area under the polygon (in hectares) calculated. Please note that internal creeks have been included within these area estimates.
An additional ‘human eye’ analysis was conducted by three members of the project team comparing time series photographs for all sites and looking for change in extent and creek patterns.
Community structure
A comparative analysis of community structure at a Unit level was conducted using replicated quadrat data from 2009/10 and 2013. Here the following analyses were possible:
1. Comparison of species present (comparison of species list for each site).
2. Comparison of species diversity (total number of species present in each site).
3. Comparison of species abundance (comparison of the proportion of quadrats in which a species was present, for each site).
Long term change in community structure, in terms of species present, was assessed by comparing the list of species recorded in 2013 and 2009/10 with a list of species recorded as present in 1986. The 1986 data comprised a set of annotated maps of where species where observed, rather than quadrat data. Given this difference in methodology, comparisons with 1986 should be considered only as a qualitative assessment of long term consistency or change.

16 Plymouth Sound and Estuaries SAC/SSSI: 2013 saltmarsh condition assessment survey report (RP01513)
3 Results
Analysis notes:
Extent For each site, where aerial photographs are available, there is presented below an analysis of change in saltmarsh extent.
This comprises:
a) A quantitative comparison of saltmarsh extent (area in hectares). This has only been conducted for the most recent years 2001 to 2009, due to the issues of comparability discussed in Section 2.
b) Qualitative ‘human eye’ comparison of the time series photographs.
The following caveats with respect to analysis of extent must be noted:
The most recently available data is from 2009, therefore no conclusions can be drawn as to more recent changes.
Additional caution must be used when interpreting the aerial photographs due to tidal differences, shadowing and potential seasonal variation in vegetation cover.
Community structure
Short/medium term change Presented below are comparisons of community structure based on comparable quadrat data collected in 2013 and 2009/2010.
For each site a table displays a comparison of community structure in terms of a) Species present, b) Total number of species recorded within the site (Species count for site), c) Abundance within the site (number of quadrats in which species is recorded as present).
Long term change A further reference point is provided for 1986, where data is available.
In 1986 a small number of additional non-typical saltmarsh species were observed, which were not formally captured on 2013/2009 survey forms. Therefore, it cannot be determined with certainty that such species recorded in 1986 were absent in 2013. Given this and other significant methodological differences only the saltmarsh species recorded in 2013 or 2009 and 1986 have been displayed in the tables below for 1986 (1986 Species Present). The 1986 data is therefore presented as a qualitative comparison of broad change or consistency in species composition.

17 Plymouth Sound and Estuaries SAC/SSSI: 2013 saltmarsh condition assessment survey report (RP01513)
Results by area:
Tamar-Tavy SSSI
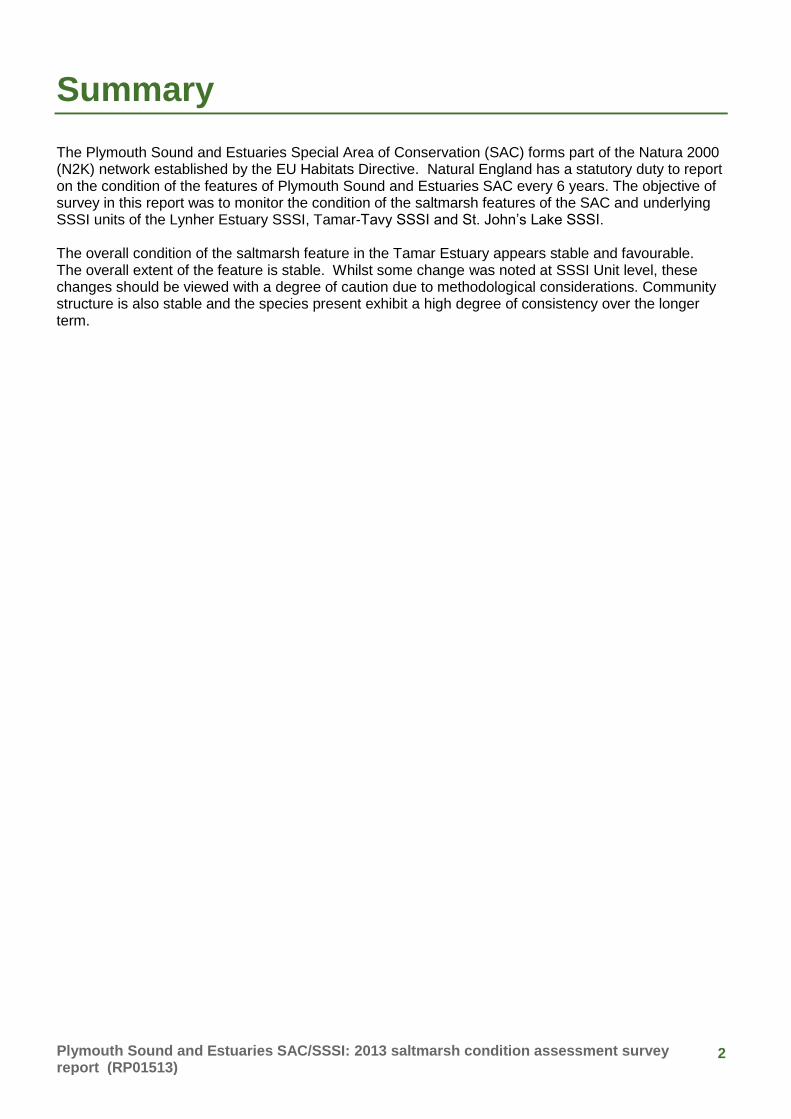
Unit 65, Kingsmill Lake Extent Quantitative analysis of saltmarsh extent was not possible due to the fragmented nature of this section of marsh. Human eye analysis of available photo sets suggested there may have been some erosion/loss of extent since 1988. However, this is inconclusive and caution is advised as observable differences between 2009 and previous years may be due to differences in the state of the tide. Figures 2 and 3 overleaf show the two most extreme time periods, 1988 and 2009.
Community structure Sea-purslane is the clear dominant species in the site in both 2013 and 2009 surveys (Table 4). The total number of species recorded is similar in 2013 (12 species) and 2009 (10 species) (Table 4). Overall species composition within the site is similar from 2009 to 2013, with 8 species common to both years. The list of species present is also qualitatively very consistent with 1986; with 12 species recorded in 2009/2013, also observed in 1986. Table 4 - Comparison of community structure 2013, 2009 and 1986 for Unit 65 Kingsmill Lake.
2013 2009 1986
No. of Quadrats in which
species present
No. of Quadrats in
which species present
Species present
(x)
Common Cord-grass Spartina anglica 2 4 x
Common Saltmarsh-grass Pucinella maritima 1 2 x
Rocky sea spurrey Spergularia rupicola 1 0
Sea arrowgrass Triglochin maritima 3 1 x
Sea plantain Plantago maritima 2 1 x
Sea aster Aster tripolium 5 2 x
Sea-purslane Atriplex (Halimione) portulacoides
9 9 x
Creeping bent Agrostis stolonifera 1 1 x
Orache species Atriplex spp. 1 1
Red Fescue Festuca rubra 2 0 x
Sea rush Juncus maritimus 1 0 x
Sea-milkwort Glaux maritima 2 0 x
Thrift Armeria maritima 0 1 x
Sea couch grass Agropyron pungens 0 1 x
Species count 12 10
18 Plymouth Sound and Estuaries SAC/SSSI: 2013 saltmarsh condition assessment survey report (RP01513)
Figure 2 - Aerial photograph of Unit 65 Kingsmill Lake from 1988.
Figure 3- Aerial photograph of Unit 65 Kingsmill Lake from 2009.
See Appendix for other available aerial photos for this Unit.

19 Plymouth Sound and Estuaries SAC/SSSI: 2013 saltmarsh condition assessment survey report (RP01513)
Unit 66, Bere Ferrers (North Tavy) Extent Quantitative analysis of saltmarsh extent was not possible as no aerial photograph was available for 2001. Human eye analysis of available photo sets does not indicate any perceptible change in saltmarsh extent between 1988 and 2009. Figures 4 and 5 overleaf show the two most extreme time periods, 1988 and 2009.

20 Plymouth Sound and Estuaries SAC/SSSI: 2013 saltmarsh condition assessment survey report (RP01513)
Figure 4 - Aerial photograph of Unit 66 Bere Ferrers from 1988.
Figure 5 - Aerial photograph of Unit 66 Bere Ferrers from 2009.
See Appendix for other available aerial photos for this Unit.

21 Plymouth Sound and Estuaries SAC/SSSI: 2013 saltmarsh condition assessment survey report (RP01513)
Community structure
Creeping bent is the most abundant species in 2013 (based on percentage cover, not shown) followed by Sea arrowgrass. These two species were also amongst the abundant species in 2010. Common cord-grass (recorded in only 2 quadrats in 2013 vs. 7 in 2010) and Sea purslane (recorded in only 1 quadrat in 2013 vs. 6 in 2010) were both notably less frequent within the site in 2013 than 2010 (Table 5). The total number of species recorded is similar, with 11 species recorded in 2013 and 13 species recorded in 2010. Overall species composition is similar in 2013 and 2010 with 10 species common to both years (Table 5). No comparison was possible to 1986 as there was no data available. Table 5 - Comparison of community structure 2013 and 2009 for Unit 66 Bere Ferrers.
2013 2010 1986
No. of Quadrats in which species
present
No. of Quadrats in which species
present
Species present
(x)
Common Cord-grass Spartina anglica 2 7 n/a
Common Saltmarsh-grass
Pucinella maritima 4 5 n/a
Glasswort species Salicornia spp. 1 1 n/a
Rocky sea spurrey Spergularia rupicola 1 0 n/a
Sea arrowgrass Triglochin maritima 5 7 n/a
Sea plantain Plantago maritima 2 4 n/a
Sea aster Aster tripolium 0 5 n/a
Sea-purslane Atriplex (Halimione) portulacoides
1 6 n/a
Creeping bent Agrostis stolonifera 5 4 n/a
Orache species Atriplex spp. 4 3 n/a
Red Fescue Festuca rubra 3 3 n/a
Saltmarsh rush / Mud rush
Juncus gerardii 0 1 n/a
Sea club-rush Bolboschoenus maritimus (Scirpus maritimus)
3 2 n/a
Greater Sea spurrey Spergularia maritima (media)
0 3 n/a
Species count 11 13

22 Plymouth Sound and Estuaries SAC/SSSI: 2013 saltmarsh condition assessment survey report (RP01513)
Unit 67, Blaxton Marsh (South Tavy) Extent Analysis of saltmarsh extent was not possible as no aerial photos were available for this Unit.
Community structure In 2013, Sea arrowgrass, Sea plantain and sea purslane are the most abundant species in the site. In total 9 species were recorded at this site (Table 6). No comparison with 2009/2010 was possible due to unavailability of data. Likewise no data was available to enable comparison with 1986 (Table 6). Field notes suggest this is only a small area with little zonation, bounded by extensive reed beds. They also note signs of some saltmarsh erosion. Table 6 - Community structure in 2013 for Unit 67 Blaxton Marsh.
2013 2009/2010 1986
No. of Quadrats in which species
present
No. of Quadrats in which species
present
Species present (x)
Common Cord-grass Spartina anglica 2 n/a n/a
Common Saltmarsh-grass
Pucinella maritima 1 n/a n/a
Sea arrowgrass Triglochin maritima 4 n/a n/a
Sea plantain Plantago maritima 3 n/a n/a
Sea aster Aster tripolium 1 n/a n/a
Sea-purslane Atriplex (Halimione) portulacoides
2 n/a n/a
Creeping bent Agrostis stolonifera 1 n/a n/a
Red Fescue Festuca rubra 2 n/a n/a
Sea rush Juncus maritimus 1 n/a n/a
Species count 9

23 Plymouth Sound and Estuaries SAC/SSSI: 2013 saltmarsh condition assessment survey report (RP01513)
Unit 69, Tamerton Lake Extent Quantitative analysis of saltmarsh extent (Table 7) shows no loss of extent between 2001 and 2009. Table 7 - Comparison of saltmarsh extent (hectares) 2001 to 2009 for Unit 69 Tamerton Lake.
2001 2009
(ha) (ha) 3.10 3.09
However, human eye analysis of photo sets suggested there may have been some slight erosion of the Western leading edge of the saltmarsh. This edge faces the direction of water flow during a flooding tide. Figures 6 and 7 overleaf show the two most extreme time periods, 1988 and 2009, with the area of possible erosion indicated.

24 Plymouth Sound and Estuaries SAC/SSSI: 2013 saltmarsh condition assessment survey report (RP01513)
Figure 6 - Aerial photograph of Unit 69 Tamerton Lake from 1988.
Figure 7 - Aerial photograph of Unit 69 Tamerton Lake from 2009.
See Appendix for other available aerial photos for this Unit.
Possible erosion on Western
leading edge

25 Plymouth Sound and Estuaries SAC/SSSI: 2013 saltmarsh condition assessment survey report (RP01513)
Community structure In 2013, Red Fescue followed by Common saltmarsh-grass are most abundant species, with English scurvey grass and Sea aster also commonly found in the site. In total 13 species were recorded at this site (Table 8). No comparison with 2009/2010 was possible due to unavailability of data. Likewise no data was available to enable comparison with 1986. Table 8 - Community structure in 2013 for Unit 69 Tamerton Lake.
2013 2009/2010 1986
No. of Quadrats in which species
present
No. of Quadrats in which species
present
Species present
(x)
Common Cord-grass Spartina anglica 1 n/a n/a
Common Saltmarsh-grass
Pucinella maritima 4 n/a n/a
Sea arrowgrass Triglochin maritima 3 n/a n/a
Sea plantain Plantago maritima 2 n/a n/a
Sea aster Aster tripolium 4 n/a n/a
Sea-purslane Atriplex (Halimione) portulacoides
2 n/a n/a
Oraches species Atriplex spp. 1 n/a n/a
Red Fescue Festuca rubra 5 n/a n/a
Sea club-rush Bolboschoenus maritimus (Scirpus maritimus)
1 n/a n/a
Sea-milkwort Glaux maritima 2 n/a n/a
Sea couch grass Agropyron pungens / E. pycnanthus / Elytrigia atherica
1 n/a n/a
English scurvey grass
Cochlearia anglica 5 n/a n/a
Couch grass Elymus repens 1 n/a n/a
Species count 13

26 Plymouth Sound and Estuaries SAC/SSSI: 2013 saltmarsh condition assessment survey report (RP01513)
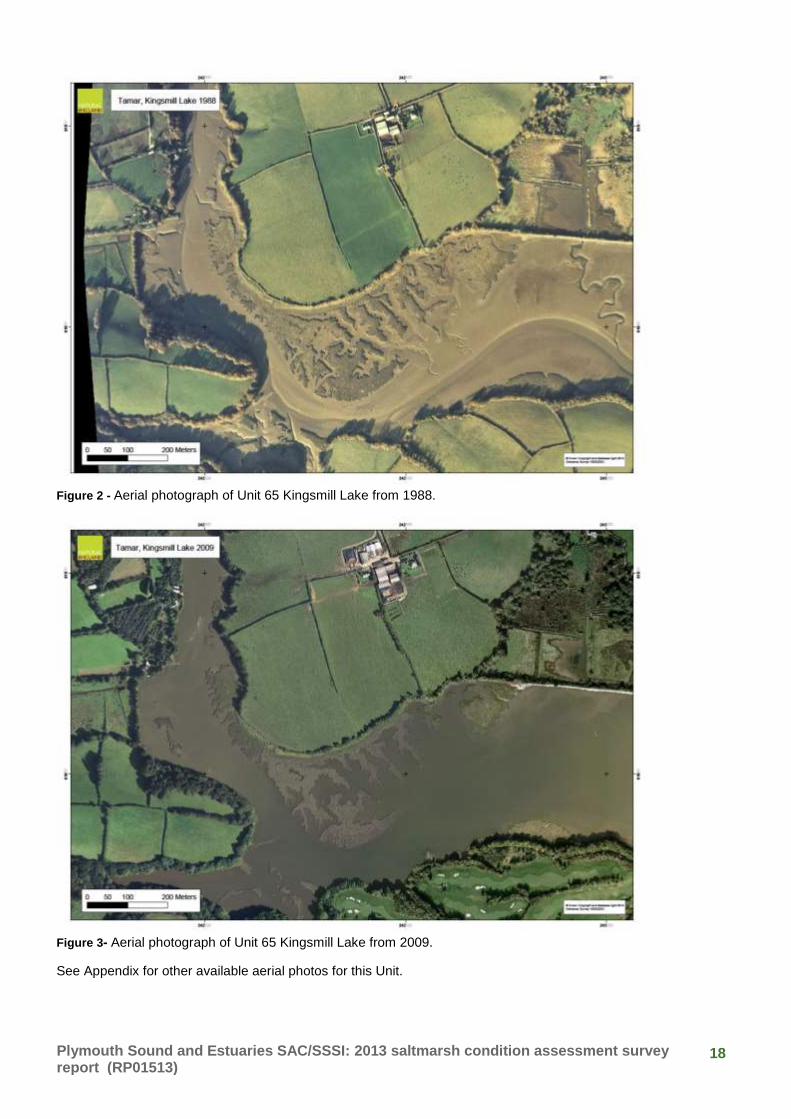
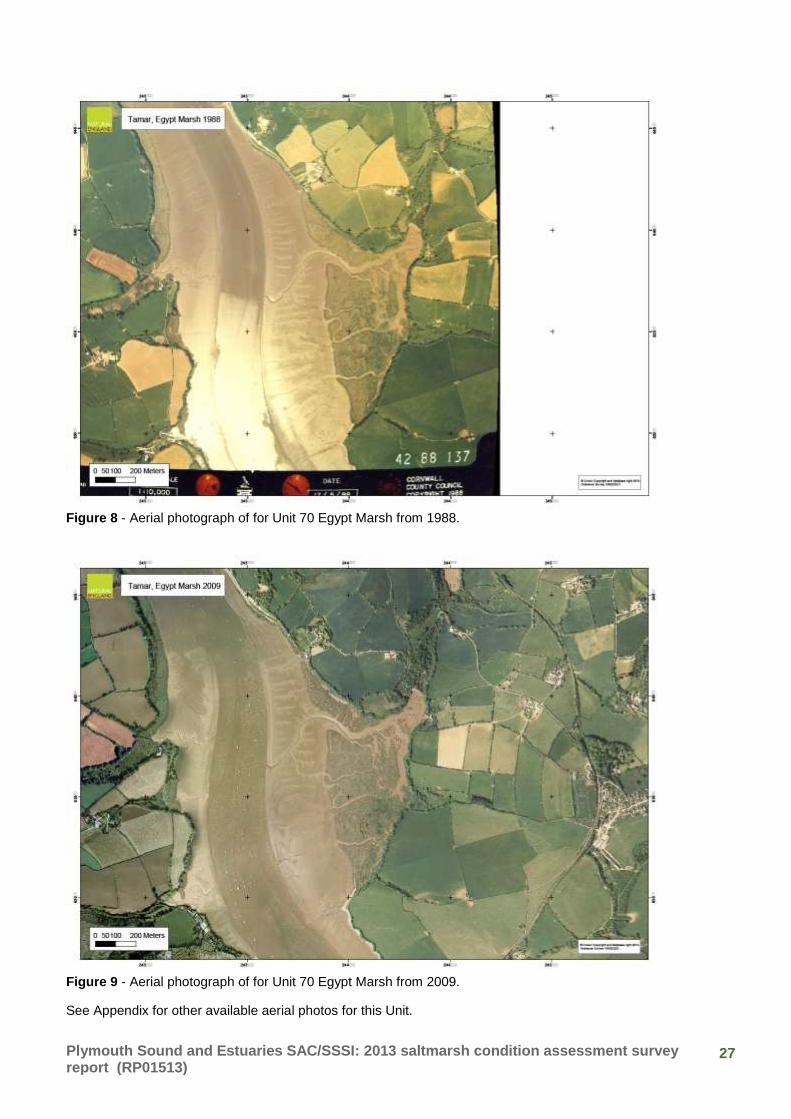
Unit 70, Egypt Marsh Extent Quantitative analysis of saltmarsh extent (Table 9) shows a small, but unlikely significant reduction in extent between 2001 and 2009. Table 9 - Comparison of saltmarsh extent (hectares) 2001 to 2009 for Unit 70 Egypt Marsh.
2001 2009
(ha) (ha) 32.82 32.66
Human eye analysis of photo sets reveals no perceptible change in saltmarsh extent between 1988 and 2009. Figures 8 and 9 overleaf show the two most extreme time periods, 1988 and 2009.
27 Plymouth Sound and Estuaries SAC/SSSI: 2013 saltmarsh condition assessment survey report (RP01513)
Figure 8 - Aerial photograph of for Unit 70 Egypt Marsh from 1988.
Figure 9 - Aerial photograph of for Unit 70 Egypt Marsh from 2009.
See Appendix for other available aerial photos for this Unit.

28 Plymouth Sound and Estuaries SAC/SSSI: 2013 saltmarsh condition assessment survey report (RP01513)
Community structure
Red Fescue (based on percentage cover, not shown), followed closely by Sea Purslane are the dominant species in both 2013 and 2010. Sea plantain was also frequently recorded in the site across both years. Common cord-grass was less common in the site in 2013, when it was observed in 4 quadrats compared with 7 quadrats in 2009 (Table 10). The total number of species recorded is similar with 11 species recorded in 2013 and 10 recorded in 2009. Overall species composition is relatively less similar than other Units, with only 6 species common to both years. No comparison was possible to 1986 as there was no data available. Table 10 - Comparison of community structure 2013 and 2009 for Unit 70 Egypt Marsh.
2013 2009 1986
No. of Quadrats in which
species present
No. of Quadrats in which species present
Species present (x)
Common Cord-grass Spartina anglica 4 7 n/a
Common Saltmarsh-grass
Pucinella maritima 0 4 n/a
Rocky sea spurrey Spergularia rupicola 1 0 n/a
Sea arrowgrass Triglochin maritima 5 5 n/a
Sea plantain Plantago maritima 7 6 n/a
Sea aster Aster tripolium 0 4 n/a
Sea-purslane Atriplex (Halimione) portulacoides
8 9 n/a
Orache species Atriplex spp. 1 1 n/a
Red Fescue Festuca rubra 7 8 n/a
Saltmarsh rush / Mud rush
Juncus gerardii 4 0 n/a
Sea rush Juncus maritimus 0 1 n/a
Sea-milkwort Glaux maritima 0 1 n/a
Sea couch grass Agropyron pungens / E. pycnanthus
2 0 n/a
Golden samphire Limbarda crithmoides 7 0 n/a
Lax flowered sea lavender
Limonium humile 2 0 n/a
Species count 11 10

29 Plymouth Sound and Estuaries SAC/SSSI: 2013 saltmarsh condition assessment survey report (RP01513)
Unit 75, Clifton Marsh Extent Quantitative analysis of saltmarsh extent (Table 11) shows a marginal increase in extent between 2001 and 2009, however, it is difficult to say whether this is real or within margins of error in the methodology. Table 11 - Comparison of saltmarsh extent (hectares) 2001 to 2009 for Unit 75 Clifton Marsh.
2001 2009
(ha) (ha) 15.03 15.30
However, human eye analysis of the available photos also suggests some slight accretion on the North-eastern leading edge of the saltmarsh extent between 1988 and 2009. Figures 10 and 11 overleaf show the two most extreme time periods, 1988 and 2009.

30 Plymouth Sound and Estuaries SAC/SSSI: 2013 saltmarsh condition assessment survey report (RP01513)
Figure 10 - Aerial photograph of for Unit 75 Clifton Marsh from 1988.
Figure 11 - Aerial photograph of for Unit 75 Clifton Marsh from 2009.
See Appendix for other available aerial photos for this Unit.
Possible accretion on leading edge

31 Plymouth Sound and Estuaries SAC/SSSI: 2013 saltmarsh condition assessment survey report (RP01513)
Community structure The same four species Red Fescue, Sea purslane, Sea arrowgrass and Creeping bent, were most abundant in the site in 2013 and 2009. Red Fescue was marginally the most dominant in 2013 (based on percentage cover, not shown). The total number of species recorded is identical at 10 species in both years. Overall species composition was also very similar, with 9 species common to both years (Table 12). The list of species present is also qualitatively very similar to 1986; with 9 species recorded in 2013/2009 also present in 1986. Table 12 - Comparison of community structure 2013, 2009 and 1986 for Unit 75 Clifton Marsh.
2013 2009 1986
No. of Quadrats in which species
present
No. of Quadrats in which species
present
Species present (x)
Common Cord-grass Spartina anglica 4 5 x
Common Saltmarsh-grass
Pucinella maritima 2 3 x
Sea arrowgrass Triglochin maritima 6 6 x
Sea plantain Plantago maritima 2 1 x
Sea aster Aster tripolium 4 6 x
Sea-purslane Atriplex (Halimione) portulacoides
7 5 x
Creeping bent Agrostis stolonifera 6 7 x
Orache species Atriplex spp. 1 4
Red Fescue Festuca rubra 7 7 x
Sea club-rush Bolboschoenus maritimus (Scirpus maritimus)
2 0 x
English scurvey grass Cochlearia anglica 0 1
Species count 10 10
32 Plymouth Sound and Estuaries SAC/SSSI: 2013 saltmarsh condition assessment survey report (RP01513)
Unit 76, North Hooe Extent Quantitative analysis of saltmarsh extent (Table 13) shows a slight increase in extent between 2001 and 2009. Table 13 - Comparison of saltmarsh extent (hectares) 2001 to 2009 for Unit 76 North Hooe. Note: data is for both
North & South Hooe.
2001 2009
(ha) (ha) 21.33 22.01
Human eye analysis of the available photos also suggests that between 1988 and 2009 there may have been some accretion on the North-western leading edge of the saltmarsh. Possibly due to an increase in the extent/density of the reed bed in the Northern half of the site. Increased density of the reed bed towards the rear (landward edge) of the marsh is also visible. Figures 12 and 13 overleaf show the two most extreme time periods, 1988 and 2009.

33 Plymouth Sound and Estuaries SAC/SSSI: 2013 saltmarsh condition assessment survey report (RP01513)
Figure 12 - Aerial photograph of for Unit 76 North Hooe from 1988.
Figure 13 - Aerial photograph of for Unit 76 North Hooe from 2009.
See Appendix for other available aerial photos for this Unit.
Possible accretion on leading edge
Possible increase in extent/density
of reed beds

34 Plymouth Sound and Estuaries SAC/SSSI: 2013 saltmarsh condition assessment survey report (RP01513)
Community structure Five species, Red Fescue, Sea club-rush, Creeping bent, Sea arrowgrass and Orache species, were noted abundant in both 2013 and 2010, with Red Fescue the overall most dominant species in both years (based on percentage cover, not shown). The total number of species recorded is identical, with 10 species recorded in both years. Overall species composition is also very similar, with 8 species common to both years (Table 14). The list of species present is qualitatively quite similar to 1986; with 6 species recorded in 2013 also present in 1986. Table 14 - Comparison of community structure 2013, 2010 and 1986 for Unit 76 North Hooe.
2013 2010 1986
No. of Quadrats in which species
present
No. of Quadrats in which species
present
Species present (x)
Sea arrowgrass Triglochin maritima 5 7
Sea plantain Plantago maritima 2 1
Sea aster Aster tripolium 4 0 x
Sea-purslane Atriplex (Halimione) portulacoides
1 1 x
Common sea-lavender Limonium vulgare 5 0
Creeping bent Agrostis stolonifera 7 6 x
Orache species Atriplex spp. 3 6
Red Fescue Festuca rubra 5 4 x
Saltmarsh rush / Mud rush
Juncus gerardii 0 3
Sea club-rush Bolboschoenus maritimus (Scirpus maritimus)
5 5 x
Common reed Phragmites australis 1 1 x
English scurvey grass Cochlearia anglica 0 1
Species count 10 10

35 Plymouth Sound and Estuaries SAC/SSSI: 2013 saltmarsh condition assessment survey report (RP01513)
Lynher SSSI
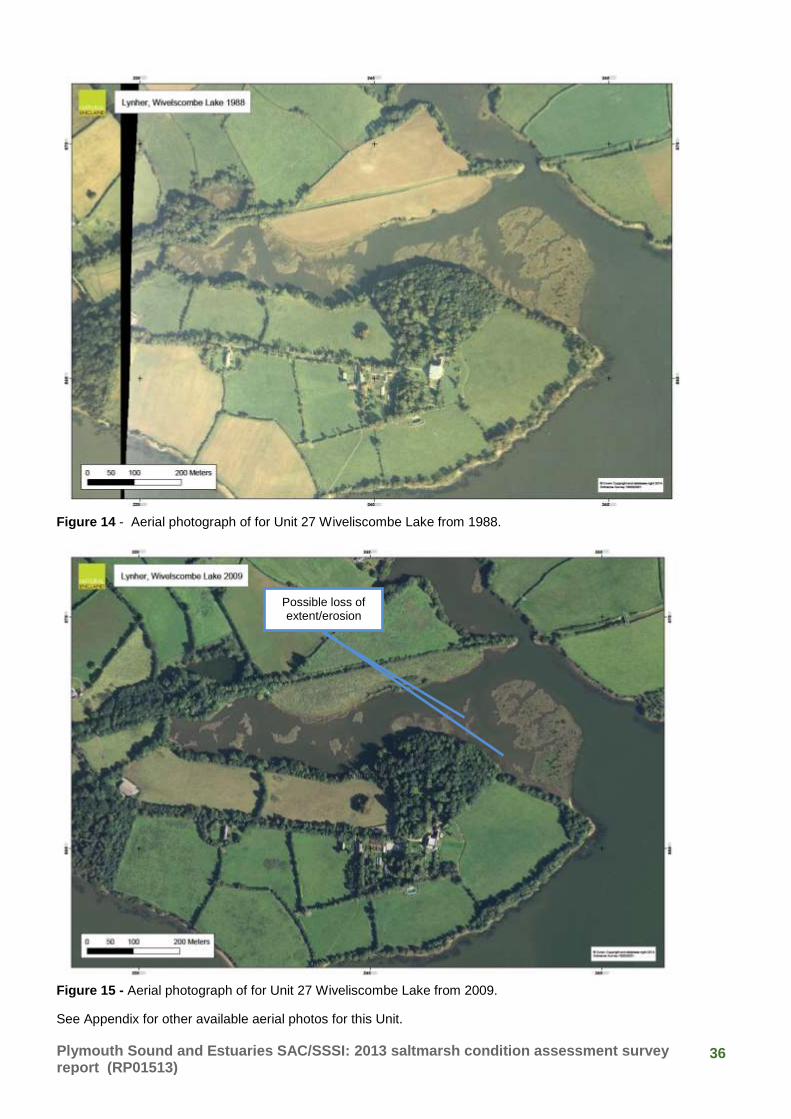
Unit 27, Wiveliscombe Lake Extent Quantitative analysis of saltmarsh extent was not possible due to the fragmented nature of this section of marsh. Human eye analysis of available photo sets suggested there may have been some erosion/loss of extent since 1988, notably between 1995 and 2001, particularly in the central section of the marsh. Figures 14 and 15 overleaf show the two most extreme time periods, 1988 and 2009, with the main area of extent loss indicated. Community structure Common cord-grass, Sea arrowgrass, Sea plantain and Sea purslane are the most common species in both years, with Sea purslane the overall dominant species (based on percentage cover, not shown) in the site in both 2013 and 2010 (Table 15). The total number of species recorded was slightly greater in 2013 at 8, than the 5 species recorded in 2010, with 4 species common to both years. No comparison was possible to 1986 as there was no data available. Table 15 - Comparison of community structure 2013 and 2010 for Unit 27 Wiveliscombe Lake.
2013 2010 1986
No. of Quadrats in which species
present
No. of Quadrats in which species
present
Species present
(x)
Common Cord-grass Spartina anglica 3 3 n/a
Common Saltmarsh-grass
Pucinella maritima 1 0 n/a
Sea arrowgrass Triglochin maritima 2 3 n/a
Sea plantain Plantago maritima 3 2 n/a
Sea aster Aster tripolium 2 0 n/a
Sea-purslane Atriplex (Halimione) portulacoides
3 2 n/a
Creeping bent Agrostis stolonifera 1 0 n/a
Orache species Atriplex spp. 0 2 n/a
Sea-milkwort Glaux maritima 1 0 n/a
Species count 8 5
36 Plymouth Sound and Estuaries SAC/SSSI: 2013 saltmarsh condition assessment survey report (RP01513)
Figure 14 - Aerial photograph of for Unit 27 Wiveliscombe Lake from 1988.
Figure 15 - Aerial photograph of for Unit 27 Wiveliscombe Lake from 2009.
See Appendix for other available aerial photos for this Unit.
Possible loss of extent/erosion

37 Plymouth Sound and Estuaries SAC/SSSI: 2013 saltmarsh condition assessment survey report (RP01513)
Unit 28, Wacker Lake and Anthony (Wacker Marsh) Extent Quantitative analysis of saltmarsh extent (Table 16) shows a very small decrease in extent between 2001 and 2009, however, due to margins of error in the methodology it is not possible to say whether this is real decrease. Table 16 - Comparison of saltmarsh extent (hectares) 2001 to 2009 for Unit 28 Wacker Lake and Anthony. Note:
data is for Anthony section of marsh only.
2001 2009
(ha) (ha) 7.33 7.15
Human eye analysis of available photos also suggests there may have been some limited erosion/loss of extent between 1988 and 2009 around small peninsulas within the marsh. Figures 16 and 17 overleaf show the two most extreme time periods, 1988 and 2009, with the main areas of possible extent loss indicated.

38 Plymouth Sound and Estuaries SAC/SSSI: 2013 saltmarsh condition assessment survey report (RP01513)
Figure 16 -:Aerial photograph of for Unit 28 Wacker Lake and Anthony from 1988. NB: Photo shows Anthony section of marsh only.
Figure 17 - Aerial photograph of for Unit 28 Wacker Lake and Anthony from 2009. NB: Photo shows Anthony section of marsh only.
See Appendix for other available aerial photos for this Unit.
Possible loss of extent/erosion

39 Plymouth Sound and Estuaries SAC/SSSI: 2013 saltmarsh condition assessment survey report (RP01513)
Community structure Sea purslane is dominant throughout the site in both 2013 and 2009. The total number of species recorded is very similar with 12 species recorded in 2013 and 13 in 2009, with 10 of the species common to both years indicating a high degree of consistency in species composition (Table 17). Comparisons with 1986 were only possible for the Anthony section of saltmarsh. Here a high degree of consistency in species composition was also noted, with 8 of the 12 species recorded in 2013 also observed in 1986 (Table 17). Table 17 - Comparison of community structure 2013, 2009 and 1986 for Unit 28 Wacker Lake and Anthony.
2013 2009 1986
No. of Quadrats in which species
present
No. of Quadrats in which species
present
Species present
(x)
Common Cord-grass Spartina anglica 5 6 x
Common Saltmarsh-grass
Pucinella maritima 2 2 x
Sea arrowgrass Triglochin maritima 5 3 x
Sea plantain Plantago maritima 6 2 x
Sea aster Aster tripolium 2 2
Sea-purslane Atriplex (Halimione) portulacoides
10 8 x
Glaucus sedge Carex flacca 1 0
Orache species Atriplex spp. 0 1
Red Fescue Festuca rubra 2 2 x
Saltmarsh rush / Mud rush
Juncus gerardii 2 1 x
Sea rush Juncus maritimus 0
Sea club-rush Bolboschoenus maritimus (Scirpus maritimus)
0 1 x
Sea-milkwort Glaux maritima 1 0 x
Thrift Armeria maritima 1 1
Sea couch grass Agropyron pungens / E. pycnanthus
1 2 x
Sweet vernal grass Anthoxanthum sp. 0 1
Species count 12 13
40 Plymouth Sound and Estuaries SAC/SSSI: 2013 saltmarsh condition assessment survey report (RP01513)
Unit 29, Erth Barton Extent Quantitative analysis of saltmarsh extent (Table 18) shows a very small decrease in extent between 2001 and 2009, however, due to margins of error in the methodology it is impossible to say whether this is real decrease. Table 18 - Comparison of saltmarsh extent (hectares) 2001 to 2009 for Unit 29 Erth Barton.
2001 2009
(ha) (ha) 8.67 8.55
Human eye analysis of available photo sets indicates there may have been some erosion/loss towards the Eastern leading edge of the marsh (loss of a low lying area of marsh) and of a peninsula of marsh within the main creek system. Figures 18 and 19 overleaf show the two most extreme time periods, 1988 and 2009, with possible areas of loss indicated. However, caution is advised, due to potential differences in the state of the tide between the two photographs.

41 Plymouth Sound and Estuaries SAC/SSSI: 2013 saltmarsh condition assessment survey report (RP01513)
Figure 18 - Aerial photograph of for Unit 29 Erth Barton from 1988.
Figure 19 - Aerial photograph of for Unit 29 Erth Barton from 2009.
See Appendix for other available aerial photos for this Unit.
Possible loss of extent/erosion
42 Plymouth Sound and Estuaries SAC/SSSI: 2013 saltmarsh condition assessment survey report (RP01513)
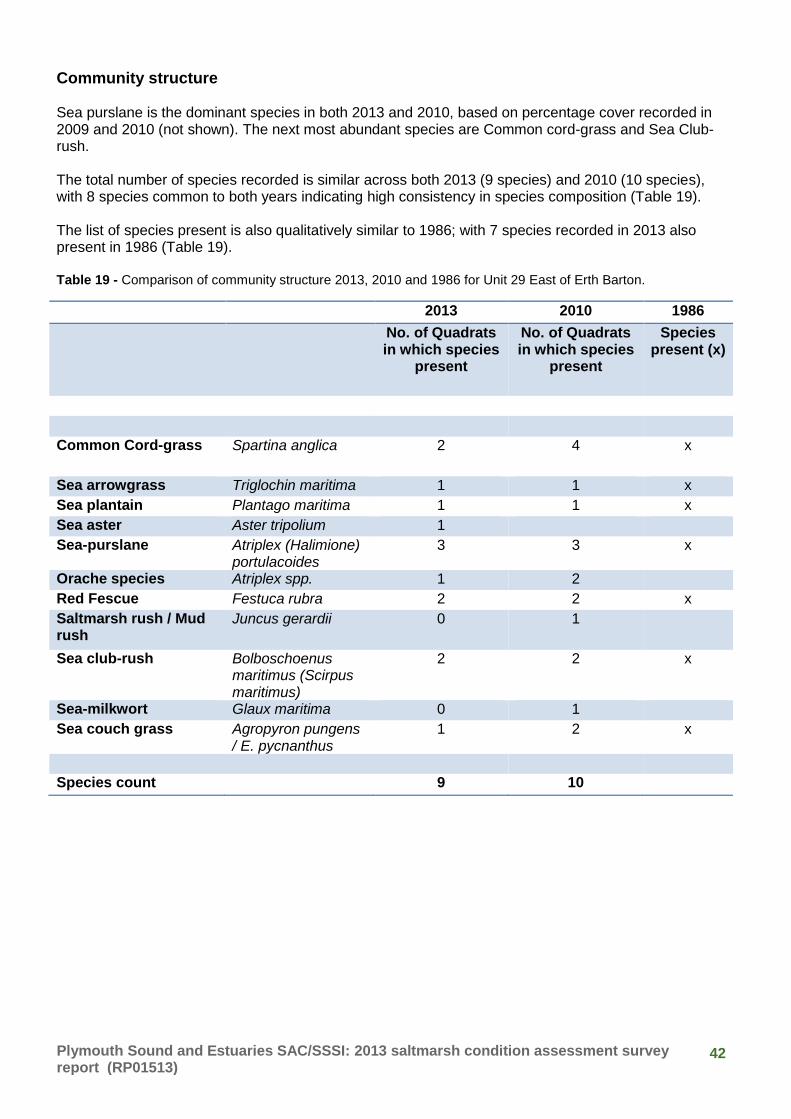
Community structure Sea purslane is the dominant species in both 2013 and 2010, based on percentage cover recorded in 2009 and 2010 (not shown). The next most abundant species are Common cord-grass and Sea Club-rush. The total number of species recorded is similar across both 2013 (9 species) and 2010 (10 species), with 8 species common to both years indicating high consistency in species composition (Table 19). The list of species present is also qualitatively similar to 1986; with 7 species recorded in 2013 also present in 1986 (Table 19). Table 19 - Comparison of community structure 2013, 2010 and 1986 for Unit 29 East of Erth Barton.
2013 2010 1986
No. of Quadrats in which species
present
No. of Quadrats in which species
present
Species present (x)
Common Cord-grass Spartina anglica 2 4 x
Sea arrowgrass Triglochin maritima 1 1 x
Sea plantain Plantago maritima 1 1 x
Sea aster Aster tripolium 1
Sea-purslane Atriplex (Halimione) portulacoides
3 3 x
Orache species Atriplex spp. 1 2
Red Fescue Festuca rubra 2 2 x
Saltmarsh rush / Mud rush
Juncus gerardii 0 1
Sea club-rush Bolboschoenus maritimus (Scirpus maritimus)
2 2 x
Sea-milkwort Glaux maritima 0 1
Sea couch grass Agropyron pungens / E. pycnanthus
1 2 x
Species count 9 10

43 Plymouth Sound and Estuaries SAC/SSSI: 2013 saltmarsh condition assessment survey report (RP01513)
Unit 31, River Tiddy Extent Quantitative analysis of saltmarsh extent (Table 20) shows no change between 2001 and 2009. Table 20 - Comparison of saltmarsh extent (hectares) 2001 to 2009 for Unit 31 River Tidy.
2001 2009
(ha) (ha) 10.05 10.07
Human eye analysis of available photo sets also suggests no change. Figures 20 and 21 overleaf show the two most extreme time periods, 1988 and 2009.

44 Plymouth Sound and Estuaries SAC/SSSI: 2013 saltmarsh condition assessment survey report (RP01513)
Figure 20 - Aerial photograph of for Unit 31 River Tidy from 1988.
Figure 21 - Aerial photograph of for Unit 31 River Tidy from 2009.
See Appendix for other available aerial photos for this Unit.

45 Plymouth Sound and Estuaries SAC/SSSI: 2013 saltmarsh condition assessment survey report (RP01513)
Community structure
In 2013 the most abundant species were Sea club-rush, Sea arrowgrass, Creeping bent, Sea couch grass and Saltmarsh (mud) rush. In 2010 Red Fescue was dominant (only observed in 2 quadrats in 2013), with Creeping bent also abundant. Orache spp. were common throughout the site in 2010 (recorded in 10 quadrats) but notably less so in 2013 (3 quadrats) (Table 21). The total number of species recorded is similar in 2013 (12 species) and 2010 (10 species), with 7 species common to both years, indicating a good degree of consistency in species composition (Table 21). The list of species present is also qualitatively similar to 1986; with 7 species recorded in 2013 also present in 1986. Table 21 - Comparison of community structure 2013, 2010 and 1986 for Unit 31 River Tiddy.
2013 2010 1986
No. of Quadrats in which species
present
No. of Quadrats in which species
present
Species present (x)
Common Cord-grass Spartina anglica 1 0
Common Saltmarsh-grass
Pucinella maritima 2 0 x
Sea arrowgrass Triglochin maritima 4 7
Sea plantain Plantago maritima 0 5
Sea aster Aster tripolium 2 0 x
Sea-purslane Atriplex (Halimione) portulacoides
1 2
Creeping bent Agrostis stolonifera 3 7 x
Orache species Atriplex spp. 3 10
Red Fescue Festuca rubra 2 10 x
Saltmarsh rush / Mud rush
Juncus gerardii 3 0
Sea rush Juncus maritimus 1 0 x
Sea club-rush Bolboschoenus maritimus (Scirpus maritimus)
5 4 x
Sea-milkwort Glaux maritima 0 4
Thrift Armeria maritima 0 1
Sea couch grass Agropyron pungens / E. pycnanthus / Elytrigia atherica
4 3 x
Species count 12 10

46 Plymouth Sound and Estuaries SAC/SSSI: 2013 saltmarsh condition assessment survey report (RP01513)
Unit 32, Grove Turf and Erth Island Extent Quantitative analysis of saltmarsh extent (Table 22) shows a small decrease between 2001 and 2009. However, due to the margin of error associated with the methodology it is not possible to say whether this is a real increase. Table 22 - Comparison of saltmarsh extent (hectares) 2001 to 2009 for Unit 32 Grove Turf and Erth Island.
Grove Turf & Erth Island Grove Turf only Erth Island only
2001 2009 2001 2009 2001 2009 (ha) (ha) (ha) (ha) (ha) (ha)
35.61 35.32 12.87 12.78 22.74 22.54
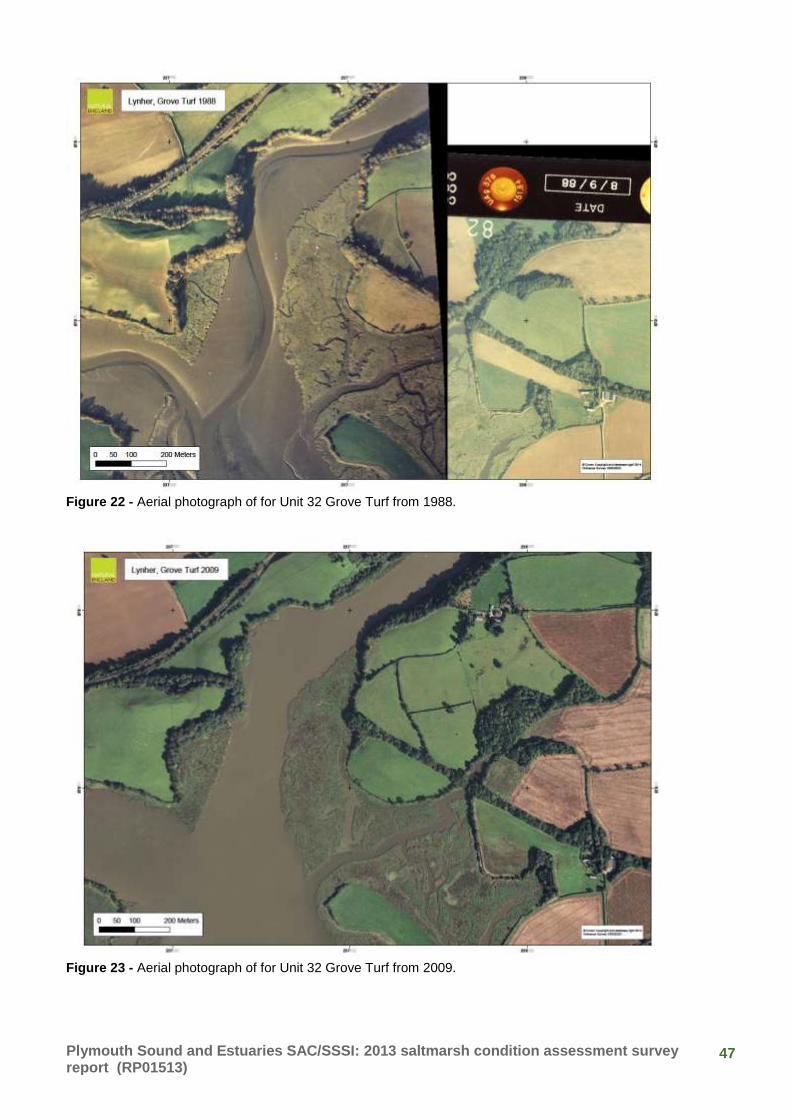
Human eye analysis of available photo sets shows no perceptible change in extent. Figures 22 and 23 (Grove Turf) and Figures 24 and 25 (Erth Island) overleaf show the two most extreme time periods, 1988 and 2009.
47 Plymouth Sound and Estuaries SAC/SSSI: 2013 saltmarsh condition assessment survey report (RP01513)
Figure 22 - Aerial photograph of for Unit 32 Grove Turf from 1988.
Figure 23 - Aerial photograph of for Unit 32 Grove Turf from 2009.

48 Plymouth Sound and Estuaries SAC/SSSI: 2013 saltmarsh condition assessment survey report (RP01513)
Figure 24 - Aerial photograph of for Unit 32 Erth Island from 1988.
Figure 25 - Aerial photograph of for Unit 32 Erth Island from 2009.
See Appendix for other available aerial photos for this Unit.

49 Plymouth Sound and Estuaries SAC/SSSI: 2013 saltmarsh condition assessment survey report (RP01513)
Community structure In 2013 Red Fescue and Sea arrowgrass are the most abundant species with Sea plantain, Thrift and Saltmarsh (mud) rush also common in the site. There is relatively high species diversity in this site with 18 species recorded in 2013, the highest for any Unit surveyed (Table 23). Of these 13 species were also recorded in 1986. No comparison with 2009/2010 was possible due to unavailability of data. Table 23 - Comparison of community structure 2013 and 1986 for Unit 32 Grove Turf & Erth Island.
2013 2009/2010 1986
No. of Quadrats in which species
present
No. of Quadrats in which species
present
Species present
(x)
Common Cord-grass Spartina anglica 1 n/a x
Common Saltmarsh-grass
Pucinella maritima 2 n/a x
Rocky sea spurrey Spergularia rupicola 1 n/a
Sea arrowgrass Triglochin maritima 9 n/a x
Sea plantain Plantago maritima 8 n/a x
Sea aster Aster tripolium 3 n/a x
Sea-purslane Atriplex (Halimione) portulacoides
2 n/a x
Common sea-lavender
Limonium vulgare 4 n/a
Long bracted sedge Carex extensa 2 n/a x
Oraches species Atriplex spp. 3 n/a
Red Fescue Festuca rubra 10 n/a x
Saltmarsh rush / Mud rush
Juncus gerardii 5 n/a x
Sea rush Juncus maritimus 1 n/a x
Sea club-rush Bolboschoenus maritimus (Scirpus maritimus)
1 n/a x
Sea-milkwort Glaux maritima 3 n/a x
Shrubby sea-blite Sueda vera 1 n/a
Thrift Armeria maritima 6 n/a x
Common reed Phragmites australis 1 n/a
Species count 18

50 Plymouth Sound and Estuaries SAC/SSSI: 2013 saltmarsh condition assessment survey report (RP01513)
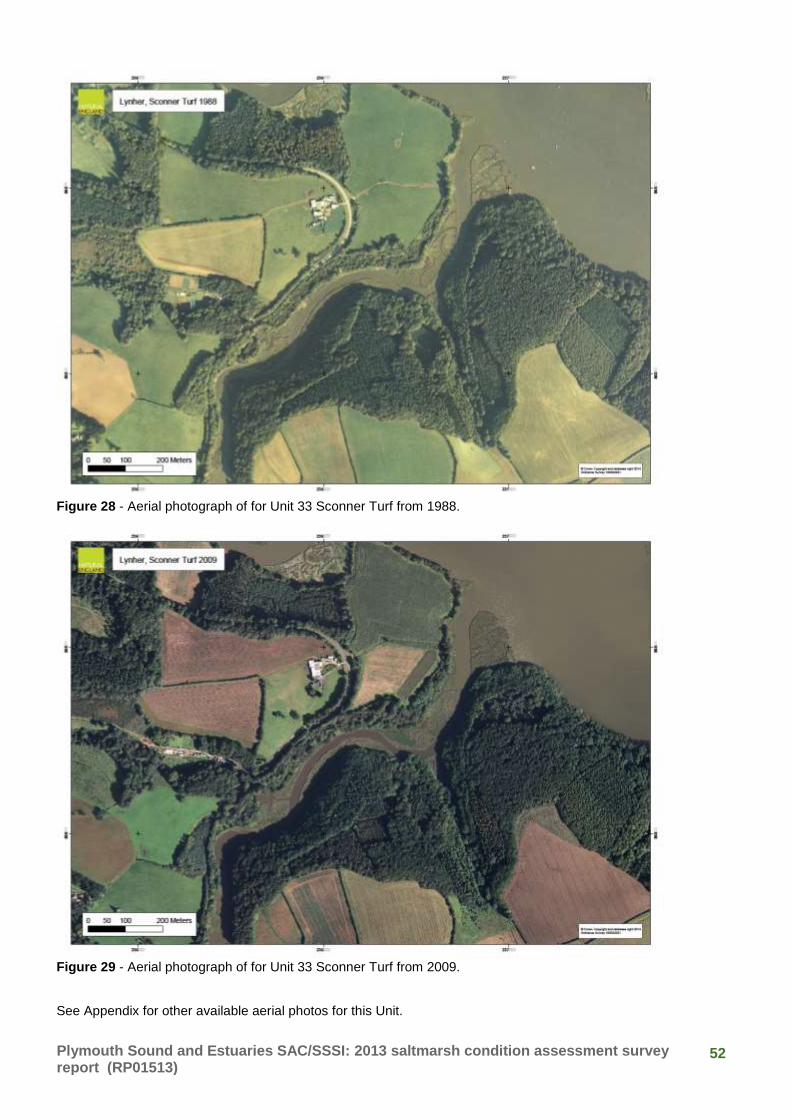
Unit 33, Polbathic Turf and Sconner Turf Extent Quantitative analysis of saltmarsh extent (Table 24) shows no change between 2001 and 2009. Table 24 - Comparison of saltmarsh extent (hectares) 2001 to 2009 for Unit 33 Polbathic Turf and Sconner Turf.
2001 2009
(ha) (ha) 14.74 14.69
Human eye analysis of available photo sets also suggests no change. Figures 26 and 27 (Polbathic Turf) and Figures 28 and 29 (Sconner Turf) overleaf show the two most extreme time periods, 1988 and 2009.

51 Plymouth Sound and Estuaries SAC/SSSI: 2013 saltmarsh condition assessment survey report (RP01513)
Figure 26 - Aerial photograph of for Unit 33 Polbathic Turf from 1988.
Figure 27 - Aerial photograph of for Unit 33 Polbathic Turf from 2009.
52 Plymouth Sound and Estuaries SAC/SSSI: 2013 saltmarsh condition assessment survey report (RP01513)
Figure 28 - Aerial photograph of for Unit 33 Sconner Turf from 1988.
Figure 29 - Aerial photograph of for Unit 33 Sconner Turf from 2009.
See Appendix for other available aerial photos for this Unit.

53 Plymouth Sound and Estuaries SAC/SSSI: 2013 saltmarsh condition assessment survey report (RP01513)
Community structure
Red Fescue was dominant across the site in both 2013 and 2010, with Sea Aster and Sea arrowgrass also common in the site in both years. In 2013 Common saltmarsh grass appears to be more common (not recorded in 2010), whilst Orache species were common in the site in 2010, but not recorded in 2013 (Table 25). The total number of species recorded is similar in 2013 (9 species) and 2010 (10 species), with 6 species common to both years, indicating a good degree of consistency in species composition (Table 25). The list of species present is also qualitatively similar to 1986; with 11 of the species recorded in 2010/2013, also observed in 1986. Table 25 - Comparison of community structure 2013, 2010 and 1986 for Unit 33 Polbathic Turf & Sconner Turf.
2013 2010 1986
No. of Quadrats in which species
present
No. of Quadrats in which species
present
Species present
(x)
Common Cord-grass Spartina anglica 1 0 x
Common Saltmarsh-grass
Pucinella maritima 4 0 x
Sea arrowgrass Triglochin maritima 4 5 x
Sea plantain Plantago maritima 3 1 x
Sea aster Aster tripolium 4 4 x
Sea-purslane Atriplex (Halimione) portulacoides
1 1 x
Creeping bent Agrostis stolonifera 2 5 x
Long bracted sedge Carex extensa 0 1 x
Orache species Atriplex spp. 0 6
Red Fescue Festuca rubra 5 5 x
Sea club-rush Bolboschoenus maritimus (Scirpus maritimus)
0 1 x
Sea-milkwort Glaux maritima 0 2 x
English scurvey grass Cochlearia anglica 2 0
Species count 9 10

54 Plymouth Sound and Estuaries SAC/SSSI: 2013 saltmarsh condition assessment survey report (RP01513)
Unit 34, Upper Lynher Extent Quantitative analysis of saltmarsh extent (Table 26) shows some reduction in extent between 2001 and 2009, towards the upper reaches of the saltmarsh. However, caution is advised due to possible tidal differences, and different shadowing on the aerial photographs. Table 26 - Comparison of saltmarsh extent (hectares) 2001 to 2009 for Unit 34 Upper Lynher.
2001 2009
(ha) (ha) 34.49 34.25
Human eye analysis suggests no major changes in extent. Note: some of the internal creeks appear wider in later years, but this is inconclusive and could be due to differences in the state of the tide. Figures 30 and 31 overleaf show the two most extreme time periods, 1988 and 2009.

55 Plymouth Sound and Estuaries SAC/SSSI: 2013 saltmarsh condition assessment survey report (RP01513)
Figure 30 - Aerial photograph of for Unit 34 Upper Lynher from 1988.
Figure 31 - Aerial photograph of for Unit 34 Upper Lynher from 2009.
See Appendix for other available aerial photos for this Unit.

56 Plymouth Sound and Estuaries SAC/SSSI: 2013 saltmarsh condition assessment survey report (RP01513)
Community structure
Sea club-rush and Creeping bent were the dominant species in both 2013 and 2010, with Creeping bent the overall most dominant species (based in percentage cover, not shown). Spear leaved Orache also remains frequent throughout the site in 2013, as was observed in 2010. The total number of species recorded is similar in 2013 (9 species) and 2010 (7 species), with 5 species common to both years (Table 27). The list of species present is also qualitatively similar to 1986; with 7 species recorded in 2013 also present in 1986 (Table 27). Table 27 - Comparison of community structure 2013, 2010 and 1986 for Unit 34 Upper Lynher.
2013 2010 1986
No. of Qs in which species is present 2013
No. of Qs in which species is present 2010
Species present
(x)
Common Cord-grass Spartina anglica 0 1
Common Saltmarsh-grass
Pucinella maritima 1 0 x
Sea plantain Plantago maritima 0 1
Sea aster Aster tripolium 2 1 x
Creeping bent Agrostis stolonifera 7 8 x
Oraches species Atriplex spp. 8 7
Red Fescue Festuca rubra 1 1 x
Saltmarsh rush / Mud rush
Juncus gerardii 1 0 x
Sea club-rush Bolboschoenus maritimus (Scirpus maritimus)
6 7 x
Sea couch grass Agropyron pungens / E. pycnanthus
1 0 x
English scurvey grass Cochlearia anglica 1 0
Species count 9 7

57 Plymouth Sound and Estuaries SAC/SSSI: 2013 saltmarsh condition assessment survey report (RP01513)
St John’s Lake SSSI Unit 1, St John’s Lake Insworke
Extent Analysis of extent using aerial photography was difficult and inconclusive, due to low resolution and differences in the state of the tide. However, no significant change was noted. Figures 32 and 33 overleaf show the two most extreme time periods, 1988 and 2009, with others appended. Community structure In 2013 Common cord-grass and Sea purslane are the dominant species in the site, with Common saltmarsh grass also notable. In total 6 species were recorded at this site (Table 28). No comparison with 2009/2010 is possible as this was the first such condition monitoring survey at this site. However, a qualitative comparison to 1986 reveals a high degree of consistency with 5 of the 6 species observed in 2013 also observed in 1986 (Table 28). Table 28 - Comparison of community structure 2013 and 1986 for Unit 1 St John’s Lake Insworke.
2013 2009 1986
No. of Quadrats in which species
present
No. of Quadrats in which species
present
Species present
(x)
Common Cord-grass Spartina anglica 5 n/a x
Common Saltmarsh-grass
Pucinella maritima 2 n/a x
Sea arrowgrass Triglochin maritima 1 n/a x
Sea-purslane Atriplex (Halimione) portulacoides
4 n/a x
Orache species Atriplex spp. 1 n/a x
Couch grass Elymus repens 1 n/a
Species count 6 n/a

58 Plymouth Sound and Estuaries SAC/SSSI: 2013 saltmarsh condition assessment survey report (RP01513)
Figure 32 - Aerial photograph of for Unit 1 St John’s Lake Insworke from 1988.
Figure 33 - Aerial photograph of for Unit 1 St John’s Lake Insworke from 2009.
See Appendix for other available aerial photos for this Unit.

59 Plymouth Sound and Estuaries SAC/SSSI: 2013 saltmarsh condition assessment survey report (RP01513)
Unit 3, St John’s Lake Extent Analysis of extent using aerial photography was difficult and inconclusive, due to both low resolution and differences in the state of the tide. However, indication of possible loss of extent towards the South-eastern extent of the saltmarsh is visible from 1988 to 2001, whereas the 2009 photo is inconclusive due to tidal inundation. Figures 34 and 35 overleaf show these time periods with the area of change highlighted. Photographs for 1996 and 2009 are appended. Community structure In 2013, Sea purslane and Common cord-grass are the dominant species in the site, with Common reed also common. In total 10 species were recorded at this site. No comparison with 2009/2010 is possible as this was the first such condition monitoring survey at this site. However, a qualitative comparison to 1986 reveals a high degree of consistency in species composition over time, with 9 of the 10 species recorded in 2013 also observed in 1986 (Table 29). Table 29 - Comparison of community structure 2013 and 1986 for Unit 3 St John’s Lake.
2013 2009 1986
No. of Quadrats in which species
present
No. of Quadrats in which species
present
Species present (x)
Common Cord-grass Spartina anglica 5 n/a x
Glasswort species Salicornia spp. 3 n/a x
Rocky sea spurrey Spergularia rupicola 1 n/a
Sea plantain Plantago maritima 1 n/a x
Sea aster Aster tripolium 2 n/a x
Sea-purslane Atriplex (Halimione) portulacoides
5 n/a x
Creeping bent Agrostis stolonifera 1 n/a x
Saltmarsh rush / Mud rush
Juncus gerardii 1 n/a x
Sea-milkwort Glaux maritima 1 n/a x
Common reed Phragmites australis 2 n/a x
Species count 10 n/a

60 Plymouth Sound and Estuaries SAC/SSSI: 2013 saltmarsh condition assessment survey report (RP01513)
Figure 34 - Aerial photograph of for Unit 3 St John’s Lake from 1988.
Figure 35 - Aerial photograph of for Unit 3 St John’s Lake from 2001.
See Appendix for other available aerial photos for this Unit.
Possible loss of extent/erosion
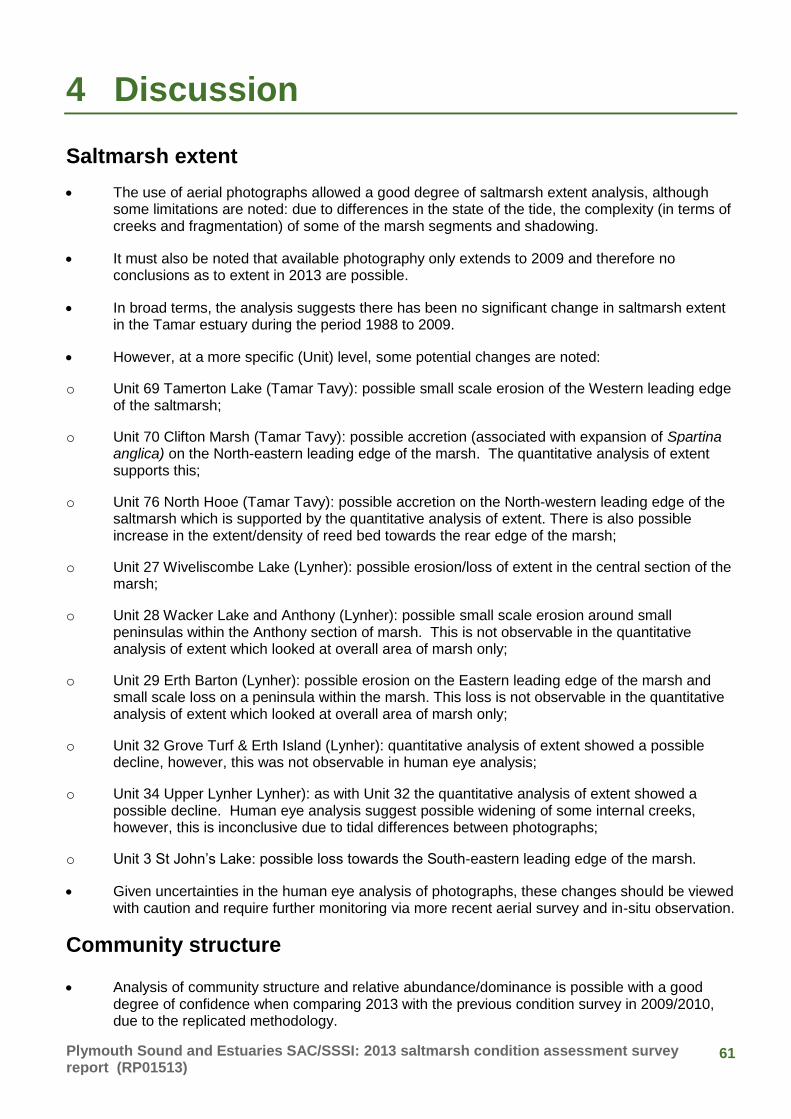
61 Plymouth Sound and Estuaries SAC/SSSI: 2013 saltmarsh condition assessment survey report (RP01513)
4 Discussion
Saltmarsh extent
The use of aerial photographs allowed a good degree of saltmarsh extent analysis, although some limitations are noted: due to differences in the state of the tide, the complexity (in terms of creeks and fragmentation) of some of the marsh segments and shadowing.
It must also be noted that available photography only extends to 2009 and therefore no conclusions as to extent in 2013 are possible.
In broad terms, the analysis suggests there has been no significant change in saltmarsh extent in the Tamar estuary during the period 1988 to 2009.
However, at a more specific (Unit) level, some potential changes are noted:
o Unit 69 Tamerton Lake (Tamar Tavy): possible small scale erosion of the Western leading edge of the saltmarsh;
o Unit 70 Clifton Marsh (Tamar Tavy): possible accretion (associated with expansion of Spartina anglica) on the North-eastern leading edge of the marsh. The quantitative analysis of extent supports this;
o Unit 76 North Hooe (Tamar Tavy): possible accretion on the North-western leading edge of the saltmarsh which is supported by the quantitative analysis of extent. There is also possible increase in the extent/density of reed bed towards the rear edge of the marsh;
o Unit 27 Wiveliscombe Lake (Lynher): possible erosion/loss of extent in the central section of the marsh;
o Unit 28 Wacker Lake and Anthony (Lynher): possible small scale erosion around small peninsulas within the Anthony section of marsh. This is not observable in the quantitative analysis of extent which looked at overall area of marsh only;
o Unit 29 Erth Barton (Lynher): possible erosion on the Eastern leading edge of the marsh and small scale loss on a peninsula within the marsh. This loss is not observable in the quantitative analysis of extent which looked at overall area of marsh only;
o Unit 32 Grove Turf & Erth Island (Lynher): quantitative analysis of extent showed a possible decline, however, this was not observable in human eye analysis;
o Unit 34 Upper Lynher Lynher): as with Unit 32 the quantitative analysis of extent showed a possible decline. Human eye analysis suggest possible widening of some internal creeks, however, this is inconclusive due to tidal differences between photographs;
o Unit 3 St John’s Lake: possible loss towards the South-eastern leading edge of the marsh.
Given uncertainties in the human eye analysis of photographs, these changes should be viewed with caution and require further monitoring via more recent aerial survey and in-situ observation.
Community structure
Analysis of community structure and relative abundance/dominance is possible with a good degree of confidence when comparing 2013 with the previous condition survey in 2009/2010, due to the replicated methodology.

62 Plymouth Sound and Estuaries SAC/SSSI: 2013 saltmarsh condition assessment survey report (RP01513)
Long term comparison is presented with 1986, where data is available, but given significant methodological differences this should be viewed as a qualitative comparison.
Overall, there is a relatively high degree of consistency in species composition across all surveyed Units when comparing 2013 to the previous condition monitoring survey in 2009/2010.
Overall, the saltmarsh in the Tamar Estuary is not particularly species diverse when compared with some other estuaries, however, the following diversity was noted:
o In the Tamar-Tavy SSSI a total of 21 saltmarsh species were recorded in 2013, with Red Fescue, Sea Purslane, Sea Arrowgrass, Creeping bent and Sea club-rush noted as the most frequent species.
o In the Lynher Estuary SSSI a total of 22 saltmarsh species were recorded with Sea purslane, Sea club-rush, Common cord-grass, Sea arrowgrass, Red Fescue and Creeping bent the most frequent species.
o St John’s Lake SSSI had relatively lower species diversity with a total 14 saltmarsh species recorded in 2013. However, this could well be due to the fact that this SSSI comprised fewer Units. Common cord-grass and Sea Purslane were the dominant species in the two units surveyed.
The overall greatest species diversity was recorded in Unit 32 Grove Turf and Erth Island, with 18 species recorded.
There is perhaps some slight decline since 2009/2010 in Common-cordgrass, especially notable in the Tamar-Tavy SSSI (Unit 66 Bere Ferrers and Unit 70 Egypt Marsh).
In terms of longer term change, overall species present across all units is qualitatively similar in 2013 to 1986, although the caveat over methodological differences must be noted.
Limitations
Reedbeds were not routinely mapped or assessed as part of this survey.
There were limitations with the extent analysis due to differences in the start of the tide and the complexity (in terms of creeks and fragmentation) of some of the marsh segments and shadowing.
Conclusion
The condition of the saltmarsh feature in the Tamar Estuary appears very stable and favourable.
Overall extent of saltmarsh appears stable, and whilst some changes are noted at Unit level, these should be viewed with a degree of caution due to limitations with respect to the aerial extent analysis methodology.
Community structure is very stable from 2009/10 to 2013 and the species present in 2009 and 2013 exhibit a high degree of consistency over the longer term, when compared with 1986.

63 Plymouth Sound and Estuaries SAC/SSSI: 2013 saltmarsh condition assessment survey report (RP01513)
Recommendations for future monitoring In conducting the analysis for and writing this report a number of observations were made with regards to the ability to compare over time and what is practically achievable for ongoing condition assessment surveys:
Although the intention was to revisit replicated quadrats during the structured walk element of the study, it was in practical terms not possible to relocate the exact 2m2 quadrat, in all cases. For these reasons and in-line with Common Standards Monitoring (CSM) guidelines, a quadrat level analysis comparing 2009/10 to 2013 was not employed. Instead, a site (Unit) level analysis was conducted based on aggregated quadrat information.
Permanent quadrat location markers would give greater confidence and enable a more robust quadrat level comparison, however, fixing quadrat locations within the saltmarsh is likely to be impractical. Furthermore, given the dynamic nature of the saltmarsh system and propensity for vegetation change in small spatial areas, it is the recommendation of the authors to continue to conduct analysis only at a site (SSSI Unit) level, and to continue to control the sample points as closely as possible to ensure the same number of quadrats, from the same areas within the marsh contribute to this analysis.
The DAFOR scale (recommended in CSM) was not utilised in the primary analysis of frequency/abundance, due to potential inconsistencies with the way the methodology had been applied in 2009/10, and a desire to compare across years. Instead, a raw quantitative assessment (number of quadrats in which a species was present) was employed to compare frequency across the two time periods. Additionally, the dominant/most abundant species in each Unit were identified based on relative total percentage cover of the species observed in each Unit.
Sward height was not compared within the analysis, although this information is available in the Appendix. A general trend of lower sward height was observed in 2013 versus the previous recordings in 2009/10. However, it is not possible to determine whether this is due to differences in methodology (e.g. surveyor bias, as a larger number of surveyors were used in 2013) or slight temporal/seasonal variations. We recommend continuing to collect sward height in future utilising the same methodology described in Section 2 and as closely as possible replicating the dates of the fieldwork period. All efforts should be taken to ensure consistent application of the method across surveyors. Once data collection methodology and time of year are controlled for, we recommend that any sward height analysis is conducted at site (Unit) level, rather than at quadrat level for the reasons described above.
Zonation transect data was collected in each Unit but is yet to be analysed. As described in Section 1, the Tamar ria system is characterised by an absence of typical saltmarsh zones. This means that changes recorded on transects may not always be due to a change in zone but may also be due to sudden changes in vegetation type (e.g. due to topography or islands of a particular vegetation) rather than typical zonation. The difficulties noted above, in terms of spatial replication of quadrats, also apply to transects.
Aerial photography proved a good means of evaluating changes in overall extent, however, it relies largely on human eye analysis. We therefore recommend that a team of three project members examine the aerial photographs for each site (as conducted in this survey) so that a consensus view may be reached. An update of the extent analysis is recommended as soon as updated aerial photography becomes available.


64
Condition Assessment
SSSI condition Table 30 - Summary of updated condition of Tamar-Tavy SSSI Units.
SSSI Unit Current Condition Condition Summary
Unit 65 Kingsmill Lake Favourable Current extent of marsh does not appear to have changed having studied aerial photos. The dominant species within the marsh remain as Sea Purslane, Sea Aster and Sea Arrowgrass. No damage to the marsh area was noted.
Unit 66 Bere Ferrers (North Tavy) Favourable No change in extent noted. Species composition remains stable with Common Saltmarsh grass, Sea Arrowgrass and Creeping Bent being the most dominant species. No damage to the marsh was recorded during the survey.
Unit 67 Blaxton Marsh (South Tavy) Favourable Saltmarsh remains bounded by extensive reedbed. Sea Arrowgrass and Sea Purslane are the most dominant species on site. In total 9 species recorded during the survey. No damage to the marsh was recorded.
Unit 69 Tamerton Lake Favourable No loss in extent of feature noted. Red Fescue, Common Saltmarsh grass and English Scurvey grass most dominant species. No damage identified to the marsh during the survey.
Unit 70 Egypt Marsh Favourable Although there are signs of erosion at the front of the marsh, aerial photographs suggest no significant loss of extent. Red Fescue and Sea Purslane remain the dominant species. Spartina appears to have slightly decreased between 2009 and 2013. No damage to the marsh was recorded
Unit 75 Clifton Favourable Comparing aerial photography over the last twenty years suggests a slight increase in extent on the North-eastern leading edge. The same four species were abundant on the site in 2013 and 2009. These include Red Fescue, Sea Purslane, Sea Arrowgrass and Creeping Bent. Nine species also present in 2009 and 2013 were also recorded for the site in 1986. No damage was noted during the survey.
Unit 76 North Hooe Favourable A slight increase in extent was noted when comparing aerial photography from 2001 and 2009. Increased density of the reedbed to the back of the marsh is also noted between 1988 and 2009. Five species were noted abundant in both 2010 and 2013. These include Creeping Bent, Sea Arrowgrass and Hastate orache, Sea Club-rush and Red Fescue. No damage was recorded to the marsh during the survey.

65
Table 31 - Summary of updated condition of Lynher SSSI Units.
SSSI Unit Current Condition Condition Summary
Unit 27 Wiveliscombe Lake Favourable Aerial photograph from 1988 and 2009 suggests a slight decrease in extent. However, no evidence of damage to the marsh is noted. Spartina, Sea Arrowgrass, Sea Plantain and Sea Purslane were recorded as the most common species in both 2013 and 2010.
Unit 28 Wacker Lake & Anthony (Wacker Marsh)
Favourable No change in extent was noted when comparing aerial photography from 1988 to 2009. The total number of species recorded in 2013 is very similar to the 2009 survey with Sea Purslane remaining dominant. No damage to the marsh was recorded during the survey.
Unit 29 Erth Barton Favourable No loss of extent between 1988 and 2009 can be confirmed when analysing aerial photography. Sea Purslane remains the most dominant species in both the surveys undertaken in 2013 and 2010. Other abundant species include Spartina and Sea Club-rush. No damage was recorded to the marsh during the survey.
Unit 31 River Tiddy Favourable No change of extent was noted when comparing aerial photographs from 1988 to 2009. Most abundant species included Sea Clubrush, Sea Arrowgrass, Creeping Bent, Sea Couch and Saltmarsh rush. No damage to the marsh was noted during the survey.
Unit 32 Grove Turf and Erth Island Favourable No change in extent evident when analysing aerial photography from 1988 to 2009. Relatively high species diversity recorded with 18 species found during the survey. Red Fescue and Sea Arrowgrass were the most abundant species on site. No damage to the marsh was recorded during the survey.
Unit 33 Polbathic Turf (and Sconner Turf)
Favourable No change in extent having analysed aerial photographs from 1988 to 2009. Red Fescue was dominant across both Polbathick and Sconner in 2013 and the previous survey in 2010, with Sea Aster and Sea Arrowgrass also common on the site in both years. No damage was recorded to the marsh during the survey.
Unit 34 Upper Lynher (Western Lynher)
Favourable Change in extent could not be confirmed when analysing aerial photographs from 2001 and 2009. Sea Club-rush and Creeping Bent were the dominant species in both 2013 and 2010. The number of species recorded in 2013, (9 species), is similar to 2010, (7 species) and 1986, (7 species). The same species were common in all three surveys. No damage was recorded to the marsh during the 2013 survey.

66
Table 32 - Summary of updated condition of St John’s Lake SSSI Units.
SSSI Unit Current Condition Condition Summary
Unit 1 St John’s Lake (Insworke) Unfavourable recovering*
Unit 1 contains a limited area of saltmarsh which was assessed as a SAC feature and a supporting habitat to the main SSSI feature. The saltmarsh habitat itself appears to be stable, with no sign of significant erosion having studied aerial photos spanning the last 20 years. There is no stock poaching or vehicle damage evident. The main species found were Spartina anglica, Atriplex Portucoides, Atriplex species, Elytrigia atherica and Triglochin maritima.
Unit 3 St John’s Lake (North Side) Unfavourable recovering*
Unit 3 contains a limited area of saltmarsh which was assessed as a SAC feature and a supporting habitat to the main SSSI feature. The saltmarsh habitat itself appears to be stable, with no sign of significant erosion having studied aerial photos spanning the last 20 years. There is no stock poaching or vehicle damage evident. The main species found included - Atriplex portulaciodes, Spartina anglica, Salicornia, Phragmities australis and Aster tripolium.
*Although the current condition of this unit is unfavourable recovering, the saltmarsh element is considered to be favourable condition

67
SAC condition Table 33 - Favourable Condition Summary for Saltmarsh Communities of Plymouth Sound and Estuaries SAC
Feature / Sub-feature
Attribute Target Site Condition Summary Condition Summary (SSSI Sub-units)
Estuaries / saltmarsh communities
Extent No decrease in extent of saltmarsh communities from an established baseline, subject to natural change
No significant decrease in extent
(Most recent survey 2009 in comparison with 1988, 1995, 2001)
Tamar Tavy
Lynher Estuary
St John’s Lake
No significant decrease
No significant decrease
No significant decrease
Estuaries / saltmarsh communities
Creek patterns No alteration of creek patterns from an established baseline, subject to natural change
No significant alteration of creek patterns
(Most recent survey 2009 in comparison with 1988, 1995, 2001)
Tamar Tavy
Lynher Estuary
St John’s Lake
No significant change
No significant change
No significant change
Estuaries / saltmarsh communities
Range and distribution of characteristic saltmarsh communities
Range and distribution of characteristic saltmarsh communities should not deviate significantly from an established baseline, subject to natural change
No significant change
(Most recent survey 2013 in comparison with 2009/10)
Tamar Tavy
Lynher Estuary
St John’s Lake
No significant change
No significant change
No significant change
Estuaries / saltmarsh communities
Characteristic species of characteristic saltmarsh communities
Frequency and abundance of characterising species should not deviate significantly from an established baseline, subject to natural change
No significant change
(Most recent survey 2013 in comparison with 2009/10)
Tamar Tavy
Lynher Estuary
St John’s Lake
No significant change
No significant change
No significant change

68 Plymouth Sound and Estuaries SAC/SSSI: 2013 saltmarsh condition assessment survey report (RP01513)
5 References
BURD, F. 1989. The Saltmarsh Survey of Great Britain: An inventory of British Saltmarshes. Cornwall Supplement. Peterborough, Nature Conservancy Council
JNCC. 2004. Common Standards Monitoring Guidance for Saltmarsh Habitats Version 4 [online]. http://jncc.defra.gov.uk/pdf/CSM_coastal_saltmarsh.pdf [Accessed February 2014]
JNCC. 2004. Natura 2000 Standard Data Form – Plymouth Sound and Estuaries SAC [online]. http://jncc.defra.gov.uk/protectedsites/sacselection/n2kforms/UK0013111.pdf [Accessed January 2014]
JNCC. 2004. Protected Sites Habitat account - Marine, coastal and halophytic habitats 1330 Atlantic salt meadows (Glauco-Puccinellietalia maritimae) http://jncc.defra.gov.uk/protectedsites/sacselection/habitat.asp?FeatureIntCode=H1330 [Accessed January 2014]
JNCC. 2004. Protected Sites Monitoring – Saltmarsh [online]. http://jncc.defra.gov.uk/page-3573 [Accessed January 2014]
JNCC.2004. UK Biodiversity Action Plan Priority Habitat Descriptions – Saltmarsh [online]. http://jncc.defra.gov.uk/PDF/UKBAP_PriorityHabitatDesc-Rev2011.pdf [Accessed January 2014]
NATURAL ENGLAND. 2014. Conservation objectives and definitions of favourable condition for designated features of interest – Lynher Estuary SSSI [online]. http://www.sssi.naturalengland.org.uk/Special/sssi/fct/FCT_1004001_F.pdf [Accessed February 2014] NATURAL ENGLAND. 2014. Conservation objectives and definitions of favourable condition for designated features of interest – Tamar Tavy Estuary SSSI [online]. http://www.sssi.naturalengland.org.uk/Special/sssi/fct/FCT_1005917_D.pdf [Accessed February 2014] NATURAL ENGLAND. 2014. Conservation objectives and definitions of favourable condition for designated features of interest – St John’s Lake SSSI [online]. http://www.sssi.naturalengland.org.uk/Special/sssi/fct/FCT_1000512_F.pdf [Accessed February 2014] NATURAL ENGLAND. 2014. European Site Conservation Objectives for Plymouth Sound and Estuaries Special Area of Conservation [online]. http://www.naturalengland.org.uk/Images/UK0013111-Plymouth-Sound-and-Estuaries-SAC_tcm6-31961.pdf [Accessed January 2014]
NATURAL ENGLAND. 2000. English Nature’s advice given under Regulation 33(2) of the Conservation (Natural Habitats &c.) Regulations 1994 [online]. http://publications.naturalengland.org.uk/file/3977172 [Accessed January 2014]
NATURAL ENGLAND. 2014. Marine Protected Areas Features Catalogue – Coastal Saltmarsh and Saline Reed Beds [online]. http://www.naturalengland.org.uk/ourwork/marine/mpa/mcz/features/broadhabitats/coastalsaltmarshesandsalinereedbeds.aspx [Accessed January 2014]

Further information Natural England evidence can be downloaded from our Access to Evidence Catalogue. For more information about Natural England and our work see Gov.UK. For any queries contact the Natural England Enquiry Service on 0300 060 3900 or e-mail [email protected] .
Copyright This report is published by Natural England under the Open Government Licence - OGLv3.0 for public sector information. You are encouraged to use, and reuse, information subject to certain conditions. For details of the licence visit Copyright. Natural England photographs are only available for non-commercial purposes. If any other information such as maps or data cannot be used commercially this will be made clear within the report.
© Natural England and other parties 2016
Report number: RP01513
ISBN: 978-1-78354-355-7