Embed Size (px)
Citation preview

ANL/ESD-16/8
Plug-in Electric Vehicle Policy
Effectiveness: Literature Review
Energy Systems Division

About Argonne National Laboratory
Argonne is a U.S. Department of Energy laboratory managed by UChicago
Argonne, LLC under contract DE-AC02-06CH11357. The Laboratory’s main
facility is outside Chicago, at 9700 South Cass Avenue, Argonne, Illinois 60439.
For information about Argonne and its pioneering science and technology
programs, see www.anl.gov.
DOCUMENT AVAILABILITY
Online Access: U.S. Department of Energy (DOE) reports produced after 1991 and a growing number of pre-1991 documents are available free via DOE’s SciTech Connect (http://www.osti.gov/scitech/)
Reports not in digital format may be purchased by the public from the National Technical Information Service (NTIS):
U.S. Department of Commerce National Technical Information Service 5301 Shawnee Rd Alexandria, VA 22312 www.ntis.gov Phone: (800) 553-NTIS (6847) or (703) 605-6000 Fax: (703) 605-6900 Email: [email protected]
Reports not in digital format are available to DOE and DOE contractors from the Office of Scientific and Technical Information (OSTI):
U.S. Department of Energy Office of Scientific and Technical Information P.O. Box 62 Oak Ridge, TN 37831-0062 www.osti.gov Phone: (865) 576-8401 Fax: (865) 576-5728 Email: [email protected]
Disclaimer This report was prepared as an account of work sponsored by an agency of the United States Government. Neither the United States Government nor any agency thereof, nor UChicago Argonne, LLC, nor any of their employees or officers, makes any warranty, express or implied, or assumes any legal liability or responsibility for the accuracy, completeness, or usefulness of any information, apparatus, product, or process disclosed, or represents that its use would not infringe privately owned rights. Reference herein to any specific commercial product, process, or service by trade name, trademark, manufacturer, or otherwise, does not necessarily constitute or imply its endorsement, recommendation, or favoring by the United States Government or any agency thereof. The views and opinions of document authors expressed herein do not necessarily state or reflect those of the United States Government or any agency thereof, Argonne National Laboratory, or UChicago Argonne, LLC.

ANL/ESD-16/8
Plug-in Electric Vehicle Policy
Effectiveness: Literature Review
prepared by
Yan Zhou, Todd Levin, and Steven E. Plotkin
Energy Systems Division, Argonne National Laboratory
May 2016

ANL/ESD-16/8
4
This page intentionally left blank.

ANL/ESD-16/8
5
ACKNOWLEDGEMENTS The authors would like to thank the U.S. Department of Energy Office of Energy Policy and
Systems Analysis for its support of this research, and in particular Jenah Zweig, Natalie
Kempkey, and Joseph Teng for their guidance throughout the development of this report. We
also thank Danilo Santini of Argonne National Laboratory for the contributions and feedback
that he provided.

ANL/ESD-16/8
6
ACRONYMS AFV: Alternative Fuel Vehicle
BEV: Battery Electric Vehicle
DOE: U.S. Department of Energy
EI: Environmental Index
EVSE: Electric Vehicle Supply Equipment
HOV: High-occupancy Vehicle
ICE: Internal Combustion Engine
LDV: Light-duty Vehicle
NYC: New York City
PEV: Plug-in Electric Vehicle (includes both PHEVs and BEVs)
PHEV: Plug-in Hybrid Electric Vehicle
VMT: Vehicle Miles Traveled
ZEV: Zero-emission Vehicle

ANL/ESD-16/8
7
CONTENTS ACKNOWLEDGEMENTS ............................................................................................................ 5
ACRONYMS .................................................................................................................................. 6
I. INTRODUCTION ................................................................................................................... 8
II. SUMMARY ......................................................................................................................... 9
A. Best Practices ................................................................................................................. 13
B. Challenges and Barriers ................................................................................................. 14
C. Additional Findings ........................................................................................................ 15
D. Research Gaps ................................................................................................................ 16
III. REVIEW OF STUDIES .................................................................................................... 19
A. Studies Based on Statistical Analysis ............................................................................ 19
B. Studies Based on Surveys .............................................................................................. 24
C. Studies Based on Examples and Experiences ................................................................ 26
IV. CONCLUSIONS................................................................................................................ 29
V. REFERENCES .................................................................................................................. 30

ANL/ESD-16/8
8
I. INTRODUCTION The U.S. federal government first introduced incentives for plug-in electric vehicles (PEVs)
through the American Clean Energy and Security Act of 2009, which provided a tax credit of up
to $7,500 for a new PEV purchase. Soon after, in December 2010, two mass-market PEVs were
introduced, the plug-in hybrid electric vehicle (PHEV) Chevrolet Volt and the battery electric
vehicle (BEV) Nissan LEAF. Since that time, numerous additional types of PEV incentives have
been provided by federal and regional (state or city) government agencies and utility companies.
These incentives cover vehicle purchases as well as the purchase and installation of electric
vehicle supply equipment (EVSE) through purchase rebates, tax credits, or discounted purchase
taxes or registration fees. Additional incentives, such as free high-occupancy vehicle (HOV) lane
access and parking benefits, may also be offered to PEV owners. Details about these incentives,
such as the extent to which each type is offered by region, can be obtained from the U.S.
Department of Energy (DOE) Alternative Fuel Data Center (http://www.afdc.energy.gov/). In
addition to these incentives, other policies, such as zero-emission vehicle (ZEV) mandates,1 have
also been implemented, and community-scale federal incentives, such as the DOE PEV
Readiness Grants, have been awarded throughout the country to improve PEV market
penetration.
This report reviews 18 studies that analyze the impacts of past or current incentives and policies
that were designed to support PEV adoption in the U.S. These studies were selected for review
after a comprehensive survey of the literature and discussion with a number of experts in the
field. The report summarizes the lessons learned and best practices from the experiences of these
incentive programs to date, as well as the challenges they face and barriers that inhibit further
market adoption of PEVs. Studies that make projections based on future policy scenarios and
those that focus solely on international markets are not included in this report. Studies that only
provide an overview of the current market without discussing how incentives influence the
market are also not included.
Since PEVs have only been available to mass-market consumers for roughly five years, and
many PEV incentives have been offered for an even shorter period, there are often insufficient
data to comprehensively analyze the impacts of a given policy or incentive. Robust analysis is
further complicated by the rapidly evolving marketplace for PEVs in the U.S. due to evolutions
such as price reductions for vehicles and charging equipment, range improvements, growing new
model availability and fluctuating gasoline prices. These changes make it difficult to isolate the
impacts of incentives and policies from external market trends. In addition, PEV sales currently
make up less than 1% of total U.S. light-duty vehicle (LDV) sales—about 113,000 PEVs out of
17.5 million LDV sales (Zhou 2016). If PEV sales grow significantly and begin to encompass
1 ZEV mandates are currently implemented at the state level and generally require car manufacturers to meet a
minimum threshold of annual ZEV sales.

ANL/ESD-16/8
9
more buyers outside of the initial innovators and early adopters—those most likely to be the first
to purchase new technologies—analyses of market behavior will become more robust predictors
of future drivers of increased PEV market penetration.
All 18 reviewed studies were published in or after 2014, though none incorporate 2015 sales data
into their analyses. As the market for PEVs continues to grow and evolve in the U.S. and more
data become available, additional research will be needed to evaluate the relative effectiveness of
various policies and incentives to promote increased PEV market penetration.
II. SUMMARY Of the 18 studies reviewed, 13 studies rely upon statistical analyses, nine of which are driven by
registration/sales data and four of which are driven by survey results, to understand the linkage
between PEV adoption and federal, state, city or utility actions. The remaining five studies
provide more qualitative analyses and discussions of how effectively a given policy has been
able to promote PEV adoption, based on examples and experiences. Table 1 summarizes the
impacts of the various policy measures that these studies analyzed. A positive impact is
registered when a quantitative analysis finds a statistically significant positive correlation
between the policy action and market adoption of electric vehicles, or when a qualitative analysis
concludes that a policy action had a positive impact on market adoption. No impact is registered
when an analysis fails to find a statistically significant positive correlation between the policy
action and market adoption of electric vehicles. Currently, there are over 30 actions that have
been taken by federal government, state or city agencies, and utilities to promote electric vehicle
adoption. Not all of these actions were evaluated by the reviewed studies; those that were
evaluated are listed in Table 1. Table 2 provides a short summary of each study with a brief
classification of its methodology. Key findings and broad trends that span multiple studies are
summarized in the following “Best Practices,” “Challenges and Barriers,” and “Additional
Findings” sub-sections.

ANL/ESD-16/8
10
Table 1: This table summarizes the various incentives and policy measures that were analyzed by the
selected studies. For each policy, the columns denote the number of studies that found 1) a positive
impact on PEV market adoption, or 2) no statistically significant impact on PEV market adoption. A
study is considered to be “not applicable” if it did not explicitly analyze the policy measure.
Policy Measure Impact on PEV Market Adoption
Positive Impact No Impact Not Applicable
Purchase Rebate 11 2 5
Tax Credit 10 2 6
Sales Tax Waiver 2 2 14
HOV Exemption 6 1 11
Parking Exemption a 2 1 15
Registration Fee Reduction 3 1 14
Charging Availability 6 1 11
Preferential Electricity Rates
for Charging
1 0 17
EVSE Purchase Incentive 2 0 16
Other Utility Promotion
Actions2
1 1 16
Emission Test Exemption 2 0 16
Zero-emission Vehicle
Mandates
2 0 16
Low Carbon Fuel Policy 1 0 17 a One study (Jin et al. 2014) found that the introduction of an additional annual registration fee negatively affected
PEV adoption. This result is interpreted to indicate that registration fee reduction has a positive impact on PEV
adoption.
2 In addition to incentivizing vehicles, charging stations and other EVSE purchases directly, many utilities
also undertake other outreach actions, such as promoting the benefits of electric vehicles and providing
relevant information (incentive overviews, information on the EVSE installation process, cost comparison
tools, electric vehicle dealership information, etc.) on their websites.

ANL/ESD-16/8
11
Table 2: A brief summary is provided for each of the 18 reviewed studies along with a characterization of
each methodology.
Study Selected Findings Methodology
Studies based on statistical analysis
Clinton (2014) Tax credits and charging infrastructure are statistically
significantly positively correlated with BEV registrations.
The effects of rebates and HOV access on BEV registration
are positive, but not statistically significant.
Logic model based on
2011–2013 sales
Greene et al. (2014a) Both long- and short-term policies are essential in the
transition to an electric drive fleet, though long-term policies
must evolve intelligently as uncertainty regarding market
dynamics and policy effectiveness lessens over time. The
estimated benefits of a transition to an electric vehicle fleet
may be up to an order of magnitude greater than the
associated costs; however, this trade-off depends on the
timing and intensity of policy interventions. ZEV mandates
appear to be a cost-effective means of supporting this
transition.
Nested logic vehicle choice
model with limited sales
data
Jin et al. (2014) Stepwise regression analysis shows that the most effective
incentives for PEV sales (in order of effectiveness) are (1)
subsidies (for both vehicles and infrastructure), (2) HOV lane
access, and (3) emissions testing exemptions, particularly for
BEVs.
Stepwise regression based
on 2013 sales
Lutsey et al. (2015) Even large, direct vehicle incentives have limited positive
effects on PEV adoption if there is limited charging
infrastructure and PEV model availability.
Stepwise linear regression
based on 2014 sales
Narassimhan and
Johnson (2014)
(1) State monetary incentives did not increase PHEV
purchases; however, HOV exemptions did. (2) Monetary
incentives significantly increased BEV purchases. (3)
Charging infrastructure availability has a significant positive
impact on both PHEV and BEV purchases.
Regression analysis based
on 2013–Q1 2014 sales
Santini et al. (2015a) DOE PEV Readiness Grants have a strongly significant and
positive statistical effect on PEV adoption rates in states
without other policy measures.
T-test based on 2013–Q1
2014 sales
Santini et al. (2015b) Cities and states with utility activities to promote PEVs, but
no state-level policies and/or incentives, have lower PEV
adoption rates than regions with support from both utilities
and state governments. Intensely focused city- or metro-level
utility efforts with state support have also achieved some
success.
T-test based on 2014 sales
Sierzchula et al. (2014) Availability of public charging infrastructure is more strongly
correlated to PEV adoption than direct financial incentives,
though both were important. However, neither measure alone
ensures high adoption rates.
Linear regression analysis
based on 2012 sales

ANL/ESD-16/8
12
Study Selected Findings Methodology
Vergis and Chen (2014) Public charging infrastructure, gasoline prices, electricity
prices, education level, vehicle miles traveled (VMT) per
capita, HOV lane access, and the presence of purchase
incentives are significantly correlated with statewide PEV
market shares. Future studies should differentiate between
PHEVs and BEVs.
Regression analysis based
on 2012–2013 sales
Studies based on surveys
Hardman and Tal
(2016)
Financial purchase incentives are not important in a
consumer’s decision to adopt a high-end BEV. Policy makers
can shift purchase incentives away from high-end buyers
without having a substantial impact on the market.
Survey (553 respondents)
and interviews (33)
Helveston et al. (2015) Consumer preferences in the U.S. and China in 2012–2013
were compared through a survey. Results show that
American consumers preferred short-range PHEVs (as
opposed to longer-range BEVs) more than Chinese
consumers, even though greater subsidies were offered for
BEVs in the U.S. It is hypothesized that this may be because
approximately two-thirds of Chinese vehicle purchasers are
first-time buyers who do not have previous experience with
gasoline vehicles and may not have the same range
expectations.
Survey analysis
(312 U.S. and 667 China
respondents)
Krupa et al. (2014) Raising consumer awareness of up-front incentives (e.g.,
purchase rebates) could have a greater impact than raising
awareness of future fuel savings. Promoting gallons of fuel
saved has more of an effect than promoting dollars saved.
Survey analysis (1,000
respondents)
Tal and Nicholas (2014) PHEV owners were more likely than BEV owners to identify
the provision of a HOV sticker as a primary motivation in
their purchase decision. However, PHEVs also produce non-
electric miles while traveling in HOV lanes by consuming
gasoline once their batteries are depleted. Differentiating
sticker access among different PHEV models based on their
electric range will help maximize electric VMT.
Survey analysis
(3,500 respondents)
Studies based on examples and experiences
Coplon-Newfield and
Devine (2015)
An immediate rebate is more attractive to consumers than a
year-end tax credit, and nonrefundable tax credits are only
useful to those with tax liability.
Qualitative findings
Dougherty and Nigro
(2014)
Innovative financial products (such as tax credits, longer loan
terms, and securitization) can reduce the costs of capital and
help move the PEV market toward self-sufficiency, reducing
the need for publicly funded incentives in the longer term
(e.g., 15 years).
Qualitative findings
Green et al. (2013) PEV policies would be more effective in achieving potential
increased adoption and emissions reductions if they focused
on early adopters and niche markets. Past incentive programs
Qualitative findings

ANL/ESD-16/8
13
Study Selected Findings Methodology
with a mainstream bias have proven to be inefficient and
costly. Strategic Niche Management should be embraced as a
means to target early adopters, and accessible loans and
financing should be supported as potential incentive
offerings.
Lutsey (2015) Increasingly stringent fuel efficiency standards, strong PEV
research and development support, and national PEV
planning appear to be necessary but insufficient actions to
grow the PEV market. Non-monetary incentives of various
types are important for consumers. Incentives should be made
available for those who lease vehicles in addition to those
who purchase vehicles.
Qualitative findings
Vergis et al. (2014) A study of PEV incentives in seven different regions finds
that those regions with stronger PEV markets have a greater
focus on market formation activities and relatively higher
PEV cost savings. Market formation incentives, sales targets,
and lower fuel costs may be contributing to higher PEV
market shares in the U.S.
Qualitative findings
A. Best Practices
PEV adoption is greatest when multiple actions are taken in parallel.
PEV incentives can be offered through a variety of different policy measures, such as direct cost
reductions, regulations and mandates, infrastructure investments, and non-monetary benefits to
vehicle owners (e.g., HOV or parking access). Studies suggest that incentives are most
successful at increasing PEV adoption when multiple incentives are offered simultaneously,
especially when policies are combined with awareness campaigns to expand focus on both
making vehicles more affordable and attractive and informing consumers about charging-
infrastructure availability, where necessary.
Clinton (2014) and Lutsey et al. (2015) indicate that the top electric-vehicle-adoption cities
typically had a combination of electric vehicle promotions, greater charging infrastructure per
capita, greater consumer incentives, and greater model availability. Sierzchula et al. (2014) also
note that both charging infrastructure and financial incentives are important to PEV adoption, but
neither alone ensured high adoption rates.
Policies to reduce the high up-front cost of PEVs can promote early market growth.
The high up-front purchase cost has long been considered a major barrier for market adoption of
PEVs. Several studies suggest that rebates and tax credits should be encouraged to reduce the
initial purchase cost, and that it is also important to ensure that similar incentives are available
for those who lease PEVs (Lutsey 2015; Krupa et al. 2014). Furthermore, longer lease terms and

ANL/ESD-16/8
14
the establishment of a clear value proposition, which increases consumer willingness to absorb
the higher vehicle cost with multi-year financing, should be encouraged. However, one study
notes that tax credits are less effective than immediate rebates (Coplon-Newfield and Devine
2015), as they must be claimed by the purchaser at a later date and are subject to some
uncertainty since they depend on the purchasers’ tax liability.
Institutional support factors are also important for promoting market growth.
Institutional support factors, such as emission testing exemptions,3 low-carbon fuel policies, and
outreach actions to support general electric-vehicle awareness, also play an important role in
PEV market adoption, as recognized by three studies from the International Council on Clean
Transportation (Lutsey et al. 2015; Jin et al. 2014; Lutsey 2015). One additional study (Santini et
al. 2015a) found that PEV Readiness Grants have a strongly significant positive effect on PEV
adoption rates, especially in states without incentives.
B. Challenges and Barriers
Vehicle charging infrastructure is an important prerequisite for PEV adoption.
Lutsey et al. (2015) also identified gaps in promotion actions. First, public charging
infrastructure availability has a significant impact on both PHEV and BEV purchases. Financial
incentives are observed to have limited positive effects on PEV adoption if there is not enough
charging infrastructure and electric vehicle model availability. Such a pattern is also observed in
the European Union. Denmark provides an example of a country with substantial vehicle
purchase incentives4 but limited charging infrastructure and limited PEV success. Similarly, New
York City (NYC) has adopted many vehicle purchase incentives and has high electric vehicle
model availability, but has much less charging infrastructure than the other 24 cities studied by
Lutsey et al. (2015). This factor, combined with a lack of state incentives, could contribute to the
low market adoption rate in NYC. Future analyses should isolate the impacts of these possible
contributing factors and assess additional market factors such as density, travel distances, and
parking costs. Additionally, analyses should differentiate between urban and suburban
environments. Further, the quantity of infrastructure may not be as important as ensuring that
3 A number of states require that vehicles undergo regular emissions testing to ensure compliance with regulations.
Some of these states grant testing exemptions to PEVs as an incentive to save time and reduce inconvenience for
owners. 4 Conventional vehicles in Denmark are subject to a registration tax that can reach 180% of the purchase cost of the
vehicle; electric vehicles have traditionally been exempt from this tax, although this policy is currently being phased
out. Denmark also provides a basic allowance of up to 10,000 DKK ($1,470) for electric vehicle registration, gives
preferential treatment for BEV parking (worth about $735/year), and provides tax rebates of up to 12,000 DKK
($1,764) for the installation of BEV home chargers.

ANL/ESD-16/8
15
consumers are aware of and have access to real-time infrastructure location and availability data
(Lutsey et al. 2015).
The availability of multiple PEV models may also be important.
The breadth of PEV model availability in a given region may also have a significant impact on
market adoption (Lutsey et al. 2015). This study describes Denver, Colorado, as one such
example, where a relatively limited number of different PEV models were available at the time
that research was conducted. Denver also has fewer charging stations per capita than the average
across all 25 cities included in this analysis. Additionally, although state financial incentives for
PEVs are generous in Colorado, PEV market share is well below the national average. It is
difficult to discern which of these factors has a greater impact. Future analysis should examine
the impact of incentive activity independently compared to promotion by all stakeholders either
in Denver or in other cities and regions.
C. Additional Findings
Several studies have reached contradictory conclusions.
Contradictory conclusions were reached by some studies, even when their analyses were based
on same-year registration data. For example, HOV access was shown to not have a statistically
significant effect on BEV purchases in one national study that utilized a logit model to analyze
the effectiveness of state-level policies (Clinton 2014). Another national study utilized stepwise
regression models to show that HOV lane access is one of the most effective state-level
promotion actions for BEVs (Jin et al. 2014). Two more studies, one based on regression
analysis at the national level (Narassimhan and Johnson 2014) and one drawing upon surveys
conducted in California (Tal and Nicholas 2014), concluded that HOV lane access also
encourages PHEV purchase. The contradictory conclusions may be associated with the different
variables used in each model, in addition to the differences in methodologies and assumptions
that were utilized.
Contradictory conclusions were also found regarding whether purchase rebates or tax credits are
a more effective tool for promoting PEV adoption. Coplon-Newfield and Devine (2015) found
that an immediate rebate is more attractive to consumers than a year-end tax credit, on the basis
of experiences in the Northeastern and Mid-Atlantic states. However, Clinton (2014) concluded
that tax credits are significantly positively correlated with BEV registrations, while BEV rebates
have a positive but not statistically significant impact. Jin et al. (2014) concluded that subsidies
(for both vehicles and infrastructure) are one of the most effective incentives, on the basis of
stepwise regression analysis. However, this study refers jointly to both tax credits and rebates as
subsidies.

ANL/ESD-16/8
16
D. Research Gaps
Few studies differentiate between BEVs and PHEVs.
Many consumers view BEVs and PHEVs very differently, and therefore certain incentives may
have differing levels of effectiveness at promoting increased market adoption of these two types
of vehicles. To date, most studies analyze PEVs collectively, and relatively few have carefully
distinguished between BEVs and PHEVs. This shortcoming is highlighted by Vergis and Chen
(2014). Several states offer different rebates or tax credits for PHEVs and/or BEVs. For example,
until July 2015, Georgia offered a $5,000 credit for BEVs but not for PHEVs (this credit expired
on July 1, 2015). Similarly, New Jersey offers a full sales tax exemption (7%) for BEVs, but no
incentives for PHEVs. Effective evaluation requires analyzing PHEVs and BEVs separately,
rather than treating them as a single vehicle type (PEVs). Studies might also consider further
segmenting BEVs and PHEVs by their range, as consumers may view, for example, the LEAF
(BEV, 75-mile electric range) and the Tesla Model S (BEV, 208- to 265-mile electric range) or
the Prius (PHEV, 11-mile electric range) and the Volt (PHEV, 38-mile electric range) very
differently.
Few studies consider socio-economic factors in their analysis.
Many studies do not consider socio-economic factors such as gasoline and electricity prices,
income, education, and dwelling types of vehicle purchasers in their statistical analyses. As one
exception to this, Narassimhan and Johnson (2014) found that a 1% increase in gasoline price led
to a 1.37% and 2.8% increase in PHEV and BEV purchases, respectively. Thus, most studies
may only partially capture the impacts of financial incentives on consumers. Sales indicate that
higher-income Americans tend to purchase PEVs (Borenstein and Davis 2015). The Electric
Vehicle Consumer Survey, which gathers data from recipients of California’s Clean Vehicle
Rebate Project, indicates that about 30% of survey respondents have a household income higher
than $200,000/year. Future analysis could evaluate how PEV buyers’ income levels mirror those
of new-car buyers in general, and how average-income buyers could benefit from lower up-front
costs. PEVs could also become more accessible to average-income buyers as more PEVs enter
the used-vehicle market.
One study (Clinton 2014) found that incentives had a smaller impact on Tesla buyers. Hardman
and Tal (2016) also found in their survey analysis that financial purchase incentives are not
important in consumers’ decision to adopt a Tesla Model S or Model X BEV. Future analyses
would benefit from separating luxury models from non-luxury models, especially once additional
luxury or performance models such as the BMW i8, Cadillac ELR, Mercedes S550 Plug, Volvo
XC-90 Plug, BMW X5e, and Audi A3e are introduced into the market. Future analysis could
evaluate why consumers at all income levels are willing to purchase high-cost internal
combustion engine (ICE) models, such as luxury sedans, without incentives, so that the PEV

ANL/ESD-16/8
17
market can learn from best practices and potentially achieve the same status, which could
eliminate the need for future incentives.
Many studies are based on data that are no longer current in a rapidly changing
marketplace.
Only five of the reviewed studies draw upon PEV sales and registration data from 2014. This is
not a criticism of existing studies that analyzed the data available at the time they were
conducted. However, given the rapidly evolving PEV marketplace (price reductions for both
vehicles and charging systems, increased consumer choice, increasing vehicle range, cheaper
gasoline prices, etc.), it would be valuable to update some of these evaluations with more recent
data. It would also be useful to analyze why PEV sales were lower in 2015 than they were in
2014.
Few studies analyze utility PEV incentives.
Lutsey et al. (2015) combined utility outreach with other non-monetized actions in a statistical
analysis of market impacts but overall found no significant correlation with PHEV or BEV sales
share in the analyzed cities. Santini et al. (2015b) found that cities with only utility incentives,
but no state or city incentives, have very low PEV adoption rates compared to cities that have
both. Increasing adoption of PEVs would reduce emissions in the transportation sector but would
increase electricity consumption, thereby increasing emissions in the power sector. The net result
of this trade-off will depend on the generation mix. Electric utilities may want to pay for vehicle
sales rebates or other incentives for PEVs if they can receive credit for net emissions reductions.
If the electric loads of charging vehicles are managed appropriately, they can also offer
additional benefits to the power system (peak shaving, storage, ancillary service provision, etc.).
To fully realize these additional benefits, increased consumer education; implementation of time-
of-use electricity rates; investments in smart vehicles, EVSE, and grid infrastructure; and policy
reforms will be required. Additional analysis of PEV joint rebate and incentive programs would
also be valuable.
Relatively few studies analyze the impacts of ZEV mandates.
ZEV mandates are often discussed as a vital tool to support PEV growth in the future, and there
is evidence to suggest that such mandates are driving accelerated electric vehicle deployment in
several regions. According to Lutsey et al. (2015), among the seven leading electric-vehicle-
adoption cities, five are in states that have adopted California’s Zero Emission Vehicle program.
However, the ten states that have voluntarily adopted ZEV mandates5 are already generally more
supportive of PEVs than the rest of the country and may also have populations that are relatively
5 California, Connecticut, Maine, Maryland, Massachusetts, New Jersey, New York, Oregon, Rhode Island, and
Vermont.

ANL/ESD-16/8
18
fast adopters of these technologies. Therefore, there is a need for rigorous analyses that attempt
to isolate and quantify the additional impacts of the ZEV mandates specifically.
Furthermore, certain PEV models were built specifically to comply with ZEV mandates. These
so-called “compliance cars” are typically conversions of existing ICE vehicle models,
manufactured in small numbers, and sold only in California or states with similar mandates in
place. While compliance cars do increase the number of PEVs in circulation, they may be
sidestepping the original intentions of ZEV mandates, which broadly speaking are to increase
electric miles traveled, reduce emissions, promote technology learning, and encourage
manufacturers to develop affordable, mainstream, mass-market PEVs. Studies are therefore
needed to analyze the effectiveness of ZEV mandates in promoting these, and other, specific
policy objectives, in addition to simply measuring changes in PEV adoption rates. Finally,
studies of PEV policies and adoption rates should be sure to consider ZEV states separately from
the rest of the country in their analyses.
Additional analysis of the DOE PEV Readiness Grant Program is needed.
Only one study (Santini et al. 2015a) evaluated the DOE PEV Readiness Grant Program as a
whole, finding that DOE PEV Readiness Grants have had a strongly significant positive effect on
PEV adoption rates in states without other incentives. PEV Readiness Grants totaling $8.5
million were first awarded to 16 communities in 2011 through the DOE Clean Cities program to
support community-wide efforts to support the adoption of PEVs and the corresponding charging
infrastructure. Further analysis is needed to isolate the impacts of the various individual actions,
incentives, and investments that are funded by these grants in each recipient community.
Studies are needed to analyze the impact of reducing or eliminating existing incentives.
PEV incentives have been offered for as many as five years in some parts of the country, and
some of these original incentives have since been reduced or eliminated. Research is needed to
fully understand the extent to which the reduction or elimination of these incentives impacts
future market adoption of PEVs. Similarly, research could seek to better understand how PEVs
can emulate other high-cost vehicles that dominate the current light-duty market without
incentives. Georgia provides an interesting potential case study for such an analysis. Prior to July
1, 2015, Georgia offered a $5,000 tax credit to purchasers of PEVs, one of the highest in the
country, which could be combined with the similar $7,500 federal tax credit. On July 1, 2015,
this state tax credit was eliminated, and an additional $200 annual registration fee was
implemented for PEV owners. Preliminary data indicate that PEV sales spiked in June 2015 as
purchasers rushed to take advantage of the expiring incentive, before dropping dramatically in
the following months (Sheinin 2015). Additional rigorous data analysis could help to isolate and
quantify the long-term impact of eliminating this incentive on PEV sales in Georgia.

ANL/ESD-16/8
19
III. REVIEW OF STUDIES
A. Studies Based on Statistical Analysis
The following studies are quantitative in nature. The researchers generally conduct statistical
and/or regression analyses based on historical data to determine the relative effectiveness of
various policies in promoting the market adoption of PEVs.
1. Clinton (2014)
This study entailed an econometric analysis at the state level to assess how incentives
have changed BEV purchasing patterns. No analysis was provided for PHEVs. The
incentives studied include rebates, tax credits, tax exemptions and HOV lane access.
Conclusions: (1) Incentive offerings and charging infrastructure are positively correlated
with BEV registrations. A $1,000 increase in incentives is associated with a 3% increase
in per capita BEV registrations. (2) Tax credits have a significant, positive effect on BEV
registrations. (3) Rebates and HOV access each have a positive but not statistically
significant effect on BEV registration. This study also found that Tesla buyers and buyers
of non-Tesla BEVs respond differently to tax credits and rebates.
2. Greene et al. (2014a)
This study evaluated costs and benefits of California-focused policy under different
scenarios using previously calibrated vehicle choice models based on actual PHEV and
BEV sales patterns and preferences. The types, timing and intensity of public policy
interventions that are necessary to accomplish a transition to electric drive vehicles in the
U.S. were also investigated, with a focus on the role of California’s ZEV mandates. In
this future projection, the rest of the U.S. is assumed to follow California’s lead by
adopting similar policies and deploying refueling infrastructure five years later.
Conclusions: It was estimated that the benefits of a transition to an electric vehicle fleet
may be up to an order of magnitude greater than the associated costs; however, this trade-
off depends on the timing and intensity of policy interventions. ZEV mandates appear to
be a cost-effective means of supporting this transition. This work is related to work
presented in two previously published reports by the same authors (Greene et al. 2013;
Greene et al. 2014b).
3. Jin et al. (2014)
This study monetized all major direct and indirect incentives offered by different states
and estimated whether such incentives influenced PEV adoption rates using 2013
registration data. Separate statistical analyses were conducted for PHEVs and BEVs.

ANL/ESD-16/8
20
Direct incentives include purchase subsidies, license tax and fee reduction, EVSE
financing, free electricity, free parking, and emissions testing exemptions. Indirect
incentives include HOV lane access, time saved from waived emissions testing, and
public charger availability (only for BEVs). Annual fees for BEV registration were also
included as a potential disincentive in this analysis. This study also provided a basic,
first-order benefit-cost analysis of PEV incentives to provide a measure of the relative
cost-effectiveness of the various policies.
Conclusions: The states with the largest PEV incentives had PEV sales shares
approximately 2 to 4 times greater than the national average of about 0.3% of new LDV
sales in 2013. State PEV incentives are playing a significant early role in reducing the
cost of ownership and in driving PEV sales, particularly for BEVs. The results of the
stepwise regression analyses indicate that the total monetary benefit available to BEV
owners is significantly positively correlated with BEV sales, but that the similar
monetary benefit for PHEVs is not correlated with PHEV sales. This study does not
attempt to explain this trend. Future state-level efforts to increase BEV sales by reducing
the total cost of owning and operating BEVs are likely to be effective. Furthermore,
stepwise regression analysis shows that the most effective incentives for vehicle adoption
are subsidies, HOV lane access, and emissions testing exemption initiatives.
4. Lutsey et al. (2015)
This study comprehensively catalogued the state, local, infrastructure, and utility actions
that are spurring PEV deployment and also included a city-specific analysis of policy
benefits to prospective PEV consumers across 25 urban areas. The seven cities with the
highest PEV share in 2014—San Francisco, Atlanta, Los Angeles, San Diego, Seattle,
Portland, and Riverside—had two to seven times the average U.S. PEV share. The top
electric-vehicle-adoption cities tend to have some combination of more actions to
promote PEVs, greater charging infrastructure availability per capita, greater consumer
incentives, and availability of more PEV models. These authors also conducted stepwise
linear regressions to test the relationship between several metrics of PEV market share
and the various PEV promotion actions within a city. Thirty actions that may be taken to
promote increased PEV adoption were grouped into broad categories, and a regression
analysis was performed to determine the impact of incentives in each of these categories
on PEV market share. This study does distinguish between BEVs and PHEVs.
Conclusions: Policy is driving accelerated PEV deployment in several cities. The number
of charging points (both level 2 and DC) per capita, city monetized benefits, and city
non-monetized benefits are all positively correlated with higher PEV deployment.
Examples of city monetized benefits include vehicle purchasing incentives, parking
benefits, EVSE financing, utility home charger incentives, and utility preferential

ANL/ESD-16/8
21
charging rates. This analysis also found that with limited charging infrastructure and
PEV model availability, even large incentives have limited positive effect on PEV
adoption. A best-fit statistical regression model finds chargers per capita and monetized
BEV benefits to be statistically significant predictors of BEV share. City non-monetized
actions improved the BEV best-fit model, although they were not a statistically
significant factor. City non-monetized actions include city fleet purchasing, providing
BEV or PEV information on a city or utility website, conducting outreach and
educational activities, providing city-owned electric chargers and establishing workplace
charging partners, allowing for a streamlined EVSE permitting process, providing utility
rate comparisons, and conducting utility outreach. A best-fit statistical regression model
found (1) the total number of actions taken by the city and local utility provider that have
a monetary value and (2) the number of chargers per capita to be significant predictors of
PHEV share.
5. Narassimhan and Johnson (2014)
This study presented a regression analysis using registration data through the first quarter
of 2014 to assess the effectiveness of various state policy incentives (tax credits, purchase
rebates, sales tax waivers, HOV exemptions, and free parking) in encouraging PEV
purchases. Besides direct incentives, factors such as public charging stations per capita
and adjusted gasoline prices were also considered. Separate regression analyses were
conducted for PHEVs and BEVs.
Conclusions: State monetary incentives do not increase PHEV purchases, regardless of
whether the state monetary incentives are offered as a tax credit, purchase rebate, or sales
tax waiver. Non-monetary incentives, like HOV exemptions, seem to encourage people to
purchase PHEVs.
State or federal monetary incentives appear to significantly increase BEV purchases. A
$1,000 increase in tax credits leads to a 4.1 % increase in BEV purchases, while a $1,000
increase in rebates leads to a 9.4% increase.
Regression results also show that public charging infrastructure availability has a
significant impact on both PHEV and BEV purchases. The results indicate that adding
more EV charging stations would reduce range anxiety and thus increase PHEV/BEV
purchases. The study does not distinguish between levels of charging stations.
6. Santini et al. (2015a)
This paper included a summary of federal support (e.g., incentives and mandates) for
PEVs. It also reviewed existing DOE Clean Cities initiative activities and strategies to
expedite the planning for and development of infrastructure and the targeted growth of
the marketplace. Uniquely among the papers reviewed, this paper controlled for the effect

ANL/ESD-16/8
22
of regional climate in three different categories—moderate, hot and cold. These factors
are important because external temperatures can impact on-road EV ranges by up to 50%,
according to test results conducted at Argonne National Laboratory (Lohse-Busch et al.
2013). Other studies conducted by these authors found a statistically significant
difference in the shares of PHEVs (as a percentage of all PEVs) between cold and warm
states.
Conclusions: A statistical analysis based on vehicle registrations from 2013 to March
2014 showed that the PEV Readiness Grants had no significant effect on PEV adoption in
states where other financial incentives were available. However, in states where other
financial incentives were not available, the PEV Readiness Grants had a strongly
significant positive effect on PEV adoption. The PEV Readiness Grant is an award that
DOE provides to support community-wide efforts to improve PEV readiness through
charging-infrastructure development, comprehensive planning, regulatory reforms, and
the provision of additional support services at the city or regional level. The study also
found that after accounting for differences in regional climate, the PEV Readiness Grants
alone were effective in the majority of states where they were used. The success of the
PEV Readiness Grants suggests that the organizational efforts promoted by the Clean
Cities initiative, making use of the lessons learned from the Grant Reports, should have a
positive effect in other states if and when Clean Cities Coordinators and affiliated
stakeholders choose to take advantage of them. This success shows that organization,
planning, stakeholder coordination, legislation and regulation revisions can all
successfully make customers comfortable with purchasing plug-in technology.
7. Santini et al. (2015b)
Private (Duke, DTE) and public (SMUD, Austin Energy) utilities are known to have
engaged in PEV outreach campaigns in recent years. This study statistically analyzed the
effectiveness of these campaigns when controlling for other factors such as travel
distance, charging station density, and state incentives.
Conclusions: The most successful of the 14 metro areas investigated in preliminary
investigations each had significant levels of state and utility support. However,
preliminary results also indicate that PEV growth was limited when a utility program was
not also supported by state- and/or city-level policies and/or incentives (e.g., Duke Power
in South Carolina, North Carolina and Indiana). A Detroit-area utility, DTE, was able to
promote limited growth in PEV adoption through its own incentives programs despite the
fact that there were no other PEV incentives offered at the state or city level. Austin
Energy was able to generate similar modest growth in PEV adoption by offering PEV
incentives even though the only additional incentive available to PEV purchasers in its

ANL/ESD-16/8
23
service territory was a $2,500 purchase rebate from the state of Texas. This state
incentive was first offered in May 2014 and was discontinued in 2015.
Strong, temporary policies addressing the coevolution of the vehicle and fuels markets
appear necessary. Because uncertainty about the transition is profound, policies must
adapt as learning reduces uncertainty. One conclusion is that long-term policies (e.g.,
ZEV programs and direct incentives) are essential in the transition to an electric-drive
fleet. However, as only limited PHEV and BEV sales data were used, it may be difficult
to draw broadly applicable conclusions from this study.
8. Sierzchula et al. (2014)
Using multiple linear regression analysis, this study examined the relationship between
several socio-economic factors and the PEV market shares6 in 30 countries in 2012.
Analyzed factors included federal financial incentives, charging stations per capita, fuel
price, electricity price, vehicles per capita, education, income, urban density and
environmental index (EI). EI is an index that ranks environmental regulation and
performance by country and is intended to capture national differences in
environmentalism.
Conclusions: The regression model found financial incentives, charging infrastructure,
and local presence of production facilities to be significantly positively correlated with
the PEV market share in a country. Results also suggest that charging infrastructure
availability had the greatest impact on PEV adoption. However, this study didn’t
differentiate between BEVs and PHEVs.
9. Vergis and Chen (2014)
This study developed a regression model of the full range of social, economic, and/or
policy factors that are influencing statewide PEV sales rates to help decision-makers
create more informed policy. The analysis did not distinguish between PHEVs and BEVs,
and the authors acknowledged this limitation.
Conclusions: Publicly available charging infrastructure, state environmentalism, gasoline
prices, electricity prices, education level, VMT per capita, HOV lane access, and the
presence of purchase incentives are significantly correlated with statewide PEV market
shares. State environmentalism was measured using scores developed by Wingfield and
Marcus (2007). States received scores based on several factors, including carbon dioxide
emissions per capita and the presence of policies related to energy efficiency, water
quality, hazardous waste management and air quality. Results suggest that any single
6 The PEV market share in a country is the fraction of all new passenger vehicle sales that are PEVs.

ANL/ESD-16/8
24
variable is not enough to drive statewide PEV markets; rather, a combination of social,
economic, and policy factors are needed. However, several study limitations should be
considered. It is important to note that some variables in this analysis (e.g., gasoline
prices) may fluctuate from year to year. Further, it may also be the case that differences
between PHEVs and BEVs, such as the varying need for new charging infrastructure
facilities, may be confounding these results. Future studies may find it beneficial to
differentiate between the two vehicle types.
B. Studies Based on Surveys
The following studies collected data from consumer surveys and drew conclusions on policy
effectiveness from their original analysis of the results.
10. Hardman and Tal (2016)
This study aimed to understand which consumers are adopting high-end BEVs, why they
are purchasing these vehicles, and how important financial incentives may be for this
group of high-end adopters. Data on high-end adopters were gathered via a questionnaire
survey and follow-up interviews in California in 2015, which yielded 540 responses and
in-depth interviews with 33 Tesla Model S customers.
Conclusions: This report determined that environmental, performance and technological
motivations are reasons for adoption of high-end vehicles, and that these technologies
bring a new segment of buyers into the market. Additionally, it was found that financial
purchase incentives are not important in consumer decisions to adopt a high-end BEV. In
other words, this study suggested that policy makers can shift purchase incentives away
from high-end buyers without having a substantial impact on the market. The maximum
income limit imposed by California on the $2,500 state rebate is unlikely to have a
detrimental effect on the adoption of high-end BEVs, according to this sample.
11. Helveston et al. (2015)
This study modeled consumer preferences for conventional, hybrid electric, PHEV, and
BEV vehicle technologies in China and the U.S., using data from choice-based conjoint
surveys fielded in 2012–2013 in both countries.
Conclusions: U.S. and Chinese subsidies are similar and both favor vehicles with larger
battery packs. However, in 2012–2013, U.S. consumers preferred low-range PHEVs
relative to Chinese consumers despite these subsidies. This study also found that
American consumers have significantly lower relative willingness to pay for BEV
technology than Chinese consumers. The authors hypothesize that this is because two-

ANL/ESD-16/8
25
thirds of vehicle purchasers in China are first-time buyers who have little to no
experience with gasoline vehicles and therefore do not have the same ingrained
performance and range expectations as many U.S. purchasers. Therefore, the decision to
purchase a BEV does not represent a paradigm shift for Chinese consumers as it might
for U.S. consumers. China also has a more widely utilized intercity train system, which
provides a viable substitute for longer travel distances. The sales share of BEVs did
increase in the U.S. in 2014.
12. Krupa et al. (2014)
This study administered a stated-preference survey to 1,000 U.S. residents in late 2011 to
2012 to better understand factors influencing the potential for PHEV market penetration.
Conclusions: The survey results underscore the importance of tax incentives and
manufacturer rebates for promoting early PHEV adoption, and suggest that raising
consumer awareness of these up-front incentives (e.g., through advertising or public
service announcements) could have a greater impact than raising awareness of future fuel
savings. This is because ICE and PEV consumers dramatically discount the potential
future fuel savings relative to sticker-price savings when making purchase decisions. The
reported high level of discounting was most pronounced when savings were framed in
dollars rather than gallons. Therefore, this study also suggested that advertising may be
more persuasive if savings are framed in gallons.
13. Tal and Nicholas (2014)
This paper discussed the use of two logit models to analyze the impact of HOV lane
stickers on vehicle purchase decisions and the resulting electric miles traveled in
California. Surveys were administered to 3,500 PEV owners who purchased their cars in
2012. The survey only focused on the three most common PEV models, Nissan LEAF,
Chevy Volt and Toyota Prius PHEV. This study also offers an analysis of the potential
cost of HOV lanes on a per-mile-driven basis. The aim is to help policy makers optimize
the benefit for each additional permit while understanding the impact of different vehicle
types.
Conclusions: PHEVs with smaller batteries are more likely to be purchased because of
the HOV sticker incentive but produce fewer electric miles as a fraction of total miles in
HOV lanes. Prius owners were more likely to agree with the characterization of “HOV as
the most important motivation” for their purchase, while LEAF owners were less likely to
agree. Survey results also showed that people who consider the HOV sticker to be the
most important incentive for the PEV purchase drive more than their counterparts who
pick other main motivations. HOV importance is highly correlated with HOV usage for
all three models. Differentiating sticker access between the PHEVs based on their electric
ANL/ESD-16/8
26
range will help maximize electric VMT. This can be done by raising the minimum
battery size requirement, creating a separate quota for each PHEV type, or creating
different incentive expiration dates for each vehicle type.
C. Studies Based on Examples and Experiences
The following studies are primarily qualitative in nature. They provide high-level reviews of
various programs, and summarize policy actions and barriers to increased market adoption. They
do not generally provide independent quantitative analyses of policy effectiveness.
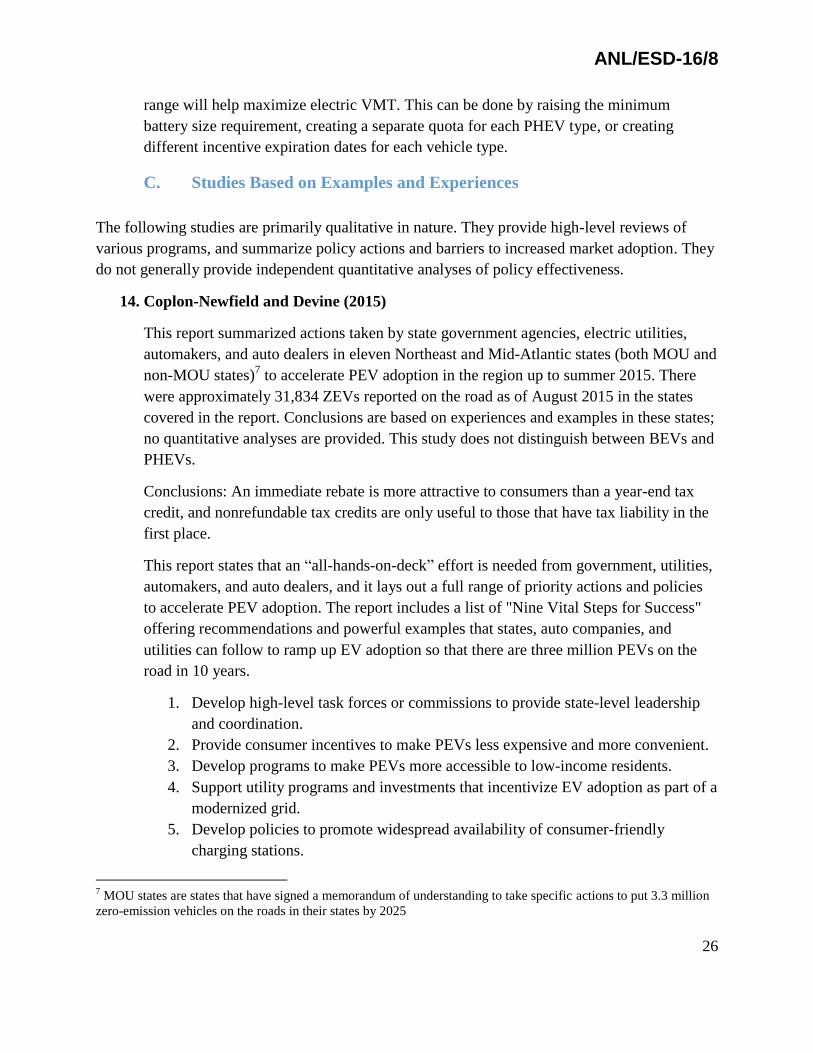
14. Coplon-Newfield and Devine (2015)
This report summarized actions taken by state government agencies, electric utilities,
automakers, and auto dealers in eleven Northeast and Mid-Atlantic states (both MOU and
non-MOU states)7 to accelerate PEV adoption in the region up to summer 2015. There
were approximately 31,834 ZEVs reported on the road as of August 2015 in the states
covered in the report. Conclusions are based on experiences and examples in these states;
no quantitative analyses are provided. This study does not distinguish between BEVs and
PHEVs.
Conclusions: An immediate rebate is more attractive to consumers than a year-end tax
credit, and nonrefundable tax credits are only useful to those that have tax liability in the
first place.
This report states that an “all-hands-on-deck” effort is needed from government, utilities,
automakers, and auto dealers, and it lays out a full range of priority actions and policies
to accelerate PEV adoption. The report includes a list of "Nine Vital Steps for Success"
offering recommendations and powerful examples that states, auto companies, and
utilities can follow to ramp up EV adoption so that there are three million PEVs on the
road in 10 years.
1. Develop high-level task forces or commissions to provide state-level leadership
and coordination.
2. Provide consumer incentives to make PEVs less expensive and more convenient.
3. Develop programs to make PEVs more accessible to low-income residents.
4. Support utility programs and investments that incentivize EV adoption as part of a
modernized grid.
5. Develop policies to promote widespread availability of consumer-friendly
charging stations.
7 MOU states are states that have signed a memorandum of understanding to take specific actions to put 3.3 million
zero-emission vehicles on the roads in their states by 2025

ANL/ESD-16/8
27
6. State and local governments must lead by example by integrating PEVs into their
fleets and other programs.
7. Automakers must increase efforts to manufacture PEVs that appeal to a broad
range of consumers, and to market and sell them aggressively in and beyond
California.
8. Develop auto dealership programs that promote EVs.
9. Improve public education and outreach to ensure that the vast majority of
consumers view PEVs as a viable and desirable option.
15. Dougherty and Nigro (2014)
This paper first summarized the most significant barriers to market demand and barriers
to private investment in Alternative Fuel Vehicles (AFVs)—including PEVs—and
fueling infrastructure. It then concluded with a review of innovative finance options used
in other sectors that could be applied to the PEV market. This report defines specific
barriers facing each key stakeholder and AFV participant category, including vehicle
buyers, vehicle manufacturers, fuel and infrastructure providers, and investors. Key
barriers listed in the study are (1) the high up-front cost of AFVs, (2) a low initial demand
for charging services that is insufficient to support the widespread deployment of
charging infrastructure, and (3) uncertainty about the benefits and costs of AFVs and
related infrastructure. No quantitative analysis is included. This study does not
distinguish between BEVs and PHEVs.
Conclusions: A range of innovative financial products can be implemented to bring
down the up-front cost for vehicle buyers and infrastructure providers and decrease
consumer risk associated with information uncertainty. Additionally, providing longer
loan terms (e.g., 15 years) and securitizing asset loans (for both vehicles and
infrastructure) into standardized financial instruments can increase market liquidity,
reduce the costs of capital, and help move the market toward self-sufficiency. These
results reduce the need for public subsidies in the longer term. Moreover, reducing
barriers to private finance is an essential part of increasing the frequency and scope of
AFV adoption.
16. Green et al. (2013)
This article argued that policies intending to give PEVs a foothold in the market should
not focus on mainstream consumers and should instead focus on niche markets,
specifically car sharing and postal fleets as well as early adopters (including green
consumers). No quantitative analysis is included.
Conclusions: Two arguments can be made in support of eliminating the mainstream
market bias of current policies in favor of policies that cultivate niche markets. The first

ANL/ESD-16/8
28
is efficiency. Thus far, PEV policies featuring a mainstream market bias have proven to
be inefficient and costly. The second is effectiveness: PEV policies would be more
effective in achieving potential societal benefits if they focused on early adopters and
niche markets, using approaches such as strategic niche management, accessible loans
and financing, and appropriately targeted incentives. Strategic niche management is a
means to introduce innovative technologies into the marketplace by simultaneously
addressing technical, policy, social, demand, production, and infrastructure barriers. PEV
policies focusing on early adopters and niche markets would lead to increased PEV
market penetration and realization of intended societal benefits. However, no quantitative
analyses were provided to support such arguments.
17. Lutsey (2015)
This report summarized global adoption trends and national targets, as well as the major
findings from 23 studies related to PEV policy effectiveness throughout the world, to
investigate emerging best practices. This study did not distinguish between BEVs and
PHEVs.
Conclusions: Increasing the stringency of efficiency standards, providing additional
support for PEV research and development, and carrying out coordinated national PEV
planning appear to be necessary but insufficient actions to grow the PEV market. Non-
fiscal incentives of various types are important for consumers. Fully engaging electric
power utilities with policies that encourage their active participation in promoting
electrified transportation has only been partially explored.
Consumer incentives that reduce the cost of ownership are important to improve the
consumer value-proposition (e.g., financial incentives should be about or above 15% of
the PEV purchase price available at the initial point of vehicle sale). However, whether
such percentage is insensitive to the actual price of the PEV is not discussed in the paper.
Incentives should also be made available for vehicle leasing.
Policymakers should commit to longer-term consumer purchase incentives to send a clear
signal to automakers to invest in and deploy PEV technologies.
18. Vergis et al. (2014)
This paper provided a summary of PEV incentives and sales data in seven different
regions. These included six countries: France, Germany, Japan, Norway, The Netherlands,
and the U.S. California was additionally treated as its own separate region in this work.
Conclusions: This study mentions that market formation incentives, sales targets, and
lower relative per-mile fuel costs may be contributing to higher PEV market shares in the
U.S. The comparison between markets shows that in all studied regions, sales of PEVs

ANL/ESD-16/8
29
are supported through various types of government incentives, government resources, and
other legitimation activities. However, regions with relatively strong PEV markets have a
greater focus on market formation activities and relatively higher costs savings associated
with operating an electric vehicle as compared to a conventional vehicle.
IV. CONCLUSIONS This literature review provides some tentative conclusions about the relative effectiveness of
various policies, regulations, and incentives in promoting increased adoption of PEVs. These
insights can inform future policy actions that seek to stimulate the development of a robust PEV
market. However, this review also demonstrates the limitations of the data and analyses that are
currently available. It is clear that policies that strongly address the value proposition of PEVs in
terms of initial cost, availability of public charging infrastructure (especially for BEVs), and
other non-monetary incentives (e.g., HOV access) will be necessary to build a strong PEV
market. Several studies discussed ZEV mandates and generally found that they will be an
important component of the transition to an electric-drive fleet. However, further research efforts
are needed to keep track of the sales in ZEV states and analyze the impact of ZEV mandates on
sales. Many studies show that successful policies must simultaneously address both vehicle cost
and charging infrastructure availability. Other important factors are the availability of a variety
of PEV models, good public knowledge about charger availability and location, and vehicle
dealers’ willingness to prioritize PEV sales.
While lessons learned from these studies can be taken and applied generally, it is difficult to
draw robust conclusions about specific policies for several reasons: (1) as the market for PEVs is
still young, sales data are available for only a relatively short period of time, (2) the market share
of PEV sales is relatively small, (3) many studies fail to separately analyze PHEVs and BEVs as
independent vehicle classes, and (4) many studies fail to consider socio-economic factors that
may affect PEV sales.
The fact that the market share of modern PEVs8 has not surpassed 1% of total light-duty vehicle
sales may imply that many or most purchasers are not mainstream consumers. Therefore, it is
possible that the purchasing behavior of such early adopters is not representative of the
population at large, and as such, these early lessons learned may not be perfectly transferrable as
the PEV market continues to grow and mature. Given crucial differences between PHEVs and
BEVs, especially the likelihood that PHEV purchasers (who will not experience range anxiety)
will be less sensitive to public charging availability than will BEV purchasers, it is unfortunate
that most of the studies do not distinguish between the two. Finally, because socio-economic
indicators, such as family income and gasoline and electricity prices, will affect the value
8 Electric vehicles were popular in the early 20
th century before being overwhelmingly replaced by gasoline-powered
vehicles

ANL/ESD-16/8
30
proposition perceived by vehicle purchasers, the lack of consideration of such variables may
limit the robustness of some of the studies. As noted in the Research Gaps section, many
opportunities for further analysis exist, and additional research is needed.
V. REFERENCES Borenstein, S., and Davis, L. (2015). The Distributional Effects of U.S. Clean Energy Tax
Credits. Energy Institute at Haas Working Paper, University of California-Berkeley.
<http://ei.haas.berkeley.edu/research/papers/WP262.pdf?>
Clinton, B. (2014). Impact of direct financial incentives on battery PEV adoption. National
Renewable Energy Laboratory. Presentation to DOE.
<http://www.nrel.gov/docs/fy15osti/63263.pdf>
Coplon-Newfield, G. and Devine, S. (2015). How northeast and mid-Atlantic states stack up in
getting PEVs on the road. Sierra Club. <http://www.sierraclub.org/compass/2015/10/new-report-
how-northeast-mid-atlantic-states-stack-getting-electric-vehicles-road>
Dougherty, S., and Nigro, N. (2014). Alternative Fuel Vehicle and Fueling Infrastructure
Deployment Barriers and the Potential Role of Private Sector Financial Solutions. Center for
Climate and Energy Solutions. <http://www.afdc.energy.gov/uploads/publication/afv_fueling_
infrastructure_deployment_barriers.pdf>
Green, E., Skerlos, S., and James, W. (2013). Increasing PEV policy efficiency and effectiveness
by reducing mainstream market bias. Energy Policy, Volume 65, pp. 562–566.
<http://www.sciencedirect.com/science/article/pii/S030142151301046X>
Greene, D., Park, S., and Liu, C. (2013). Analyzing the Transition to Electric Drive in California.
< http://www.theicct.org/sites/default/files/publications/Transition-to-Electric-Drive-2013-
report.FINAL.pdf>
Greene, D., Park, S., and Liu, C. (2014a). Public policy and transition to E-drive vehicles in the
U.S.: The role of ZEV mandates. Energy Strategy Review, Volume 5, pp. 66–77.
<http://www.sciencedirect.com/science/article/pii/S2211467X14000455>
Greene, D., Park, S., and Liu, C. (2014b). Transitioning to Electric Drive Vehicles: Public Policy
Implications of Uncertainty, Network Externalities, Tipping Points and Imperfect Markets.
<http://www.theicct.org/sites/default/files/publications/Greene_Transition-to-
Edrive_jan2014.pdf>
Hardman, S., and Tal, G. (2016). Exploring the decision to adopt a high-end battery electric
vehicle: The role of financial and non-financial motivations. Proceedings of 95th Transportation
Research Board Annual Meeting, Washington D.C. <http://amonline.trb.org/trb60693-2016-
1.2807374/t025-1.2816189/529-1.2816401/16-1783-1.2813159/16-1783-1.2816405?qr=1>

ANL/ESD-16/8
31
Helveston, J.P., Liu, Y., Feit, E., Klampfl, E., and Michalek, J.J. (2015). Will subsidies drive
PEV adoption? Measuring consumer preferences in the U.S. and China. Transportation Research
Part A: Policy and Practice, Volume 73, pp. 96–112.
<http://www.sciencedirect.com/science/article/pii/S0965856415000038>
Jin, L., Searle, S., and Lutsey, N. (2014). Evaluation of state-level U.S. PEV incentives.
International Council on Clean Transportation.
<http://www.theicct.org/sites/default/files/publications/ICCT_state-EV-
incentives_20141030.pdf >
Krupa, J.E., Rizzo, D.M., Eppstein, M.J., Lanute, D.B., Gaalema, D.E., Lakkaraju, K., and
Warrender, C.E. (2014). Analysis of a consumer survey on plug-in hybrid PEVs. Transportation
Research Part A: Policy and Practice. Volume 64, pp. 14–31.
<http://www.sciencedirect.com/science/article/pii/S0965856414000500>
Lohse-Busch, H., Duoba, M., Rask, E., and Stutenberg, K., Ambient Temperature (20°F, 72°F
and 95°F) Impact on Fuel and Energy Consumption for Several Conventional Vehicles, Hybrid
and Plug-In Hybrid Electric Vehicles and Battery Electric Vehicle. Journal of SAE International,
Technical Paper 2013-01-1462. <http://papers.sae.org/2013-01-1462/>
Lutsey, N. (2015). Transition to a global zero-emission vehicle fleet: a collaborative agenda for
governments. International Council on Clean Transportation.
<http://www.theicct.org/sites/default/files/publications/ICCT_GlobalZEVAlliance_201509.pdf>
Lutsey, N., Searle, S., Chambliss, S., and Bandivadekar, A. (2015). Assessment of leading PEV
promotion activities in United States cities. International Council on Clean Transportation.
http://www.theicct.org/sites/default/files/publications/ICCT_EV-promotion-US-
cities_20150729.pdf
Narassimhan, E., and Johnson, C. (2014). The effect of state incentives on plug-in PEV
purchases. National Renewable Energy Laboratory. Presentation to DOE.
<http://www.nrel.gov/docs/gen/fy15/62884.pdf>
Santini, D., Zhou, Y., and Marcy, R. (2015a). Electric drive technology market trends. Argonne
National Laboratory. White paper for DOE Clean Cities Strategic Planning. <https://cleancities.
energy.gov/files/u/news_events/document/document_url/95/2015_strategic_planning_electric_dr
ive.pdf>
Santini, D., Zhou, Y., and Marcy, R. (2015b). PEV adoption pattern and utility outreach study.
Presentation to DOE; white paper in preparation.
Sheinin, A.G. (2015). Electric vehicle sales fizzle after Georgia pulls plug on tax break. The
Atlanta Journal-Constitution, Nov. 25. <http://www.myajc.com/news/news/state-regional-govt-
politics/electric-vehicle-sales-fizzle-after-georgia-pulls-/npQcH/>

ANL/ESD-16/8
32
Sierzchula, W., Bakker, S., Maat, K., and Van Wee, B. (2014). The influence of financial
incentives and other socio-economic factors on PEV adoption. Energy Policy, Volume 68, pp
183–194. <http://www.sciencedirect.com/science/article/pii/S0301421514000822>
Tal, G., and Nicholas, M., (2014). Exploring the impact of high occupancy vehicle (HOV) lane
access on plug-in vehicle sales and usage in California. Institute of Transportation Studies,
University of California, Davis, Research Report UCD-ITS-RR-14-16.
<http://www.its.ucdavis.edu/research/publications/publication-detail/?pub_id=2355>
Vergis, S., and Chen, B. (2014). Understanding variations in US plug-in PEV markets. Institute
of Transportation Studies, University of California, Davis, Research Report UCD-ITS-RR-14-25.
<http://www.its.ucdavis.edu/research/publications/publication-detail/?pub_id=2397>
Vergis, S., Turrentine, T., Fulton, L., and Fulton, E. (2014). Plug-in PEVs: a case study of seven
markets. Institute of Transportation Studies, University of California, Davis, Research Report
UCD-ITS-RR-14-17. <http://www.its.ucdavis.edu/research/publications/publication-
detail/?pub_id=2369>
Wingfield, B., and Marcus, M. (2007). America’s Greenest States. Forbes, October 17.
<http://www.forbes.com/2007/10/16/environment-energy-vermont-biz-beltway-
cx_bw_mm_1017greenstates.html>
Zhou, Y. (2016). Light Duty Electric Drive Vehicles Monthly Sales Updates. Argonne National
Laboratory, January. http://www.anl.gov/energy-systems/project/light-duty-electric-drive-
vehicles-monthly-sales-updates

ANL/ESD-16/8
33
Argonne National Laboratory is a U.S. Department of Energy
laboratory managed by UChicago Argonne, LLC
Energy Systems Division Argonne National Laboratory
9700 South Cass Avenue, Bldg. #362
Argonne, IL 60439
www.anl.gov