Embed Size (px)
Citation preview

Understanding Yu’E Bao: the implications of
Internet Finance development in China
BY
XIAO YAYUE STUDENT NO.14252961
A PROJECT SUBMITTED IN PARTIAL FULFILLMENT OF THE
REQUIREMENT FOR THE DEGREE OF
BACHELOR OF SOCIAL SCIENCE (HONOURS) DEGREEN IN CHINA STUDIES
ECONOMICS CONCENTRATION
HONG KONG BAPTIST UNIVERSITY
APRIL 2018

2
HONG KONG BAPTIST UNIVERSITY
April 2018
We hereby recommend that the Project by Ms. Xiao Yayue entitled “Understanding
Yu’E Bao: the implications of Internet Finance development in China” be accepted in
partial fulfilment of the requirements for the Bachelor of Social Sciences (Honours)
Degree in China Studies in Economics.
_________________ _________________
Dr. Luk Sheung Kan Dr.
Project Supervisor Second Examiner

3
Acknowledgements
First and foremost, I would like to take this opportunity to express my deepest gratitude
to my supervisor Dr. Luk Sheung Kan, Paul for overseeing my progress and advising
me at every step through the entire project. It has been an honour and pleasure working
with him.
Moreover, thanks are also due to all the professors and lecturers in HKBU Department
of Economics for their constant guidance throughout the entire course of my
undergraduate study in Hong Kong. Their dedication and hard work make my college
years an unforgettable and valuable experience in my life.
Finally, I would like to thank my parents for their love and care. I am grateful for their
unconditional full support, financially and spiritually.
_______________
Student’s signature:
China Studies Degree Course
(Economics Concentration)
Hong Kong Baptist University
Date: _________________

4
Contents
Abstract ...................................................................................................................................... 5
1. Introduction and Background .................................................................................... 7
1.1. What is Internet Finance: Review on its development in China .....................10
1.2. What is Yu’E Bao: Review on money market fund ...............................................13
1.3. Historical data and policy change .............................................................................14
2. Literature Review ........................................................................................................ 20
2.1. Determinants of interest rate of Yu’E Bao ..............................................................20
2.2. Underlying risks of Yu’E Bao .......................................................................................22
2.3. Money market fund, traditional banking sector and interest rate liberalisation ...................................................................................................................................25
3. Data.................................................................................................................................. 28
4. Methodology and Empirical Results ...................................................................... 29
4.1. “Mean-Variance”, Capital Asset Pricing Model (CAPM) and Sharpe ratio ..29
4.1.1. Proxy selections and definitions of relevant terms ...............................................34
4.1.2. Empirical results and analysis ......................................................................................40
4.2. Third and fourth moment: shape of the distribution .........................................43
5. Economic Interpretations and Further Analysis ............................................... 46
6. Limitations..................................................................................................................... 54
7. Conclusions and Suggestions ................................................................................... 56
8. Appendix ......................................................................................................................... 58
9. References ...................................................................................................................... 62

5
Abstract
This paper is based on a case study of Yu’E Bao, a popular Internet Finance investment
product in China. We start with an introduction of China’s Internet Finance
development situation and four major forms of Internet Finance. Following this we
provided a detailed description on Yu’E Bao’s model, including its historical
performance, interest rates determinants, underlying risks, and its impacts on the
banking sector. Then, we move on to two research questions: 1) Has Yu’E Bao actually
outperformed other investment alternatives? If not, what are the major factors
contributing to its popularity? 2) Assuming Yu’E Bao is a representative of money
market funds and China’s Internet Finance product, what economic implications can we
draw from this development, especially regarding the Chinese financial system?
Based on Capital Asset Pricing Model (CAPM) and Sharpe ratios, we analysed daily
data on stock market performance and similar investment products, from 2013 to 2018.
We further divided the sample time period into shorter time frames to better see the
changes occurring overtime. Our research findings to the first question are as follows:
1) compared to the stock market, Yu’E Bao and other money market funds have a
higher risk-adjusted return. The advantage of less volatility in return is more obvious
during stock crash time; 2) compared to other money market funds, the Sharpe ratio of
Yu’E Bao is consistently higher than the average of money funds in different time
frames, providing a high and also stable risk-adjusted return; 3) high households’ saving
ratio, relatively poor performance of investment alternatives, and use of Internet and
technology together contribute to the popularity of money market funds in China.

6
Regarding the impacts of money market funds and Internet Finance on the Chinese
financial system, our analytical results are the following: 1) On one hand, the sheer size
of assets managed by money market funds will take away some portion of bank deposits
and thereby affect banks’ lending ability; 2) On the other hand, the large amount of
assets invested in cash equivalents extend the lending ability of banks through
negotiable deposits; 3) recent policy changes show that the development of money
market funds is still under control of the Chinese government and therefore, will not
cause fundamental change to China’s traditional banking sectors; 4) In general, Internet
Finance development has brought fiercer competition to the traditional banking sector
and accelerated the process of interest rate marketization.
Key Words: Yu’E Bao; Money Market Fund; Internet Finance; Sharpe Ratio; China

7
1. Introduction and Background
Yu’E Bao, an investment product based on the third-party payment platform Alipay and
managed by Tianhong Asset Management Co., has gained increasing popularity since it
first appeared on the market in May 2013. At the end of 2017, Yu’E Bao has reported
1.58 trillion yuan (US$ 251.2 billion)1 in asset value under management, surpassing
JPMorgan’s US government money market fund to become the largest money market
fund in the world. Yu’E Bao is also considered one of the most typical products of
Chinese Internet Finance (Jingu, 2014).
Even so, the concerns over the security and further development of the poduct exist.
Fitch, one of the world’s big three crediting rating agencies, consider Yu’E Bao much
riskier than JP Morgan’s US government money market fund. Their evaluation criteria
include credit quality, liquidity and market concentration.2 China’s implicit state-
guaranteed financial system3 and special economic environment also contribute to other
concerns about multiple regulators and regulatory arbitrage (Chan, 2017).4
The sheer size of Yu’E Bao’s asset under management and its broad investor base
mandates these risks merit our attention. This paper addresses two major questions: (1)
Has Yu’E Bao actually outperformed the market and other alternative investment? If
not, what major factors have inspired its popularity among Chinese investors? (2)
1 Data source: Tianhong Asset Management Co. (2017, Dec 31). Tianhong Yu’E Bao Money Market
Fund Q4 2017 Report 2 Fitch Ratings Inc. (2017, Dec 13). Comparing the World’s Two Largest Money Funds (More Risk for
World's Biggest, China's Yu'E Bao, than JPM USG MMF) Retrieved from
https://www.fitchratings.com/site/re/906997 3 Implicit state guarantee means that government will bail out a firm when the firm face default risk
through the implementation of public policies. 4 See Chan, H. (2017, May 10). Yu’E Bao: A Double-Edged Sword for Financial Innovation. Retrieved
from https://ippreview.com/index.php/Blog/single/id/434.html

8
Assuming Yu’E Bao is a representative of money market fund and China’s Internet
Finance development, what economic implications can we draw from this development?
What changes this development may put on Chinese financial system?
Year 2013, which is often referred to as “the year of Internet Finance in China”, is
widely considered a new era for Internet Finance development (Jingu, 2014). Most
research into Internet Finance has taken the form of qualitative analysis of the industry’s
emerging business models, underlying risks and governance and regulatory problems.
Pricing problems on P2P lending platforms has also been the subject of several
quantitative studies centred on Internet Finance centred.
Though some studies have been previously conducted, this paper still contains a number
of relevant contributions. Firstly, it provides an overview of Internet Finance
development in China and a detailed description on Yu’E Bao to readers who might not
be familiar with this product and the development situation in China. Secondly,
previous studies on Yu’E Bao only cover years up to 2015. We extend the studies to
2018. Such extension of study period is crucial because China’s stock market went
through dramatic fluctuations during the year 2015 and the year 2016. We consider the
stock market an investment alternative to money market funds in our study, so abnormal
fluctuation is an important consideration in evaluating product performance. Thirdly,
past studies focus on the single product, Yu’E Bao within a single period. We include
other money funds for comparison and also divide the whole of the time sample period
into shorter time period to better evaluate the performance as it changes over time.

9
The paper proceeds as follows: latter part of this section introduces basic information
and facts; Section 2 provides a related literature review; Section 3 and Section 4
describe data, methodology and empirical results; Section 5 discusses economic
interpretations and further analysis; Section 6 analyses the limitations of our study and
the last section concludes and suggests some directions for further research.

10
1.1. What is Internet Finance: Review on its development in China
Internet Finance, also referred to as “digital finance” or “fintech”, has been grown
popular and inspired wide discussion in recent years. Definitions of Internet Finance
vary, covering different items. Chinese officials5 define Internet Finance as “the new
business model of utilizing the Internet information communication technologies to
accomplish a wide range of financial activities, such as third-party payment, online
lending, direct sales of funds, crowding, online insurance and banking” (Shen and
Huang, 2016). Broader definitions of Internet Finance also include Internet digital-
based currencies like Bitcoin, Q-coin and Amazon Coin. In this work, we have adapted
the narrower definition that defines Internet Finance as financial services and financial
intermediaries provided online.
Through technological advancement, individuals and corporations can enjoy traditional
financial services such as money deposits, withdrawals, online transfers, fundraising,
investment and wealth management. McKinsey (2014) estimates that by 2025, financial
services’ extensive use of Internet applications will contribute 1,200 billion CNY to
China’s annual GDP. In 2015, China’s Internet Finance user base has already expanded
to 500 million people, contributing to 20% of GDP, between 12 and15 trillion CNY.6
There are four major forms of Chinese Internet Finance: micro-financing services, peer-
to-peer lending (P2P), crowd funding and third-party payment. Micro-financing services
5 People's Bank of China, Ministry of Industry and Information Technology, Ministry of Public Security,
Ministry of Finance, State Administration for Industry and Commerce, State Council Legislative Affairs
Office, China Banking Regulatory Commission, China Securities Regulatory Commission, China
Insurance Regulatory Commission, and State Internet Information Office jointly issued the Guiding
Opinions on Promoting the Healthy Development of Internet Finance July 2015 Retrieved from
http://www.mof.gov.cn/zhengwuxinxi/zhengcefabu/201507/t20150720_1332370.htm 6 See Ngai, J. et al., ‘Disruption and Connection: Cracking the Myths of China Internet Finance
Innovation’, McKinsey Greater China FIG Practice July 2016.

11
primarily target customers without easy access to bank or cheap credit, including private
firms, small and medium enterprises (SMEs) and low-income individuals. Currently, E-
commerce and IT companies are primary providers of micro-financing services. Making
use of data technology, IT companies performed both quantitative and qualitative
analysis to determine users’ crediting ratings. The information7 used to build credit-
rating models includes but is not limited to the company business register information,
transaction history, payment of utility fees, personal profile and social connections.
From credit ratings, loan providers can determine financing details, including the
amount, interest rate, maturity date. After borrowers are lent fund, micro-financing
companies employ third-party payment platforms to monitor money use and detect
potential misuse. Mirco-financing companies can immediately terminate lending and
block relevant accounts on third-party platforms (Zhang and Zhou, 2015). As of March
2017, Ant Credit, an affiliate under Alibaba Group, has lent 5.2 million RMB unsecured
loans to small business in China.8 Internet-based Micro-financing in China is also
considered as progress in promoting financial inclusion and enhancing affordable access
to financial services for disadvantaged individuals and groups (Loubere, 2017).
The second type of Internet Finance, peer-to-peer (P2P) lending is a direct financing
method9 that enables borrowers to divide financing needs into small portions and
borrow from a large group of lenders. This process simultaneously allows lenders to
7 See Sesame Credit, a platform under Alipay and Alibaba for an example. Information is obtained from
https://www.xin.xin/#/detail/1-2 8 Data is obtained from official Website of Ant Financial. Unsecured loans refer to the loan issued and
supported by the borrowers’ credit ratings, instead of by any kinds of collaterals. 9 Direct financing refers to the way of financing that borrowers directly borrow from financial market
without the need to turn to a financial intermediary. While in the case of indirect financing, financial
intermediaries take money from the borrowers at an interest rate and lend the money to borrowers at a
higher rate, leading to high cost of borrowing.

12
reduce risk exposure by diversifying their portfolio and lending to many borrowers.
Currently, Lufax, an affiliate under Ping An Insurance (Group) Co., is one of China’s
largest P2P lending platforms. Unlike financial intermediaries, who profit from the
spread between lending and borrowing rates, P2P lending platforms primarily generate
profits from their service fee structures. These platforms’ services include financial and
wealth management products, investment consulting, debt assignment10
, credit rating
evaluation with credit data, and information disclosure (Zhang and Zhou, 2015).
The third category of Internet Finance is crowd funding, which raises capital for a
project and a venture via a huge Internet user base. Crowd funding can take the form of
a donation, loan, reward or equity. Popular Chinese crowed funding platforms include
Taobao and JD.
The fourth and equally indispensable subset of Internet Finance is China’s Internet
Finance is third-party payment platforms. Third-party payment was originally designed
in the United State, to resolve payment problems in Customer-to-Customer (C2C)
business. This payment method dates back to 1999, when E-commerce giant eBay
purchased and further developed Billpoint, a company providing individual-to-
individual money transfer services. PayPal, one of the most popular third-party
payment platforms worldwide, targets both customer-to-customer (C2C) and business-
to-business (B2B) services. At the end of 2017, its annual payment volume had reached
451.27 Billion USD11
, while mobile payment’s global total revenue, including third-
10
Debt assignment refers to the transfer of debt and all related rights and obligations from a creditor
(assignor) to a third-party (assignee). 11
Data is obtained from PayPal Annual Report 2017.

13
party payments and direct payments via bank-developed mobile apps, was reported at
780 Billion USD.12
China’s largest third-party payment platforms are Alipay, affiliated with Alibaba, and
TenPay, affiliated with Tencent. Respectively, these two platforms took up of 53.73%
and 39.35% of the market share in Q3 2017.13
Other platforms include Union Pay and
Baidu Wallet.
This study’s focus, Yu’E Bao, does not clearly belong within any of the four categories
presented above. Even so, Yu’E Bao’s development is closely tied to third-party
payment platforms. Yu’E Bao and its characteristics will be further discussed in the
following section
1.2. What is Yu’E Bao: Review on money market fund
Yu’E Bao, which translates to “leftover treasure” in Chinese, is a money market fund
that is typically espoused as open-end, low-risk, low-return, high-liquidity and cash-
equivalent. An open-ended fund issues an unlimited number of stock or bond shares and
allows investors to sell and buy these shares at any trading time. In contrast, close-
ended funds issue a fixed number of shares, and investors are only permitted to trade
these shares through a broker.
Compared to other fund types, money market funds typically accumulate lower returns
and exercise less risk. These funds typically invest in short-term, high quality debt
12
Data is obtained from TrendForce 13
Data is obtained from iResearch.

14
securities that include government treasury bonds, tax-exempt municipal securities, and
corporate and bank debt securities. In practice, many investors (perhaps incorrectly)
consider a money market fund to be as safe as a bank deposit and a useful alternative to
stock market investment.
Yu’E Bao’s investment process is simple and convenient. Investors can transfer money
into Yu’E Bao online or via mobile phone with Alipay from either an Alipay or bank
account. Once transferred, investors can remove money from Yu’E Bao at any time. At
its initial development stage (before mid-201714
), investors are able to do these
transactions at any time and in any amount without incurring transaction fee. Since May
2017, the fund management company implemented maximal purchase limits. Yu’E
Bao’s investor base now numbers around 3 billion.15
1.3. Historical data and policy change
This section provides historical data on Yu’E Bao’s return rate, asset value, asset value
growth rate, and asset allocation. This data is provided to allow readers a more
comprehensive and direct impression of this investment product. This section also
considers crucial historical policy changes in investment in Yu’E Bao. In China,
government intervention is quite common and heavily influences economic
development while regulatory directly affects market behaviour.
Figure 1.3.1 compares Yu’E Bao’ returns to the People’s Bank of China (PBoC
hereafter) 3-month benchmark deposits rate and demand deposit rate benchmark.
14
Changes will be covered in the Part 1.3 Historical data and policy change. 15
Data is obtained from Tianhong Asset Management Co.’s Website.

15
During our study period, which spanned from May 30, 2013 to Feb 12, 2018, Yu’ E
Bao’s average 7-day annualized return rate of Yu’E Bao is 3.86%, much higher than the
PBoC benchmark deposit rate.
Interest rate, which is closely related to the cost of borrowing and the price the capital,
has been rigidly controlled by Chinese government for a long time. A few measures for
exercising the control include bank reserve requirement, loan quota and deposit ceiling.
Before Nov 2015, as shown in the Table 1.3.1, PBoC implemented a deposit rate ceiling
on commercial banks based on the benchmark. A deposit ceiling is the upper limit that a
lending institution can charge for a loan and this directly limits interest earned from
bank deposits. The removal of interest rate ceilings in November 2015 is considered as
“the most decisive step” China made in interest rate liberalization and also accelerates
the process of financial reform (PBoC, 2015).

16
Table 1.3.1 RMB deposit rates
2004/10 Removed the floor of deposit rates
2012/06 Increased the ceilings of deposits rates to 1.1x of the benchmark deposit
rate
2014/11 Raised the ceilings of deposits rates from 1.1x to 1.2x of the benchmark
deposit rate
2015/03 Raised the ceilings of deposits rates from 1.2x to 1.3x of the benchmark
deposit rate
2015/05 Raised the ceilings of deposits rates from 1.3x to 1.5x of the benchmark
deposit rate
2015/08 Removed the ceilings of deposit rates with maturities > 1 year
2015/10 Removed the ceilings of deposit rates for commercial banks and rural
cooperative financial institutions
Sources: PBoC; CICC
17
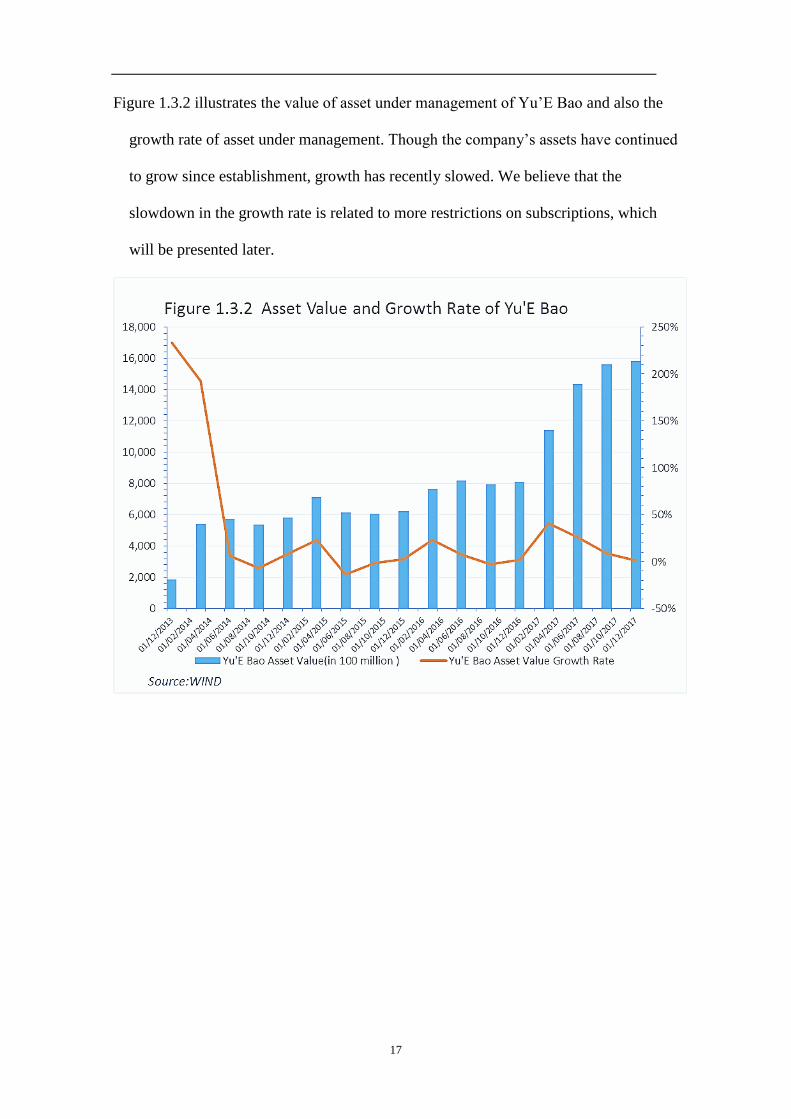
Figure 1.3.2 illustrates the value of asset under management of Yu’E Bao and also the
growth rate of asset under management. Though the company’s assets have continued
to grow since establishment, growth has recently slowed. We believe that the
slowdown in the growth rate is related to more restrictions on subscriptions, which
will be presented later.

18
Figure 1.3.3 illustrates Yu’E Bao’s asset allocation during the period considered by this
study. Cash and cash equivalents consistently occupied the largest proportion of the
company’s allocation, and these assets were primarily employed for negotiable bank
time deposits. Unfortunately, information regarding bank deposits counterparties and
Yu’E Bao’s investment securities is unavailable to the public.

19
Figure 1.3.4 outlines four major shifts in investment policies under Tianhong Asset
Management Co. These shifts include reduction in the maximum funds an individual
can deposit into Yu’E Bao, the maximum amount an investor can invest in a day, and
most recently, an aggregate daily subscription quota16
for all the investors. This
progression demonstrates the company and fund manager seek greater control over the
market, asset growth, and liquidity risk avoidance.
Figure 1.3.4 Investment Policy Change
16
Meaning that the total amount available to all the investors for subscription is limited.
May 30 2013 No limit on Subscription and redemption
May 27 2017 Individual Subscription Maximal: 250,000 Yuan
August 14 2017 Individual Subscription Maximal:
100,000 Yuan
December 8 2017 Daily Subscription Maximal: 20,000 Yuan
Feburary 1 2018 - March 15 2018 "Aggregate Daily Subscription Quota"

20
2. Literature Review
Despite Yu’E Bao’s rapid development, several past studies have addressed the
following three questions. First, what are the major determinants of Yu’E Bao’s interest
rate, and how can its relatively high return be explained? Second, what major risks
underlie Yu’E Bao and other money market fund returns? Third, since 2013, when
Yu’E Bao appeared on the market, whole money market funds market have reached a
valuation of 6.8 trillion yuan (as of November 2017),17
or about 60% of total mutual
funds(Chinadaily, 2018). This amount surpasses the 4.7 trillion total valuation of
individual bank account deposits with the Bank of China in 2017.18
This has attracted
attention to Yu’E Bao and other money market funds’ impacts on the traditional
banking industry and the interest rate liberalisation process.
2.1. Determinants of interest rate of Yu’E Bao
Previous interest rate related studies have attempted to identify the relationship between
Yu’E Bao’s returns and interbank rate and money supply factors such as exchange rates.
Some researchers have compared Yu’E Bao with the whole money fund market and
concluded Yu’E Bao exhibits the scale effect,19
which contributes to the firm’s
relatively high return and lower volatility (Cheng, Pang and Zhang, 2018).
In a study of Yu’E Bao’s costs and interest paid to investors, Liu (2014) applied a linear
regression model to analyse the relationship between the Yu’E Bao interest rate and the
17
Data is obtained from China Bank Association. 18
Data is obtained from Bank of China 2017 Annual Report. Retrieved from
http://www.bankofchina.com/en/investor/ 19
Scale effects means that when total output of a product increases, the average cost of production will
decrease.

21
Shanghai Inter-Bank Offered Rate (SHIBOR). She found no long-term relationship
between these two factors and argued that Yu’E Bao initially transferred some of profits
to investors as interest payments through bank deposit agreements.
Other research argued against this finding. Jiang (2015) reported a linear relationship
between Yu’E Bao’s return over period and the SHIBOR rate in the last historical
period and the return of Yu’E Bao in the period . Lu, Xue and Zhou (2015)
employed a multi-factor regression model to analyse the relationship between Yu’E Bao
and SHIBOR at different maturities. They identified significant relationships between
these two factors, but the directions of these impacts varied; while the 1-month and 3-
month SHIBOR rate were positively related to Yu’E Bao’s return, the 2-Week SHIBOR
was negatively related.
He and Bai (2015) constructed Ensemble Empirical Mode Decomposition Vector
Autoregression (EEMD-VAR) model and found that SHIBOR and money supply have
the highest degree of influence on Yu’E Bao’ s return and they thus concluded that the
tightness of domestic financing level and monetary policy are two most significant
determinants. Besides, they also suggested that exchange rate and bank loan ratio have a
negative correlation with the return.
When investigated Yu’E Bao’s asset allocation and profit statements, Chen and Bai
(2017) found over 70% of the company’s assets are held in bank deposits and reserves,
and 99% of interest came from bank deposit agreements. Based on a Bayesian Quantile
Regression Model, they also identified a significant positive relationship between the
Yu’E Bao’s return and SHIBOR, a 1-year bank investment product return, and the

22
Chinese government’s 1-year bond yield. Their study also demonstrated a negative
correlation between money supply (M2) and Yu’E Bao’s return. They concluded
macroeconomic development negatively relates to Yu’E Bao’s return.
The most recent literature, published by Chen et al (2018), focuses on Yu’E Bao’s
volatility and externality compensative return. The study employed a time-variant
capital asset pricing model (CAPM). The WIND Index and CSI money fund index acted
as market proxies and compared to Yu’E Bao’s performance. Their results demonstrate
that Yu’E Bao’s returns were less volatile than the overall market, and only a relatively
insignificant correlation exists between Yu’E Bao and the market, leading to smaller
beta than traditional financial products. Chen et al (2018) posited that Yu’E Bao’s
relatively high return and low volatility resulted from the scale effect – as Yu’E Bao
gathered investors’ income at its large scale, each individual’s money contributed
positive externality20
to others’ return. The three present the term “externality rate of
return” to refer to this advantage wielded by Yu’E Bao and other Internet Financial
products.
2.2. Underlying risks of Yu’E Bao
Yu’E Bao and other similar money market fund products are associated with five types
of risk: credit, liquidity, interest rate, policy and operation (Chen, 2014; Wang et al,
2014; Lin, 2015; Li, 2015).
Credit risk refers encompasses the outcome wherein borrowers default and prove unable
to service debt payment. In this situation, investors may be unable to reacquire their
20
Externality refers to the benefit or cost to society or another person of a private action.

23
principal funds, let alone interest. In the case of Yu’E Bao, this category of risk may
arise due to asset mismanagement. According to Lin (2015), over 90% of Yu’E Bao’s
assets are currently allocated in interbank deposits. As a result, credit risk takes the form
of bank default.
Liquidity risk is dictated by Yu’E Bao’s buying and redemption rules. As an open-
ended fund, Yu’E Bao can be bought and redeemed by investors at any time. The “T+0”
transaction cycle requires same-trading-day payment settlement, and in practice,
investors can typically withdraw money from Yu’E Bao to their Alipay accounts
immediately. Compared to China stock market, where a “T+1” 21
settlement cycle is
employed, Yu’E Bao has proved an attractive investment option for investors who value
near-instant liquidity.
But Yu’E Bao’s “T+0” transaction settlement rule also facilitates some risk. If a large
volume of shares are simultaneously redeemed, the company may have insufficient cash
to fulfil short-term financial demands. Such sudden widespread redemption is not
unprecedented in China. On Nov 11, 2013, China’s largest online shopping day (similar
to Black Friday in the US), 16.79 million online shopping transactions were paid with
investor funds withdrawn from Yu’E Bao. In total, these transactions were valued at
61.25 billion yuan and set a record for single-day fund redemption value worldwide
(Lin, 2015). Notably, on September 30, 2013, the total value of Yu’E Bao’s assets
under management was 556.53 billion yuan. Even accounting for asset growth between
September 30 and November 11, the 61.25 billion yuan withdrawn constitute a sizable
portion of Yu’E Bao’s assets.
21
“T+1” transaction cycle allows one more day to settle the payment.

24
Interest rate risk emerges from fluctuations in the market interest rate. Investment
product value is altered based on the spread between the market interest rate and the
return rate from Yu’E Bao. Increased market interest rates will, for example, result in a
decrease in investment value and affect investors’ real purchasing power. Chen (2014)
argues that monetary policy, macroeconomic development and inflation all contribute to
this type of risk.
Policy risk results from uncertainty in the adoption and implementation of policy
changes. Still new and immature, China’s Internet Finance industries and products have
not yet received sufficient regulatory attention and guidance. More broadly, China’s
financial market is also not well-established. Potential policy changes or stricter future
regulations may damage investor interests and positions (Wang, 2014).
Finally, operation risk is primarily the result of imperfections in Yu’E Bao’s transaction
system, lack of management experience and concerns over cyber security (Chen, 2014).
Chen (2014) applied the Value-at-Risk (VAR) method to measure Yu’E Bao’s risk. His
analysis demonstrates the firm’s risk now is controllable, but he argues the public
should closely monitor potential default, increasingly strict supervision from external
regulators and cyber security problems.
In conclusion, Yu’E Bao’s associated risk can generally be classified into two
categories. The first type of risk closely relates to this investment product’s
development environment and includes risks arising from immature operation systems
and cyber security. In addition, China’s financial system, sometimes characterised as

25
“dominated by large banking sectors with inefficiency and non-performing loan”,22 also
contributes to credit and liquidity risk. The remaining type of risk includes all general
risks faced by money market funds, including interest rate risk, liquidity risk and so on.
2.3. Money market fund, traditional banking sector and interest rate liberalisation
The following section considers the influence of Yu’E Bao and other money market
funds’ actual effects on the interest rate liberalisation process. In addition, the overall
effect of Internet Finance development on traditional banking industries is first
presented.
In studying Internet Finance’s overall effects on traditional banking sectors, Guo and
Shen (2016) stated the Internet Finance development’s major influences include
upgraded technology, improved work efficiency, increased capital cost and reduced
management costs and risk-taking. They also demonstrated a “U” shaped trend in the
impacts of Internet Finance on commercial banking sectors; in Internet Finance’s early
phase, commercial banks benefited from reduced management costs and risk-taking.
Later, however, Internet Finance development facilitated increased capital cost and risk-
taking. In addition, Guo and Shen (2016) noted heterogeneity in the sensitivity of banks’
responses to these changes: small and medium banks proved more sensitive, while large
commercial banks were generally slower to respond.
Hassanali, Bernard and Marc (1995) cited evidence of U.S. money market fund
development to explain the relationship between money funds and interest rate
22
Non-performing loan(NPL) refers to the loan that the borrower does not make the interest payment or
repay the principal. For details, see Allen, F., Qian, J., Zhang, C., & Zhao, M. (2012). China's financial
system: opportunities and challenges (No. w17828). National Bureau of Economic Research.

26
liberalisation. They argued interest rate liberalisation is a crucial factor in money market
fund growth, and the development of money market funds also accelerates the interest
rate liberalisation process. According to Shaw (1973), interest rate liberalisation, which
allows the interest rate to be determined by market supply and demand, is a critical step
in financing deepening23
and removing excessive government interventions.
When considering the relationship between money market funds and traditional banking
sectors, Xiao (2016) was the first to employ quantitative analysis to determine the
impacts of money market funds on bank deposits, liquidity and interest rate
liberalisation in China. Xiao (2016) employed data collected from 16 publicly listed
Chinese banks between 2008 and 2014 and found that money market fund growth
significantly impacted bank deposit volume. For every 1% increase in money market
fund valuation, bank deposits fell around 0.08%. In addition, money market fund
development reduced banks’ liquidity ratios by altering their demand deposit ratio. She
found that China’s deposit rate constrains prevented banks’ deposit volumes from
illustrating interest rate sensitivity. However, a positive correlation does exist between
the yields of bank-guaranteed financial products and money market funds. When money
market fund yields increase by 1%, bank-guaranteed yields increase by 0.643%. As a
result, Xiao (2016) concluded money market fund development positively impacts
China’s interest rate liberalisation and also affects the traditional banking industry.
Zhao and Ji (2017) adopted “Structure-Conduct-Performance” (SCP) theory and
analysed both bank and Yu’E Bao financial products. Based on data gathered between
23
Financial deepening means the increased provision of financial services. Financial deepening includes
providing a wider range of services and providing different socioeconomic groups better access to
financial services.

27
2012 and 2015, the two researchers posited the emergence of Yu’E Bao improved bank
financial product yields. In addition, Yu’E Bao’s presence and expansion fosters more
intense competition within the traditional banking industry and helps improve the
service quality.
Previous literature closely relates to this study’s scope. Analysis of interest rate and risk
factors enables better understanding of investors’ choices to invest in money market
funds and how investors weight risk types in China’s unique financial and economic
system. However, past research has primarily focused on Yu’E Bao, which is a single
product. Less attention has been dedicated to investment alternatives, such as stock
investments and other money market funds. In this study, we seek to determine if Yu’E
Bao provides a higher return to risk ratio than other investment choices. In addition, we
analyse Yu’ E Bao’s performance across different development time periods framed by
key changes.

28
3. Data
The data employed in this study was exported from Bloomberg Terminal and WIND.
Bloomberg is a digital platform specializing in the provision of data and financial
analysis. Practitioners and investors can also use the platform to monitor real-time
market fluctuations and trade.
WIND is China’s Bloomberg equivalent. It provides analysis focused on the Chinese
market and is widely employed by Chinese individuals and institutions. We downloaded
any data unavailable on Bloomberg from WIND.
This study considers a period spanning from 30 May 2013 to 13 Feb 2018 (inclusive).
This period starts with Yu’E Bao’s establishment. A wider coverage of data will enable
us to better observe interest rate changes and improve comparison accuracy.
All collected data is daily data normalized on a weekly-rolling basis. A detailed
description of this normalization and calculation process for each data category is
provided in this study’s empirical analysis section. Proxy selection criteria will also be
discussed in the empirical analysis section. In the appendix, Table 8.1 describes each
data source.

29
4. Methodology and Empirical Studies
4.1. “Mean-Variance”, Capital Asset Pricing Model (CAPM) and Sharpe ratio
Capital Asset Pricing Model (CAPM), a classical modern finance model, was first
introduced by William Sharpe (1964) and John Lintner (1965) and has been widely
discussed ever since. In addition to its use as the base of many academic studies, CAPM
is also widely applied in industry analysis. Practitioners and investors employ risk
indexes derived from CAPM, such as the Sharpe Ratio and Beta, to evaluate portfolio
performance. These indexes are crucial in considering investment decisions. In 1990,
CAPM’s importance and widespread impact earned Markowitz and Sharpe the Nobel
Prize in Economic Science.
This study’s empirical analysis is based on CAPM. We interpret the performance of
Yu’E Bao using empirical results. However, since CAPM was developed based on
Modern Portfolio Theory (MPT), MPT first warrants further explanation.
Modern Portfolio Theory and “Mean-Variance Analysis”
Modern Portfolio Theory development was founded by Markowitz’s work Portfolio
Selection in 1952. He argues there are two major steps in forming a portfolio. First,
through observations and analysis of investment products’ past performance, potential
investors form expectations about future performance. Second, investors then select
portfolios based on these future performance beliefs. Markowitz’s theory primarily
emphasises this second phase. He presented the “Mean-Variance Analysis” technique to
facilitate more efficient investment decisions.

30
In Markowitz’s model,
∑
∑
∑ ∑
where
denotes the percentage of asset i to be invest in portfolio j.
denotes the return of assets i.
, and all the weights are non-negative given that short-sale is not
permitted.
is the standard deviation of the asset i during the sample period.
is the coefficient correlation between asset i and asset j during the sample period.
is also the covariance between asset i and asset j during the sample period.
One of Modern Portfolio Theory’s key insights is that an asset or portfolio’s return and
risk should not be viewed or assessed independently. Instead, investors should consider
how each investment contributes to the overall portfolio’s return and risk. If we assume
all investors are rational and risk-averse, then investors analyse a portfolio’s variance
and mean and attempt to optimize portfolios by either maximizing expected returns
within a specific level of variance or minimizing variance at a specific level of return.
One major limitation of Modern Portfolio Theory is its more normative theory on
portfolio optimization (Sharifzadeh, 2005); the model is also unsuitable for application

31
by individual investors. The model also fails to explain how investors initially construct
their return expectations for single individual assets.
Second, Markowitz’s model requires the estimation and calculation of the variance-
covariance matrix (Sharifzadeh, 2005). This process can prove troublesome, as it
requires the estimation of n variances and
convariance. For a CSI 300 Index stock,
for example, 45,150 calculations of variances and covariance are required. Previous
theories did not provide a market equilibrium price for assets under risk and did not
explain the relationship between “the price of individual asset price” and “various
components of its risks” (Sharpe, 1964, pp 425-427). Soon after MPT’s introduction,
CAPM was developed based on “Mean-Variance” trade-off and the “Risk-Return”
concept.
Capital Asset Pricing Model
CAPM began with Markowitz’s “Mean-Variance Efficient Portfolio Optimizer” model
and additional assumptions of capital market structure and investor behaviour. These
major assumptions include (1) investors are risk-averse, rational individuals who try to
maximize the utility of their wealth; (2) investors can borrow and lend unlimited
volumes of risk-free assets at a risk-free rate; (3) investment quantities are fixed and
limited to all marketable assets (this assumption excludes all privately traded or
nontraded assets or investments); (4) markets are frictionless: costless information is
simultaneously available to all investors, and individual investor actions have no effect
on market price; finally, (5) there are no market imperfections, such as transaction costs
or tax liabilities. This assumption ensures only two factors affect how investors form

32
their portfolios: expected return and return variance (Copeland et al. 2005; Sharifzadeh,
2005).
In essence, CAPM addresses the relationship between an individual asset’s expected
rate of return and risk. CAPM measures the sensitivity of a single asset to the entire
market and calculates whether the expected excess return of any portfolio, ( ) , has a
linear relationship with the portfolio’s sensitivity to the market, , and expected excess
market return, ( ) . The model is expressed as follows:
( ) ( ) Where
( ) denotes the expected return on an investment.
denotes the theoretical risk-free rate of return.
( ) denotes the average expected market rate of return.
( )
( ) denotes the sensitivity of the individual asset’s
rate of return to the overall market’s rate of return.
The difference between the actual return rate and expected equilibrium rate return rate is
denoted by alpha, or Jensen’s index:
( ) ( ) ( )
Where
( ) denotes the expected return on an asset or portfolio.
denotes the theoretical risk-free rate of return.
( ) denotes the average expected market rate of return.
( )
( )

33
The alpha ratio compares the actual realized performance of a portfolio and its required
rate of return by measuring whether an investment outperforms or underperforms the
market. Alpha is also referred to as the “overall excess return” or “abnormal return”. A
positive alpha ratio of 1%, for example, indicates the return on investment outperformed
the market benchmark by 1% in the same period. Thus, investors attempt to identify
investments with higher alpha ratios.
Risk-Reward Analysis: Sharpe Ratio
Like alpha, beta, standard deviation and R-squared, the Sharpe Ratio, a statistical risk-
adjusted return, is a crucial indicator of performance.
Arthur D Roy (1952) was the first to suggest the use of a risk-reward ratio for portfolio
selection and risk management. Roy’s safety-first criterion (1952) stated that investors
should minimize the probability an asset’s return will fall below the minimal acceptable
return, denoted by ( ) where is the actual return of the asset, i, and is
the minimal acceptable return rate. Later, in 1966, William Sharpe developed this
criterion into a “reward-to-variability” ratio now known as the Sharpe Ratio. The ratio
is expressed as follows:
( )
√ ( )
Where
( )
√ ( )
34
The Sharpe Ratio measures excess return, referred to as risk premium, by undertaking
one more unit of risk. This ratio is useful because it labels an investment as suitable
only if higher returns do not facilitate additional risk. Thus, a higher Sharpe Ratio
implies better risk-adjusted performance.
In next section, we apply CAPM and “Risk-Reward Analysis” to calculate the value of
Sharpe Ratios. Comparisons between Yu’E Bao and other investment choices are
included to address our first research question: Has Yu’E Bao outperformed the market
and other similar investment products? In addition, we repeated this calculation process
across different time frames to identify any changes in Sharpe ratios and locate
rationales behind these changes. First, we must outline the criteria and reasons behind
proxy selections. Then, we display our results. Economic interpretations of these results
are discussed in a later section.
4.1.1. Proxy selections and definitions of relevant terms
The choice of market rate: CSI300 Index
The Shanghai-Shenzhen China Stock Market 300 Index (CSI 300 Index) was selected
as a market performance proxy. The CSI 300 Index replicates the performance of the
top 300 stocks traded in the Shanghai and Shenzhen Stock Exchanges. The CSI 300
Index is a market-value-weighted index, and each stock component is weighted
according to the total market value of its outstanding shares.24
24
Market-value weighted index is also known as capitalization-weighted index. The changes in individual
stock price have different impacts on the stock index according to their market capitalization (the share
price times the number of shares outstanding). In contrast, in a price-weighted index, price of each stock
is the only factor for determining the stock index.

35
We selected the CSI 300 Index for two reasons. First, the index possesses wide
coverage of stock market performance. The CSI 300 Index is comprised of 300 stocks
with the highest market values in many sectors, including finance, utilities,
construction, and IT. This distribution more effectively represents overall market
performance than similar indexes with less coverage, such as the CSI 100 Index or
indexes focusing on a specific industry, such as the CSI 300 Capital Markets Index.
Second, the CSI 300 Index more comprehensively reflects stock market fluctuations.
Because the CSI 300 Index is a cross-market index with stocks in both the Shanghai
Stock Exchange and Shenzhen Stock Exchange, it is more representative than a single-
market index, such as the Shanghai Stock Exchange 150 Index (SSE 150 Index).
The Risk-Free Rate Option: China Demand Deposit Rate
A risk-free rate refers to the rate investors can acquire from risk-free investments.
Damodaran (2009) outlines two major criteria for risk-free investments: no risk of cash
flow associated default, and no reinvestment risk.25
In reality, almost all investments
have some risk. Governments also can collapse and default on sovereign debt. The most
recent example of such default occurred in Greece in 2015 and led to repayment failure
of 1.7 Billion USD in government debt to the International Monetary Fund (CNN,
2015).
Considering the political, economic power and Government Bond, the U.S. is unlikely
to collapse soon. In addition, the short maturity of U.S. Treasury bills26
further reduces
25
Reinvestment risk refers to the risk that the coupon received from the investment has the potential to be
reinvested at a lower interest rate. 26
Usually issued with maturity dates of 28 days, 91 days, 182 days and 364 days, all less than one year.

36
interest rate risk. In practice, so called T-bills commonly act as a reliable proxy for the
risk-free return rate for academics and practitioners. In contrast, China’s government
bond liquidity 27
is relatively low. This makes its use as a proxy inappropriate when
compared to money market funds. Past studies have employed China’s Shanghai
Interbank Offered Rate (SHIBOR) as a risk-free rate proxy, but this rate is also
unsuitable for comparison to Yu’E Bao’s high liquidity product.
Like Chen et al. (2018), we selected and applied the demand deposit rate as a proxy for
the risk-free rate. The demand deposit is the money individuals can withdraw from their
bank deposit accounts at any time without notifying their banks in advance. This high
liquid characteristic resembles Yu’E Bao’ near-instant liquidity. During our study
period, demand deposit rates differed between banks. However, the five largest state
banks28
maintained the same demand deposit rate. This rate was used for our study.
The choices of other money market funds for comparisons
We selected and compared the performance of six funds to Yu’E Bao’s performance.
Funds were selected based on several major criteria. First, all funds were money market
funds. We limited our comparisons to this category to limit potential biases in result
interpretation. We excluded bond, equity, and index, fund investment through qualified
domestic institutional investors (QDII) schemes and other non-money market funds.
Second, selected funds were established before Yu’E Bao was introduced to the market,
May 30, 2013. This criterion ensures compared data sets share time frames and similar
sample sizes. As discussed in the above literature review, Yu’E Bao’s interest rate
27
Usually issued with maturity of 3 or 5 years, longer than 1 year. 28
Refers to Bank of China; Industrial and Commercial Bank of China; Agriculture Bank of China; China
Construction Bank; Bank of Communications.
37
closely relates to several economic factors, including SHIBOR, the exchange rate and
money supply. The comparison of performance ratios between funds is not objective
across differing time periods and macroeconomic environments. Third, the minimal
purchase amounts for selected funds range from 0.01 CNY to 100 CNY with an upper
maximal purchase amount limit. In China, two classes/categories can exist within the
same money market fund: category A and category B. The biggest difference between
these categories is the purchase threshold. Category A targets individual investors and
assigns a maximal holding amount, while in contrast, category B targets institutional
investors and has a minimal holding amount. Since the lower purchase limit of Yu’E
Bao is 1 CNY and the upper limit has been reduced since 2017, we compared Yu’E Bao
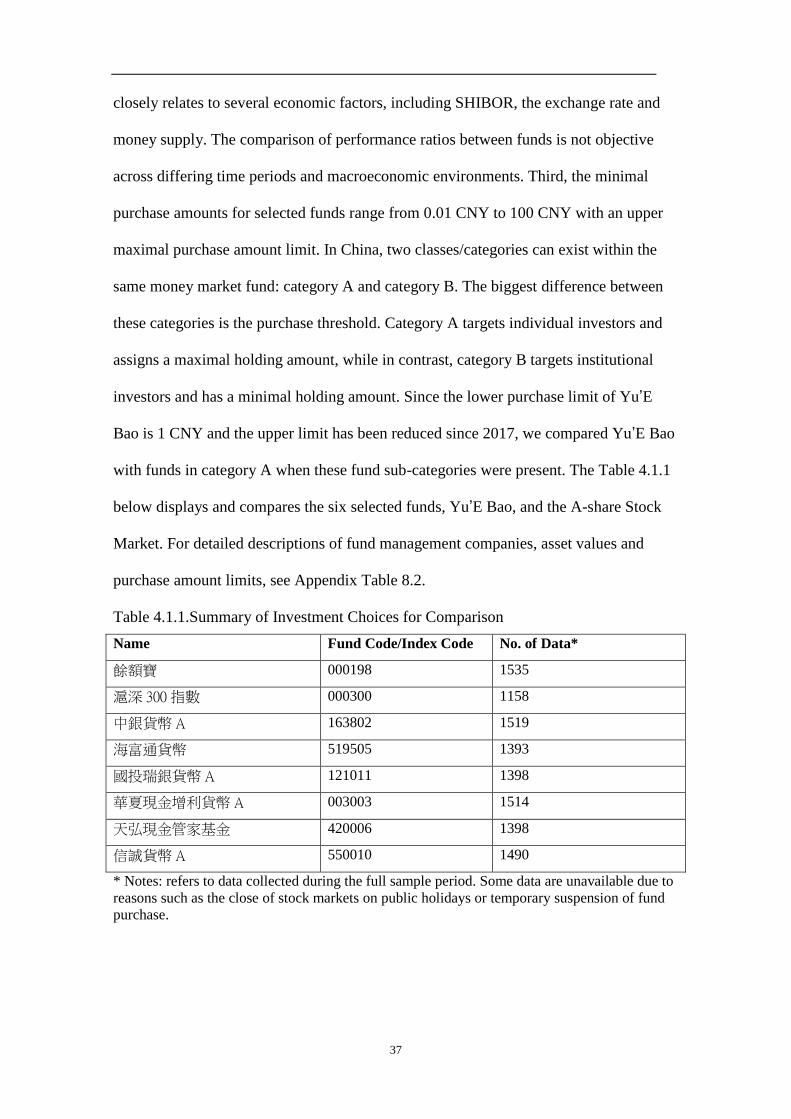
with funds in category A when these fund sub-categories were present. The Table 4.1.1
below displays and compares the six selected funds, Yu’E Bao, and the A-share Stock
Market. For detailed descriptions of fund management companies, asset values and
purchase amount limits, see Appendix Table 8.2.
Table 4.1.1.Summary of Investment Choices for Comparison
Name Fund Code/Index Code No. of Data*
餘額寶 000198 1535
滬深 300 指數 000300 1158
中銀貨幣 A 163802 1519
海富通貨幣 519505 1393
國投瑞銀貨幣 A 121011 1398
華夏現金增利貨幣 A 003003 1514
天弘現金管家基金 420006 1398
信誠貨幣 A 550010 1490
* Notes: refers to data collected during the full sample period. Some data are unavailable due to
reasons such as the close of stock markets on public holidays or temporary suspension of fund
purchase.

38
The Choice of Sub-Time Frames
As discussed in the Data session, our full sample study period is from May 30 2013 to
Feb 13 2018. To see how Yu’E Bao and other money market fund performed during the
time when abnormal fluctuations and volatility occurred in stock market, we further
divided the study time periods into four shorter timeframes:
- First period: May 30, 2013 - May 29, 2015
- Second period: May 30, 2015 - Feb 13, 2018
- Stock Crash Time: May 29 2015 - Feb 29 2016
- Post-Crisis Time: March 01 2016 - Feb 13 2018
The cut-off point is the China Stock Crash in 2015. During the June 2015 to Feb 2016,
China stock market fluctuated dramatically. On the single “Black Monday” August 24
2015, Shanghai Stock market fell by 8.48% and Shenzhen main index fell 7%, leading
to a largest plunge since 2007(The New York Times, 2015). A few government
responses include suspension of scheduled Initial Public Offering (IPO),
implementation of circuit breaker29
in January 2016, interest rate cut and etc.
Definitions of relevant terms
Closing Price (for CSI 300 Index): the final price of a security at which it is traded on a
given trading day. Closing price thus represents the latest valuation of a security until
trading begins on the next trading day.
29
Circuit breaker, also called trading curb or “collars”, refers to the mechanism that transactions will be
halt temporarily if the prices hit pre-defined threshold. 5% and 7% are two thresholds applied in China
stock market.

39
7-Day Annualized Return Rate (for all money market funds): the average return level of
the money market fund over the past 7 days. The data obtained after the annualization
and is a reflection of the fund's profitability.
Since the data exported are on daily basis and we adjusted it as follows:
For the return of CSI 300, the weekly return is calculated by:
Where
is the weekly return of CSI300 Index at the time t,
is the closing price at the time t
Considering that market may close due to public holidays or other reasons, calculation
is on the trading days’ basis instead of calendar days to avoid ambiguity.
For the return of Yu’E Bao and other money market funds, the weekly turn is calculated
by:
( )( )
Where
is the 7-day annualized return for money market funds
is the weekly return for these products

40
4.1.2. Empirical results and analysis
Sharpe Ratios
Table 4.2.2 and Figure 4.2.2 display the results of Share ratios. There are three major
findings in terms of Sharpe ratios. Firstly, using China demand deposit rate as the risk-
free rate, stock market generally has a lower value of Sharpe ratios, or even negative
ones during the crisis time, than the money market funds. This implies that for every
unit of extra risk taken, investors may not receive a higher return but even suffer loss.
While in the case of money market funds, the positive values represent less downside
risk, which is the possibility that the actual return being lower than the expected one and
investors suffer from loss when the market condition is not good. We consider
difference in Sharpe ratios is related to different investment natures between equity and
mutual funds. For the stock market investment, it is commonly characterized “high risk,
high return”. In contrast, mutual funds usually can diversify risks through asset
allocations and it offers professional management to the investors, which make money
market funds more attractive for investors who cannot bear much risks and lack of
professional knowledge in stock market.
Secondly, for the comparison among different money funds, we find that Yu’E Bao is
not always the “Best performer” among all the seven money funds in terms of Sharpe
ratios. However, for all six time periods, Yu’E Bao outperformed at least half of rest
funds, ranking top 3 among six funds constantly. This implies that during our study
periods, the return from investing in Yu'E Bao and bearing risks is relatively stable and
higher.

41
Thirdly, regarding the performance of a single fund, we find that the Sharpe ratios
fluctuated a lot in different market conditions. In the first two years' of development,
Yu’E Bao carried a Sharpe ratio of 5.63 while in the most recent two and a half years,
Sharpe ratio decreased to around 4.40. In addition, this ratio is even higher when the
stock market was experiencing a decline, reaching 7.14 during 2015 China stock crash.
This means that during the crisis, investors even received higher return for the same unit
of risk they undertook.
Similar unexpected higher Sharpe ratios during crisis time also exist in other six money
funds. Based on the calculation formula,
( )
√ ( )
We found that the higher Sharpe ratios result from relatively smaller value in
dominator, which is the standard deviation of the return √ ( ), instead of a larger
value of numerator, expected excess return ( ). This led us to think that during
stock crisis time, even though people generally held a lower expectation of return from
investment, Sharpe ratio might be even higher due to less volatility in return. Detailed
calculation results for each investment product will be provided in Appendix Table 8.3.

42
Table 4.1.2 Summary of Sharpe Ratios Time
CSI 300 Index Yu'E Bao 中銀貨幣 A 海富通貨幣 國投瑞銀貨幣 A 華夏現金增利 A 天弘現金管家 信誠基金
Full sample period 0.0745 3.5040 3.3375 3.5176 3.2052 2.8811 2.9467 2.6003
13/05/30 -15/05/29 0.2302 5.6351 5.0493 4.9440 4.9531 4.8451 4.3647 3.1981
15/05/30 -18/02/13 -0.0335 4.3677 4.4998 4.0157 3.3995 3.3754 3.2373 3.9296
Stock Crash -0.2188 7.1422 9.5188 4.6793 3.6196 10.7038 3.9319 6.1009
Post-Crisis Time 0.1771 4.0926 4.1020 3.8506 3.4597 2.9277 3.3847 3.6842

43
4.2. Third and fourth moment: shape of the distribution
Previous analysis based on CAPM is subject to the two crucial conditions. First, the
return rate of each investment product is normally distributed. Second, investors are
only concerned with the first two central moments of the probability distribution of the
return: the average return rate and the variance of return. In these settings, the best
option to maximize their utility lies on in “mean-variance frontier”. However, in reality,
these conditions might not always be met. Literatures related to fund performance
assessment have found that the return of portfolio is not always normally distributed
(Cambell and Hentschel, 1992) and Leptokurtic problems30
exist in return distribution
(Hsu, Ou and Ou, 2012).
For this reason, we included the third and fourth moments in the empirical studies and
with the aid of Excel, we drew the distribution curve to visually compare the
distributions of return.
Third moment: Skewness
The third moment, skewness, is the measure of the degree of asymmetry of the
distribution around the mean. Skewness is calculated by:
∑ ( )
Where is the mean value, is the cubed standard deviation, and is the number of
data points. Normal distribution has a skewness value of 0. A negative value of
skewness indicates that there is a long tail in the negative direction and data distribution
30
A Leptokurtic problem means that the distribution tends to be more peaked and fatter tailed than
normal distribution.

44
is skewed to the right. In contrast, a positive value of skewness indicates that there is a
long tail in the right direction and data distribution is skewed to the left.
Fourth moment: Kurtosis
The fourth moment, kurtosis, is a measure of the peakedness of a distribution, whether it
is more or less peaked than normal distribution. Kurtosis is calculated by:
∑ ( )
A normal distribution has a kurtosis has value of 3. A kurtosis value less than 3
indicates a “light tailed distribution”, producing a relatively flat distribution and is said
to be “platyurtic”. A kurtosis value greater than 3 indicates a “heavy tailed distribution”,
producing a relatively peaked distribution and is said to be “leptokurtic”.
To better equip our analysis of money fund performance, we further investigated
previous studies on the relationship between third and fourth moments of investment
products’ performance and investors’ preference. We found that the discussion on
skewness has already been hotly debated for a few decades and the results and opinions
greatly vary. Francis (1975) is the first to question whether it is important to include
skewness parameters in investors’ decision-making process. Based on empirical
evidence, Francis (1975) claimed investors actually do not consider skewness in stock
market investment. On the other hand, it has been suggested by many other scholars that
risk-averse investors should prefer investments displaying positive skewness (Arditti,
1967; Jean, 1971). Recent research on hedge fund skewness and subsequent investment
flows into and out of hedge funds found that investors do include skewness in the
evaluation of historical performance of hedge funds and this contributes to better ex-
ante fund selections. Additionally, the returns for inflows into hedge funds with positive

45
skewness grow by 11.5% more annually than hedge funds with negative skewness
(Heuson, Hutchinson and Kumar, 2012).
In contrast, investors’ preference for positive kurtosis can be more intuitively
interpreted. Darlington (1970) stated that, at a given variance, kurtosis can be used to
describe the dispersion of the observations from the average. Thus, it measures the
possibility of extreme outcomes, or the extent to which investors may garner either
extreme loss or gains. Later studies provided evidence to risk-adverse investors’
preference for positive kurtosis (Dittmar, 2002; Agarwal, Bakshi Huij, 2008).
Unfortunately, most existing theories and studies about skewness and kurtosis problems
center on equity and hedge fund investment and little are related to the focus of our
study: money market funds. Considering that some features of money funds and hedge
funds greatly differ31
, we did not directly employ these theories to interpret and
compare the third and fourth moment performance of money market funds.
In addition, considering that our primary research interest lies in Internet Finance
development and the implications on the Chinese financial system, we left the problems
related to parameter selections and possible data transformation processes in Sharpe
ratio model for future research. Instead, we provide graph illustrations of the
distributions and statistical results as shown in the Appendix Figure 8.4. More
suggestions for future research are mentioned in Part Seven: Conclusions and
recommendations for future research.
31
Hedge funds sometimes can be aggressively managed and are only open to a few “accredited”
investors. In addition, the management fee for hedge funds is much higher than that for money market
funds. The primary goal of investing in hedge fund is to outperform the market.

46
5. Economic Interpretations and Further Analysis
In this section, we first interpret the empirical results and address our first research
question: Has Yu’E Bao actually outperformed the market and other alternative
investments? If not, what major factors have inspired its popularity among Chinese
investors? Then, we use Yu’E Bao as a representative of money market funds and
China’s Internet Finance development to further extend our discussion to the second
research question: What implications can we draw from this development and what
changes may Internet Finance bring to China’s traditional financial system?
Based on a single-criteria “Risk-to-Reward” analysis, we find that during our study
period, Yu’E Bao had a higher Sharpe ratio than stock market investment. Compared to
the other six selected money funds, the performance of Yu’E Bao is more stable in the
sense that its Sharpe ratios are higher than at least half of six similar money funds, all in
the same time period. This finding drives us to characterize the performance of Yu’E
Bao as “more stable”. In addition, we find that during the crisis, money funds show
even higher Sharpe ratios even though stock market investors might suffer great loss.
However, we do not hold the direct interpretation that “it is a higher Sharpe ratio alone
that leads to the popularity of Yu’E Bao among investors,” because investors may have
different investment preferences, and other indicators also affect the evaluation of its
performance. In fact, we have identified other crucial factors contributing to the
popularity of Yu’E Bao and the rapid development of money market fund products in
general.

47
First and foremost, China’s household saving rate has been quite high for a long time,
providing the basis for the most direct source of money for money market fund
investment. As shown in the Figure 5.1, around half of GDP is saved in China (Red
solid line in Figure 5.1), both among individual households and at firms. Regarding
households, national rural-urban adjusted data from National Bureau of Statistics of
China reveals that households saved more than 40% of earnings (Song and Xiong,
2017).
Figure 5.1 Saving and Investment figure
Source: Data source: China Statistical Yearbook
Many studies have been conducted to analyse the underlying reasons for such a higher
saving ratio.32
Some explanations include, the changes in population policies and
32
A few classical models applied include Keynesian absolute-income hypothesis, Modigliani-Brumberg’s
life-cycle theory, and Friedman’s permanent-income hypothesis. For details, see Qian (1988) and Yang
(2012).

48
subsequent structural change in demography, imbalanced sex ratio, the on-going and
incomplete transition from public-provided housing, education, and healthcare to
private provision, and so on. One recent study on household finances in China
compared with U.S household finances development situation33
finds that the higher
wealth-to-income ratio in China is driven by investor preference parameters and
institutional parameters. That is, Chinese investors tend to be more patient than those in
the U.S. and this characteristic is believed to be related to the long agriculture
development traditions in China. Additionally, China’s labour market is riskier with a
higher level of uncertainty. More variable income changes34
and a low consumption
floor35
motivate China’s households to maintain more in precautionary savings (Cooper
and Zhu, 2018). Thus, we think that the popularity of Yu’E Bao and large volume of
assets under management of the money market fund is closely related to investors’ high
saving ratios and disposable income. When a “cash-equivalent” investment product,
with near-intense liquidity but bringing a much higher interest than bank deposits,
comes into the market, it provides a channel for Chinese investors to spend their large
amount of accumulated savings.
Second, the popularity of Yu’E Bao is closely related to the less desirable performance
of other investment alternatives. In this study, we consider stock market investment as
the major alternative choice. China’s stock market is frequently described as “a casino
driven by speculations rather than end-investment” (Elliott and Yan, 2013). The term
“speculation” refers to the investors’ behaviour in purchasing a certain group of stocks
33
See Cooper and Zhu(2018) Household Finance in China, NBER Working Paper No. 23741 34
Variable income refers to uncertainty in the future revenue and it is often related to unpredictability and
instability of changes. 35
Consumption floor refers to the expected level of lowest consumption and it is an indicator of a
country’s social safety net.

49
which they believe will soon increase, spurring other investors to pay a higher price for
it. With little regard to the underlying value of the firms, the primary aim of speculation
is to make quick money rather than profit from long-term investment (Song and Xiong,
2017). Thus, the turnover rate36
is a direct reflection of speculative behaviours in the
market. Figure 5.2 illustrates the volatility of China’s A-share market and high turnover
rate.
Figure 5.2 Shanghai Stock Exchange Composite Index and Monthly Market Turnover Rate
Note: The Shanghai Stock Exchange Composite Index uses the right y-axis, while the
monthly market turnover rate uses the left y-axis.
Source: Song and Xiong (2017)
Regarding the Sharpe ratios, the major measurement of investment performance used in
our study, previous studies on China’s stock market return show a high mean return and
a high standard deviation37
. Recent research by Cooper and Zhu (2018) compares stock
market performances between China and the U.S. and report a 10.07% average return
with a standard deviation of 0.47 in China, while the U.S. experiences a 6.33% average
36
Turnover rate is calculated by dividing the total amount of shares traded in one period by the average
amount of shares outstanding. It measures the trading volume and liquidity of stock markets. 37
Fang, Gu, Xiong and Zhou (2015) reported a 7.3% average stock market return and a standard
deviation of 0.0515 during the year 2003-2013. For details, see “Demystifying the Chinese Housing
Boom," Working Paper 21112, National Bureau of Economic Research.

50
return with a standard deviation of 0.155. The authors argued that a lower risk-adjusted
return together with stock adjustment, high cost of stock market participation, and a
high variability in returns, shows that China’s stock market is still underdeveloped.
In short, we believe that the popularity of Yu’E Bao and other money funds is not only
attributable to the attractiveness of this single group of products itself but is also closely
related to the performance of the market alternatives and the availability of investment
products in the current market. We might expect a change if China’s stock market were
to make fundamental and significantly improvements, if Chinese investors were to
become more knowledgeable of the stock market or if other new, breakthrough
investment products were to appear in the market.
Relevant technological developments also contribute to Yu’E Bao’s superior popularity.
One major advantage Yu’E Bao holds over other money funds is that it is based on
Alipay, a leading digital payment platform developed by Chinese Internet giant,
Alibaba. Investors can freely access their Yu’E Bao’s account balance and use it as cash
in daily life through Alipay, which seems impossible for money funds provided by
traditional banks or those that can currently only be redeemed online. We also have
observed the rapid development of other money funds based on another Internet giant,
Tencent and their WeChat digital payment platform.38
Here, we draw the conclusion for our first research question regarding the popularity of
Yu’E Bao and other money funds: First, high saving ratios provide sufficient money for
Chinese investors to put in Yu’E Bao accounts and it is the basis of the large volume of
38
South China Morning Post (Jan 4 2015)“Tencent gets a licence to sell mutual funds to WeChat’s 1
billion users in China” Available at http://www.scmp.com/business/companies/article/2126876/tencent-
granted-licence-sell-mutual-funds

51
assets managed by China’s money fund markets. Second, the relatively underdeveloped
stock market with high volatility and a lower ratio risk-adjusted return leads to a lower
participation from Chinese investors. Therefore, Yu’E Bao and other money funds
become a more attractive investment choice. Thirdly, the combination of Internet
technology and a digital payment platform further boosts the popularity of Yu’E Bao.
Before moving on to the second research question regarding the impacts of money
market funds on financial system, we intend to provide some background information
on China’s financial system to facilitate our interpretation. For a long time, in contrast
to the U.S. and U.K., China’s financial system has been described as a “bank-based”
system instead of “market based” (Chan, Fung and Thapa, 200639
). In China, bond
financing and equity financing make up only one-fifth of the total credit for non-
financial institutions. Meanwhile, state-owned banks contribute more than 40% of total
bank deposits (Song and Xiong, 2017). In addition, the Chinese government has been
playing an active role in the country’s economic development and financial system
reform (Elliott and Yan, 2013). In this setting, we believe Yu’E Bao, or other Internet
Finance products, influences China’s financial system in four major ways.
First, the sheer size of assets managed under money market funds may take away some
bank deposits and therefore, have an impact on bank profitability and operation.
Additionally, the major business of China’s commercial banks is absorbing deposits and
offering loans; as a result, the primary source of profit is the spread between the deposit
39
In a bank-based financial system, as the case in Germany, banks play a crucial role in capital allocation,
saving mobilization, and risk management. In contrast, in a market-based financial system, such as the
financial system in the U.S., securities markets play a leading role in firms financing, corporate
governance, and risk management. The comparison between these two systems has been debated for a
long time under two disciplines, development economics and corporate finance. For details, See
Demirgüç-Kunt, Levine (1999)
52
rate and lending rate. If a substantial amount of money is moved from bank deposits to
money market funds, or other Internet Finance products such as P2P lending, the
decrease in deposits may greatly affect banks’ lending ability and thereby its
profitability. The case might be even worse before the removal of “loan-to-deposit
ratio” limit in June, 2015.40
Second, we believe that, to some degree, money market funds will help to increase
bank’s lending ability. Over 50% of the assets of Yu’E Bao or other money funds are
invested in “cash equivalents”, which are predominately negotiable deposits. Since a
negotiable deposit, unlike a retail deposit, is not subject to China’s high bank reserve
requirement ratios, negotiable deposits between banks and money market funds extend
banks’ lending ability to some extent.
Third, we think development of money market funds will not fundamentally challenge
China’s banking sector in the short-term. We observed more regulations and
supervision from China’s government officials, such as China Securities and Regulatory
Commission (CSRC) and The People’s Bank of China (PBoC) over money funds’
reserve ratio and liquidity risk. Currently, Yu’E Bao’s assets are said to have been fully
compliant with the guidelines on bank deposits (Caixin, 2018) and all money market
funds have been included in the PBoC M2 money supply statistics. This shows that the
development and movement of money funds is under scrutiny and control of Chinese
government.
40
“Loan-to-deposit ratio” is a big administrative restriction, prohibiting commercial banks from lending
more than a predefined percentage of deposits.

53
Last, we consider the general impacts of Yu’E Bao-like Internet Finance products on
China’s traditional financial system and especially the banking sector in two major
aspects: the use of payment platforms and the process of interest rate liberalization and
financial reform. For the first aspect, the wide use of convenient online digital payment
platform isolates the transaction and consumption information from the banks and also
leads to a deduction of bank’s non-interest income (Zhang and Zhou, 2015). For the
second aspect, different Internet Finance business models and their popularity in China
have reflected consumers’ price preference for both the demand and the supply. For a
long time, the greatest comparative advantage of Chinese commercial banks lies in their
low cost of lending; this has already caused the problems of shadow banking41
and a
large volume of Non-Performing Loans (NPL) in the Chinese financial system. More
competition brought by Internet Finance developments such as money market funds and
P2P platforms has already helped to decrease the spread between lending and borrowing
rates and thereby accelerate the interest rate marketization in letting the rates be
determined by market demand and supply. In addition, more competition helps to
improve efficiency of bank operations and together with the deleveraging scheme,42
helps to accelerate banking sector reform. Due to time and space limitations, we are
unable to discuss this impact in detail even though it deserves further discussion.
41
The Shadow banking system refers to non-bank financial intermediaries that have the same functions of
as traditional banks but are subject to little banking regulations. 42
Deleverage is the attempts to decrease financial leverage, reducing the level of debt. For details, see
Bouis, R., Christensen, A. K., & Cournède, B. (2013); For China’s deleveraging details, see Zhang and
Chang (2017).

54
6. Limitations
There were several limitations in our studies. First of all, the short time span of the
study limits the sample size. During our study period, between 2013 and 2018, China’s
stock market experienced great fluctuations and Sharpe ratios may be affected by stock
market rallies and falls within our sample period. This might affect the accuracy of our
comparison between money market funds and stock investment.
The second limitation of our study is the lack of available data and public information.
Unfortunately, we could hardly find more information on bank deposits counterparts
and Yu’E Bao’s investment details in securities is unavailable to the public. Through a
recent study on Yu’E Bao, we find some indexes, such as CSI money fund index and
WIND index of monetary funds. It is possible that these two indexes are closely related
to the overall market performance of China’s money market funds and can be used as a
benchmark for us to evaluate the performance of Yu’E Bao against the whole market.
However, as this paper is written, little information on these two indexes is available to
the public.
Also, some limitations exist in our use and application of original Capital Assert Pricing
Model (CAPM) and Sharpe Ratio. To list a few: 1) the traditional CAPM is based on
the historical performance of an asset and uses historical average data to predict future
return. However, past performance might not always be a suitable indicator for future
performance; 2) its underlying assumption of zero transaction cost and no taxes hardly
validate in reality and these factors do affect investors’ behaviours; 3) it assumes that
there are risk-free assets that investors can borrow unlimitedly, while in fact, even
government debt carry some risks; 4) Sharpe Ratio uses the standard deviation of the

55
return to measure the return volatility and it assumes that the return is normally
distributed. It does not distinguish the upside and downside fluctuations. So, it is
possible that at the same level of standard deviation of the return, investors may suffer
great loss, considering the skewness and kurtosis in the distribution of the return
(Copeland et al. 2005; Sharifzadeh, 2005).
.

56
7. Conclusions and Suggestions
In this session, we first conclude our findings in an empirical analysis and summarize
our previously discussed interpretations. Then, recognizing the limitations of our
studies, we provide recommendations for future research.
Based on Sharpe ratios calculation results, we find that, generally speaking, money
markets funds have better performance than the China A-Share market during the years
2013 to 2018, showing a higher risk-adjusted return. Yu’E Bao does not always have
the highest Sharpe ratios among all seven money funds in all the analysed time periods.
However, its performance is relatively stable and better than average. We also link the
popularity of Yu’E Bao with its developed payment platform, Alipay as a part of
Alibaba, an Internet and technology giant in China. Furthermore, we argue that the
overall large share of money market funds is closely related other factors, including
households’ high saving ratios and relatively poor performance of the alternative
investment mechanism, China’s stock market.
Further, we consider the impacts of money market funds on the banking sectors in two
ways. By taking away some bank deposits, the surge of money market funds leads to a
decrease in bank’s lending ability. At the same time, the “cash equivalents” in the
money market funds’ assets extend banks’ lending ability through negotiable bank
deposits, which are not subject to bank reserve requirement ratio.
In the foreseeable future, we expect that the rise and development of money market
funds will not bring a fundamental challenge to the traditional banking sector in China,
given that more regulations and control have been implemented by Chinese officials

57
and government has been played a crucial role in China’s financial system and
economic development. However, from a long-term perspective, we believe that money
market funds, along with other forms of Internet Finance, helps to increase market
competition and add weight to the role of market demand and supply in deciding the
interest rates. Along with other reforms, such as de-leveraging, Internet Finance
development accelerates the process of reforms in banking sectors and interest rate
liberalization.
Regarding the possibility of future research, we recommend two directions to pursue.
First, since we find that skewness and kurtosis exist in the distributions of the return of
money market funds and most current researches focus only on the hedges funds and
equity, we believe it is interesting to further analyse the relationship between skewness
and kurtosis of the return of money market fund and investors’ behaviours.
Second, we recommend future study on the impacts of Internet Finance on China’s
financial system, traditional banking sector, and the process of interest rate
liberalizations, especially in the forms of quantitative analysis.

58
8. Appendix
Table 8.1 Data Source
Data: Source:
CSI 300 Closing Price Bloomberg
Yu’E Bao Bloomberg
Demand Deposit Rate Bloomberg
PBoC 3-Month Deposit Benchmark Rate Bloomberg
中銀貨幣 A WIND
海富通貨幣 WIND
國投瑞銀貨幣 A WIND
華夏現金增利貨幣 A WIND
信誠貨幣 A WIND
Table 8.2 Information on Money Market Funds
Name* Company Total Asset(In
millions)#
Maximal
Subscription
Amount(in
millions)
Yu’E Bao
Tianhong Asset
Management Co.,
Ltd.
157,983,239.6376
Daily aggregate
subscription amount
applied
中銀貨幣 A
Bank of China
Investment
Management Co.,
Ltd
43,033.3286 1,000^
海富通貨幣 Haitong Investment
Management Co.,
Ltd.
64,228.0283 500
國投瑞銀貨幣 A UBS SDIC Fund
Management
Co.,Ltd.
191,619.7119 30,000^
華夏現金增利貨幣
A
China Asset
Management
Co.,Ltd.
3,033,659.0537 100 per person per
day; 500 in total
天弘現金管家基金 Tianhong Asset
Management Co.,
Ltd.
33,388.2283 500
信誠貨幣 A CITIC-Prudential
Fund Management
Company Ltd.
21,785.3475 500
Notes:
* Original Chinese names are presented if official English translations are unavailable #
As of December 31, 2017
^ Limits on the total number of subscriptions for Category A and Category B

59
Table 8.3 Sharpe Ratios Calculation Results Full sample period: May 30, 2013 - May 29, 2015
CSI 300 Yu’E Bao 中銀貨幣 A 海富通貨幣 國投瑞銀貨幣 A 華夏現金增利貨
幣 A 天弘現金管家 信誠貨幣 A
( ) 0.29104% 0.06570% 0.05780% 0.06236% 0.06081% 0.06404% 0.05900% 0.06215%
√ ( ) 0.0390836 0.0001874 0.0001732 0.0001775 0.0001897 0.0002236 0.0002002 0.0002390
Shape Ratio 0.0744665 3.5040000 3.3375157 3.5137003 3.2052376 2.8644665 2.9467449 2.6002974
May 30, 2013 - May 29, 2015
CSI 300 Yu’E Bao 中銀貨幣 A 海富通貨幣 國投瑞銀貨幣 A 華夏現金增利貨
幣 A 天弘現金管家 信誠貨幣 A
( ) 0.86919% 0.08250% 0.07335% 0.07507% 0.07388% 0.08433% 0.07289% 0.07876%
√ ( ) 0.0377609 0.0001464 0.0001453 0.0001513 0.0001492 0.0001742 0.0001670 0.0002463
Shape Ratio 0.2301839 5.6350000 5.0493317 4.9623358 4.9531194 4.8421162 4.3647166 3.1980745
May 30, 2015 - Feb 13, 2018
CSI 300 Yu’E Bao 中銀貨幣 A 海富通貨幣 國投瑞銀貨幣 A 華夏現金增利貨
幣 A 天弘現金管家 信誠貨幣 A
( ) -0.13236% 0.05590% 0.04788% 0.05313% 0.05121% 0.05136% 0.04879% 0.04912%
√ ( ) 0.0395182 0.0001280 0.0001064 0.0001323 0.0001506 0.0001522 0.0001507 0.0001250
Shape Ratio -0.0334926 4.3680000 4.4997712 4.0156940 3.3995060 3.3743970 3.2373222 3.9295806
Stock Crash Time: May 29 2015 - Feb 29 2016
CSI 300 Yu’E Bao 中銀貨幣 A 海富通貨幣 國投瑞銀貨幣 A 華夏現金增利貨
幣 A 天弘現金管家 信誠貨幣 A
( ) -1.44662% 0.05230% 0.04645% 0.05163% 0.04548% 0.05476% 0.04008% 0.04465%
√ ( ) 0.0661212 0.0000732 0.0000488 0.0001103 0.0001257 0.0000512 0.0001017 0.0000732
Shape Ratio -0.2187833 7.1420000 9.5187690 4.6792550 3.6195619 10.7038028 3.9392307 6.1009418
Post-Crisis Time: March 01 2016 - Feb 13 2018
CSI 300 Yu’E Bao 中銀貨幣 A 海富通貨幣 國投瑞銀貨幣 A 華夏現金增利貨
幣 A 天弘現金管家 信誠貨幣 A
( ) 0.36287% 0.05700% 0.04832% 0.05371% 0.05337% 0.05029% 0.05210% 0.05339%
√ ( ) 0.0204900 0.0001393 0.0001178 0.0001395 0.0001543 0.0001718 0.0001539 0.0001449
Shape Ratio 0.1770981 4.0930000 4.1019158 3.8506482 3.4596578 2.9265965 3.3847290 3.6841615

60
Figure 8.4 Distributions of the Money Market Funds’ Weekly Return

61
Note: Excel's KURT( ) function computes the excess kurtosis, not
the kurtosis. Excess kurtosis = kurtosis – 3

62
9. References
Allen, F., Qian, J., & Qian, M. (2007). China's financial system: past, present, and
future.
Allen, F., Qian, J., Shan, S. C., & Zhu, L. (2014). The best performing economy with
the worst performing market: Explaining the poor performance of the Chinese stock
market.Shanghai Advanced Institute of Finance Working Paper.
Allen, F., Qian, J., Zhang, C., & Zhao, M. (2012). China's financial system:
opportunities and challenges (No. w17828). National Bureau of Economic Research.
Bai, J. (2016). Researches upon the Factors of Yu-Ebao Returns and Its
Prediction (Unpublished master's thesis). Southeast University..
Bouis, R., A. Christensen and B. Cournède (2013), "Deleveraging: Challenges, Progress
and Policies", OECD Economics Department Working Papers, No. 1077, OECD
Publishing, Paris, http://dx.doi.org/10.1787/5k4221459fjc-en.
Chan, H. H. (2017). Yu'e Bao: A Double-Edged Sword for Financial Innovation.
Retrieved from https://ippreview.com/index.php/Blog/single/id/434.html
Chen, X. (2014). Research on risk management of Yu’e Bao (Unpublished master's
thesis). China Ocean University.
Chen, Y., Pang, J., & Zhang, W. (2018). A Study of Volatility and Externality
Compensative Return of Internet Financial Products in the Case of Yuebao. Emerging
Markets Finance and Trade, 54(4), 761-773.
Cooper, R., & Zhu, G. (2017). Household Finance in China(No. w23741). National
Bureau of Economic Research.
Copeland, Thomas E.; Weston, J. Fred; Shastri, Kuldeep (2005): Financial theory and
corporate policy. 4th ed. Boston MA: Addison-Wesley (The Addison-Wesley series in
finance).

63
Demirgüç-Kunt, A., & Levine, R. (1999). Bank-based and market-based financial
systems: Cross-country comparisons.
Elliott, D. J., & Yan, K. (2013). The Chinese financial system: An introduction and
overview. Brookings Institution.
Financial Statistics Report, January 2018. (The People’s Bank of China). Retrieved
from http://www.pbc.gov.cn/english/130721/3484553/index.html
Irwin, N. (2015, July 06). How to Make Sense of China's Plummeting Stock Market.
Retrieved from https://www.nytimes.com/2015/07/07/upshot/how-to-make-sense-of-
chinas-plummeting-stock-market.html
Jingu,T (2014) Internet Finance growing rapidly in china. Nomura Research Institute.
Retrieved from
https://www.nri.com/~/media/PDF/global/opinion/lakyara/2014/lkr2014189.pdf
Lintner, J. (1965). Security prices, risk, and maximal gains from diversification. The
journal of finance, 20(4), 587-615.
Loubere, N. (2017). China’s Internet Finance Boom and Tyrannies of Inclusion. China
Perspectives, 2017(2017/4), 9-18.
Mehran, H., Laurens, B., & Quintyn, M. (Eds.). (1996).Interest Rate Liberalization and
Money Market Development. International Monetary Fund.
Sharifzadeh, M. (2006). An Empirical and Theoretical Analysis of Capital Asset Pricing
Model. Yayınlanmamış Doktora Tezi, Walden University.
Sharpe, W. F. (1964). Capital asset prices: A theory of market equilibrium under
conditions of risk. The journal of finance,19(3), 425-442.
Shaw, E. S. (1973). Financial deepening in economic development. New York: Oxford
University Press.

64
Shen, Y., & Huang, Y. (2016). Introduction to the special issue: Internet Finance in
China.
Song, Z. M., & Xiong, W. (2018). Risks in China’s financial system.
Tianhong Yu’E Bao money market fund 2017 Q4 Report (Rep.). (2018, January 19).
Retrieved http://cdn-thweb.tianhongjijin.com.cn/fundnotice/11yuebao_1.pdf
Xiao, Hong.(2016). Money Market Fund, Liquidity of Commercial Bank and Interest
Rate Liberalisation (Unpublished master's thesis) Southernwest University of Finance
and Economics
Xiaojing, Z., & Xin, C. (2017). Deleveraging: Data, risks and countermeasures *. China
Economist, 12(1), 2-37. Retrieved from
https://search.proquest.com/docview/1859708611?accountid=11440
XiaoXia, L. (2015). Measure of the Risk of Yuebao Based on VaR-GARCH Model and
Its Prevention. Journal of Nanjing University of Finance and Economics, 3, 006.
Xiong, W. (2018). Risks in China’s financial system (No. 1/2018). Bank of Finland,
Institute for Economies in Transition.
Zhang, C., & Zhou, Y. (2015). Internet Finance in China: An Event Study of Yu'e
Bao (Unpublished master's thesis). Stockholm School of Economics. Retrieved from
http://arc.hhs.se/download.aspx?MediumId=2740
何建敏, & 白潔. (2015). 基於 EEMD-VAR 的餘額寶收益率影響因素研究. 現代財
經: 天津財經學院學報, (8), 80-89.
劉冬青. (2014). 基於線性回歸模型的餘額寶價值分析. 哈爾濱商業大學學報: 社會
科學版, (5), 47-54.
蔣玥. (2015). 餘額寶的收益影響因素以及風險分析. 金融經濟: 下半月, (12), 178-
180.

65
趙紅, & 姬健飛. (2017). 餘額寶收益率對我國商業銀行理財產品收益率的影響研
究. 河北經貿大學學報, 38(3), 65-71
陳耀輝, & 白蘭. (2017). 基於貝葉斯分位元數回歸模型的餘額寶收益風險分析. 長
江大學學報: 社會科學版, (3), 82-90.
陸敬筠, 薛卓之, & 周奇. (2015). 銀行同業拆借利率對餘額寶收益率影響的實證研
究. 征信, (2015 年 11), 71-74.


![from Jingu - せんぐう館2014/12/21 · 参 宮 み や げ 平成25 年 9・25[水]-12・23[月] a souvenir from Jingu TOKUSU 開 館 時 間 九 時 ~ 十 六 時 半 休](https://img.dokumen.tips/doc/110x75/60edac80a0d4de0bf2674310/from-jingu-e-20141221-25-9i25i12i23oe.jpg)