Embed Size (px)
Citation preview

iRIi 8846 PLEASE DO Nar REMOVE FRG1 LIBRARY
Bureau of Mines Report of Investigations/1984
Evaluation of Methods for Recovering Potash From Carnallite Ore
By D. G. Foot, Jr., and J. L. Huiatt
UNITED STATES DEPARTMENT OF THE INTERIOR
Report of Investigations 8846
Evaluation of Methods for Recovering Potash From Carnallite Ore
By D. G. Foot, Jr., and J. l. Huiatt
With an Economic Evaluation by D. A . Kramer
UNITED STATES DEPARTMENT OF THE INTERIOR
William P. Clark, Secretary
BUREAU OF MINES
Robert C. Horton, Director
Library of Congress Cataloging in Publication Data:
Foot, D. G. (Donald G.) Eva luati on of methods fo r recover in g potash from carna l lire ore .
( Report of in ves ti ga ti ons; 8846)
Includes bibliographical re fere nces .
Supt. of Doc s . no . : I 28.23 :8846 .
1. P o ta s h. 2. Carn a llite . 3. F lota ti on. [. lJu ia rr, J. L. [I. T i· tl e . II[. Series: Repor t of investigations (United Stares . Bureau o f Mine s ) ; 8846 .
TN23.U43 [TN919] 622s [622' .36 361 83·600310
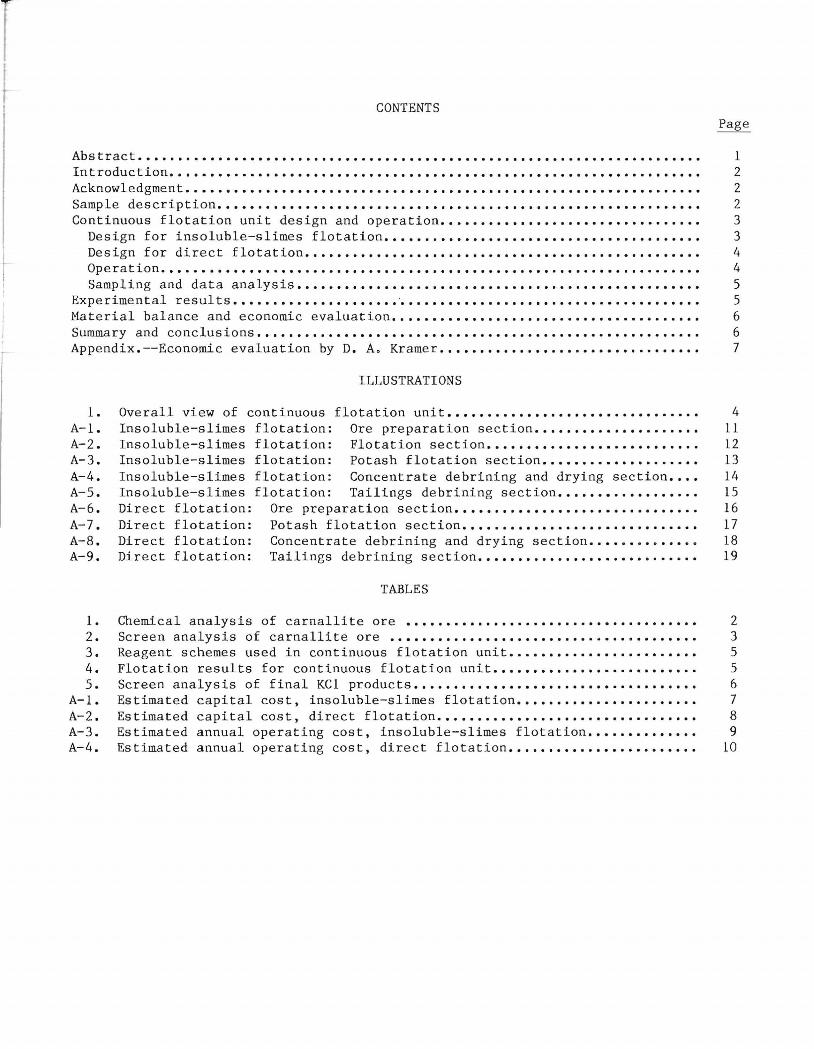
CONTENTS
Abs tract ••••••. Introduction ••• Acknowledgment .....•......•....•.......• Sample description........................ • ••.•. Continuous flotation unit design and operation •••••••••
Design for insoluble-slimes flotation... . ••••••••• Design for direct flotation............. • ••••••••• Operation •••.••••••••••••••.•••.•.•••••• Sampling and data analysis ••••••••••••••
Experimental results ••••••••••••••••••••• '. Material balance and economic evaluation •• Summa.ry and conclusions................... . .................. . Appendix.--Economic evaluation by D. A. Kramer ••••••.•••••••.••.••••••.
1. A-l. A-2. A-3. A-4. A-5. A-6. A-7. A-8. A-9.
1. 2. 3. 4. 5.
A-l. A-2. A-3. A-4.
ILLUSTRATIONS
Overall view of continuous flotation unit •••••••••••••.••••••••••••••••.• Insoluble-slimes flotation: Ore preparation section ••••••••••.• Insoluble-slimes flotation: Insoluble-slimes flotation: Insoluble-slimes flotation: Insoluble-slimes flotation:
Flotation section •••••••••••••••••. Potash flotation section •.•••••••••••••.•••• Concentrate debrining and drying section •• Tailings debrining section ••••••••.••••••.
Direct flotation: Direct flotation:
Ore preparation section ..••..........•.....•......... Potash flotation section •.••..••••••••••••••••••.
Direct flotation: Concentrate debrining and drying section •••••• • • • Direct flotation: Tailings debrining section ••••••••••••••••••.•.•.•.•••
TABLES
Chemical analysis of carnallite ore •................•.......•........... Screen analysis of carnallite ore •••••.••••••••••••••.••.••••••••••• Reagent schemes used in continuous flotation unit •.••••••••••••.••••• Flotation results for continuous flotation unit.... . ••••••.• Screen analysis of final KC1 products.............. . •••••••• Estimated capital cost, insoluble-slimes flotation....... • ••••• Estimated capital cost, direct flotation •••••••.••••.•••• Estimated annual operating cost, insoluble-slimes flotation •••..• Estimated annual operating cost, direct flotation •••.•••••..•••••••••••••
1 2 2 2 3 3 4 4 5 5 6 6 7
4 11 12 13 14 15 16 17 18 19
2 3 5 5 6 7 8 9
10
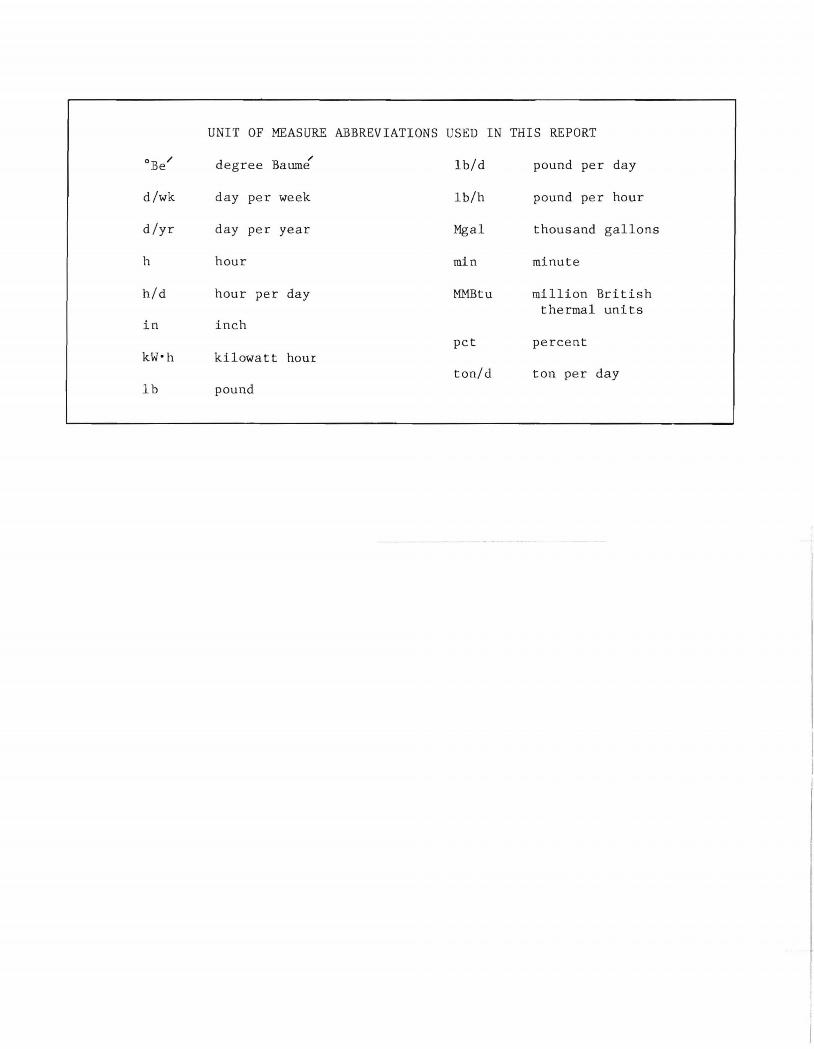
UNIT OF MEASURE ABBREVIATIONS USED IN THIS REPORT
°Be/ degree Baum{ lb/d pound per day
d/wk day per week lb/h pound per hour
d/yr day per year Mgal thousand gallons
h hour min minute
hid hour per day MMBtu million British thermal units
in inch pct percent
kW·h kilowatt hour ton/d ton per day
Ib pound
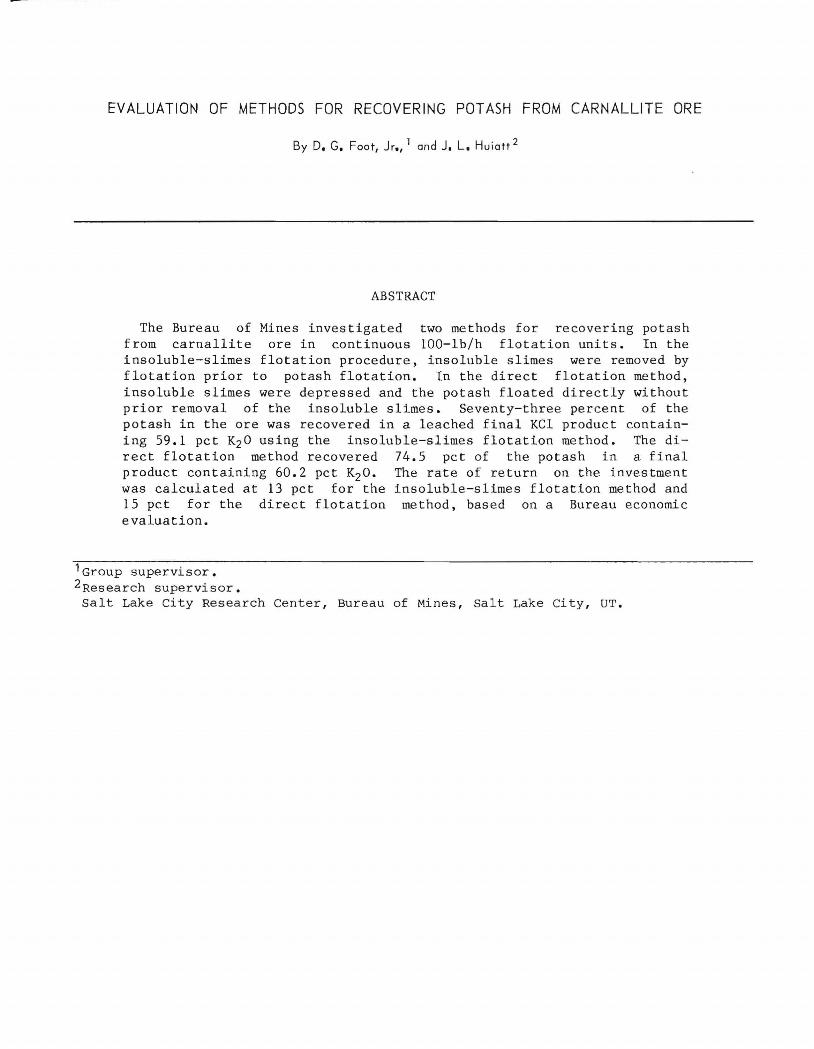
EVALUATION OF METHODS FOR RECOVERING POTASH FROM CARNALLITE ORE
By D. G. Foot, Jr., 1 and J. L. Huiatt 2
ABSTRACT
The Bureau of Mines investigated two methods for recovering potash from carnallite ore in continuous 100-lb/h flotation units. In the insoluble-slimes flotation procedure, insoluble slimes were removed by flotation prior to potash flotation. In the direct flotation method, insoluble slimes were depressed and the potash floated directly without prior removal of the insoluble slimes. Seventy-three percent of the potash in the ore was recovered in a leached final KCl product containing 59.1 pet K20 using the insoluble-slimes flotation method. The direct flotation method recovered 74.5 pct of the potash in a final product containing 60.2 pet K20. The rate of return on the investment was calculated at 13 pct for the insoluble-slimes flotation method and 15 pct for the direct flotation method, based on a Bureau economic evaluation.
lGroup supervisor. 2Research supervisor. salt Lake City Research Center, Bureau of Mines, salt Lake City, UT.
2
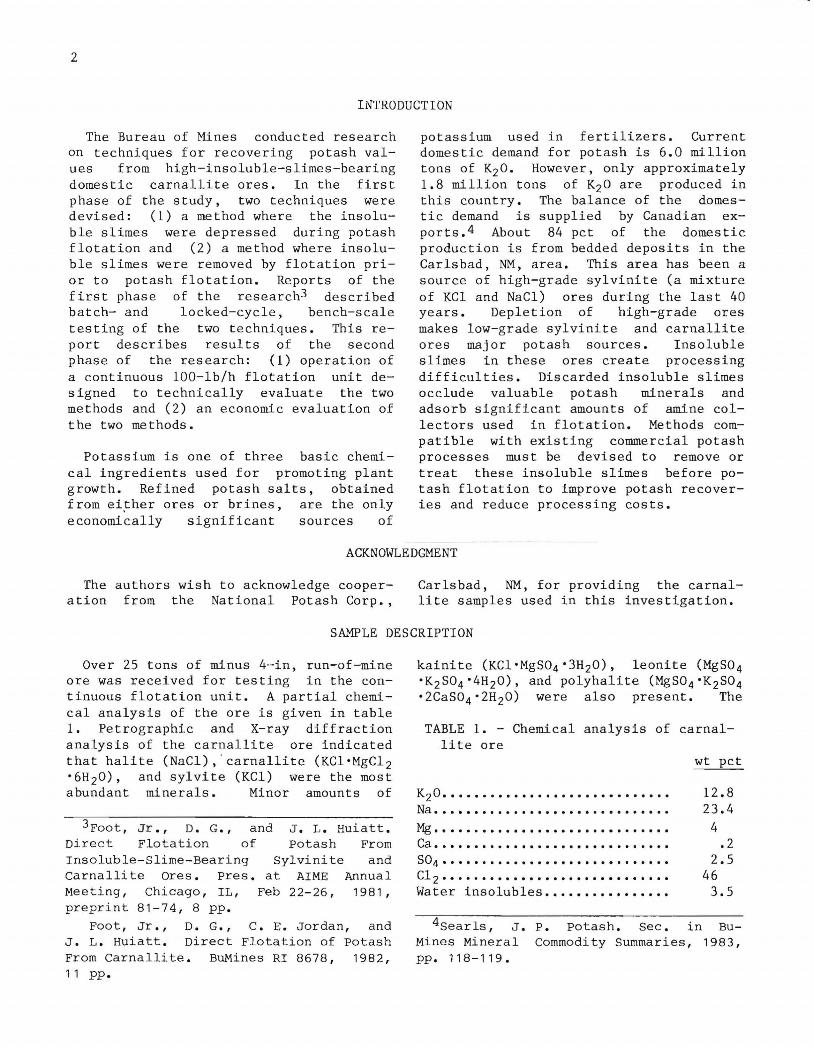
INTRODUCTION
The Bureau of Mines conducted research on techniques for recovering potash values from high-insoluble-slimes-bearing domestic carnallite ores. In the first phase of the study, two techniques were devised: (l) a method where the insoluble slimes were depressed during potash flotation and (2) a method where insoluble slimes were removed by flotation prior to potash flotation. Reports of the first phase of the research3 described batch- and locked-cycle, bench-scale testing of the two techniques. This report describes results of the second phase of the research: (1) operation of a continuous 100-lb/h flotation unit designed to technically evaluate the two methods and (2) an economic evaluation of t he two me thods •
Potassium is one of three basic chemical ingredients used for promoting plant growth. Refined potash salts, obtained from ei~her ores or brines, are the only economically significant sources of
potassium used in fertilizers. Current domestic demand for potash is 6.0 million tons of K20. However, only approximately 1.8 million tons of K20 are produced in this country. The balance of the domestic demand is supplied by Canadian exports. 4 About 84 pct of the domestic production is from bedded deposits in the Carlsbad, NM, area. This area has been a source of high-grade sylvinite (a mixture of KCl and NaCl) ores during the last 40 years. Depletion of high-grade ores makes low-grade sylvinite and carnallite ores major potash sources. Insoluble slimes in these ores create processing difficulties. Discarded insoluble slimes occlude valuable potash minerals and adsorb significant amounts of amine collectors used in flotation. Methods compatible with existing commercial potash processes must be devised to remove or treat these insoluble slimes before potash flotation to improve potash recoveries and reduce processing costs.
ACKNOWLEDGMENT
The authors wish to acknowledge cooperation from the National Potash Corp.,
Carlsbad, NM, for providing the carnallite samples used in this investigation.
SAMPLE DESCRIPTION
Over 25 tons of minus 4--in, run-of-mine ore was received for testing in the continuous flotation unit. A partial chemical analysis of the ore is given in table 1. Petrographic and X-ray diffraction analysis of the carnallite ore indicated that halite (NaCI), ' carnallite (KCI·MgCI 2 ·6H 20), and sylvite (KCI) were the most abundant minerals. Minor amounts of
3Foot , Jr., D. G., and J. L. Huiatt. Direct Flotation of potash From Insoluble-Slime-Bearing Sylvinite and Carnallite Ores. Pres. at AIME Annual Meeting, Chicago, IL, Feb 22-26, 1981, preprint 81-74, 8 pp.
Foot, Jr., D. G., C. E. Jordan, and J. L. Huiatt. Direct Flotation of potash From Carnallite. BuMines RI 8678, 1982, 11 pp.
kainite (KCI·MgS04 ·3H20), leonite (MgS0 4 ·K2S04 ·4H20), and polyhalite (MgS0 4 ·K2S04 ·2CaS04·2H20) were also present. The
TABLE 1. - Chemical analysis of carnallite ore
K2 O. " " " " " " " " " " " " " " " " " " " " " " " " " " " " Na" " " " " " " " " " " " " " " " " " " " " " " " " " " " " "
Mg " " " " " " " " " " " " " " " " " " " " " " " " " " " " " " Ca" " " " " " " " " " " " " " " " " " " " " " " " " " " " " " 8°4 " " " " " " " " " " " " " " " " " " " " " " " " " " " " " C1 2 " " " " " " " " " " " " " " " " " " " " " " " " " " " " " Water insolubles •••••.•••.••••••
wt pct
12.8 23.4
4 • 2
2.5 46
3.5
4Searls, J. Mines Mineral pp. 118-119.
P. potash. Sec. in BuCommodity Summaries, 1983,
water-insoluble fraction of the ore contained abundant magnesite, chlorite, and illite. Some carnallite and sylvite contained minor amounts of occluded hematite, which gave the minerals a distinct red color.
Carnallite ore was prepared for feed to the continuous flotation unit by crushing
3
through 3/4-in size using a hammer mill. The ore was screened at 10 mesh, the liberation size for the sylvite and carnallite minerals. The oversize was processed in a rod mill. Dry screen analysis of the crushed ore, given in table 2, indicated that 23.4 pct of the total weight was coarser than 10 mesh.
CONTINUOUS FLOTATION UNIT DESIGN AND OPERATION
DESIGN FOR INSOLUBLE-SLIMES FLOTATION
Circuit design was based on data obtained from bench-scale, locked-cycle testing. The flow diagram presented in appendix figures A-I through A-5 was adopted for the method using insolubleslimes flotation. Minus 3/4-in material was fed to a 10-mesh vibrating screen. Screen oversize was processed in a rod mill operating at 50-pct-solids pulp density. The screen undersize was slurried with saturated brine and mixed with rod mill discharge. The combined slurry flowed to a carnallite decomposition tank. Because carnallite must be decomposed to KCl to produce a feed material for potash flotation, approximately 400 Ib of fresh water per ton of the carnallite ore was added to dissolve the MgC1 2 , leaving a solid KCl product. Approximately 9 pct of the potassium in the carnallite was dissolved in the brine during the 5-min decomposition leach. (A portion of this potash could be recovered by solar evaporation of the excess plant brine.)
Slurry from the carnallite leach decomposition step was diluted to 27 pct solids for the insoluble-slimes flotation
TABLE 2. - Screen analysis of carnallite ore
Screen size, mesh
Plus 10 ......................... . Minus 10 plus 20 •.•••••.••.•.•••. Minus 20 plus 35 ................ . Minus 35 plus 65 ................ . Minus 65 plus 100 .••....•..•••.•. Minus 100 ....................... .
wt pct
23.4 19.2 14.6 15.6 8.7
18.5
circuit. Insoluble-slimes flotation reagents (Superfloc 127 and Aeropromoter 870)5 were added ahead of flotation in a Denver No. 7 Sub-A flotation machine. No conditioning was required. Total insoluble-slimes flotation time was approximately 10.5 min.
Deslimed pulp was conditioned for 2 min with MRL-201 insoluble-slimes blinder and an emulsion of Armeen TD and Barrett's oil. Conditioned pulp was fed to a bank of three Denver No. 5 Sub-A flotation machines. Potash rougher flotation time was 10.5 min. The potash rougher concentrate was upgraded further by a 3.5-min single-stage cleaner flotation and 3.5-min recleaner flotation without additional reagents. The recleaner concentrate was water-washed to remove fine NaCl and filtered to recover the entrained brine. Less than 0.5 pct potash was lost during final product leaching. Pan filters were used for final debrining of all products in the flotation unit. Potash cleaner and recleaner tailings were recycled to rougher and cleaner flotation circuits, respectively.
Insoluble-slimes concentrate and salt tailings from potash rougher flotation were combined and thickened in a spiral classifier. The clear brine was recycled, while the thickened solids were filtered to recover additional brine. New equilibrium brine, made from the ore, was used in the flotation unit for initial startup only. Brine was recycled as completely as possible during operation.
5Reference to specific products does not imply endorsement by the Bureau of Mines.
4
The recycled brine from classifier and filtered products was pumped to a recycle brine tank. This tank served as a surge tank for process brine, which was metered to various points in the flotation unit.
DESIGN FOR DIRECT FLOTATION
This circuit, shown in appendix figures A-6 through A-9, was similar to the insoluble-slimes flotation circuit except (1) the insoluble-slimes flotation circuit was eliminated, (2) slurry from the carnallite decomposition was pumped directly to the potash flotation circuit, and (3) the slimes were flocculated with Superfloc 127 and depressed with MRL-201
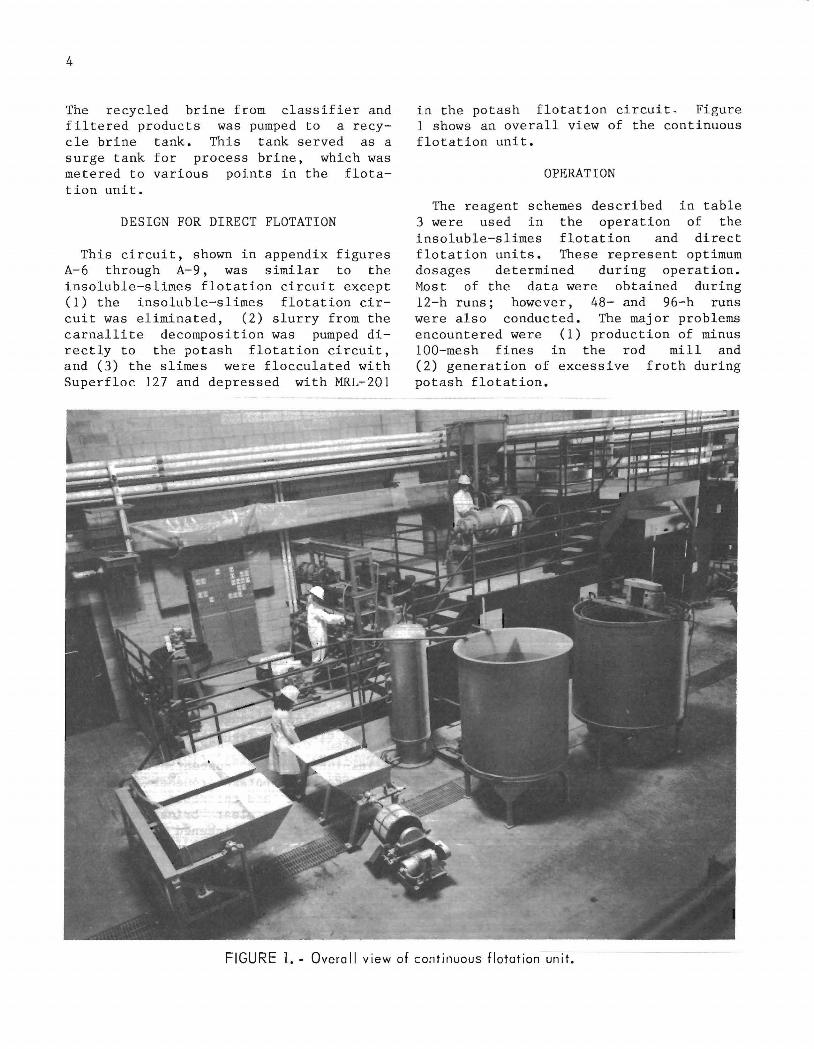
in the potash flotation circuit - Figure 1 shows an overall view of the continuous flotation unit.
OPERATION
The reagent schemes described in table 3 were used in the operation of the insoluble-slimes flotation and direct flotation units. These represent optimum dosages determined during operation. Most of the data were obtained during 12-h runs; however, 48- and 96-h runs were also conducted. The major problems encountered were (1) production of minus lOa-mesh fines in the rod mill and (2) generation of excessive froth during potash flotation.
FIGURE 1. - Overall view of continuous flotation unit.
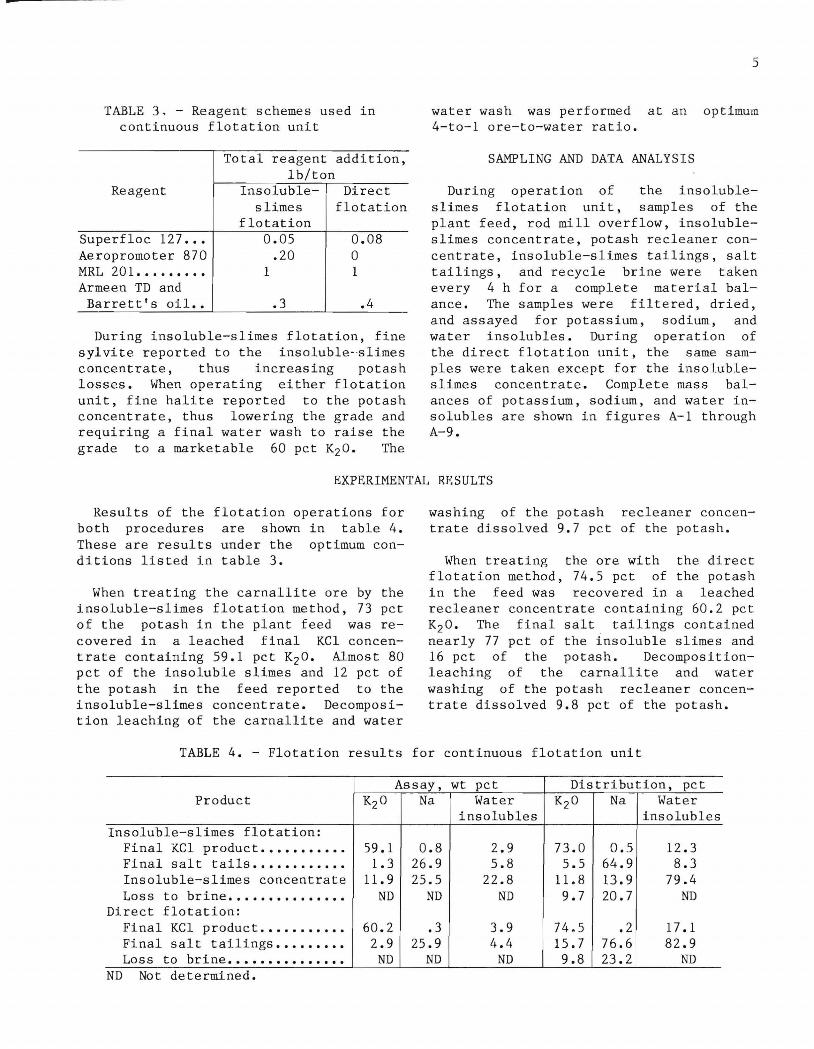
TABLE 3, - Reagent schemes used in continuous flotation unit
Reagent
Superfloc 127 .•• Aeropromoter 870 MRL 201 .•.•••••• Armeen TD and Barrett's oil..
Total reagent addition, lb/ton
Insoluble-slimes
flotation 0.05
.20 1
.3
Direct flotation
0.08 o 1
.4
During insoluble-slimes flotation, fine sylvite reported to the insoluble- ·slimes concentrate, thus increasing potash losses. When operating either flotation unit, fine halite reported to the potash concentrate, thus lowering the grade and requiring a final water wash to raise the grade to a marketable 60 pct K2 0. The
5
water wash was performed at an optimum 4-to-l ore-to-water ratio.
SAMPLING AND DATA ANALYSIS
During operation of the insolubleslimes flotation unit, samples of the plant feed, rod mill overflow, insolubleslimes concentrate, potash recleaner concentrate, insoluble-slimes tailings, salt tailings, and recycle brine were taken every 4 h for a complete material balance. The samples were filtered, dried, and assayed for potassium, sodium, and water insolubles. During operation of the direct flotation unit, the same samples were taken except for the insolubleslimes concentrate. Complete mass balances of potassium, sodium, and water insolubles are shown in figures A-I through A-9.
EXPERIMENTAL RESULTS
Results of the flotation operations for both procedures are shown in table 4. These are results under the optimum conditions listed in table 3.
When treating the carnallite ore by the insoluble-slimes flotation method, 73 pct of the potash in the plant feed was recovered in a leached final KCI concentrate containing 59.1 pct K2 0. Almost 80 pct of the insoluble slimes and 12 pct of the potash in the feed reported to the insoluble-slimes concentrate. Decomposition leaching of the carnallite and water
washing of the potash recleaner concentrate dissolved 9.7 pct of the potash.
When treating the ore with the direct flotation method, 74.5 pct of the potash in the feed was recovered in a leached recleaner concentrate containing 60.2 pct K2 0. The final salt tailings contained nearly 77 pct of the insoluble slimes and 16 pct of the potash. Decompositionleaching of the carnallite and water washing of the potash recleaner concentrate dissolved 9.8 pct of the potash.
TABLE 4. - Flotation results for continuous flotation unit
Assay, wt pct Distribution, pct Product K2 0 Na Water K20 Na Water
insolubles insolubles Insoluble-slimes flotation:
Final KCI product .....•..... 59.1 0.8 2.9 73.0 0.5 12.3 Final salt tails ................. 1.3 26.9 5.8 5.5 64.9 8.3 Insoluble-slimes concentrate 11.9 25.5 22.8 11.8 13.9 79.4 Loss to brine .................... ND ND ND 9.7 20.7 ND
Direct flotation: Final KCI product ..•.•.••.•• 60.2 .3 3.9 74.5 .2 17.1 Final salt tailings •.•.••••• 2.9 25.9 4.4 15.7 76.6 82.9 Loss to br i ne ................. ND ND ND 9.8 23.2 ND
ND Not determined.

6
Screen analysis of the concentrates obtained under optimum conditions are shown in table 5. Over 28 pct of the weight was in the minus 100-mesh fraction. Limited testing indicated that the material could be pelletized readily to increase particle size and thus improve market value.
Potash lost to the insoluble-slimes concentrate was predominately minus 100-mesh material, while potash lost to the final salt tails was predominately plus 35-mesh material. Both plus 35-mesh and minus 100-mesh material were lost to the final tailings when using the direct
TABLE 5. - Screen analysis of final KCl products, weight percent
Product size, mesh
Minus 35 ............. . Minus 35 plus 10 ••.••• Minus 100 .••.•••••.•.•
Insoluble method, slimes 28.7 42.7 28.6
Direct method
29.4 39.2 31.4
flotation method. Halite contamination of the potash recleaner flotation concentrates was almost entirely minus 100-mesh material. This fine material was entrained in the froth.
MATERIAL BALANCE AND ECONOMIC EVALUATION
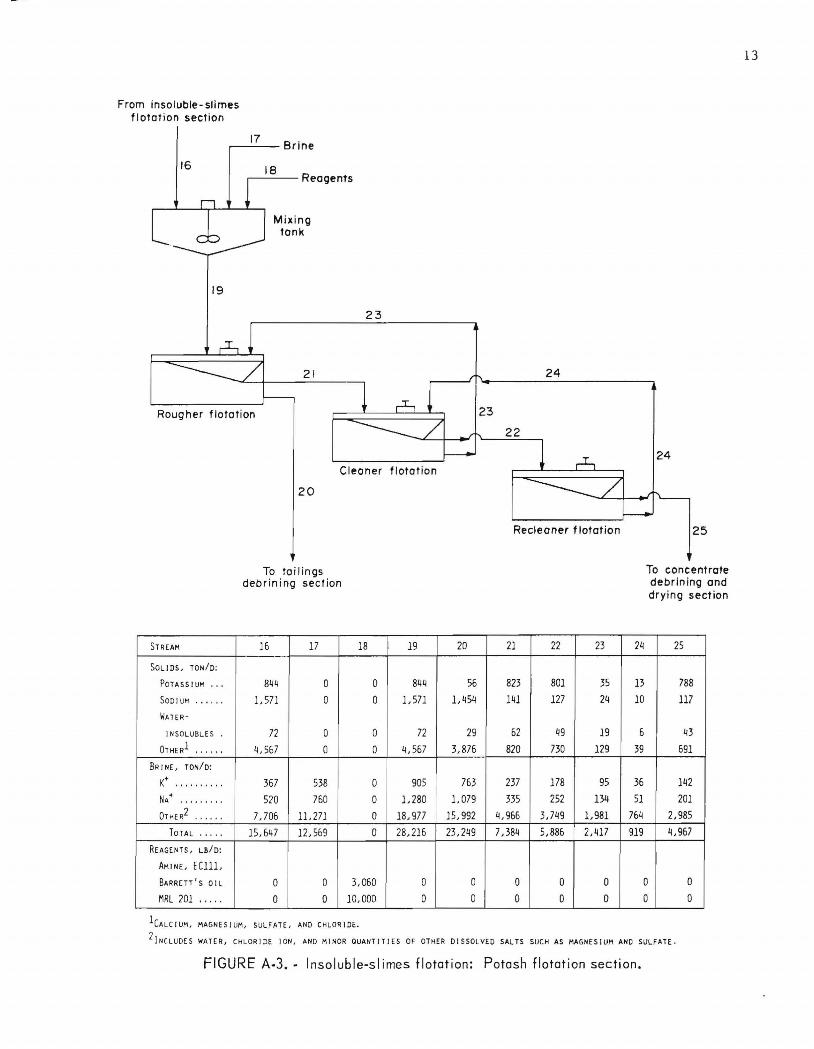
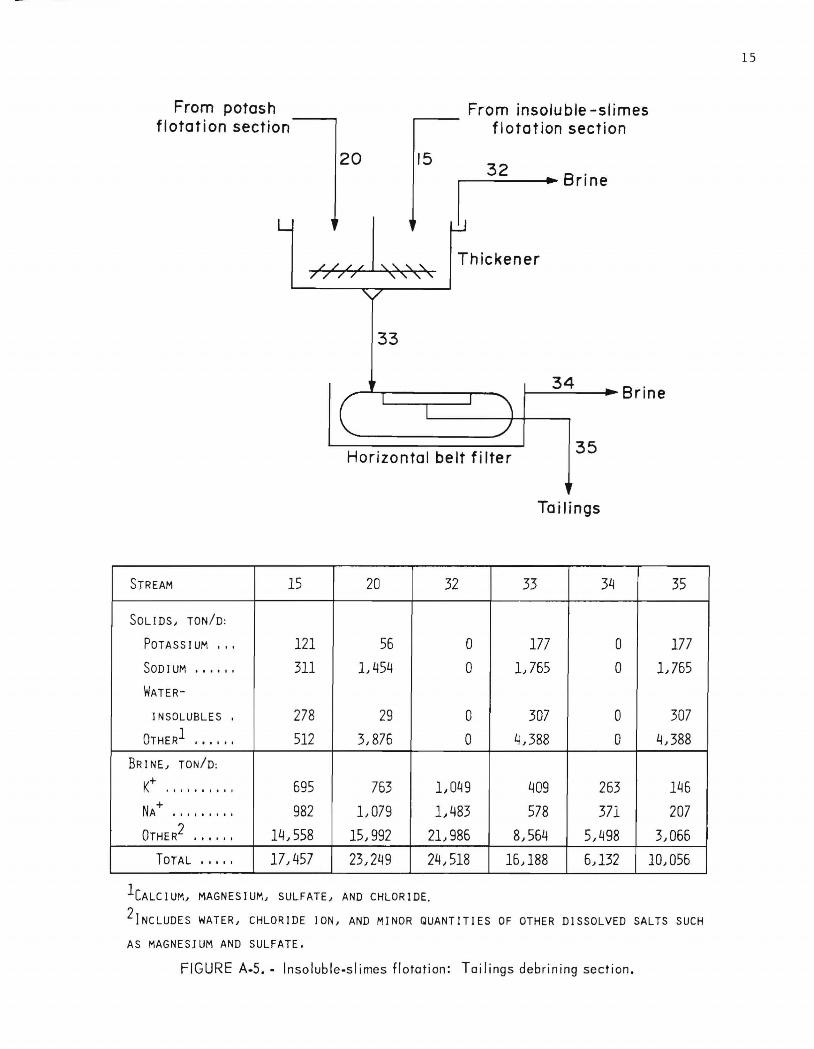
Flow diagrams balances for the
and complete material insoluble-slimes flota-
tion and direct flotation procedures are shown in figures A-I through A-S and A-6 through A-9, respectively. The material balances are for a plant designed to process 10,000 tonld of carnallite ore of the grade described in table 1. Economic evaluations of the methods are described in tables A-I through A-4.
Estimated operating cost for the insoluble-slimes flotation process is
$49.92/per ton of potash product, or $0.85 per unit of K20; the cost for the direct flotation process is $47.46 per ton of potash product, or $0.78 per unit of K20. Based on a selling price of muriate of potash of $1.26 per unit of K20, the insoluble-slimes flotation procedure yields an estimated rate of re-t-tl-rfl-em-irwes-'~meftt:- o·~ - l-:1- pet- after taxes. Direct flotation yields an estimated l5-pct after-tax rate of return on inves tment.
SUMMARY AND CONCLUSIONS
Operation of a 100-lb/h continuous flotation unit demonstrated the technical and economic feasibility of recovering potash from insoluble-6limes bearing carnallite ore. Using the insoluble-slimes flotation process, where the slimes are removed by flotation prior to potash flotation, 73 pct of the potash in the feed was recovered in a leached recleaner flotation concentrate contiaining 59.1 pct K20. Nearly 80 pct of the insoluble slimes was recovered in the insolubleslimes flotation concentrate.
Using a direct flotation method, where the potash is floated directly while
depressing the insoluble slimes, 74.5 pct of the potash in the feed was recovered in a leached recleaner concentrate containing 60.2 pct K20. The final salt tailings contained nearly 83 pct of the insoluble slimes.
The processes are economically feasible, yielding, after taxes, estimated rates of return on investment of 13 pct for the insoluble-slimes flotation method and 15 pct for the direct flotation method.
APPENDIX.--ECONOMIC EVALUATION
By D. A. Kramer1
7
CAPITAL COSTS
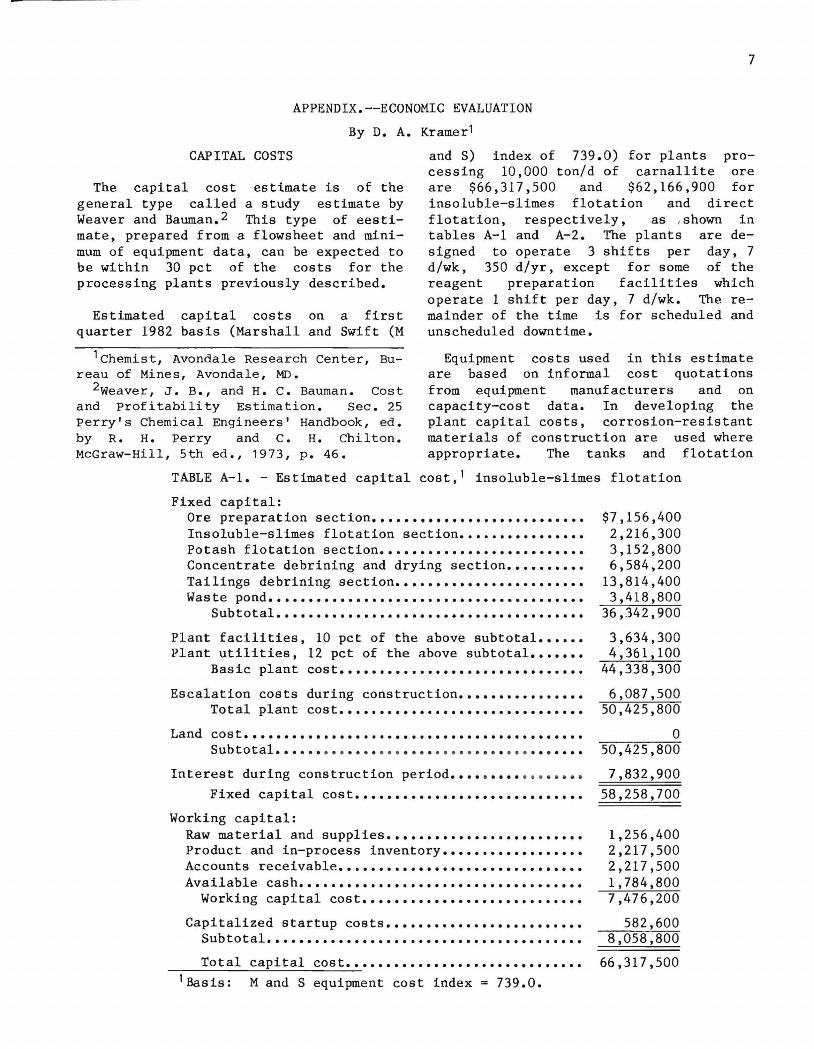
The capital cost estimate is of the general type called a study estimate by Weaver and Bauman. 2 This type of eestimate, prepared from a flowsheet and minimum of equipment data, can be expected to be within 30 pct of the costs for the processing plants previously described.
Estimated capital costs on a first quarter 1982 basis (Marshall and Swift (M
and S) index of 739.0) for plants processing 10,000 ton/d of carnallite ore are $66,317,500 and $62,166,900 for insoluble-slimes flotation and direct flotation, respectively, as , shown in tables A- I and A-2. The plants are designed to operate 3 shifts per day, 7 d/wk, 350 d/yr, except for some of the reagent preparation facilities which operate 1 shift per day, 7 d/wk. The remainder of the time is for scheduled and unscheduled downtime.
1 Chemist, Avondale Research Center, Bureau of Mines, Avondale, MD.
2weaver, J. B., and H. C. Bauman. Cost and profitability Estimation. Sec. 25 perry's Chemical Engineers' Handbook, ed. by R. H. Perry and C. H. Chilton. McGraw-Hill, 5th ed., 1973, p. 46.
Equipment costs used in this estimate are based on informal cost quotations from equipment manufacturers and on capacity-cost data. In developing the plant capital costs, corrosion-resistant materials of construction are used where appropriate. The tanks and flotation
TABLE A-I. - Estimated capital cost,1 insoluble-slimes flotation
Fixed capital: Ore preparation section ••••••••••••••••••••••••••• Insoluble-slimes flotation section •••••••••••••••• Potash flotation section •••••••••••••••••••••••••• Concentrate debrining and drying section •••••••••• Tailings debrining section •••••••••••••••••••••••• Was te pond ••••••••••••••••••••••••••••••••••••••••
Subtotal •••••••••••••••••••••••••••••••••••••••
Plant facilities, 10 pct of the above subtotal •••••• Plant utilities, 12 pet of the above subtotal •••••••
Basic plant cost •••••••••••••••••••••••••••••••
Escalation costs during construction •••••••••••••••• Total plant cost •••••••••••••••••••••••••••••••
Land cos t ••.......•...................•...•••.•.•... Subtotal ••• •• • • • • • •• • ••• • • •• ••••• ••• • ••• •••••••
Interest during construction period •••• • •••• ••• •••••
$7,156,400 2,216,300 3,152,800 6,584,200
13,814,400 3,418,800
36,342,900
3,634,300 4,361,100
44,338,300
6,087,500 50,425,800
o 50,425,800
7 , 832,900
Fixed capital cost ••••••••••••••••••••••••••••• 58,258,700
Working capital: Raw material and supplies ••••••••••••••••••••••••• Product and in-process inventory •••••••••••••••••• Accounts receivable ••••••••••••••••••••••.•••••••• Available cash ................................... .
Working capital cost ••.•••.•••••••••..••••.•.•••
Capitalized startup costs ••••••••••••••••••••••••• Subtotal ••••••••••••••••••••••••••••••••••••••••
Total capital cost ••••••••••••••••••••••••••••••
1Basis: M and S equipment cost index = 739.0.
1,256,400 2,217,500 2,217,500 1,784,800 7,476,200
582,600 8,058,800
66,317 , 500
8
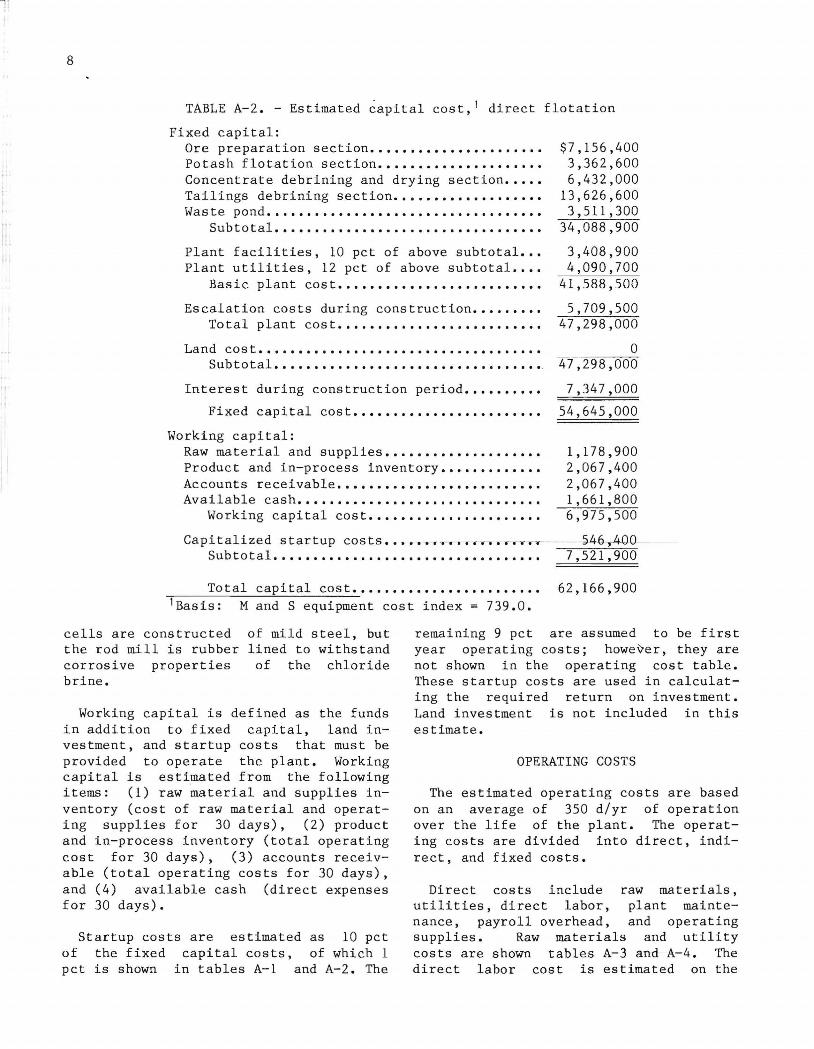
TABLE A-2. - Estimated capital cost, 1 direct flotation
Fixed capital: Ore preparation section ......••••.•••..•..•.. Potash flotation section .•.••...•.•••..••...• Concentrate debrining and drying section ••..• Tailings debrining section ..•..•.•.•••..•.••• Was te pond ••••••.•••••••••••••••.••••••••••••
Subtotal ................................. .
Plant facilities, 10 pet of above subtotal ••• Plant utilities, 12 pet of above subtotal •.•.
Basic plant cost •...•••.•..•.•.•..•.••..••
Escalation costs during construction •.•..•••. Total plant cost ••..•.•......•........•••.
Land cost ................................... . Subtotal ................................. I .
Interest during construction period •..•••...•
Fixed capital cost •••••..•..••....••••••.•
Working capital: Raw material and supplies ••.•..•..•..•.•.••.• Product and in-process inventory •••......•... Accounts receivable ........•.....•.........•. Available cash .............................. .
Working capital cost •••••........•.••..•..
Capitalized startup costs •.•••• r -••••••••••• - .- -.
Subtotal ................................. .
Total capital cost •••..•.•••.••••.....•.•• lBasis: M and S equipment cost index = 739.0.
$7,156,400 3,362,600 6,432,000
13,626,600 3,511,300
34,088,900
3,408,900 4,090,700
41,588,500
5,709,500 47,298,000
o 47,298,000
7,347,000
54,645,000
1,178,900 2,067,400 2,067,400 1,661,800 6,975,500
5 4-6 ,,-4-0 0 7,521,900
62,166,900
cells are constructed of mild steel, but the rod mill is rubber lined to withstand corrosive properties of the chloride brine.
Working capital is defined as the funds in addition to fixed capital, land investment, and startup costs that must be provided to operate the plant. Working capital is estimated from the following items: (1) raw material and supplies inventory (cost of raw material and operating supplies for 30 days), (2) product and in-process inventory (total operating cost for 30 days), (3) accounts receivable (total operating costs for 30 days), and (4) available cash (direct expenses for 30 days).
remaining 9 pct are assumed to be first year operating costs; however, they are not shown in the operating cost table. These startup costs are used in calculating the required return on investment. Land investment is not included in this estimate.
Startup costs are estimated as 10 pet of the fixed capital costs, of which 1 pet is shown in tables A-I and A-2. The
OPERATING COSTS
The estimated operating costs are based on an average of 350 d/yr of operation over the life of the plant. The operating costs are divided into direct, indirect, and fixed costs.
Direct costs include raw materials, utilities, direct labor, plant maintenance, payroll overhead, and operating supplies. Raw materials and utility costs are shown tables A- 3 and A- 4. The direct labor cost is estimated on the
9
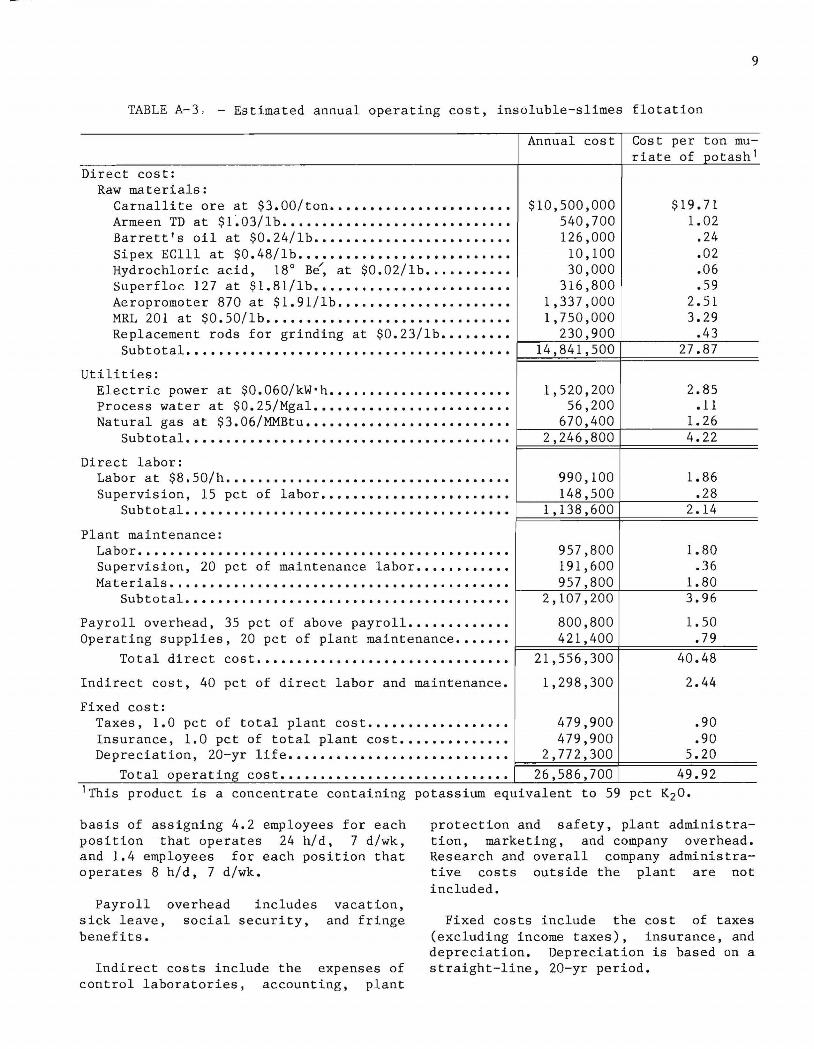
TABLE A-3, - Estimated annual operating cost, insoluble-slimes flotation
Direct cost: Raw materials:
Carnallite are at $3.00/ton ••••••••••••••••••••••• Armeen TD at $1 ·.03/1b ............................ . Barrett I s oil at $0. 24/lb •••••••••••••••••••.••••• Sipex EClll at $0.48/lb ••••••••••••••••••••••••••• Hydrochloric acid, 18° B~, at $0.02/lb ••••••••••• Superfloc 127 at $1.81/lb ••••••••••••••••••••••••• Aeropromoter 870 at $1. 91/lb •••••••••••••••••••••• MRL 201 at $O.SO/lb ..................•..•......... Replacement rods for grinding at $0.23/lb •••••••••
Subtotal ........................................ .
Utilities: Electric power at $0.060/kW·h ••••.•••••••••••••••••• Process water at $0.25/Mgal ••••••••••••••••••••••••• Natural gas at $3.06/MMBtu ••••••••••••••••••••.•••••
Subtotal ........................................ .
Direct labor: Labor at $8.50/h ................................... . Supervision, 15 pet of labor •••••••••••••••••••.••••
Subtotal ........................................ .
Plant maintenance: Labor .............................................. . Supervision, 20 pet of maintenance labor •••••••••••• Materials .......................................... .
Subtotal ........................................ .
Payroll overhead, 35 pet of above payroll •••••••••••.• Operating supplies, 20 pet of plant maintenance •••••••
Total direct cost ••••••••••••••••••••••••••••••••
Indirect cost, 40 pet of direct labor and maintenance.
Fixed cost: Taxes, 1. 0 pet of total plant cos t ................. . Insurance, 1.0 pet of total plant cost •••••••••••••• Depreciation, 20-yr life •..•........•.....•......•..
Total operating cost •••••••••••••••••••••••••••••
Annual cost Cost per ton mu-riate of potash 1
$10,500,000 $19.71 540,700 1.02 126,000 .24
10,100 .02 30,000 .06
316,800 .59 1,337,000 2.51 1,750,000 3.29
230,900 .43 14,841,500 27.87
1,520,200 2.85 56,200 .ll
670,400 1. 26 2,246,800 4.22
990,100 1.86 148,500 .28
1,138,600 2.14
957,800 1.80 191,600 .36 957,800 1.80
2,107,200 3.96
800,800 1. 50 421,400 .79
21,556,300 40.48
1,298,300 2.44
479,900 .90 479,900 .90
2,772,300 5.20
26,586,700 49.92 lThis product is a concentrate containing potassium equivalent to 59 pet K20.
basis of assigning 4.2 employees for each position that operates 24 hid, 7 d/wk, and 1.4 employees for each position that operates 8 hid, 7 d/wk.
Payroll sick leave, benefits.
overhead includes social security,
vacation, and fringe
Indirect costs include the expenses of control laboratories, accounting, plant
protection and safety, plant administration, marketing, and company overhead. Research and overall company administrative costs outside the plant are not included.
Fixed costs include the cost of taxes (excluding income taxes), insurance, and depreciation. Depreciation is based on a straight-line, 20-yr period.

10
TABLE A-4. - Estimated annual operating cost, direct flotation
Direct cost: Raw materials:
Annual cost Cost per ton muriate of potash!
Carnallite ore at $3.00/ton ••.•.•••••.•.•••....••• $10,500,000 $19.96 Armeen TD at $1.03/lb............................. 721,000 1.37 Barrett's oil at $0.24/lb......................... 168,000 .32 Sipex EClll at $0.48/lb........................... 10,100 .02 Hydrochloric acid, 18° Be' at $0.02/lb............. 40,000 .08 Superfloc 127 at $1.81/lb......................... 506,800 .96 MRL 201 at $0.50/lb............................... 1,750,000 3.33 Replacement rods for grinding at $0.23/lb •••••.••• r-~~2~3~0~,~9~0~0~ ______ ~~ •• 4~4~ __ __
Subtotal •......•.....•.......••........•......•.. F==1=3=,=9=2=6=,=8=0=0=F=======2=6=.=4=8======
Utilities: Electric power at $.060/kW·h........................ 1,248,700 2.37 Process water at $0.25/Mgal......................... 56,500 .11 Natural gas at $3.06/MMBtu ••..•...••...•.•••..•••••• ~~~6~6~0~,787070+-______ ~1~.~2~6 ____ _
Subtotal.. .•••••.•••.•••••...•••••••••••.•.•..•.. 1 ,966,000 3.74 F=========*============= Direct labor:
Labor at $8.50/h ................................... . 919,400 1.75 Supervision, 15 pet of labor........................ 137,900 .26
r-~~~~~~------~~~-----Subtotal......................................... 1,057,300 2.01
F=======~F============ Plant maintenance:
La bo r ••..•......••....•...•...•....•...........•.... 920,900 1.75 Supervision, 20 pet of maintenance labor ••.••••••.•• 184,200 .35 Materials........................................... 920,900 1.75
r-~~~~~~------~~~-----Subtotal ......................................... . 2,026,000 3.85
Payroll overhead, 35 pet of above payroll............. 756,800 1.44 Operating supplies, 20 pet of plant maintenance....... 405,200 .77
F=~2~0~,1~3~8=,~10~0~====~3~8~.2~9~=== Total direct cost ••.••••••••.••••.•••••••.•••••••
Indirect cost, 40 pet of direct labor and maintenance. 1,233,300 2.34
Fixed cost: Taxes, 1.0 pet of total plant cost.................. 461,300 .88 Insurance, 1.0 pet of total plant cost.............. 461,300 .88 Depreciation, 20-yr life.. •••.. •••••••• ••.•••••• •••• 2,664,700 5.07
F=~~~~~======~=77==== Total operating cost............................. 24,958,700 47.46
!This product is a concentrate containing potassium equivalent to 61 pet K20.
The estimated annual operating costs for a plant processing 10,000 ton/d of carnallite ore are $26,586,700 for the insoluble-slimes flotation circuit and $24,958,700 for the direct flotation circuit, as shown in tables A-3 and A-4. For the insoluble-slimes flotation circuit which produces a product of approximately 59 pet K20, this corresponds to
$49.92 per ton of product, or $0.85 per unit of K20. The direct flotation circuit produces a product of approximately 61 pet K20, and the above operating cost corresponds to $47.46 per ton of product, or $0.78 per unit of K20. (One unit is equivalent to 1/100 of a ton, or 20 lb.)

Carnallite ore
3
screen
6
screen
8
STREAM 1
SOLIDS, TONh) 10,000
BRINE, TON/o 0 TOTAL 10,000
4
7
2 3
6,300 3,700
0 0 6,300 3,700
9
Brine
Brine
10
4
8,300
0 8,300
2
5
5
5 6 7
2,000 10,000 2,340
0 0 0 2,000 10,000 2,340
D Hamme' mill
D Hamme, mill
Rod mill
8
7,660
a 7,660
" To insoluble-slimes
flotation section
9 10 11
0 0 10,000
2,340 18,764 21,104 2,340 18,76ll 3L104
FIGURE A-l. - Insoluble-slimes flotation: Ore preparation section.
11

12
I
!
From ore preparation section
II
13
....----Water
Mi tank
14 ....---- Reagents
__ -+-__ '_5_..... To tailings debrining n
STREAM
SOLI os, TON/o:
POTASSIUM" ,
SODIUM ..... ,
WATER-
INSOLUBLES
OrtiE R1 ".,.,
BR 1 NE, TOI,do:
K+ """'''' NA+
I I I' I I •••
"'1'1 I
TOTAL , .. ,'
REAGENTS, LB/o:
SUPER FLOC 127
AEROPROMOTER
It't "'"
Slimes flotation 16
11
1,060
2,240
350 6,350
967
L144
18,993
104
0
0
To potash flotation s
0
0 L882
0 350
0 5,079
0 },062
0 1,502
2,000 22,264
2,000 33,104
0 ° 0 0
1 ~CALCIUM, MAGNESIUM, SULFATE, AND CHLORIDE.
111 15
0 121
° 311
0 278 I 0 512
0 695
0 982
0 14,
0
500 0
2,000 0
16
8411
1,571
72
4,567
367
520
7,706
0
0
2INCLUDES WATER, CHLORIDE ION, AND MINOR QUANTITIES OF OTHER DISSOLVED SALTS SUCH
AS MAGNESIUM AND SULFATE,
FIGURE A-2. - Insol limes flotation: Flotation section.
From insoluble-slimes flotation section
.--.....:...;17 __ Brine
16 ,----'....::.-- Reagents
19
Rougher flotation
Mixing tonk
2 1
23
Cleaner flotation
STREAM
SOLI os, TON/o:
POTASSIUM '"
SOD I UM """ WATER-
INSOLUBLE S ,
OT HE Rl """ BR I NE, TON/o:
K+ """""
NA· " """, OT HE R2 " " "
TOTAL .. .. ,
REAGENTS, LB / o:
AMINE, ECllL BARREn's OIL
MRL 201 "'"
20
To tailings debrining section
16 17
844 0
L571 0
72 0 4,567 0
367 538
520 760 7,706 11,271
15,&47 12, 5&9
0 0
0 0
18
0
0
0
0
0
0 0
0
3,060
10,000
1CALCIUM, MAGNESIUM, SULFATE, AND CHLORIDE,
19
844
1,571
72
4, 567
905
1.280 18,977
28, 216
0
0
24
22
Recleaner flotation
20 21 22 23
56 823 801 35
1,454 141 127 24
29 62 49 19 3,876 820 730 129
763 237 178 95 1,079 335 252 134
15,992 4, 966 3,749 1,981
23,249 7,384 5,886 2,417
0 0 0 0
0 0 0 0
24
13 10
6
39
36
51 7&4
919
25
To concentrate debrln Ing and drying section
25
788
117
43
691
142
201 2, 985
4,967
0 0
0 0
21NCLUDES WA TER, CHLORIDE ION, AND MINOR QUANTITIES OF OTHER DISSOLVED SAL TS SUCH AS MAGNESIUM AND SULFATE,
FIGURE A-3. - Insoluble-51 imes flotation: Potash flotation secti.on.
13

14
From potash flotation section
25
27
26 .....--- Water
Mixing tank
f---__ 2_8 ____ B ri ne
Horizontal belt filter r--3-0_~Stack effluent
29
31
Potash product
STREAM 25 26 27 28 29 30 31
SOLIDS, TON/D :
POTASSIUM ... 788 0 78~ 0 78~ 38 746
SODIUM .. ,. I. 117 0 12 0 12 0 12 WATER-
INSOLUBLES ~3 0 ~3 0 ~3 0 ~3
1 OTHER .. .. .. &91 0 763 0 763 ~2 721 BR I NE, TON/D :
K+ . . ..... . .. 1~2 0 146 139 7 0 0 NA + ........ . 201 0 306 292 14 0 0
2 OTHER ...... 2,985 ~10 3,323 3,166 157 178 0 TOTAL ..... ~, 967 ~10 5,377 3,597 1,780 258 1,522
1CALCIUM, MAGNESIUM, SULFATE, AND CHLORIDE.
2INCLUDES WATER, CHLORIDE ION, AND MINOR QUANTITIES OF OTHER DISSOLVED SALTS SUCH
AS MAGNESIUM AND SULFATE.
FIGURE A~4 •• Insoluble~slimes flotation: Concentrate debrining and drying section.
From potash flotation section
L
15
1 1
~~~~ 7777 ~ '\ '::I. '::I. ,,~""
'\/
33
From insoluble-slimes flotation section
.----_3_2 __ ... B r i ne
~
Thickener
34 --I ~
Brine I
./ Horizontal belt filter
35
, Tailings
STREAM 15 20 32 33 311 35
SOLIDS, TON/D :
POT ASS I UM '" 121 56 0 177 0 177 SODIUM •••• I I 311 1,454 0 L765 0 L765 WATER-
INSOLUBLES , 278 29 0 307 0 307 1 OTHER ,.,'" 512 3,876 0 4,388 0 4,388
BR I NE, TON/D:
K+ ,. I I f I , . I' 695 753 L049 409 263 146
NA+ 'I I I I '1'1 982 L079 L483 578 371 207 2 OTHER ,.,'" 14,558 15,992 21,986 8,564 S,1l98 3,065
TOTAL ",., 17,457 23,249 24,518 16,188 6,132 10,056
lCALCIUM, MAGNESIUM, SULFATE, AND CHLORIDE.
2INCLUDES WATER, CHLORIDE ION, AND MINOR QUANTITIES OF OTHER DISSOLVED SALTS SUCH
AS MAGNESJUM AND SULFATE,
FIGURE A-5. - Insoluble-slimes flot(]tion: Tailings debrining section.
15

16
Carnallite ore
3
screen
6
screen
8
STREAM 1
SOLI os, TaNIo 10,000
BQINE, TaNIo 0
TOTAL 10,000
2
4
5
5
7
9
Brine
Brine
10
2 3 ~ 5 6
6, 300 3,700 8,300 2,000 10,000
0 0 0 0 0
6,300 3, 700 8,300 2,000 10,000
7
2,340
0 2, 340
D Homme,mHI
a Homme, mill
Rod mill
8
7,660
0 7,660
II
To potash flotation section
9 10 11
0 0 10,000
2,340 18,76~ 21,104 2,340 18,764 31,104
FIGURE A-6. - Direct flotation: Ore preparation section.

-
From ore preparation section
12 ,.----- Water
II ~--- Reagents
14
Rougher flotation
Mixing tank
17
16
Cleaner flotation
STR EAM
SOLI os, TON/D:
PO TASSiUM . . .• •
SODI UM ••••••••
WATER -
I NSO LUBLE S •••
OTHER1 ........
BR I NE, TON /D :
~ .......... .. NA· .•.••••••. .
OTHER2 ... . . .. .
TOTAL ...... .
REAGENTS, Ls/D:
AMINE-BARRETT 'S
OIL ..........
SUPE RFLOC 127 . MRl 201 .. , .. . .
15
To tailings debrining section
11 12 13
L060 0 0 2,740 0 0
350 0 0 6,350 0 0
967 0 ° L 144 0 0 18, 993 2,000 0
3Ll04 2,000 °
° 0 4,000
0 0 800 0 0 10,000
lCALCIUM, MAGNE SIU~" SULFA TE , AND CHLORIDE.
14 15
965 160 1,882 Ll16
350 290 5,079 4,334
L 062 897 1,502 L268
22,264 18,197
33 , ]04 27, 462
0 0
0 0 0 0
19
17
18
Recleaner flotation
16 17 18
845 40 827 204 38 182
127 67 92 902 157 786
227 62 227 320 86 321
4,749 1, 28£ 4,756
7,374 1,732 7,] 91
0 0 0
0 0 0 0 0 0
20
To concenlmte debrining and drying section
19 20
22 805 16 166
32 60 41 745
62 165 87 234
1,289 3,467
1,549 5, 642
0 0 0 0 0 a
2 JNCLUDES WA T ER , CHLORI DE ION, AND MINOR QUANTIT IES OF OTHER D I SSOLV ED S,LTS SUCH AS MAGNE SI UM AND SucF ATE .
FIGURE A-7. - Direc t flotation: Potash flotation section.
17
18
From potash flotation section
20
22
r--2_I-Water
Mixing tank
1--___ 2_3 __ • Br i ne
Horizontal belt filter r---2_5----1..- Stac k effluent
24
26
Potash product
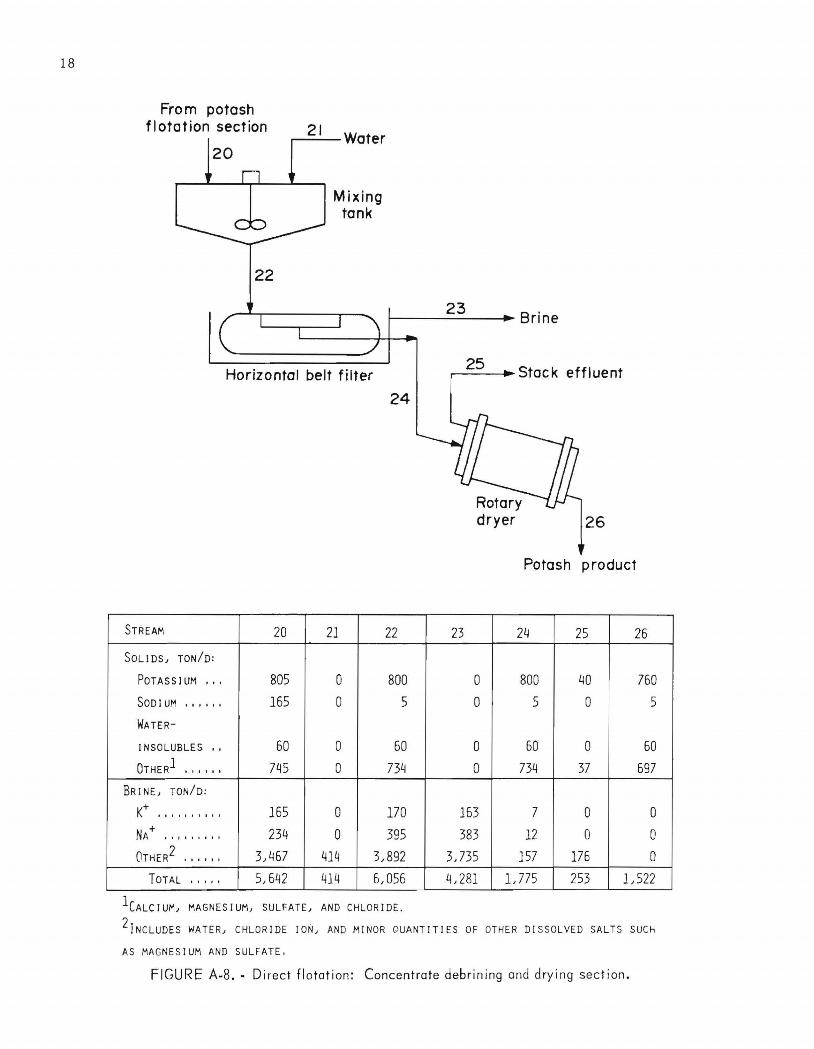
STREAM 20 21 22 23 24 25 26
SOLIDS, TON/D:
POTASSIUM '" 805 0 800 0 800 40 760
SODIUM • I I fl' 155 0 5 0 5 0 5
WATER-
INSOLUBLES " 50 0 60 0 50 0 50 1 OTHER .... ,. 745 0 734 0 734 37 697
BRINE, TON/D:
K+ " .. I , I I I I 165 0 170 163 7 0 0 NA + "1 1" I I I 234 0 395 383 12 0 0
2 OTHER .... ,' 3,467 414 3,892 3,735 157 176 0
TOTAL ..... 5,642 414 6,055 4,281 L775 253 1,522
lCALClUM, MAGNESIUM, SULFATE, AND CHLORIDE.
2lNCLUDES WATER, CHLORIDE ION, AND MINOR QUANT ITIES OF OTHER DISSOLVED SALTS SUCH
AS MAGNESIUM AND SULFATE.
FIGURE A-8 .• Direct flotation : Concentrate debrining and drying section.

15
28
From potash flotation section
27 ,.-.---~.~ Br in e
Thickener
29 f-----...... Brine
Horizontal belt filter 30
Tailings
STREAM 15 27 28 29 30
SOLI os, TON/o :
POTA SS IUM '" 160 0 160 0 160
SODIUM I I I I I I L716 0 L716 0 1,716
WATER-
IN SOLUBLES , , 290 0 290 0 290 1 OTHER """ ~,33~ 0 ~,33~ 0 ~,334
BRINE, TON/o: + K I I I I ,. I I I I 897 590 307 217 90
+ NA . I I t I I I If 1,268 834 434 307 127 2 OTHER """ 18,797 12,368 6,429 4,556 L873
TOTAL "'" 27,462 13,792 13,670 5,080 8,590
lCALCIUM, MAGNESIUM, SULFATE, AND CHLORIDE .
2JNCLUDES WATER, CHLORIDE ION , AND MINOR QUANTITIES OF OTHER DISSOLVED
SALTS SUCH AS MAGNE SIUM AND SUL FATE ,
FIGURE A-9. - Direct flotation: Tailings debrining section.
19
tt U.S . GOVERNMENT PRINTING OFFICE: 1983-705-020/108 INT.- BU . OF MINES,P G H ., P A . ;>.7299