Embed Size (px)
Citation preview
Loughborough UniversityInstitutional Repository
Plate-out in PVC extrusion.I. Analysis of plate-out
This item was submitted to Loughborough University's Institutional Repositoryby the/an author.
Citation: GILBERT, M. ... et al, 2008. Plate-out in PVC extrusion. I.Analysis of plate-out. Journal of vinyl and additive technology, 14 (1), pp. 3-9
Additional Information:
• This article was published in the journal, Journal of vinyl and additivetechnology [ c© Society of Plastics Engineers]. The definitive version isavailable from: http://www3.interscience.wiley.com/
Metadata Record: https://dspace.lboro.ac.uk/2134/3266
Publisher: John Wiley & Sons
Please cite the published version.
This item was submitted to Loughborough’s Institutional Repository by the author and is made available under the following Creative Commons Licence
conditions.
For the full text of this licence, please go to: http://creativecommons.org/licenses/by-nc-nd/2.5/

Plate-out in PVC Extrusion – I Analysis of plate-out
M Gilberta, N Varshneyb, K Van Soomc, M Schillerd Abstract
Samples of extruder plate-out from industrial rigid PVC production
lines have been investigated using a number of analytical techniques.
The combined use of SEM-EDX (scanning electron microscopy –
energy dispersive x-ray analysis), thermal analysis, FTIR (Fourier
Transform infra Red spectrophotometry) and LIMA (laser induced
mass analysis) has enabled most plate-out components to be
identified, and linked to likely formulation ingredients. FTIR and
thermal analysis were used to identify organic components. FTIR was
also useful for identifying some inorganic compounds present in
sufficient quantities, while EDX detected elements present. LIMA was
the most sensitive technique, detecting trace quantities of both cations
and anions. Calcium carbonate, titanium dioxide and lead stabilizers
were found in all die plate-out samples studied, together with small
amounts of lubricants.
Introduction
Plate-out is a well known problem with respect to rigid PVC extrusion [1-9]. It may be
defined as the formation of unwanted deposits anywhere in an extrusion line. Attention was
a Institute of Polymer Technology and Materials Engineering, Lough borough University, Loughborough, Leics LE11 3TU, UK. b Wavin Plastics Ltd., Parsonage Way, Chippenham, Wiltshire, SN15 5PN. c Honeywell Belgium, N.V.Haasrode, Research Park, Grauwmeer 1, B-3001 Heverlee, Belgium. d Chemson Polymer - Additive AG, Industriestraße 19, 9601 Arnoldstein, Austria.
focussed on this topic in the late 1970s and early 1980s, for example references [1-5]. It was
found that both formulation and processing conditions affect plate-out formation. Parey [1,2]
discussed effects due to mixing conditions and the surface structure of PVC, although these
factors have not been considered by other workers. It was established by a number of workers
[3,4,6] that plate-out consisted mainly of inorganic materials, including particularly titanium
dioxide, calcium carbonate, and tribasic lead sulfate. Organic components were found to
include organics from calcium stearate, waxes, plasticizer, and some PVC. In other words, the
composition of plate-out is vastly different from the PVC formulation itself. Plate-out is
observed for many formulations; although it has been suggested that it is particularly severe
for lead formulations, a survey of the literature actually suggests that it is found with most
stabilizer types. Parey [1,2] suggested that formulations containing liquid stabilizers are more
resistant to plate-out than those containing solid stabilizers. Pointe [3] analyzed PVC
extrusions and compression moldings, and found that the composition of inorganics was
lower at the surfaces, which was attributed to separation of inorganic material via migration.
There is general agreement that the amount of plate-out increases as melt temperature
increases [1-3,7]. This has been attributed to the reduction in melt viscosity that promotes
migration. The most detailed mechanism for the production of plate-out is that proposed by
Lippoldt [4]. This mechanism, which is becoming increasingly widely accepted, is based on
the assumption that organic components, particularly hydrocarbons, act as a 'carrier' for
inorganics. The mechanism proposed for the tin stabilized formulation used by Lippoldt
consists of five stages, which may be summarized as follows:
(i) molten hydrocarbon dissolves stabilizer; (ii) at temperatures above 175oC calcium
stearate dissolves in this mixture to produce a complex; (iii) this complex is adsorbed on to
the polar surfaces of inorganic additives, rendering them less polar; (iv) in decompression
zones in the extruder, the above conglomerates are released from the polymer melt. The
reduction in pressure results in a decrease in temperature to below 175oC, so precipitation
occurs; (v) the separated gel-inorganic mixture deposits on metal surfaces and loses
hydrocarbon. This provides a region on which further material deposits, and the process is
continued.
175oC was also recognised as a critical temperature by Parey, who found that for a lead
stabilized formulation, plate-out was particularly severe in the temperature range 175oC -
195oC, which he related to the region in which primary particles are present in the PVC melt.
Leskovyansky [5] discussed the contribution of oxidized metal surfaces to plate-out
production.
The formation of plate-out has been re-visited more recently [6-9]. Bussman et al [6]
examined various Ca/Zn stabilized formulations and attributed plate-out formation to
oxidation of iron in the steel extruder barrel, causing a rough surface, to which excess
lubricant migrated causing a build-up. Unlike other workers, they related plate-out to the
thermal stability of different formulations, and considered that plate-out was produced in high
pressure, rather than low pressure regions in the extruder. Bos et al [7] reviewed the factors
that affect plate-out formation, and discussed the differences between die plate-out and
calibration plate-out. Once again, they mentioned the effect of the barrel surface. Holtzen and
Musiano [8] considered the effect of polymer melt rheology, and used dies of varying design
to identify positions at which plate-out originated.
Several workers observed that increasing the amount of filler such as CaCO3 had the effect of
reducing the amount of plate-out, and this was attributed to abrasive action on the walls of the
extruder [3,6,7,10]. For this reason, anti-plate-out additives have been developed. Of these,
fine particle silicas are probably the most common [11,12]. Increasing TiO2 however
increased plate-out [10] which was unexpected. Schiller et al [10] also investigated the
influence of a number of processing conditions and formulation ingredients on plate-out.
They showed that Lippoldt’s mechanism also applied to lead based compounds, and that PE
waxes, calcium and lead stearates form alloys. A higher extrusion torque caused more plate-
out, and plate out was also increased by the presence of small amount of moisture.
This paper describes a group of techniques which, when used together are capable of
analyzing small samples of plate-out collected during PVC extrusion [13]. Samples examined
were obtained from commercial extrusion lines. Results from these samples provide further
evidence about plate out composition.
Experimental
Samples
As a result of a request to a number of processors, samples of plate-out were obtained and
subsequently analyzed. In some cases several grams of sample were available, while other
samples were less than one gram in weight. Details of these samples are listed in Table 1.
Characterization of plate-out samples
Methods used
The above plate-out samples were characterized by the following techniques:
DSC
Samples were heated at 10oC/min to 220oC in a 910 DSC cell attached to a TA Instruments
Thermal Analyst 2000. This technique enables any crystalline materials to be detected and
possibly identified.
SEM-EDX
Samples were gold coated and observed with a Cambridge Instruments Stereoscan 360 with
an EDX analyzer. This enabled elements present in the plate-out to be identified.
FTIR Samples were ground with IR grade potassium bromide powder, and IR spectra
obtained using a Mattson 3000 FTIR spectrometer, fitted with a diffuse reflectance (DRIFT)
attachment. The presence of organic material can be readily identified; calcium carbonate and
calcium stearate also give characteriztic spectra.
LIMA Small fragments of plate-out were examined using a Cambridge Mass Spectrometry
Laser Induced Ion Mass Analyzer. In this technique a pulsed UV laser is used to remove
material from a sample surface. This ionized material passes into a mass spectrometer for
analysis. The sample area analyzed is 1-2μm in diameter, and about 0.25μm deep. Both
cations and anions can be detected, as well as various chemical groups. This method is
extremely sensitive so can provide a considerable amount of information for very small
samples.
DSC traces and FTIR spectra were also obtained for various PVC additives to serve as
standards, thus aiding the identification of unknown samples.
Results and Discussion
Summary data for the plate-out samples is shown in Table 2 . Selected data for the samples
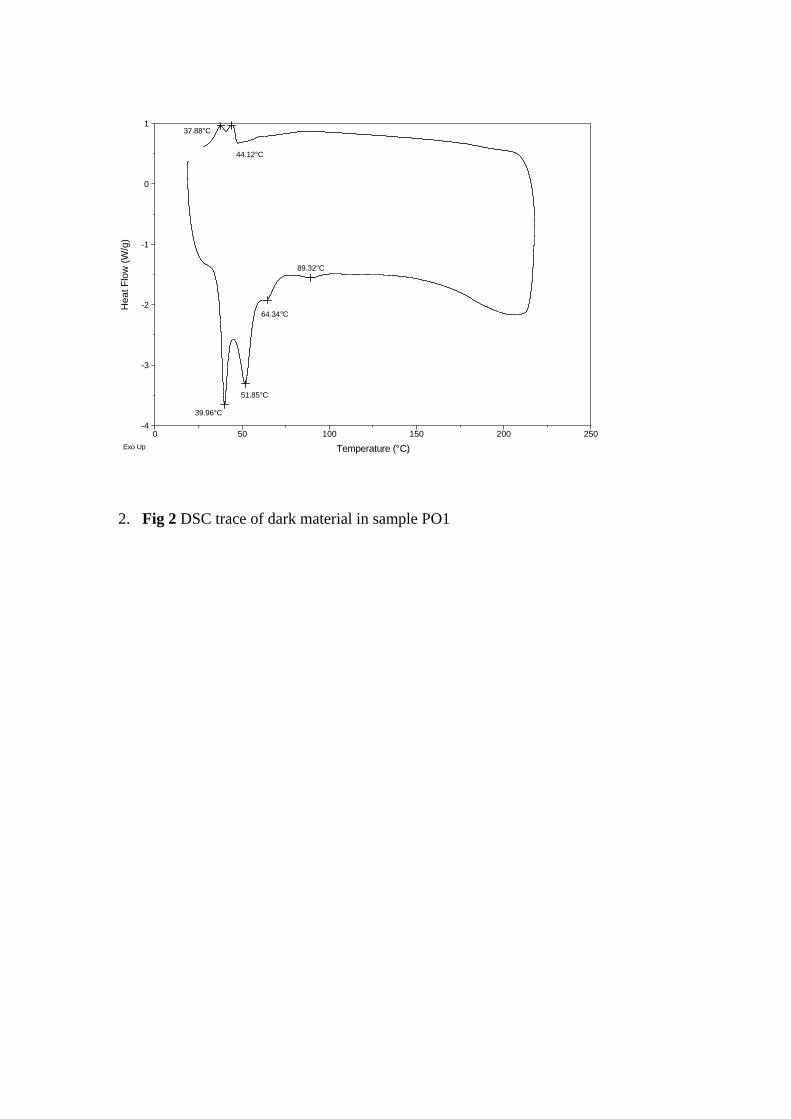
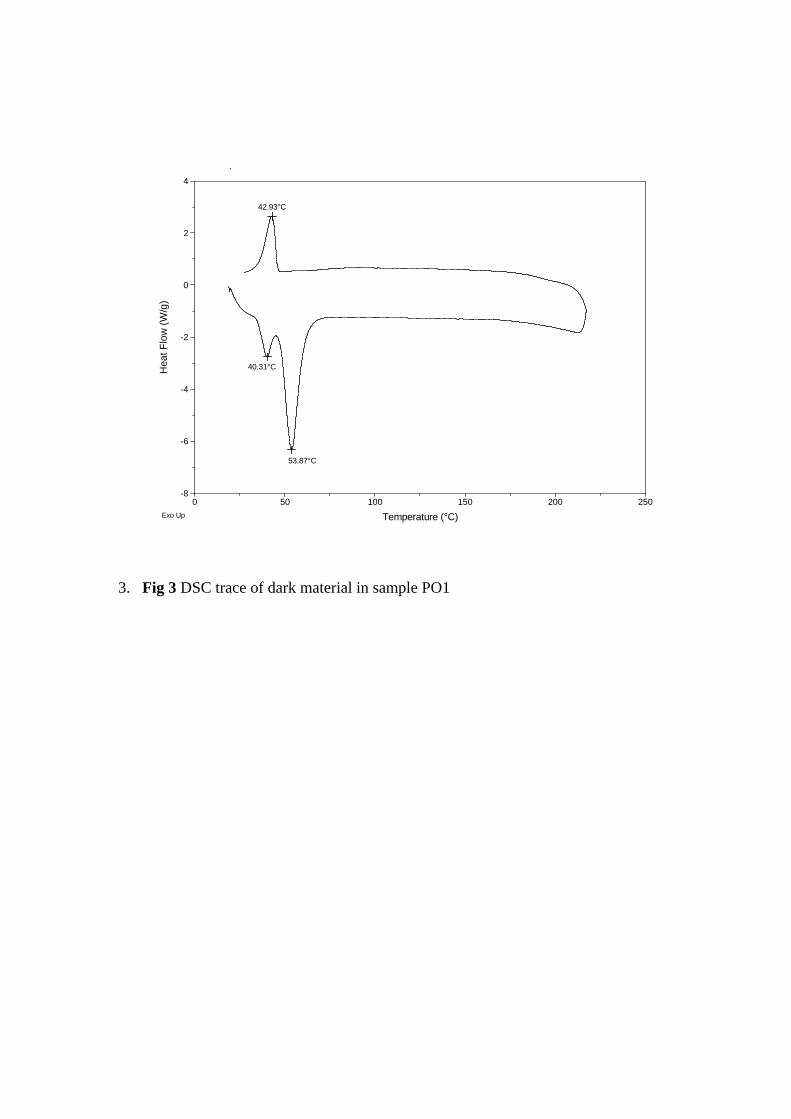
examined will be discussed. A typical plate out sample PO1 is shown in Fig 1. DSC traces of
the dark and light material in PO1 are shown in Figs 2 and 3. Both show two melting peaks in
the region of 40 – 55oC, while Fig 2 shows additional minor peaks at higher temperatures.
The ratio of the major peaks at 40oC and 52oC differs in the two samples. Pure stearic and
palmitic acids have melting temperatures of 69oC and 63oC, but these values are reduced in
mixtures which would be used in lubricants. This identification was confirmed by GC-MS
analysis. Infra red analysis of this sample suggested that hydrocarbon wax or polyethylene
was also present, possibly accounting for the minor DSC peak at 80-85oC. This sample was
predominantly organic, but LIMA, which is extremely sensitive demonstrated the presence of
minor amounts of inorganic components as indicated in Table 2. The phosphite and phosphate
anions are likely to originate from lead phosphite, since this plate-out was obtained from a
lead stabilized compound. Sample PO1 was obtained from the calibrator. Previous work[15]
has shown that calibrator plate-out is normally organic, produced by volatilization and
condensation or from the surface of the hot extruded product.
Backscattered SEM images of die plate-out samples PO3 – PO8 are shown in Fig 4. The
physical composition of plate-out varies considerably, and is generally heterogeneous,
containing regions with different compositions, implying that a number of different
components were deposited from the melt. The various samples will be considered
individually.
The absence of DSC melting peaks below 220oC for sample PO3 suggested that organic
components were absent, an observation confirmed by FTIR. The SEM image of this sample
is shown in Fig 4a. It consists of light flake particles on a dark substrate. EDX analysis
revealed that the flakes were rich in lead, sulphur, phosphorus and chlorine, consistent with a
lead stabilized formulation. The darker areas were rich in titanium, lead and phosphorus. No
calcium was detected by EDX, but the small amount detected by LIMA could be attributed to
calcium stearate. CaCl anions were also present from reaction with chlorine ions from
degraded PVC. Again ions were detected by LIMA and phosphorous oxide by FTIR.
The appearance of the PO4 plate-out was rather different in that clear stripes are observed on
the flakes in the SEM image (Fig 4b). This effect has been attributed to to preferential
deposition of additives at striations along the die flow channel [14]: the light areas were lead
related while the darker regions were composed of both CaCO3 and TiO2. LIMA also showed
that the sample was rich in lead, calcium and titanium based species, and a weak DSC melting
peak at 140oC was typical of calcium stearate. The infra red spectrum corresponded to a
mixture of titanium dioxide and calcium carbonate. PO5 was allegedly from the same
extrusion run, but differed in color and appearance (Fig 4c). Analysis by EDX and LIMA did
however show that both PO4 and PO5 were composed of the same inorganic components but
thermal analysis did not provide any evidence of calcium stearate. DRIFT again detected
mostly CaCO3 and TiO2 (Fig 5) with additional absorbances at 2920, 2851 cm-1 (both CH2),
1732 cm-1 (C=O, major peak for carboxylate) and 1022 cm-1 (phosphorus related, strong peak
for dibutyl lead phosphite (DBLP)).
Backscattered SEM-EDX of PO6 (Fig 4d) revealed large particles of CaCO3 covered with
smaller particles of lead stabilizer. Again dark and light flakes were detected. LIMA was
performed on both the light and dark flakes; the light flakes were rich in sodium, calcium
(filler) and titanium (pigment); the darker material contained species common to the
stabilizer, e.g. lead and phosphorous. The sodium present in this sample could be attributed to
sodium carbonate blowing agent. A small amount of calcium stearate was detected by DSC,
while infra-red analysis detected mostly CaCO3 again with CH2 peaks, C=O at 1736cm-1 and
1566cm-1 (probably due to calcium stearate) (Fig 6).
DSC analysis of PO7 revealed calcium stearate, and a peak at 104oC, probably due to a
hydrocarbon wax lubricant. This sample appeared to have been obtained during a purge cycle,
as small quantities of purge material were present. EDX detected an abundance of chlorine
with smaller quantities of calcium and sodium, suggesting that the material was
predominantly foamed PVC and CaCO3 filler, with traces of blowing agent. The infra-red
spectrum was predominantly CaCO3 with minor absorbances associated with calcium
stearate. The different colored flakes present were examined by LIMA, and had different
compositions as shown in Table 3.
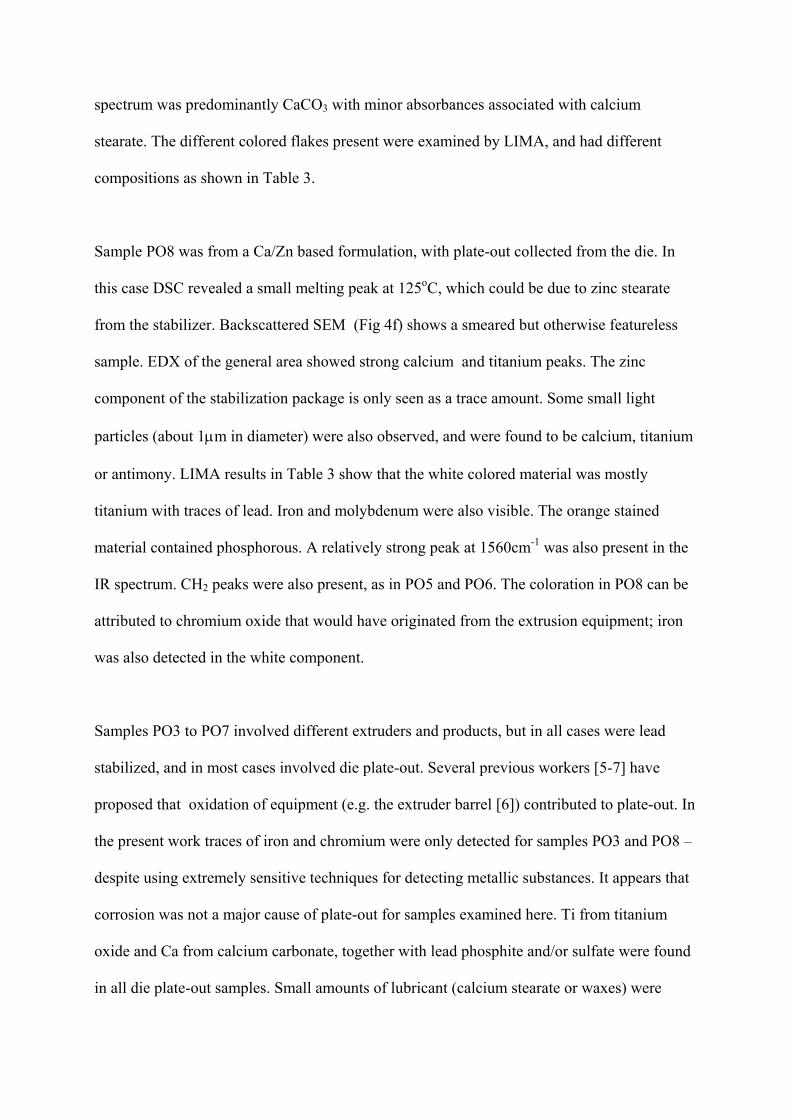
Sample PO8 was from a Ca/Zn based formulation, with plate-out collected from the die. In
this case DSC revealed a small melting peak at 125oC, which could be due to zinc stearate
from the stabilizer. Backscattered SEM (Fig 4f) shows a smeared but otherwise featureless
sample. EDX of the general area showed strong calcium and titanium peaks. The zinc
component of the stabilization package is only seen as a trace amount. Some small light
particles (about 1μm in diameter) were also observed, and were found to be calcium, titanium
or antimony. LIMA results in Table 3 show that the white colored material was mostly
titanium with traces of lead. Iron and molybdenum were also visible. The orange stained
material contained phosphorous. A relatively strong peak at 1560cm-1 was also present in the
IR spectrum. CH2 peaks were also present, as in PO5 and PO6. The coloration in PO8 can be
attributed to chromium oxide that would have originated from the extrusion equipment; iron
was also detected in the white component.
Samples PO3 to PO7 involved different extruders and products, but in all cases were lead
stabilized, and in most cases involved die plate-out. Several previous workers [5-7] have
proposed that oxidation of equipment (e.g. the extruder barrel [6]) contributed to plate-out. In
the present work traces of iron and chromium were only detected for samples PO3 and PO8 –
despite using extremely sensitive techniques for detecting metallic substances. It appears that
corrosion was not a major cause of plate-out for samples examined here. Ti from titanium
oxide and Ca from calcium carbonate, together with lead phosphite and/or sulfate were found
in all die plate-out samples. Small amounts of lubricant (calcium stearate or waxes) were
present in all cases, supporting the proposal that they were functioning as carriers.
Miscellaneous additives such as blowing agents and flame retardants could also be observed.
Results here show that the lubricants have a key role in plate-out; in the second part of this
paper the effects of different lubricant types will be considered.
Conclusions
The combination of a number of characterization techniques is invaluable for this type of
analysis. FTIR and DSC were used to identify organic components. FTIR was also useful for
identifying some inorganic compounds present in sufficient quantities, while EDX detected
elements present. LIMA was the most sensitive technique, detecting trace quantities of both
cations and anions. In general the different techniques provided support for one another. The
calibrator plate-out was mainly organic. Main components of the die plate-out for lead
stabilized compounds were titanium from TiO2, calcium from calcium carbonate and lead
stabilizers. Small amounts of lubricant (calcium stearate or waxes), which would be molten at
extrusion temperatures, were also present, supporting the proposal that they were acting as
carriers for the inorganics. In a second paper the effects of different lubricant types will be
examined. PVC itself is not generally detected in plate-out samples.
It was also observed that corrosion of the extruder barrel was not a major cause of plate-out
for samples examined here.
References
1. J. Parey 'Plate-Out in flow channels in PVC Extrusion', Conference Proceedings, IKV
Colloquium, Aachen, March 1980, 432-436. 2. J. Parey 'Plate-Out - Cause and Remedy' , Kunststoffberater, 4, 39-40 (1980). 3. B. R. O. Pointer, 'Extrusion of Unplasticised PVC: A study of plate-Out Phenomena',
Internal report PL/510/B, Imperial Chemical Industries Ltd, PVC Division, Welwyn Garden City, 1-20.
4. R. F. Lippoldt, 'How to avoid plate-out in extruders', Plastics Engineering, September 1978, 37-39.
5. P. J. Leskovyansky, 'Testing for Plate-Out Using the Torque Rheometer', J. Vinyl. Tech., 6 82-84 (1984).
6. G. Bussman, H. Ruse and B. Herr, 'Plate-Out in PVC Processing', Kunstoffe, 88, 2154-2157 (1998).
7. A. Bos, T. Huelsmann, S. Juergens and M. Sander, 'Plate-out in Extrusion', Conference Proceedings, New Techniques in Extrusion, Wűrzburg, 1999.
8. D. A. Holtzen and J. A. Musiano, ‘Die Lip Plate-Out – a proposed mechanism’, Du Pont Technical Updat.e
9. M. Schiller, A. Egger and P. Stern, 'Profile, Produktion, Probleme - eine unvermeidbare Dreieinigkeit?', Conference proceedings, New Techniques in Extrusion, Wűrzburg, 2000 - Beispiel 3.
10. M. Schiller, B. Pelzl, R. Haberleitner, H. Huisman; “Plate out – A problem without hope?” Plastic Profiles in Construction, Brussels, November 2006
11. W. V. Titow, Chapter 4 in PVC Plastics - Properties, Processing and Applications, Elsevier Applied Science, London and New York, 1990.
12. E. J. Wickson and R. F. Grossman, Chapter 28 in Handbook of PVC formulating, ed W. V. Titow, John Wiley and Sons, New York, 1993.
13. M Gilbert, N Varshney K Van Soom M Schiller IOM Conf. Proc. International PVC Conference, Brighton, April 2002, 157-165.
14. I. Szarvasy and J.F.T. Pittman, Polym. Eng. & Sci., 43, 1488 (2003). 15. J. Clarke and D. Gerlach, Conf. Proc. Current Trends in PVC Technology, Loughborough
2003.
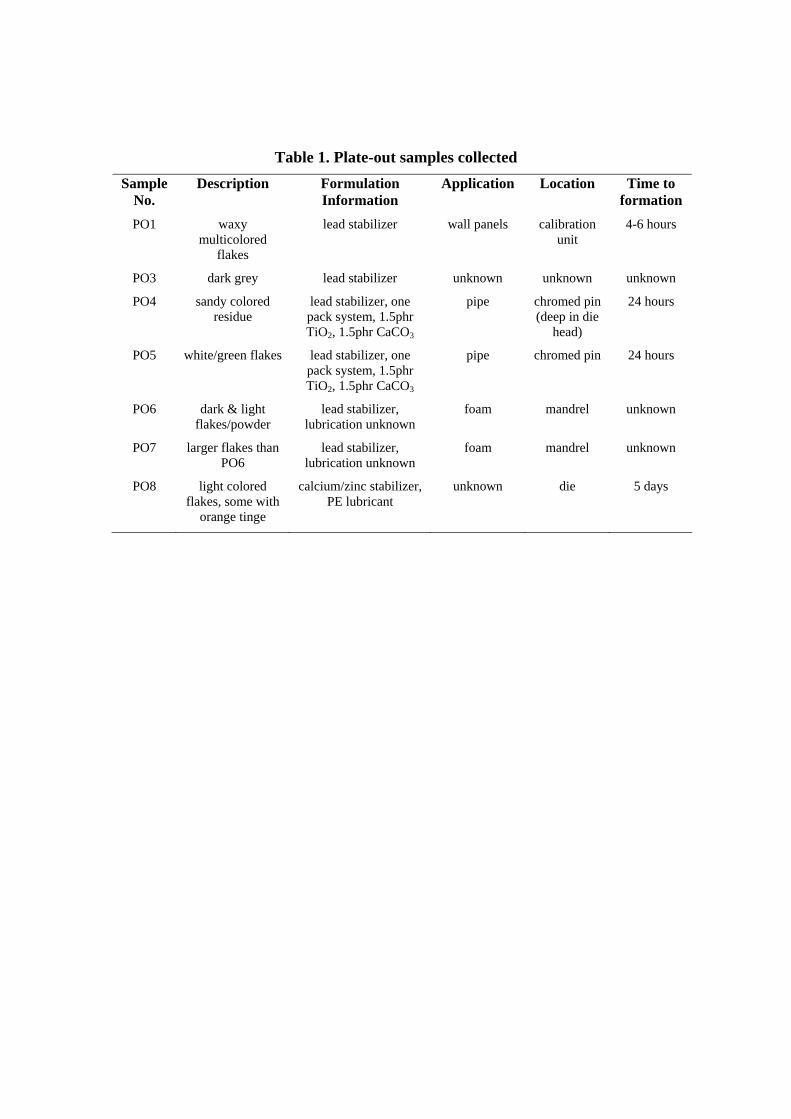
Table 1. Plate-out samples collected Sample
No. Description Formulation
Information Application Location Time to
formation PO1 waxy
multicolored flakes
lead stabilizer wall panels calibration unit
4-6 hours
PO3 dark grey lead stabilizer unknown unknown unknown
PO4 sandy colored residue
lead stabilizer, one pack system, 1.5phr TiO2, 1.5phr CaCO3
pipe chromed pin (deep in die
head)
24 hours
PO5 white/green flakes lead stabilizer, one pack system, 1.5phr TiO2, 1.5phr CaCO3
pipe chromed pin 24 hours
PO6 dark & light flakes/powder
lead stabilizer, lubrication unknown
foam mandrel unknown
PO7 larger flakes than PO6
lead stabilizer, lubrication unknown
foam mandrel unknown
PO8 light colored flakes, some with
orange tinge
calcium/zinc stabilizer, PE lubricant
unknown die 5 days
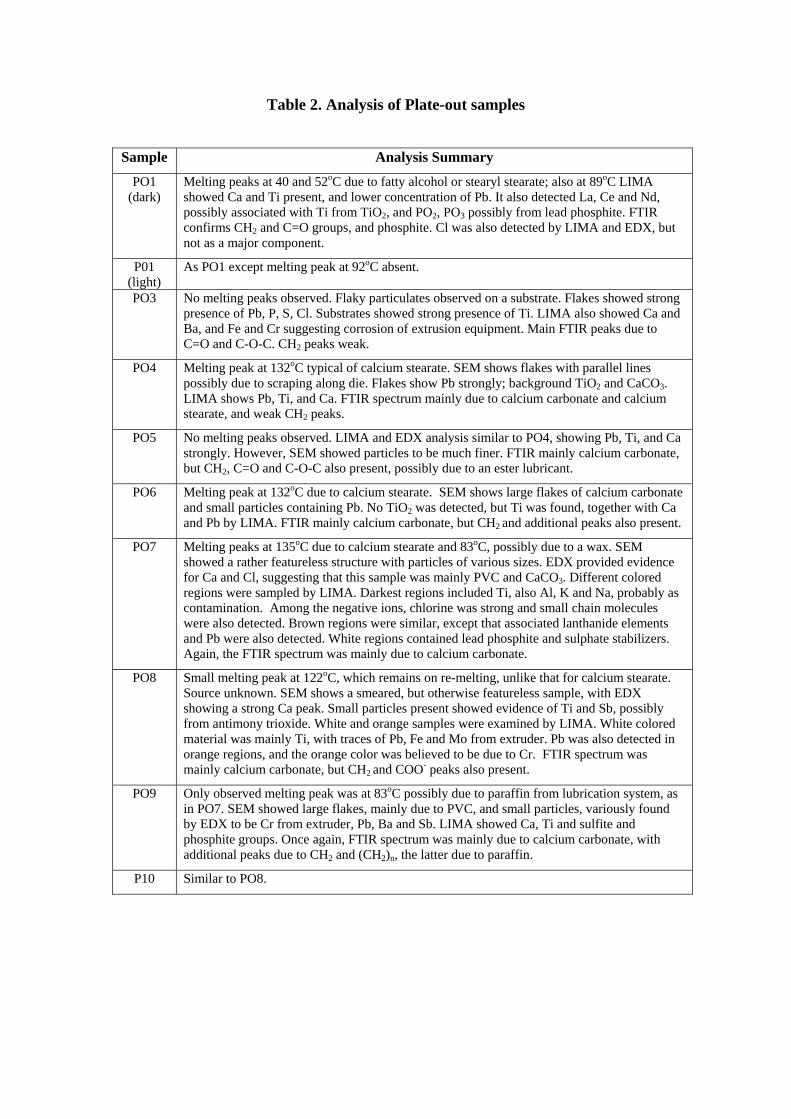
Table 2. Analysis of Plate-out samples
Sample Analysis Summary
PO1 (dark)
Melting peaks at 40 and 52oC due to fatty alcohol or stearyl stearate; also at 89oC LIMA showed Ca and Ti present, and lower concentration of Pb. It also detected La, Ce and Nd, possibly associated with Ti from TiO2, and PO2, PO3 possibly from lead phosphite. FTIR confirms CH2 and C=O groups, and phosphite. Cl was also detected by LIMA and EDX, but not as a major component.
P01 (light)
As PO1 except melting peak at 92oC absent.
PO3 No melting peaks observed. Flaky particulates observed on a substrate. Flakes showed strong presence of Pb, P, S, Cl. Substrates showed strong presence of Ti. LIMA also showed Ca and Ba, and Fe and Cr suggesting corrosion of extrusion equipment. Main FTIR peaks due to C=O and C-O-C. CH2 peaks weak.
PO4 Melting peak at 132oC typical of calcium stearate. SEM shows flakes with parallel lines possibly due to scraping along die. Flakes show Pb strongly; background TiO2 and CaCO3. LIMA shows Pb, Ti, and Ca. FTIR spectrum mainly due to calcium carbonate and calcium stearate, and weak CH2 peaks.
PO5 No melting peaks observed. LIMA and EDX analysis similar to PO4, showing Pb, Ti, and Ca strongly. However, SEM showed particles to be much finer. FTIR mainly calcium carbonate, but CH2, C=O and C-O-C also present, possibly due to an ester lubricant.
PO6 Melting peak at 132oC due to calcium stearate. SEM shows large flakes of calcium carbonate and small particles containing Pb. No TiO2 was detected, but Ti was found, together with Ca and Pb by LIMA. FTIR mainly calcium carbonate, but CH2 and additional peaks also present.
PO7 Melting peaks at 135oC due to calcium stearate and 83oC, possibly due to a wax. SEM showed a rather featureless structure with particles of various sizes. EDX provided evidence for Ca and Cl, suggesting that this sample was mainly PVC and CaCO3. Different colored regions were sampled by LIMA. Darkest regions included Ti, also Al, K and Na, probably as contamination. Among the negative ions, chlorine was strong and small chain molecules were also detected. Brown regions were similar, except that associated lanthanide elements and Pb were also detected. White regions contained lead phosphite and sulphate stabilizers. Again, the FTIR spectrum was mainly due to calcium carbonate.
PO8 Small melting peak at 122oC, which remains on re-melting, unlike that for calcium stearate. Source unknown. SEM shows a smeared, but otherwise featureless sample, with EDX showing a strong Ca peak. Small particles present showed evidence of Ti and Sb, possibly from antimony trioxide. White and orange samples were examined by LIMA. White colored material was mainly Ti, with traces of Pb, Fe and Mo from extruder. Pb was also detected in orange regions, and the orange color was believed to be due to Cr. FTIR spectrum was mainly calcium carbonate, but CH2 and COO- peaks also present.
PO9 Only observed melting peak was at 83oC possibly due to paraffin from lubrication system, as in PO7. SEM showed large flakes, mainly due to PVC, and small particles, variously found by EDX to be Cr from extruder, Pb, Ba and Sb. LIMA showed Ca, Ti and sulfite and phosphite groups. Once again, FTIR spectrum was mainly due to calcium carbonate, with additional peaks due to CH2 and (CH2)n, the latter due to paraffin.
P10 Similar to PO8.
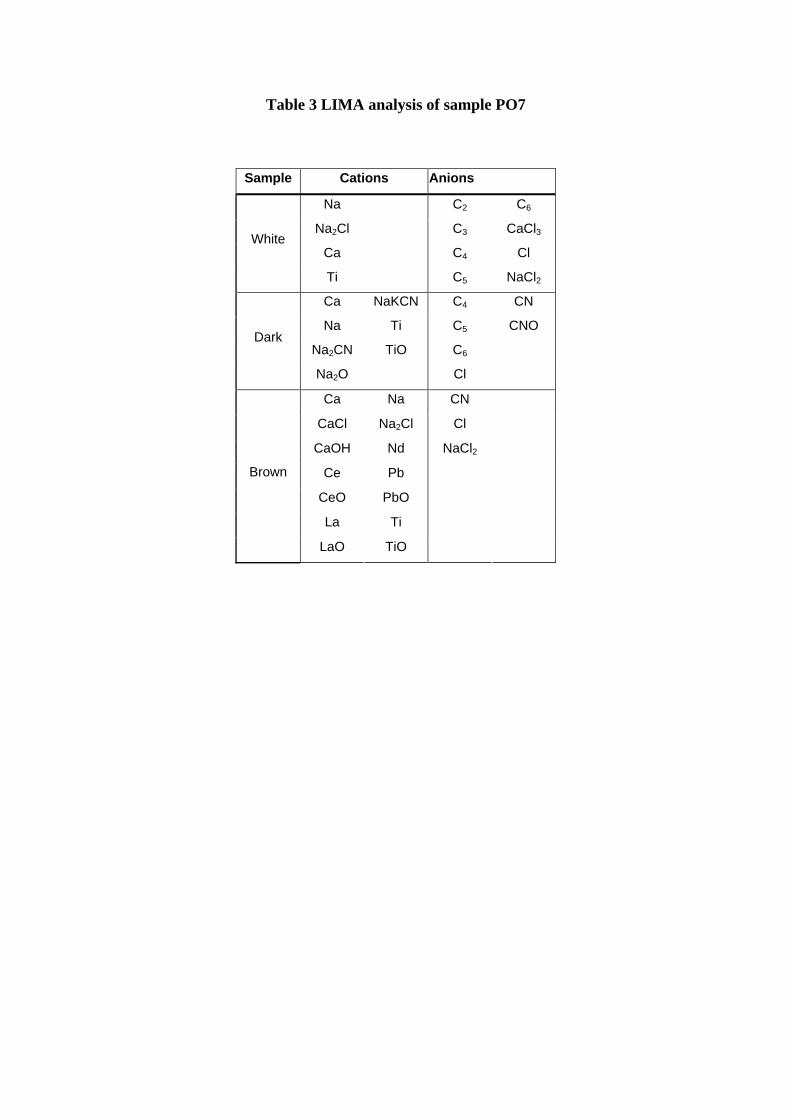
Table 3 LIMA analysis of sample PO7
Sample Cations Anions
Na C2 C6
Na2Cl C3 CaCl3
Ca C4 Cl White
Ti C5 NaCl2
Ca NaKCN C4 CN
Na Ti C5 CNO
Na2CN TiO C6 Dark
Na2O Cl
Ca Na CN
CaCl Na2Cl Cl
CaOH Nd NaCl2
Ce Pb
CeO PbO
La Ti
Brown
LaO TiO

1. Fig 1 Plate-out sample PO1
39.96°C
51.85°C
64.34°C
89.32°C
37.88°C
44.12°C
-4
-3
-2
-1
0
1H
eat F
low
(W/g
)
0 50 100 150 200 250
Temperature (°C)Exo Up
2. Fig 2 DSC trace of dark material in sample PO1
40.31°C
53.87°C
42.93°C
-8
-6
-4
-2
0
2
4
Hea
t Flo
w (W
/g)
0 50 100 150 200 250
Temperature (°C)
p
Exo Up
3. Fig 3 DSC trace of dark material in sample PO1
Fig 3

a
b
c
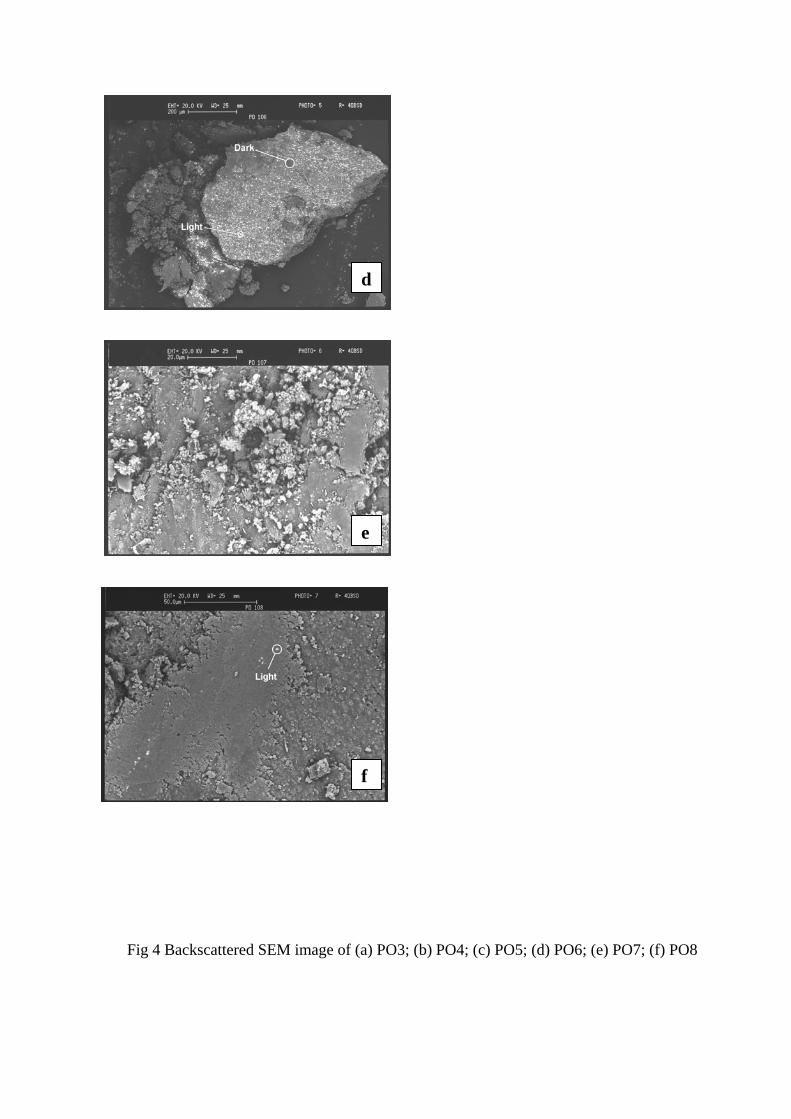
Fig 4 Backscattered SEM image of (a) PO3; (b) PO4; (c) PO5; (d) PO6; (e) PO7; (f) PO8
d
e
f

4. Fig 5 FTIR spectrum of sample PO5
0
0.1
0.2
0.3
0.4
0.5
0.6
0.7
0.8
0.9
1
60010001400180022002600300034003800
Wavenumber (cm-1)
Abs
orba
nce
PO105Calcium carbonateTitanium dioxide
2920 2851
1732
1022
CaCO3
TiO2

5. Fig 6 FTIR spectrum of sample PO
0
0.1
0.2
0.3
0.4
0.5
0.6
0.7
0.8
0.9
1
60010001400180022002600300034003800
Wavenumber (cm-1)
Abs
orba
nce
PO107Calcium carbonate
2916 2849 1728
1566
CaCO3